public disclosure authorized trade among ... - world bank
TRANSCRIPT

Trade among Developing Countries:Theory, Policy Issues, and Principal Trends
SWP479World Bank Staff Working Paper No. 479
August 1981
Prepared by: Oli Havrylyshyn [Consultant]Martin WolfIntemational Trade and Capital Flows DivisionEconomic Analysis and Projections DepartmentDevelopment Policy Staff
Copyright ® 1981The World Bank1818 H Street, N.W.Washington, D.C. 20433, U.S.A. _
The views and interpretations in this document are those of the authorsand should not be attributed to the World Bank, to its affiliatedorganizations, or to any individual acting in their behalf.
Pub
lic D
iscl
osur
e A
utho
rized
Pub
lic D
iscl
osur
e A
utho
rized
Pub
lic D
iscl
osur
e A
utho
rized
Pub
lic D
iscl
osur
e A
utho
rized
Pub
lic D
iscl
osur
e A
utho
rized
Pub
lic D
iscl
osur
e A
utho
rized
Pub
lic D
iscl
osur
e A
utho
rized
Pub
lic D
iscl
osur
e A
utho
rized


The views and interpretations in this document are those of the authors andshould not be attributed to the World Bank, to its affiliated organizations,or to any individual acting in their behalf.
WORLD BANK
Staff Working Paper No. 479
August 1981
TRADE AMONG DEVELOPING COUNTRIES:THEORY, POLICY ISSUES, AND PRINCIPAL TRENDS
A Background Study for World Development Report 1981
The paper presents the early results of empirical work on tradeamong developing countries. The results, which are preliminary and will befurther expanded, are based on data derived from a sample of thirty-threedeveloping countries that account for about 60 percent of developingcountries' exports to one another. Such evidence as we have been able to puttogether indicates that the sample is fairly representative of overall trendsin trade among developing countries.
The main conclusion is that non-fuel trade among developingcountries, excluding capital-surplus oil exporters, accounted for a remarkablystable share of their total trade between 1963 and 1977. This constancy,however, conceals two interesting opposing trends: the share of manufacturesexported to developing countries has been falling sharply while that of non-fuel primary commodities has been rising, the latter largely because of thedemands of the newly industrializing countries (NICs). Nevertheless, thedynamism of manufactures has meant that they make up an increasing share oYtrade among developing countries. Four particular points emerge from theevidence: (a) there is no obvious sign of a bias against trade amongdeveloping countries, except by whatever effect their own commercial policiesmay have; (b) the more inward-looking countries tend to send a higherproportion of their exports to other developing countries, and regionalintegration strengthens this effect; (c) exports of manufactures to developingcountries are much more capital intensive than those to industrializedcountries; and (d) exports to developing country markets may not be the vitalfirst stage for capital goods exports that is sometimes supposed.
Prepared by: Oli Havrylyshyn [Consultant] and Martin WolfInternational Trade and Capital Flows DivisionEconomic Analysis and Projections DepartmentDevelopment Policy Staff
Copyright © 1981 RY FUND
The World Bank INTERNATIONAL MONETA
1818 H Street, N.W. JOINT LIBRARY
Washington, D.C. 20433 ^ QU.S.A. I., o 198 a
iNtEON'AITIONA~ BiA§k ~nihREC0N§tkAC1 iON 'AV4D 6EVtL0M~tq
WmVo6t6k R&16@

We are indebted to many individuals for comments and wish to thankfor their detailed suggestions and assistance Francis Colaco, Michael Finger,Helen Hughes, James Riedel, and Antoine Schwartz. For their most effectivecollaboration in the empirical analysis we are grateful to Aeran Lee, ColinMcFadyen, and Bill Shaw, and for immense patience and efficiency inpreparation of the manuscript we thank Karen Adams.

i
CONTENTS
Page
INTRODUCTION ....... .............................................. 1
A. The Main Issues in Trade among Developing Countries ......... 1
B. The Program of Work and the Organization of the Paper ....... 3
THE THEORY OF TRADE AMONG DEVELOPING COUNTRIES ................... 5
A. Trade Theory and the Direction of Developing Countries'Trade . ....... .............................. ............... 5
1. The Underlying Determinants . . 5
2. Barriers to Trade and Implications for Its Direction... 13
3. Market Size and Growth as Determinants of Trade ........ 18
4. Conclusion on the Determinants of the Direction*of Trade Flows ...... .. 20
B. The Benefits of Trade among Developing Countries ............ 22
C. Policy Options for Trade among Developing Countries .. . 28
1. Externalities, Factor Market Distortions, and"Natural" Barriers ............... . 28
2. Barriers Created by Trade Policy .. 31
3. Assessment of Policy Options . . 32
D. Conclusion ......................... 0................................. 33
TRENDS IN TRADE AMONG DEVELOPING COUNTRIES . . 34
A. The Destination of Developing Countries' Exports ............ 37
1. Trend in the Share of Trade among Developing Countries 38
2. Market Size and Growth and "Bias" in Trade amongDeveloping Countries ................................ 48
B. Salient Features of Trade among Developing Countries ........ 54
1. Commodity Composition and Principal Flows ............... 55
2. Trade among Developing Countries and the NICs ......... . 66

ii
3. Capital-Labor Ratios in Exports of DevelopingCountries .................................... ....... 74
4. Capital Goods Trade among Developing Countries ......... 75
IV. SUMMARY OF MAIN FINDINGS . . . 81
A. The Main Trends in the Destination of DevelopingCountries' Trade ......................................... 81
B. Principal Hypotheses on Trade among Developing Countries.... 84
1. The Myth of a Bias against Trade among DevelopingCountries ........................................... 84
2. Developing Countries' Commercial Policies andthe Direction of Their Exports ...................... 85
3. The Capital Intensity of Trade .............. . 86
4. Capital Goods Exports and Developing Country Markets ... 86
APPENDICES . 87
REFERENCES ... . . . . . . . . . . . . . . . . . . . . . . . . . . . . . . 110
TEXT TABLES
Page
1 Trade among Developing Countries asv Share of Their Total Exports 42
2 Share of Trade among Developing Countries in Total Trade byRegion, 1963-1977 Selected Years .............................. 46
3 Shares of Exports to Developing Countries in Total Exports ...... . 47
4 Shares of Exports of Manufactures to Developing Countries inTotal Exports and Shares of World Income. .. 50
5 Share of Major Markets in Developing Country Exports by MainCommodity Group, Selected Years..... 52
6 Share of Capital-Surplus Markets for Developing Country Exportsby Region and Selected Developing Countries, 1973 and. 1977.... 53
7 Commodity Composition of Developing Country Exports toDifferent Markets ........ . . . ...................... ... 56
8 Commodity Composition of Exports from Developing Countriesin Selected Years ..... 58

iii
9 Weight of Manufactures in Exports of the Total Sample andof the Regions . ........................... .................... 59
10 Commodity Composition of Exports from Developing andIndustrialized Countries to Developing Countries, 1977 .60
11 Principal Products in Trade among Developing Countries.. 62
12 Shares of Ten Top Exporters in Trade among Developing Countriesfor Major Commodity Groups, 1963 and 197 7. ...... 64
13 Major Bilateral Commodity Flows, 197 7....... 67
14 The Role of NIC Markets in Trade among Developing Countries,1963 and 1977977.............. .................. 70
15 Percentage Distribution of NIC Imports by Origin, 1963 and 1977.. 72
16 Percentage Distribution of NIC Exports by Destination,1963 and 1977 .... ..... 73
17 Direct Factor Content of NIC Manufactured Exports, 1977 .. 75
18 Selected Indicators of Trends in Trade in Capital Goods amongDeveloping Countries ................. ..................... 77
19 Changes in Direction of Exports of Capital Goods fromMajor Exporters, 1963-77 ....... ..... ... .... ........ . 79
TEXT FIGURES
1 Percentage Share of Developing Country Exports Going toDeveloping Countries .................... 39

iv
ACRONYMS AND ABBREVIATIONS
In text
BEC (U.N.) Broad Economic Categories
EPD Economic Analysis and Projections Departmentof the World Bank
GATT General Agreement on Tariffs and Trade
IMF International Monetary Fund
MFN Most favored nation
NBER National Bureau of Economic Research
NICs Newly industrializing countries
NTBs Non-tariff barriers to trade
OPEC Organization of Oil-Exporting Countries
SITC Standard International Trade Classification
UNCTAD U.N. Conference on Trade and Development
In tables
CPEs Centrally planned economies
CSCs Capital-surplus oil-exporting countries
OILX Oil-exporting countries
DCs Industrialized countries
LDCs Developing countries

I. INTRODUCTION
Why should the direction of trade, in general, and trade among
developing countries, in particular, be worth studying? The subject is
significant to the extent it is likely to enhance understanding of the
relationship between trade and welfare (including growth) or - still better -
to aid in formulating clear policy advice. A number of influential advisers
have suggested that there are indeed important implications. Therefore, it is
as important to sift sense from nonsense in these pronouncements as to reach
the final conclusion that the direction of developing countries' trade is
indeed a matter of great consequence.
A. The Main Issues in Trade among Developing Countries
What are the main arguments that the direction of developing country
trade matters? One is that developing countries are victims of the chronic
disease of "dependencia," which can be cured by collective self-sufficiency,
the earlier nostrum of simple self-sufficiency having proved frequently fatal
(especially to smaller patients). A related view is that of (Stewart 1976),
who suggests that colonial trade patterns imposed a straightjacket on
developing countries, leading to a bias away from potentially more lucrative
trade with one another because of transport, financial, and marketing
constraints. Trade between developing countries is thought to be better than
trade with industrialized countries because of opportunities for learning by
doing, the shared technological requirements of the South, and the advantages
of the appropriate technology supposedly embodied in capital goods produced by
developing countries. Sir Arthur Lewis (1980) in a return to the "engine of

2
growth" perspective argues that the world is probably entering a period of
chronic slow growth whose effects on developing countries can be mitigated, if
not escaped altogether, only if they increase trade with one another. The
strength of this recommendation is increased, he argues, if the developed
countries retreat behind protectionist walls. There are those who argue that
in. the 1970s booming trade among developing countries had already performed
just the role that Lewis recommends.
Most of the debate is implicitly concerned with manufactured
goods. An important topic that is, therefore, infrequently mentioned is trade
in primary commodities, which seems to offer a valuable opportunity for
expanded trade among developing countries. A relevant concept here is that of
triangular trade among industrial, developing, and newly industrializing
countries (NICs). Thus, it is suggested that rapid growth and structural
change in the NICs lead to increases in their demand for the primary goods
exported by other developing countries.
Another debate centers around the benefits of trade, especially in
manufactures, between developing and developed countries on the one hand and
among developing countries on the other. Krueger (1978) argues that it is the
former that is more valuable for developing countries since, being more labor-
intensive, it leads to more employment per unit of exports. Meanwhile, Hughes
(1980) suggests that the latter - at least in the future - is of great value,
pointing to those benefits of trade among developing countries in similar
goods that result from the rigors of competition and opportunities to learn by
doing and to exploit economies of scale.
Policy recommendations do not in all cases follow directly from
views about the benefit of one or other component of trade but are, of course,
quite closely related to them. Those who believe that trade among developing

3
countries is particularly valuable tend to recommend discriminatory trade
liberalization via customs unions or free trade areas (UNCTAD 1979). Those
who think that trade among developing countries is discriminated against cite
liner conferences for shipping that are dominated by industrialized countries,
firms, lack of credit, or problems with currency convertibility and then focus
upon policy reform in these areas. Even those who are wary of the economic
costs of discriminatory trading arrangements and are well aware that they have
been collapsing like ninepins (Vaitsos 1978, Hughes 1980) sometimes still
argue that discriminatory policies are the best available vehicles for wider
liberalization by developing countries, but that care must be taken to avoid
costly trade-diverting plans and to look instead for opportunities for trade
creation. The most likely focus for such arrangements is said to be the NICs.
Many others would argue, however, that there are no reasons for concentrating
policy on any particular trade channel, such as that among developing
countries, but rather that what is needed is a general reduction in barriers
to trade. (Balassa 1979a, Frank 1978).
B. The Program of Work and the Organization of the Paper
This paper is the first step in a program of work designed not only
to illuminate the fundamental issues but to bring some order into a fevered
and sometimes contradictory debate. Its immediate purpose is quite limited,
namely to clear the ground for subsequent, more ambitious construction. This
process involves two activities. The first is to provide an analytical
framework within which this paper itself and - more important - a subsequent
work program can be placed. The second is to develop a picture of overall
trends and patterns in trade among developing countries. It should be
stressed that neither is an end in itself but merely a stage in "work in

4
progress," and this is, therefore, the characteristic of the paper itself.
If the first purpose is considered more closely, it wilL be noted
that, even though a major reason for study of the direction of developing
country trade is the already cited views of others about its importance and
policy implications, those views themselves are too inchoate to form a
framework for coherent analysis. The procedure followed in Chapter II is
instead to establish our own organization of the theoretical issues and to
place the views of others in that context.
The picture of overall trends that appears in Chapter III has
several purposes. In the first place, a number of commonly held views are
called into doubt. For example, the "bias" against trade among developing
countries is not readily identifiable and needs more careful definition.
Again, the argument that developing countries must export capital goods to one
another before being able to break into developed country markets for these
products also appears dubious. More controversial still, high propensities to
trade with other developing countries seem to be a symptom of the more inward-
looking trade regimes. The second principal purpose of Chapter III is to
suggest new hypotheses about the determinants, role, and consequences of trade
among developing countries, not least because of the failure of so many
expectations. Finally, these observations allow more informed judgement about
how trade at least, and to some extent development itself, may proceed in
different global environments. Although extrapolation from the past is not
legitimate, some understanding of what has happened allows intelligent
consideration of the prospects.
Chapter IV iterates the highlights of the empirical analysis
presented in Chapter III in relation to the issues noted here and discussed
further in Chapter II.

5
II. THE THEORY OF TRADE AMONG DEVELOPING COUNTRIES
This chapter has two main purposes: the first is to develop
systematically, but briefly, the implications of the theory of trade among
developing countries; the second is to place the main issues that have
concerned other writers in the context of that theoretical discussion. The
theoretical analysis is divided into three areas: the determinants of the
size, direction, and composition of trade flows; their welfare (including
growth) effects; and the selection of optimal policy instruments.
A. Trade Theory and the Direction of Developing Countries' Trade
1. The Underlying Determinants of the Direction and CommodityCharacteristics of Trade
The most widely used predictive theory of trade is, of course,
Heckscher-Ohlin. From our point of view its most important differences from
other theories lie in three assumptions: constant returns to scale, a common
worldwide stock of knowledge, and no country-specific resources or factors of
production. In its customary two-country form the theory does not, of course,
deal with the issue of the direction of trade. In a multi-country world, in
which countries' relative endowments of capital and labor are on a continuum,
the theory has been extended by Krueger (1977) and Baldwin (1979) to predict
that a country will trade in both directions, selling more labor-intensive
goods to countries more generously endowed with capital and vice versa. Such
differences had been found earlier for Japan by Tatemoto and Ichimura (1959)
in tests of the Leontief paradox and recently have been found for several
developing countries in the National Bureau of Economic Research (NBER)
studies on trade and employment, which are summarized in Krueger (1978).
Adding more factors, such as labor with different skills, further increases

6
the opportunities for trade between any two developing countries with some
differences in factor endowment, even if this difference is far smaller than
the difference between either of them and a developed country. As the Krueger
(1977) paper makes clear, the extension of Heckscher-Ohlin theory provides
only qualitative predictions of how much trade will take place between whom
and in what. The outcome, in practice, will depend on transport costs in
different directions and commercial policy in particular. In general, a
country in the middle range of factor endowments will produce for domestic
consumption goods requiring factor ratios close to its overall endowment and
will export more labor-intensive goods to countries with higher overall
capital endowments and more capital-intensive goods to countries with lower
overall capital endowments (and vice versa for imports). 1!
A dynamic version of this theory is Balassa's (1979) "Stages of
Comparative Advantage," which results in much the same set of empirically
testable hypotheses but concentrates on the overall pattern of comparative
advantage as a country changes its relative factor endowment over time. Thus,
From Krueger (1977) one can infer the following relationships, which arealso derived by Jungho Yoo in an Appeudix to Baldwin (1979). If K =capital-labor ratio; p,x, and m are production, exports, and imports,respectively; a,b, and c are the countries ordered with decreasingcapital endowment ratios; then for the middle country b (with countrydestinations for exports and origins for imports denoted by a,b and c):
(1) Kxc > Kpb; (2) Kmc < Kpb;
(3) Kxa < Kpb; and (4) Kma > Kpb.
Overall, we know only that:
(5) Kma1 > Kpb = K endowment of b > iKxa.Kxcl |Kmc
Hence, testable propositions can be stated only in comparison to domesticproduction, or gross baskets to a destination (xa vs ma, xc vs mc), orsimilar flows with different partners (xc vs xa, mc vs ma), but never fornet exports either in total or even to a given destination.

7
rapidly growing countries gain advantage overall in more skill and capital
intensive activities while losing advantage to slower growing countries in
simpler labor-intensive manufactures. The implications for trade among
developing countries at any moment are the same as those of the modified
Heckscher-Ohlin theory discussed above. Over time rapidly growing developing
countries will increase the capital and skill intensity of their exports in
both directions while maintaining the separation between the characteristics
of goods traded in each direction.
The evidence in the work cited above, as well as our own results
(see Chapter III below), provide support for some of the hypotheses implicit
in this modified Heckscher-Ohlin theory. Thus, we note, in particular, that
developing countries' manufactured exports to developed countries are, on
balance, more labor-intensive than those to other developing countries. This
evidence does not, however, either confirm or deny the predictions about trade
between any pair of countries, on which much more work needs to be done.
One important modification to the underlying assumptions of the
Heckscher-Ohlin model discussed above concerns differences in natural resource
endowments across countries.-2 The goods that are then traded, which have
been labelled "Ricardian" by Hirsch (1974), include minerals, food and non-
food raw materials such as cotton, rubber, or timber. Since in the global
contexts differences among developing countries in natural resource endowments
are likely to be large in relation to differences in capital availability, and
2/ Strictly speaking two different kinds of natural resource based tradeshould be distinguished. The first is the consequence of relative landavailability, in general, whereas the second is the result of highlyspecific resources such as oil, copper, or an equatorial climate. Theformer fits into the Heckscher-Ohlin framework with multiple factors,whereas the latter is clearly different. Since both form the basis ofprimary goods trade, however, they are treated together in thisdiscussion.

8
these differences can be quite as large with one another as with .developed
countries, one might expect- "Ricardo goods" to be an important part of trade
among developing countries. Furthermore, developing countries have been
industrializing rapidly, and this is particularly true of a number of
countries poor in natural resources. This itself should tend to increase
demand for industrial imports, for the production of which some developing
countries are ill suited or even, as applies particularly to minerals,
completely unequipped. Finally, many developing countries have found it
difficult to sustain agricultural production growth in line with that of
demand, which is fuelled by burgeoning population, whereas others have,
through productivity gains and specialization, become surplus producers of
some products. For all these reasons one might expect trade in "Ricardo
goods" to be an increasingly important component of trade among developing
countries.
Evidence developed further in the succeeding chapter bears out this
hypothesis. It is true that, in line with the overall dynamism of
manufactured exports, exports of manufactures have a rising weight in overall
non-fuel trade among developing countries. For our sample of 33 developing
countries, that share rose from 41 to-54 percent between 1963 and 1977. This
rise was, however, much less than in their trade with developed countries,
where the weight rose from 17 to 50 percent in this period. In fact, the
share of the 33 countries' manufactured exports going to developing countries
fell from 40 percent in 1963 to 25 percent in 1977. This change seems to
indicate an increasing ability to exploit the large potential for Heckscher-
Ohlin-based trade in manufactures with the developed countries whose relevant
resource endowments are so different.. Meanwhile in non-fuel primary
commodities the share of developing country markets in developing countries'
exports rose from 16 to 23 percent over the same period. It is, therefore, a

9
great error to ignore the potential for trade among developing countries in
"Ricardo goods," even though there is some reason to fear the "staple traps"
that can result from excessive specialization in primary commodities and to
expect that many of the dynamic gains from trade will come from manufactured
exports.
Product-cycle theory, which is focused on manufactures, stresses
country-specific knowledge, with that knowledge being slowly diffused over the
world. This approach may be seen either as an extension of the Heckscher-Olin
theory, the idea being that the development of new products and processes is
skill-intensive in itself, or as distinct from it, emphasis then being on the
notion that knowledge is unevenly distributed over the world. In any case,
this diffusion of products provides a rationale for trade among developing
countries. For a given product advanced developing countries first pick up
production from developed countries and export in both directions. Later the
product shifts to less advanced developing countries. In the meantime the
advanced developing countries have picked up a new product. Hence at any
given time one would observe trade among developing countries in manufactured
goods of differing degrees of sophistication. This theory could have
different implications, both from the modified Heckscher-Ohlin theory
discussed above and from the explanations for intra-industry trade. Thus, a
developing country might trade goods of a given level of sophistication in all
directions and would seem somewhat unlikely to trade with similar countries.
Unfortunately, in practice it is almost impossible to test versions of product
cycle and Heckscher-Ohlin theories against each other effectively [as
attempted by Hufbauer (1970)], even when they can be distinguished.
Intra-industry trade is less a theory than an observation, though
recent efforts have been made by Lancaster (1980) to provide a theoretical

.10
basis. It is, in any event, an observation that challenges the Heckscher-
Ohlin paradigm, at least to the extent that what is observed is not a
statistical artifact but indicates trade in both directions in commodities
with similar factor intensity rankings in the trading partners (at least as
far as use of the general factors of production are concerned). in this case,
just as in that of Ricardo goods, some assumptions of the Heckscher-Ohlin
theory need to be relaxed, such as constant returns to scale or that knowledge
is common to all countries and firms. Intra-industry trade has been observed
to be important among developed countries, and Balassa (1979a) found that
Latin American integration had resulted in an increase in such trade.
Meanwhile, Hughes (1980) stresses that this is an important element in the
prospects for trade among developing countries. Clearly, the existence of
economies of scale, firm-specific knowledge, and so forth provides a rationale
for trade in manufactures among developing countries, as has been investigated
at the micro-economic level by Rhee and Westphal (1980).
On a closely related topic Amsden (1976), in one of a handful of
journal articles specifically analyzing trade among developing countries,
attempts to test whether this trade is "competitive" (intra-industry) or
"complementary" (inter-industry) and concludes that it is complementary. The
test consists of a finding that for eight NICs, manufactured exports are
greater the higher the degree of industrialization in the destination. This
result suggests, however, that trade tends to be highest among the NICs and
hence may be interpreted as confirming the existence of intra-industry or
competitive trade, for it is surely among the NICs that one finds the greatest
opportunities for such trade.
Linder (1961) states explicitly that the level of trade among
developing countries should be high. Linder's argument, which is restricted

11
to manufactures, considers international trade to be like domestic exchange.
Trade flows will radiate outwards towards proximate and similar markets. The
greater the similarity between the patterns of domestic demand, the higher the
trade between two countries. Since developing countries are more similar to
one another than to industrialized countries, and the latter are similar to
one another, the implication is a large trade, all things being equal, among
developed countries and a large trade among developing countries, with
relatively little trade between developed and developing countries. This
hypothesis is borne out in a certain sense. Thus, taking countries' shares in
world GNP as an indicator of their potential as markets, we observe in Chapter
III that developing countries export more manufactures to one another than
might be expected. This bias is perhaps particularly surprising when the pull
of comparative advantage might be expected rather to lead developing countries
towards trade with developed countries.
Why might the Linder approach, which seems theoretically empty, give
valid predictions? One reason might be the intra-industry trade discussed
above. If such trade develops because of the possibilities for exploiting
economies of scale in the production of goods that were initially developed
for the domestic market, the natural outlet will be countries with potential
demand for the sorts of products acceptable domestically, or, in other words,
broadly similar countries. Intra-industry specialization as a basis for
Linder-style trade is likely to occur when the countries involved also enjoy
liberal trade policies with respect to one another and thus permit
specialization. Another reason for Linder trade might be the importance of
transport costs and geographical proximity. Quite a different basis for trade
with similar countries is inward-looking industrialization in the exporting
country. Thus, with such an industrialization pattern (whether because of a

12
country's size or its protectionism), the structure and characteristics of
production will be determined by those of demand. Exports, being'limited in
product characteristics, are likely to go to countries with broadly similar
demand patterns, who are either not yet able to produce the same goods or who
follow relatively liberal trade policies with respect to the exporter (for
example in regional integration arrangements).
The evidence presented below indicates that Linder-style trade,
although surprisingly important, is becoming less so over time. Thus, the
share of developing country markets in their exports of manufactures has been
steadily declining (see Figure 1 and Table 4). At the same time, the more
inward-looking countries have relatively high and in some cases increasing
biases towards trade with developing countries (compare Argentina, Brazil,
Colombia, and Mexico with Hong Kong, Korea, Malaysia, and Singapore in
Appendix Figure A.1). The implications seem to be that for developing
countries as a whole forces for specialization vis-a-vis industrialized
countries have become increasingly powerful over time, whereas countries that
have continued to follow inward-looking policies (or are large) have tended to
show a continued and dominant Linder-style trade pattern in this sector.
The implication of the evidence presented above is apparently that
Linder-style trade among developing countries has become decreasingly
important and perhaps decreasingly efficient. Stewart (1976), however, argues
that the hypothesis has normative validity but that trade among developing
countries is biased downward by colonial experience. The implication of this
view is that there is plenty of room for more efficient intra-industry
specialization among developing countries. The existence of the current bias
towards trade with developing countries, as well as the tendency of the most
efficient exporters to trade decreasingly with developing countries, casts

13
some doubt on this hypothesis. Against this, however, the trade barriers of
developing countries themselves provide some reason for believing that there
is potential for more trade among them, as is discussed further below.
2. Barriers to Trade and the Implications for Its Direction
The ultimate trade flows will be determined not only by the
underlying factors discussed above but by natural and policy barriers.
Obviously a general view of these different barriers is needed.
The cost of transport and communications, which we may think of as
including financial networks and currency clearing arrangements, is said to be
particularly high for South-South trade. With the possible exception of
oligopoly pricing by shipping conferences (see Yeats 1977 and Laing 1977),
however, the problem is a circular one, since better connections, lower
transport costs, and improved financial facilities are as much dependent on
increased trade as vice versa. It should be noted that, since developing
countries are usually closer to some other developing countries than to
developed countries not merely physically but also culturally, there should be
a natural offsetting tendency towards trade with one another. It is not
clear, therefore, whether these barriers should lead one to expect more or
less trade among developing countries than their importance as markets would
suggest, with other determinants (e.g., factor endowments) held constant.
An important barrier is that of marketing channels. The marketing
barrier to trade among developing countries is in part the consequence of the
absence in the importing developing country of such key institutions as large
retailers, specialized importers, and wholesalers. Such institutions grow
only as per capita income rises and even then only if governments let them.
The absence of these channels makes it particularly difficult for developing

14
countries to sell to other developing countries what they have shown
themselves particularly adept at, namely manufactured consumer goods. This
constraint can affect even exports to developed countries with relatively
undeveloped distribution systems - Italy is one important example. An
indication of how important this barrier to exports to developing countries
could be is that in India the larger domestic producers of clothing find it
necessary to sell almost all their output to developed or centrally planned
economies.
One barrier of obvious importance is the commercial policies of both
developed and developing countries and the relationship between the two. As
far as the developing countries are concerned, Hughes (1980) suggests that
"the principal constraint to more South-South trade lies in the developing
countries' high level of protection" (p. 30). The literature on trade among
developing countries is replete with suggestions that lowering these barriers
would provide a valuable impetus to more South-South trade. It is important
to remember that developing country protection has- certainly not fallen over
the past 35 years - more probably the reverse. Furthermore, protection is
concentrated on items that a developing country is in a position to produce,
which are also likely to be those most suitable for other developing countries
to export. In the process intra-industry trade between countries at similar
levels of development and Heckscher-Ohlin-based trade in goods that both
countries have some capacity to produce, however inefficiently, are likely to
be particularly severely restricted. This may be a part of the explanation
why, relative to the pattern of,developing country trade as a whole, trade
among developing countries is increasingly concentrated in "Ricardo goods."
An offset to the general story of commercial policy barriers in
developing countries is the repeated attempt to create such integration

15
arrangements as free trade areas or customs unions. Although-there is doubt
about the benefits and viability of these policies (see the survey by Vaitsos
1978 and Balassa and Stoutjesdijk 1975), it is perfectly possible that they
have increased the volume of trade among developing country members, whether
through trade creation, diversion or both. Moreover, not only the volume of
trade but also its characteristics should be affected, as appears to have been
the case in Latin America. This finding for Latin America is made by us below
and also by Gregoire (1980). Balassa (1979a) finds more specifically that
intra-industry trade has increased in Latin American trade groupings and
concludes that integration therefore has had some effect in offsetting the
normal barriers to such trade among developing countries.
Turning from barriers imposed by developing countries to those of
developed countries, the story is very different. Overall levels of
protection have declined steadily in developed countries since the Second
World War and have by now reached almost negligible levels, at least as far as
tariffs are concerned. In such an environment one would expect to see what
one does in fact see: a shift in the direction of developing countries'
exports of the goods for which tariffs have fallen, namely manufactures,
towards developed country markets. Since the 1980s will see further tariff
reductions, following the Tokyo Round, the effect might be expected to
continue. This view is, however, much more controversial, as the reductions
may be offset by the bias against developing countries in tariff reductions,
erosion of the preference margins of the Generalized System of Preferences,
and the rise of a new protectionism in the form of non-tariff barriers to
trade (NTBs).
It has been argued that the tariff reductions negotiated among
developed countries are largely irrelevant to the developing, since they do
not apply to "developing country goods." The existence of such a bias is very

16
probable (Olechowski and Sampson 1980, Corbo and Havrylyshyn 1980), but the
proposition that, in consequence, tariff liberalization is irrelevant for
developing countries takes much too static a view. In the first place,
developing countries have not only been able to take advantage of tariff cuts
(Finger 1976) but have also diversified and upgraded their exports to exploit
the opportunities created in products not previously thought of as of export
interest to them (Finger and Kreinin 1978). It is worth remembering that not
a few of the NICs had not merely negligible industrial exports but negligible
industrial sectors as little as 20 years ago. In the second place, as the
NICs upgrade their exports, opportunities are created for those behind, even
if the direct benefit for the latter of developed country tariff
liberalization is modest in the short run. In the third place, there is an
important effect on all developing country exports (including raw materials)
if outward-looking liberalization succeeds in accelerating the growth of
developed countries. Finally, the importance of erosion of preferences is not
likely to be substantial, as the restrictions on preferences have in any event
reduced their benefits considerably in comparison to the benefits of general
tariff cuts (Baldwin and Murray 1976).
NTBs are, of course, an important part of the commercial policies of
both developed and developing countries. Indeed, one might well argue that,
with the decline in tariff rates in the former and the extreme popularity of
NTBs in the latter, these measures are by now much the most important
component of commercial policy. As with tariffs, prior to 1973 the trend in
developed countries was towards greater liberalization, whereas in developing
countries it was, if anything, the reverse. These different trends certainly
helped to pull developing countries exports, at least in manufactures, towards
developed country markets. (Agriculture was much more thoroughly protected in

17
developed countries, especially in the European Economic Community.) Even the
system of protection in textiles and clothing had no major effect on
developing countries' exports prior to the latter 1970s (Keesing and Wolf
1980).
Since 1973 there has undoubtedly been an increased resort to various
devices to "manage" world trade. Page (1979) estimates that between 1974 and
the end of the decade the proportion of trade in manufactures that is
"managed" had risen from 13 to 21 percent (Ibid., p. 11). It is far from
certain that the use of NTBs prior, or subsequent, to 1974 has been biased
against developing countries, although it is clear that not only textiles and
clothing but also footwear, all of which are of particular interest to
developing countries, have been increasingly severely restricted (Olechowski
and Sampson 1980 and Keesing and Wolf 1980). Nonetheless, many actions, for
example the trigger price systems in steel and "less than fair value" actions
in the United States (Finger 1980) have certainly not been concentrated on
developing countries. On balance, the increased use of NTBs by developed
countries in the 1970s has made the task of exporting to them more
difficult. Nevertheless, the effect has certainly not been to prevent
continued striking success in exploiting opportunities in this direction
(Balassa 1980, Gard and Riedel 1980).
As has been mentioned in trying to explain the importance of Linder
trade, another policy influence may be the nature of an exporter's trade
regime. More outward-looking economies appear to export a lower share of
their manufactured goods - including capital goods - to other developing
countries than do those that are more inward-looking.

18
3. Market Size and Growth as Determinants of the Direction of Trade
Developed countries account for 65 percent of world GNP, 67 percent
of world imports, and 64 percent of world imports of manufactures. ./ Between
1960 and 1973 imports into developed countries grew at an average rate of 9
percent a year in real terms, considerably faster than the 6 percent a year of
imports into developing countries. Given these facts and the growing
liberalization of developed countries' import regimes, it is not surprising
that developing countries' exports, especially of manufactures, were pulled
increasingly into these markets.
Given the underlying determinants of and barriers to trade,
differences in market size and growth are bound to play a decisive role in
determining the direction of trade. In the 1960s and early 1970s developed
countries were particularly dynamic markets. In the middle 1970s oil-
exporting developing countries enjoyed a rapid rise in purchasing power, and
after 1973 developing countries grew faster in relation to the developed than
they had before. These changes in trends were likely to play an important
role in determining the direction of trade flows, and this is, in fact, amply
borne out by the data presented in Chapter III.
From the point of view of exporters it is not merely the growth in
aggregate market size but its commodity composition that matters. It is only
if the pattern of demand matches the actual or potential comparative advantage
of the exporter that the aggregate growth creates important opportunities.
Indeed, the export pessimism of the 1950s depended as much on the presumed
These data are from UNCTAD, Handbook of International Trade andDevelopment Statistics, 1979. The definitions of developed anddeveloping countries are those of the IJN. Manufactures are SITC 5-8 less68.
19
inability of developing countries to diversify away from primary commodities
with poor growth prospects, even in a rapidly growing world, as on doubt about
the aggregate growth potential of developed countries.
Both for analysis of the past and consideration of the future,
variations in GNP growth over time and across markets have three sorts of
implications: in the first place, they will influence the aggregate growth of
all the markets to which an exporter is trying to sell; in the second place,
they will influence the direction of exports; and, finally, they will
influence the commodity composition of demand. Given the nature of the
shifts, the various exporting countries and producers will find their
particular opportunities improved or, perhaps, sharply worsened.
It is these sorts of considerations that underlie the analysis of
developing countries' problems recently presented by Sir Arthur Lewis
(1980). Leaving aside for the moment the implication of his arguments both
for policy and for the benefits of trade, let us focus only on the
consequences for trade flows themselves. He argues that, if slow developed
country growth continues, then sustained growth at 6 percent a year for
developing countries' GNP is unattainable without greatly increased trade
among developing countries. The argument is that slow developed country
growth will, all other things being equal, lead to slower aggregate growth for
developing countries' exports and to a shift in their direction (the latter
needing policy encouragement in his view). In addition, one might project a
change in the aggregate commodity characteristics of developing country
exports. This combination of circumstances should lead not only to somewhat
worse opportunities for most developing countries' exports but also to
differences in the degree of damage among them. These various presumed
effects of changes in developed country growth on the level and direction of

20
exports need further analysis. The evidence suggests, surprisingly, that
developing countries' exports of manufactures have grown almost unabated
throughout the 1970s, even to developed country markets, despite recession and
slower growth in the latter.
4. Conclusion on the Determinants of the Direction of Trade Flows
The analysis of the underlying theoretical determinants of trade, of
barriers to trade, and of market size and growth leads to a number of quite
interesting hypotheses about the trade pattern to be expected of the
developing countries.
In the first place, only a small part of the trade of any developing
country is likely to be with countries at similar income levels and with
similar resource endowments. Heckscher-Ohlin and product cycle
considerations, the relatively greater protectionism of developing than of
industrialized countries, and the overwhelming relative size of developed
country markets tend to reinforce one another in bringing about this result.
The offsetting factor could be the potential for intra-industry specialization
among those developing countries with industrial sectors sufficiently advanced
to permit production of goods amenable to product differentiation. The
obvious potential is among the NICs, but with few exceptions - Hong Kong and
Singapore because of general trade policy and, to some extent, Latin American
countries because of regional trade liberalization - their commercial policy
is likely largely to preclude this development. The experience of more
liberal countries is that the potential for intra-industry trade does not
offset the general pressures away from trade with similar countries.
In the second place, there will have been a strong pull over time
towards trade with developed countries in particular, especially as some

21
developing countries began to develop a Heckscher-Ohlin (and product-cycle)
based comparative advantage in the more standardized and labor-intensive
manufactured goods. At least until 1973 both market growth and commercial
policy tended to reinforce the effect of this development.
In the third place, some of the larger and more inward-looking
developing countries will tend to trade relatively strongly with other
developing countries, because the characteristics of their available exports
are largely determined by domestic demand and are particularly suitable,
therefore, for other developing countries.
In the fourth place, although trade in manufactures can be expected
to be dominated by Heckscher-Ohlin and product cycle differences that are
widest between developed and developing countries, this is not so true of
primary commodities, for which resource endowment differences among developing
countries are large. Thus, when trade growth in manufactures and primary
commodities are compared it may be expected that the former will show the
greater pull towards the developed countries. This will be true even if, in
fact, manufactures become a larger part of trade among developing countries
because the growth of manufactured output and demand has been universally
larger than for primary commodities.
Finally, a particularly dynamic component of trade among developing
countries should be exchange among countries with different resource
endowments and income levels and especially exchange of manufactures for
primary commodities for both domestic use and further processing between
rapidly growing, resource-poor NICs and other countries. Indeed, this might
be expected to be the main direct implication of the NICs' growth for other
developing countries. In turn, developing countries might provide a useful
market for the exports of the most capital- and skill-intensive and most
technologically sophisticated manufactured exports of the NICs.

22
B. The Benefits of Trade among Developing Countries
In the absence of divergences between social and private costs and
benefits or policy-induced distortions, there is no reason to suppose that
trade in any one direction is likely to be more beneficial than in any
other. The argument that some kinds of trade are better than others depends,
therefore, on an appeal to particular divergences or distortions.
Krueger (1980) argues that trade with developed countries - at least
in manufactures - is more beneficial to the developing countries than that
with developing countries. The basis of the argument is simply that
developing countries generally suffer from unemployment, the shadow wage
being, therefore, generally below the market wage. At market prices the more
capital-intensive techniques and industries will appear relatively more
profitable than they should. Moreover, in the case of trade, exports to
developed countries are less capital-intensive than those to developing
countries. Thus, because of the labor market distortion, trade with developed
countries is relatively too small and that with developing countries too
large. This is, of course, equivalent to saying that, at the margin, social
returns on exports to developed countries are higher than those on exports to
developing countries. Hughes (1980) suggests that the importance of exports
to overall absorption of labor is not large. More critical than this
shortcoming, however, are the assumptions that labor is in surplus and that
the demand for exports of developing countries is elastic. Some uncertainty
about the protectionist environment of the future may weaken the plausibility
of the latter assumption. As to surplus labor, the assumption is not true of
several newly industrializing economies (Singapore, Korea, Taiwan), where
evidence of upward wage pressures suggests a proximity to full employment.
Even where a surplus of unskilled labor exists, skill shortages or other

23
constraining factors may determine the production possibility frontier at a
position short of full employment of all resources.
Krueger's argument is, of course, a counter to the view that the
distortions run in opposite directions. One argument is that there are
external benefits from competitive trade among developing countries. Thus,
Hughes (1980) stresses the potential benefits for x-efficiency, innovation,
and exploitation of economies of scale that should result from trade in
manufactures among developing countries. Balassa (1979) and Keesing (1978)
make similar claims, and Rhee and Westphal (1980) provide some limited
evidence for the scale and specialization benefits. A related proposition is
based on the infant industry argument. In a world where developing countries
trade only with the developed countries, more sophisticated and capital-
intensive goods can initially be produced only for the home market. If the
latter is small, subsidization may be required if anyone is to be interested
in producing the products at all. The most common means of subsidizing the
industry is, of course, protection, which imposes significant costs. The
existence of other and poorer countries, however, it is suggested, creates a
natural comparative advantage in export from the country's "next generation"
of industries. In this way costs of infant industry promotion are lowered
and, in the process, overall growth should be somewhat accelerated. As
Keesing (1978, p. 15) puts it, one should consider "the dynamic, learning, x-
efficiency and long-run advantages of trying to create exports based on future
rather than past comparative advantage." Trade with other developing
countries is, it is argued, a relatively cheap way of accelerating this
process. Thus, the existence of the wider array of potential trading partners
reduces the gulf between the private and social net benefits of infant
industry promotion.

24
An argument can be made that links those who emphasize the dynamic
benefits of trade among developing countries and the "dependency" theorists.
Thus, one of the results of more diversification in the direction of trade is
more diversification in the products traded (for reasons developed above in
the discussion of the determinants of trade flows). The latter, in turn,
entails more diversified domestic production than if there were to be free
trade and only developed countries as markets. From a social point of view
diversification may be beneficial simply as insurance against adverse
developments in major products. Diversification may also provide social
benefits because it ensures a wider range of skills and knowledge (with
benefits for adaptability similar to those of genetic variability in a
species) and reduces the potential for coercion by any one trading partner.
A terms-of-trade argument can also be made for the benefits of
export diversification to developing countries as a whole. For most
individual developing countries prices can be taken as given when trading with
developed countries. For all of them together, however, there are likely to
be substantial divergences between marginal and average revenues for many
products. Thus the expansion of any one country's exports to developed
countries will occur, to some extent, at the expense of other developing
countries - an externality that the exporter will ignore. If potential for
trade with one another increases and this trade is at least to some extent a
substitute for trade with developed countries, the effect will be an upward
shift in export supply curves to the latter. This will, in turn, reduce
export volume and improve the overall terms of trade vis-a-vis developed
countries, just as would the joint imposition of an optimal export tax.
Those working in the "dependency" tradition (Stewart 1976, for
example) argue that colonial and neo-colonial coercion has forced developing

25
countries to trade more with developed countries and less with one another
than they should. The consequences are excessive specialization and
consequent vulnerability, on the one hand, and loss of the dynamic benefits of
trade with one another, on the other hand. Trade among developing countries
is, therefore, the best avenue of escape from the staple trap with its
attendant stagnation. These analysts thus believe that there are substantial
divergences between the private and social net benefits of trade flows in
various directions, in general, and of removing bottlenecks on trade with
developing countries, in particular.
Although some of the elements discussed above appear in the
arguments of export pessimists - a view popular in the 1950s and now returning
(see Lewis 1980) - the structure of that argument is a little different. In
the first place, the issue is set in a dynamic context in which the goal is a
certain rate of growth for developing countries and the constraint is the rate
of growth and pattern of demand consequent upon growth in the world as a
whole. In the second place, it is not necessary to the argument that some
distortion makes trade among developing countries superior at the margin to
that with developed countries. The view is rather that for almost all
developing countries a certain rate of growth of trade is virtually essential
for any target growth rate of income. If developed countries grow slowly,
there is a limit to the rate of growth of primary exports from developing
countries to the developed, without major relative price declines, and of
manufactured exports, largely because of protectionism. The required overall
growth of trade can then be achieved only by accelerated trade among
developing countries. It is probably appropriate to view the argument as
stating that, although all trade is equally beneficial, the value of any one
opportunity increases as other opportunities decline.. The argument can be

26
inverted in a way that makes it more releva-nt to policy by stating that in
this global environment the costs of barriers to trade among developing
countries are higher than when the developed countries are more dynamic.
There is some evidence on the occasionally contradictory and
sometimes mutually reinforcing views outlined above. In the first place,
Krueger is clearly correct in arguing that trade in manufactures with
developed countries is indeed more labor-intensive than that with developing
countries. Secondly, the various dynamic arguments have been no more than
partially tested, for. example with the evidence on intra-industry trade in
Latin America with its presumed competitive benefits. There is certainly
evidence that casts doubt on the infant industry argument that developing
countries are important as first markets for more sophisticated goods, namely
the fact that exports of capital goods from developing countries have been
going increasingly to developed countries. Thus, although capital goods are a
larger share of exports to developing countries than to developed countries
and the share of these goods in exports to developing countries has been
rising, the share of developing countries markets in exports of capital goods
has declined from 63 to 43 percent between 1963 and 1977 for our sample of 33
countries. Finally, although it is probably true that the existence of trade
with developing countries leads to export diversification, the benefits of
this are uncertain. In the case of manufactured exports, at least, it appears
that the countries that specialized increasingly in trade with developed
countries have shown themselves more flexible than the others in meeting
changing, opportunities.
The export pessimism of Lewis (1980) is also somewhat doubtful. The
link between growth of developed countries and developing country exports of
primary commodities is itself weak for many commodities, since the developed

27
countries are dominant exporters of many primary products other than fuel and
tropical tree crops. Furthermore, .the evidence suggests that the link with
manufactured exports is still weaker, and the latter are now about as
important in aggregate as non-fuel primary exports. Thus, although more trade
opportunities can hardly hurt, it is far from clear that trade among
developing countries is essential for developing country income growth when
there is a slowdown in developed countries.
One case for which the Lewis argument seems relatively strong is
that of exporters of primary commodities. This allows one general observation
on the statements about the presumed benefits of greater trade among
developing countries that have been discussed above, namely that they are
almost exclusively concerned with manufactured goods. Indeed, in the case of
those concerned with staple traps, it is just this presumed feature of trade
among developing countries - the expansion of manufactured exports - that is
most attractive, and their view has, in turn, frequently motivated policy.
Nonetheless, as has been suggested above, both theory and experience suggest
that it is for primary rather than manufactured goods that trade among
developing countries has been particularly valuable. This finding indicates
that a different view of trade among developing countries may be appropriate --
one which stresses the benefits of the resulting increased opportunities for
exports by countries with a comparative advantage in primary commodities, that
points to complementarities between more and less industrialized developing
countries in export and further processing of primary products or exchange of
food and raw materials for capital goods, and that highlights the consequent
potential for increased employment. Thus, since agriculture is frequently
more labor-intensive than manufacturing in developing countries, a strong
tendency to increased trade in primary commodities among developing countries

28
turns Krueger's argument on its head. It is certainly true that primary
commodities should not be ignored in considering the effects of trade among
developing countries.
C. Policy Options for Trade among Developing Countries
The arguments and evidence discussed above certainly do not seem to
come-out decisively in favor of, or against, trade in any particular
direction. Be that as it may, whatever the benefits of trade flows in
particular directions, trade theory suggests that intervention in trade is
unlikely to be the best course. This argument needs clarification in relation
to the discussion above of barriers to trade among developing countries and of
the effects of trade in particular directions. For this purpose it is
convenient to divide the problems, to which policy is to be addressed, into
those that are not themselves caused by other trade policy actions and those
that are.
1. Externalities, Factor Market Distortions, and "Natural" Barriersto Trade among Developing Countries
The divergences between private and social net benefits of trade in
particular directions, that are not themselves the consequence of trade
policy, fall into three broad areas: (a) the results of labor market
distortions, "dynamic" externalities (e.g., learning by doing, exploitation of
economies of scale, and so forth), (b) benefits of product and destination
diversification for individual developing countries and all developing
countries together, and (c) problems associated with transport, finance, and
market barriers (e.g., oligopolistic shipping markets, inadequate trade credit
or currency convertibility, lack of market knowledge or of marketing
institutions, and so forth). As far as the first is concerned, the best

29
policy is to deal with the labor market distortion, the second best is to
subsidize labor-intensive output, and the third best is to subsidize labor-
intensive exports. A policy to promote trade with developed countries in
particular (which might be an implication of Krueger's argument) is a poor
option indeed. For any individual country dynamic externalities putatively
associated with particular exports are best exploited through direct
subsidization of the source of the externality, of the output, or of the
exports, in that order. A policy to promote trade among developing countries
specifically is unlikely to be the best means of capturing the externality.
Even diversification can probably be best achieved through a policy to promote
more varied output and thus trade, although some promotion of exports in new
directions (whether developing or developed countries) may be appropriate.
The implications of transportation, financial, and marketing
barriers are complex. As far as the first is concerned, port or airport
development generally has little to do with trade in any particular
direction. Shipping or air freight could be biased against trade among
developing countries because of domination by developed country firms. The
best way to deal with this problem is to develop alternative transportation
systems, which might have implications for trade among developing countries
even if not directed at that objective. These involve investments in fairly
capital-intensive sectors and need careful justification. Again, financial
constraints can be dealt with by establishing credit institutions, and so
forth, without having any specific trade destination in mind, although it is
likely that trade with developing countries will benefit the most. Similar
arguments apply to the problem of marketing barriers, but here there is an
interesting additional issue. As has been mentioned, the marketing barrier to
trade among developing countries is in part the consequence of the absence of

30
certain institutions - large retailers, specialized importers, and
wholesalers. There is very little that can be done about this constraint in
the short run, although it is interesting that for some commodities, developed
country institutions such as the Japanese trading houses are playing a role in
trade among developing countries.
An interesting aspect of the constraints on transportation, finance,
and marketing in trade among developing countries is the presumption that
these will diminish as trade grows or, in other words, that there is potential
for a virtuous circle. This externality can, of course, follow from growth in
trade between any pair of countries-and is best seen as another variant of the
infant export argument. The difficulty with applying this plausible idea to
policy is that at any point the returns to expanding trade along habitual
channels are likely to be higher, since the initial investment has already
been made. Furthermore, quantification of the externality is virtually
impossible. Nevertheless, since there may be some external benefit and, in
addition, there is a case for diversification, some promotion of trade to new
destinations may be justified.
The arguments discussed here do not seem to justify a policy
specifically aimed at promoting trade among developing countries. There does,
however, seem to be some case for promoting exports to new destinations,
although working out the details of policy would be difficult. It also makes
sense to examine whether there are profitable opportunities to improve
transportation, finance, and marketing systems. It must be accepted, however,
that in the last category there are constraints that only development itself
is likely to cure. It is easier to sell shirts and toys through Sears Roebuck
than through the fragmented distribution systems of most developing (and some
developed) countries.

31
2. Barriers Created by Trade Policy
There are two respects in which the arguments about optimal policy
for a single country need modification: first, the starting point is one in
which extensive trade-policy-created barriers to trade exist, whereas
dismantling them is far from easy; second, policy collusion among a number of
countries is possible, which violates the standard small country assumption.
How do these factors affect policy choices?
A simple argument for preferential liberalization of trade among
developing countries is that this may be the only politically practical way of
dealing with domestic protectionist lobbies. As experience among developed
countries has shown, reciprocal liberalization is the most effective way of
defusing opposition. In the case of developed countries, however, their size
in world trade makes it politically easy to liberalize on a most favored
nation (MFN) basis, while ignoring free riders. For developing countries this
is not practical. Thus, for political, if not economic, reasons it should be
much easier to liberalize on a discriminatory basis, in an attempt to restrict
benefits to participants in the liberalization process.
In addition to political practicality, there are also economic
reasons for reciprocal discriminatory liberalization. In the first place, it
is possible that the liberalization by trade partners creates new
opportunities for valuable trade that actually make this option superior to
unilateral non-discriminatory liberalization (although in the case of
developing countries this is perhaps unlikely). This sort of reasoning
underlies the recommendations of those interested in promoting integration in
order to exploit economies of scale (see Cooper and Massell 1965). In the
second place, unilateral liberalization being impossible politically,
discriminatory reciprocal liberalization may be the best available policy from
an economic point of view.

32
These sorts of arguments for discriminatory liberalization to deal
with existing barriers (see Hughes 1980) run in the face of experience (see
Vaitsos 1978). Most such schemes collapse for two central reasons: first,
any program of trade liberalization entails loss of control over resource
allocation by nationally oriented planning; second, substantial trade
diversion usually follows because of high external barriers and high internal
costs of production, and this diversion, in turn, usually benefits the more
advanced countries at the expense of the poorer, since liberalization tends to
focus- upon manufactured goods. For this reason discriminatory liberalization
can be politically feasible only if the countries concerned accept the role of
trade in allocating resources and have generally outward-looking and liberal
trade policies. It is useful, therefore, to distinguish between outward and
inward-looking trade liberalization agreements, with the former more viable
(if also less necessary) than the latter. -/
3. Assessment of Policy Options in the Light of the Determinantsand Effects of the Destination of Trade
Discussion of policy deals with virtually all the reasons for
believing that trade with developing countries needs special action. The
general conclusion is that, where policy is needed, it should either not be
addressed to trade at all or at least not exclusively to trade among
developing countries. This is true even where extensive barriers to trade
exist already, either because nothing can be done about them directly or
because, where created by policy, discriminatory action is likely to be
economically inefficient and politically destabilizing.
We are indebted to Helen Hughes for this important distinction.

33
It is important to see how these conclusions fit into the argument
that trade among developing countries must serve as a source of growth in the
future. Our conclusion is that this argument comes down to a simple
proposition: in an environment where developed countries are poor markets,
the costs to developing countries of their own barriers to trade with one
another rise. Therefore, action to deal with the "natural" and policy-created
barriers is more important and the economic return to developing countries as
a whole is higher. The policy recommendations themselves do not change. It
is not the case, for example, that high-cost discriminatory trade
liberalization arrangements become acceptable - on the contrary, inefficiency
is likely to be more costly than in a forgiving environment. Whether such
policy improvement can fully offset the effects of a deteriorating world
environment on growth is another, and open, question.
D. Conclusion
The discussion of the theoretical issues brings out a number of
interesting hypotheses about the determinants and characteristics of trade
flows to different destinations, the effects of trade, and policy options. An
important conclusion is that these issues have to be examined separately.
Furthermore, however valuable trade among developing countries may be and
however important the barriers to it, it is not likely that policy should be
directed exclusively towards it. A major purpose of this discussion was to
reveal this as a crucial non sequitur.

34
III. TRENDS IN TRADE AMONG DEVELOPING COUNTRIES
There is no ideal format for presenting evidence on a large topic
encompassing many distinct hypotheses and policy issues. It turns out not to
be convenient to follow the organization of Chapter II, which is why some of
the implications of our findings have already been presented in that
chapter. Here we present data on the destination of developing countries'
exports over time and on some key features of trade among developing
countries, in particular, bringing out the consequences for some of the
theoretical issues discussed in Chapter II.
Before presenting the results of our empirical analysis, we outline
the data sources, assumptions made, and definitions used. The empirical basis
for the study is the UN trade data accessed by the so-called "GATT (General
Agreement on Tariffs and Trade) System" program. Because of gaps and in order
to observe individual countries while limiting the volume of data, a sample of
33 developing countries was chosen. These are labelled "Reporter Countries"
in Appendix A. Although the volumes of trade analyzed do, therefore,
understate total trade flows, the coverage is very high. For 1977, the
study's figure on non-fuel exports by the 33 developing countries to the world
was approximately US$97 billion or 64 percent of a total US$151 billion, based
on the 1980 UNCTAD Handbook of International Trade and Development
Statistics. For trade among developing countries the coverage is about 60

35
percent of the total. 5/
How representative is the sample? As one reason for selecting
countries in the sample was that data were available for the entire 1963-77
period, both small and low-income countries may be somewhat under-represented,
even though several, African, Asian, and Latin American countries with one or
both of these characteristics are included in our sample. We also note that
the principal focus of the analysis will be on the exports of the sample to
the "Partner Countries" (Appendix A). Because the sample over-represents
exporters of manufactures, the weight of manufactured goods will be overstated
in export figures; thus, in the discussion of commodity composition, it will
be necessary to look also at the imports of the sample countries. Finally,
from the evidence discussed in footnote 5 and estimates for 1970 by the
The UNCTAD figure for exports from "other" (i.e., non-OPEC) developingcountries to all world destinations was $137.6 billion in 1977. (SeeUNCTAD, Handbook of International Trade and Development Statistics,Supplement 1980, Table 3.1). Adjusted for fuels, the total is $116.1billion (see Table 3.6A). To this must be added the non-fuel exports ofOPEC members that are not defined as capital-surplus in this study and,more important, the non-fuel exports of countries included in the WorldBank's but not the United Nation's definition of developing countries,namely, Greece, Israel, Portugal, South Africa, Spain, and Yugoslavia.The non-fuel exports of the former group were $6.8 billion and of thelatter were $27.9 billion. Total non-fuel exports of developingcountries according to the World Bank's definition, therefore, were$150.8 billion in 1977. As far as trade among developing countries isconcerned, we start with the UNCTAD figure of $25.3 billion for exportsfrom "other" developing countries to one another in 1977, which isadjusted to $21.7 billion after exclusion of fuels. Non-fuel exports ofSouthern Europe, South Africa, and non-capital-surplus OPEC members toone another and to "other" developing countries are estimated at about$8.9 billion. (Their total non-fuel exports are taken from the UNCTADHandbook and the direction of exports from World Bank, World DevelopmentReport, 1979, World Development Indicators Table 11.) To this must alsobe added non-fuel exports from "other" developing countries to SouthernEurope, South Africa, and non-capital-surplus OPEC members, which areestimated at about $8 billion. (The market shares were taken from IMF,Direction of Trade Yearbook 1979 and the level of non-fuel exports fromthe UNCTAD Handbook.) Total non-fuel exports from developing countriesto one another are estimated, therefore, at $38.6 billion or 25.6 percentof their total exports.
36
Economic Projections Department (EPD) of the World Bank, it appears that non-
fuel exports among developing countries, as the World Bank defines them, rose
from- 23.3 to 25.6 percent of total trade between 1970 and 1977. In our
sample, by contrast, the change from 1971 to 1977 was from 22 to 24 percent of
exports. It appears, therefore, that our sample is a little more oriented
away from trade with developing countries than is the universe of all
developing countries, but the changes in the 1970s in the sample's direction
of trade are representative of those of developing countries as a whole.
The principal country groupings are those used by the World Bank,
comprising developing countries (LDCs in the tables), developed or
industrialized countries (DCs), capital-surplus (oil-exporting) countries
(CSCs), and centrally planned economies (CPEs). The coverage of these and
other sub-groups is defined in Appendix A. It can be questioned whether Spain
and Yugoslavia, in particular, should be included among the developing
countries. Where this appears to distort the results (on the whole it does
not), a note will be made. Commodity categories are defined in Appendix B.
For reasons given in Section l.a (below), "total trade" in this paper is
usually trade exclusive of fuels (SITC 3), which means that commodity
composition is defined with respect to trade excluding fuels and therefore
differs from conventional usage. An effort has also been made to define
capital goods so as to exclude large consumer items, in particular automobiles
and electrical components, transistors, tubes, and valves.
An important point to note is that the analysis is carried out
almost exclusively in terms of the shares of exports going in different
directions. The reasons for this are two: first, our lack of confidence in
any available deflators and, second, the appropriateness of the share measure
to a study of the structure of trade. Since the analysis largely excludes

37
fuels, the worst problem created by use of nominal data is avoided, and
reliance on the share measure diminishes the problems further. Nevertheless,
there are at least two major defects inherent in the approach. In the first
place, changes in shares mask the dynamism (or lack of it) of the entire
system. Thus, the declining shares of total manufactured exports going to
developing countries, for example, conceal the equally important fact of the
rapid growth of these exports. In the second place, changes in shares can
reflect changes in numerators, denominators, or both, whereas the correct
interpretation of the changes depends in part on what underlies them. These
defects need to be kept in mind throughout the discussion below.
Finally, a reference must be made to the problem of re-exports,
which are not netted out in this analysis. An attempt to do so proved
fruitless, because only a few countries provide the data and only for some
years. For these cases, the apparent trend was a decline in the share of re-
exports in the total exports of rapidly growing economies such as Singapore
and Hong Kong, but there was no clear direction for other economies. 6/
A. Destination of Developing Countries' Exports
In discussing the destination of the trade of developing countries
attention is paid first to overall trends in the share of trade among
developing countries in their total trade and then to the effect of
differences in market size and growth on the direction of developing
countries' exports.
6/ For example Ghana's re-exports share increased for 1963 to 1973, thendecreased by 1976, ranging from 5 to 15 percent.

38
1. Trend in the Share of Trade among Developing Countries in their Total Trade
The discussion below starts with the overall trend in the shares of
developing countries' markets, then examines those of major commodity sub-
groups and proceeds to differences in the experiences of particular regions
and functional categories of developing countries.
a. Overall Trends in the Share of Trade among Developing Countries
Earlier studies on trade among developing countries (Hughes and
Laursen 1978, Hughes 1980) have observed a long-term decline in its share in
total developing country exports from about 24 percent in the mid-1950s to 20
percent in the 1970s, followed by a reversal to 23 percent in 1977. This
finding is confirmed for the trade of all commodities in our sample, inclusive
of fuel, when the developing world is defined to include capital-surplus oil-
exporting countries. The cycle is far less pronounced, however, for non-fuel
exports to developing countries, excluding capital surplus oil exporters, as
Figure 1 shows. With the latter included, there is a slight downward trend
for the share of exports of all commodities to developing countries from 1963
(26 percent) to 1973 (24 percent), then a sharp rise to 30 percent in 1977.
Excluding the capital-surplus oil exporters as markets does not by any means
eliminate the upward jump between 1973 and 1977, but modifies it
substantially, as the share then increases by only 2 percentage points from 23
percent in 1973 to 25 percent in 1977. Sales to the capital-surplus oil
exporters clearly account for much of the upward jump in trade among developing
countries broadly defined. Furthermore, excluding fuels trade, the downward
trend to 1973 is much weakened, the share of trade among developing countries in
their total trade remaining nearly constant from 1963 to 1973 at between 22

39
Figure 1: PERCENTAGE SHARE OF DEVELOPING COUNTRYEXPORTS GOING TO DEVELOPING COUNTRIES
\iManufactured Goods to LDC
\_,_AlI goods to (LDC + CSC)
....... AI goods to LDC
\ _ _ _Non-Fuel Exports to LDC
r~~~~~~~~~~~~~~er
CW
20
1963 ~~~~~1968 19'71 19'73 19'75 7
Years
World Bank - 22825

40
and 23 percent. -7 This change in the pattern as we focus on non-fuel trade
results from the sharp decline from 35 percent in 1963 to 26 percent in 1973
in the share of trade among developing countries in their total trade in
fuels, which reflects their increasing reliance upon capital surplus oil
exporters. In 1963 the latter accounted for 34 percent of developing
countries' fuels imports but in 1973 for 53 percent. 8/
In summary, if we look only at non-fuel exports to developing
countries (excluding capital-surplus oil exporters), the share in total
exports was quite stable at 22 to 23 percent from 1963 to 1973 then rose
somewhat in 1975 to 24 percent, where it stayed until 1977 (see Table 1). The
nominal growth rates for exports to developed countries were not distinctly
different from those to developing countries before 1973. From 1973 to 1977,
however, trade among developing countries grew faster in all years except
1976, the year of recovery in the industrial countries. That trade with
developing countries again grew faster in 1977 than trade with developed
countries suggests a sustained trend towards increased shares of trade among
developing countries rather than a short-term diversion in 1975. GATT data
for later years confirm this, showing for the three years 1977, 1978, and 1979
that the share of trade among developing countries in their total trade was
20.4 percent, 19.9 percent, and 20.1 percent respectively. It would appear
7/ The shares of trade among developing countries, including the capitalsurplus oil exporters, in our sample are higher than those in Hughes(1980), which are derived from UNCTAD, Handbook of International Tradeand Development Statistics, for various years. The differences betweenthe ratios shown here and those in Hughes' paper are largely aconsequence of differences among the definitions of the group ofdeveloping countries and the limited nature of our sample.
8/ The ex-post definition of capital-surplus oil-exporting countries isapplied over the entire period, though of course these countries weregenerally not in surplus in the 1960s.

41
that, although the share of trade among developing countries established in
1975 has not been surpassed, neither has it been reduced.
b. Trends in Major Commodity Sub-Groups
For commodity subgroups (see Table 1), the picture is somewhat
different. In manufactures in particular, one observes a strong downward
trend in the share of trade among developing countries except for an
interruption in 1975. It is noteworthy that most of this decline took place
between 1963 and 1971. The share of exports to developing countries in their
total exports of manufactures fell from 40 percent in 1963 to 27 percent in
1971, and then more slowly to 25 percent in 1977. The shift in the
destination of manufactures was towards the developed countries until 1973 and
then towards the capital-surplus oil exporters, although even before 1973
growth of exports to the latter was usually much higher than that to other
developing countries. The capital-surplus oil exporters did, however, only
take only between 1.0 and 2.5 percent of developing countries' manufactured
exports in the 1960s, and this did not change until the dramatic growth rates
of 50 to 100 percent a year between 1972 and 1976. By 1977 capital-surplus
oil exporters were taking 7.0 percent of the manufactured exports of
developing countries. Because the trend in trade in manufactures is so
markedly different from that for all non-fuel trade, we return to investigate
it more closely below. Note, however, that the general trend towards a
declining share of developing country markets in exports of manufactures was
not followed by Latin American countries (see Table 2), which experienced the
opposite trend.
Within manufacturing, capital goods are of particular interest. It
is sometimes argued 9/ that not only should there be more trade among
2/ See recent World Bank studies by Pack (1980) and Datta-Mitra (1979).

42
Table 1: TRADE AMONG DEVELOPING COUNTRIES AS SHARE OF THEIR TOTAL EXPORTS
(Percent)
1963 1968 1971 1973 1975 1977
Food and Beverages 16 19 18 19 21 23
Non-food Agriculture 18 24 26 25 27 29
Metals and Minerals 11 9 10 11 11 12
Total Non-Fuel Primary 16 19 18 20 20 23
Manufactures 40 30 27 25 28 25
TOTAL Non-Fuel 22 23 22 22 24 24
Capital Goods - Broad 66 53 44 38 45 38
Capital Goods - Narrow 63 55 48 43 49 43
Source: Computations based on-GATT trade data tapes, prepared by SystemsDivision, EPD. Definitions are given in Appendix B. Unless other-wise indicated, sources for all tables are the same.

43
developing countries in capital goods than there is, but also that one must
expect developing countries to sell new capital goods at first largely to one
another, because of fierce competition in the markets of industrial
countries. By learning in developing country markets, world-wide
competitiveness can be achieved. What we observe, in fact, is that trade
among developing countries in capital goods, even quite narrowly defined, 10/
has declined sharply from 63 to 43 percent of their total exports of capital
goods in a period in which the volume of these exports to all destinations has
grown almost twice as fast as total non-fuel exports (see Appendix Table
A.4). Furthermore, unlike trade in manufactures as a whole, where the decline
had largely occurred by 1971, there continued to be a strong downward movement
in the share of developing country markets for capital goods except for 1975.
(This trend, however, again does not occur in Latin America.)
An increasing share of exports of primary goods (excluding fuel) has
gone to other developing countries. This trend was opposite to that for
exports of manufactures, and the latter's effect on the direction of total
non-fuel exports was more than fully offset. The developing country market
share for primary goods increased between 1963 and 1977 from 16 to 23 percent
of all developing country exports of such goods. The share of developing
country markets in metals and minerals remained relatively constant, whereas
that in food and non-food agricultural commodities increased markedly,
particularly in the 1970s for food and in the 1960s for non-food
commodities. Since the sample in this study is biased against exporters of
primary goods, these results may well understate the growing importance of
0/! See Appendix B. The broad definition includes automobiles and electricalcomponents, transistors, valves and tubes, large items of trade that areprobably best defined as consumer durables. Thus the narrow definitionis more appropriately considered as capital goods.

44
trade among developing countries in primary goods. This trend suggests a
burgeoning "triangular trade," in which the rapid growth and industrialization
of some developing countries has led to imports of raw materials in greater
variety and quantity than before.-Li
c. Differences among the Experiences of Regions and FunctionalCategories of Developing Countries
The values and trends for the shares of developing country markets
in exports vary systematically by region, as can be seen in Tables 2 and 3,
with only a few countries within their regions showing important
differences. Asia, on the one hand, began with above average dependence on
developing countries in all commodity groups, but this also declined faster
than the average, and by the end of the period the shares were at about the
average. Latin America, on the other hand, had below average dependence on
developing countries in 1963 but experienced an unusually large increase in
the shares of developing country markets. By 1977 the region's dependence on
developing countries was well above the average, especially for manufactured
goods. Southern European trends followed the average very closely, whereas
Africa had a mixed experienced: for manufactured goods the share of
developing country markets declined, but for all non-fuel goods it increased
markedly. Latin America's increased trading with developing countries
suggests that regional integration arrangements may have had a strong
effect. For the eight Latin American countries in our sample, two-thirds of
exports going to developing countries in 1977 were destined to trade
associates. This figure appears not to be attributable merely to the effect
It is somewhat of a puzzle, however, why the share of developing countrymarkets in metals and minerals did not increase; one possible answer liesin our sample's under-representation of mineral exporters.

45
of proximity, as only half of exports to developing countries normally go to
"neighbors" (Appendix Table A.5). Other factors were also at play, however,
including, as Wionczek (1979) has noted, import-substitution and the
consequent search for developing country markets for spill-over of
manufactured goods. It is noteworthy that within Latin America, only
Argentina of the three NICs (Brazil, Argentina, and Mexico) experienced the
regional trend for increased shares of developing country markets in
manufactured exports, whereas the other two experienced more fluctuating
shares.
When the sample is grouped into functional categories, one observes
that for the NICs the values and trends are almost identical to those for
developing countries as a whole. As they accounted for 56 percent of the
total exports of the 33 sample countries in 1963 and 66 percent in 1977, this
is not surprising. (Further information on the role of NICs in trade among
developing countries is given below.) It is important to observe that the
sub-sample of oil importing countries excluding the NICs exhibits similar
trends to those of the NICs. Indeed, it is only the small, low-income
countries that, as a group, show a distinctly different pattern, experiencing
increased dependence on developing country markets throughout the period, not
only for all non-fuel exports but also for manufactured goods in general and
capital goods in particular.
Observed variations by region, functional groups, and by individual
country indicate that the trend towards declining importance of trade among
developing countries in manufactures, though not universal, was found
frequently even within the two regions experiencing an increase in the share
of this trade, Africa and Latin America. The higher and rising shares for
Latin America suggest integration as one factor, whereas the lower and sharply

Table 2: SHARE OF TRADE AMONG DEVELOPING COUNTRIES IN TOTAL TRADE BY REGION 1963-1977 SELECTED YEARS
(Percentage)
Non-fuel Merchandise Manufactures Capital Goods - Narrow1963 1968 1973 1977. 1963 1968 1973 1977 1963 1978 1973 1977
Exporting Region
Sample of 33 LDCs 22 23 22 24 40 30 25 25 66 55 38 38
Southern Europe 19 21 19 21 33 28 22 24 54 47 40 37
Asia 31 26 24 24 44 28 22 24 88 76 41 37
Africa 8 11 15 13 33 42 42 26 33 43 52 47
Latin America 14 21 24 30 36 45 37 51 58 57 53 69
NICs 23 24 22 25 41 29 23 25 64 53 42 42
Non-NIC Oil Importers 20 18 21 20 34 28 29 27 53 57 57 55
Small Low Income 12 13 15 19 44 63 57 42 28 50 54 58

47
Table 3: SHARES OF EXPORTS TO DEVELOPING COUNTRIES IN TOTAL EXPORTS
Manufactures All Excluding Fuels1963 1968 1971 1973 1975 1977 1963 1968 1971 1973 1975 1977
Greece 32 18 21 18 21 20 11 13 15 14 16 17
Israel 24 19 22 20 23 18 18 17 18 18 20 17
Portugal 43 36 30 22 19 17 37 33 29 22 20 17
Spain 34 38 32 30 34 32 16 27 25 24 27 27
Turkey 10 10 17 18 10 09 13 12 15 1S 14 13
Yugoslavia 32 19 14 12 16 16 19 16 12 11 14 16
SOUTHERN EUROPE 33 28 25 22 25 24 19 21 20 19 21 21
Cameroon 79 77 70 62 75 31 08 11 14 15 19 08
Congo 06 14 29 43 55 38 07 17 26 31 40 29
Ivory Coast 59 58 64 52 71 Ss 12 11 12 17 21 18
Ghana 17 05 30 11 35 - 05 06 08 08 14 -
Senegal 26 73 76 71 68 - 06 15 29 32 25 -
Tunisia 53 27 18 24 19 09 16 16 13 16 26 15
Libya 22 90 93 97 - - 16 50 38 94 40 -
Nigeria 15 - 06 07 04 13 05 - 05 06 03 03
Central AfricanRepublic 50 32 29 38 36 17 28 19 22 23 22 10
AFRICA 33 42 45 42 48 26 08 11 11 Is 19 13
Hong Kong 27 17 15 14 14 14 29 18 15 is 15 15
Singapore 97 85 66 44 47 44 60 54 51 40 44 43
Korea 43 15 14 12 14 15 32 14 13 12 15 15
talaysia 9U 74 60 43 39 35 33 31 35 33 32 33
Philippines 07 08 30 29 26 20 04 08 09 10 09 10
Thailand 67 46 41 34 36 33 52 42 36 40 37 38
India 33 23 29 22 27 24 24 17 22 19 21 19
Pakistan 43 35 27 38 31 24 34 31 27 37 38 27
Iran 29 11 15 14 20 - 13 15 16 is 16 -
Sri Lank& 27 16 12 - 14 23 17 16 22 - 26 30
ASIA 44 28 25 22 23 21 31 26 25 24 24 24
Brazil 41 51 47 38 47 43 11 19 23 23 28 27
Argentina 46 53 60 60 71 63 22 35 33 39 43 43
Colombia 61 49 51 40 55 59 07 14 20 20 27 23
Honduras 93 97 45 66 80 78 19 21 11 15 21 17
.N4xico 31 28 25 20 38 - 09 12 14 12 18 -
Venezuela 20 59 56 43 52 - 11 15 14 15 21 -
Paraguay 15 12 47 31 72 - 30 38 43 24 42 -
Pa am 61 97 72 85 83 86 05 04 50 09 13 22
LATIN AMERICA 36 45 42 37 50 51 14 21 23 24 29 30

48
declining shares for much of Asia and the NICs, plus particular country
experiences within each continent, suggest that inward- versus outward-looking
trade regimes are another. The increased shares of trade with developing
countries in total trade for small and low-income countries and the
experiences of several "late-comers" (Senegal, Honduras, the Philippines)
suggest yet a third factor, namely the stage of industrial development. It
might be hypothesized, as has been discussed in Chapter II, that the
importance of developing country markets to developing country exporters is
greater the lower the level of development, the more inward-looking the trade
regime, and the larger the role of integration schemes.
d. Conclusion on Trends in Trade among Developing Countries
It appears that for developing country exporters (as represented by
our sample), the share of exports to developing countries (excluding CSCs) for
total non-fuel merchandise was fairly stable from 1963 to 1973 at about 22
percent, then rose only slightly in 1975 to 24 percent, where it has stayed
through 1977 and probably 1979. For manufactures, however, the share has
declined markedly from 40 percent to 25 percent, although the rate of decline
slowed in the 1970s. The reverse trend was experienced in Latin America,
however. In short, there has not been a marked increase in the role of this
trade since 1963, and what has occurred has been limited to primary goods or
to Latin American countries. Some difference is observable, however, between
the 1960s and the 1970s, the downward trend for manufactures being more
moderate in the latter decade.
2. Market Size and Growth and "Bias" in Trade among Developing Countries
The discussion begins with the vexing issue of whether there is a
"bias" towards or away from developing country markets and then considers the

49
effect of the income growth of capital-surplus oil-exporting countries on the
direction of developing countries' exports.
a. "Bias" in the Direction of Trade
We referred in Chapter II above to several arguments that South-
South trade is biased downward. It is difficult to test the hypothesis
without definition of the norm relative to which a bias can be measured. A
thorough test, therefore, requires comprehensive specification of a model that
can determine expected trade values. Although this is a part of our intended
future research, here we investigate the issue of bias by defining it more
narrowly as "gravity bias," namely, a situation in which actual trade with
developing countries is less than expected in relation to their relative size
as markets.
Specifically, we define a bias ratio for exporter i as:
(1) Bi = SXLi/SYL
where SXLi is the share of i's exports going to developing countries, and SYL
is the developing countries' share of world income. The values covered for
our entire sample contradict the view that there is a bias. Indeed, if
anything, the level of trade among developing countries is higher than their
size as markets alone would predict. The share of developing countries' total
exports going to other developing countries ranged from 22 percent to nearly
25 percent, whereas their share in world income was in the order of 16-18
percent. _22 Clearly, shares of exports by developing countries to one
another far exceed their shares in world income.
12/ Calculated from EPD data, excluding the CPEs.

50
Admittedly, this measure ignores several countervailing effects, in
particular the proximity of developing countries to each other, but by
isolating what is a major determinant of direction of trade, the need for a
clearer statement of what might be meant by bias is emphasized.
It is interesting to observe that for manufactured exports alone,
the shares of exports to one another are much higher than shares in world
income (see Table 4) but that this upward bias has declined over time, which
also appears to be true for most countries individually, as is shown in the
charts for the Bi measure, in Appendix Figure A.1.
Table 4: SHARES OF EXPORTS OF MANUFACTURES TO DEVELOPING COUNTRIES INTOTAL EXPORTS AND SHARES OF WORLD INCOME
(percent)
Shareof LDC Exports LDC Share ofGoing to LDCs World Income BIAS
1963 40 15.6 2.56
1968 30 14.7 2.04
1971 27 14.6 1.85
1973 25 14.8 1.68
1975 28 16.7 1.68
1977 25 17.3 1.44
Sources: Trade data in GATT System at EPD International Trade and CapitalFlows Division; income data from EPD Data Files.

51
b. Capital-Surplus Countries as Export Markets
Although a decline in the share of developing country markets in the
period 1963-73 was mirrored by the rise of that of developed country markets,
the developing country share remained relatively stable after 1973, and a
diversion took place from developed to capital-surplus, oil-exporting
countries. Although it may be correct to exclude the flows to CSCs in an
analysis seeking to confirm whether there has been a marked rise in trade
among developing countries in the 197 0s, the role of these markets has been
far too important to be ignored. Hence we conclude the discussion on the
effects of market size with a more detailed look at developing country exports
to the capital-surplus countries. One may adduce two reasons for special
consideration of these countries in this study. First, these countries are
probably more like developing than industrial countries, despite high per
caput income levels. They are barely industrialized, have inadequate
infrastructures, include large amounts of non-commercial economic activity,
and are undergoing rapid structural change. This last feature tends to make
their import requirements more like those of other rapidly growing developing
countries. Secondly, the huge redistribution of purchasing power occurring in
favor of these countries after 1973 had a large effect on the directions of
world trade, and this is, of course, reflected in the direction of developing
countries' exports.
After 1973 these markets boomed (as is evident from Table 5), more
than doubling in importance for developing countries' non-fuel exports and
taking 5 percent of the total. In manufactured and capital goods they became
even more important, accounting for 7 and 9 percent of developing country
exports, respectively. They did so, however, not at the expense of the share
of developing country destinations, but rather at the expense of the share of

52
developed country markets. Thus, developed country markets fell from a share
of 68 percent of developing countries' total non-fuel exports in 1973 to 63
percent in 1977.
Table 5: SHARE OF MAJOR MARKETS IN DEVELOPI1NG COUNTRY EXPORTSBY MAIN COMNODITY GROUP, a/ SELECTED YEARS
LDC csc DC'1973 1975 1977 1973 1975 1977 1973 1975 1977
Food and Beverages 19 21 23 2 6 4 72 63 64Manufactures 25 28 25 2 6 7 66 58 61Capital Coods
(Narrow) 43 49 43 4 7 9 44 36 38
Total Non-Fuel 22 24 24 2 5 5 68 62 63
_, Non-food agriculture and metals & minerals had less than 1% shares throughout theperiods, and in fact these declined somewhat. In total exports to CSCs, these-twocategories had a weight of only 4.7% in 1977.
The experience of developing countries in exports to CSCs varied
considerably by region and by specific countries, as is shown in Table 6. For
the group as a whole (represented by our sample of 33) the role and the
increase in the role of CSC markets were almost exactly the same as for
developed country exporters (as is shown in Table 6); the same obtains for
NICs as a group. By geographic region the differences are substantial, with
Asia standing above all others as the region for which CSC markets became most
important (as might be expected from its location and level of development),
especially for manufactures and capital goods. In Asia, Korea, India and

Table 6: SHARE OF CAPITAL-SURPLUS MARKETS FOR DEVELOPING COUNTRY EXPORTSBY REGION AND SELECTED DEVELOPING COUNTRIES, 1973 AND 1977
(In percent, except for column 1)
$ Million Total Non-Fuel Food & Beverages Manufactures Capital GoodsExporters Exports 1973 1977 1973 1977 1973 1977 1973 1977
LDCs - 33 4,768 2 5 2 4 2 7 4 9
Southern Europe 1,416 2 6 2 5 3 7 5 10
Africa 26 1 1 1 1 2 1 4 3
Asia 3,009 2 7 4 7 3 9 3 12
Latin America 346 1 2 1 2 0 1 0 1
NICs 3,282 2 5 2 3 2 7 3 9
DCs 38,256 2 6 1 4 2 6 3 9
Greece 398 3 13 2 8 5 18 19 28
Tunisia 25 8 5 1; 11 7 2 49 13
Korea 1,122 1 11 0 2 2 13 1 24
India 726 4 12 4 10 5 15 16 22
Pakistan 291 9 26 20 41 7 22 27 13
54
Pakistan were the most dependent on CSC markets, which took well over 10
percent of their exports by 1977, with food (for Pakistan) and manufactures
(for India) being particularly dependent on these markets. Korea's dependence
on CSC markets is high only for capital goods (24 percent) and far less so for
all non-fuel exports. (11 percent). In terms of the total developing country
exports to CSCs, however, Korea is by far the major single exporter, providing
$1,122 million in 1977, which is 23.5 percent of the total and 37.3 percent of
the Asian total.
The regional and country-specific experience of developing country
exports to capital-surplus countries exemplifies the complexity of
explanations for the level of trade among developing countries. The exporters
that have done well in CSC markets are those that (1) were more outward-
oriented in their policies, (2) were not involved in regional trading
arrangements, or (3) were closer in distance and had better transport links to
CSC markets. At first glance, however, no one of these factors stands out as
the most important.
B. Salient Features of Trade among Developing Countries
In the second and last major sub-section of the chapter, which deals
with some of the features of trade among developing countries, the overall
commodity composition and principal flows are first considered; then attention
is paid specifically to the place of the NICs among the developing countries;
thereupon, the factor-intensity of trade among developing countries is
examined; and, finally, there is an analysis of trade among developing
countries in capital goods.

55
1. Commodity Composition and Principal Flows
We address four areas: (a) the broad characteristics of the pattern
of developing countries' exports in different directions, including the
differences among the regions' export structures and the contrast with
industrialized countries' exports to developing countries; (b) the commodity
detail in trade among developing countries; (c) the major participants in
trade among developing countries; and (d) major bilateral commodity flows.
a. The Broad Characteristics of Developing Countries' Exportsin Different Directions
The exports of developing to other developing countries in 1977 were
strikingly similar to those to developed countries (Table 7), with only
slightly less food (32.3 versus 35.1 percent) and slightly more manufactures
(54.4 versus 49.9 percent), but there is a decidedly higher weight of capital
goods (20.4 versus 9.4 percent). 21L Exports to CSCs and oil-exporting
developing countries contain relatively more manufactures and fewer primary
commodities, as might be expected. In exports to NICs food and non-food
agricultural goods have a considerably greater weight than in other exports,
whereas manufactures are much less important.
Over time manufactures have become increasingly important in trade
among developing countries (see Table 8), although they were already
relatively important in 1963, accounting for 41.0 percent of the total._L4/
Offsetting declines occurred in the relative importance of all three
3L Within manufactures, of course, the types of goods do differconsiderably, as our later discussion of capital-intensity of the goods(Section B.3) exported in different directions shows.
4/ This might be an overstatement attributable to re-exports, whose relativeshare has probably declined.

56
Table 7: COMMODITY COMPOSITION OF DEVELOPING COUNTRY EXPORTS TO DIFFERENT MARKETS
(1977 - percent)
World DC CSC LDC OILX NICS
Food & Beverages 34.3 35.1 25.7 32.3 31.1 38.4
Non-Food Agriculture 8.3 7.8 2.7 9.9 4.3 18.9
Metals & Minerals 5.2 6.3 2.0 2.7 1.5 3.9
Manufactures 51.3 49.9 69.4 54.4 62.4 38.8
Total Non-fuels 100.0 100.0 100.0 100.0 100.0 100.0
Capital Goods - Broad 12.6 9.4 16.5 20.4 23.8 11.7
Capital Goods - Narrow 8.8 5.3 15,2 15.8 17.9 8.0
Fuels 17.8 19.1 1.7 22.3 4.7 11.9

57
categories of primary goods. Note also the substantial increase in the share
of capital goods in exports to developing countries, which more than doubled
between 1963 and 1977. The changes in the structure of exports from
developing to industrialized countries were much the same on the whole as
those in trade among developing countries, the weight of manufactures
increasing and that of primary goods falling. It appears, however, that the
rise in the importance of manufactures from 17.1 percent of exports to
industrialized countries in 1963 to 49.9 percent in 1977 was far more dramatic
than that in exports to developing countries, in which the share rose only
from 41.0 to 54.4 percent.
By region, one observes some variation in the composition of the
export basket (see Table 9). Southern Europe is above the developing country
weighted average for the share of manufactures in exports both to developing
and to developed countries, as are the NICs, whereas Africa and Latin America
are well below the average. For all groups the share of manufactures in
exports to the developing countries exceeds that in exports to developed
countries. In 1963 Asia had shares of manufactures in exports to both
destinations that were slightly above the developing country average, but by
1977 it was unique in having well above average shares in exports to the
developed countries but slightly below average shares in exports to the
developing countries, which reflects the shift of Asian exporters from
developing to developed country markets. Such a drastic shift was unique to
Asia, but in all cases the tendency towards increased relative importance for
manufactures of developed country markets is evident.
As a footnote to the discussion of developing countries' exports, an
interesting comparison is of exports of the developing countries to other
developing countries with those to developing from industrialized countries.

58
Table 8: COMMODITY COMPOSITION OF EXPORTS FROM DEVELOPING COUNTRIES INSELECTED YEARS
Percent Exports from LDCs
To LDCs To DCs To LDCs To DCs To LDCs To DCs
- - - 1963 - - - - - - 1971.- - - - - - 1977 - - -
Food & Beverages 36.8 52.8 29.8 39.9 32.3 35.1
Non-Food Agriculture 16.5 19.8 14.5 11.3 9.9 7.8
Metals & Minerals 4.0 9.8 3.8 10.0 2.7 6.3
Manufactures 41.0 17.1 50.7 37.9 54.4 49.9
Total Non-Fuels . 100.0 100.0 100.0 100.0 100.0 100.0
Capital Goods - Broad 9.5 3.2 15.6 5.2 20.4 9.4
Capital Goods - Narrow 7.7 2.6 12.6 3.3 15.8 5.3
Fuels 45.0 28.0 50.4 30.6 22.3 19.1

59
Table 9;. WEIGHT OF MANUFACTURES IN EXPORTS OF
THE TOTAL SAMPLE AND OF THE REGIONS
(Percent)
1963 1977To LDCs To DCs To LDCs To DCs-
-Exportinr Region
LDC 33 41.0 17.1 54.4 49.9
Southern Europe 66.2 29.2 76.7 62.9
Africa 20.7 3.9 25.2 - - 10.9
Asia 42.1 25.6 53.5 62.3
Latin America 19.5 6.0 40.7 18.3
NICs 51.7 22.2 63.4 62.7
Note: Appendix Table A.1 provides a fuller picture of the commoditycomposition by region.

60
From Table 10 it appears that the former were quite different from the latter,
manufactured exports accounting for 82 percent of industrialized countries
exports to developing countries but only 54.4 percent of trade among
developing countries. The difference between the two baskets had decreased
since 1963, however.
Table 10: COMMODITY COMPOSITION OF EXPORTS FROM DEVELOPING ANDINDUSTRIALIZED COUNTRIES TO DEVELOPING COUNTRIES, 1977
LDC to LDC DC to LDC
Food & Beverages 32.3 10.1
Non-Food Agriculture 9.9 3.0
Metals & Minerals 2.7 2.3
Manufactures 54.4 82.0
Total Non-Fuel 100.0 100.0
Capital Goods (Broad Definition) 20.4 42.1
Capital Goods (Narrow Definition) 15.8 38.4
Fuels 22.3 1.8
The contrast is even more marked in capital goods, the weight of
which is more than twice as high in exports from industrialized to developing
countries as in trade among developing countries. Non-fuel primary goods have
a weight of 45.6 percent in trade among developing countries, but of only 18.0
percent in exports from developed to developing countries, which provides yet
another perspective on the importance of primary goods in trade among
developing countries.

61
In sum, the major characteristics of trade among developing
countries are that the weight of manufactures is slightly higher than in their
exports to industrialized countries but is far below the weight in exports
from industrialized to developing countries. Although the share of
manufactures in trade among developing countries has increased since 1963, it
has not experienced as dramatic a rise as in exports from developing to
industrialized countries.
b. Commodity Detail in Trade among Developing Countries
The total exports of our sample of 33 developing countries to
developing country markets were about $23 billion in 1977. Seventeen groups
of commodities (at the 3-digit SITC level) with a value of $400 million or
more each accounted for nearly half of the total (as is seen in Table 11).
Indeed, the top 10 groups alone accounted for 34 percent of the total. Among
the important products in .trade among developing countries, there are more
primary than manufactured goods, largely because the latter are more
heterogeneous.
A different perspective is provided if we consider products for
which trade with developing countries accounts for 50 percent of total
exports. These are quite different on the import and export sides. Among
imports, developing country sources are important for 22 commodity groups (see
Appendix Table A.3), all of them primary goods, a few of them processed:
preserved fruit and vegetables, shaped wood, processed oils, tanning
materials, and plywoods. Exports for which developing country destinations
account for 50 percent of the total, however, include a predominance of
manufactured and partly processed items, including cereal preparations, soaps
and cleansers, plastic materials, agricultural machinery, textile machinery,
and road vehicles such as bicycles and motorcycles.

62
Table 11: PRINCIPAL PRODUCTS IN TRADE AMONG DEVELOPING COUNTRIES
(in million US$, 1977 prices)
1977Rank SITC Product Groups Exports
1. 071 Coffee 1011
2. 231 Crude Rubber 988
3. 732 Road Motor Vehicles 849
4. 042 Rice 793
5. 263 Cotton 749
6. 242 Rough Wood 740
7. 735 Ships and Boats 708
8. 719 Mach. & Appl., Non-electric 571
9. 729 Other Elec. Mach. & Apparatus 560
10. 061 Sugar & Honey 516 (7,483)
11. 682 Copper !'476
12. 841 Clothing (except fur) 454
13. 044 Maize, Unmilled 446
14. 422 Vegetable oil, Non-soft 446
15. 081 Animal Feed 439
16. 651 Yarn and Thread 426
17. 421 Soft Vegetable Oil 399 (10,568)

63
This view on trade among developing countries reflects two important
roles of developing countries for one another: they are both major sources of
many primary goods and provide key markets for a variety of semi-manufactured
and manufactured goods. Among manufactures one finds that developing country
markets are of major importance for several types of capital goods: metal
containers for storage, agricultural machinery, textile and leather machinery,
machinery for special uses, and electrical power machinery.
c. Major Participants in Trade among Developing Countries
The 10 leading developing economy exporters to developing economy
markets (Taiwan excluded) accounted for more than 80 percent of the total non-
fuel exports to other countries of the 33 developing countries in our sample
and over 90 percent of their exports of manufactures and capital goods to
other developing countries (Table 12). For manufactures the degree of
concentration in the top 10 countries was the same in 1963 and 1977, whereas
it increased for total non-fuel exports from 80.1 percent to 86.1 percent as a
result of a concentration in the exports of primary goods, particularly food
and beverages. Note, however, that among the top 10 exporters the degree of
concentration in the top 3 fell from 40 percent to 38 percent for the total,
especially so for manufactures (from 52 to 43 percent) and capital goods (from
72 to 54 percent).
Much the same countries are included in the list in both years,
except for Pakistan and Portugal, which were not in the list for 1977, and
Spain and Korea, which were not in the list for 1963. The group of principal
exporters in trade among developing countries includes all of the NICs (except
Portugal in 1977), although Mexico, Greece, and Israel are included in the
list only for manufactured or capital goods. Apart from the NICs only three

Table 12: SHARES OF TEN TOP EXPORTERS IN TRADE AMONG DEVELOPING COUNTRIES
FOR MAJOR COMMODITY GROUPS, 1963 and 1977
Total Non-Fuel Exports Hanufacturesa - 1977 Cooda - Narrov Definition 1963 and Be19e7a7e961771963 1977 196317 9317
1. Singapore 17.27 Brazil 14.54 Singapore 22.60 Spain 19.28 Yugoslavia 32.52 Spain 24.41 Argentina 20.43 Braztl 23.462. India 11.32 Spain 12.26 India 16.82 Singapore 12.74 Singapore 27.19 Brazil 17.54 Thailand 14.90 Argentina 20.953 Malaysia 10.10 Singapore 11.26 Hong Kong 12.43 Brazil 11.35 Spain 11.58 Singapore 12.46 Singapore 12.60 Thailand 13.644. Argentina 10.03 Argentina 11.17 Yugoslavia 8.94 Korea 10.32 Malaysta 4.78 Argentina 9.83 India 9.84 Halaysia 7.195. Thailand 7.21 Malaysia 7.82 Portugal 7.91 Hong Kong 8.77 Portugal 3.85 Yugoslavia 9.37 Brazil 7.40 Singapore 6.116. iong Kong 5.92 Korea 6.65 Spain 5.84 Argontin 7.22 ArgentnA 3.09 Korea 7.04 Malaysia 5.51 Spain 4.31
7. Brazil 4.70 Thailand 5.91 terael 3.87 India 6.71 India 2.83 IndY1 3106 pl Lunta2 4.3 S Lndia 3.978. Portugal 4.60 India 5.26 Pakistan 3.74 Yugoslavia 4.60 Mexico 2.83 rala ci 3.12 Portugal 2.63 Sre Lanka 2.689. Yugoslavia 4.54 Hong Kong 5.13 Mexico 3.56 Israel 3.79 Brazil 2.77 Greece 2.32 pakistan 2.55 Korea 2.0210. Pakistan 4.43 Yugoslavia 3.55 Malaysia 3.49 Malaysia 2.69 Hono Kong 2.65 lara1 I 2.02 Spain 2.23 Pakistan 1.76
TOTALS 80.12 83.55 93.07 93.47 9412 92.16
Note: Shares here mean the exports of a commodity group from a given country to LDCs as a percent of exportsfrom all 33 LDCs in our sample to LDCs. Thus, for example, in )963 Singapore accounted for 17.27 percentof non-fuel exports to LDCs by the 33 LDC sample.

65
countries are included, two of them - Thailand and Malaysia - largely as
exporters of primary goods, and India as an exporter of manufactured goods. A
fourth, Pakistan, was an important exporter of both primary and manufactured
goods in 1963, but was outside the top 10 in 1977. Indeed, as to be expected,
the non-NIC countries in general lost ground relative to the NICs, their share
in exports to developing countries declining consistently with the exception
of India's share in capital goods exports, which increased slightly from 2.8
percent to 4.1 percent
The most dramatic changes in relative importance of specific
countries are the sharp increase in the shares for Brazil, Spain, and Korea
and the decline for India, Yugoslavia, and - to a smaller extent -
Singapore. In 1963 Brazil was only seventh and Spain not among the first 10,
but in 1963 they were first and second with 28 percent of inter-developing
country exports between them. Korea's rise was less marked, moving from less
than 1 percent to 6.7 percent and sixth rank, but this rise occurred despite
the fact that for Korea's total non-fuel exports, the importance of developing
country markets declined substantially over that period.
d. Major Bilateral Flows in Trade among Developing Countries
Finally, we look at the major bilateral commodity flows. Those ih
excess of $50 million, at the 3-digit SITC level in 1977, are shown in Table
13. A total of 31 such flows are identified, totalling $3,069 million, or 14
percent of total trade among developing countries. The largest 10 such flows
alone were $1,847 milion or 8.5 percent of trade among developing countries.
Most notable is the predominance of primary goods. Of these bilateral flows,
only 8 were in manufactures and they totalled only $578 million. As
manufactured goods in trade among developing countries represented 54.4

66
percent of total non-fuel exports (see Table 7), this list of major flows
clearly under-represents manufactures. The latter are somewhat more
diversified in terms of the commodities involved.
There is no great surprise in the countries that are in this list:
they are on the whole the same as in Table 12. As to the commodities for
which large bilateral flows exist, they are generally the same as those shown
in Table 11. There are several products, however, with bilateral flows of
over $50 million that have total flows .among developing countries of less than
$400 million and do not appear in Table 11. These are marked with the letter
a in Table 13.
2. Trade among Developing Countries and the NICs
In the discussion below of the place of NICs in the overall picture
we consider first the major role they play in the total exports of the sample
of developing countries; then the role of all developing countries as markets
for NICs and of NICs as markets for all developing countries is examined;
finally, NICs are distinguish'ed from other developing countries, in order to
identify the relative success of the two sub-groups as suppliers to NICs and
their relative importance as markets for them. In this last section the
attempt is to identify the effect of rapid NIC growth on one another and on
other developing countries.
a. The Weight of NICs in Developing Countries' Trade
It is evident from the preceding section that the major exporters in
trade among developing countries are the NICs. NICs were the source of
5/ The'NICs are listed in Appendix A. Israel and Argentina are added to theOECD list of 10, but Taiwan is excluded, as data for Taiwan are not inthe GATT system.

67
.Table 13: MAJOR BILATERAL COMMODITY FLOWS, 1977
Rank 3 digit SITC Commodity Exporter - Importer US$ Million
1. Crude Rubber Malaysia - Singapore 542
2. Rough wood Indon'esia - Korea 328
3. Rice Thailand - Indonesia 180
4. Coffee Brazil - Spain 154
5. Coffee Ivory Coast - Spain 118
6. Fresh Fruits Argentina - Bazil 114
7. Rough Wood Malaysia - Korea 108
8. Batteries, Valves, Transistors Singapore - Malaysia 105
9. Fixed Vegetable Oils, soft Brazil - India 103
10. Shaped wood a/ Malaysia - Singapore 95
11. Ships and Boats Spain - Yugoslavia 83
12. Road Motor Vehicles Singapore - Malaysia 78
12. Crude Rubber Malaysia - Spain 78
14. Rice Thailand - Spain 77
15. Ships and Boats Korea - Liberia 76
15 Fresh Meat a! Yugoslavia - Greece 76
17 Ships and Boats Yugoslavia - India 72
18 Sugar & Honey Thailand - Taiwan -/ 68
19 Crude Rubber Malaysia - Korea 67
19 Fixed Vegetable Oil, soft Brazil - Iran 67
21 Coffee Colombia - Spain 62
22 Machinery for special ind.-/-/ Singapore - Malaysia 58
23 Iron Ore.Concentrates a/ Brazil - Argentina 57
24 Batteries, Valves, Transistors Korea - Hong Kong 53
24 Coffee Brazil - Argentina 53
24 Rough Wood Ivory Coast - Spain 53
27 Feedstuff Singapore - Malaysia 55
27 Feedstuff Brazil - Yugoslavia 55
29 Iron & Steel Bars - Spain Singapore 53
29 Rice Thailand - Singapore 53
31 Cocoa a/ Ghana - Spain 52
3,069
a/ Products that do not appear in Table 11.
b/ Taiwan is identifiable as a destination of exports in the GATT System withthe label "Asia N.E.S.", though it is not possible to obtain data on Taiwanas an exporter from the system on a consistent basis.
c/ SITC 719.

68
66 percent of all non-fuel exports in our sample of 33 countries 'ut took only
38 percent of all imports. Focusing on the exports, we find that this share
is far higher for manufactures (78 percent) and capital goods narrowly defined
(83 percent), but - surprisingly - still very high for food (58 percent) and
all primary goods (54 percent). These findings underline the fact that
several newly industrializing economies have a strong natural resource base,
particularly Brazil and Argentina. Although these two stand out, they do not
completely account for the NICs' exports of food. In 1977 Brazil and
Argentina accounted for 44 percent of all 33 developing countries' food
exports, non-NICs for 42 percent, and other NICs for 14 percent.
b. Role of all Developing Countries as Markets for NICs and Vice Versa
As mentioned above, the share of developing country markets in NICs'
exports followed exactly the same pattern as for all developing countries,
being about 22 to 23 percent from 1963 to 1973 and then rising somewhat to 25
percent in 1977. 'For manufactures the share fell continuously from 41 to 25
percent and for capital goods from 64 percent to 42 percent, but it rose for
food and beverages, from 16 to 24 percent. The NICs of course largely
determine the pattern for all developing countries, given their high share in
the total exports of our sample, but the pattern for non-NICs was similar to
that for NICs, especially for manufactures. 16/
The role of NICs as exporters in trade among developing countries in
1977 was much greater than their role as importers. Over time, however, NICs
became more important among developing country markets for all commodity
16/ As Table 2 clearly shows, for functional as opposed to regionalgroupings of countries, only the small, low-income countriesexhibited a different pattern, with their exports to developingcountries increasing strongly over the period.

69
categories, their shares of developing country markets for developing country
exports increasing from 46.1 to 51.0 percent in primary goods and from 17.4 to
27.6 in manufactures (see Table 14). In relation to developing country
exports to all world destinations, however, NICs became more important as
markets only in primary goods, their share increasing from 7.4 to 11.7 percent
of developing countries' exports of these goods. The rise was particularly
dramatic for non-food agriculture. Their importance among world markets for
manufactured and capital goods did not rise, however.
c. Relative Role of NICs and other Developing Countriesas Suppliers of, and Markets for, NICs
If we distinguish NICs from other developing countries, interesting
patterns emerge. Table 15 shows the origin of NIC imports. It is clear that
for non-food raw materials, developing countries outside the group were a
source for more than one-third of these imports, although their share fell
somewhat between 1963 and 1977. NICs were the fastest-growing group among the
developing countries and experienced the greatest expansion of imports. Table
15 suggests that their growth had spill-over benefits by creating export
opportunities for all developing countries (including other NICs), at least
equal to those created for developed country exporters, as is indicated by the
slight rise from 19 percent to 20 percent in the shares of all developing
countries in NIC markets. In manufactures and foods these shares rose
substantially, from 5 to 10 percent and 37 to 45 percent, respectively, which
means that developing countries shared more than proportionately in the new
NIC markets for these categories. The spill-over was disproportionately high
for NICs' trade with one another. However, the share of non-NICs as sources
for NIC imports generally declined except in manufactures, where it was in any
event very small. Thus, the non-NIC developing countries were unable to

Table 14: THE ROLE OF NIC MARKETS IN TRADE AMONGDEVELOPING COUNTRIES: 1963 and 1977
1963 1977Exports to NICs as NICs as Percent Exports to NICs as NICs as Percent
% of Total Exports a/ of LDC Markets b/ % of Total Exports of LDC Markets
Food & Beverages 5.9 36.6 10.2 44.3
Non-Food Agriculture 11.8 68.0 20.7 71.4
Metals & Minerals 4.4 40.4 7.0 55.8
Total Primary Non-Fuel 7.4 46.1 11.7 51.0
Manufactures 7.0 17.4 6.9 27.6
Total Non-Fuel 7.4 33.8 9.2 38.2
Capital Goods - Narrow 9.1 14.5 9.0 21.0
a/ (LDC exports to NICs 1 LDC exports to World) x 100.
b/ (LDC exports to NICs * LDC exports to all LDCs) x 100.

71
expand their exports to NICs as quickly as the growth of NIC demand, which
suggests the important role of supply constraints considerations. In general,
it was the NICs that were able to obtain the greatest advantages in selling to
the most rapidly growing markets among developing countries, namely,
themselves.
The export side of NICs' trade ,reflects the large and growing role
of developed countries as markets for manufactured goods. Table 16 shows that
the share in the NICs' exports of exports to developing countries declined for
manufactures but increased sharply in primary goods. If NIC markets are
distinguished from those of other developing countries, however, the picture
is altered a little. Almost the entire rise from 15 to 24 percent in the
share of exports of primary products from NICs to developing countries was due
to a rise in the share of the other NICs' markets. This is consistent with
the view that NICs are fast-growing markets requiring large imports of raw
materials.
d. Conclusion
The trade between NICs and other developing countries is in fact
quite large in raw materials, somewhat less so in food, and very small in
manufactures. The growth of NIC markets has provided spill-over effects for
other developing countries, but they have not maintained their shares in this
market for primary goods, losing ground not only to developed countries in raw
materials but also to NICs themselves in food and manufactures. Developing
countries outside the NIC group have on the whole not been able to respond as
effectively to the rapid growth of export opportunities in NIC markets as have
developed countries and the NICs themselves.

72
Table 15: PERCENTAGE DISTRIBUTION OF NIC IMPORTS BY ORIGIN, 1963 AND 1977
1963 1977Al1 Non- All Non-
DCs LDCs NICs NICs DCs LDCs NICs NICs
Food & Beverages 50 37 13 24 44 45 22 23
Non-Food Agriculture 40 58 9 49 44 47 7 40
Metals & Minerals 54 43 6 37 60 39 6 33
Non-Fuel Primary 47 44 11 33 46 44 15 29
Manufactures 88 5 3 2 84 10 7 3
Total Non-Fuel 74 19 6 13 72 20 9 11
Capital Goods - Narrow 95 3 2 1 93 5 4 1

73
Table 16: PERCENTAGE DISTRIBUTION OF NIC EXPORTS BY DESTINATION, 1963 AND 1977
1963 1977All Non- Non-
DCs LDCs NIC NIC DCs LDC NIC NIC
Food & Beverages 79 16 6 10 62 24 11 13
Non-Food Agriculture 67 16 1b 6 58 29 16 13
Metals & Minerals 81 9 4 5 68 15 8 7
Total Non-Fuel Primary 77 15 6 11 62 24 12 12
Manufactures 51 41 5 36 62 25 6 19
Total Non-Fuel 69 23 6 17 62 25 8 17
Capital Goods - Narrow 20 64 8 56 38 42 8 36

74
3. Capital-Labor Ratios in Exports of Developing Countries
It has..been argued by Krueger (1978) among others that trade among
developing countries is less beneficial than exports to industrialized
countries from the point of view of employment, because these exports have
higher capital-labor ratios. We test this prediction here by computing the
direct capital-labor ratios for baskets of goods exported from NICs to
industrialized countries and other developing countries respectively.
The modified three-couintry Heckscher-Ohlin model discussed in
Chapter II predicts that the middle country exports to industrialized
countries will be more labor intensive than exports to developing countries.
Furthermore, the continuum of country factor endowments should lead one to
expect that goods that go in greatest proportion to developing country markets
will also have the highest capital-labor ratios. NIC exports at the 3 digit
SITC level for 1977 are therefore subdivided into four categories:
- exports of which developing country markets take 50 percent of
exports ("principal developing country goods").
- exports of which developing country markets take between 30 and 50
percent ("secondary developing country goods").
- exports of which industrialized country markets take between 60
and 80 percent ("secondary developed country goods").
- exports of which industrialized countries take 80 percent or more
("principal developed country goods").
Capital-labor ratios (inclusive of human capital) are taken from
Balassa (1979), assigned, with his concordance, to the 3 digit goods in each
of these categories, and a weighted average capital-labor ratio is computed.
The results are shown in Table 17, and they clearly confirm the expectation
that trade among developing countries is more capital- and skill-intensive
than exports of developing countries to industrialized countries.

75
Whereas the overall average capital-labor ratio of NIC exports is
about $30,664, it is substantially higher for exports to developing countries
($45,342) and lower for exports to developed countries ($25,407).
Furthermore, for goods 50 percent or more of which go to developing country
markets, the ratio is even higher, at $53,589, whereas for goods that go
largely to developed country markets, the ratio is far lower, at $15,075. The
test is of course not as precise as one might make it, but it does conform
strongly to the general conclusions of Krueger (1978) and Balassa (1979) and
contradicts the finding of Amsden (1980) that trade among developing countries
is not more capital intensive than their exports to industrialized countries.
Table 17: DIRECT FACTOR CONTENT OF NIC MANUFACTURED EXPORTS, 1977
Capital-Labor Ratio ($000/Worker)
Principal Developing Country Exports 53,589
Secondary Developing Country Exports 44,170
All Developing Country Exports 45,347
Secondary Developed Country Exports 39,780
Principal Developed Country Exports 15,075
All Developed Country Exports 25,407
All Exports 30,664
4. Capital Goods Trade among Developing Countries
It is argued that advanced developing countries (NICs) can benefit
other developing countries by developing appropriate capital goods for export
76
to them. Furthermore, from the point of view of NICs themselves, the export
of such capital goods may serve to stimulate innovation of products and
production processes. In addition, since exports of capital goods to
industrialized countries may not be possible at first, the more accessible
developing country markets can offer opportunities to advance up the ladder of
technological sophistication. Finally, the modified Heckscher-Ohlin theory
implies that developing countries with larger endowments of capital, skills,
and technical experience should be exporting goods that are more intensive in
these factors, such as capital goods, to other developing countries, while
continuing to export more labor-intensive goods to developed countries.
As we see in Table 18, the weight of capital goods in exports to
developing countries is far higher than for developed country destinations.
Similarly, the change over time is as predicted, as the weight of capital
goods in exports to developing countries has increased substantially -U- from
7.7 to 15.8 percent; and for NICs this has also risen (but not as sharply),
from 12.1 to 19.8 percent. The same rise is seen for all countries exporting
these goods, except for Yugoslavia (see Table 19). At the same time, the
share of capital goods exports to developing country markets has declined
markedly, as is shown in Part B of the table. Three countries in particular
We define capital goods as shown in Appendix B, in two categories: broadand narrow. The former is based on the U.N. Broad Economic Categories(BEC), capital goods plus transport equipment. The latter excludes twolarge items in trade among developing countries that appear to us to bebetter considered as consumer durables or parts thereof: 732.1,Passenger Cars; and 729, Batteries, Lamps, Auto Electrical Equipment,Valves, Tubes, Transistors. The narrow definition also excludes MotorVehicle Parts, Motorcycles, Bicycles, and Invalid Carriages. The use ofthe narrow definition does make some difference to conclusions. Forexample, in Spain's exports of "capital goods broad" the share of exportsto developing countries declines sharply (50% to 38%), although for thenarrow definition it remains constant, as is seen in Part A of Table18. In general, however, the conclusions are unaffected.

Table 18: SELECTED INDICATORS OF TRENDS IN TRADE IN CAPITAL GOODS a/AMONG DEVELOPING COUNTRIES
A B C DCountry Share in LDC Exports to LDCs as % Weight of Capital Goods Weight of Capital Goods
Trade of K Goods of Total In Exports to LDC In Exports to DCs1963 1971 1977 1963 1971 1977 1963 1971 1977 (1977)
Spain 11.6 32.0 24.4 49 50 50 25.6 35.5 31.5 17.2
Brazil 2.8 10.4 17.5 85 75 60 4.5 12.1 19.1 8.3
Singapore 27.2 11.4 12.5 99 82 47 12.0 13.5 28.5 15.9
Argentina 3.1 7.1 9.8 78 78 89 2.4 9.7 13.9 6.7
Yugoslavia 32.5 11.5 9.4 54 24 25 54.9 42.4 41.8 27.5
Korea 6.7 7.0 7.0 46 28 25 6.5 3.9 16.8 10.1
India 2.9 6.1 4.1 76 62 49 1.9 10.8 17.6 4.8
Malaysia 4.8 2.5 3.1 99 94 32 3.6 3.9 6.3 6.6
Greece 0.6 0.6 2.3 37 35 51 5.0 4.6 18.2 6.1
Portugal 3.9 4.9 15.0 76 56 23 6.4 12.9 15.2 11.4
LDC 33 100.0 100.0 100.0 63 48 43 7.7 12.6 15.8 5.3
NICs - - - 64 46 42 12.1 16.9 19.8 6.9
DCs - - - 34 31 33 32.4 35.9 38.4 23.9
a/ The narrow definition is used here - see footnote 17.
b/ By country share is meant: Percent of LDC-33 exports of capital goods to LDCs, accounted for by thespecific country.

78
have risen to prominence in capital goods exports to developing countries:
Spain, Brazil, and Korea. Nevertheless, while sharply increasing the weight
of capital goods in their exports to developing countries, Brazil and Korea
have expanded exports to developing country markets far less rapidly than to
industrialized countries (and to CSCs for Korea). Thus, the share of their
total capital goods exports going to developing countries has fallen from 85
to 60 percent and from 46 to 25 percent, respectively. Spain's exports to
developing countries have throughout the period accounted for only half of its
exports of capital goods.
The data confirm the theoretical expectation that trade in 1977
among developing countries contains relatively more capital goods than trade
with industrialized countries and that the importance of capital goods in
trade among developing countries incr- (ses over time. -L It is not the case,
however, that developing countries are turning towards developing country
markets for capital goods, indeed quite the reverse is true - they are turning
away from these markets. This does not necessarily mean, however, that
developing countries' markets were not valuable for other developing
countries. The successful exports to industerialized countries may have
initially been exported to the developing countries, even if only in small
quantities. (The likelihood of this being significant is reduced, however, by
the recognition that the shares of capital goods exported to developing
countries began to fall shortly after 1963 for most countries. At that time,
however, no developing country other than Spain and Yugoslavia had achieved
any very substantial level of technological sophistication.) An alternative
8/ A related conclusion is that the capital-labor intensity of exports toLDCs is higher than that for exports to DCs, as observed directly in theprevious section.

79
Table 19: CHANGES IN DIRECTION OF EXPORTS OF CAPITAL GOODS FROM
MAJOR EXPORTERS, 1963-77
(Percent Share by Destination)
LDC Share CSC Share DC Share1963 1971 1977 1963 1971 1977 1963 1971 1977
Spain 49 50 50 2 2 6 49 46 42
Brazil 85 73 60 0 ) 2 12 27 38
Singapore 99 82 47 0 2 4 0 15 46
Argentina 78 78 89 0 0 9 22 22 11
Yugoslavia 54 24 25 1 3 Li 12 35 15
Korea 46 28 25 0 1 24 54 71 51
.ndia 76 62 49 28 11 22 5 18 21
Malaysia 99 94 32 0 0 0 1 4 68
Portugal 76 53 23 1 0 3 23 46 67
Greece 37 35 51 3 13 28 61 47 13

80
view is that capital goods exported to different destinations may differ
markedly, with those to developed countries being consistently simpler
products with little design and technology requirements. In this case, even
if smaller in aggregate, exports to developing countries might provide greater
external benefits via learning by doing and so forth. More analysis in this
area is clearly needed, focusing upon individual commodities within the
capital goods category.

81
IV. SUTMMARY OF MAIN FINDINGS
There is little point in repeating the many observations made on
trade among developing countries. The aim of this chapter is rather to bring
out the main points and most challenging hypotheses. Reference is made
largely to the facts discussed in Chapter III while bringing out some of the
implications for the theoretical issues dealt with in Chapter II.
A. The Main Trends in the Destination of Developing Countries' Trade
Contrary to a widespread impression, there has been no large shift
toward trade among developing countries since 1973, at least when the focus is
upon non-fuel trade and developing countries are defined exclusive of the
capital-surplus, oil-exporting countries. The share of non-fuel exports to
developing countries, excluding capital-surplus oil exporters, was quite
stable at between 22 and 23 percent of their total exports between 1963 and
1973, whereupon it rose to 24 percent in 1975 and 1977. This overall
stability gives a misleading impression, however, since at a more
disaggregated level there have been opposing and mutually cancelling trends
for manufactures and primary commodities.
Manufactured exports were the developing countries' most dynamic
export sector in the 1960s and 1970s. The direction of these exports also
L-c~hanged- dramatically, the share of developing countries as markets falling
from 40 percent in 1963 to 27 percent in 1971 and 25 percent in 1977. In the
1960s and early 1970s it was the industrialized countries that were the main
recipients of an increased share of developing countries' manufactured
exports. In the later 1970s it was the capital-surplus, oil-exporting
countries, whose share rose from 2 percent in 1973 to 7 percent in 1977.
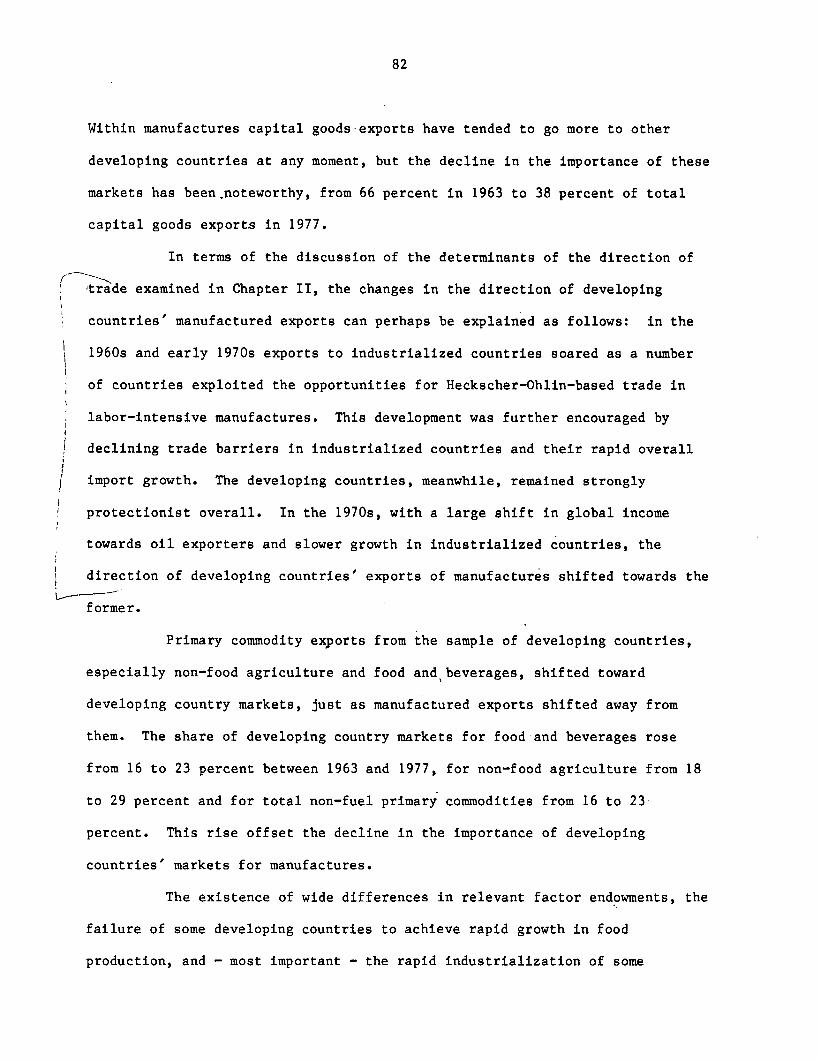
82
Within manufactures capital goods-exports have tended to go more to other
developing countries at any moment, but the decline in the importance of these
markets has been.noteworthy, from 66 percent in 1963 to 38 percent of total
capital goods export.s in 1977.
In terms of the discussion of the determinants of the direction of
trade examined in Chapter II, the changes in the direction of developing
countries' manufactured exports can perhaps be explained as follows: in the
1960s and early 1970s exports to industrialized countries soared as a number
of countries exploited the opportunities for Heckscher-Ohlin-based trade in
labor-intensive manufactures. This development was further encouraged by
declining trade barriers in industrialized countries and their rapid overall
import growth. The developing countries, meanwhile, remained strongly
protectionist overall. In the 1970s, with a large shift in global income
towards oil exporters and slower growth in industrialized countries, the
direction of developing countries' exports of manufactures shifted towards the
former.
Primary commodity exports from the sample of developing countries,
especially non-food agriculture and food and,beverages, shifted toward
developing country markets, just as manufactured exports shifted away from
them. The share of developing country markets for food and beverages rose
from 16 to 23 percent between 1963 and 1977, for non-food agriculture from 18
to 29 percent and for total non-fuel primary commodities from 16 to 23
percent. This rise offset the decline in the importance of developing
countries' markets for manufactures.
The existence of wide differences in relevant factor endowments, the
failure of some developing countries to achieve rapid growth in food
production, and - most important - the rapid industrialization of some

83
resource-poor developing countries seem to explain these trends in primary
commodities. Most of the increase in the shares of the markets of developing
countries in their exports of primary commodities is, in fact, accounted for
by the increased demand for primary commodities of NICs. (Moreover, much of
the increased exports to NICs came from other NICs.) In all, an important
effect of NICs on other developing countries seems to be through their demand
for primary goods. In 1977 NICs purchased more than half of the non-fuel
primary commodities exported by the 33 developing countries to one another but
only 28 percent of the manufactures.
It should be stressed, finally, that even though exports of non-fuel
primary commodities grew more rapidly to developing countries' markets than to
the rest of the world, the importance of manufactures rose in all markets.
The effect of the overall dynamism of exports of manufactures swamped that of
the shift in direction toward industrialized countries. Thus, the share of
exports of manufactures in developing countries' trade with one another rose
from 43 percent in 1963 to 54 percent in 1977, and this share in their exports
to the NICs rose from 22 to 40 percent. The shift in the destination of
manufactures is shown in the fact that their importance in developing
countries' exports to other destinations rose much more than in trade with one
another. Thus, manufactures rose from 17 to 50 percent of non-fuel exports of
developing countries to industrialized countries and from 30 to 70 percent of
their exports to capital-surplus, oil-exporting countries between 1963 and
1977.

84
B. Principal Hypotheses on Trade among Developing Countries
Four particular findings or hypotheses of the paper should be
,stressed: (1) the apparent absence of any "bias" of developing country
exports toward industrialized country markets; (2) the effect of commercial
X policy on the direction of developing countries' exports; (3) the relatively
high capital intensity of developing countries' manufactured exports to one
another; and (4) the lack of evidence for an overwhelming role among
developing countries for exports in capital goods.
1. The Myth of a Bias against Trade among Developing Countries
Developing countries exports to one another of all non-fuel
commodities of manufactures and of non-fuel primary commodities exceed what.
might be expected, on the basis of their weight in the world economy. It
should be noted that forces of comparative advantage on Heckscher-Ohlin lines
suggest that efficient trade should be predominantly with industrialized
countries, especially in manufactures. Moreover, industrialized countries
have not only been liberalizing their trade policies, at least in
manufactures, whereas developing countries have not, but they have
substantially more open trade regimes in general. Thus, one might expect
trade of developing countries with industrialized countries actually to exceed
that indicated by the latter's weight in the world economy. Since this is not
the case (but rather the reverse), it is difficult to argue that there is an
effective bias against trade among developing countries.
If there is in fact such a bias, the argument must be that, because
of proximity, the opportunities for -intra-industry trade, and the importance
of similar demand patterns, developing countries ought to trade much more with
one another than their weight in the world economy suggests. In response, it

85
should be noted that transport costs are generally of decreasing importance in
determining the optimal location of production and patterns of trade. Thus,
the reasons for believing that there should be more trade among developing
countries than there is - potential for intra-industry trade and similarity in
demand - are also reasons for believing that the source of bias against such
trade is likely to be the commercial policies of developing countries
themselves. If, therefore, trade among developing countries should be higher
than it already is, their own trade policies are likely to be the main
"biasing" factor.
2. Developing Countries' Commercial Policies and the Direction of Their Exports
From the point of view of exporting developing countries, the
commercial policies of all the other developing countries that are potential
markets are a pervasive factor. One would expect the effects to be shared by
all developing country exporters, therefore, except to the extent that
regional or other preferences are important. Despite this feature of the
environment, the shares of different destinations differ markedly for
countries and regions whose economic potential one might expect to be
similar. An important reason is probably the commercial policies of the
countries as exporters. __\
The evidence is quite striking: while the East Asian NICs, for
example, have experienced low and declining shares of exports to developing
countries for their manufactured exports, the reverse has been true for Latin
America. The explanation is probably the effect of outward-looking policies
leading to specialization on Heckscher-Ohlin lines, on the one hand, and
inward-looking policies, especially in the context of regional preferences,
leading to spillover exports to countries with similar demand patterns, on the
other hand.

86
3. The Capital Intensity of Trade
One of the implications of trade theory is that trade of developing
countries with one another will be more capital-intensive than with
industrialized countries. The evidence presented above strongly supports this
assumption, manufactured exports to industrialized countries being almost half
as capital intensive as those to developing countries. Furthermore, the
higher the share of industrialized country markets for a given product, the
less capital-intensive it is. The capital intensity of those products, half
of whose exports go to developing country markets, is three and a half times
greater than that of those products, 80 percent of whose exports are destined
for the markets of industrialized countries and only 20 percent for those of
developing countries.
4. Capital Goods Exports and Developing Country Markets
It is frequently argued that trade among developing countries in
capital goods can be beneficial for both exporters and importers. It is
certainly the case that a higher proportion of capital goods is exported to
developing countries than of manufactures overall, 43 against 25 percent in
1977. Furthermore, capital goods amounted to 16 percent of trade among
developing countries and only 5 percent of their trade with industrialized
countries in the same year. Nevertheless, the importance of developing
country markets has been declining for the exporters of capital goods, from 63
percent in 1963 to 43 percent in 1977, and this shift in direction occurred
very early in their development for many industrializing countries. It can,
therefore, be questioned whether exports to developing countries are so
essential a first step for exporters of capital goods as is sometimes
suggested.

87
APPENDICES
Page
Appendix A Country Coverage and Aggregations. ........................ 88
Appendix B Definition of Capital Goods Categories. .................... 90
Tables
A.1 Commodity Composition of Inter-LDC Exports by Region ............. 93
A.2a Percentage Distribution of Exports of LDC-33 by Destinationand Comnodity Group...o. .... .. ......... . o ................. . ..... 94
A.2b Percentage Distribution of Exports of Oil Exporting Countriesby Destination and Commodity Groups............................... 95
A.2c Percentage Distribution of Exports of Oil Importing Countriesby Destination and Commodity Groups................... ......... 96
A.2d Percentage Distribution of Exports of Developed Countriesby Destination and Commodity Groupsr............................ 97
A.2e Percentage Distribution of Exports of Southern Europe byDestination and Commodity Groups...... 98
A.2f Percentage Distribution of Exports of Asia by Destinationand Commodity Groups ... 99
A.2g Percentage Distribution of Exports of Latin AmericanCountries by Destination and Commodity Groups . 100
A.2h Percentage Distribution of Exports of Africa by Destinationand Commodity Groups**p..... .... . ......... . ............... .. 101
A.2i Percentage Distribution of Exports of NICs by Destinationand Commodity Groups ... .......... .......... 102
A.3 Products for which Share of Trade with Developing CountriesExceeded 50 Percent in 1977. .................. ................... 103
A.4 Annual Growth Rates of Exports by Destination andCommodity Group ........ 104
A.5 Exports to Trade Associates and Neighbors as Percent ofTotal Exports to LDCs .. ............................ .............. . 105
Figures
A.1 "Gravity Bias" of Inter-LDC Trade by Country, 1963-1977 .......... 106

88
APPENDIX A
COUNTRY COVERAGE AND AGGREGATIONS
Reporter Countries and Groupings
Southern Europe: Greece, Israel, Portugal, Spain, Turkey, Yugoslavia.
Africa: Cameroon, People's Republic of the Congo, Ivory Coast, Ghana,(Central African Republic), Senegal, (Nigeria), Tunisia, Libya.
Asia: Iran, Hong Kong, Singapore, Korea, Malaysia, Philippines, Thailand,India, Pakistan, (Sri Lanka).
Latin America: Brazil, Argentina, Colombia, Honduras, Mexico, Venezuela,Paraguay,(Panama ).
Aggregations
LDCs33: All above countries; the four in parentheses have several missingdata points (Panama: 1967; Sri Lanka: 1973; Central African Republic:1972; Nigeria: 1968 and 1969).
OILX: Oil Exporters-(People's Republic of the Congo, Nigeria, Tunisia, Libya,Iran, Malaysia, Mexico, Venezuela.
OILM: All other countries in above sample.
DC, Industrialized Countries.
NIC: Greece, Israel, Portugal, Spain, Yugoslavia, Hong King, Singapore,South Korea, Brazil, Argentina, Mexico.

89
Partner Country GroupinRs
(OILX) Oil Exporters: Algeria, Angola, Bahrain, Bolivia, Brunei, Congo, Ecuador,Egypt, Gabon, Indonesia, Malaysia, Mexico, Nigeria, Oman, Peru, Syrian ArabRepublic, Trinidad & Tobago, Tunisia, Venezuela.
(OMLOY) Oil Importers-Low Income: Dahomey, Burundi, Central African Republic, Chad,Ethiopia, Guinea, Kenya, Madagascar, Mali, Malawi, Niger, Rwanda, Sierra Leone,Somalia, Tanzania, Uganda, Upper Volta, Comoro Islands, the Gambia, Afghanistan,Bhutan, Bangladesh, Burma, Kampuchea, India, Laos, Nepal, Pakistan, Sri Lanka,Viet Nam, Zaire.
(OMMIDY) Oil Importers-Middle Income: Oil Importing NICs:Greece, Israel, Portugal, Spain, Yugoslavia, Hong Kong, Singapore, SouthKorea, Brazil, Argentina plus: Other Mid-Y Oil Importers: Martinique,Virgin Islands, Bermuda, Mauritania, Mozambique, Sudan, Togo, Cameroon,Ghana, Ivory Coast, Liberia, Zimbabwe, Senegal, Zambia, Seychelles,Equatorial Guinea, Sao Tome & Principe, Cape Verde Islands, Guinea Bissau,Grenada, Guyana, Panama (Canal Zone), Uruguay, Suriname, Barbados, Bahamas,Cyprus, Malta, Turkey, French Polynesia, New Caledonia, Guam, American Samoa,Pacific Islands, Gilbert & Ellice Islands, Macau, New Hebrides, St. Vincent,Dominica, St. Lucia, St. Kitts-Nevis-Anguilla, Belize, Antigua, Cuba,Guadeloupe, Netherlands Antilles, French Guiana, Mauritius, South AfricaAfars & Issas, Jordan, Morocco, Lebanon, Yemen, Yemen Democratic Republic,Reunion, Tonga, British Solomon Islands, Philippines, Papua New Guinea,Thailand, Western Samoa, Fiji, Haiti, Chile, Colombia, Costa Rica, DominicanRepublic, El Salvador, Guatemala, Honduras, Jamaica, Nicaragua, Paraguay.
(LDC) Developing Countries: All countries in above three categories.
(SEURO) Southern Europe: Greece, Israel, Portugal, Spain, Turkey, Yugoslavia.
(NIC) Newly-Industrialized Countries: Greece, Israel, Portugal, Spain, Yugoslavia,Hong Kong, Singapore, South Korea, Brazil, Argentina, Mexico.
(CSC) Capital-Surplus Countries: Iran, Iraq, Kuwait, Libya, Qatar, Saudi Arabia,United Arab Emirates.
(CPE) Centrally Planned Economies: Albania, Bulgaria, China, Cuba, Czechoslovakia,German Democratic Republic, Hungary, Democratic Republic of Korea,Mongolia, Poland, Romania, USSR.
(DC) Industrialized Countries: All other countries.
90
APPENDIX B
Definition of Capital Gocds Categories
The capital goods categories used in this study have a broader and anarrower definition. The first,K-GOOD BROAD,is defined so as to includeitems labelled as "Capital Goods" in category 41 of U.N. Classification byBroad Economic Categories, Statistical Papers Series M, No. 53, Rev. 1, 1976,as well as certain parts and accessories for capital goods (category 42 inthe above document), and transport equipment (categories 51, 52, 53). Sincethe GATT system uses SITC Rev. 1, whereas the BEC uses Rev. 2, an exact corres-pondence is impossible; we have attempted to approximate the above 5 cate-gories under SITC Rev. 1, on the basis of the concordance given in the Rev. 2documents.
As the broader category includes passenger cars (SITC 7321) andother apparent consumer items such as batteries, electric lamps, valves,tubes,and transistors (in SITC 729), and as these items are large in devel-oping countries' exports, we have also defined a narrower category of capitalgoods, K-GOOD NARROW, excluding these items and a few other less important non-capital items as described below. The one item in 729 that is doubtless capi-tal (729.7: Electron and Proton Accelerators) will not figure largely intrade among developing countries, hence we have not attempted to include it.

91
K-GOODS BROAD
692 (Metal Containers)
695 (Tools Used in Hand or Machine)[Less 695.24 (Interchangeable tools)1
698.2 (Safes, Strong-rooms, Strong-boxes of base metal)
7 (Machinery & Transport Equipment)[Less 717.3 (Sewing Machines)
719.4 (Domestic Appliances, Non-Electric)724 (Telecommunications Equipment)]but including 724.91 (Electrical Line Telephone and Telegraph
Equipment)724.92 (Microphones, Loudspeakers and Amplifiers)
[Less 725 (Domestic Appliances, Electric]
812.1 (Central Heating Apparatus)
821.02 (Medical Furniture)
861.3 (Binoculars, Microscopes)[Less 861.31 (Binoculars & Refracting Telescopes)]
861.7 (Medical Instruments)
861.8 (Meters and Counters, Non-Electric)
861.9 (Measuring & Scientific Instruments)
864.2 (Clocks and Parts)
894.5 (Fair-Ground Amusements)
895.11 (Filing Cabinets)

92
K-GOODS NARROW
K-Goods Broad
Less 729 (Batteries, Lamps, Auto Elec. Equip.,Valves, Tubes, Transistors)
7321 (Passenger Motor Cars)
7328 (Parts for Motor Vehicles)
7329 (Motorcycles)
7331 (Bicycles)
7334 (Invalid Carriages)

Appendix Table A.1: COMMODITY COMPOSITION OF INTER-LDC EXPORTS. BY REGION(Percent)
1963 1977Sample S.Europe Africa Asia Lat.America Sample S. Europe Africa Asia Lat.America
Food & Beverages 36.8 20.5 56.4 32.6 60.9 32.3 13.8 38.8 27.8 53.6
Non Food Africulture 16.5 8.4 10.6 19.1 16.6 9.9 6.5 27.7 14.4 3.9
Metals & Minerals 4.0 3.8 10.2 4.1 2.7 2.7 2.4 6.5 3.1 1.8
Non-Fuel Primary 57.4 32.7 77.3 55.9 80.2 44.9 22.7 73.0 45.3 59.3
Manfuactures 41.0 66.2 20.7 42.1 19.5 54.4 76.7 25.2 53.5 40.7
All excl. Fuels 100.0 100.0 100.0 100.0 100.0 100.0 100.0 100.0 100.0 100.0 w
(Value in $USMillion) (14,882) (2,868) (1,380) (6,353) (4,281 ) (91,563)'/ (24,031) (4,260) (42,716) (20,556)
K Goods Broad 9.5 23.9 4.0 7.5 4.5 20.4 31.0 5.0 16.1 20.1
K Goods Narrow 7.7 22.6 3.0 4.9 4.0 15.8 27.6 4.2 10.5 16.0
Fuels 45.0 3.9 11.3 24.4 15.1 22.3 3.0 627.2 14.6 4.5
a/ In 1977 the sample excludes seven countries for which data were unavailable (Ghana, Iran, Libya, Mexico, Paraguay,Senegal, Venezuela) and the values shown as well as the percentages in the table are for the remaining 26 countries.These countries accounted for 6 percent of non-fuel exports to the world in 1975, hence the approximate value for
all 33 countries in 1977 is estimated to be US$97,057 (=US$91563 x 1.06).

Appendix Table A.2a: PERCENTAGE DISTRIBUTION OF EXPORTS OF LDC-33 BYDESTINATION AND COMMODITY GROUP
LDCof which (Value in
DC CSC TOTAL OILX NICs CPEs WORLD Million US$)
1963
Non-Fuel Prim. 57.8 0.6 12.4 3.2 5.7 5.3 76.7Food & Bev. 37.0 0.6 7.9 2.6 2.9 2.1 48.0Non-food Agr. 13.9 0.1 3.6 0.3 2.5 2.7 20.4Metals & Min. 6.9 NIL 0.9 0.3 0.4 0.5 8.3
Manufactures 12.0 0.3 9.0 3.7 1.6 1.2 22.7
TOTAL NON-FUEL 70.1 0.9 21.7 7.1 7.3 6.6 100.0 14881.7
1971
Non-Fuel Prim. 41.5 0.9 10.7 1.6 6.0 4.6 57.8Food & Bev. 27.0 0.7 6.6 1.3 3.1 2.5 27.0Non-food Agr. 7.7 0.1 3.2 0.2 2.4 1.5 12.6Metals & Min. 6.8 0.1 0.8 0.1 0.5 0.6 8.2
Manufactures 25.7 0.9 11.2 3.4 3.5 3.2 41.2
TOTAL NON-FUEL 67.7 1.8 22.2 5.1 9.6 7.8 100.0 28119.9
1977
Non-Fuel Prim. 30.8 1.6 10.8 2.6 5.5 4.5 47.8Food & Bev. 21.9 1.4 7.7 2.1 3.4 3.1 34.3Non-food Agr. 4.9 0.1 2.4 0.3 1.7 0.8 8.3Metals & Min. 3.9 0.1 0.6 0.1 0.4 0.6 5.2
Manufactures 31.2 3.7 13.0 4.3 3.6 2.8 51.3
TOTAL NON-FUEL 62.6 5.2 23.9 6.9 9.1 7.3 100.0 91563.3
Note: Components may not add up to total because of discrepancies in aggregating the different levelsof SITC in the GATT systems and rounding. Nil means that the share is less than 0.5 percent.In 1977 the sample excludes seven countries for which data was not available. Their exports in1975 comprised about 6 percent of the total sample's exports.

Appendix Table A.2b: PERCENTAGE DISTRIBUTION OF EXPORTS OF OIL-EXPORTING COUNTRIES BYDESTINATION AND COMMODITY GROUPS
LDCof which (Value in
DC CSC TOTAL OILX NICs CPEs WORLD Million US$)
1963
Non-fuel Prim. 69.5 .5 13.0 .7 9.2 4.8 88.0Food & Bev. 27.7 .4 4.2 .4 2.4 .6 33.0Non-food Agr. 21.7 .1 7.2 .2 6.1 3.8 32.7Metals & Min. 20.2 NIL 1.7 .2 .7 .4 22.2
Manufactures 6.8 .1 4.3 .8 1.8 NIL 11.2
TOTAL NON-FUEL 76.8 .6 17.5 1.6 11.1 4.8 100.0 2791.9
1971
Non-fuel Prim. 55.8 1.2 14.1 .6 11.3 6.2 77.5Food & Agr. 24.9 1.1 4.3 .2 3.3 2.2 32.6Non-food Agr. 14.4 .1 7.7 .2 7.1 3.3 25.5Metals & Min. 16.6 NIL 2.2 .2 .9 .7 19.5
Manufactures 13.5 .5 6.3 1.5 2.2 1.2 21.6
TOTAL NON-FUEL 69.8 1.7 20.8 2.1 13.7 7.4 100.0 4015.8
1977
Non-fuel Prim. 50.5 1.2 22.0 .8 16.5 5.9 79.7Food & Bev. 19.9 .8 8.2 .4 4.4 1.1 30.0Non-food Agr. 20.0 .4 12.2 .4 11.1 4.1 36.7Metals & Min. 10.7 .1 1.7 .1 1.0 .7 13.1
Manufactures 13.1 .3 5.5 .6 3.8 .1 19.1
TOTAL NON-FUEL 64.5 -1.6 27.8 1.4 20.4 6.0 100.0 6654.7
Note: Components may not add up to total because of discrepancies in aggregating the different levelsof SITC in the GATT systems and rounding. Nil means that the share is less than 0.5 percent.

Appendix Table A.2c: PERCENTAGE DISTRIBUTION OF EXPORTS OF OIL-IMPORTING COUNTRIES BYDESTINATION AND COMMODITY GROUPS
LDCof which (Value in
DC CSC TOTAL OILX NICs CPEs WORLD Million US$)
1963
Non-fuel Prim. 55.1 .7 12.3 3.8 4.9 5.5 74.1Food & Bev. 39.2 .6 8.8 3.1 3.0 2.5 51.5Non-food Agr. 12.1 .1 2.8 .3 1.6 2.4 17.5Metals & Min. 3.8 NIL .7 .3 .3 .6 5.1
Manufactures 13.2 .3 10.0 4.4 1.5 1.5 25.3
TOTAL NON-FUEL 68.5 1.0 22.7 8.4 6.5 7.0 100.0 12089.8
1971
Non-fuel Prim. 39.1 .8 10.1 1.8 5.1 4.3 54.5Food & Agr. 27.4 .7 7.0 1.4 3.1 2.6 37.7Non-food Agr. 6.6 .1 2.5 .3 1.6 1.2 10.4Metals & Min. 5.1 NIL, .6 .1 .4 .5 6.3
Manufactures 27.7 1.0 12.0 3.8 3.7 3.5 44.5
TOTAL NON-FUEL 67.3 1.8 22.4 5.6 8.9 7.8 100.0 24104.1
1977
Non-fuel Prim. 29.2 1.6 9.9 2.7 4.6 4.3 45.3Food & Bev. 22.1 1.4 7.7 2.3 3.4 3.3 34.6Non-food Agr. 3.7 .1 1.6 .3 1.0 .5 6.0Metals & Min. 3.4 .1 .6 .1 .3 .5 4.6
Manufactures 32.7 3.9 13.6 4.6 3.6 3.1 53.8
TOTAL NON-FUEL 62.4 5.5 23.6 7.3 8.2 7.4 100.0 84908.5
Note: Components may not add up to total because of discrepancies in aggregating the different levelsof SITC in the GATT systems and rounding. Nil means that the share is less than 0.5 percent.

Appendix Table A.2d: PERCENTAGE DISTRIBUTION OF EXPORTS OF DEVELOPED COUNTRIES BYDESTINATION AND COMMODITY GROUPS
LDCof which (Values in
DC CSC TOTAL OILX NICS CPES WORLD Million US$)
1963
Non-fuel Prim. 21.2 .2 5.2 1.2 1.8 1.3 28.2Food & Bev. 10.5 .2 3.7 .9 1.1 .9 15.43Non-food Agr. 6.0 NIL 1.0 .1 .5 .3 7.4Metals & Min. 4.8 NIL .6 .1 .2 .1 5.5
Manufactures 44.3 1.1 20.1 4.6 6.3 2.1 70.1
TOTAL NON-FUEL 66.3 1.3 25.8 5.9 8.1 3.5 100.0 94207.1
1971
Non-fuel Prim. 16.6 .2 3.8 .7 1.6 .7 21.5Food & Agr. 8.9 .2 2.6 .6 .9 .4 12.2Non-food Agr. 3.5 NIL .7 .1 .4 .2 4.5Metals & Min. 4.2 NIL .6 .1 .3 .1 4.9
Manufactures 53.5 1.3 18.6 3.8 7.9 2.7 76.8
TOTAL NON-FUEL 71.0 1.7 23.1 4.6 9.9 3.5 100.0 232518.0
1977
Non-fuel Prim. 14.4 .5 3.7 1.0 1.6 .9 19.8Food & Bev. 8.2 .4 2.4 .8 .9 .6 11.7Non-food Agr. 3.1 NIL .7 .1 .4 .2 4.1Metals & Min. 3.1 .1 .6 .1 .3 .1 4.0
Manufactures 49.8 4.9 19.6 5.8 7.9 3.7 78.6
TOTAL NON-FUEL 65.2 5.8 23.9 6.9 9.8 4.7 100.0 663041.0
Note: Components may not add up to total because of discrepancies in aggregating the different levels ofSITC in the GATT systems and rounding. Nil means that the share is less than 0.5 percent.

Appendix Table A.2e: PERCENTAGE DISTRIBUTION OF EXPORTS OF SOUTHERN EUROPE BYDESTINATION AND COMMODITY GROUPS
LDCof which (Value in
DC CSC TOTAL OILX NICs CPEs WORLD Million US$)
1963
Non-fuel Prim. 47.8 .1 6.3 1.5 2.8 7.0 61.7
Food & Bev. 35.9 .1 4.0 1.2 1.2 3.8 44.1
Non-food Agr. 7.9 NIL 1.6 .2 1.2 2.1 11.6
Metals & Min. 4.0 NIL .7 .2 .4 1.2 5.9
Manufactures 19.7 .4 12.7 3.7 2.8 4.7 37.9
TOTAL NON-FUEL 67.6 .6 19.2 5.3 5.6 11.7 100.0 2867.7
1971
Non-fuel Prim. 31.2 .4 5.6 1.0 2.6 4.6 41.9
Food & Agr. 21.7 .3 3.6 .8 1.4 2.6 28.4
Non-food Agr. 4.8 .1 1.5 .1 .9 .9 7.3
Metals & Min. 4.6 NIL .5 .1 .3 '1.0 6.2
Manufactures 34.2 1.5 14.3 4.0 4.5 7.1 57.6
TOTAL NON-FUEL 65.5 1.9 20.1 5.0 7.2 11.7 100.0 7947.1
1977
Non-fuel Prim. 21.8 1.4 4.8 1.4 1.8 3.9 32.1
Food & Bev. 15.7 1.1 2.9 1.0 1.0 2.3 22.1
Non-food Agr. 3.3 .1 1.4 .3 .7 .5 5.3
Metals & Min. 2.9 .2 .5 .1 .2 1.1 4.7
Manufactures 37.3 4.5 16.0 5.3 *4.2 8.1 67.5
TOTAL NON-FUEL 59.3 5.9 20.8 6.7 6.1 12.0 100.0 24030.5
Note: Components may not add up to total because of discrepancies in aggregating the different levels
of SITC in the GATT systems and rounding. Nil means that the share is less than 0.5 percent.

Appendix Table A.2f: PERCENTAGE DISTRIBUTION OF EXPORTS OF ASIA BYDESTINATION AND COMMODITY GROUPS
LDCof which (Value in
DC CSC TOTAL OILX NICs CPEs WORLD Million US$)
1963
Non-Fuel Prim. 43.7 1.3 17.4 5.6 7.3 6.3 69.3Food & Bev. 19.3 1.2 10.2 4.5 2.7 1.7 32.8Non-food Agr. 17.5 .1 6.0 .6 4.1 4.1 27.8Metals & Min. 6.9 NIL 1.3 .5 .4 .5 8.7
Manufactures 15.1 .5 13.0 6.4 1.8 .8 29.6
TOTAL NON-FUEL 59.1 1.8 31.1 12.4 9.3 7.1 100.0 6353.6
1971
Non-fuel Prim. 31.1 1.6 12.1 2.2 6.8 5.2 50.2Food & Agr. 13.3 1.4 6.6 1.7 2.5 2.1 23.4Non-food Agr. 10.7 .1 4.7 .4 3.9 2.6 18.3Metals & Min. 7.1 .1 .9 .1 .4 .5 8.5
Manufactures 32.3 1.2 12.2 4.3 3.6 2.6 48.6
TOTAL NON-FUEL 64.1 2.8 24.7 6.6 10.5 7.8 100.0 11349.7
1977
Non-fuel Prim. 23.2 1.9 10.7 2.6 5.4 3.4 39.5Food & Bev. 12.2 1.6 6.6 2.1 2.3 2.0 22.5Non-food Agr. 6.5 .2 3.4 .3 2.6 1.1 11.3Metals & Min. 4.5 .1 .7 .1 .4 .3 5.7
Manufactures 39.9 5.1 12.6 4.0 4.0 1.2 59.1
TOTAL NON-FUEL 64.1 7.0 23.6 6.7 9.5 4.7 100.0 42716.8
Note: Components may not add up to total because of discrepancies in aggregating the different levelsof SITC in the GATT systems and rounding. Nil means that the share is less than 0.5 percent.

Appendix Table A.2g: PERCENTAGE DISTRIBUTION OF EXPORTS OF LATIN AMERICAN COUNTRIESBY DESTINATION AND COMMODITY GROUPS
LDCof which (Value in
DC CSC TOTAL OILX NICs CPEs WORLD Million US$)
1963
Non-fuel Prim. 77.2 NIL 11.1 1.4 6.5 3.6 92.1Food & Bev. 56.3 NIL 8.3 1.2 4.7 1.6 66.4Non-food Agr. 12.2 NIL 2.4 .1 1.5 1.7 16.3Metals & Min. 8.7 0 .4 NIL .2 .3 9.4
Manufactures 4.9 NIL 2.8 .7 .7 .1 7.7
TOTAL NON-FUEL 82.2 NIL 13.9 2.1 7.1 3.6 100.0 4280.7
1971
Non-fuel Prim. 61.2 .1 14.9 1.6 9.0 3.1 79.4Food & Agr. 47.8 .1 10.8 1.3 6.4 2.4 61.2 C
Non-food Agr. 4.7 NIL 3.1 .2 1.9 .6 8.4Metals & Min. 8.6 0 1.1 .1 .7 .1 9.8
Manufactures 10.8 NIL 8.0 2.2 2.9 .3 19.2
TOTAL NON-FUEL 72.8 .2 23.2 3.8 12.1 3.4 100.0 7030.0
1977
Non-fuel Prim. 48.5 1.5 18.1 4.1 9.9 7.4 75.5Food & Bev. 41.7 1.4 16.4 3.9 8.8 6.6 66.1Non-food Agr. 2.6 .1 1.2 .2 .7 .4 4.2Metals & Min. 4.2 0 .5 NIL .4 .4 5.2
Manufactures 10.9 .2 12.2 4.6 2.5 .7 23.9.
TOTAL NON-FUEL 59.4 1.7 30.3 8.7 12.4 8.0 100.0 20555.7
Note: Components may not add up to total because of discrepancies in aggregating the different levelsof SITC in the GATT systems and rounding. Nil means that the share is less than 0.5 percent.

Appendix Table A.2h: PERCENTAGE DISTRIBUTION OF EXPORTS OF AFRICA BYDESTINATION AND COMMODITY GROUPS
LDCof which (Values in
DC CSC TOTAL OILX NICs CPEs WORLD Million US$)
1963
Non-fuel Prim. 83.9 .3 6.2 1.6 2.3 2.9 94.0
Food & Bev. 61.3 .3 4.5 1.4 1.7 2.5 69.2
Non-food Agr. 15.6 NIL .9 .1 .4 .2 16.6
Metals & Min. 7.1 0 .8 .2 .3 .2 8.2
Manufactures 3.4 NIL 1.7 .4 .6 NIL 5.1
TOTAL NON-FUEL 88.0 .3 8.0 2.0 2.9 3.0 100.0 1379.7
1971
Non-fuel Prim. 75.6 1.0 7.4 .8 4.4 6.6 90.9
Food & Agr. 55.9 1.0 3.6 .5 2.0 5.3 66.1
Non-food Agr. 12.5 NIL 2.5 .2 1.8 .6 15.7
Metals & Min. 7.2 NIL 1.3 .1 .6 .7 9.2
Manufactures 3.9 .2 3.7 .7 .3 .3 8.3
TOTAL NON-FUEL 80.2 1.3 11.3 1.5 4.7 6.9 100.0 1793.3
1977
Non-fuel Prim. 71.2 .5 9.8 1.0 5.9 3.8 85.4
Food & Bev. 59.4 .4 5.2 .7 2.6 2.6 67.7
Non-food Agr. 9.6 .1 3.7 .3 2.9 .8 14.3Metals & Min. 2.2 NIL .9 .1 .4 .4 3.5
Manufactures 8.9 .1 3.4 .3 .4 .2 13.1
TOTAL NON-FUEL 81.2 .6 13.4 1.4 6.3 4.0 100.0 4260.5
Note: Components may not add up to total because of discrepancies in aggregating the different levels
of SITC in the GATT systems and rounding. Nil means that the share is less than 0.5 percent.

Appendix Table A.2i: PERCENTAGE DISTRIBUTION OF EXPORTS OF NICS BYDESTINATION AND COMMODITY GROUPS
LDCof which (Value in
DC CSC TOTAL OILX NICs CPEs WORLD Million US$)
1963
Non-fuel Prim. 53.4 .1 10.6 3.4 4.4 5.1 69.5Food & Bev. 37.5 .1 7.5 3.0 2.7 2.0 47.2Non-food Agr. 10.8 .1 2.6 .3 1.5 2.5 16.0Metals & Min. 5.1 NIL .6 .2 .2 .6 6.3
Manufactures 15.3 .2 12.2 6.2 1.6 1.8 29.8
TOTAL NON-FUEL 69.0 .4 23.3 10.0 6.0 6.9 100.0 7782.9
1971
Non-fuel Prim. 33.9 .2 9.0 1.7 4.7 3.1 46.4Food & Agr. 25.0 .1 6.2 1.3 3.0 1.7 33.2Non-food Agr. 4.4 .1 2.0 .2 1.3 .9 7.4Metals & Min. 4.6 NIL .7 .1 .4 .5 5.8
Manufactures 34.4 .9 13.7 4.5 4.2 3.3 52.5
TOTAL NON-FUEL 68.9 1.1 22.9 6.3 9.0 6.4 100.0 17826.3
1977
Non-fuel Prim. 22.9 1.1 8.8 2.3 4.3 3.7 36.9Food & Bev. 17.6 .9 6.9 1.9 3.2 2.7 28.2Non-food Agr. 2.8 .1 1.4 .3 .8 .5 4.9Metals & Min. 2.5 .1 0.6 .1 .3 .5 3.7
Manufactures 38.8 4.1 15.5 5.4 4.1 3.3 62.6
TOTAL NON-FUEL 62.0 5.2 24.5 7.7 8.4 7.1 100.0 62938.5
Note: Components may not add up to total because of discrepancies in aggregating the different levelsof SITC in the GATT systems and rounding. Nil means that the share is less than 0.5 percent.

103
Appendix Table A.3: PRODUCTS FOR WHICH SHARE OF TRADE WITH DEVELOPINGCOUNTRIES EXCEEDED 50 PERCENT IN 1977
Imports of 33 Sample Countries
011 - Fat, FTesh, Chilled or Frozen042 Rice051 Fruit, Fresh, and Nuts (not.-incl. Oil Nuts), Fresh or Dried052 Dried Fruit (incl. Artificially Dehydrated)
053 Fruit, Preserved and Fruit Preparations054 Vegetables, Fresh, Frozen or Simply Preserved
061 Sugar and Honey071 Coffee072 Cocoa074 Tea and Mate075 Spices081 Feeding-Stuff for Animals (not incl. Unmilled Cereals)
121 Tobacco, Vnmauufactuted231 Crude Rubber (incl. Synthetic and. Reclaimed)242 Wood in the Rough or Roughly Squared)243 Wood, Shaped or Sicply Worked264 Jute265 Vegetable Fibres, Except Cotton and Jute431 Animal and Vegetable Oils and Fats, Processed532 Dyeing and Tanning _xtracts, and Synthetic Tanning Materials631 Veneers, Plywood Boards, 'Improved' or Reconstituted Wood
687 Tin
Exports of 3.3 ~amnle Countries
001 Live Animals022 Milk and Cream024 Cheese and Curd042 Rice044 Maize046 Meal and Flour of Wheat or of Meslin048 Cereal Preparations of Flour and Starch of Fruits & Vegitables091 Margarine and Shortening122 Tobacco Manufactures266 Synthetic and Regenerated (Artificial) Fibers431 Animal and Vegetable Oils and Fats, Processed
553 Perfumery and Cosmetics, Dentifrices (Except Soaps)554 Soaps, Cleansing and Polishing Preparations561 Manufactured Fertilizer571 Explosive and Pyrotechnic Products581 Plastic Materials, Regenerated Cellulose and Artificial Resins641 Paper and Paperboard664 Glass692 Metal Containers for Storage and Transport712 Agricultural Machinery717 Textile and Leather Machinery718 Machinery for Special Uses722 Electric Power Machinery733 Road Vehicles Other Than Motor Vehicles862 Photographic and Cinematographic Supplies892 Printed Matter

104
Append-ix Table A.4: ANNUAL GROWTH RATES OF EXPORTS BY DESTINATION AND CO14IODITY GROUP
(Undeflated Values)
DC CSC LDC OILX NICS CPES WORLD
1963-1971
Food & Bev. 4.1 12.0 5.9 -1.0 9.4 10.5 4.8
Non-food Ag. 0.5 9.8 6.7 4.3 7.9 0.7 1.9
Met. & Min. 8.0 26.4 7.6 -4.1 11.9 8=8 8.1
Non-fuel Prim. 3.9 12.3 6.2 -0.6 9.0 6.1 4.5
Manufactures 19.1 25.3 11.4 7.2 19.6 21.8 16.7
Total Non-Fuel 7.8 17.4 8.5 3.9 11.9 10.5 8.3
Capital Goods- 28.1 31.1 15.3 10.8 24.8 15.3 19.5Narrow
1971-1977
Food & Bev. 17.6 34.6 25.0 32.8 23.5 26.1 20.2
Non-food Ag. 13.0 37.8 15.6 26.3 14.8 9.4 13.5
Met. & Min. 11.2 39.5 16.3 21.4 16.6 21.9 12.9
Non-fuel Prim. 15.8 35.1 21.9 31.2 19.9 21.3 18.0
Manufactures 25.8 53.5 24.8 26.4 22.4 19.4 26.2
Total Non-Fuel 20.2 46.0 23.3 27.9 20.7 20.6 21.7
Capital Goods- 30.0 56.4 28.1 27.9 33.7 27.5 30.5Narrow
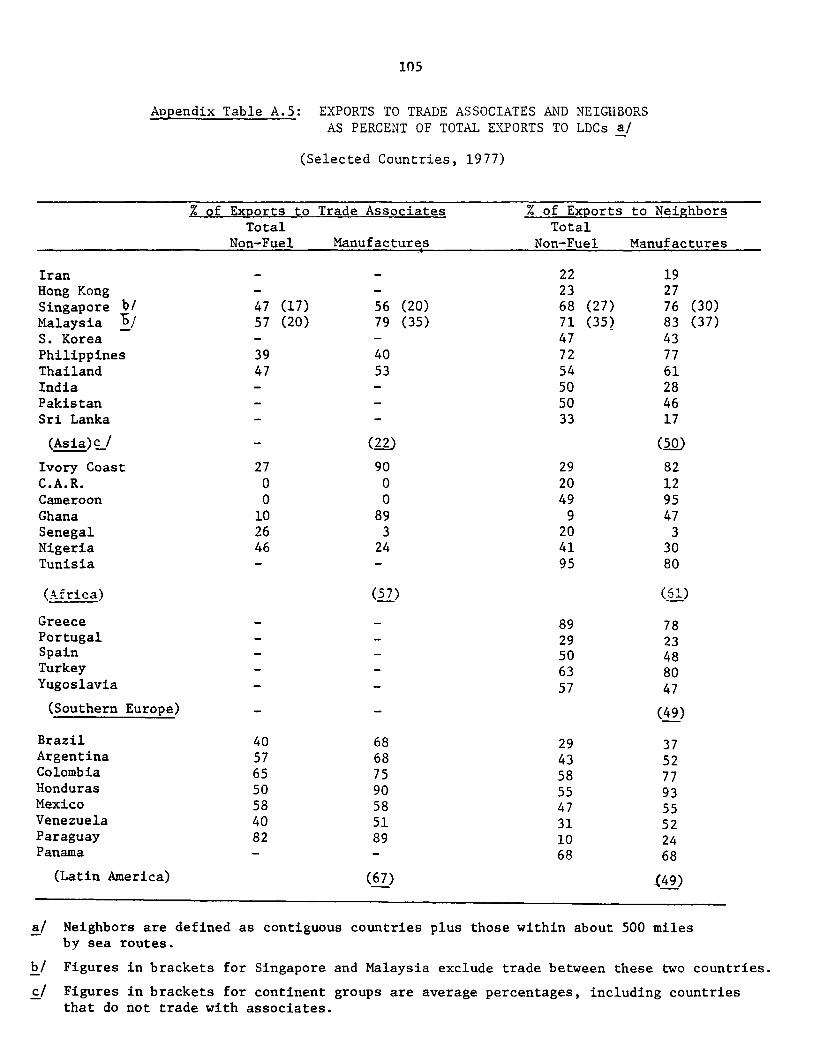
105
Appendix Table A.5: EXPORTS TO TRADE ASSOCIATES AND NEIGHBORSAS PERCENT OF TOTAL EXPORTS TO LDCs a/
(Selected Countries, 1977)
% of Exports to Trade Associates /. of Exports to NeighborsTotal Total
Non-Fuel Manufactures Non-Fuel Manufactures
Iran - - 22 19Hong Kong - - 23 27Singapore b/ 47 (17) 56 (20) 68 (27) 76 (30)Malaysia bX 57 (20) 79 (35) 71 (35) 83 (37)S. Korea - - 47 43Philippines 39 40 72 77Thailand 47 53 54 61India - - 50 28Pakistan - - 50 46Sri Lanka - - 33 17
(Asia)c / - (.2) (50)
Ivory Coast 27 90 29 82C.A.R. 0 0 20 12Cameroon 0 0 49 95Ghana 10 89 9 47Senegal 26 3 20 3Nigeria 46 24 41 30Tunisia - - 95 80
(Africa) (57) (52)
Greece - - 89 78Portugal - - 29 23Spain - - 50 48Turkey - - 63 80Yugoslavia - - 57 47
(Southern Europe) - - (49)
Brazil 40 68 29 37Argentina 57 68 43 52Colombia 65 75 58 77Honduras 50 90 55 93Mexico 58 58 47 55Venezuela 40 51 31 52Paraguay 82 89 10 24Panama - - 68 68
(Latin America) (67) (49)
a/ Neighbors are defined as contiguous countries plus those within about 500 milesby sea routes.
b/ Figures in brackets for Singapore and Malaysia exclude trade between these two countries.
c/ Figures in brackets for continent groups are average percentages, including countriesthat do not trade with associates.

qdelS q1zua uT OUJFT TDUOZT.Cqoql Aq polealpUT ST jt -d uo pouT,P oTTeU U4` 103 00 JO O
0TSP V M
-,-=-,,,,.,~~~~~~~~~~~~40 ' ..... ,...----..........*.*.....ooo................................ fo " S01*
*~~~~~~~~~ a ::
* a , :: :: .
9;n ;v: ;I,)oq * : :..
: :
* ~~~o : a :: :: ,nao , o
i~~~~~~~~~~~~~~~~~~~~~~f S?i
i I I i 2OS. 'F
i i ~~~~~~~~~~~esnZAGOsn
r,- -
r;~~~~~~~~~~~~~~~~~~~~~~~~~~~~~~~~~~~U 'E. +~~~~~~~~~~~~~~~~~~~~-
i; T- ; i ': :: ''I
' ; ; ::~~~~~ ;ooq~~~~~ ~ ~~~~~~~~~~~~~~~~~~~~~~ *- ;
-I a ~ ~ ~ ~ ~ ~ *1T-6 xiiKo aan a -w ao asi ma.'TVW3F Tud
.. a :: a v; ; ;
; :: o :: o i O O g ' 2 ; :^ :: :: i 1~0~~I Ia: 0 g ' 2
SZ* a OS'
* ~ ~ ~~~~~~~~~~~~~~~~~~~~~~~~~~~* a
*~~ ~ ~~~~~~~~~~~~~~~~~~~~~ ; ____________+_____________________--___________ * ______ ______________________
;~~~~~~~~~~~~~~~~~~~~~~~~~~~~.. . ;, i
. . a ::ea
*~~ ~ ~~~~~~~~~~~~ s a;
* ,,.lo a Ia OU
t; ~ ~~ ~ ~~~~~~~~~~~~~~~~~ :: o ;: 0 a : 0 a a
* ~ ~~~~ ~ ::'e eiO a
*~ ~ ~ ~ ~ ~ ~ ~~~t1s6 .AnO Ae a:n Ca-uls a: .I a lAE, ' A8gXpa
a -. 0 000~~~~~~~~I I .,~~~~~ .90

t'Z61 29.I Q61 £916t
....... ................ . ....
S . ; :: . :: :: ;
~~~~~~~~~~~~~~~~~~~~~;Aori s pi
*. .. S
.. .. *- ; ; ; o n0 s'.0 2'
oflqndalJ u8D1a;V 1ei)uaD * utt
a II
:: ;4 I . ... ;
*~~;S' ; iOSZ'£
* i Tii
t,2 A1 ______ _ TIb6lw eS
ii~~ . . .. . .+ . . . . . . . . . . . . ....... ------ ----- -- ---- - --......-..-................-.-...-..-..-..- .- *- *- ** ** **-*-- -- -- -- -- ---**---- .-..-..-..-..-..-...-..-..-..- *- ------- -, *
; . : i . . .
:: , n sX n * , n o q s ?~* S ;~~~~~ ~ ~~~~~~~~~~~~~~~~~~~ :: .. i
U ~~~"4~2. 004 9
;a, .; .. .. .. s 5
---------- -- ------------------------------------ + -------- 3so °I ------ +
r I. F- :: :5
|~~~~~~~~~~~~~~~~~16 Ils ; ;:61:
-Z6I_____________________---- --- 4…+… - +…----------------------------
F"' ; flg ' ; ; VO
4L~~ ~~ ~ ~~~~~~~~~~~~~~~ I .. -.
4~~ ~~ ~ ~~~~~~~~~~~~~~~~~~~~~~~~~~~~~~~ ; S
;~~ ~~ ~ ~~~~~~~~~~~~~~~~~~~~~ S b lO'
£01

flEX :.961 r -;891
;lilXll .* 6 6 < * 4- - ;-4
; ; . - I
; ns ̂ * I ; ^ *- pflni '?~~~~~~~~~~~~~~~~~~~~~~~~~~~~~~~~~~~~~~~~~~~~~~~~~~* f
iflI) *gn~~~~~~~~~~~~~~~~~~~1 0
; . . . .:: . . :: ....... . .. i n - ; a - .. . . .. ..
* il]* * os LUTPIq
* b/~~~~~~~~~~~~~~~~~t S961 ~~~~~~~~~~~~~~~~~~~~~~C96EI
*Z6 T -.11 a 696
r a;r a -. --
; - : : .. a:;;:
a :: .. :: _a
Flo . a odSursI
; ~ ~ ~ ~ ~ ~ ~ ~ ~ ~ . **O a nns m
; * ;
; .. a
- - - - - - - - - - - - - - - - - - - - -------------------- --- ---- .. . . . . . . . . .... . . . . . . . . . . ... . -- -- ---
Sol I ;rii)n
* sauddTE4 lu~ f.Suot61 1 _________________________________________ -_____ 3 TY __________+___________________________
…4 … ; ee**nn;-+ o o
; Sl ; ; . ;~~~~~~~~~~~~~~~O

*L; I E~A 9 1 Qb61 ,.
; ~ ~ ~ ~ ~ ~ ~ ~ ~ ~ ~ ~ ~~~*li ,, ;. ; ;j
r e t ' - r~~~~~~~~~~~~~~~~~~~~~~~~~~~~~~~~~~~~~~~~~~~~~~~~~~~~~~~~~~~~~~~~~~~~*cr ~"-- - - -- ---- - - - - - - - - - - - -- - - - - - - - - - - - - --- -
; ;n,u "(. ; ;no-
; ;a az -w iin
;, .: a i ; :: I ;
~~~~~~~~~~~~~~~~~~~~~~~~~~~~~~r ; | t
--- ------------ _- _- ___-- --------- _-- ____ - - -- - -- ---- --- - -- - -- ---- + -__----------------- ---------------- -------
.~~~~~~~t ; ;: -9 tI
t - .. . .. I ; _ _~~~~~~~~~~~~~~~~r ( ..... .... .... ..... .... II'
tt~~~~~~~~~~~~~~~~~~"
*;l 2 i ;
; :: :: ;u;a;
I lt:~~~~~~~ I tl~~~~~~~~~')0 I P I
............ u. l . ..........u .......... . S .... i ll, I )
i ; ; ;
:t~~~~"
;~~~~~~~~~~~~~~~~~~~~~~,~ .|t1 * ; nsz
-86- O~~~~~~~~~~X~~~1I ~~~vaumav NTil?! C P,200J) r-V ajnw81d ZTp-u5add
601
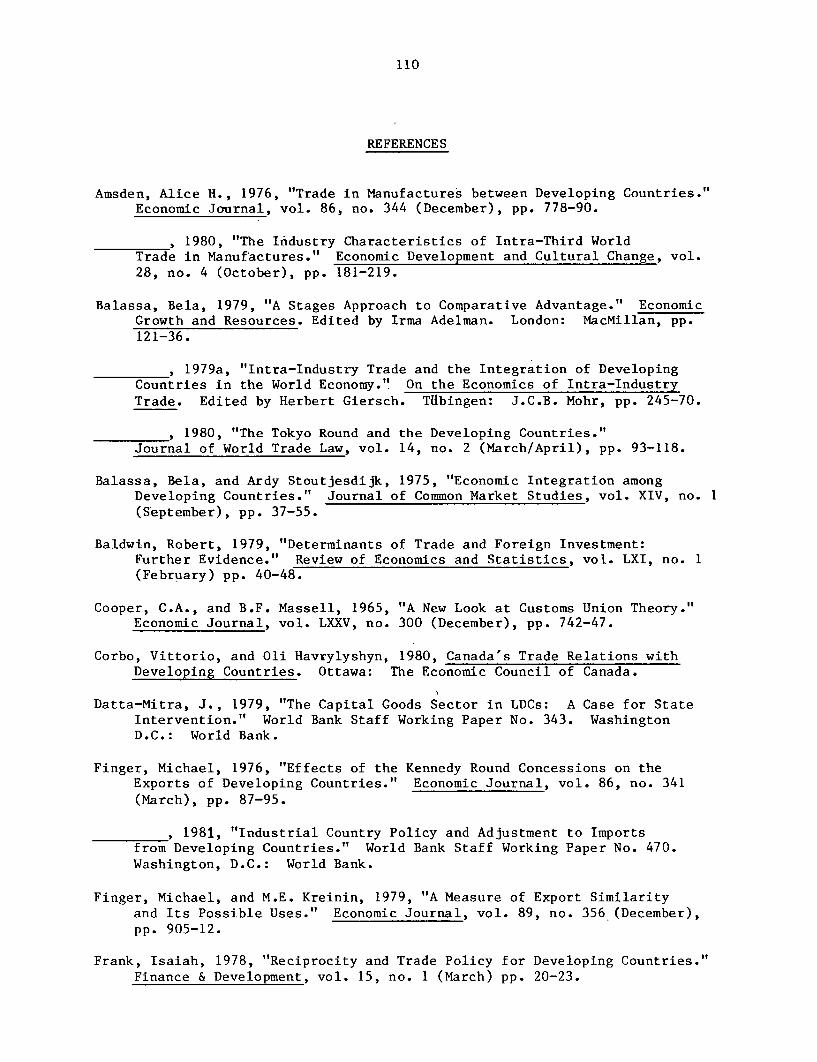
110
REFERENCES
Amsden, Alice H., 1976, "Trade in Manufactures between Developing Countries."Economic Journal, vol. 86, no. 344 (December), pp. 778-90.
, 1980, "The Industry Characteristics of Intra-Third WorldTrade in Manufactures." Economic Development and Cultural Change, vol.28, no. 4 (October), pp. 181-219.
Balassa, Bela, 1979, "A Stages Approach to Comparative Advantage." EconomicGrowth and Resources. Edited by Irma Adelman. London: MacMillan, pp.121-36.
, 1979a, "Intra-Industry Trade and the Integration of DevelopingCountries in the World Economy." On the Economics of Intra-IndustryTrade. Edited by Herbert Giersch. TUbingen: J.C.B. Mohr, pp. 245-70.
, 1980, "The Tokyo Round and the Developing Countries."Journal of World Trade Law, vol. 14, no. 2 (March/April), pp. 93-118.
Balassa, Bela, and Ardy Stoutjesdijk, 1975, "Economic Integration amongDeveloping Countries." Journal of Common Market Studies, vol. XIV, no. 1(September), pp. 37-55.
Baldwin, Robert, 1979, "Determinants of Trade and Foreign Investment:Further Evidence." Review of Economics and Statistics, vol. LXI, no. 1(February) pp. 40-48.
Cooper, C.A., and B.F. Massell, 1965, "A New Look at Customs Union Theory."Economic Journal, vol. LXXV, no. 300 (December), pp. 742-47.
Corbo, Vittorio, and Oli Havrylyshyn, 1980, Canada's Trade Relations withDeveloping Countries. Ottawa: The Economic Council of Canada.
Datta-Mitra, J., 1979, "The Capital Goods Sector in LDCs: A Case for StateIntervention." World Bank Staff Working Paper No. 343. WashingtonD.C.: World Bank.
Finger, Michael, 1976, "Effects of the Kennedy Round Concessions on theExports of Developing Countries." Economic Journal, vol. 86, no. 341(March), pp. 87-95.
, 1981, "Industrial Country Policy and Adjustment to Importsfrom Developing Countries." World Bank Staff Working Paper No. 470.Washington, D.C.: World Bank.
Finger, Michael, and M.E. Kreinin, 1979, "A Measure of Export Similarityand Its Possible Uses." Economic Journal, vol. 89, no. 356 (December),pp. 905-12.
Frank, Isaiah, 1978, "Reciprocity and Trade Policy for Developing Countries."Finance & Development, vol. 15, no. 1 (March) pp. 20-23.

111
Gard, Linda M., and James Riedel, 1980, "Safeguard Protection of Industry inDeveloped Countries: Assessment of the Implications for DevelopingCountries." Weltwirtschaftliches Archiv, Band 116, Heft 3, pp. 471-92.
Gregoire, J.P., 1980, "Evaluating Regional Schemes for the Promotion of Inter-LDC Trade." U.S. Dept. of State, Bureau of Intelligence and Research,April 1980. Processed.
Hirsch, S., 1974, "Hypotheses Regarding Trade between Developing andIndustrial Countries." The International Division of Labor Problems andPerspectives: International Symposium. Edited by Herbert Giersch.TUbingen: J.C.B. Mohr., pp. 65-82.
Hufbauer, Gary C., 1970, "The Impact of National Characteristics and Tech-nology on the Commodity Composition of Trade in Manufactured Goods." TheTechnology Factor in International Trade. Edited by Raymond Vernon. NewYork: National Bureau of Economic Research, pp. 145-231.
Hughes, Helen, 1980, "Inter-Developing Country Trade and Employment." Paperpresented at International Economic Association, Sixth World Congress on"Human Resources, Employment and Development." Mexico City, 4-9 August,1980.
Keesing, Donald B., 1978, "Trade in Manufactures among Developing Countries."Washington, D.C.: World Bank (June). Internal circulation only.
Keesing, Donald B., and Martin Wolf, 1980, "Textile Quotas against DevelopingCountries." Thames Essay no. 23. London: Trade Policy Research Centre.
Krueger, Anne 0., 1977, "Growth, Distortions and Patterns of Trade amongMany Countries." Princeton Studies in International Finance no. 40.
, 1978, "Alternative Trade Strategies and Employment in LDCs."American Economic Review. Papers and Proceedings of the Ninetieth AnnualMeeting of the American Economic Association (May 1978), pp. 270-74.
, 1980, "Alternative Trade Strategies and Employment." Paperpresented at International Economic Association, Sixth World Congress on"Human Resources, Employment and Development," Mexico City, 4-9 August,1980.
Laing, E.T., 1977, "Shipping Freight Rates for Developing Countries." Journalof Transport Economics and Policy, vol. XI, no. 3 (September), pp. 262-76.
Lancaster, Kelvin, 1980, "Intra-Industry Trade under Perfect MonopolisticCompetition." Journal of International Economics, vol. 10, no. 2, pp.151-75.
Lewis, W.A., 1980, "The Slowing Down of the Engine of Growth." The AmericanEconomic Review, vol. 70, no. 4 (September), pp. 555-64.
Linder, S.B., 1961, An Essay on Trade and Transformation. Stockholm:Almquist and Wikesell.

112
Olechowski, Andrzej, and Gary Sampson, 1980, "Current Trade Restrictions in theEEC, The United States and Japan." Journal of World Trade Law, vol. 14,no. 3 (May/June), pp. 220-31.
Pack, Howard, 1980, "Fostering the Capital Goods Sector in LDCs: A Survey ofEvidence and Requirements." World Bank Staff Working Paper No. 376.Washington D.C.: World Bank.
Page, S.A.B., 1979, "The Management of International Trade." NationalInstitute of Economic and Social Research, Discussion Paper 29, London:National Institute of Economic and Social Research, (November).
Rhee, Yung W., and Larry E. Westphal, 1980, "Microanalytical Aspects ofComplementary Intra-industry Specialization." Washington D.C.: WorldBank (June). Internal circulation only.
Schwartz, A., E. Lutz, I. Jacobsen, and A. Lee, 1980, World Trade Flows byOrigin and Destination, 1970-90: A Functional Analysis. DivisionWorking Paper no. 1980-8. International Trade and Capital FlowsDivision, EPD. Washington D.C.: World Bank.
Stewart, Frances, 1976, "The Direction of International Trade: Gains andLosses for the Third World." A World Divided: The Less DevelopedCountries in the International Economy. Edited by G.K. Helleiner.Cambridge: Cambridge University Press.
Tatemoto, M., and S. Ichimura, 1959, "Factor Proportions and Foreign Trade:The Case of Japan." Review of Economics and Statistics, vol. XLI, no. 4(November), pp. 442-46.
United Nations Conference on Trade and Development (UNCTAD), 1979, EconomicCo-Operation among Developing Countries. TD/244, 11 April 1979. NewYork.
, Various Years, Handbook of International Trade and DevelopmentStatistics. New York.
Vaitsos, Constantine, 1978, "Crisis in Regional Economic Co-operation(Integration) among Developing Countries: A Survey." World Development,vol. 6, pp. 719-69.
Wionczek, Miguel, 1978, "Can the Broken Humpty-Dumpty Be Put Together Againand by Whom? A Comment on the Vaitsos Survey," World Development, vol 6,pp. 769-772.
Yeats, A.J., 1977, "A Comparative Analysis of Tariffs and Transport Costs onIndia's Exports." Journal of Development Studies, vol. 14, no. 1(October), pp. 97-107.

COMPANION PAPERS IN THIS SERIES
No. TITLE OF PAPER AUTHOR
449 Policy Experience in Twelve Less Developed Countries B. Balassa
470 Industrial Country Policy and Adjustment to Imports J.M. Fingerfrom Developing Countries
471 The Political Structure of the New Protectionism D. Nelson (consultant)
472 Adjustment to External Shocks in Developing Countries B. Balassa
473 Food Policy Issues in Low-Income Countries E. Clay (consultant)
474 Energy, International Trade, and Economic Growth A. Manne (consultant)
475 Capital-Importing Oil Exporters: Adjustment Issues A.H. Gelband Policy Choices
476 Notes on the Analysis of Capital Flows to Developing R.C. Bryant (consultant)Nations and the 'Recycling' Problem
477 Adjustment Experience and Growth Prospects of the F. JaspersenSemi-Industtial Countries
478 Trade Policy Issues for the Developing Countries I. Frank (consultant)in the 1980s
479 Trade among Developing Countries: Theory, Policy 0. HavrylyshynIssues, and Principal Trends (consultant)
M. Wolf
480 Trade in Services: Economic Determinants and A. Sapir (consultant)Development-Related Issues E. Lutz
481 International Migrant Workers' Remittances: Issues G. Swamyand Prospects
482 Private Bank Lending to Developing Countries R. O'Brien (consultant)
483 Development Prospects of the Capital Surplus R. HablutzelOil-Exporting Countries
484 Private Capital Flows to Developing Countries and A. FlemingTheir Determination
485 International Adjustment in the 1980s V. Joshi (consultant)

No. TITLE OF.PAPER AUTHOR
486 Adjustment in Low-Income Africa R. Liebenthal
487 A Comparative Analysis of Developing Country C. WallichAdjustment Experiences in the 1970s: Low-IncomeSouth Asia
488 Developments in and Prospects for the External N. HopeDebt of the Developing Countries: 1970-80 andBeyond
489. Global Energy Prospects B.J. ChoeA. LambertiniP. Pollak