public disclosure authorized - world bank · public disclosure authorized. ... based upon a request...
TRANSCRIPT

Pub
lic D
iscl
osur
e A
utho
rized
Pub
lic D
iscl
osur
e A
utho
rized
Pub
lic D
iscl
osur
e A
utho
rized
Pub
lic D
iscl
osur
e A
utho
rized
Pub
lic D
iscl
osur
e A
utho
rized
Pub
lic D
iscl
osur
e A
utho
rized
Pub
lic D
iscl
osur
e A
utho
rized
Pub
lic D
iscl
osur
e A
utho
rized

This is a technical document of The World Bank Group and does not represent an official position of the Bank Group
or of its Executive Board. The document provides an economic and statistical analysis of the Ugandan tourism
sector, based upon a request from the Uganda Ministry of Tourism, Wildlife, and Antiquities (MTWA). The Task
Team Leaders are Martin Fodor and Hannah Messerli.
© 2013 THE WORLD BANK GROUP1818 H Street NWWashington DC 20433Telephone: 202-473-1000Internet: www.worldbank.org
All rights reserved.First printing July 2013
This work is a product of the staff of The World Bank Group with external contributions. The findings, interpretations, and conclusions expressed in this work do not necessarily reflect the views of The World Bank Group, its Board of Executive Directors, or the governments they represent.
The World Bank Group does not guarantee the accuracy of the data included in this work. The boundaries, colors, denominations, and other information shown on any map in this work do not imply any judgment on the part of The World Bank Group concerning the legal status of any territory or the endorsement or acceptance of such boundaries.
R I G H T S A N D P E R M I S S I O N S
The material in this publication is copyrighted. Copying and/or transmitting portions or all of this work without permission may be a violation of applicable law. The World Bank Group encourages dissemination of its work and will normally grant permission to reproduce portions of the work promptly.
For permission to photocopy or reprint any part of this work, please send a request with complete information to the Copyright Clearance Center Inc., 222 Rosewood Drive, Danvers MA 01923, USA; telephone: 978-750-8400; fax: 978-750-4470; Internet: www.copyright.com.
All other queries on rights and licenses, including subsidiary rights, should be addressed to the Office of the Publisher, THE WORLD BANK GROUP, 1818 H Street NW, Washington, DC 20433, USA; fax: 202-522-2422; e-mail: [email protected].
All maps courtesy of Tableau Maps and created from author’s data.
Cover image: Minden PicturesAll images courtesy of Shutterstock, LLC, except where noted otherwise.

Contents
Chapter 1Introduction—Uganda Tourism in Contextpage 1
Chapter 2 Economic Analysis of Ugandan Tourism Exports in 2012page 4
Chapter 3Statistical Analysis of the Tourism Expenditure and Motivation Survey page 20
Chapter 4Main Findings and Policy Conclusions page 46
Pho
to: K
irk
E. H
amilt
on

Pho
to: K
irk
E. H
amilt
on
ii
iii
This report is the result of a collaboration between the Uganda Ministry of Tourism, Wildlife, and Antiquities
(MTWA), the Uganda Bureau of Statistics (UBOS), and the World Bank. The report was written by Kirk
Hamilton (World Bank) and Martin Schmidt (consultant, World Bank), with contributions from Alex Asiimwe
(MTWA) and Sam Kaisiromwe (UBOS). It analyzes responses to the Tourism Expenditure and Motivation
Survey 2012 (TEMS). The survey, designed by MTWA and carried out by UBOS, was conducted to extend
the findings of the Uganda Tourism Sector Situational Assessment: Tourism Reawakening (World Bank, June
2012) and to provide a quantitative basis for economic modeling of the impact of tourist expenditures on
Uganda’s economy.
The report has benefited from the assistance and advice of many colleagues, including Amb. Patrick Mugoya
(Permanent Secretary, MTWA), Dr. Chris Mukiza (Director of Macroeconomic Statistics, UBOS), Samuel
Echoku (UBOS), Yunus Koire (UBOS), Laban Mbulamuko (Ministry of Finance, Planning and Economic
Development), Charles Byaruhanga (Ministry of Finance, Planning and Economic Development), Bradley
Weiss (consultant, World Bank), and Stuart Solomon (consultant, World Bank).
Particular thanks go to the peer reviewers at the World Bank, Irina Klytchnikova and Craig Meisner.
Finally, the generous financial support of the U.K. Department for International Development (DFID) is
gratefully acknowledged.
Acknowledgments
Monetary equivalents 2012 average
Monetary unit = Uganda Shilling (UGX) 1.00 dollar US = 2686 UGX

iv
Executive Summary v
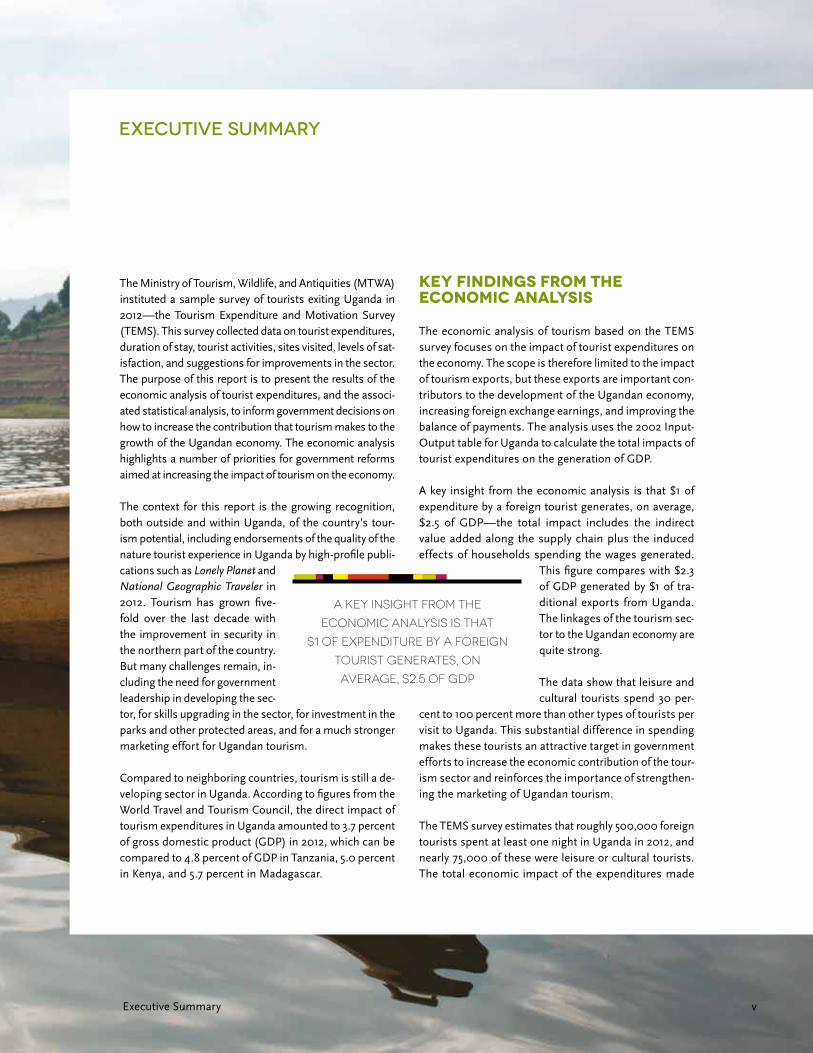
The Ministry of Tourism, Wildlife, and Antiquities (MTWA) instituted a sample survey of tourists exiting Uganda in 2012—the Tourism Expenditure and Motivation Survey (TEMS). This survey collected data on tourist expenditures, duration of stay, tourist activities, sites visited, levels of sat-isfaction, and suggestions for improvements in the sector. The purpose of this report is to present the results of the economic analysis of tourist expenditures, and the associ-ated statistical analysis, to inform government decisions on how to increase the contribution that tourism makes to the growth of the Ugandan economy. The economic analysis highlights a number of priorities for government reforms aimed at increasing the impact of tourism on the economy.
The context for this report is the growing recognition, both outside and within Uganda, of the country’s tour-ism potential, including endorsements of the quality of the nature tourist experience in Uganda by high-profile publi-cations such as Lonely Planet and National Geographic Traveler in 2012. Tourism has grown five-fold over the last decade with the improvement in security in the northern part of the country. But many challenges remain, in-cluding the need for government leadership in developing the sec-tor, for skills upgrading in the sector, for investment in the parks and other protected areas, and for a much stronger marketing effort for Ugandan tourism.
Compared to neighboring countries, tourism is still a de-veloping sector in Uganda. According to figures from the World Travel and Tourism Council, the direct impact of tourism expenditures in Uganda amounted to 3.7 percent of gross domestic product (GDP) in 2012, which can be compared to 4.8 percent of GDP in Tanzania, 5.0 percent in Kenya, and 5.7 percent in Madagascar.
Executive Summary
Key Findings from the Economic Analysis
The economic analysis of tourism based on the TEMS survey focuses on the impact of tourist expenditures on the economy. The scope is therefore limited to the impact of tourism exports, but these exports are important con-tributors to the development of the Ugandan economy, increasing foreign exchange earnings, and improving the balance of payments. The analysis uses the 2002 Input-Output table for Uganda to calculate the total impacts of tourist expenditures on the generation of GDP.
A key insight from the economic analysis is that $1 of expenditure by a foreign tourist generates, on average, $2.5 of GDP—the total impact includes the indirect value added along the supply chain plus the induced effects of households spending the wages generated.
This figure compares with $2.3 of GDP generated by $1 of tra-ditional exports from Uganda. The linkages of the tourism sec-tor to the Ugandan economy are quite strong.
The data show that leisure and cultural tourists spend 30 per-
cent to 100 percent more than other types of tourists per visit to Uganda. This substantial difference in spending makes these tourists an attractive target in government efforts to increase the economic contribution of the tour-ism sector and reinforces the importance of strengthen-ing the marketing of Ugandan tourism.
The TEMS survey estimates that roughly 500,000 foreign tourists spent at least one night in Uganda in 2012, and nearly 75,000 of these were leisure or cultural tourists. The total economic impact of the expenditures made
A key insight from the
economic analysis is that
$1 of expenditure by a foreign
tourist generates, on
average, $2.5 of GDP

Economic and Statistical Analysis of Tourism in Ugandavi
by these half-million foreign tourists while in Uganda is large—expenditures totaled UGX (Uganda shillings) 1.1 trillion and generated UGX 2.7 trillion of GDP. This expenditure amounted to 38 percent of exports and gen-erated 5.6 percent of 2012 GDP, including revenues to government from indirect taxes of 0.5 percent of GDP.
Policy simulations show that attracting 100,000 addition-al leisure tourists to visit Uganda would add 11 percent to exports and 1.6 percent to GDP. Similarly, if each tour-ist visiting Uganda stayed one additional night, imports would rise by 7 percent and GDP by 1 percent. The latter finding is important because the TEMS survey shows that over 70 percent of tourists visiting on business, for meetings, or to visit friends and relatives did not visit any natural sites outside of Kampala.
The Statistical Analysis
In 2013 more than 1 million nonresidents visited Uganda, and it is estimated that about half of them of them stay at least one night. Most tourists come from Uganda’s neigh-boring countries, Europe, and North America; Kenya (16 percent of all visitors), Rwanda (10 percent), the United Kingdom (11 percent), and the United States (15 percent) are tourists’ most common countries of residence.
On their trip to Uganda, over 40 percent of tourists visit other African countries, most importantly Kenya (visited by 20 percent of all Ugandan tourists), Tanzania (12 per-cent), and Rwanda (10%). About 90 percent of tourists travel in groups of four or fewer. Some 32 percent of tourists come for business reasons, 11 percent for meet-ings or conferences, 17 percent for leisure, 20 percent for family, 5 percent for spiritual/religious purposes, and 2 percent for cultural tourism; the remaining tourists come to Uganda for research, nongovernmental organization (NGO) work, or education.
Among leisure tourists, wildlife safari (39 percent), gorilla viewing (26 percent), adventure tourism (25 percent), and backpacker travel (17 percent) are the most popu-lar trip activities; it is possible to distinguish a group of young backpacker travelers from other leisure tour-ists; for example, backpackers stay longer (20 days on average versus 14 days for the average leisure tourist), spend less ($1,160 in total versus $1,438; $105 per day
versus $176), and engage more frequently in adventure activities (33 percent versus 21 percent). African tourists predominantly come to Uganda for business or meeting reasons; most leisure tourists come from Europe (46 percent), but a large number of them come from Africa (20 percent) and North America (22 percent).
Most tourists obtain information regarding their trip to Uganda mainly through personal networks; however, leisure tourists rely as much on travel agents, guide-books, and the World Wide Web as they rely on per-sonal networks. Only 5 percent of all tourists use the Uganda Tourism Board’s website as their main source of information.
Business and meeting tourists rarely stay longer than a week (only 25 percent), but a sizeable proportion of them stay for extended periods of time (up to 6 months). About 75 percent of leisure and cultural tourists do not stay longer than 2 weeks (their average length of stay is 7 days), and 90 percent of them do not stay longer than 1 month.
In Uganda, virtually all travel (about 98 percent) is by road (bus, car, or motorcycle). Leisure tourists account for the vast majority of visits to national parks and stays in nature tourism accommodation (lodges, cottages, camp-sites, etc.); nevertheless, about 20 percent of business, meeting, and family tourists undertake at least one trip to Uganda’s nature tourism sites.
The popularity of nature tourism sites generally does not depend on tourist type; however, destinations closer to Kampala are relatively more attractive to business and meeting tourists; there is large variation in the popular-ity of nature tourism sites and, apart from Murchison Falls National Park, the most popular destinations are in the vicinity of Kampala and the southwest of Uganda. If tourists visit a specific nature tourism site, they stay on average between 1 and 2 days.
About 6 percent of all tourists and 20 percent of all lei-sure tourists are package tourists; 80 percent of package tourists stay less than 15 days in Uganda, their average total package expenditure is about $1,415 per person (ex-cluding airfare), and their average daily package expen-diture is about $166. Discretionary spending of package

Executive Summary vii
tourists increases their total and daily expenditure by about 20 percent.
Low-season (November to June) and high-season (July to October) tourists differ: the main difference is that low-season tourists are less often leisure tourists than high-season tourists (16 percent versus 20 percent). Low-season leisure tourists spend, on average, nearly 50 percent less than high-season leisure tourists (in total $981 versus $1,718, and by day $139 versus $210). And the percentage of package tourists among leisure tourists is much smaller in low season than in high season (14 percent versus 29 percent).
Tourists’ overall satisfaction with their trip to Uganda is high. However, local transport in Uganda and insufficient visitor information are the most frequently cited sources of dissatisfaction and suggested areas for improvement. Moreover, about 10 percent of respondents to questions on areas for improvement in Uganda tourism cited the quality of customer service as an issue.
Policy Implications
Going forward, there are two basic ways to make tour-ism’s contribution to the Ugandan economy grow: at-tracting more tourists and persuading tourists to spend more money while they are visiting Uganda. These goals lead to four broad areas where government policy and government investment can make a difference:
■ Marketing Uganda: Stronger branding, use of new media, strengthening links with travel agencies in source markets, and attracting high-profile foreign operators can all contribute to attracting more tour-ists to visit Uganda.
■ Increasing supply: Private sector investments in the tourism sector will be needed to meet growing de-mand, which will require improvements in the invest-ment climate in Uganda. In addition, policies and regulations specific to the tourism sector need to be reviewed and reformed. A growing private sector can in turn contribute to marketing Uganda tourism.
■ Removing bottlenecks: Investments in infrastruc-ture, particularly roads, can decrease the cost and increase the convenience for tourists to visit the natural areas of Uganda. Reforms of the concession policy for tourism operators, in particular to increase transparency and security of tenure, will boost private investment in the sector. And filling the skills gap in the sector will increase visitor satisfaction and the ef-fectiveness of word-of-mouth marketing when these visitors return home.
■ Investing in natural assets: The national parks and other protected areas in Uganda are in the process of recovery from the neglect of earlier decades. Investments in park infrastructure, machinery and equipment, the protection and management of wild-life, and staff skills are needed to increase the value of the key natural assets in the sector.
Pho
to: K
irk
E. H
amilt
on
Economic and Statistical Analysis of Tourism in Ugandaviii
Introduction— Uganda Tourism in Context 1
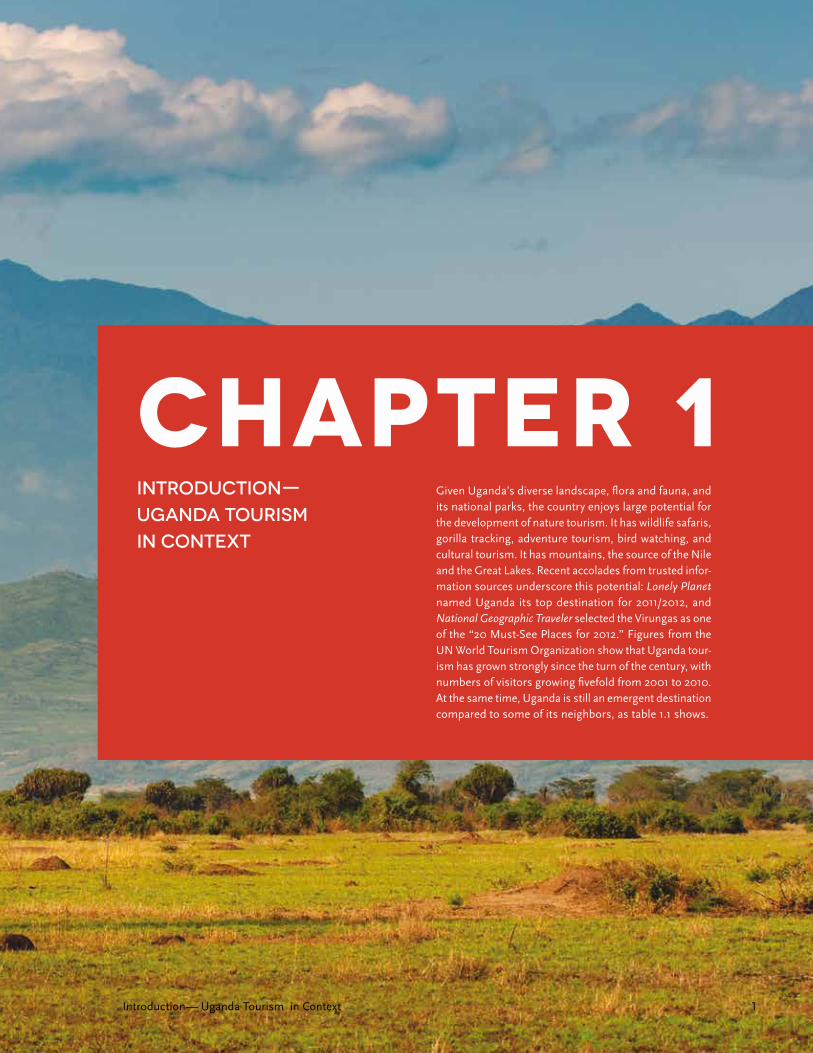
Given Uganda’s diverse landscape, flora and fauna, and its national parks, the country enjoys large potential for the development of nature tourism. It has wildlife safaris, gorilla tracking, adventure tourism, bird watching, and cultural tourism. It has mountains, the source of the Nile and the Great Lakes. Recent accolades from trusted infor-mation sources underscore this potential: Lonely Planet named Uganda its top destination for 2011/2012, and National Geographic Traveler selected the Virungas as one of the “20 Must-See Places for 2012.” Figures from the UN World Tourism Organization show that Uganda tour-ism has grown strongly since the turn of the century, with numbers of visitors growing fivefold from 2001 to 2010. At the same time, Uganda is still an emergent destination compared to some of its neighbors, as table 1.1 shows.
Chapter 1Introduction— Uganda Tourism in Context
Economic and Statistical Analysis of Tourism in Uganda2
able 1.1. Tourist Arrivals and Direct Contribution to GDP
International tourist arrivals, 2010
Direct contribution to GDP, 2012
Kenya 1,470,000 5.0%
Rwanda 619,000 3.1%
Tanzania 754,000 4.8%
Uganda 946,000 3.7%
Sources: Arrivals—UN World Tourism Organization, Tourism
Highlights, 2012 Edition; GDP—World Travel and Tourism
Council, Travel and Tourism Economic Impact 2013.
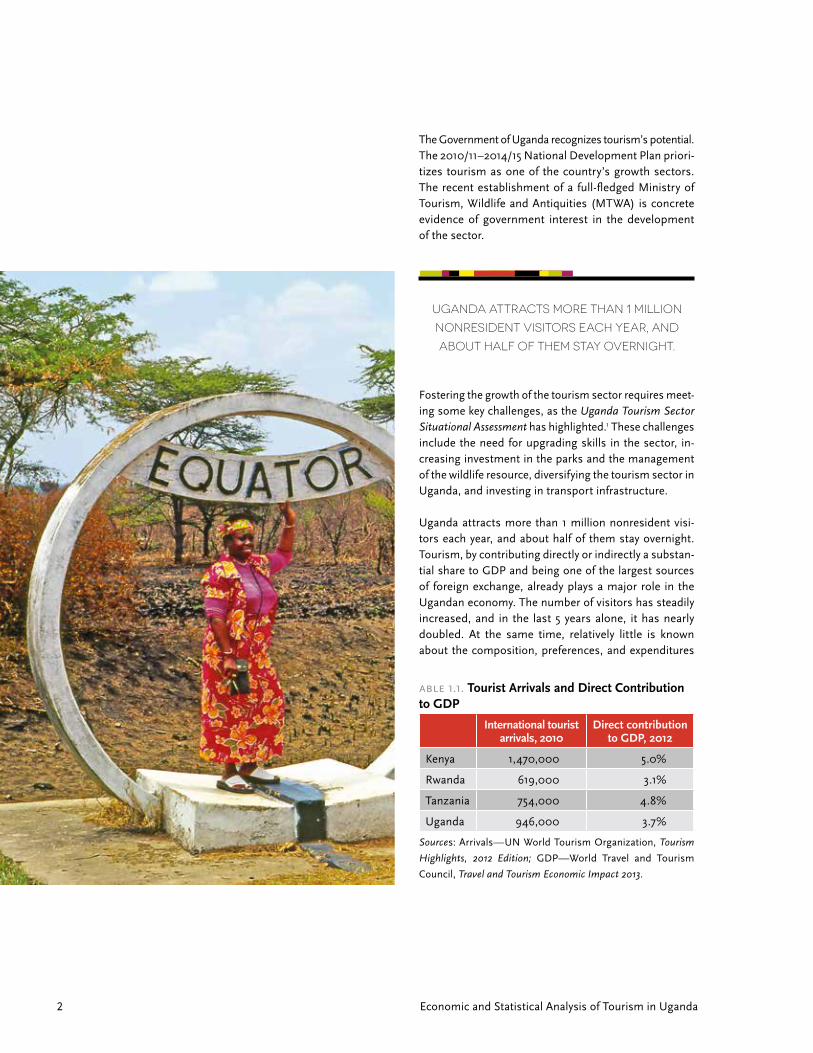
The Government of Uganda recognizes tourism’s potential. The 2010/11–2014/15 National Development Plan priori-tizes tourism as one of the country’s growth sectors. The recent establishment of a full-fledged Ministry of Tourism, Wildlife and Antiquities (MTWA) is concrete evidence of government interest in the development of the sector.
Fostering the growth of the tourism sector requires meet-ing some key challenges, as the Uganda Tourism Sector Situational Assessment has highlighted.1 These challenges include the need for upgrading skills in the sector, in-creasing investment in the parks and the management of the wildlife resource, diversifying the tourism sector in Uganda, and investing in transport infrastructure.
Uganda attracts more than 1 million nonresident visi-tors each year, and about half of them stay overnight. Tourism, by contributing directly or indirectly a substan-tial share to GDP and being one of the largest sources of foreign exchange, already plays a major role in the Ugandan economy. The number of visitors has steadily increased, and in the last 5 years alone, it has nearly doubled. At the same time, relatively little is known about the composition, preferences, and expenditures
Uganda attracts more than 1 million
nonresident visitors each year, and
about half of them stay overnight.
Introduction— Uganda Tourism in Context 3
of Uganda’s tourists, particularly about leisure tourists, who tend to spend more and stay longer than other types of tourists. The Expenditure and Motivation Survey 2012 (TEMS 2012) was designed and carried out to overcome this lack of information.
The economic analysis of tourism in Uganda is the central focus of this report and is featured in chapter 2. It is fol-lowed by the detailed statistical analysis in chapter 3 and by summary policy conclusions in chapter 4.
Endnotes
1. Uganda Tourism Sector Situational Assessment: Tourism Reawakening. The World Bank, June 2012.
Pho
to: K
irk
E. H
amilt
on

Economic and Statistical Analysis of Tourism in Uganda4
The data from immigration forms at border crossings show that Uganda has experienced strong growth in numbers of visitors in recent years. But a fuller understanding of the contribution of tourism to the Ugandan economy has been hampered by a lack of information about the average tourist’s prime reason for visiting, length of stay, number of sites visited and activities undertaken, level of satisfaction with the visit, and total expenditures made by the tourist while in Uganda. Without this information, it has been difficult for the government of Uganda to prioritize investments and policy reforms in the tourism sector. This chapter analyzes the economic contribution of tourism exports to the Ugandan economy to guide government strategy for the sector.
Chapter 2Economic Analysis of Ugandan Tourism Exports in 2012
Economic Analysis of Ugandan Tourism Exports in 2012 5

Economic and Statistical Analysis of Tourism in Uganda6
The data on tourist expenditures from the Tourism Expenditure and Motivation Survey 2012 (TEMS) pro-vides the basis for valuing tourism exports, but it is im-portant to note that the overall size of the tourism sector is larger than what is captured by the TEMS data. The dif-ference includes investments made by tourism operators as well as investments and operating expenditures made by government in the administration of the sector and the operations of public sector tourism assets, such as mu-seums and national parks. The United Nations Tourism Satellite Accounts (if imple-mented) as well as the publica-tions of the World Travel and Tourism Council can provide a snapshot of the larger sector.
Tourism exports are particu-larly important from the per-spective of economic policy. They provide scarce foreign exchange earnings and contrib-ute positively to the balance of payments. They are also strongly influenced by government policy. Policy reforms can strengthen the promotion of the sector in foreign markets, and reforms on the supply side can foster the growth of the tourism sector and its contribution to na-tional income.
Scope of the Analysis
By design, the TEMS measures data only on nonresidents who spend at least one night in Uganda. This criterion ensures that data on the tourists who are making the largest expenditures in Uganda are captured—an over-night stay entails expenditures on local transport, accom-modation, and food as well as additional expenditures on activities and/or shopping. It also ensures that the most policy-sensitive tourists are surveyed—the tourists whose numbers and total expenditures can grow as a result of both promotion of Uganda as a tourist destina-tion and growth in the quantity and quality of the supply of tourism services in Uganda.
As seen in table 2.1, immigration data show that 1,069,000 nonresidents departed Uganda in 2012. Of these nonresidents, nearly 700,000 were residents of Common Market of Eastern and Southern Africa
(COMESA) countries. The analysis of the TEMS data as-sumes that 80 percent of the COMESA visitors departing at the major land border crossings were on day trips for small-scale trading activities in Uganda. Total expendi-tures by these day-tripping COMESA visitors are likely to be minimal. Moreover, attempts to survey them would be unsatisfactory because of high refusal rates and heavily biased responses—it is reasonable to assume that these visitors would wish to avoid any scrutiny by officials of the government of Uganda.
The scope of the TEMS and the economic analysis is therefore conservative, but the data are of high quality and are sharply focused on the highest-spend-ing foreign tourists, including the most policy-sensitive tour-ists. The TEMS classifies tour-ists according to their primary reason for visiting Uganda: the
categories are (1) leisure,1 (2) business, (3) spiritual, (4) meetings and conferences, (5) cultural, (6) visiting family and friends, and (7) other. Of these tourists, the most policy-sensitive are the leisure and cultural tourists and, to a lesser extent, tourists attending meetings and conferences. However, even for the other categories of tourists, increases in the quantity and quality of tourism services would increase the likelihood of their spending an extra a day or more on leisure or cultural activities while in Uganda.
Tourism exports are
particularly important from
the perspective of economic
policy. They provide scarce
foreign exchange earnings
and contribute positively to
the balance of payments.
Table 2.1: Departures of Foreign Tourists by Region of Residence, 2012
Africa, COMESA 687,169
Africa, other 108,728
Europe, western 92,020
Europe, other 7,734
North America 60,376
Others and not stated 113,019
Total 1,069,046
Source: Uganda Bureau of Statistics (UBOS).

Pho
to: K
irk
E. H
amilt
on
Economic Analysis of Ugandan Tourism Exports in 2012 7
Measuring the Economic Impact of Tourists
The primary data used in measuring the contribution of tourists to the Ugandan economy are the individual tour-ist expenditure data, derived from TEMS respondents who were non–package tourists and therefore were able to itemize their expenditures. These expenditures by in-dividual respondents were then scaled up, according to the population weights derived from the immigration forms, to the total population of visitors who spent at least one night in Uganda in 2012.2
Because these expenditures were made by nonresidents of Uganda, they are formally part of Uganda’s exports rather than domestic final demand. The effect of these exports on the wider economy is modeled using the 2002 input-output (IO) table for Uganda.3
Expenditures by tourists constitute the direct effect that tourists have on the Ugandan economy, and the direct impact of these expenditures is the amount of value add-ed (wages and salaries, mixed income of unincorporated businesses, profits, and indirect taxes) in the sectors that supply the goods and services purchased. Using the IO model, however, the indirect effects of these expendi-tures can also be captured—for example, a purchase of a restaurant meal requires the purchase of foodstuffs, beverages, and energy to provide the meal, and these purchases create a cascade of value added in the sectors that produce food, beverages, and energy.4 These sectors
in turn generate value added and purchase intermediate inputs. This full chain of production is modeled using the IO table.
Finally, by closing the IO model to household expendi-ture, the induced effects of the purchase of a restaurant meal can also be estimated. In this case, the wages, salaries, mixed income, and profits generated in each sector accrue to households who save some portion of the income and spend the rest on goods and services, generating yet another stream of intermediate inputs and factor incomes along the chain of production. This additional stream adds up to the total induced effect of consuming a restaurant meal.5
Of course, some inputs to production are imported rather than domestically produced, so this effect is also captured in the IO model through the use of import share coefficients for intermediate inputs as well as expendi-tures by households and government.
Summary Figures on High-Spending Foreign Tourists
The TEMS provides a rich source of information on for-eign tourists departing Uganda. To emphasize a point made earlier, by focusing on tourists who spent at least one night in Uganda, the survey captures information about the major contributors to tourist exports.6 Tables 2.2 and 2.3 and figures 2.1 and 2.2 highlight the summary data for these tourists.

Table 2.2: Key Data on Tourists Who Spent at Least One Night in Uganda, 2012
Number of tourists
Average nights per visit
Average expenditure per visit, $
Average expenditure per visit, UGX thousand
Leisure 68,100 6.8 1,211 3,253
Business 164,500 4.4 871 2,339
Spiritual 30,300 7.4 808 2,170
Meetings 60,700 5.2 929 2,495
Cultural 6,600 6.1 1,179 3,167
Family 121,000 5.7 539 1,448
Other 49,300 6.3 560 1,504
All tourists 500,600 5.5 812 2,181
Note: Expenditures are mean values for tourists staying 15 nights or less and spending $50 per night or more.
Source: TEMS.
Table 2.3: Distribution of Total Tourist Expenditures per Visit by Tourist Type, $
Leisure Business Spiritual Meetings Cultural Family Other All tourists
Retail trade 124 140 92 149 196 101 85 121
Hotels, bars, and restaurants
591 505 333 580 595 260 277 435
Passenger road transport
133 80 85 81 106 63 67 82
Air transport 24 14 8 5 46 2 3 10
Cultural and recreational services
295 48 51 50 140 63 60 88
Other services 44 84 240 65 95 52 67 76
Total 1,211 871 808 929 1,179 539 560 812
Source: TEMS.
Economic and Statistical Analysis of Tourism in Uganda8
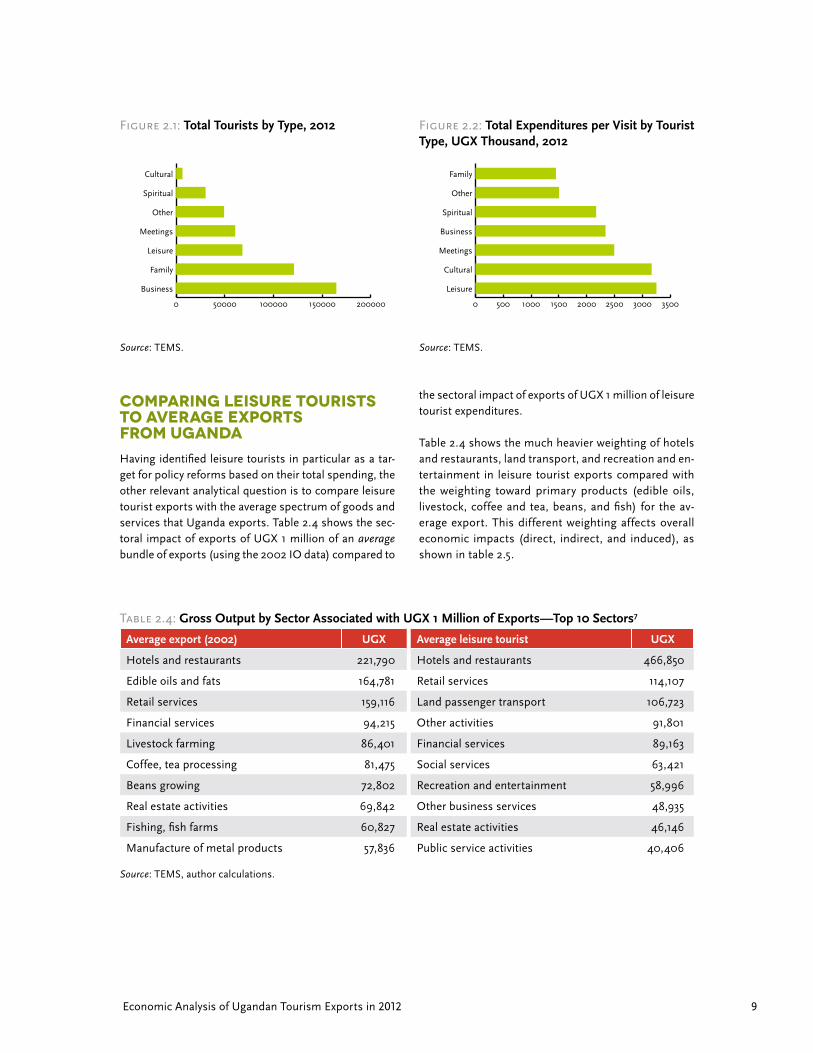
As seen in figure 2.1, the largest numbers of tourists were on business or visiting family and friends, with leisure (nature) tourists coming in third. Cultural tourists were the smallest category of visitors.
However, as figure 2.2 emphasizes, the biggest spenders per visit were leisure and cultural tourists. These tourists are an attractive target for government policy because they spend 30 to 100 percent more per visit than do tour-ist in the other categories. As table 2.2 shows, business tourists and tourists attending meetings spent the least number of nights per visit, and they are not particularly
policy sensitive—they come to Uganda primarily for business or meetings rather than to enjoy the tourist attractions in the country. The lowest-spending tourists per visit are those visiting friends and family as well as those in the Other category.
Table 2.3 presents the distribution of tourist expenditures, which has implications for the impacts that tourism ex-ports have on the broader economy. As expected, ex-penditures are weighted toward the hotel and restaurant sector, cultural and recreational services (particularly for leisure and cultural tourists), transport, and retail trade.
Economic Analysis of Ugandan Tourism Exports in 2012 9
Comparing Leisure Tourists to Average Exports from UgandaHaving identified leisure tourists in particular as a tar-get for policy reforms based on their total spending, the other relevant analytical question is to compare leisure tourist exports with the average spectrum of goods and services that Uganda exports. Table 2.4 shows the sec-toral impact of exports of UGX 1 million of an average bundle of exports (using the 2002 IO data) compared to
the sectoral impact of exports of UGX 1 million of leisure tourist expenditures.
Table 2.4 shows the much heavier weighting of hotels and restaurants, land transport, and recreation and en-tertainment in leisure tourist exports compared with the weighting toward primary products (edible oils, livestock, coffee and tea, beans, and fish) for the av-erage export. This different weighting affects overall economic impacts (direct, indirect, and induced), as shown in table 2.5.
Figure 2.1: Total Tourists by Type, 2012 Figure 2.2: Total Expenditures per Visit by Tourist Type, UGX Thousand, 2012
Table 2.4: Gross Output by Sector Associated with UGX 1 Million of Exports—Top 10 Sectors7
Average export (2002) UGX Average leisure tourist UGX
Hotels and restaurants 221,790 Hotels and restaurants 466,850
Edible oils and fats 164,781 Retail services 114,107
Retail services 159,116 Land passenger transport 106,723
Financial services 94,215 Other activities 91,801
Livestock farming 86,401 Financial services 89,163
Coffee, tea processing 81,475 Social services 63,421
Beans growing 72,802 Recreation and entertainment 58,996
Real estate activities 69,842 Other business services 48,935
Fishing, fish farms 60,827 Real estate activities 46,146
Manufacture of metal products 57,836 Public service activities 40,406
Source: TEMS, author calculations.
Source: TEMS. Source: TEMS.
Perc
enta
ge
PercentageSuggested Tourism Improvements
0 50000 100000 150000 200000
Business
Family
Leisure
Meetings
Other
Spiritual
Cultural
Perc
enta
gePercentage
Suggested Tourism Improvements
0 500 1000 1500 2000 2500 3000 3500
Leisure
Cultural
Meetings
Business
Spiritual
Other
Family

Economic and Statistical Analysis of Tourism in Uganda10
Table 2.5: Economic Impact of UGX 1 Million of Expenditure: Average Export Compared with Leisure Tourist Export
Exports (2002) Leisure tourists
Final demand 1,000,000 1,000,000
Value added 2,323,784 2,449,298
Wages and salaries 633,733 679,895
Skilled and highly skilled 385,679 490,425
Semiskilled and unskilled 248,053 189,469
Mixed income (NIUB) 1,067,062 1,071,569
Surplus 372,425 459,753
Indirect taxes 250,565 238,081
Memo: Imports 543,220 528,956
Memo: Multiplier 2.3 2.4
Percentages of value added
Wages and salaries 27.3% 27.8%
Skilled and highly skilled 16.6% 20.0%
Semiskilled and unskilled 10.7% 7.7%
Indirect taxes 10.8% 9.7%
Memo: Imports 23.4% 21.6%
NIUB: net income of unincorporated business.
Source: TEMS, author calculations.
Owing to the effects of household expenditures induced by this hypothetical export of UGX 1 million, the total value added (i.e., GDP) generated exceeds the total final demand. This effect is more pronounced for the leisure tourist export compared to the average export—a mul-tiplier of 2.4 compared with 2.3. Although the difference is small, this result shows that leisure tourist exports are closely linked to the rest of the Ugandan economy. In con-trast, indirect tax revenues (value added tax [VAT], excise tax, and tariffs on imports) are somewhat higher for aver-age exports compared to leisure tourists.
The other point to note in table 2.5 is the distribution of wages and salaries between skilled and unskilled labor-ers. Leisure tourist exports employ a much larger propor-tion of skilled labor compared to average exports—this
is good news to the extent that these tend to be good jobs, but it is less positive in the context of the large pool of unskilled labor in Uganda.
The Overall Economic Impact of Tourists in 2012
Table 2.2 highlighted the average expenditures per visit by the different types of tourists. The starting point in assessing the overall economic impact of tourists visiting Uganda is therefore to analyze the economic impacts per tourist visit. This information is presented in table 2.6.
The first figure to note in this table is the size of the mul-tiplier for each tourist type. This metric is the amount of value added (GDP) generated per dollar of final

Pho
to: K
irk
E. H
amilt
on
Economic Analysis of Ugandan Tourism Exports in 2012 11
Table 2.6: Economic Impact of One Average Tourist Visit by Tourist Type, UGX Thousand
Leisure Business Spiritual Meetings Cultural Family Other All tourists
Final demand 3,253 2,339 2,170 2,495 3,167 1,448 1,504 2,181
Value added 7,966 5,893 5,364 6,334 7,827 3,602 3,744 5,447
Wages and salaries 2,211 1,506 1,438 1,603 2,079 949 985 1,428
Skilled and highly skilled 1,595 1,067 992 1,138 1,485 673 696 1,015
Semiskilled and unskilled 616 439 446 464 594 277 289 414
Mixed income (NIUB) 3,485 2,653 2,424 2,860 3,482 1,608 1,671 2,435
Surplus 1,495 1,190 994 1,293 1,520 705 735 1,072
Indirect taxes 774 544 509 578 746 340 353 511
Memo: Imports 1,720 1,216 1,153 1,291 1,665 758 788 1,140
Memo: Multiplier 2.4 2.5 2.5 2.5 2.5 2.5 2.5 2.5
Percentages of value added
Wages and salaries 27.8% 25.6% 26.8% 25.3% 26.6% 26.4% 26.3% 26.2%
Skilled and highly skilled 20.0% 18.1% 18.5% 18.0% 19.0% 18.7% 18.6% 18.6%
Semiskilled and unskilled 7.7% 7.4% 8.3% 7.3% 7.6% 7.7% 7.7% 7.6%
Indirect taxes 9.7% 9.2% 9.5% 9.1% 9.5% 9.5% 9.4% 9.4%
Memo: Imports 21.6% 20.6% 21.5% 20.4% 21.3% 21.0% 21.0% 20.9%
NIUB: net income of unincorporated business.
Source: TEMS, author calculations.

Pho
to: K
irk
E. H
amilt
on
Economic and Statistical Analysis of Tourism in Uganda12
expenditure based on direct plus indirect plus induced impacts of expenditures on the economy. For the average of all tourists and the non–leisure tourists, this figure is 2.5, which is higher than the average export multiplier of 2.3 and the leisure tourist multiplier of 2.4. Again, tourist expenditures are strongly linked to the Ugandan economy.
For leisure tourists, two other figures stand out. First, the share of wages and salaries in the value added gener-ated is higher (27.8 percent) than the other categories of tourists. The second figure to note is the share of indirect taxes in value added, which again is higher (9.7 percent) than for other categories of tourists. Leisure tourists are therefore strongly linked to formal sector employment and the generation of government revenues.
As seen in table 2.7, the overall economic impacts of all tourists, broken down by tourist type, is substantial. First, expenditures by tourists who spent at least one night in Uganda are a large proportion of exports: 38 percent for all tourists and roughly 8.5 percent for lei-sure and cultural tourists. These expenditures in turn are substantial proportions of GDP: 2.2 percent for all tourists and 0.5 percent for leisure and cultural tourists. These expenditures generate value added amounting to 5.6 percent of GDP for all tourists and 1.2 percent for leisure and cultural tourists.
The half-million tourists who spent at least one night in Uganda in 2012 therefore made a major contribution to Uganda’s exports and to GDP.
Simulating the Impact of Policies That Increase Tourism
Fundamentally, there are two ways to increase tourism’s contribution to the Ugandan economy. The first is to attract more tourists to visit. The second is to persuade tourists to spend more while they are visiting Uganda. These goals require different policy interventions.
The TEMS shows that roughly 70,000 visitors to Uganda in 2012 were leisure tourists—these are the tourists who spent the most per visit. One obvious policy outcome to examine is the impact of attracting another 100,000 leisure tourists to visit Uganda. Table 2.8 breaks down the figures.

Economic Analysis of Ugandan Tourism Exports in 2012 13
Table 2.7: Total Economic Impact of All Tourists by Tourist Type, UGX Million
Leisure Business Spiritual Meetings Cultural Family Other All tourists
Total tourists 68,100 164,500 30,300 60,700 6,600 121,000 49,300 500,600
Final demand 221,496 384,821 65,755 151,453 20,899 175,166 74,150 1,091,746
Value added 542,510 969,368 162,542 384,459 51,657 435,860 184,562 2,726,707
Wages and salaries 150,594 247,676 43,567 97,273 13,723 114,888 48,579 715,056
Skilled and highly skilled 108,627 175,472 30,064 69,103 9,800 81,384 34,315 507,878
Semi-skilled and unskilled 41,967 72,204 13,502 28,170 3,923 33,503 14,264 207,178
Mixed income (NIUB) 237,348 436,499 73,440 173,604 22,979 194,515 82,360 1,219,096
Surplus 101,833 195,723 30,117 78,486 10,031 85,260 36,229 536,819
Indirect taxes 52,734 89,470 15,418 35,095 4,924 41,198 17,394 255,737
Memo: Imports 117,162 199,989 34,935 78,333 10,986 91,721 38,837 570,878
Memo: 2012 GDP 49,080,988
Memo: 2012 exports 2,861,546
Final demand, percentage of exports
7.74% 13.45% 2.30% 5.29% 0.73% 6.12% 2.59% 38.15%
Percentages of GDP
Final demand, percentage of GDP
0.45% 0.78% 0.13% 0.31% 0.04% 0.36% 0.15% 2.22%
Value added, percentage of GDP
1.11% 1.98% 0.33% 0.78% 0.11% 0.89% 0.38% 5.56%
Wages and salaries, percentage of GDP
0.31% 0.50% 0.09% 0.20% 0.03% 0.23% 0.10% 1.46%
Skilled and highly skilled 0.22% 0.36% 0.06% 0.14% 0.02% 0.17% 0.07% 1.03%
Semi-skilled and unskilled 0.09% 0.15% 0.03% 0.06% 0.01% 0.07% 0.03% 0.42%
Indirect taxes, percentage of GDP
0.11% 0.18% 0.03% 0.07% 0.01% 0.08% 0.04% 0.52%
Memo: Imports, percentage of GDP
0.24% 0.41% 0.07% 0.16% 0.02% 0.19% 0.08% 1.16%
NIUB: net income of unincorporated business.
Source: TEMS, author calculations

Economic and Statistical Analysis of Tourism in Uganda14
Table 2.8: Economic Impact of an Additional 100,000 Leisure Tourists, UGX Million
Number of leisure tourists 100,000
Final demand 325,251
Value added 796,637
Wages and salaries 221,137
Skilled and highly skilled 159,511
Semiskilled and unskilled 61,625
Mixed income (NIUB) 348,529
Surplus 149,535
Indirect taxes 77,436
Memo: Imports 172,044
Memo: 2012 GDP 49,080,988
Memo: 2012 exports 2,861,546
Final demand, percentage of exports 11.37%
Percentages of 2012 GDP
Final demand, percentage of GDP 0.66%
Value added, percentage of GDP 1.62%
Wages and salaries, percentage of GDP 0.45%
Skilled and highly skilled 0.32%
Semi-skilled and unskilled 0.13%
Indirect taxes, percentage of GDP 0.16%
Memo: Imports, percentage of GDP 0.35%
NIUB: net income of unincorporated business.
Source: TEMS, author calculations
Figure 2.3: Percentage of Tourists Who Do Not Visit Natural Sites Outside Kampala
happen is if tourists stay longer. As figure 2.3 shows, 75 percent of tourists who visit Uganda for business, meet-ings and conferences, and to visit friends and relatives do not visit any of the natural areas outside of Kampala.
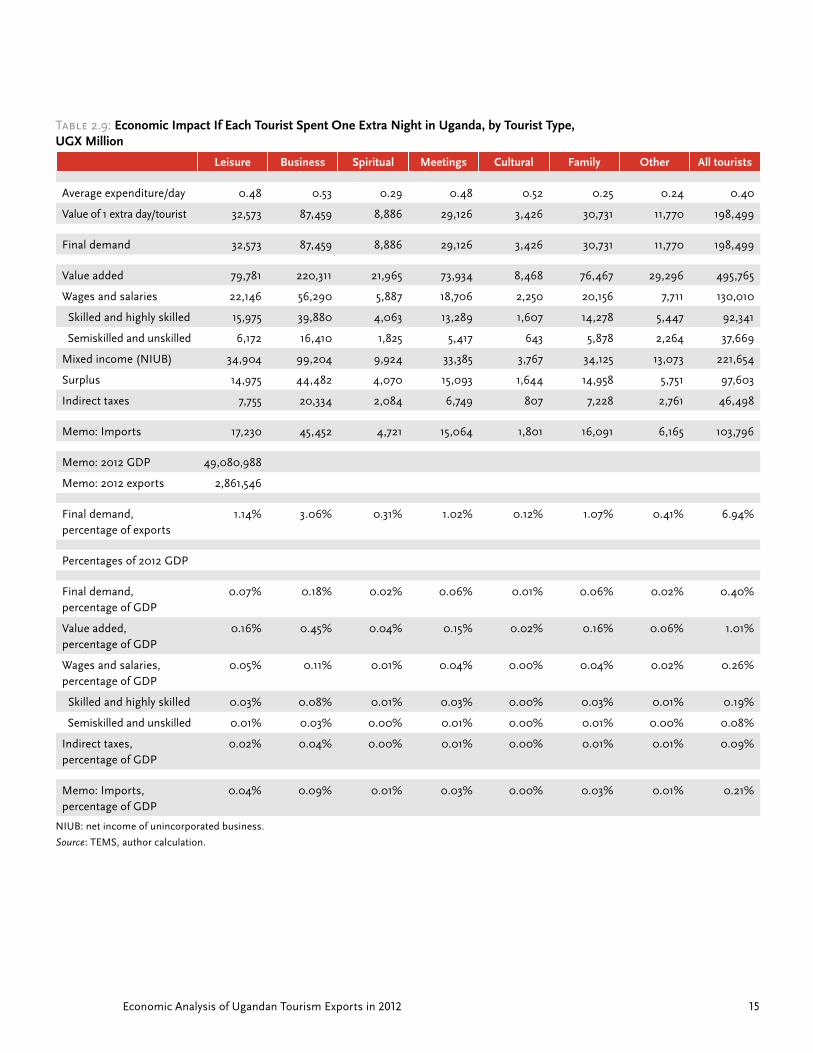
The impacts of policy reforms that make it easier and more affordable for tourists to extend their stay in Uganda are shown in table 2.9. The simulation answers the question, What would be the economic impact if every tourist who spent at least one night in Uganda in 2012 de-cided to extend their visit by one additional night?
As the table shows, the effect of extending all tourist stays by one night is substantial, adding 1 percent to GDP and 7 percent to total exports (1.25 percent of this attributable to leisure and cultural tourists). Wages and salaries in the formal sector would rise by UGX 130 billion, and indirect tax revenues would rise by nearly UGX 47 billion.
Source: TEMS.
The effects of this near tripling of leisure tourists would be substantial. Tourist expenditures would increase total exports by over 11.4 percent, and GDP would grow by 1.6 percent. Wages and salaries for skilled and highly skilled workers would rise by UGX 160 billion. Government would raise an additional UGX 77 billion in indirect taxes.
Turning to the question of persuading tourists to spend more while in Uganda, the most profitable way for this to
Perc
enta
ge
PercentageSuggested Tourism Improvements
0 10 20 30 40 50 60 70 80
Business
Meetings
Family
Spiritual
Other
Cultural
Leisure
Economic Analysis of Ugandan Tourism Exports in 2012 15
Table 2.9: Economic Impact If Each Tourist Spent One Extra Night in Uganda, by Tourist Type, UGX Million
Leisure Business Spiritual Meetings Cultural Family Other All tourists
Average expenditure/day 0.48 0.53 0.29 0.48 0.52 0.25 0.24 0.40
Value of 1 extra day/tourist 32,573 87,459 8,886 29,126 3,426 30,731 11,770 198,499
Final demand 32,573 87,459 8,886 29,126 3,426 30,731 11,770 198,499
Value added 79,781 220,311 21,965 73,934 8,468 76,467 29,296 495,765
Wages and salaries 22,146 56,290 5,887 18,706 2,250 20,156 7,711 130,010
Skilled and highly skilled 15,975 39,880 4,063 13,289 1,607 14,278 5,447 92,341
Semiskilled and unskilled 6,172 16,410 1,825 5,417 643 5,878 2,264 37,669
Mixed income (NIUB) 34,904 99,204 9,924 33,385 3,767 34,125 13,073 221,654
Surplus 14,975 44,482 4,070 15,093 1,644 14,958 5,751 97,603
Indirect taxes 7,755 20,334 2,084 6,749 807 7,228 2,761 46,498
Memo: Imports 17,230 45,452 4,721 15,064 1,801 16,091 6,165 103,796
Memo: 2012 GDP 49,080,988
Memo: 2012 exports 2,861,546
Final demand, percentage of exports
1.14% 3.06% 0.31% 1.02% 0.12% 1.07% 0.41% 6.94%
Percentages of 2012 GDP
Final demand, percentage of GDP
0.07% 0.18% 0.02% 0.06% 0.01% 0.06% 0.02% 0.40%
Value added, percentage of GDP
0.16% 0.45% 0.04% 0.15% 0.02% 0.16% 0.06% 1.01%
Wages and salaries, percentage of GDP
0.05% 0.11% 0.01% 0.04% 0.00% 0.04% 0.02% 0.26%
Skilled and highly skilled 0.03% 0.08% 0.01% 0.03% 0.00% 0.03% 0.01% 0.19%
Semiskilled and unskilled 0.01% 0.03% 0.00% 0.01% 0.00% 0.01% 0.00% 0.08%
Indirect taxes, percentage of GDP
0.02% 0.04% 0.00% 0.01% 0.00% 0.01% 0.01% 0.09%
Memo: Imports, percentage of GDP
0.04% 0.09% 0.01% 0.03% 0.00% 0.03% 0.01% 0.21%
NIUB: net income of unincorporated business.
Source: TEMS, author calculation.

Economic and Statistical Analysis of Tourism in Uganda16
Poverty Impacts
Because this analysis is based on tourist expenditures, it does not permit any direct analysis of the impacts of tourism, particularly of leisure and cultural tourism, on poverty in Uganda. A full analysis of tourism and poverty would require administration of a household survey mea-suring the sources of income and levels of well-being of households living adjacent to national parks compared with similar households who are not living in the vicinity of national parks.
The Uganda Tourism Sector Situational Assessment notes that human-wildlife conflict is an issue in areas around the national parks, which has a negative impact on household income and well-being. It also notes that, through a government program, 20 percent of park fees is shared with households in adjacent areas. This share of fees should be positive for household welfare, but the report suggests that fee income is not well targeted to maximize benefits.
The literature on household benefits from reforms in natural resource management8 suggests that the insti-tutional setting in which reforms take place is critical for increasing household welfare. Recent work in Zambia, for example,9 shows that the community share of the fees from trophy hunting in the Game Management Areas around natural parks has been largely captured by local elites, so the impacts on poor households are limited.
Whether households living adjacent to national parks benefit from the parks is important for reducing poaching and encroachment, which erode the quality of Uganda’s natural assets and undermine the basis for nature tour-ism. Government may wish to consider ways to reduce human-wildlife conflict, to compensate households for losses from these conflicts, and to reform the institu-tional structures that govern how communities benefit from park fees.
Policy Priorities That Follow from the Economic Analysis
Policies implemented by the Uganda Ministry of Tourism, Wildlife and Antiquities (MTWA) or by other ministries of the Ugandan government can contribute in four ar-eas to growth in the number of tourists visiting Uganda

Economic Analysis of Ugandan Tourism Exports in 2012 17
and their contribution to GDP. In one way or another, these areas all relate to the two basic ways to grow tour-ism’s contribution to the Ugandan economy: by attract-ing more tourists and persuading them to spend more money while staying in Uganda.
The following subsections deal with (1) marketing Uganda, (2) increasing the supply of tourism services, (3) removing bottlenecks, and (4) investing in natural assets. In many instances, the questions of increasing de-mand and increasing supply overlap and are interlinked.
Marketing Uganda
The TEMS asked departing tourists to write their sug-gestions for ways to improve the tourist experience in Uganda. Among the top five suggestions, 15 percent of tourists mentioned Web publicity and visitor information as weak points.
Although the Uganda Tourism Board (UTB) can use tra-ditional channels, such as posters, brochures, and trade shows, to market the country, and can build relationships with travel agencies in source markets, better use of social media can augment these channels. Expert advice on how to build a “new media” marketing strategy could be valu-able. At the same time, private sector actors in the tourism sector have a strong interest in promoting Ugandan tour-ism, which implies that increasing the supply of tourism services is also a key part of marketing Uganda.
Particular marketing benefits may be associated with high-profile foreign nature tourist operators, because
they would feature their Ugandan sites in their own mar-keting material. Attracting high-profile investors means meeting their standards for secure investments, and the net benefits to the economy may be partially diluted be-cause after-tax profits are repatriated. But investments by high-profile operators are important in signaling to other investors and to potential tourists that Uganda is a high-quality tourist destination.
Branding is also an issue in marketing Uganda. Other destinations have successfully created a brand and an im-age that appeals to potential tourists: think of “Incredible India” or “Malaysia Truly Asia.”
Increasing Supply
Assuming a successful marketing strategy that attracts more tourists to visit Uganda, a concomitant need exists for expansion of the supply of tourism services. To the extent that tour operators are also active in marketing Uganda, an expansion of tourism services can create a virtuous circle of increasing supply and demand.
Although MTWA has some important levers for increas-ing investments in the sector (see the next section, “Removing Bottlenecks”), many of the reforms needed hinge on the overall investment climate in Uganda. Doing Business 201310 shows that Uganda is in many ways typical of other African economies. There is a particular weak-ness with regard to starting a business (which requires 15 procedures, 33 days, and fees on the order of 77 percent of per capita income)11 and with protecting investors and trading across borders.

Economic and Statistical Analysis of Tourism in Uganda18
It is important to note that investment incentives for the tourism sector are typically not the best instrument for expanding supply, whether through tax breaks or explicit or implicit subsidies. One reason for this is that Uganda has unique assets—African landscapes and African wildlife—which can attract investors without subsidies or tax expen-ditures. The other reason is that investment incentives are very poor substitutes for reforming the overall business climate: the incentives are costly and of limited scope, whereas improving the business climate yields permanent increases in growth rates and the scope is economy-wide.
Government also needs to review whether tourism sec-tor–specific policies and regulations are inhibiting invest-ment in the sector—and to institute reforms as needed.
Removing Bottlenecks
Another of the top five suggestions from TEMS for im-proving the tourist experience is the question of trans-port, both quantity and quality, as was noted by 35 percent of respondents to the question on the survey. Investments in roads and consequent private sector in-vestments in supply can increase the affordability and convenience of getting to and traveling between nature tourism sites. This is essential for the growth of the over-all sector, and can facilitate tourists ‘adding on’ an ad-dition day to their trips. However, roads are expensive, and benefits beyond the tourism sector (e.g., access to markets for farmers) likely will need to be identified to justify public investments.
Another bottleneck is the current policy on concessions in national parks. Reforms will be needed to increase transparency for potential investors, creating a level play-ing field and providing sufficient security of tenure to at-tract private investors. The other side of this coin, howev-er, is ensuring high performance by concession holders.
Finally, capacity building on the skills required for customer service in the tourism sector is another important aspect of removing bottlenecks. Ten percent of TEMS respon-dents identified the quality of customer service in Uganda as an issue that detracts from the tourist experience—and this factor reduces word-of-mouth marketing by tourists who have visited Uganda. More generally, staff skills are an important ingredient in making the sector grow.
Investing in Natural Assets
As just noted, Uganda has unique natural assets that can yield economic benefits. And tourists responding to the TEMS rate the main national parks fairly highly, with 65 percent giving a score of excellent or very good.
As an emergent nature tourist destination, however, it is clear that Uganda has investment needs in its national parks and game reserves. These include investments in park infrastructure, machinery and equipment needed for operations, better protection of wildlife assets, and increasing staff skills.
Conclusions from the Economic Analysis
A few clear analytical messages result from the economic analysis of tourist expenditures:
■ Leisure and cultural tourists are an attractive target for government policy—they spend 30 to 100 percent more per visit than other tourists.
■ Spending by leisure tourists stimulates more GDP per dollar spent than the average traditional export in Uganda.
■ The overall impact of tourist expenditures in 2012 was large, contributing to 38 percent of exports and 5.6 percent of GDP, including indirect taxes amount-ing to 0.5 percent of GDP.
■ Attracting 100,000 additional leisure tourists to visit Uganda would add 11 percent to exports and 1.6 percent to GDP.
■ Persuading each tourist to spend one more night in Uganda would add 7 percent to exports and 1.0 percent to GDP.
Based on this analysis, there is an argument for govern-ment action to help the sector grow by using more ef-fective methods of marketing of Uganda, increasing the supply of tourist services, removing bottlenecks that limit the sector, and investing in natural assets.
Economic Analysis of Ugandan Tourism Exports in 2012 19
Endnotes
1. Note that, as defined in the TEMS questionnaire, leisure tourists are primarily nature tourists.
2. See Analysis of Uganda’s Tourism Expenditure and Motivation Survey (TEMS) 2012 (World Bank 2013) for details.
3. This is the most recent IO table at the time of writing. A more recent table would be preferable for the analysis, but patterns of goods and services and primary factors used in individual IO sectors tend to be fairly stable over time. The IO model analysis is therefore valid but could be improved with more recent IO data when they become available.
4. his is similar to, but more comprehensive than, the familiar value chain analysis used in many studies of the tourism sector.
5. It should be noted that the IO model assumes that households always consume the same array of goods and services in fixed proportion, with no substitution between different goods and services and no changes in the propensity to consume out of income. This is a strong assumption and requires some caution when interpreting the results of the model.
6. Unless otherwise specified, references to “tourists” in this text is limited to foreign tourists who spent at least one night in Uganda.
7. Table 2.4 reports the direct and indirect impacts on sectoral gross output, excluding the induced impacts of households spending wages and other income.
8. See World Bank, 2008, Poverty and Environment: Understanding linkages at the household level. The World Bank: Washington DC.
9. Bandyopadhyay, S., and G. Tembo, 2009. Household welfare and natural resource management around national parks in Zambia. World Bank, Policy Research Working Paper WPS4932.
10. Doing Business 2013. The World Bank: Washington DC.
11. As one Ugandan interlocutor for this report noted, “You really have to love Uganda to start a business here.”
Economic and Statistical Analysis of Tourism in Uganda20
The Expenditure and Motivation Survey 2012 (TEMS) was conducted in two waves under the supervision of the Uganda Bureau of Statistics (UBOS) and the Ministry of Tourism, Wildlife, and Antiquities (MTWA). The first wave covered low-season tourists, while the second wave focused on high-season tourists. Interviewers recorded responses regarding socioeconomic characteristics, purpose of visit, information sources, accommodation choices, means of transport, duration of stay, visits to tourist sites, and expenditures. This chapter highlights the main findings from the questionnaire.
Chapter 3Statistical Analysis of the Tourism Expenditure and Motivation Survey

Statistical Analysis of the Tourism Expenditure and Motivation Survey 21

Economic and Statistical Analysis of Tourism in Uganda22
Methodology and Survey Design
Interviewers asked non-Ugandan, nonresident visitors who stayed at least one night in Uganda a series of basic questions concerning their provenance, socioeconomic characteristics, purpose of visit, duration of stay, and sources of information about Uganda. Interviewers fur-ther asked for tourists’ accommodation and transporta-tion choices, level and distribution of expenditures, visits to specific tourism sites, and perceptions of quality.
The tourist survey comprised 3,908 interviews and the corresponding questionnaires. The sample size was large enough to yield sufficiently precise estimates at the group and most subgroup levels. The survey’s target population, re-ferred to as tourists, consisted of all non-Ugandan, nonresident visitors of Uganda who spent at least one night in the country, and departed through one of Uganda’s four largest migration posts. The interviews were con-ducted at three land border cross-ings (Katuna, Busia, Malaba) and Entebbe International Airport. The airport and the land border crossings account for more than 80 percent of all departures from Uganda.1
Interviewers collected tourists’ responses in two waves: a low-season wave with 1,680 respondents in April and May and a high-season wave with 2,228 respondents in October. For the purpose of the survey, low season is the period that runs from November to June, and high season is the period that runs from July to October. Each wave is assumed to be representative of the specific season.
Interviewers approached tourists at each of the four inter-view locations, and tourists were generally quite willing to participate in the survey. The overall response rate was 72 percent, and the interview location-specific response rates were respectively 73 percent (Entebbe), 77 percent (Katuna), 62 percent (Busia), and 65 percent (Malaba). Interviewers conducted 2,651 interviews in Entebbe, 515 in Katuna, 362 in Busia, and 316 in Malaba. Interviewers excluded tourists who were Ugandan residents or who had not stayed overnight in Uganda.
Tourists were interviewed shortly before leaving Uganda through the Entebbe International Airport or one of the three land border crossings. The four different interview locations and the two seasonal waves naturally stratify the target population into eight location- and season-specific strata (two seasonal strata for each of the four geographical strata). To obtain a representative picture of the eight strata, the interviewers tried to avoid selection bias by sampling randomly within each stratum.
The 3,908 questionnaires underwent consistency checks, typo checks, and checks for violations of random sam-pling. Whenever typos or inconsistent observations were detected, an effort was made to correct them. If a
plausible correction was impos-sible, inconsistent observations were discarded and typos were left unchanged. Observations were also discarded whenever they seemed to have been the result of nonrandom sampling (e.g., when the same interviewer on the same day conducted in-terviews with two tourists who reported rare but identical so-cioeconomic characteristics
and apparently traveled together). At the end of the cleaning procedure, 3,583 interviews remained: 1,572 low-season interviews and 2,011 high-season interviews. By location, 2,488, interviews were conducted in Entebbe, 456 in Katuna, 339 in Busia, and 300 in Malaba. It is as-sumed that the removal of inconsistent or nonrandom observations does not impact the random distribution on the strata level.
Once data cleaning was completed, the sample’s actual strata sizes became known. The combination of random sampling on the strata level and knowledge of the tar-get population’s strata sizes then allowed weighting of sample observations so that target population averages and distributions could be estimated. To accomplish this task, each stratum was assigned a weight corresponding to the proportion between stratum population size and stratum sample size.
Unfortunately, the exact sizes of the target population strata are not exactly known. The official statistics2 record
Interviewers asked
visitors who stayed at
least one night in Uganda
questions concerning their
provenance, socioeconomic
characteristics, purpose and
duration of stay, and sources
of information about Uganda.

Statistical Analysis of the Tourism Expenditure and Motivation Survey 23
nonresident departures of tourists independent of their length of stay. Consequently, tourists who do not stay overnight in Uganda are included in the official numbers. However, nonresident departures at land border cross-ings include a large number of visitors who do not stay overnight and are not part of the target population. To impute the missing numbers, it is assumed that about 80 percent of the Common Market of Eastern and Southern Africa (COMESA) citizens’ land border crossings derive from visitors who do not stay overnight. The whole pro-cess of calculating sample weights is outlined in annex 3A, while annex 3B outlines the estimation of the total tourist population.
Random sampling on the stratum level is crucial to obtain valid estimates of the target population charac-teristics. Successful random sampling on the stratum level implies that sample characteristics at the stratum level are close to strata characteristics at the target population level.
Nonresident departures from Entebbe are unlikely to con-tain many visitors who do not stay overnight. Therefore, direct comparison of Entebbe’s monthly nonresident de-parture numbers with selected sample characteristics of the low- or high-season waves should give an indication of the quality of random sampling. Unfortunately, the interpretation of the numbers is not clear.
Based on 2012 migration statistics,3 it seems that European and North American tourists have been overs-ampled (e.g., in May in Entebbe, they made up 34.8 per-cent and 25.3 percent of visitors but account for only 21.5 percent and 15.6 percent in the corresponding migration departure statistics), whereas African tourists have been undersampled (e.g., in May in Entebbe, they made up 33.6 percent of visitors and account for 39.5 percent in the migration statistics). However, the migration statistics classify a large number of departing visitors as “Others & Not Stated” (23.4 percent of all Entebbe departures in May), while Asian, Latin American, and Australian tour-ists account for only 6.3 percent of the sample. If the majority of visitors in this category did not state their nationality, it is plausible that a large number of African, European, and North American visitors remained unclas-sified. In principle, this effect can account for all dis-crepancies between sample and immigration statistics.
Consequently, neither the Entebbe subsample nor the even harder to interpret subsamples from the land border crossings allows a definite assessment of the quality of random sampling. Therefore, and because attempts to correct for the potential discrepancies through reweight-ing did not substantially change the statistical findings, it is subsequently assumed—at least, as a first approxi-mation—that the random sampling assumption holds for strata levels.

Economic and Statistical Analysis of Tourism in Uganda24
Origin of Tourists
Tourists come to Uganda from all over the world. Figure 3.1 shows how tourists’ countries of residence are distrib-uted around the globe. The four countries visitors claim as their residence most frequently are Kenya, the United States, the United Kingdom, and Rwanda. Combined they account for more than 50 percent of all visitors.
These four countries represent the three main continents where visitors to Uganda come from. Figure 3.2 shows that most tourists have their country of residence in Africa (45 percent), Europe (29 percent), or North America (18 percent). Tourists also reside in Asia (4 percent), Australia (3 percent), and South America (<1 percent). A large number of Asian tourists (40 percent) arrive from only three countries: India, Pakistan, and Bangladesh.
A closer look at the distribution of tourists’ countries of origin in figure 3.3 reveals that a large portion of African tourists come from Uganda’s neighboring countries (17 per-cent from Kenya, 10 percent from Rwanda, 4 percent from Tanzania, 3 percent from South Sudan) and South Africa (4 percent). On the other hand, many European tourists live in the northern part of Europe—the United Kingdom (11 per-cent), Netherlands (4 percent), and Germany (4 percent).
Tourist Arrival and Departure
Figure 3.4 shows the distribution of airlines tourists use. Air Kenya, Uganda Airways, South African Airways, and Precision Air are the most frequently used African airlines and carry about 34 percent of the tourists. KLM Royal Dutch Airlines, British Airways, and Brussels Airlines are the largest non-African airlines. Together they carry about 35 percent of Ugandan tourists. United Nations–operated flights transport about 4 percent of Ugandan tourists.
During their trip, 40 percent of tourists visit other—main-ly neighboring—African countries. About 17 percent of tourists visit more than one other African country. Figure 3.5 maps the percentage of tourists who visit a specific African country. The most commonly visited countries are Kenya (20 percent of all tourists), Tanzania (12 per-cent), Rwanda (10 percent), the Democratic Republic of Congo (5 percent), South Sudan (4 percent), and South Africa (4 percent).
Figure 3.2: Tourists’ Continents of Residence
Figure 3.1: Tourists’ Countries of Residence (Percentage of Total Tourist Population)
0 10 20 30 40 50
Percent
Australia
South America
North America
Europe
Africa
Asia
Reg
ion
of r
esid
ence
Percentage
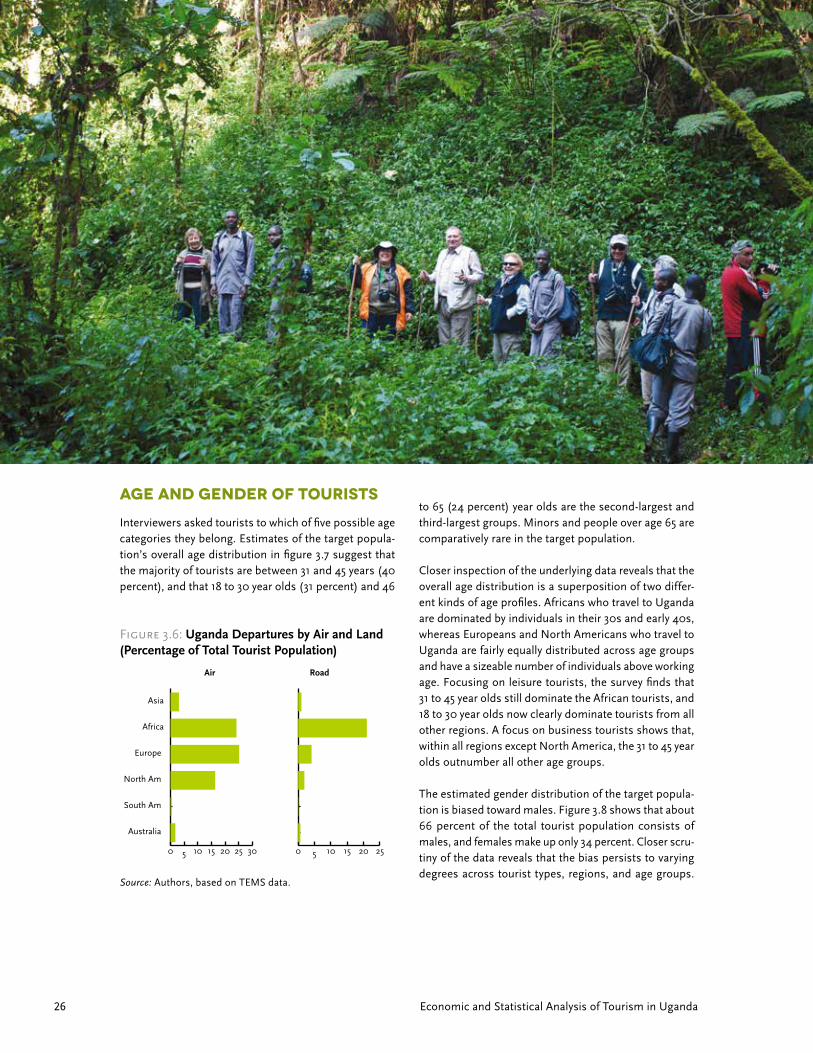
The surveyed tourists left Uganda through the airport in Entebbe or through one of the three land border cross-ings. Extrapolating to the target population, about 71 percent of tourists depart from Entebbe airport, and 29 percent depart from the land borders in Katuna (10 percent), Busia (12 percent), and Malaba (7 percent).4 Figure 3.6 shows that African tourists in the target population depart by air about as often as they depart by land, whereas all other tourists depart mainly by air. Consequently, the vast majority of tourists who leave Uganda by land are African residents.
Source: Authors, based on TEMS data.
Percentage of tourists residing in country16%0%

Statistical Analysis of the Tourism Expenditure and Motivation Survey 25
Figure 3.4: Airlines Tourists during Their Trip (Percentage of Tourists Who Travel by Air)
Figure 3.5: Tourists’ Visits to Other African Countries as Part of Uganda Trip (Percentage of Total Tourist Population)
Figure 3.3: Tourists’ Countries of Residence in Africa and Europe (Percentage of Total Tourist Population)
Percentage
0 5 10 15 20
Percent
United NationsUganda AirwaysTurkish Airways
South African AirwaysQatar Airways
Precision AirMission Aviation Fellowship
KLM Royal Dutch AirlinesGulf Air
EmiratesEgypt AirEagle Air
Delta AirlinesCanadian Regional Jet
Brussels AirlinesBritish Airways
Air RwandaAir Kenya
Air FranceAir Canada
Aero Link540
Whi
ch a
irlin
e di
d yo
u us
e?
Source: Authors, based on TEMS data.
Percentage of tourists residing in countryPercentage of tourists residing in country16%16% 0%0%
20%0%Percentage visiting
Economic and Statistical Analysis of Tourism in Uganda26
Age and Gender of Tourists
Interviewers asked tourists to which of five possible age categories they belong. Estimates of the target popula-tion’s overall age distribution in figure 3.7 suggest that the majority of tourists are between 31 and 45 years (40 percent), and that 18 to 30 year olds (31 percent) and 46
Figure 3.6: Uganda Departures by Air and Land (Percentage of Total Tourist Population)
0 5 10 15 20 25 30
Australia
South Am
North Am
Europe
Africa
Asia
0 5 10 15 20 25
RoadAir
to 65 (24 percent) year olds are the second-largest and third-largest groups. Minors and people over age 65 are comparatively rare in the target population.
Closer inspection of the underlying data reveals that the overall age distribution is a superposition of two differ-ent kinds of age profiles. Africans who travel to Uganda are dominated by individuals in their 30s and early 40s, whereas Europeans and North Americans who travel to Uganda are fairly equally distributed across age groups and have a sizeable number of individuals above working age. Focusing on leisure tourists, the survey finds that 31 to 45 year olds still dominate the African tourists, and 18 to 30 year olds now clearly dominate tourists from all other regions. A focus on business tourists shows that, within all regions except North America, the 31 to 45 year olds outnumber all other age groups.
The estimated gender distribution of the target popula-tion is biased toward males. Figure 3.8 shows that about 66 percent of the total tourist population consists of males, and females make up only 34 percent. Closer scru-tiny of the data reveals that the bias persists to varying degrees across tourist types, regions, and age groups.
Source: Authors, based on TEMS data.

Statistical Analysis of the Tourism Expenditure and Motivation Survey 27
Only cultural tourists, Australian tourists, and tourists in their 20s show a balanced gender distribution.
The relative discrepancy between male and female tourists is partly due to regional differences. More than three-quarters of African and Asian tourists are male (a ratio of more than 3:1), whereas males and females are more equally distributed across Australian, European, and North American tourists (a ratio of less than 3:2).
Size of Tourist Groups
Tourists sometimes travel in groups consisting of fam-ily members, company colleagues, or friends who have booked the same package tour. Figure 3.9 illustrates that overnight tourists to Uganda travel most of the time alone or in small groups. The large majority of tourists travel alone (62 percent), and 20 percent travel as couples. Groups of three account for 5 percent, and groups of four account for 3 percent of all tourists. Virtually all tourists (99 percent) travel in groups smaller than 15 people.
Closer study of the survey data shows that the size distri-butions differ across tourist types and across the regions where tourists come from. Leisure, spiritual, and cultural tourists are nearly as likely to travel in couples as they are to travel alone. All other tourist types are far more likely to travel alone. Asian and African tourists are more likely to declare they travel alone (around 75 percent of Asian and African tourists do) than are European, North American, and Australian tourists. The latter are more likely to travel in groups, and only around 55 percent of them travel alone.
Tourist’s Main Purpose of Visit
The reasons tourists travel to Uganda are diverse. Interviewers asked tourists for the main purpose of their trip and classified tourists according to one of seven main categories: leisure, recreation, and holidays; business and professional; spiritual and religious; meetings and confer-ences; cultural tourism; family and relatives; and a residual category called “other.” Three of the seven categories (lei-sure, meetings, other) contain subcategories, and tour-ists could pick one or more to further describe the main
Figure 3.7: Age Composition of Tourists Figure 3.8: Gender Composition of Tourists
Figure 3.9: Size Distribution of Tourist Groups
0 5 10 15 20 25 30 35 40
Percent
Above 65
46–65
31–45
18–30
Under 18
Age
gro
up
Percentage
0 10 20 30 40 50 60 70 80
proportions
Female
Male
Sex
Percentage
Percentage
Num
ber
of p
eopl
e in
par
ty
0 10 20 30 40 50 60
Percent
15
14
13
12
11
10
9
8
7
6
5
4
3
2
1
Source: Authors, based on TEMS data. Source: Authors, based on TEMS data.
Source: Authors, based on TEMS data.

Economic and Statistical Analysis of Tourism in Uganda28
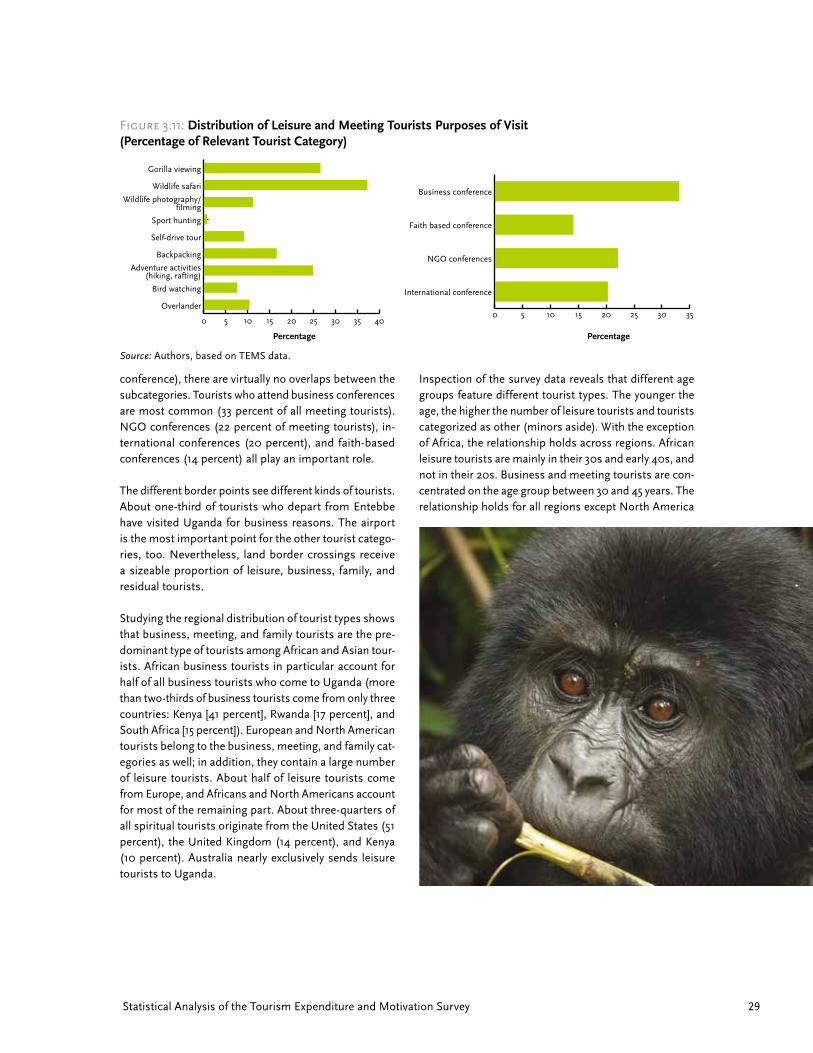
photography, sport hunting, self-drive tours, backpacker experiences, adventure activities, bird watching, and overlander tours. Leisure tourists can choose more than one of the nine subcategories, and about 25 percent ac-tually do. Figure 3.11 illustrates the findings. Wildlife sa-fari and gorilla viewing are most popular among leisure tourists (37 percent and 27 percent of leisure tourists pursue these activities), followed by adventure activities and backpacking (25 percent and 17 percent respective-ly). Sport hunting in Uganda is an exotic activity among leisure tourists, but the remaining categories of nature tourism are fairly common (about 10 percent each).
Statistical techniques allow leisure tourists to be grouped on the basis of the leisure activities they pursue.5 The survey groups tourists into two clusters: the first cluster consists of leisure tourists who are backpacking, and the second cluster consists of all other leisure tourists. The differences between the two clusters are real and sizeable. More than 75 percent of backpackers are less than 30 years old, but less than 40 percent of the other leisure tourists are under 30. Backpackers are much less likely to engage in gorilla viewing (12 percent versus 30 percent of other leisure tourists) and wildlife safaris (24 percent versus 40 percent). They are more likely to participate in adventure activities (35 percent versus 23 percent). Moreover, they stay longer than other leisure tourists (23 days on aver-age versus 14 days) and spend less in total ($1,017 versus $1,369) and per day ($72 versus $171).
Even though meeting and conference tourists could belong to multiple subcategories (business conference, NGO conference, faith-based conference, international
Figure 3.10: Distribution of Tourists’ Main Purpose of Visit (Percentage of Total Tourist Population)
purpose of their trip. Figure 3.10 displays the estimated population distribution of tourists’ main purpose of visit.
The majority of tourists travel for business purposes (31 percent). Family (20 percent) and leisure (18 percent) are tourists’ second- and third-most frequent purpose for travel. Twelve percent of tourists come (often as vol-unteers) for research, nongovernmental organization (NGO) work, or education, and they fit into the residual category. Meetings and conferences attract about 11 percent of tourists, spiritual reasons motivate about 5 percent, and the fairly recent phenomenon of cultural tourism draws about 2 percent.
The survey lists nine activities for which leisure tourists come to Uganda: gorilla viewing, wildlife safaris, wildlife
0 5 10 15 20 25 30 35
Percent
Other
Family and relatives
Cultural tourism
Meetings and conferences
Spiritualand religious
Business and professional
Leisure, recreation,and holidays
Mai
n pu
rpos
e of
vis
it
Percentage
Source: Authors, based on TEMS data.
Statistical Analysis of the Tourism Expenditure and Motivation Survey 29
conference), there are virtually no overlaps between the subcategories. Tourists who attend business conferences are most common (33 percent of all meeting tourists). NGO conferences (22 percent of meeting tourists), in-ternational conferences (20 percent), and faith-based conferences (14 percent) all play an important role.
The different border points see different kinds of tourists. About one-third of tourists who depart from Entebbe have visited Uganda for business reasons. The airport is the most important point for the other tourist catego-ries, too. Nevertheless, land border crossings receive a sizeable proportion of leisure, business, family, and residual tourists.
Studying the regional distribution of tourist types shows that business, meeting, and family tourists are the pre-dominant type of tourists among African and Asian tour-ists. African business tourists in particular account for half of all business tourists who come to Uganda (more than two-thirds of business tourists come from only three countries: Kenya [41 percent], Rwanda [17 percent], and South Africa [15 percent]). European and North American tourists belong to the business, meeting, and family cat-egories as well; in addition, they contain a large number of leisure tourists. About half of leisure tourists come from Europe, and Africans and North Americans account for most of the remaining part. About three-quarters of all spiritual tourists originate from the United States (51 percent), the United Kingdom (14 percent), and Kenya (10 percent). Australia nearly exclusively sends leisure tourists to Uganda.
Inspection of the survey data reveals that different age groups feature different tourist types. The younger the age, the higher the number of leisure tourists and tourists categorized as other (minors aside). With the exception of Africa, the relationship holds across regions. African leisure tourists are mainly in their 30s and early 40s, and not in their 20s. Business and meeting tourists are con-centrated on the age group between 30 and 45 years. The relationship holds for all regions except North America
Figure 3.11: Distribution of Leisure and Meeting Tourists Purposes of Visit (Percentage of Relevant Tourist Category)
0 5 10 15 20 25 30 35 40
Overlander
Bird watching
Adventure activities(hiking, rafting)
Backpacking
Self-drive tour
Sport hunting
Wildlife photography/filming
Wildlife safari
Gorilla viewing
0 5 10 15 20 25 30 35
International conference
NGO conferences
Faith based conference
Business conference
Percentage Percentage
Source: Authors, based on TEMS data.
Economic and Statistical Analysis of Tourism in Uganda30
where business tourists belong to the oldest preretire-ment age group.
Information Sources about Uganda
Tourists who consider a visit to Uganda inform them-selves before they make decisions about the trip in general and about accommodation, restaurants, sites to visit, and entertainment in particular. The interview-ers asked tourists about their main information source. Personal contacts with friends and relatives are tourists’ most important information source. Figure 3.12 shows that about 52 percent of tourists rely mainly on these contacts when they make travel-related decisions. They rely far less often on third-party sources like the Web (14 percent of tourists), the media, or guidebooks and travel agencies. Among tourists who use mainly the Web to inform themselves, the website of the Uganda Tourism Board (UTB) is very popular and functions as the main information source for about 32 percent of them—that is, about 5 percent of all tourists use the UTB website as their main source of information.
The underlying data show that the main source of infor-mation varies with the type of tourist. Leisure tourists draw as much on the Web, guidebooks, and travel agen-cies as they rely on personal contacts. The relationship becomes more pronounced when tourists visit a large number of nature tourism sites. All other tourist types rely mainly on friends and partly on information from the Web. Business and meeting tourists complement their information from personal contacts with local media, print media, guidebooks, and travel agencies. Business tourists apparently are the only ones who use trade fairs to some extent.
The underlying data further show that some regional differences exist. African tourists differ in that they use personal contacts far more than do tourists from other regions. At the same time, they use the Web less frequently and local media like newspapers, radio, or television more frequently as their main source of infor-mation. The main sources of information do not differ much across other regions. Australia stands out in that travel agents serve as the main source of information to 27 percent of Australian tourists. Variation of the main

Statistical Analysis of the Tourism Expenditure and Motivation Survey 31
sources of information is minor across age groups and largely reflects regional differences in age profiles.
Number of Nights Spent
Tourists’ duration of stay is very diverse. The duration of stay can range from an overnight stay to a yearlong one. Tourists spend an average of 17 nights in Uganda. Because of tourists who stay for very long periods of time (e.g., long backpacker trips, lengthy work-related assignments, religious missions, extended family visits, or monthlong scientific volunteering), the average gives a misleading picture of the typical duration of stay. Half of all tourists do not stay longer than 6 days, 80 percent do stay not longer than 15 days, and about 90 percent do not stay longer than 1 month. For the subpopulation of tourists who do not stay longer than 15 days, figure 3.13 shows the distribution of number of nights spent. The distribution has a mode at 3 nights and a long tail; it peaks at weeklong and monthlong stays.
Further inspection of the survey data reveals that the duration of stay varies strongly with the main purpose of visit. Business and meeting tourists rarely stay lon-ger than a week (only about 25 percent do). Those who stay longer usually spend multiple weeks or months in Uganda. Leisure, spiritual, and cultural tourists, on the other hand, are most likely to stay longer than 1 week (more than 50 percent do). Leisure and cultural tourists who stay longer than 1 month are very rare (less than 8 percent), whereas stays of spiritual tourists that last
Figure 3.12: Distribution of Main and Web Information Sources (Percentage of Total Tourist Population)
Figure 3.13: Distribution of Number of Nights Spent in Uganda (Percentage of Subpopulation Who Stays 1 Month or Less)
longer than a month occur more frequently (about 14 percent). Family tourists’ duration of stays last longer than those of business tourists and shorter than those of leisure tourists. Other tourists’ duration of stay can be very long (27 percent of other tourists stay longer than a month). Table 3.1 shows the average and median duration of stay for all tourists and the average duration of stay of tourists who stay not more than 15 days.
Closer inspection of the survey data reveals that the re-gion-specific distributions of duration of stay are partly a reflection of the region-specific mix of tourist types (e.g., African tourists are dominated by business tourists) and partly the result of geographic distance, country-specific holiday regulations, and other factors. The former effect
0 10 20 30 40 50 60
Other specify
Trade fair
Airline (magazine)
Friends, relatives
Radio, TV
Web
Travel guidebooks
Newspaper, magazines, brochures
Travel agent,tour operator
0 10 20 30 40 50 60 70 80
Web other website
Web www.visituganda.com
Percentage Percentage
Perc
enta
ge
Number of nights spent Percent"1 8.0"2 10.5"3 10.7"4 8.4"5 7.1"6 5.8"7 8.9"8 2.8"9 2.8"10 3.9"11 1.2"12 2.3"13 1.0"14 4.7"15 1.3"16 0.5"17 0.7"18 0.8"19 0.5"20 0.7"21 2.0"22 0.5"23 0.3"24 0.3"25 0.5"26 0.1"27 0.3"28 0.5"29 0.1"30 2.4"31 0.2
0
2
4
6
8
10
12Percent
31302928272625242322212019181716151413121110987654321
Number of nights spent in Uganda
Source: Authors, based on TEMS data.
Source: Authors, based on TEMS data.

Economic and Statistical Analysis of Tourism in Uganda32
can be eliminated if the same tourist type is compared across different regions.
Furthermore, the age-specific distributions of number of nights spent are largely determined by the region-specific age compositions. For example, tourists in their 30s and early 40s are mainly African and Asian business tourists, and consequently, the distribution of duration of stay shows the pattern of African and Asian business tour-ists. Tourists in their 20s and retirees have the longest stays (26 days and 19 days respectively; those numbers compare with 12 days for 31–45 years olds and 14 days for 45–65 year olds).
Accommodation
Before or during their trip to Uganda, tourists must de-cide where they want to spend their nights. If they do not stay in private homes, they can choose between urban or nonurban settings and expensive or inexpensive ac-commodation types. Figure 3.14 demonstrates that most tourists stay in local hotels, inexpensive motels/inns/guesthouses, and private homes. Nonurban accommo-dation options, such as lodges, cottages, and campsites, and the expensive international hotels are less common accommodation choices.
The average number of nights tourists stay in a specific accommodation option is a good measure for the typical duration of stay in a given accommodation type (disre-garding tourists who never stay in the specific accommo-dation type). Figure 3.15 shows the resulting conditional averages. It suggests that tourists first choose between urban hotel stays and nonurban nature tourism accom-modation, and less expensive the option, the longer the stay tends to be. Private home stays are longest, followed by hotel stays (hostel, motel, local, international) and nature tourism accommodation (campsite, cottage, sa-fari lodge). Other accommodation mainly includes rare dormitory stays or long-term apartment rentals.
Studying the survey data further reveals that the average number of nights spent in each accommodation type dif-fers among tourist types. Business and meeting tourists are the most frequent users of international and local hotels. Leisure and cultural tourists are the near exclu-sive users of nature tourism accommodation (lodges,
Table 3.1: Averages and Median of Number of Nights Spent by Tourist Type (in Days)
Figure 3.14: Percentage of Tourists Staying in Different Accommodation Options
Figure 3.15: Typical Number of Nights Spent in Different Accommodation Options (Averages Conditional on Stay)
Main purpose of visit
Average Median 15 Days (average)
Leisure 15 8 7
Business 14 4 5
Spiritual 24 9 7
Meetings 10 5 5
Cultural 9 7 7
Family 15 7 6
Other 35 14 6
0 10 20 30 40 50
Percent
Other
Hostel
Private home
Campsite
Cottages and bandas
Safari lodge, luxurytented camp
Motel, inn, guesthouse
Local hotel
International hotel
Acc
omod
atio
n ty
pe
Percentage
0 5 10 15 20 25 30
Average
Other
Hostel
Private home
Campsite
Cottages and bandas
Safari lodge, luxury tented camp
Motel, inn, guesthouse
Local hotel
International hotel
Acc
omod
atio
n ty
pe
Average number of nights
Source: Authors, based on TEMS data.
Source: Authors, based on TEMS data.
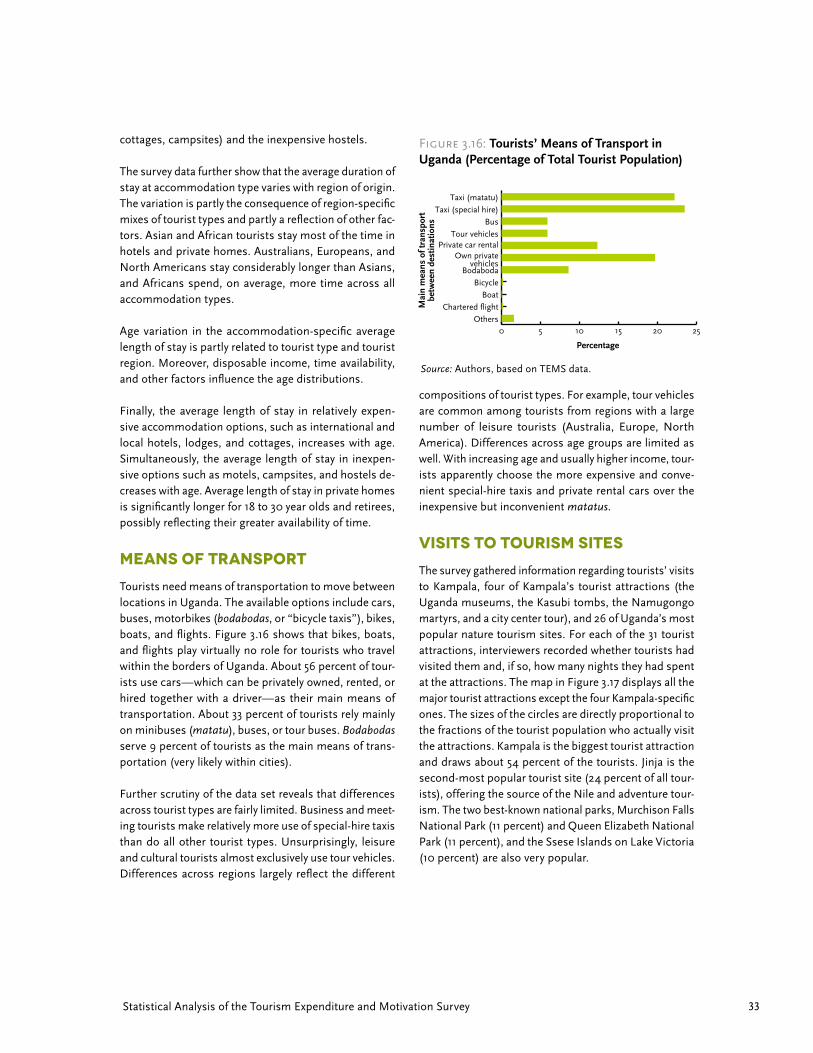
Statistical Analysis of the Tourism Expenditure and Motivation Survey 33
cottages, campsites) and the inexpensive hostels.
The survey data further show that the average duration of stay at accommodation type varies with region of origin. The variation is partly the consequence of region-specific mixes of tourist types and partly a reflection of other fac-tors. Asian and African tourists stay most of the time in hotels and private homes. Australians, Europeans, and North Americans stay considerably longer than Asians, and Africans spend, on average, more time across all accommodation types.
Age variation in the accommodation-specific average length of stay is partly related to tourist type and tourist region. Moreover, disposable income, time availability, and other factors influence the age distributions.
Finally, the average length of stay in relatively expen-sive accommodation options, such as international and local hotels, lodges, and cottages, increases with age. Simultaneously, the average length of stay in inexpen-sive options such as motels, campsites, and hostels de-creases with age. Average length of stay in private homes is significantly longer for 18 to 30 year olds and retirees, possibly reflecting their greater availability of time.
Means of Transport
Tourists need means of transportation to move between locations in Uganda. The available options include cars, buses, motorbikes (bodabodas, or “bicycle taxis”), bikes, boats, and flights. Figure 3.16 shows that bikes, boats, and flights play virtually no role for tourists who travel within the borders of Uganda. About 56 percent of tour-ists use cars—which can be privately owned, rented, or hired together with a driver—as their main means of transportation. About 33 percent of tourists rely mainly on minibuses (matatu), buses, or tour buses. Bodabodas serve 9 percent of tourists as the main means of trans-portation (very likely within cities).
Further scrutiny of the data set reveals that differences across tourist types are fairly limited. Business and meet-ing tourists make relatively more use of special-hire taxis than do all other tourist types. Unsurprisingly, leisure and cultural tourists almost exclusively use tour vehicles. Differences across regions largely reflect the different
compositions of tourist types. For example, tour vehicles are common among tourists from regions with a large number of leisure tourists (Australia, Europe, North America). Differences across age groups are limited as well. With increasing age and usually higher income, tour-ists apparently choose the more expensive and conve-nient special-hire taxis and private rental cars over the inexpensive but inconvenient matatus.
Visits to Tourism Sites
The survey gathered information regarding tourists’ visits to Kampala, four of Kampala’s tourist attractions (the Uganda museums, the Kasubi tombs, the Namugongo martyrs, and a city center tour), and 26 of Uganda’s most popular nature tourism sites. For each of the 31 tourist attractions, interviewers recorded whether tourists had visited them and, if so, how many nights they had spent at the attractions. The map in Figure 3.17 displays all the major tourist attractions except the four Kampala-specific ones. The sizes of the circles are directly proportional to the fractions of the tourist population who actually visit the attractions. Kampala is the biggest tourist attraction and draws about 54 percent of the tourists. Jinja is the second-most popular tourist site (24 percent of all tour-ists), offering the source of the Nile and adventure tour-ism. The two best-known national parks, Murchison Falls National Park (11 percent) and Queen Elizabeth National Park (11 percent), and the Ssese Islands on Lake Victoria (10 percent) are also very popular.
Figure 3.16: Tourists’ Means of Transport in Uganda (Percentage of Total Tourist Population)
0 5 10 15 20 25
Percent
Others
Chartered flight
Boat
Bicycle
Bodaboda
Own privatevehicles
Private car rentalTour vehicles
Bus
Taxi (special hire)
Taxi (matatu)
Mai
n m
eans
of t
rans
port
betw
een
dest
inat
ions
Percentage
Source: Authors, based on TEMS data.
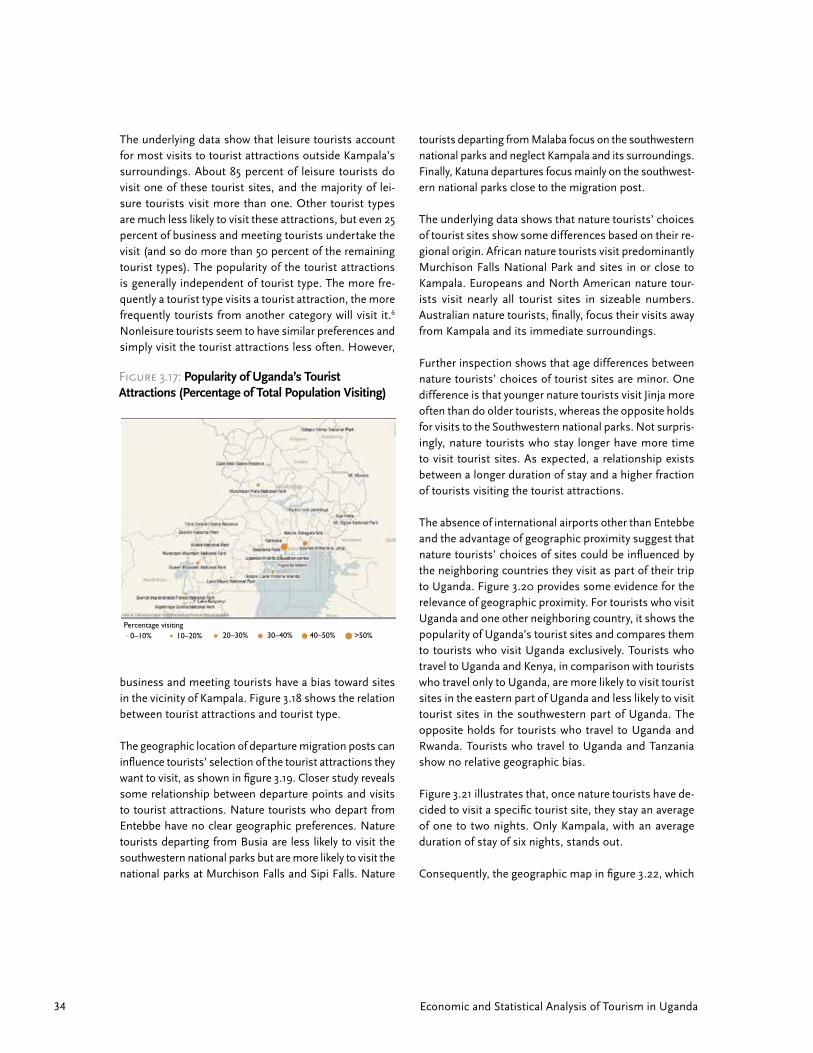
Economic and Statistical Analysis of Tourism in Uganda34
The underlying data show that leisure tourists account for most visits to tourist attractions outside Kampala’s surroundings. About 85 percent of leisure tourists do visit one of these tourist sites, and the majority of lei-sure tourists visit more than one. Other tourist types are much less likely to visit these attractions, but even 25 percent of business and meeting tourists undertake the visit (and so do more than 50 percent of the remaining tourist types). The popularity of the tourist attractions is generally independent of tourist type. The more fre-quently a tourist type visits a tourist attraction, the more frequently tourists from another category will visit it.6 Nonleisure tourists seem to have similar preferences and simply visit the tourist attractions less often. However,
tourists departing from Malaba focus on the southwestern national parks and neglect Kampala and its surroundings. Finally, Katuna departures focus mainly on the southwest-ern national parks close to the migration post.
The underlying data shows that nature tourists’ choices of tourist sites show some differences based on their re-gional origin. African nature tourists visit predominantly Murchison Falls National Park and sites in or close to Kampala. Europeans and North American nature tour-ists visit nearly all tourist sites in sizeable numbers. Australian nature tourists, finally, focus their visits away from Kampala and its immediate surroundings.
Further inspection shows that age differences between nature tourists’ choices of tourist sites are minor. One difference is that younger nature tourists visit Jinja more often than do older tourists, whereas the opposite holds for visits to the Southwestern national parks. Not surpris-ingly, nature tourists who stay longer have more time to visit tourist sites. As expected, a relationship exists between a longer duration of stay and a higher fraction of tourists visiting the tourist attractions.
The absence of international airports other than Entebbe and the advantage of geographic proximity suggest that nature tourists’ choices of sites could be influenced by the neighboring countries they visit as part of their trip to Uganda. Figure 3.20 provides some evidence for the relevance of geographic proximity. For tourists who visit Uganda and one other neighboring country, it shows the popularity of Uganda’s tourist sites and compares them to tourists who visit Uganda exclusively. Tourists who travel to Uganda and Kenya, in comparison with tourists who travel only to Uganda, are more likely to visit tourist sites in the eastern part of Uganda and less likely to visit tourist sites in the southwestern part of Uganda. The opposite holds for tourists who travel to Uganda and Rwanda. Tourists who travel to Uganda and Tanzania show no relative geographic bias.
Figure 3.21 illustrates that, once nature tourists have de-cided to visit a specific tourist site, they stay an average of one to two nights. Only Kampala, with an average duration of stay of six nights, stands out.
Consequently, the geographic map in figure 3.22, which
Figure 3.17: Popularity of Uganda’s Tourist Attractions (Percentage of Total Population Visiting)
business and meeting tourists have a bias toward sites in the vicinity of Kampala. Figure 3.18 shows the relation between tourist attractions and tourist type.
The geographic location of departure migration posts can influence tourists’ selection of the tourist attractions they want to visit, as shown in figure 3.19. Closer study reveals some relationship between departure points and visits to tourist attractions. Nature tourists who depart from Entebbe have no clear geographic preferences. Nature tourists departing from Busia are less likely to visit the southwestern national parks but are more likely to visit the national parks at Murchison Falls and Sipi Falls. Nature
Percentage visiting0–10% 10–20% 20–30% 30–40% 40–50% >50%

Statistical Analysis of the Tourism Expenditure and Motivation Survey 35
Figure 3.18: Popularity of Tourist Attractions by Tourist Type (Percentage Visiting of Total Population)
depicts the unconditional average number of nights tour-ists stay at selected sites, is nearly a mirror image of the geographic map in figure 3.17, which shows the popularity of tourist sites.
Package Tours
Figure 3.23 shows that about 7 percent of all tourists are package tourists. About 25 percent of package tourists
buy their package inside Uganda after their arrival; nearly all the rest (74 percent) buy it outside of Uganda before the beginning of their trip. A tiny minority (1 percent) buys packages outside and inside Uganda. The fact that the vast majority of package tourists buy their packages outside Uganda opens the possibility of revenue leakag-es—that is, the possibility that revenue accrues to other countries as a consequence of tour arrangements made outside the country. In principle, the Ugandan tourism
Percentage visiting
Other
Meeting
Leisure
Cultural
Business
Family
Spiritual
0–10% 10–20%
20–30% 30–40%
40–50% >50%
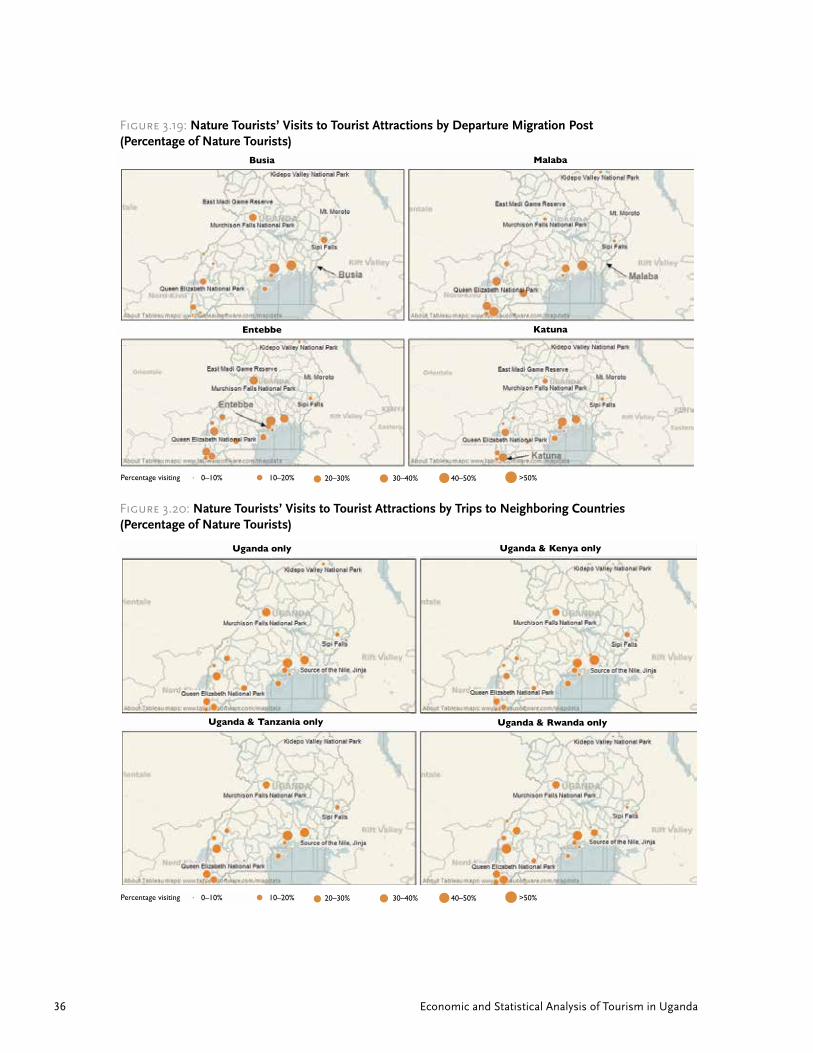
Economic and Statistical Analysis of Tourism in Uganda36
Figure 3.19: Nature Tourists’ Visits to Tourist Attractions by Departure Migration Post (Percentage of Nature Tourists)
Figure 3.20: Nature Tourists’ Visits to Tourist Attractions by Trips to Neighboring Countries (Percentage of Nature Tourists)
Percentage visiting
Percentage visiting
Busia
Entebbe
Uganda & Tanzania only
Malaba
Katuna
Uganda & Rwanda only
20–30% 30–40%
20–30% 30–40%
40–50% >50%
40–50% >50%
0–10% 10–20%
0–10% 10–20%
Uganda only Uganda & Kenya only

Statistical Analysis of the Tourism Expenditure and Motivation Survey 37
Figure 3.21: Nature Tourists’ Typical Number of Nights Spent at Different Tourist Sites
Figure 3.22: Nature Tourists’ Average Number of Nights Spent at Different Tourist Sites
sector could generate immediate revenue by arranging package tours that are sold outside Uganda.
Further scrutinizing the underlying data reveals that leisure tourists make up the majority of package tourists (58 per-cent), so about 21 percent of all leisure tourists travel with a package arrangement. Business, meeting, and other tour-ists each add about 10 percent to the pool of package tour-ists. Moreover, Australian, European, and North American nature tourists are the ones most likely to book a package tour (54 percent, 20 percent, and 31 percent respectively). Nature tourists in their late 40s and older are more likely than younger nature tourists to book a package tour.
Estimating package tourists’ total and per-day Uganda expenditure is not straightforward because package tourists often do not explicitly include package cost into
their expenditure responses, but state only additional expenditures. Moreover, about 50 percent of package tourists visit other countries and make it impossible to extract Uganda-specific expenditures. To obtain a fairly reliable expenditure estimate, only total per-person pack-age cost and no other expenditures enter the estimation calculations. Package tourists who visit other countries are excluded from the calculations. The resulting total expenditures are likely underestimates because tourists’ discretionary spending should be added to the total ex-penditure. Rough estimates suggest that discretionary spending amounts to 20 percent of total package cost. Figure 3.24 shows the resulting distribution of total pack-age cost. The mean package cost is estimated as $1,398. The mean rises to $1,678 if discretionary spending is added at 20 percent of the package cost.
Total expenditure and knowledge of the number of nights spent make it easy to estimate package tourists’ per-day expenditure. Figure 3.25 shows the resulting distribution. The mean of the distribution is $165, or $199 if discretion-ary spending is included. Because only 45 respondents out of 289 package tourists declared their total expen-diture and stayed only in Uganda, the estimated expen-diture means are not precise. Moreover, 25 percent of respondents declared their daily package expenditure at, implausibly, under $50, thereby calling into question the reliability of package tourists’ expenditure distribution.
Expenditures of Independent Travelers
The most measurable economic consequence of tour-ists’ visits to Uganda are the tourists’ expenditures. The survey asked interviewees, package tourists and indepen-dent travelers alike, to estimate their total expenditure and their expenditure in selected, predefined categories (the most important ones being accommodation, food and beverages, local transport, and shopping).
The previous section used interviewees’ answers to esti-mate package tourists’ total expenditure. Here the focus is on independent travelers who purchase accommoda-tion, food and beverages, local transport, tourist ser-vices, and other items separately. Independent travelers’ expenditure is the best measure of tourists’ economic impact because independent travelers avoid fees charged
Average nights 0–1 1–2 2–3 3–4 4–5 >5
Average nights 0–0.1 0.1–0.2 0.2–0.3 0.3–0.4 0.4–0.5 >0.5

Economic and Statistical Analysis of Tourism in Uganda38
by foreign travel agencies and can credibly break down their expenditures into categories.
Figure 3.26 shows independent travelers’ distribution of total per-person expenditure. The distribution is nonnormal (there is no well-defined typical expenditure), nonsymmetric and has a long tail. Peaks at rounded expenditure numbers are pronounced (at $1,000, $1,500, $2,000, etc.). The target population’s mean total expenditure of independent travel-ers is estimated as $1,036, and the median total expenditure as $500. The numbers are probably underestimates be-cause they are based on survey respondents’ often implau-sibly low expenditure numbers (because many respondents will have low expenditures, it is difficult to decide which specific respondents have implausibly low expenditures). Dollar expenditure figures are also subject to change be-cause respondents gave their expenditures in different currencies (mainly US$, 60 percent; UGX, 20 percent; and euro, 10 percent) and currency exchange rates are volatile (exchange rate movements of about 10 percent in 2012).
Figure 3.23: Distribution of Package Tourists (Percentage of Total Tourist Population) and Distribution of Outside versus Inside Packages (Percentage of Package Tourists)
0 20 40 60 80 100
Percent
Package
Independent
Percentage
Percentage
Did
you
trav
el in
depe
nden
tly?
0 10 20 30 40 50 60 70 80 90 100
Percent
Outside Uganda
Inside Uganda
Source: Authors, based on TEMS data.

Statistical Analysis of the Tourism Expenditure and Motivation Survey 39
Expenditures differ across tourist types (see table 3.2). Total expenditure is highest for spiritual and other tour-ists, and it is lowest for family tourists. The high expen-ditures for spiritual and other tourists result from long stays. If expenditures are limited to tourists who stay a month or less, the expenditure order changes and leisure tourists emerge as the highest expenditure type, while family and other tourists form the lowest expenditure types. Spiritual tourists in total still spend more than business, meeting, and cultural tourists except when duration of stay is limited. The concentration of low ex-penditures is highest for family tourists.
Further inspection of the survey data shows that regional differences are also apparent. The mean expenditures of Australian ($1,591) and North American ($1,568) tourists are higher than of Asian ($1,436) and European ($1,342) tourists. African tourists, on average, spend less than all other tourists ($616). The findings do not change much the duration of stay is limited to 1 month or less. Due to the relatively small number of respondents from Asia and Latin America, the expenditure estimates for these regions are unreliable.
Furthermore, older—usually more affluent—age groups generally show a higher total expenditure than younger ones. The mean expenditures are $657 for minors, $1,018 for individuals between 18 and 30 years, $962 (age 30–45 years), $1,126 (45–65 years), and $1,810 for individuals over 65. The relatively large total expenditure for 18 to 35 year olds is a consequence of longer stays, whereas the relatively low total expenditure for 35 to 45 years olds is a result of the age-group-specific predominance of
Figure 3.24: Distribution of Package Tourists (Uganda Only) Total Expenditure (US$)
Figure 3.25: Distribution of Package Tourists’ (Uganda Only) Expenditure per Day (US$)
Figure 3.26: Distribution of Independent Travelers’ Total Expenditure (US$)
Perc
enta
ge
0
3
6
9
12
15Percent
Total expenditure per person (in US$)
1000 2000 3000 4000 5000
Tourist type Average Median 31 Days (average)
Leisure $1,209 $800 $1,088
Business 1,057 500 816
Spiritual 1,394 700 924
Meeting 893 523 828
Cultural 819 500 808
Family 804 363 618
Other 1,256 600 675
Table 3.2: Independent Travelers’ Total Expenditure by Tourist Type (US$)
Package expenditure per person (in US$)
Perc
enta
ge
0
5
10
15
20Percent
2000 4000 6000 8000
Package expenditure per person per day (in US$)
Perc
enta
ge
0
2
4
6
8
10
12Percent
200 400 600 800
Source: Authors, based on TEMS data. Source: Authors, based on TEMS data.
Source: Authors, based on TEMS data.
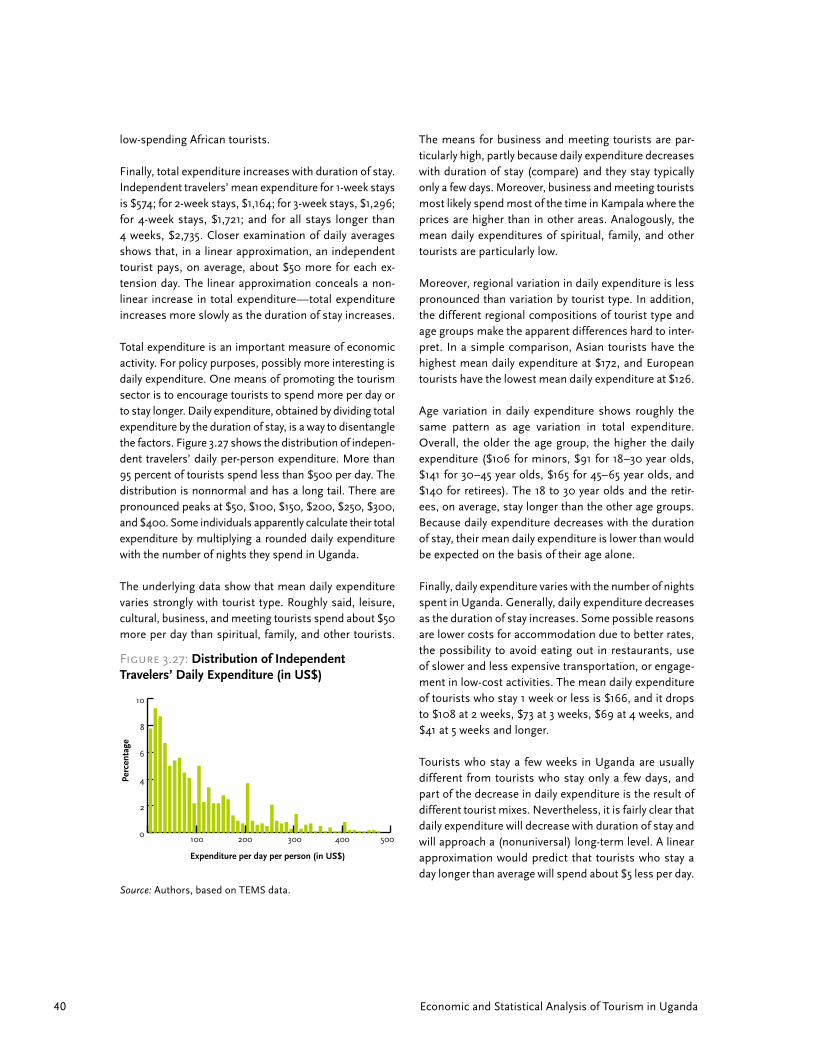
Economic and Statistical Analysis of Tourism in Uganda40
low-spending African tourists.
Finally, total expenditure increases with duration of stay. Independent travelers’ mean expenditure for 1-week stays is $574; for 2-week stays, $1,164; for 3-week stays, $1,296; for 4-week stays, $1,721; and for all stays longer than 4 weeks, $2,735. Closer examination of daily averages shows that, in a linear approximation, an independent tourist pays, on average, about $50 more for each ex-tension day. The linear approximation conceals a non-linear increase in total expenditure—total expenditure increases more slowly as the duration of stay increases.
Total expenditure is an important measure of economic activity. For policy purposes, possibly more interesting is daily expenditure. One means of promoting the tourism sector is to encourage tourists to spend more per day or to stay longer. Daily expenditure, obtained by dividing total expenditure by the duration of stay, is a way to disentangle the factors. Figure 3.27 shows the distribution of indepen-dent travelers’ daily per-person expenditure. More than 95 percent of tourists spend less than $500 per day. The distribution is nonnormal and has a long tail. There are pronounced peaks at $50, $100, $150, $200, $250, $300, and $400. Some individuals apparently calculate their total expenditure by multiplying a rounded daily expenditure with the number of nights they spend in Uganda.
The underlying data show that mean daily expenditure varies strongly with tourist type. Roughly said, leisure, cultural, business, and meeting tourists spend about $50 more per day than spiritual, family, and other tourists.
The means for business and meeting tourists are par-ticularly high, partly because daily expenditure decreases with duration of stay (compare) and they stay typically only a few days. Moreover, business and meeting tourists most likely spend most of the time in Kampala where the prices are higher than in other areas. Analogously, the mean daily expenditures of spiritual, family, and other tourists are particularly low.
Moreover, regional variation in daily expenditure is less pronounced than variation by tourist type. In addition, the different regional compositions of tourist type and age groups make the apparent differences hard to inter-pret. In a simple comparison, Asian tourists have the highest mean daily expenditure at $172, and European tourists have the lowest mean daily expenditure at $126.
Age variation in daily expenditure shows roughly the same pattern as age variation in total expenditure. Overall, the older the age group, the higher the daily expenditure ($106 for minors, $91 for 18–30 year olds, $141 for 30–45 year olds, $165 for 45–65 year olds, and $140 for retirees). The 18 to 30 year olds and the retir-ees, on average, stay longer than the other age groups. Because daily expenditure decreases with the duration of stay, their mean daily expenditure is lower than would be expected on the basis of their age alone.
Finally, daily expenditure varies with the number of nights spent in Uganda. Generally, daily expenditure decreases as the duration of stay increases. Some possible reasons are lower costs for accommodation due to better rates, the possibility to avoid eating out in restaurants, use of slower and less expensive transportation, or engage-ment in low-cost activities. The mean daily expenditure of tourists who stay 1 week or less is $166, and it drops to $108 at 2 weeks, $73 at 3 weeks, $69 at 4 weeks, and $41 at 5 weeks and longer.
Tourists who stay a few weeks in Uganda are usually different from tourists who stay only a few days, and part of the decrease in daily expenditure is the result of different tourist mixes. Nevertheless, it is fairly clear that daily expenditure will decrease with duration of stay and will approach a (nonuniversal) long-term level. A linear approximation would predict that tourists who stay a day longer than average will spend about $5 less per day.
Figure 3.27: Distribution of Independent Travelers’ Daily Expenditure (in US$)
Perc
enta
ge
0
2
4
6
8
10Percent
Expenditure per day per person (in US$)
100 200 300 400 500
Source: Authors, based on TEMS data.

Statistical Analysis of the Tourism Expenditure and Motivation Survey 41
However, a better approximation is nonlinear and shows a decreasing daily expenditure trend.
When asked by the interviewers, a large majority of in-dependent travelers (more than 90 percent) were willing to break down their total expenditure into expenditure subcategories such as accommodation, food and bever-ages, other shopping, local transport, and others. The high response rate allows the inference of representative estimates for the target population, as shown in figure 3.28. The accommodation ($374) and food and bever-ages ($252) subcategories account for nearly two-thirds of mean total expenditure ($1,036). Local transport ($114) and other shopping ($116) are two other subcategories with sizeable expenditure.
The finding holds across tourist types. Unsurprisingly, leisure tourists have the highest average expenditure in categories that are related to nature tourism (park entry fees, tracking fees, adventure activities) or guided tours (sightseeing tours, guide services). Family tourists spend least on accommodation and beverages. Spiritual tour-ists’ large expenditure in the residual expenditure sub-category (“Other”) is mainly due to donations.
Tourists’ Satisfaction with Trip
At the end of the survey, tourists could voice their
satisfaction regarding various aspects of their trip and suggest improvements. Figure 3.29 displays tourists’ sat-isfaction with different trip categories. Hospitality and home stays were much appreciated by most tourists. Local transport and visitor information drew the great-est criticism.
Tourists’ satisfaction with the quality of specific Ugandan national parks is reflected in figure 3.30. The most popular national parks (Murchison Falls, Queen Elizabeth, and Bwindi Impenetrable Forest) all receive very high tourist satisfaction ratings. Semliki National Park and Mount Elgon National Park are the only ones in the list that receive a sizeable number of low ratings. The satisfaction ratings regarding Uganda’s national re-serves (Ajai, East Madi, Kabwoya, Katonga, Matheniko-Bokora, and Pian-upe) are unreliable because only a handful of survey respondents had visited them.
Tourists’ overall high satisfaction with their Ugandan trip experience translates into an openness toward a return to Uganda and a high likelihood of their recommending a trip to Uganda to their friends (see figure 3.31). The underlying data show that the high likelihoods of return and recommendation hold across tourist types. Leisure and cultural tourists are the most unlikely to return but the most likely to recommend the experience. Family and business tourists are the most likely to return to Uganda.
Survey respondents had the option to suggest ways to improve tourism in Uganda, and about 15 percent did. Their responses can be grouped into categories and are shown in figure 3.32. Transport and Web publicity were cited most frequently as areas of improvement. This result is consistent with the relatively low satisfaction ratings regarding local transport and visitor information, shown in figure 3.29.
Perc
enta
ge
Total expenditure by category (independent tour)
0 50 100 150 200 250 300 350 400
Average
OtherLocal transportGuide servicesEntertainment
Other shoppingCrafts & souvenirs
Domestic air transportAdventure activities
Sightseeing toursTracking fees
Park entry feesFood & beverages
Accomodation
Figure 3.28: Independent Travelers’ Mean Total Expenditure by Specific Subcategories (in US$)
Source: Authors, based on TEMS data.

Economic and Statistical Analysis of Tourism in Uganda42
Figure 3.29: Tourist Satisfaction with Specific Trip Aspects
Figure 3.30: Tourist Satisfaction with National Parks and National Reserves
Figure 3.31: Tourists’ Likelihood of Return to Uganda and Recommendation of Their Experience to Friends
Perc
enta
ge
Percentage
Percentage
Like
lihoo
d of
ret
urn
to U
gand
aR
ecom
men
datio
n of
Uga
nda
to fr
iend
s
0 10 20 30 40 50 60 70 80
Percent
Very unlikely
Unlikely
Uncertain
Likely
Very likely
Percentage
0 10 20 30 40 50 60 70 80
Percent
No
Not sure
Perhaps
Definite
Perc
enta
ge
Percentage
Percentage
0 20 40 60 80 100
PoorAdequateGoodVery goodExcellent
People & hospitality
Visitor information
Duty free shopping
Tours, excursions
Local transport
Entertainment
Restaurants
Safari lodges
Hotels
Standard Services
Perc
enta
ge
Percentage
Percentage
0 20 40 60 80 100
PoorAdequateGoodVery goodExcellent
Mt. Elgon NP
Kidepo Valley NP
Murchison Falls
Kibale NP
Semliki NP
Bwindi Impenetrable Forest NP
Rwenzori Mountain NP
Mgahinga Gorilla NP
Queen Elizaberth NP
Lake Mburo NP
Figure 3.32: Suggested Areas for Improvement of Ugandan Tourism
Perc
enta
ge
PercentageSuggested Tourism Improvements
0 5 10 15 20 25 30 35 40
Percent
International languages
Security
Hygiene
Web publicity
Hotels & restaurants
Transport
Customer service
Source: Authors, based on TEMS data.
Source: Authors, based on TEMS data.
Source: Authors, based on TEMS data.
Source: Authors, based on TEMS data.
Pho
to: K
irk
E. H
amilt
on
Statistical Analysis of the Tourism Expenditure and Motivation Survey 43
Endnotes
1. Uganda Bureau of Statistics (forthcoming), 2013 Statistical Abstract.
2. For example, Uganda Bureau of Statistics (forthcoming), 2013 Statistical Abstract.
3. For example, Uganda Bureau of Statistics (forthcoming), 2013 Statistical Abstract.
4. Uganda Bureau of Statistics (2012), 2012 Statistical Abstract.
5. The statistical technique used here is called k-means clustering, whereby the number of clusters k is set to 2 and the clustering is based on the nine leisure subcategories.
6. Correlations between the tourist-type-specific fractions are usually around 0.9 and always greater than 0.7.
7. Uganda Bureau of Statistics (forthcoming), 2013 Statistical Abstract.
8. The vast majority of nonresident, non-Ugandan visitors who stay at least one night exited Uganda at Entebbe or the land border crossings sampled by the TEMS.
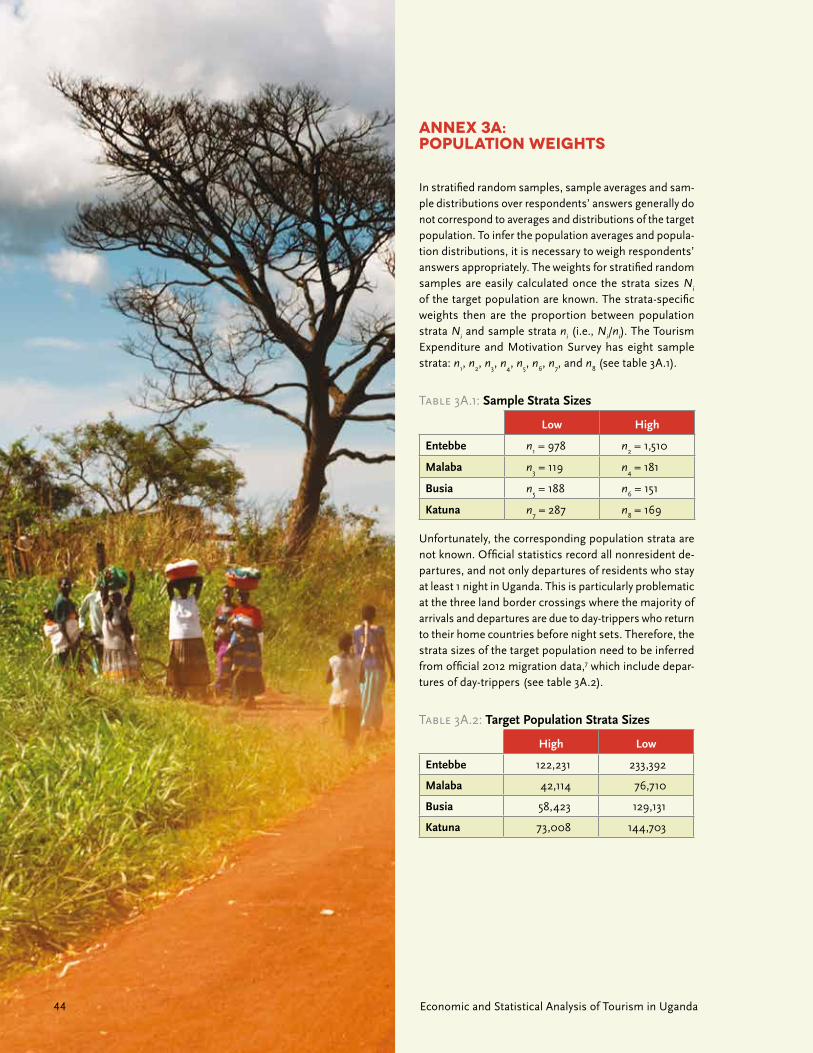
Economic and Statistical Analysis of Tourism in Uganda44
In stratified random samples, sample averages and sam-ple distributions over respondents’ answers generally do not correspond to averages and distributions of the target population. To infer the population averages and popula-tion distributions, it is necessary to weigh respondents’ answers appropriately. The weights for stratified random samples are easily calculated once the strata sizes N
i
of the target population are known. The strata-specific weights then are the proportion between population strata N
i and sample strata n
i (i.e., N
i/n
i). The Tourism
Expenditure and Motivation Survey has eight sample strata: n
1, n
2, n
3, n
4, n
5, n
6, n
7, and n
8 (see table 3A.1).
Table 3A.1: Sample Strata Sizes
Low High
Entebbe n1 = 978 n
2 = 1,510
Malaba n3 = 119 n
4 = 181
Busia n5 = 188 n
6 = 151
Katuna n7 = 287 n
8 = 169
Unfortunately, the corresponding population strata are not known. Official statistics record all nonresident de-partures, and not only departures of residents who stay at least 1 night in Uganda. This is particularly problematic at the three land border crossings where the majority of arrivals and departures are due to day-trippers who return to their home countries before night sets. Therefore, the strata sizes of the target population need to be inferred from official 2012 migration data,7 which include depar-tures of day-trippers (see table 3A.2).
Table 3A.2: Target Population Strata Sizes
High Low
Entebbe 122,231 233,392
Malaba 42,114 76,710
Busia 58,423 129,131
Katuna 73,008 144,703
Annex 3A: Population Weights
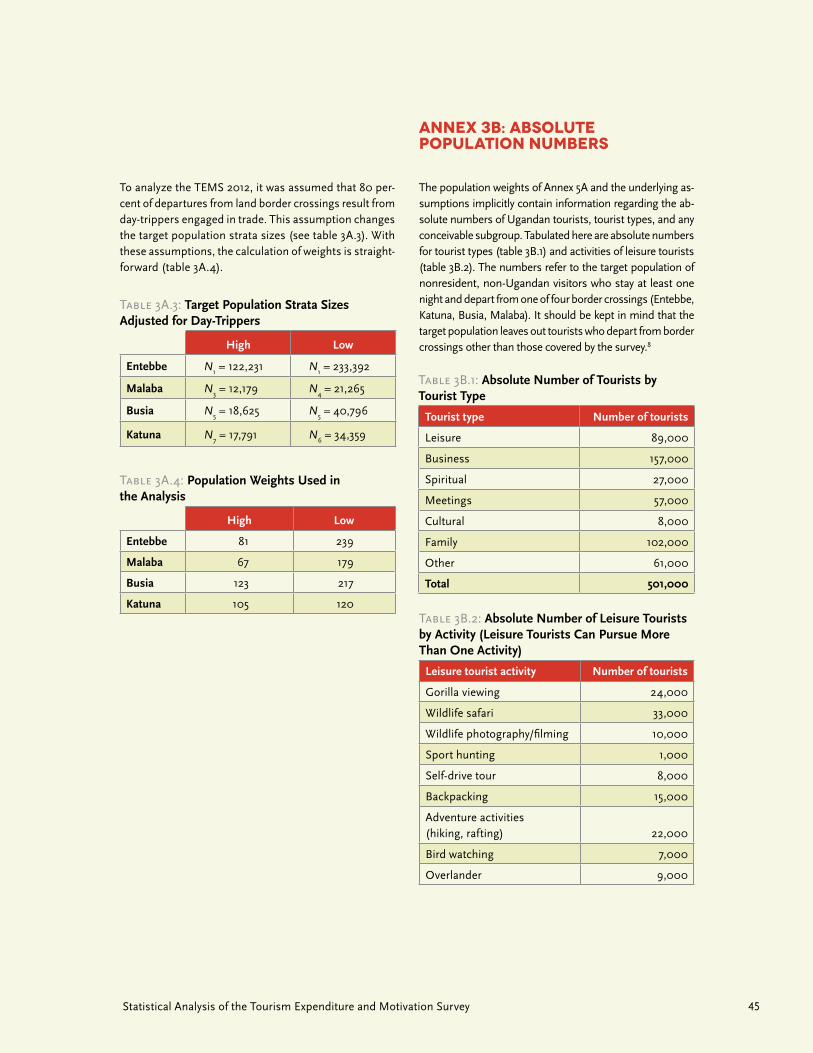
Annex 3B: Absolute Population Numbers
Statistical Analysis of the Tourism Expenditure and Motivation Survey 45
To analyze the TEMS 2012, it was assumed that 80 per-cent of departures from land border crossings result from day-trippers engaged in trade. This assumption changes the target population strata sizes (see table 3A.3). With these assumptions, the calculation of weights is straight-forward (table 3A.4).
Table 3A.3: Target Population Strata Sizes Adjusted for Day-Trippers
High Low
Entebbe N1 = 122,231 N
1 = 233,392
Malaba N3 = 12,179 N
4 = 21,265
Busia N5 = 18,625 N
5 = 40,796
Katuna N7 = 17,791 N
6 = 34,359
Table 3A.4: Population Weights Used in the Analysis
High Low
Entebbe 81 239
Malaba 67 179
Busia 123 217
Katuna 105 120
The population weights of Annex 5A and the underlying as-sumptions implicitly contain information regarding the ab-solute numbers of Ugandan tourists, tourist types, and any conceivable subgroup. Tabulated here are absolute numbers for tourist types (table 3B.1) and activities of leisure tourists (table 3B.2). The numbers refer to the target population of nonresident, non-Ugandan visitors who stay at least one night and depart from one of four border crossings (Entebbe, Katuna, Busia, Malaba). It should be kept in mind that the target population leaves out tourists who depart from border crossings other than those covered by the survey.8
Table 3B.2: Absolute Number of Leisure Tourists by Activity (Leisure Tourists Can Pursue More Than One Activity)
Leisure tourist activity Number of tourists
Gorilla viewing 24,000
Wildlife safari 33,000
Wildlife photography/filming 10,000
Sport hunting 1,000
Self-drive tour 8,000
Backpacking 15,000
Adventure activities (hiking, rafting) 22,000
Bird watching 7,000
Overlander 9,000
Table 3B.1: Absolute Number of Tourists by Tourist Type
Tourist type Number of tourists
Leisure 89,000
Business 157,000
Spiritual 27,000
Meetings 57,000
Cultural 8,000
Family 102,000
Other 61,000
Total 501,000
Economic and Statistical Analysis of Tourism in Uganda46
As the preceding chapters show, the Tourism Expenditure and Motivation Survey 2012 (TEMS) paints a rich picture of the tourists who visited Uganda in 2012, the sites they visited, and the activities they undertook. Crucially, it also provides a wealth of policy-relevant information, including the expenditures made by these tourists, their satisfaction with tourist sites and the quality of services and accommodation, and their suggestions for how to improve the tourist experience in Uganda.
Tourists’ overall satisfaction with their trip to Uganda is high. However, local transport in Uganda and insuf-ficient visitor information are the most frequently cited sources of dissatisfaction and suggested areas for im-provement. The need for a stronger Web presence for Ugandan tourism was also noted by tourists. In addition, about 10 percent of respondents to questions on areas for improvement in Uganda tourism cited the quality of customer service as an issue.
Chapter 4Main Findings and Policy Conclusions

Pho
to: K
irk
E. H
amilt
on
Main Findings and Policy Conclusions 47
Economic and Statistical Analysis of Tourism in Uganda48
The economic analysis of chapter 2 focuses on tourism exports—the expenditures made by foreign tourists while they were in Uganda. These expenditures provide scarce foreign exchange for Uganda and contribute positively to the balance of payments. The analysis shows that tourist expenditures are strongly linked to the Ugandan economy. When direct, indirect, and induced effects are counted, each dollar spent by a foreign tourist generates US$2.50 of GDP.
The TEMS estimates that roughly 500,000 foreign tour-ists spent at least one night in Uganda in 2012, and nearly 75,000 of them were leisure or cultural tourists. As shown in chapter 2, the total economic impact of the expenditures made by these half-million foreign tourists while in Uganda is large: expenditures totaled UGX 1.1 trillion and generated UGX 2.7 trillion of gross domestic product (GDP). This expenditure amounted to 38 per-cent of exports and generated 5.6 percent of 2012 GDP, including revenues to government from indirect taxes of 0.5 percent of GDP.
Expenditure data from the TEMS show that leisure and cultural tourists spend 30 to 100 percent more per visit than other categories of tourists. Policy simulations show that attracting 100,000 additional leisure tourists to visit Uganda would add 11 percent to exports and 1.6 percent to GDP. Similarly, if each tourist visiting Uganda stayed one additional night, imports would rise by 7 percent and GDP by 1 percent. The latter finding is important because the TEMS shows that over 70 percent of tourists visiting on business, for meetings, or to visit friends and relatives did not visit any natural sites outside of Kampala.
In terms of policy priorities, there are two basic ways to make tourism’s contribution to the Ugandan economy grow: by attracting more tourists and by persuading tourists to spend more money while they are visiting Uganda. To meet this increased demand, however, in-creases on the supply side are required. This analysis leads to four broad areas where government policy and government investment can increase tourism’s contribu-tion to the economy:
■ Marketing Uganda—Stronger branding, use of new media, strengthening links with travel agencies in source markets, and attracting high-profile foreign operators can contribute to attracting more tourists to visit Uganda.
■ Increasing supply—Private sector investments in the tourism sector are needed to meet growing demand, which will require improvements in the investment climate in Uganda. In addition, poli-cies and regulations specific to the tourism sec-tor need to be reviewed and reformed. A growing private sector can in turn contribute to marketing Uganda tourism.
■ Removing bottlenecks—Investments in infrastruc-ture, particularly roads, can decrease the cost and increase the convenience for tourists visiting the natural areas of Uganda. Reforms of the concession policy for tourism operators, in particular to increase transparency and security of tenure, will boost private investment in the sector. And filling the skills gap in the sector will increase visitor satisfaction and the ef-fectiveness of word-of-mouth marketing when these visitors return home.
■ Investing in natural assets—The national parks and other protected areas in Uganda are in the process of recovery from the neglect of earlier decades. Investments in park infrastructure, machinery and equipment, the protection and management of wild-life, and staff skills are needed to increase the value of the key natural assets in the sector.
Policy simulations show
that attracting 100,000
additional leisure tourists
to visit Uganda would add
11 percent to exports and
1.6 percent to GDP.

1818 H Street, NWWashington, DC 20433Telephone: 202-473-1000
Internet: www.worldbank.org
22 Whitehall LondonSW1A 2EG
Email: [email protected]
Telephone 020 7023 0000