public disclosure authorized - world...
TRANSCRIPT

Pub
lic D
iscl
osur
e A
utho
rized
Pub
lic D
iscl
osur
e A
utho
rized
Pub
lic D
iscl
osur
e A
utho
rized
Pub
lic D
iscl
osur
e A
utho
rized
Pub
lic D
iscl
osur
e A
utho
rized
Pub
lic D
iscl
osur
e A
utho
rized
Pub
lic D
iscl
osur
e A
utho
rized
Pub
lic D
iscl
osur
e A
utho
rized


~~,.......,_~ Bank I World
-..----1 Atlas
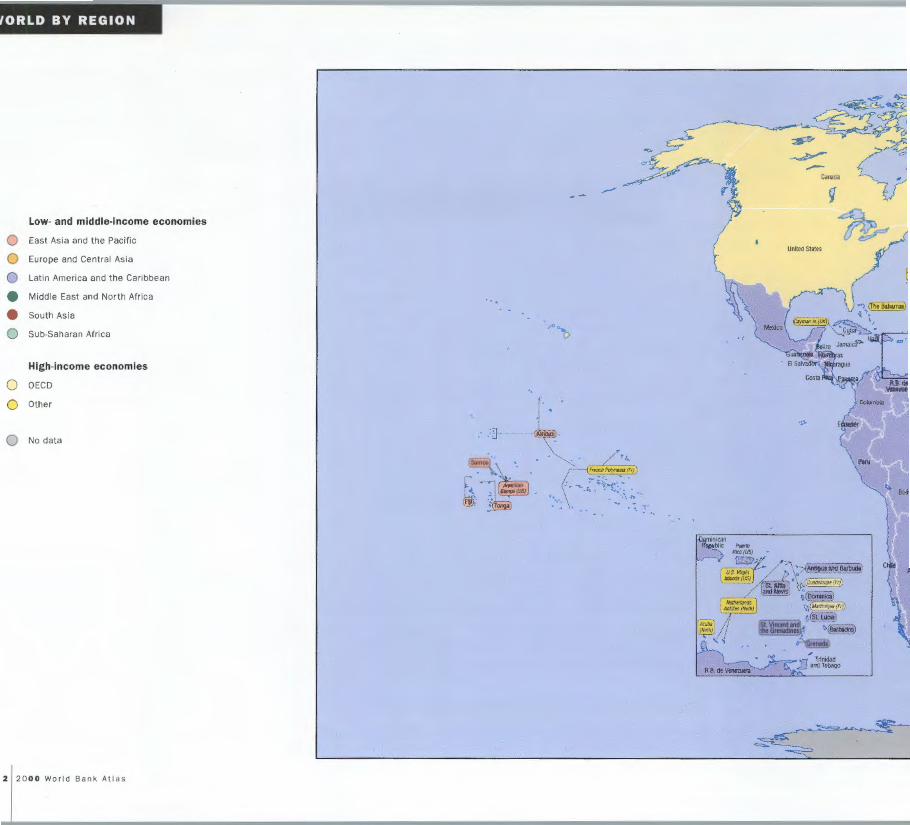
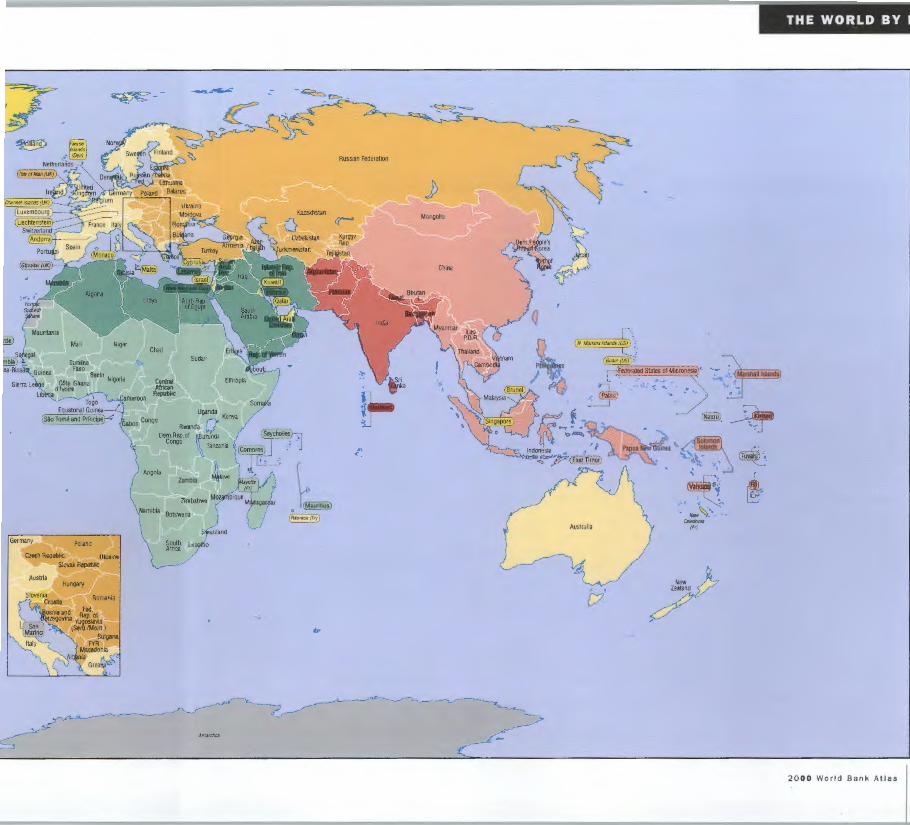
ORLD BY REGION
Low- and middle-income economies
0 East Asia and the Pacific
0 Europe and Central Asia
0 Latin America and the Caribbean
Middle East and North Africa
South Asia
0 Sub-Saharan Africa
High-income economies
0 OECD
0 Other
0 No data
2 20 00 World Bank Atlas
--
Chad Sudan
Central Alrtcan ~bile
Congo uoaanda Kenya ~ Rwanda
Demca:= at .;;;ndl Tanzania
THE WORLD BY
Russian Federation
2000 World Bank

ENTS
WORLD VIEW
Introduction
CD 2 6
PEOPLE
!~.':l.P.~I'.. ___________ _ !::i!~~-~p~~~~'::l~L~~~ir.~~ . }-~~~ Infant mortality rate , 1998
16 18 19
ENVIRONMENT
Environment -·········-····----------------
~or~-~~---~-<:>Y.~.r.~~-~-! .... ~-~~-?. .......................... -Annual deforestation, 1990-95 ...........................................................................
2 (;~i_l_~ .... r:'l.~. '. '::l .~~~i-~_i _<:>_~-~ ~~-~?::::~-~---·· .. . ........................................................................................... ?..'?. -~~~~-~-~-~-~-~- r..E~~?.-~. r.-~~-~--P..~E ... ~.~pit~~----~-~-?.~ ---· Introduction 7 Access to safe water, 1990-96 21
-----------------------------------------------·-·······-······················-·········-····
-~- • .... r:'l.~. '::l9<:> .P<:>.r ___ r~-~i<:>~ -~-~---·· 2 Female net primary enrollment ratio , 1997 23 lntroducci6n 7 Social statistics 24 Environmental statistics
World View 8
-· -~-~~.r.-~-~-~i_<:>'::l.~.·--·~~y~_l<:>. P.r:'l .~.~-~---~?.~'-~--- ·· 10 ~?.~~ry~~9~~~t 12 ?.a._n.~i~g~gf~~<:>~<:J.r:'li~!';- ~~!';~q<:)!l_ §~!"P.E'l.r.g~pi~.9. .... 14
~ll.~~Pf'!~~~Y.Il. !'!1~~~~~~1!. 9 _9~j-~~~i!~---~~- 9~y~lgpp~~~n.~!l.~P'a.n. .... i .n..~-~-r..n..C!.tig_ n. __ a._l____ 10
!::a.P.C!~Y~~~~~! .... ~a. .. 9.~!!~ ........................................................................... ~.?. . 14
!~-~~PI'.~~!Y.~!'!I.':I-:!~1~! ... 9
Population 17
Esperance d~yi~~~<:l~<:li~~~'::l~~' l.?.~~ ~~
!.~':l:<_ de ~<:>E!~li~~~~~<:l~~il~.~~?.~ -- ·· ············ · ·························································· · ·······-~-~ 20 .. ······································• M9J!l_~!r.i!i<:>':l_ <::_~E'!~'-~~E'!'2!9'2!~, _:t.~~~::::~? ..... .
Acces a une eau salubre, 1990-96 21 -········-· ·············-· ········································································································•
Taux de croissance de Ia consommation
_§!~.!. i.~-~-i _g_~-~-!'i ... ~.?. .<::.i _;:I_I _E')_~- ...................................................................................................................................... ?..<.!:
Poblacl6n 17
Envlronnement Couvert forestier, 1995 ............................................................................... .. ...................................... Deboisement 1990-95
~-~!;;!;;()_'::IE~~-!'. ... 9 .. : .EO.~.'::I ... 9.()U_C::E'!P.~r . ~.131_>i!1)':1.!., .... :t.~-~-?...... _ ~r:'li!';!';i<:>~~ <:!~ <:li?.:<X<:l.E'l .. <:lE'l .~~r.~?.~E:l p~r. ~<;~~i~<;~~~! -~~?.§
-~-E'l-~~~-r:'l.E:l .~~---~-~-~ -r.!l~!i_q~_E:)_ , ____ ~-~?..? .... C:?.~~?..r:'lr:'l.~~i?.~<:l'.~~~r.~iE:!P.<;lr_ ~~~i~<;~~~' ~-~~!.
Medlo Amblente Cubierta forestal , 1995 ·······························-·····················-···············-····-·····
Metas de desarrollo a nivel internacional -·····-····-··-····------------------------------------------------------------------------------ 10 _t::~p~r.~-~~~- ~-~Yi<:lC! <;~l ___ !l_C!.~-~r., ... ~-~-~!'1..... 18 !?_E:!~?_r.~~!<:~~i?.~ . <:l-~':1<:1' ·- ~~-~g::::~?. _ __
.~.<:>-~ .r.~ .Z..C! .. X ... •a. .. ~--~-~-~- !3. ..... 12 Tasa de mortalidad 1998 19 R.~~~r.~<:>~9~<:1~Y~<:l~I~~P~~~~pi~<:l ! ~~~~
?i!~!l.9.i?.~ r:'l~n.9i~l ~~!~r.~in.<:>~ 9~1 ~t:'!~P~~ 9.~pi~a. 14 Malnutrici6n en Ia 20 .E.'r:'li~i<:>n.~~ 9~~iO.~i~?.~~~C!E~<:>~<:>P~E~~pi~<:l· ~~~El
(1~~-~~<:)- ~I_<:I~~~P.?.!C!.~IE:!, ~-~~g::::~f:l 21 ~-~-i9.i.~.n.-~_i _C! ... 9..~. 1-··-~-~<:>. 9~ .. l.<:l .. ~n.E'l!:~!~.·---~-~-~! . !.<:1~!3.9.~~r.~.<:.i~i_E:ln.!<:>~r.~api~~- 9.~1~?nsu~.<:> P.r.iYC!'!<:>·~~~Q:::~8 22 Consumo?_e en~r~!~P.~~~~pi~Cl!~?.~?. . . __ ~<:>r.~~~~a.j~~~!<:>9.~r:'l8.!~~~1C!9.~r:'l~j~r.~~ .. _ Estadisticas ambientales
en Ia escuela 1997 23 Estadisticas sociales 24
4 2000 World Bank Atlas
2 3 3 3
3

ECONOMY
-~~~-~-~~.L. 9..~.~-p~~--~-~pi~~L ~.§'.~.~---··· .
39 ..................................
!'~Li~l!l~l!E~ ~~~r~ i~ §[?~! ~~~!3. ................... .. ........................ ... ~9. Investment share in 1998 41 Economic statistics 42
Economie 37 ·················································································································································- ............................................................. .
~t::J~p~r. ... ~.~-~-i-~-~r:'.!! .... ~.~-~!3. .................. . - 38 I.~l!~ ~~~r.<:>.i~~~r:'~~ ~~ ~t::J~..P..~L~~~i!.~r:'t, ~~~9.~~1:3. . }~. _l:l~r!_<:le l : ~griculture da_n~le PIB!~~-98 Part de l' investissement dans le 1998
40 41
Statistiques economiques 42
Economia 37 ........................................•
38 .............. · ············································ ··········• !:l.~.!'l ... P.~r. ... ~-~-p_i!~.! .}~-~.1:3. .... ····· ·······································-····
!.?~-~ -~~E.r_~C::ii!Ji~r:'!~.-~-~-IJ"'f'!i:!P~E. C::~f>i!~ · ~~§l9:::§l? _ __ 3 9 !:>r.«:>P<:>.r.~i9.~_<:1~1~ ~1\r.i~~!!l!L~ ~~ ~i~~-~!}~~13. ~9.-~rl:)p<:J.r.~i~~ _<:!~ I~ i~y~r~i~~ ~~ ~I ~1!3.! .. ~~~!3. ... .. . . .. ............ .......... . ~~-
STATES & MARKETS
States and Markets
~ili~~r.x ~~P~~~i~l!r.~ ~~~r.~ i~ 9.~~! ~~~! ~~Y.~_<:I_r.I:)~_<:I~ .~~ -~P-E:!E~~r:'!~!\~. 1:>.!!«:>!~1 _r.<:>.C:I_~~! . ~~~!3. I.~l~p~l:)_~~ f!.!~i~li~~~p~r. ~·29.9P~I:)pl~! ~~~1:3. -~~r.~<:>.~~~~<:>.f!.IP~t~r~p~r. ~.QQ(?.p~l:)p_I~L ~~~!3. States and markets statistics
et Marche
!'.~r..! ~~~ ~~p~~~~~ -~ili!~ir.~~ -_<:1~':1~ I~!'.~~ · - ~~~! . Part des routes revetues dans le reseau routier 1998
~i~~~~~~~~p~l:)~ig~~~pr.i~~ip~I~~P<:>.~r.-~QQQ~~-~i~~~~~!~~~l:3. 9.r.c:li~~!~l!r.~ i~~iY.i~l!~I~ _PI:>~E ~99(?. ~~~i~~~!~ ! ~~~!3. .~!~ti~~ig~~~---~~-~~---~! ... f!.l .. C:I .r.~.~-~---··
~~-~~~•"-•~••••Y..•••~~.'..C:.~•~ •"-•~• •m•••••••••••••••••••••••m••m •m• • • • •m• • • !'.LI:>P.<:>.r.~i~~ c:l~l 1\~~~l:)_~ili!~E~~ ~I y~~· ~~~! f<3~!~!~!<3~_ P<3~ii!J~~~<3~<3!>~1:>'!19. PI:>r~E:!~~<3J~~~~!<:>.!~I .....
de caminos, 1998
44 46 47 48 49 50
45 46 47 48 49 50
45 46
47 ·---------------------------------- ------------------------------------------------------------------------------------------·········································-·· ·
~!~.~-~-~-.!~.l~!.~ .~i~~~-- pr.i.~-~ -i_p~I~~- - P<:>.r .~-~-~-~~:999 .. P~r!l9~~~-! ... ~.~-~!3. . ... 48
GLOBAL LINKS
Global Links 52
.t:!.~-~- p_r.iy_~-~~---~-~pi!~lfi«:>.Y:'..~ .... P..~L .. ~.Cl:Pi!~! ... ~.~-~-1:3... ......................................... _ 54
_t:!~~ - ~Jc:l_!.l_c:l~~ P.~E~~P!!Cl:· -~~~1,3 ············-········-········-···-····-···- 55 Global links statistics 56 -················-······························- ······-················································································- ········································-
!.'.!~~r~c:.~I.<>.~~- ~.C:C)'.!<>..~.i':l.':l.~~ ... ~.<>..'.l.~.i~.~-~~ •m•m•• •m•• . . ••••••••••••• •m ~~-Fiux nets de capitaux prives par habitant, 1998 54 y1ux nets d'aide par habitant, 1998 55
56
!.'.!~~-~'.."'.~.i~-~----~':1.'.1.~.~.~.1 . ................................... ··································································································~-~ Y.ll!)'?~ ---~-~-~.I:>.~----~-~----~~P!~~I_pf.iY._~~I:>. .P~! .~_<3.P.i.~~L~~?8 54 y1ujos netos d~----~-~i-~-~-~-~-cia per capita, 1998. ........................................................ ?..?._
56
Technical Notes 58
-······ . ··············-····· .................................................................................................................................................................... ~
.JIIotes Te_<:~'.l_i':I_~~S ----·m·m··· -·--·- 60
Estadisticas econ6micas 42 f<:>.~P-~t~~I:>E~~~r.~«:>~~~~~P<:>!~~~~~:999~r.~<:>.~~~!~~~l:3. 49 Notas Tecnicas 62
~~~~~!~!i_C.~~ ~~~~_<:I«:>~X~~EC.C:I~I:>~ 50
2000 World Bank Atlas

6 20 00 World Bank Atlas
Introduction
The World Bank Atlas, now in its 32nd year, provides a quick view of the stat
of life on our planet, measured by key development indicators and illustrate•
by colorful and informative maps. For quick reference, the data are also di~
played on each page in summary charts and tables.
The World View section focuses on development goals for the 21st centur
and some of the special development issues of the heavily indebted poor cour
tries (HIPCs). People, Environment, and Economy present data on more tradi
tional development topics. States and Markets provides indicators of privat•
investment and infrastructure, reflecting the interplay of a wide range of devel
opment issues. And Global Links documents the forces of global integratiOJ
with data on trade, financial flows , and tourism.
Every effort has been made to standardize the data and to observe inter
national definitions and classifications, but differences in statistical and col
lection methods mean that the indicators are not always strictly comparable
In an effort to address data coverage and quality issues and to increase tho
resources available for statistical capacity building in developing countries
a consortium of more than 90 countries and international organizations ha
com'e together under the banner of Partnership in Statistics for Developmen
in the 21st Century, or Paris 21. As in earlier editions, brief descriptions o
the data are included in the technical notes, and more detailed notes an
available in the World Development Indicators and its CD-ROM edition, whid
also includes full time series.
Introduction
L'Atlas de la Banque mondiale, publie pour Ia 32e annee, offre un aperc;:u rapide
de Ia situation des etres humains, en se fondant sur des indicateurs des du
developpement et en synthetisant cette information au moyen de cartes en
couleurs. Pour plus de commodite, les donnees utilisees figurent egalement sur
chaque page sous forme de tableaux et graphiques recapitulatifs.
La section Perspective mondiale a trait aux objectifs de developpement du XXIe
siecle eta certaines des contraintes de developpement particulieres aux Pays
pauvres tres endettes (PPTE). Les sections Population, Environnement et
Economiefournissent des donnees sur les themes classiques du developpement.
La section Etat et Marchi presente des indicateurs sur l'investissement prive
et les infrastructures, et temoigne de !'interaction de toute une gamme de
problemes de developpement. La section Interactions economiques mondiales,
enfin, apporte des informations sur les forces qui poussent a Ia mondialisation,
avec des donnees sur les echanges commerciaux, les flux financiers et le tourisme.
Bien qu'on se soit efforce de normaliser les donnees et de respecter les
definitions et classifications internationales, les differences de methodes
statistiques et de collection des donnees font que les indicateurs ne sont pas
toujours strictement comparables. Desireux de s'attaquer au probleme de
Ia couverture et de Ia qualite des donnees et d'accroitre Jes ressources
disponibles pour renforcer les capacites des pays en developpement dans Je
domaine de Ia statistique, plus de 90 pays et organisations internationales
ont forme un consortium, sous !'appellation de Partenariat statistique au
service du developpement a l'aube du XX/' siecle ou Paris 21. Comme dans les
editions anterieures, Jes notes techniques decrivent brievement les donnees,
tandis que des notes plus detaillees figurent dans Ia publication World
Development Indicators et dans sa version CD-ROM, qui com porte aussi des series
chronologiques completes.
lntroduccion
El World Bank Atlas, ahora en su trigesima segunda edicion, ofrece un
panorama sucinto de las condiciones de vida en nuestro planeta, medidas
por un conjunto de indicadores fundamentales del desarrollo e ilustradas
con mapas informativos a todo color. Ademas, en cada pagina se presentan
datos en graficos y cuadros condensados para su consulta rapida.
La seccion titulada Perspectiva Mundial se centra en las metas en materia
de desarrollo para el siglo XXI yen algunas de las cuestiones especiales sobre
desarrollo que enfrentan los paises pobres muy endeudados (PPME). En las
secciones sobre Poblaci6n, Medio Ambientey Economia se presentan datos sobre
los aspectos mas tradicionales del desarrollo. La seccion sobre Estados y Mercados contiene indicadores sobre inversion privada e infraestructura,
que reflejan Ia interaccion de una amplia gama de aspectos sobre el desa
rrollo. En Ia seccion sobre Integraci6n Mundial se examinan las fuerzas que
impulsan Ia integracion mundial con datos sobre comercio, flujos financieros y turismo.
Se han hecho grandes esfuerzos para uniformar y observar las definiciones
y clasificaciones internacionales, pero dadas las diferencias que existen en los
metodos estadisticos y de recopilacion de datos, los indicadores no son
siempre estrictamente comparables. En un esfuerzo por abordar el tema de
Ia cobertura de los datos y los aspectos relativos a su calidad, y por incrementar
los recursos disponibles para el fortalecimiento de Ia capacidad estadistica de
los paises en desarrollo, se ha formado un consorcio de mas de 90 paises y
organizaciones in teracionales denominado Partnership in Statistics for Development
in the 21st Century, o Paris 21. Como en ediciones anteriores, en las notas tecnicas
se incluyen breves descripciones de los datos presentados, yen World Development
Indicators y su version en CD-ROM, que tam bien incluye series cronologicas
completas, se presentan mas notas pormenorizadas.
2000 World Bank Atlas

8 20 00 World Bank Atlas
World VIew
At the beginning of the 21st century our greatest challenge is to elimina
poverty. More than 1.2 billion of the world's people live on less than $1
day-another billion, on less than $2. In addition to lacking income, the poo
lack access to education and health care and are often exposed to the effec
of environmental damage.
To measure progress in reducing poverty, the international community h2
set seven goals:
• Reduce the proportion of people in extreme poverty by at least hal
between 1990 and 2015.
• Achieve universal primary education by 2015.
• Move toward gender equality by eliminating gender disparities in pr mary and secondary education by 2005.
• Reduce the infant and child mortality rates by two-thirds between 1990 an
2015.
• Reduce the maternal mortality ratio by three-fourths between 1990 an
2015.
• Provide access to reproductive health services for all no later than 2015
• Put in place national strategies for sustainable development by 2005-t
reverse current trends in environmental losses by 2015.
Progress in reducing poverty rates stalled in the past two years, especiall
in Asia, as a result of the financial crisis. Primary enrollment ratios continu
to improve, and mortality rates have fallen-in some countries dramaticall
But there is a danger of moving backward, especially in countries beset b
political instability and civil disorder. So, much remains to be done. Ma
countries and most regions can still achieve the goals, if growth resumes an•
if countries adopt the right policies to sustain growth and direct the ben~
fits to the poor.

l'aube du XXIe siecle,le plus grand defi qui se pose au monde est I' eradication
Ia pauvrete. Plus de 1,2 milliard d'etres humains vivent aujourd'hui avec
de 1 dollar par jour, et 1 milliard avec moins de 2 dollars. Outre leur manque
revenus, les pauvres n'ont pas acces a I' education et aux soins de sante, et ils
souvent a subir Jes efiets des degats causes a l'environnement.
Afin de mesurer les progres realises dans Ia lutte contre Ia pauvrete, Ia
-.vJ•u•uuuauLc intemationale s'est fixe sept objectifs:
• Reduire de moitie au moins, entre 1990 et 2015,Ja proportion d'individus vivant
dans une extreme pauvrete.
• Assurer l'enseignement primaire universe! d'ici 2015.
• Progresser vers I' egalite des sexes en eliminant les disparites entre filles et gart;ons
dans l'enseignement primaire et secondaire d'ici 2005.
• Reduire Jes taux de mortalite infantile de deux tiers entre 1990 et 2015.
• Reduire les taux de mortalite matemelle de trois quarts entre 1990 et 2015. Assurer l'acces aux services de sante dits de reproduction pour tous en 2015 au
plus tard.
Mettre en oeuvre des strategies nationales de developpement durable d'ici 2005,
afin d'inverser Ia tendance actuelle de deperdition des ressources
environnementales d'ici 2015.
Le processus de reduction des taux de pauvrete a marque Je pas ces deux
demieres annees, surtout en Asie, du fait de Ia crise financiere. Les taux de
scolarisation primaire continuent de s'ameliorer, et les taux de mortalite ont
baisse- de maniere spectaculaire dans certains pays. Mais le risque de regression
existe, surtout dans les pays en proie a une instabilite politique eta des troubles
civils. Dans ce contexte, il reste beaucoup a faire . Bien des pays et Ia plupart des
regions peuvent encore atteindre les objectifs vises si Ia croissance reprend et si
les gouvemements adoptent les politiques voulues pour maintenir cette croissance
et permettre aux pauvres d'en recolter les fruits.
Perspective Mundlal
AI iniciarse eJ siglo XXI, nuestro mayor desafio es eliminar Ia pobreza. Mas
de 1.200 millones de Ia poblaci6n mundial subsisten con menos de US$1 al
dia, y otros 1.000 millones, con menos de US$2. Ademas de carecer de
ingresos, los pobres no tienen acceso a Ia educaci6n ni a los servicios de salud
y suelen estar expuestos a los efectos del deterioro ambiental.
Para medir el progreso en materia de reducci6n de Ia pobreza, Ia
comu nidad internacional ha ftiado siete metas:
• Reducir Ia proporci6n de personas que vive en Ia pobreza extrema por lo
menos a Ia mitad entre 1990 y 2015.
• Lograr Ia universalidad de Ia educaci6n primaria para el ano 2015.
• Avanzar hacia Ia igualdad de los sexos eliminando las diferencias de esta
indole en la ensenanza primaria y secundaria para el ano 2005.
• Reducir en dos tercios Ia mortalidad infantil yen Ia ninez entre 1990 y 2015.
• Reducir Ia mortalidad por causas derivadas de Ia maternidad en tres cuartas partes entre 1990 y 2015.
• Proporcionar acceso a los servicios de salud reproductiva para todos a mas tardar en el aiio 2015.
• Aplicar, para el aiio 2005, estrategias nacionales para el desarrollo sostenible,
a fin de invertir, para el aiio 2015, las actuales tendencias en materia de perdidas ambientales.
En los ultimos dos anos se ha detenido eJ avance hacia Ia reducci6n de Ia
pobreza, especialmente en Asia, como resultado de la crisis financiera. La tasa
de matricula en Ia escuela primaria sigue aumentando y las tasas de mortalidad
han bajado, en algunos paises extraordinariamente. Sin embargo existe el
peligro de que se produzca un retroceso, sobre todo en los paises azotados por
Ia inestabilidad politica y las perturbaciones sociales. De manera que queda mucho
por hacer. Muchas naciones y Ia mayoria de laS regiones aun pueden alcanzar
las metas si se reanuda el crecimiento y si se aplican politicas nacionales
adecuadas para sostener eJ crecimiento y orientar los beneficios hacia los pobres.
2000 World Bank Atlas

The International community has
set ambitious goals for reducing
poverty and closing the large
gaps In social development In the
next century. Meeting these
goals will require a strong
commitment by developing
countries , a renewed effort by
International development
agencies, and considerable
support from advanced countries.
10 2000 World Bank Atlas
GOAL: reduce income poverty by half by 2015
Poverty rate
• 1990 • 1998 • 2015 (target)
50 40 30 20 10 0
~ 16
1 ;; 2
SOurce: World Bank staff estimates.
a. People living on less than PPP $1 a day.
Headcount percent a
East Asia and the Pacific
Europe and Central Asia
Latin America and the Caribbean
Middle East and North Africa
South Asia
Sub-Saharan Africa
GOAL: reduce infant mortality by two-thirds by 2015
Infant mortality rate
1990 • 1998 • 2015 (target)
100 80 60 40 20 0
35
-e ~ 878-+-
Source: World Bank staff estimates.
Deaths per 1,000 live births
East Asia and the Pacific
Europe and Central Asia
Latin America and the Caribbean
Middle East and North Africa
South Asia
Sub-Saharan Africa
GOAL: primary enrollment of 100 percent by 2015
Net primary enrollment ratio
1990 • 1998
Percent
East Asia and the Pacific
Europe and Central Asia
Latin America and the
Caribbean
Middle East and North
Africa
South Asia
Sub-Saharan Africa
50 60
Source: UNESCO estimates, 1999.
+ 2015 (target)
70 80 90
100
99
100
99
101
II

GOAL: gender equality in enrollment by 2005
Ratio of girls to boys in primary and secondary school
• 1990 • 1998
Percent 50 60
East Asia and the Pacific
Europe and Central Asia
+ 2005 (target)
70 80 90
91
100
Latin America and the
Caribbean -----------:-~~C~r> Middle East
and North Africa
South Asia
Sub-Saharan Africa
Source: UNESCO.
GOAL: access to reproductive health for all by 2015
Contraceptive prevalence among women aged 15-49
• Country level, most recent year available in 1990-98
Percent
East Asia and the Pacific
Europe and Central Asia
Latin America and the
Caribbean
0 20 40 60 80
l ao PD R Indonesia China
• • • Russian Federation Moldova • • • Kazakhstan
Hai t i Nicaragua
• • • Puerto Rico
100
Middle East Republic of Yemen Islamic Republic of Iran
and North --41·---~••--t••---Africa Jordan
South Asia
Sub-Saharan Africa
Pakistan
• Guinea •• Cameroon
Source: National estimates.
India •• Bangladesh
Mauriti us • Note: Use of contraceptives is affected by many factors, including access
to reproductive health services. There Is no established goat. The data
shown are for the lowest, median, and highest value In each region for
the most recent year available in 1990-98.
International development goals WOR
GOAL: reduce maternal mortality by three-quarters by 2015
Maternal mortality ratio
e Country level , most recent year available in 1985-88
1,200 600 200
l ao PDR Republic of Korea • • • Mongolia
Turkmenistan Uk raine ~
Poland
Bolivia Uruguay
• • • Jamaica
Oman . unisla .e
Republic of Yemen
Bhutan Sri Lanka
Deaths per 100,000 live births
East Asia and the Pacific
Europe and Central Asia
Latin America and the Caribbean
Middle East and North Africa
• • • South Asia Nepal
Central African Republic • • Tanzania
SOurce: National estimates.
Mauritius • Sub-Saharan Africa
Note: The data shown are for the lowest, median, and highest value in
each region for the most recent year available In 1985-88.
G The challenge of meeting our goals
I believe that the greatest moral
challenge we face Is the fact that
one In four of the people with
whom we share this small and
beautiful planet live In abject
poverty. I also believe that we live
at a time when It Is possible to
make massive reductions In
poverty. But to do so, we must
turn the development efforts of
the International community from
an obsession with Inputs and
generalized rhetoric about poverty
to a clear focus on outputs and
year-on-year effectiveness In
reducing poverty measured
against our agreed goals In each
and every country.
The Hon. Cl are Shor t ,
U.K. Secret ary of State for
Internationa l Deve lopment,
Pari s, 1999
2000 World Bank Atlas

For the heavily Indebted poor
countries (HIPCs), high levels of
debt are a serious constraint on
their ability to pursue sustainable
development and reduce poverty.
Slow growth and rising
populations have lowered their
per capita Incomes. Because of
bad policies and bad luck, the
financing offered them In the
hope of stimulating new growth
has become an unmanageable
burden.
. 2 2000 World Bank Atlas
HIPCs have seen their incomes decline . . .
GNP per capita ($)
600 ---------- HIPCs
- Other low-income countries
500
400
300
200
1980 1982 1984 1986 1988 1990 1992 1994 1996 1998
Source; World Development Indicators database and World Bank staff estimates .
. . . in lowering infant mortality . . .
Infant mortality rate (per 1.000 live births)
150
100
50
0 -1980 1982 1984 1986 1988 1990 1992 1994 1996 1998
• HIPCs • Other low·income countries
Source: World Development Indicators database and World Bank staff estimates.
. . . and have made less progress in reducing illiteracy ...
Adult illiteracy rate (% aged 15 and above) 100.-----------------------------------------------,
- HIPCs
- Other low-income countries
75
50
25
OL-------------------------------------------~ 1980 1982 1984 1986 1988 1990 1992 1994 1996 199E
Source: World Development Indicators database and World Bank staff estimates .
. . . and in slowing fertility
Total fertility rate (births per woman)
10
5
It~ 0 I 1980 1982 1984 1986 1988 1990 1992 1994 1996 1998
• HIPCs • Other low-income countries
Source: World Development Indicators database and World Bank staff estimates .
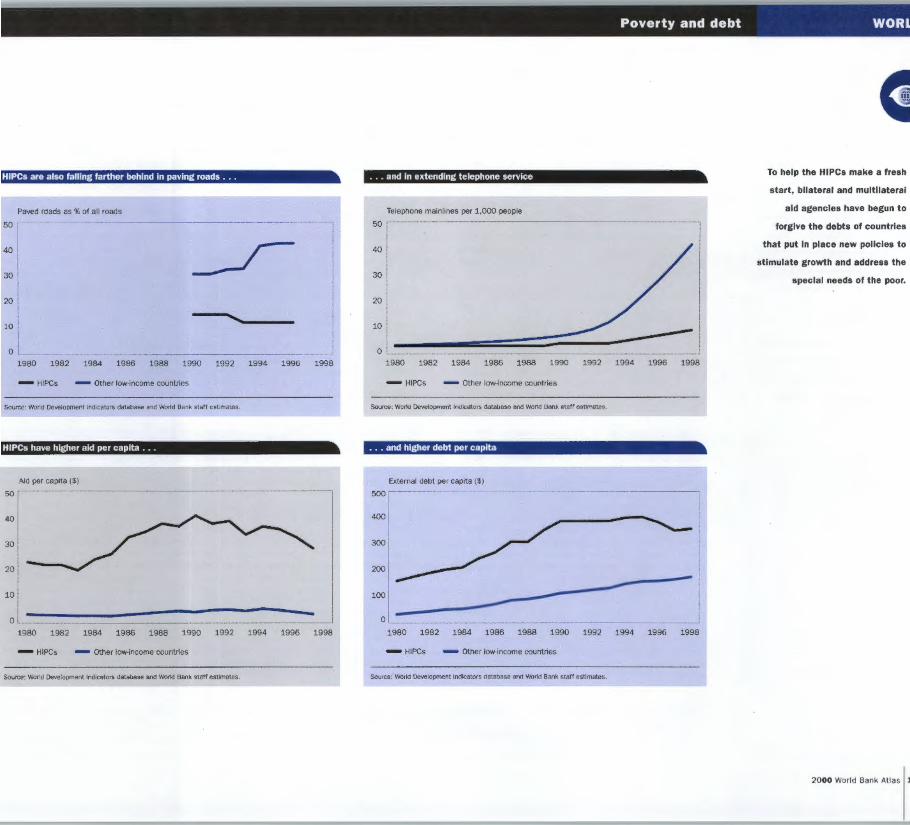
HIPCs are also falling farther behind in paving roads ...
Paved roads as % of all roads
50
l 40
30
20
) 0
1980 1982 1984 1986 1988 1990 1992 1994 1996 1998
-HIPCs - Other low-income countries
Source: World Development Indicators database and World Bank staff estimates.
HIPCs have higher aid per capita . ..
Aid per capita($)
40
30
20
10
1980 1982 1984 1986 1988 1990 1992 1994 1996 1998
-HIPCs - Other low-income countries
Source: World Development Indicators database and World Bank staff estimates.
Poverty and debt WOR
. . . and in extending telephone service
Telephone mainlines per 1,000 people 50 .-----------------------------------------------~
40
30
20
10
0 1980 1982 1984 1986 1988 1990 1992 1994 1996 1998
- HIPCs - Other low-income countries
Source: World Development Indicators database and World Bank staff estimates.
. . . and higher debt per capita
500
400
300
200
100
0
External debt per capita($)
-------------~ ...--1980 1982 1984 1986 1988 1990 1992 1994 1996 1998
-HIPCs - Other low-income countries
Source: world Development Indicators database and World Bank staff estimates.
G To help the HIPCs make a fresh
start, bilateral and multilateral
aid agencies have begun to
forgive the debts of countries
that put In place new policies to
stimulate growth and address the
special needs of the poor.
2000 World Bank Atlas l

The Atlas method of calculating
GNP per capita converts national
currency units to dollars at
prevailing exchange rates,
adjusted for inflation and averaged
over three years. Because those
rates do not always reflect
differences in prices, purchasing
power parities are used to convert
GNP per capita estimates into
international dollars. An
international dollar buys the same
amount of goods and services In a
country's domestic market as $1
would buy in the United States.
14 2000 World Bank Atlas
GNP per capita, 1998 World Bank Atlas
GNP per capita, 1998 purchasing power
Rank method $ Rank parity method $
6
7 8
• 10
u 12
2.3 14 S.l 16 17 18
S.l 20
21 22 21 25
• 27
• 32
• 39 ... 46
48 49 .. 51
u
Luxembourg
Liechtenstein
Switzerland
Norway
Bermuda
Denmark
Japan
Cayman Islands
Singapore
United States
Iceland
Austria
Germany
Sweden
Belgium
Monaco
Netherlands
Brunei
Finland Franceb
Hong Kong, China<
United Kingdom
Australia
Italy
Canada
45,100 ,.
2 39,980
34,310 4 a I'
33,040 6
32,350 7 8
30,170
29,240
27,830
26,830
26,570
25,580
25,380
24,780
24,280
24,210
23,660
21,410
20,640
20,090
19,170
• 10
• 12
Sol 14 S.l 16 17 18
S.l 20
22 23
a4 25
• Ireland 18,710 27
United Arab Emirates 17,870 3$ Israel
New Zealand
Spain
Cyprus
Greece
Portugal
Malta
Slovenia
Korea, Rep.
Antigua and Barbuda
Argentina
Bahrain
Saudi Arabia
Seychelles
16,180
14,600
14,100
11,920
11,740
10,670
10,100
9,780
8,600
8,450
8 ,030
7,640
6 ,910
6,420
6,190
6,070
33
• 38 .. 43
• 48
• 51
• 53
• 60 -53
14
Luxembourg
Liechtenstein
Bermuda
United States
Cayman Islands
Switzerland
Norway
Singapore
Monaco
Brunei
Iceland
Denmark
Belgium
Japan
Austria
Malta
Canada
Netherlands
Germany
Australia
Franceb
Hong Kong, China<
Finland
Italy
United Kingdom
36,703
29,240
26,876
26,196
25,295
24,886
24,774
23,855
23,622
23,592
23,145
22,901
22,814
22,325
22,026
21.795 21,214
20,763
20,641
20,365
20,314
Sweden 19,848
United Arab Emirates 18,871
Ireland 17,991
Cyprus 17,599
Israel 16,861
New Zealand 16,084
Spain 15,960
Portugal 14,569
Slovenia 14,400
Greece 13,994
Korea, Rep. 13,286
Czech Republic 12,197
Argentina 11,728
Bahrain 11,556
Saudi Arabia 10,498
Seychelles 10,185
Hungary 9,832
St. Kitts and Nevis __ 9_,_7_90_
GNP per capita, 1998 World Bank Atlas
GNP per capita, 1998 purchasing power
Rank method $ Rank parity method $
76
77 78
'IIi:
86
81' 88
• 90 .. 92 .. 94
• 97 -99
~ 101 • 103 -105 -107 -109
WJ
Czech Republic
Chile
Brazil
Croatia
5,150
4 ,990 86
4 ,630
4 ,620 86
4,520
Slovak Republic
Antigua and Barbuda
Uruguay
Chile
South Africa Trinidad and Tobago
Hungary
Gabon
4 ,510 70 Mauritius
4 ,170 tift Malaysia
9,62·
8 ,891
8,54:
8,50
8,291
8,231
7.6~
7,56:
7,54:
7,451
7,20:
6,69:
6,59· 6,461
6,31· 6,28.
6,181
5 ,86
5,81: 5 ,791
5,77
5,701
5,61!
5,57:
5,55
5,52· 5,281
5,16!
5,12
4,92!
4,89
4,77
4,68:
Poland
Mexico
Mauritius
Slovak Republic
Malaysia
St. Lucia
Lebanon
Venezuela, RB
Estonia
South Africa
Grenada
Turkey
Dominica
Botswana
Panama
3 ,910
3,840
3 ,730
3 ,700
3,670
3 ,660
3 ,560
3,530
3 ,360
3,310
3 ,250
3,160 3,150
3,070
2,990
Costa Rica 2,770
Belize 2,660
St. Vincent/Grenadines 2,560
73
~ 75
~ 78 • 80
82 • 84 • 86 • 88 • 90 • Lithuania
Colombia
Peru
Latvia
2 ,540 92 2,470 •
Russian Federation
Fiji
Belarus
Thailand
Tunisia
Namibia
El Salvador
Micronesia, Fed. Sts.
Dominican Republic
Paraguay
Tonga
Jamaica
Suriname
Iran, Islamic Rep.
2,440
2,420
2 ,260
2,210
2,180
2,160
2,060
1,940
1,850
1,800
1 ,770
1,760
1 ,750
1,740
1 ,660
1,650
94
~ 96
~ 99
~ 101
103
105
107
109
Estonia
Poland
Mexico
Trinidad and Tobago
Croatia
Turkey
Brazil
Belarus
Lithuania
Russian Federation
Colombia
Costa Rica
Botswana
Latvia
Venezuela , RB
Gabon
Romania
Grenada
Thailand
Namibia
Tunisia
Iran, Islamic Rep.
Panama
St. Lucia
Dominica
Bulgaria
Algeria 4,59!
St .. Vincent/Grenadines 4.~
Belize 4 ,36 .
Dominican Republic 4,33'
Kazakhstan
Paraguay
Macedonia, FYR
Swaziland
Tonga
Peru
4,31"
4,31:
4,22·
4,19!
4,18
4181
Note: Ran kings include all 206 Atlas economies, but only those that have confirmed 1998 Atlas GNP per capita estimates or rank among the top 20 are shown. See the Economy table Jpages 42-43) 1
country notes.
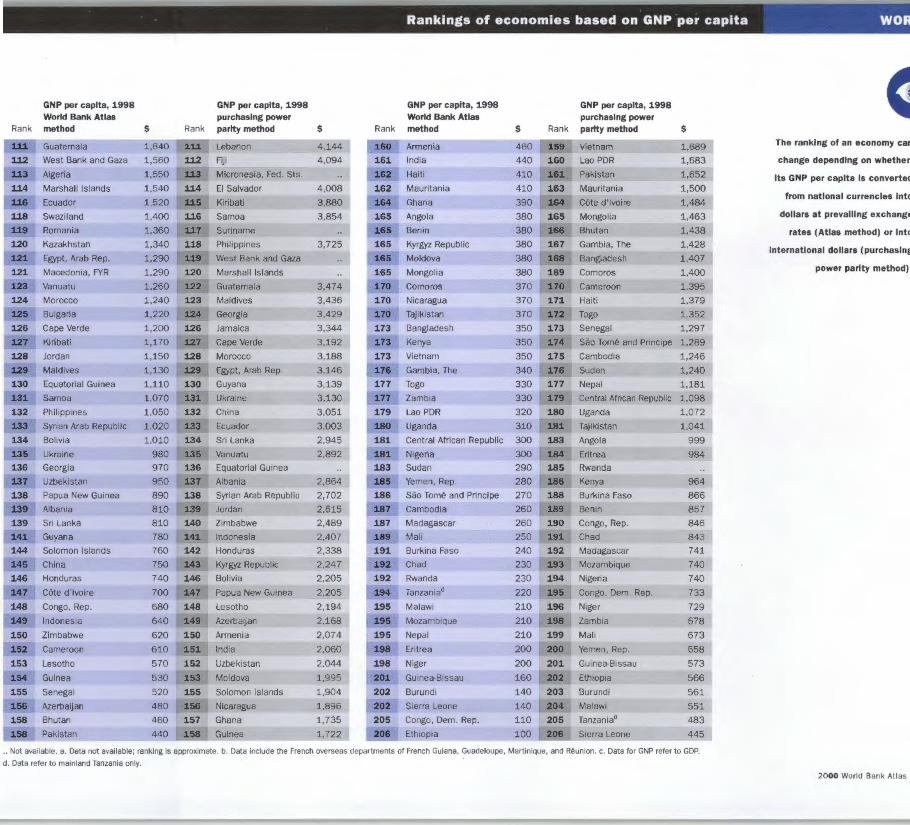
Rankings of economies based on GNP per capita WO
GNP per capita, 1998 World Bank Atlas
GNP per capita, 1998 purchasing power
Rank method $ Rank parity method $
120
11:1. 121
:1.21 124
Sill 126
i27
Guatemala
West Bank and Gaza
Algeria
Marshall Islands
Ecuador
Swaziland
Romania
Kazakhstan
Egypt, Arab Rep.
Macedonia, FYR
Vanuatu
Morocco
Bulgaria
Cape Verde
Kiribati
128 Jordan
sat Maldives
130 Equatorial Guinea
s.a:L Samoa
132 Philippines
Ill Syrian Arab Republic
134 Bolivia
:1.38 Ukraine
136 Georgia
1.17 Uzbekistan
136 Papua New Guinea
:1.11 Albania
139 Sri Lanka
2.42. Guyana
144 Solomon Islands
141 China
146 Honduras
2.47 Cote d'lvoire
148 Congo, Rep.
2.41 Indonesia
150 Zimbabwe
112 Cameroon
153 Lesotho
114 Guinea
155 Senegal
1111 Azerbaijan
158 Bhutan
1118 Pakistan
1,640
1 ,560
1,550
1,540
1,520
1,400
1,360
1,340
1,290
1,290
1,260
1,240
1,220
1,200
1,170
1,150
1,130
1,110
1,070
1,050
1,020
1,010
980
970
950
890
810
lebanon
Fiji
Micronesia, Fed. Sts.
El Salvador
Kiribati
Samoa
Suriname
Philippines
West Bank and Gaza
120 Marshall Islands
..- Guatemala
123 Maldives
1.14 Georgia
126 Jamaica
1Z1 Cape Verde
128 Morocco
sat Egypt, Arab Rep.
130 Guyana
s.a:L Ukraine
132 China
Ill Ecuador
134 Sri Lanka
Ul Vanuatu
136 Equatorial Guinea
1.11 Albania
138 Syrian Arab Republic
:1.11 Jordan
810 140 Zimbabwe
780 2.42. Indonesia
760 142 Honduras
750 :Ia Kyrgyz Republic
740 146 Bolivia
700 2.47 Papua New Guinea
680 148 Lesotho
640 148 Azerbaijan
620 150 Armenia
610 :1.1:1. India
5 70 152 Uzbekistan
530 :1.18 Moldova
520 155 Solomon Islands
480 Sl8 Nicaragua
460 157 Ghana
440 1111 Guinea
4,144
4,094
4,008
3,880
3,854
3,725
3,474
3,436
3,429
3,344
3,192
3,188
3,146
3,139
3,130
3,051
3,003
2,945
2,892
2,864
2,702
2,615
2,489
2,407
2,338
2,247
2,205
2,205
2,194
2,168
2,074
2,060
2,044
1,995
1,904
1,896
1,735
GNP per capita, 1998 World Bank Atlas
GNP per capita, 1998 purchasing power
Rank method $ Rank parity method $
Armenia
India
Haiti
Mauritania
Ghana
Angola
Benin
180
* 183 .. 185 -167
Vietnam
Lao PDR
Pakistan
Mauritania
Cote d'lvoire
Mongolia
Bhutan
Gambia, The
Bangladesh
Comoros
Cameroon
Haiti
Togo
Senegal
1,689
1,683
1,652
1 ,500
1,484
1,463
1,438
1,428
1,407
1,400
1,395
1,379
1,352
1,297
.s.eo 161
S.82 162
114 165
1111 165
1111 165
:1.70 170
:1.70 173
:1.73 173
:1.78 177
:1.77 179
180 181
18:1. 183
1111 186
117
Kyrgyz Republic
Moldova
Mongolia
Comoros
Nicaragua
Tajikistan
Bangladesh
Kenya
460
440
410
410
390
380
380
380
380
380
370
370
370
350
350
118 169 ... 171
:1.72 173
i74 175
:L78 177
:1.78 180
:1.1:1. 183
:LM 185
118 188 189
Sao Tome and Principe 1,289
Vietnam 350 Cambodia 1,246
Gambia, The 340 Sudan 1,240
Togo 330 Nepal 1,181
Zambia 330
Lao PDR 320
Central African Republic 1,098
Uganda 1,072
Uganda 310 Tajikistan
Angola
Eritrea
Rwanda
Kenya
Burkina Faso
Benin
Central African Republic 300
Nigeria 300
Sudan 290
Yemen, Rep. 280
Sao Tome and Principe 270
Cambodia 260
187 Madagascar
189 Mali
191 Burkina Faso
112 Chad
192 Rwanda
:1.14 Tanzaniad
195 Malawi
191 Mozambique
195 Nepal
188 Eritrea
198 Niger
20:1. Guinea·Bissau
202 Burundi
202 Sierra Leone
Congo, Dem. Rep.
Ethiopia
260 190 Congo, Rep.
250 :1.11 Chad
240 192 Madagascar
230 183 Mozambique
230 194 Nigeria
220 191 Congo, Dem. Rep.
210 196 Niger
210 188 Zambia
210 199 Mali
200 200 Yemen, Rep.
200 201 Guinea·Bissau
160 202 Ethiopia
140 203 Burundi
140 204 Malawi
110 205 Tanzaniad
100 208 Sierra Leone
1,041
999
984
964
866
857
846
843
741
740
740
733
729
678
673
658
573
566
561
551
483
445
.. Not available. a. Data not available; ranking is approximate. b. Data include the French overseas departments of French Guiana. Guadeloupe, Martinique, and Reunion. c. Data for GNP refer to GDP.
d. Data refer to mainland Tanzania only.
The ranking of an economy can
change depending on whether
Its GNP per capita Is converted
from national currencies Into
dollars at prevailing exchange
rates (Atlas method) or Into
International dollars (purchasing
power parity method).
2000 World Bank Atlas
8 2000 World Ban k Atlas
People
No social phenomenon has attracted more attention in the past half centur
than the "population explosion"-the surge from about 2.5 billion peopl
in 1950 to more than 6 billion in 1999, making the 20th century an era c
unprecedented population growth. As our population grew, the interval fo
adding another billion people became shorter and shorter, with the increas
from 5 billion to 6 billion coming in only 12 years . Most of the addition<
billion were born in low-income countries.
Living standards have improved in developing countries over the past 5
years. Mortality rates have fallen, and primary enrollment ratios continue t
improve. Many countries have reduced poverty. In general, people today ar
healthier, better educated, and better fed .
But we should not be complacent: economic and social turmoil and th
continuing spread of HIV I AIDS put the futures of millions of people at ris1
And although the population growth rate is slowing, over the next decad
70 million people will be added to the world's population each year. Tha
will tax the ability of many developing countries to provide their people wit;
health and education services.

Population
Depuis un demi-siecle, aucun phenomene social n'a autant marque les
esprits que << !'explosion demographique » , cet essor qui a vu Ia population
mondiale passer d'environ 2,5 milliards d'individus en 1950 a plus de 6
milliards en 1999, faisant du xxe siecle une ere de croissance demographique
sans precedent. Ce mouvement s'est accompagne d'une reduction croissante
de l'intervalle necessaire a Ia population du globe pour progresser d'un
milliard: ainsi, le passage de 5 a 6 milliards s'est fait en 12 annees seulement.
La majorite de ce milliard d'etres humains supplementaires a vu lejour dans
des pays a faible revenu.
Les niveaux de vie ont progresse dans les pays en developpement au cours
des 50 dernieres annees. Les taux de mortalite ont diminue, et les taux de
scolarisation primaire ont continue d'augmenter. Dans beaucoup de pays, on
note un recul de Ia pauvrete. D'une maniere generale, les individus
d'aujourd'hui sont en meilleure sante, mieux eduques et mieux nourris.
Mais il .ne faut pas se laisser aller a un optimisme excesif : !'agitation
sociale, les troubles economiques et Ia propagation continue du VIH/ SIDA
representant une menace pour l'avenir de millions d'etres humains. Meme
si l'accroissement demographique tend a diminuer a l'heure actuelle , ou
prevoit une augmentation annuelle de 70 millons d'individus supplementaires,
et ce pour Ia decennie a venir- ce phenomeme aura des repercutions sur
!'aptitude d'un grand nombre de pays en developpment a dispenser des
services de sante et d 'education a leur populatio"n.
Poblacion
Ningun fenomeno social ha despertado tanto in teres en los ultimos 50 aiios
como Ia "explosion demognifica" -el aumento de unos 2.500 millones de
habitantes en 1950 a mas de 6.000 millones en 1999- , que hizo del siglo XX
una era de crecimiento demografico sin precedentes. A medida que Ia
poblacion fue aumentando, el tiempo en que crecio en 1.000 millones se hizo
cada vez mas corto; ya que paso de 5.000 a 6.000 millones en tan solo 12 aiios.
La mayorfa de los 1.000 millones adicionales de personas nacio en los pafses
de ingreso bajo.
Los niveles de vida han mejorado en los pafses en desarrollo en los ultimos
50 aiios. Las tasas de mortalidad se han reducido, y las tasas de matrfcula en
Ia escuela primaria siguen aumentando. Muchas naciones han logrado
reducir Ia pobreza. En general, Ia poblacion en Ia actualidad es mas sana,
tiene mas educacion y esta mejor alimentada.
Sin embargo , no debemos caer en Ia complacencia: las conmociones
economicas y sociales, asi como Ia constante propagacion del VIH/ SIDA
ponen en peligro el futuro de millones de personas. Ademas, si bien Ia tasa
de crecimiento de Ia poblacion se esta desacelerando, en Ia proxima decada
Ia poblacion mundial aumentara anualmente en 70 millones de personas.
Esto socavara Ia capacidad de muchos pafses en desarrollo para prestar
servicios de salud y educacion a su poblacion.
20 00 World Bank Atlas

-
.......
0 Less than 55
0 55-64
0 65-69
0 70-74 ....... 0 75 or more .i. • .. 0 No data
18 20 00 World Bank Atlas
Life expectancy
Life expectancy at birth, 1998 The average number of years a newborn baby would live
if patterns of mortality prevailing for all people at the time
of its birth were to stay the same throughout its life.
".
~
Dlstllbutlonolwwld poplll.aon..,... ___
~ .., ... expectallc:J. birth
Less than 55
0 55-i;4
0 6!Hl9 ......................... 0 70-74
0 75ormore .......................... 0 No data
~-.
Esperance de vie a Ia nalssance, 1998 Nombre moyen d'annees que vivrait un nouveau-ne si les
tendances de mortalite observees pour I' ensemble de Ia
population au moment de sa naissance restaient
inchangees tout au long de son existence.
Lire expectancr .t blrtll,1998, r-a
East Asia & Pacific 69 Europe & Central Asia 1--====--•69
Latin America & Caribbean
Middle East & North Africa 1--=== South Asia
Sub-Saharan Africa
High income 78
0 20 40 60 80 100
Esperanza de vida al nacer, 1998 NOmero de aiios que viviria un recien nacido, en promedi<
si las tendencias de mortalidad de toda Ia poblaci6n e
el momenta de su nacimiento se mantuvieran constante
durante toda su vida.
t ....
,,. /
Lire expectancr .t blrth,1998, ,_.
Economies GNP $
millions 1998
Population millions
1998
GNP pel capiU
~ 199E
Less than 55 55-i;4
6!Hl9
41 171,948 569 3{)( ........................................................................ 22 803,150 1.498 54( .................................. 29 1,900,669 1,024 1,86( ......................................................................................
70.::.!~................ . .. :5.~ ....... ~!.1.~:5.,~.9.:5. 1,87 4 ... .. ~!.!1.~ 75ormore 48 22,750,913 931 24,43(
······································································································· No data 12 12,293 1 16,11(

Tasa de mortalidad infantll, 1998 NOmero de muertes de niiios de menos de un aiio de edad
por cada mil nacidos vivos.
- ... 4
\
-
.....
0 0 10-24
0 25-49
0 50-99
0 0 No data
Economies GNP $
millions 1998
Population millions
1998
GNP per capita
$ 1998
.. L.~.--~.~~.a.~ .. ~9. ...... :4.?. ... 3.~,.~.3.~, !~:4.......... 988 ....... 3.~,.~.~9.
.. ~9.:::?.~.............. 53 ....... ~!.6.:4.6.:.3..5.:4........... 567 ..... 3.,.9.9.9. ?.5.::19.. ... .. . .. .. ~~.. . .~ :.0.~~,.~3.3. ......... ?:3.82 1,350 50-99 42 851,913 1, 796 470 ............................. 100 or more 21 106,882 .................. 3.6.~ ... ........... ~10 Nodata 12 12,293 1 16,110
Taux de mortalite infantile, 1998 Nombre de deces d'enfants de moins d'un an pour mi lle
naissances.
East Asia & Pacific I===== Europe & Central Asia
Latin America & Caribbean
Middle East & North Africa 45
South Asia 75
Sub-Saharan Africa 92
High income
0 20 40 60 80 100
Infant deaths
Infant mortality rate, 1998 The number of deaths of children under one year of age
per thousand live births.
N~ .. \
' ~ ;
• 1l. i·:. -~ ~ 1\ t ~ ""·•
~w~~~--· ., j)
I' •• -t p . "'~ •.
Less than 10 e 10-24 0 25-49 0 50-99 0
100ormore 0 No data 0
( ~-..
"
i. ~
~
20 00 World B a n k Atl as
: .~
-
0 Less than 10%
0 10-19%
0 20-29%
0 30-39%
0 40%ormore
0 Nodata
0 2 000 World B a nk Atlas
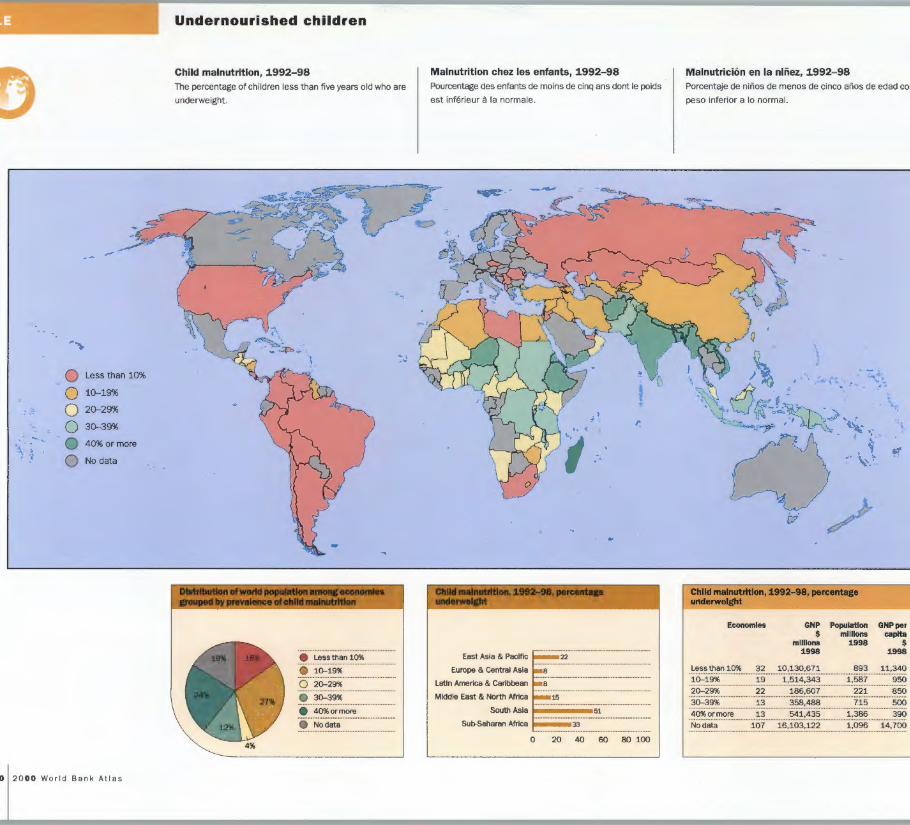
Undernourished children
Child malnutrition, 1992-98 The percentage of children less than five years old who are
underweight.
Dlatrlbutlon of world popullltlon ..._, --&fOUP8d by prevalel- of clllld llllllnutrltlon
Less than 10%
0 10-19%
0 20-29% ············•····•········•· 0 30-39% ........................................................ e 40%ormore
·o Nodata
Malnutrition chez les enfants, 1992-98 Pourcentage des enfants de moins de cinq ans dont le poids
est inferieur a Ia normale.
-
East Asia & Pacific ~ Europe & Central Asia 8
Latin America & Caribbean 8
Middle :~::a::~:~:~~: :: :: :15:: :: 33
51
0 20 40 60 80 100
Malnutricion en Ia niiiez, 1992-98 Porcentaje de nifios de menos de cinco afios de edad co1
peso inferior a lo normal.
Economies GNP $
millions 1998
Population millions
1998
~,
' &'t .;
GNP per capita
$ 1998
.. L.~".~.~~~~--~9.9.6. ....... :3.? y,J,~:3.<:>,~?~ . f3.~~-- __ 11,34o 10-19% 19 ...... ~!5..~~,-~~:3. .......... },~?_.. 950 20-29% 22 186.607 221 850 ............................................................................................. 30-39% ................. ~:3. ..... ..... .3.~,~ ...... ....... !1.~ ................ 5.<:><:1 40% or more 13 541.435 1,386 390 No data 107 16,103,122 1,096 14,700

lcceso al agua potable, 1990-96 •orcentaje de Ia poblaci6n que tiene suficiente acceso a
na cantidad adecuada de agua potable .
... ~
0 0
:.:"' 0 0 -.. 0 \ . . 0 No data
~oftllepopuldonwltllto ......... 1980-88
Economies GNP Population $ millions
millions 1998 1998
Less tha.~. ~.O.:*.> ......... ~~ ............... l.~ 7,649 534 40-59'l6 .................... P ....... 2.~~:9.9.~ :··········· · ·· 368
GNP per capita
$ 1998
280 720
2,180 . ~<.>::.!~ ...................... ~~ .......... ~,~~~,.9.~.1. 833 28 ... ~,1.~~,.!~ :::::::: :?,~3.~ ......... ~,.1.~ 80-94%
95%ormore No data
35 9,14 7,338 ................................... 60 14,336,037
367
956 24,930
15,000
Acces a une eau potable, 1990-96 Pourcentage de Ia population ayant acces raisonnable
ment satisfaisant a une quantite adequate d'eau potable.
East Asia & Pacific 84
Europe & Central Asia n.a.
Latin America & Caribbean --=:= 75
Middle East & North Africa 71
South Asia = 77
Sui:>Saharan Africa = 43
High income 85
0 20 40 60 80 100
Safe water
Access to safe water, 1990-96 Percentage of the population with reasonable access to an
adequate supply of treated or uncontaminated water.
~ I '
r
Dl.trlllutlan of-'d populdon ___ __
......,..,_to ..........
Less than 40%
40-59% 0 60-79% 0 80-94% 0
95%ormore • No data 0
.. -l. -' ~~~
t "c
., '
~
20 00 World Bank Atlas

-- -
"'"'!>
0 0 0-{).9%
. ~~ 0 · .. 0
.\ .... ~ '" 0 > "i 0 No data
2 2 20 00 World Bank Atlas
Change in personal spending
Private consumption per capita growth rate, 1990-98 The average annual percentage change in a country's
private consumption per capita.
....... .., ....................... ... e Less than 0%
6 0:::0:9% . o· i:o::i9% ......................... 0 2.0-2.9%
0 3.0% or more
·a Nodata
Taux de croissance de Ia consommation privee par habitant, 1990-98 Taux moyen annuel de variation de Ia consommation privee
par habitant.
Pllnilllaar I I IJIIDnPII' ........... IIIIIe, U80-88,....-. ... ,..
East Asia & Pacific
Europe & Central Asia 2.6
Latin America & Caribbean
Middle East & North Africa
South Asia 3.5
Sub-Saharan Africa
High income
-2 0 2 4
5.7
6 8
Tasa de crecimiento per capita del consumo privado, 1990-98 Variaci6n porcentual anual media del consumo privado
capita de un pais .
PdnllllaanJ ... ,..,...,._......, ~....-. ... ,.. __ _
Economies GNP $
millions 1998
Less than 0% 42 1,435,916 ............................................................................
Population millions
1998
627
GNPpc caplt
199
2,29
. ~.:~~·············· 25 5,885,741 411 14,31
.. 1.:.<>:::~:~ . .. . ... ?.?..... ~~,~~~!3.9.~ .................. ~~~ ....... ~~:.8.9.
.. 2.:.<>:::?.:~1.6. . . ..... 1.~ .......... ~!.72~,.!19 ....... ~!.~ ........ ?.:.9.~ 3.0%ormore 30 4,186,967 ••••. ~.:9.~9 ..... - ~'-~ ·Nii.iiaia ·· · · ·68 · ····597;930 347 1.12
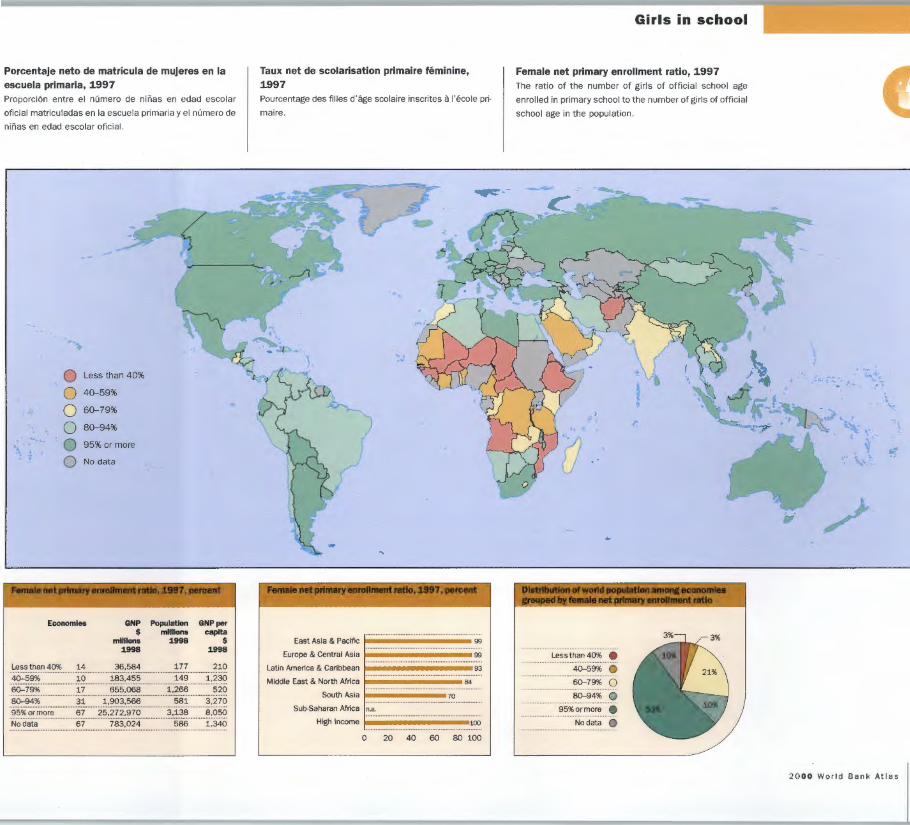
Porcentaje neto de matricula de mujeres en Ia escuela primaria, 1997 Proporci6n entre el numero de ninas en edad escolar
oficial matriculadas en Ia escuela primaria y el numero de
ninas en edad escolar oficial.
( -~
.....
0 Less than 40%
0 40--59%
0 60--79%
0 80--94%
\ 0 95% or more > . ; 0 No data
Fem8le net prlnwy enrollment rdo, 1917, .--t
Economies GNP $
millions 1998
Population millions
1998
Less than 40%
40-59%
60-79%
14 36 ,584 177 ..................................... 10 ... 1.~~,:<\~~ . . .... Y1:9. 17 ....... ~~?.,Q~~ 1,266
GNP per capita
$ 1998
210 1,230
520
80-94% 31 1,903,566 .................................................................................... 581 ......... ~,?!Q 95% or more 67 25,272,970 3,138 ............................................................................................ No data 67 783,024 586
8 ,050 1,340
-,
Taux net de scolarisation primaire feminine, 1997 Pourcentage des filles d'age scolaire inscrites a I' ecole pri
maire.
.. ___.13
Female net primary enrollment ndlo, 1917' .--t
East Asia & Pacific 99
Europe & Central Asia 99
Lat in America & Caribbean ~93
Middle East & North Africa 84
South Asia 70
Sui>Saharan Africa ln.a High income 100
0 20 40 60 80 100
Girls in school
Female net primary enrollment ratio, 1997 The ratio of the number of girls of official school age
enrolled in primary school to the number of girls of official
school age in the population.
I ...
.. )
~. #',
Dletrlbutlan of-'dpcllllle.tlan 81110111--I(JGUped bJ fenlllle net prlnwy ennlllment ndlo
Less than 40% 0 40-59% 0 60-79% 0 80-94% 0
95%ormore 0 No data 0
,.
20 00 World Bank Atlas

Population Population Prlvate Safe growth consump- water
rate tlon per capita % of average population
% annual with thousands per year % growth access
Economy 1998 1990-98 1990-98 1990-961
Ule ...... laney
at birth
years 1998
1-. Child Net
mortality malnutrttlon -rate primary
per 1,000 %under-live births weight
1998 1992-98'
enrollmont
% 1997
Female labor force
%of
total 1998
J\fg~a~is!a~ ..... .... ... ... .... ... ?~,()5! 5 .0 0.2 2.6 4.2
12 76
46 149 49 33 35 --------------------------Albania ................................. 3., ::1:3.!:! .. 5 .9 72 25 8 41
Alge~ia . 29 ... 922 ... - 3.5 71 35 13 93 26 American Samoa 63 Andorra 65 ............................................................................................................................................................................................ ··············-!':ngol.~ ... .. ... ... ... .... 1?.()()1 ...... ::!:? ............ ::§.· ::! ............ }? .......... ... 4J ........... J:?~ ................................... ::J.4.... .... ... 4§ .... _ !':ntiguaa~dBarbuda. 67 0.6 95 75 1!. .......................................................... _ !':rg~~!i~~ .......................... 3§,!?5 Armenia Aruba
............... :;!.!.9.? ... 94
1.5 1.0
2. 7 65 73 19 ....................... --8.2 74 15
2 3
100 32 48
Australia .......................... y:~. !.5.~ ...... l:o:.3 ........... ?J!. ........... !1.!:! ............ J.!1 ... ............. ? ............................... !0.0 ............ 4:3 ... _ !':u.~tr.l~ . ~, ()!!! (),?. . 1. :~ . J? ? . 1c:J() :"() . ~~~aija~ ............................ ?.,!0)1.9 .. 1.4 71 17 10 44 B~h.~~.a~,. !:h~ .. 294 2.0 97 74 17 . }().9 .. ......... 4! .. . Bahrain 643 3.5 100 73 9 99 20 ........................................................................................................................................................................................................... -~~-~gl~d.e.~~ .. .... ............ .... ... 1_?5,f3?!:l 1 .9 2 .1 84 59 73 56 70 42 Barbados 266 · 0.4 0.8 100 76 14 .. 95 46 ............................................ Belarus ................... 10,239 .. 0 .0 - 3.4 68 11 84 49
-~el.!li~_fl1... . ....................... ~() , 2():" ......... .0.:.3. .................... 0.:.~---· . J?. .13 !()() :"1. . Belize 239 3.3 1.9 73 75 28 6 100 24
Benin ................................... 5.,.9:"1! .. 3.3 0.6 50 53 87 29 50 48 Bermuda 63 0.6 .... ......................................... .. ....................................................................................................................................................... . Bhutan 759 3.4 64 61 61 40 ...................................................................................................................................................................................................................................................................................................... Bolivia 7 ,950 2 .7 ........... 0.9... . ... 55 . . ............ 60.. . .... !:!.!:>.. 38 $ii~6~~ aniiH~rieso~i6a •• .••. ::J..t~!l ••• :::2:4 13 ········ ···· 3a··· Botswana ........................... ~.,!';6?.... 2.9 0.8 62 83 46 Brazil ........................................... !135..,.8.7..4: 1.6 3.3 33 6 94 35 Brunei 315 2 .9 9 89 35 .......................... _ ........................ ..
B.ulgar.'a . . 8,2(;7 -0.8 -1.5 .................. ........ 71 14 ............................................. !:!.9..... 48 Burkina Faso ... 19 •. !:;!0... 2 .7 0 .6 44 104 33 25 47 Burundi .................. § .. !J4:8.... 2 .6 --4.0 52 42 118 33 49 Cambodia ............................... 1~ .. <1~.8... 3.3 13 54 .......... ~02.. 100 52 Cameroon .......................................... ~<\.,_?.<?.?. 3.2 0.0 41 54 77 22 ................... ?.9..... 38 Canada ..... .39 .. :301... . 1.2 0.9 99 79 5 100 ........... <\? ..... . <;al)<>\/er.d~ ............................ <11..6... 2.8 0.1 51 68 ............ ?.5.... 100 39 c;axm.~n.Jsla~ds ........................ ::J6 ........... ·- .. <;e.~tr~l A.!ri~~-n ... ll~p~blic .. 3,.~fl.O_ 2.4 -2.1 19 44 98 23 38 <;~a9 J ,?!l?. ?::" 2.~ :"? 9.9. 3!') } !'j ~~ . Channel Islands 149 0.6 79 6
Chile ....................................................... !<\.,_1!2..~ 1.8 7.0 .................... !3.:5.... 75 10 1 89 33 China ........................................... ~ .•. 2..3.!l.,.?!'J.!:l.... 1.2 8.0 !:)() 70 ................... 3..1 ____ . 16 ... 100 ............ <\~ .... . .... ~.O.~S ... K.O.".!k<;.~. i_n.~ § ,?.!l?. 2.3 2.9 79 .. .. :;! ............................... !:l.?. ........... }7 .. . ... t>1.a~ao. , <;hin~ .. 459 3.0 2.2 78 6 .. ... . .... .......... .. 81.._ ................ ~.? ....... . Colombia .............................. ~0,8<:J:". . 2 .2 1.9 78 70 23 8 89 38 Comoros 531 2.9 --4.9 48 60 63 26 45 42 ................................................................................................................................................................................................................................................................................................................................. c;o_n!\~., .. Pe..m_, !leP.· ........... 48_,2~?. . 3.6 - 9.2 27 51 90 34 48 43 c;o.ngo, Rep, .. 2 .•. 783. . 3.2 - 1.6 47 48 90 76 43
Costa Rica ........................ .3,52.?. . 2 .3 1.0 92 7.!... ...................... !.::1 ...................... 5. ....................... ? .9. ...................... :3.1. ........ . Cote d' lvorre ................... ~4,4!1? . 3.1 - 1.8 . ?..? ................ :".f3 ....................... ?!l .................... ?.4: ....................... ?.0. ...................... 3..::! ....... . Croatia ....................................... :".,.?().! _ -0.9 63 73 8 1 100 44 Cuba .. !1,1,():3_ 0.6 93. .................. .!?. ......................... ...? .............................................. !()() ...................... :3.9. ....... . (;yprus ................................. }5.3 1.4 100 78 8 96 39 c;ze.~h.He.p~bhc.. .... .... ... ... 19.?9.5 -0.1 Denmark .............................. ? .}()1... 0.4 DJibO.U.!i .. 636 3 .0 Dominica 73 0 .1
!4 2000 World Bank Atlas
2.8 3.0
0.4 24
5 5
106 15
1 100 100
27
47 46
Population Population Private Safe Ufe Infant Child Net Female labor fofce
growth consurnp- water expec- mortality malnutrttlon -rate tlon tancy rate ..... 'Y
per capita %of at birth enrollmont average population
% annual with per 1,000 % under· %of total 1998
thousands per year %growth access years 1998
live births weight % 1997 Economy 1998 1990-98 1990-98 1990-96' 1998 1992-98'
[)!J.J11i.~ic.~~. R.eP~~.Ii<: ............... ~, ?.,5:" ... . Ecuador ........... .. ~.2.A?.?. Egypt,A~aiJ .lle!': .................. 61..,4:9.! .. El Salvador ... !')_,.()?..?
E.9~!'!o.n~I_ .. GE.Jn~~. .... .... .... . ...... 4:?.! ..
2.1 2.4 2.3 2 .4 2.9
Entrea ............................ .::3.,.?!.!:! 3.0
2.4 0.2 2.1 3.7
- 5.3
Estonia ............................... 1. .. 4:5() .. - 1.1 0.0 E.!hi9pi~ .................................. ?.1.., ;!13?.. .. 2.6 1.0 Faeroe Islands 44 ....................................... fiji __ 790 1.0
Finland ............... 5.,.1?3... 0 .5 -0.1
France ........ !58.,.8:"~. 0.5 0.8
71 71 6 94 30 70 70 100 27 M ~ ~ ~ ~ ~ ........................
55 69 31 11 89 36 95 50 106
7 51 61 .............................. 70 9
80 44 28 ..............................
100
35 47 49
27 43 107 48 27 41
100 73 19 8 100 29 ...................
98 100
77 4 78 5 ... ....... ... ..
100 48 100 45 .. ....................... ..
French. Polynes'!' .......................... ?2..?. 2.0 ......................................... . 72 53 53 73
11 ......................................................................... Gabon ................................... 1.,.18_() .. 3.0 .t>.a.r:n. .~.'~-'--!:~e..... . . .... 1,21,6 4.0
--4.1 -0.2
67 76
86 45 26 58 45
(;~orgia .............................................. 5..,.~4:.? 0.0 .................... .
76 15 89 47
G~riTl~ny ............................ !32.,04! . 0.5 Ghana .. 18,.460 . 3 .1
Greece .......................................... _!()_,_5:1.5..... 0.5 Greenland 56 0 .1
0.9 1.2 1.3
56 77 5 ................................ 60 78 ...............................
65 6
18 68
100 42 . .............................. . 27 51
100 37
............................................................ . .................................................. .. Grenada Guam Guatemala .............................. Guinea Guine&sissau
96 0.4 149 1.5 . .................................... ..
........ !(),!!:!9.. 3.0 7,082 3 .0 •••• ~;i~~ .... 2.5
<3~.Y~.n~ .. 849 0.9
Haiti ...................... ...7.,.64:~ .. Honduras .................................. 6.,.1??.
2.4 3.3
2.5
1.7 1.6 ....... 2.3 5 .6
0 .3
85 72 14 77 8 .. .. .. .. .................................................................................... .
67 64 42 27 70 28 . ............................. . 62 47 118 .. 33 47 ······ 53 ···· 44 ·········· i2a ·········································3s·············· 4o 81 28 65
64 54 69
57 71 36
18 28 25
93 34 43
89 31
~~ngary .............................. ~.0.1.:1.:" -0.4 - 1.0 71 10 97 45 Iceland 274 lnd1a 979,673
Indonesia .... .... ..... 2§i:~j8 _lr~n,. l ~laJT1i_c llep. _ .......... ~1,94:7.
.lr~q ......................................... ?.2,.32..1! .. .
1.0 2 .0 1.9 1.9 3 .0
0 .4 4 .0 5 .9 1.2
......................................................... 100
81 62 83 44
79 3
63 65 71 59
70 43 26
103
53 34
100 45 71 99
32 40
16 89 26 12 70 19 ..............................
Ireland ........................ .3.,.7()5 0.8 3.9 .. 76 6 .. 100 34 ........ ............................. . .................................................... . Isle of Man 76
Israel ............. ___ 5_,_9.§3__ 3.5 3.4 99 78 6
_lt~IX... . ... :5.7 ,.5~9 ........... <J:? (),4; J!l • 5 Jamaica ...................... 2 ,.?!6.. 1.0 - 1.1 70 75 21 J.apan . . ...... ~?.6 ,.4!0 0.3 1.6 96 81 4
Jordan . .... .... .... .... .... ..... .... . ..... :".,.??.:! .. . Kazakhstan ........................... !5,.5!;!.3 .. .
.K.~n.Y.~ .................................................. ?.!'J.,.?!:J.5 .. . K1nbat1 86
.K.o.re..a., ()~fl1.: .. 13.~P.- ...................... ?.:3.,.!!.!
.Ko.re.a, .. R~P.: ........................... ~13.,.4:30 ... . Kuwait ................................. I ,8f36 .. . .K.x.r.~--Fl~!'.~. ~~-i~ ............................... <\.,_?.!;l!:l Lao PDR . . ............. '1.,.9.! ~- .. Latvia ................................. 2.!.'~:".!! .. Lebanon ................................................ :",.?.:l..<J ... . Lesotho .............................. 2.,.05.1!.
5.2 -0.7
3 .1 2 .5 1.8 1.1
- 1.9 1.0 3.0
-1.2
0.2
-0.2
89
53 100
....................................................... 4.6
- 5.2
5 .3 -3.9
83 100 ..............................
81 39
100 52
71 65
27 22
51 76 ........................ 61 58 63 73 77
54 9
12 67 26 54 96 70 15 70 55
................................ 27 93
10
5 8
23
32
2
41 100 38 ...........................
96 46 ............................... 100 41 ............................
68 23 ............................... 47
67 46
100 64
..............................
11 99
41 31 47
40 69
3 16
............................... 100 50 ...............................
29 74 37 ...............................
Llbena .................................. 2 ,.9§2 ..
2.1 2.5 2.8 2 .6
30 47 114 40
~'IJX.~ ................. 5.,392. .. 90 70 23 5 100 22 Liechtenstein 32 .............................................................................. Lithuania ........................................... 3..,.?.0.3. -0.1 - 2.0 72 9 48
-- Private Safe lfOWth consum~ water rate lion
per capita % of a.oerage population
" amual with thousands per year % growth access
:conomy 1998 1990-98 1990-98 1990-96•
,~xe_m_b.o.~rg _. 427 1.6 0.6
Ulo expectancy
at birth
"'"" 1998
77 4.7 .. 73
Intent Child Net
mortality malnutrition -rate primary -mont
per 1,000 % under· liveblrths >Neight %
1998 1992-98" 1997
4 16 95
Female
labof
Ioree
% of total 1998
37 41 ~<Jg<l.~.O.~i~, .. f.:Y.~ owo w "" """ ~ • • <J.l,() 0.8 ........................................... . ................................................................................... .
~!'.~.~~~a.~g~r. •••••w 0 .!~,.?.§l.:2 3.2 1<'~".:-'!i _;Q,?.?_<I ___ :)"_l, _ ~a~".¥.'J.i!' ...... w •••••••••••••••••••••••••••••••• :2~.!.!?..<J..... 2.8 ~aldives 263 3.0 ··································-··-···- ············-····-···-···-.. ·-· ~ali ...................................................... !9..,.?.§l.§ 3.2 ~alta 377 0.9 ...............................
-1.1 4.5 2.4
-1.1
29 45 89 89 37
100" ~arshall Islands 62 4.2 77 ......................................................................................
58 42
·················-···-····-···-72 67 50 77
92 134
8 31
117
40 30 20 43 27
62 100 --------·---·-·--------------100
31 100
45 49
46 27
.launtania ................................... 2.. , .?.?.~ 3.2 1.9 64 54 90 23 15
53 44 ...................................... .lauritius 1,160 1.3 3.4 98 71 19 97 32
'!a.Y.9.!!.e.. ________________ !.2..?. _ --------·--·--->:l~~l~?-···-··················-··-···-··-···-···~?.!.~§ ... --··-···-~:.<! .. _. _____ :::Q,.~---- 83 >:1!~'.!'.~~-"-ia, Fe<,!, __ ?.!•· 113 2.4 100
72 67
...........................
30 100 33 .............. ····-·· 28
<,loldova ··················································"· '·?~.!,! -o.2 9.2 56 67 ................... !~ ........................ :.: ........................... :.: ......................... :.e .. . <,lonaco 32 ......................... .................................................. ... .................... ~?."fl".l.i~.. ....... .. .. . . ....... .... ~- ·.?~:":.... 2.2 <,lorocco ........................................... :2?..,.!.!.? 2.1 1.3 'f.1oza'!'!Jlg~e ....... _} ,§"_94 7 2.6 0.7
'<lJ.~~mar :1;~,.:1:§."-···-····-···1.::.~ 2.7 ~amibia .. ! .,.§§.?.._ 3.0 -2.6
:ie..P-".1______________ ······-···--:z.~,_851 2.8 1.9 ~etherlands 15_,_698 0. 7 1.6 ~etherlands Antilles 213 1.6 'Jew Caledonia 207 3.0 ·····································································································-'Jew Zealand 3, 7.§12 1.4 1.8
~i-~_a..r.~fl~~ ··"·'·?.~~ 3.2 0.6 ~iJ!~'. .... _ ·······-··-··-··- - __ ... !9.,.1.:~:3. ... -····-····-~'-~·-·-··-···--::<l:.~ ~igeri.a·····-···-·-···-···---·--- _ 120,817 3.3 ___________ -:1.:,.~---·-'Jorthem Mariana Islands··· · · · ·····ea-·-···-···-·
52 32 38 57 44
100
..... 87 81 53
_ }~--
66 67
50 49
45 134 ····················-·········· 60 54 58
78 67 77
78 5
9 10
88 67
26 34 43 26 57
............................. 99 94 63
100 ................................ 76 14 73 7 ............................... 77 68 36 46
__ 5..~ --118
76
............................................
12 50 39
100 80 19
·················-···········-································································- ............................................................................................................................................................. ~?..'.~~Y. ··································· ·············"· '-~ -'l.:Z. ................ 9.:.13. ................. 3.·6 100 .... ............. ?!,! ...................... :4 . . ................ !92 ... . ?.'!'a.~. ..... ......................... ... ... . ..... ~.~Q:Z. .............. ?.:<!.. ... .. §fl. ............. ?..3. ................ !~ ... . ... :Z..3. ................ §! 0 akistan ...................................... !.:3.!. ,.?~:Z. 2.8 2.6 60 62 ..................... ~.!.... 38 ......................... . 'alau 19 2.9 100 71 25
47 35 48 43 41 40 40 43
45 35 44 36
46 16 28
......................................................... . .........................•
,~~~.".'.". ................................................ _?,.??.:1:.. ... _ 2 .0 3.4 84 ··-··-··-·?.·~---···-···-···- .?..! .......... ·---·-··.? 90 35 ~.ap_u.a... N..e.~. '3..u.in~.a- ........ ·······""·E:l9..:3_ ............ ~.§ ... _. __ ..1:.:.! .. _ _ _____ 2_ll. _________ 5._?___________ 59 30 ·--· 42 P..~'.~~.a..Y........ . ....................... ?.,.:Z..!.~ ................ ~:.<! ........ -..... -o:.! .................... -~!1 70 24 97 30 Peru ......................................... ?",_!,!()_:!. 2.0 2.9 80 69 40 8 ................... ~.~---· 31 P..h.i_Up~i~(l-~ ............................. .J?.,.! ?_:1; 2.6 1.4 83 69 .................... ~.?.... 30 100 38 Poland .......................................... ~~,.E:l?.§ 0.2 4.8 .......................... 73 10 ...................................... ~.9.... . 46 P..~r.!.~fla..L .. _ ..... _ ....................... ~.,-~§.8 0 .1 2 .4 82 75 s. ........................................... !9..<J. ..................... ~~ ...... . P..~~'.!<>.~i~E. ._ _ ___ }!!,!§.() 1 .2 ............................ ~.?............. .?.§ ...................... !9. ...................... - .............................. _37
9.a..ta._r.·-····-··--····-···-····-···-· J":Z._. __ Elc:l._ ·-·-·--··-····- 100 ··-··--?..~·-···--·-···- 18 6 85 .................. ~~ ---··· ~~".'-"-.~"--·········-·-- -- _:2_2._,§.9_3. _______ :::(),~ !.:.! ...................... §.? .................. §.~ ........................ :Z..! ................ _ 6 100 44 ~'!.S.>;.i~-~.X~9.~r.a..!i?.D_ _ . !.'!§.,.~9..9.._ -o.1 4.5 ·······-··- 67 17 3 100 ............... '!§l .... . Rwanda ............................................... ~ •. !().? 2.2 -o.4 41 123 29 49 Samoa 169 0.8 68 69 25 95 ...............................
142 3.0 - 7.9 64 49 16 ............... . ............................. . 93 72 20 ..............................• ~~-~-~-i .. f.l.r~.b..i!'. 2.9..,.!.3..~... 3.9 15 . ............................................................................. . 58
22 ........................................... ~~.".'l.fl~l ...... -...... §l ,.<J.?_9. _ 3,g ____ _Q,§. _____ _ 43 50 52 69 54
~~Y-~.'!.e.l~_s_ 79 ··-··-l,J ____ !.Q,?. _ 6 97 72 15 ··-··-····-···-··-··--····-
~ie..r.r.a.. .. ~_e.9..n..e._ .. ~!.fl.?..?.... 2.8 -3.3 34 37 169 ............................. 37 100 ~iD.fl~P.?.r..e.______ ··················-3,164 2.2 4 .5 77 4 91 39 ...................................................
73 9 SloV.."..k ... ~~P..~~I.i~ ............................ 5..,.:3.~! 0.3 -o.9 ....................... . ............................................ 48 46 47
SloveD.i.". .................................................... :!., .~?..:Z.. ........... :::9.:.! ............... _.3 .8 98 75 5 .......................... 94 ................. .... Solomon Islands 416 3. 7 71 .............. ...... .
Poputatlon Population Pltvate Safe growth consump- water .... -
..... capita " of average population
% annual with thousands per year % growth access
Economy 1998 1~98 1~98 1~96·
..............................................
Ulo expectancy
atblrtll
"'"" 1998
Infant Child Net
mortality malnutrition -rate prtma<y
per 1,000 % Under· -· mont
live births weight % 1998 1992-98- 1997
Female
labof
Ioree
% of total 1998
Somalia .................................... ~.,<!.1.§ 2.2 . . ........ .... ..... 48 37 Ul ~ ..................... South Africa ... ~:1.,_:1;<!2 2.3 0.6 ......... .. ?<!. . 63 ·········· ?1, . 9 ........ l()<J. ............. :3!3. . . _S~_a._in___ .... :3.9.._:3?.1 0.2 1.0 ........ ···············- 78 5 100 37 Sn Lanka················-····-····-···- ....... !?.·.?!.8. ............ ..1::.'! ... -......... 4.3 46 73 ................ !§. ............... 38 .................. !9.9_.... 36 !)_t,_~!~s.a._~~~~~i~-- 41 __ -::Q," ___ ?.:?. _ ........... 1.:9.9 .............. -.. J<! .... _ 21 .. ..
··-····-···-·····-···-····-···-···-··-···-··-···-St. Lucia 152 1.8 0.5 100 72 17 .. .. ............. _,_, .. _,,_,_ ................... , .. ,_ .. ,_ .. ,_ ...... -.... -....... -............ ,_,,_,,_,_ .. ___ ,,_, _____ ,_, ___ ,,_, ___ ,,_ .. __ .... -........... ·-St. Vincent and the Grenadines 113 ........................................ ··························-···
Sudan ........................................ 2.8,_3"_7 Suriname 412 Swaziland 989 .............................................................
o.8 ................ :Z.:!. ............... ·-··· 2.3 50 0.4 3.6
.. ........................................... .. 72 43 . ............................. .
73 55 70 56
22 69 28 69
34 29 .. 33 .............................................
95 38
Sweden ................................ ~,.ll.?..:Z. ........... 0.5 -Q.4 ............................ 79 ........................ '! ............................................ !Q<J. ...................... '!S. ...... . !>.:-'!i!z.~'.l."..~c:l .. _ .... _ ··-···-·--·--···-·J ,:I.().§ _________ <J.~S.-. -o.3 100 J'?. .. -···-···- 4 .. :"·-···-··--·--!QQ .. - .. -···-·-···:1:_0 ?.Y..r:i<l.~.-A.,r_abf.l.e..P.~~Ii9 ........... _!?.,.?.?.?..._ 3.3 -o.6 85 69 28 1_3 ····-···-···-·9.:1._____ 26 I~i_i_~!~!.a.D.... 6,115 2.0 ...... §.9. ................... ..?..9. 23 ·······································- 44 Tanzania ............. 3.~ ,-~2..8..... 3.3 0 .0 49 47 85 31 49 49 Thailand ................................... E>!,:Z.<:>! 1.4 3.5 89 72 29 ....................................... 8.~ ... 46 T~fl?. ................................................ :4,.:45._8. 3.4 -o.2 ............... El~. . 49 78 25 70 40 T?.~ga_____________ ........................... 9.9... 0 .4 ............... ····- 100 71 ...................... ?..! ............................ .......................................................... . I.riDic:l.a~ .. a..~c:l. !.9~~!1.0. ................... :!.,.?.~? .............. <J.:I,! ................ :3.c0 ..... ?..? ................... !} ____ .............. !?. ....................... _ 100 34 I~.fl_is.J.a.___________ ············-·9.,_:3_3.?. 1 .9 2.2 99 72 ________ 2.f! ··-···----~---·-···-···-!()() 31 Turkey .......................... §3.,.'!?..:1._ 1 .8 2.5 ................ ..... .... 69 38 10 98 37
Turkmenistan " " 7..! .1,! .............. ..3:.El ............... ·····-····- 60 66 33 ... ···-····- ··-···-···- ·············-··-··-~§ ______ . -~~~~-d~ ............................................. :Z.Q,_I,!§l.? 3.5 3.6 34 42 101 26. ............................ .................... '!S. ...... . Ukraine ............................................. ?.Q,_:2~!:i.... -o.4 ................ :::S.:.I,! ...................... ?..?. ..................... §.!. ........................ !" .............................................................................. '!§l ........ . .IJ.~.it~d _A'.."..~ .. ~'.".i'.."..t.e..~ ... 2, !.~.'! ............... ?.:§ ......................................... ~.!,! 75 ......................... f!.... 7 ................. ?..! .... 14 .IJ.~.~!~c:l .. ~i~g-~_'l.'." .......... ?'?.,~?.!? 0.4 1.6. . ......... l.:Q<J. ...... -···-··- 77 ................ §. ............ _ 100 44 IJ..~i!~c:l!>.!a._t~~---··· .. :Z.?._Q~2.§l~_ 1.1 1.9 ·····-···-····- 77 7 1 ______ :1,()<! _ 46 .lJ.'.~flU_!IL______ ............. :3.,:Z.f!~- 0.8 ............ ?..::2_. ?..~ ................. _!~ 16 ~-·· --··-fl.?. 41
~~~~~l~ta~ ............................... _24 ,~~~ H 7.3 ~~ ~; ;~ -- _1§1:- ___ 6~,- 4~ ....... ,_ .......... -... -... -.............. ______ .......................... .
Y.e.n.~z.~-~l_a , ___ RI:l .............................. 2.:'3,.~~-:Z. .............. 2.:.!5. ............ :::L4 .................... ?.<;) .................. ?_3 .................... 2.1. ................... !5. .................... 8.4 .............. 3.4_ 'J.ietnal11 .................................. 7.6,_52.0_ ....... ~, 1,__ 36 68 34 40 ............... 1.:99.... 49 1/irgi~~~~~~-d..SJ.l!:.~:l •••m• .. .1:1.:8.. Ll,! . ••••••••• •m••••• •••• •••• •••••m •••••••••••w••••••••?..!.. ••••••••••••••••• ...l-0 y.'~~! ... E!~~.k. .. ~.~.<! .. §.~za -~_,_?.::'l.?.
Y.e.".'~.~-'-· ~~!'.: ···················-··········-·· 16,5_99 ~~~~a.~ F.!!l.~IIJ.:I~!J !Q,§!§ ··-····-···.<!.:!. ·----
4.5 4.8 -1.8
Zambia ·---~_,_?_!?.§ 3.1 -2 .0 .................................. Zimb.."..b..v.'.~···············- ············••m••·····!:l.:,.§?.~ 2.6 -1.9
.. Not available.
39
43 77
71 24 ,_ ..... 56 82 46 ······-··--:z.~--72 13 2 .. ~ ··-···-···-···-····-····-····-····-····-···-··-···--·-··-·-··-···- ··-···-···-··-··-·-·· 43 114 24 72 45 .. ....................... ___ , __ .. ___ .. , ......... ,_ .. ___ , . 51 73 16 92 44 .............................................................................................................
Note: Figures in italics are for years other than those specified; the number 0 or 0.0 means zero or less than half the unit shown and not known more precisely . a. Data refer to the most recent year available .
20 00 World Bank Atlas
21 2000 World Bank Atlas
Environment
Low- and middle-income economies have 76 percent of the world's land a1
80 percent of the world's forests. And almost 60 percent of their people li
in rural areas, largely dependent on agriculture.
Agricultural production is now keeping pace with population growth, b
it often contributes to environmental degradation. Unsustainable farmi1
methods-such as the excessive use of water, pesticides, and fertilizers
reduce biodiversity, degrade soil, and pollute water. Environmental dama.
can also harm agriculture. The destruction of watersheds dries up sources
irrigation, while pollution destroys fisheries and reduces crop yields. That push
people to use marginal land, reducing production and perpetuating pove1
for those who depend on agriculture . The relationship between development and environment is complex, b
economic growth and better environmental management can be compl
mentary. To grow, countries exploit the natural resources available to the1
and as they grow richer they both consume more and can better afford
protect the environment. For poor countries the challenge is to adopt a st
tainable path of development-for rich countries, to begin to live within tht
share of the global commons.

Environnement
Les pays a revenu intermediaire et les pays a faible revenu representent 76% de
Ia surface emergee du globe et abritent 80 % de ses forets. Et pres de 60 % de
leurs habitants vivent en milieu rural et soot tributaires de !'agriculture.
Bien que Ia production agricole suive aujourd'hui le rythme de Ia croissance
demographique, elle contribue dans bien des cas a Ia degradation de
l'environnement. Les pratiques culturales non viables, telles que !'utilisation
excessive d' eau, de pesticides et d' engrais, ont pour effet de reduire Ia biodiversite,
de degrader les sols et de polluer les ressources en eau. Mais !'agriculture peut
elle aussi patir des degats causes a l'environnement. La destruction des bassins
versants entraine I' epuisement des ressources disponibles pour I 'irrigation, et Ia
pollution detruit les ressources halieutiques et reduit les rendements des cultures.
Dans ces conditions, les individus soot amenes a exploiter des terres marginales,
ce qui reduit Ia production et ne fait qu'aggraver Ia pauvrete de ceux qui
dependent de )'agriculture.
La relation qui existe entre developpement et environnement est complexe,
mais il peut y avoir complementarite entre croissance economique et progres en
matiere de gestion environnementale. Pour assurer leur croissance, les pays
exploitent les ressources naturelles dont ils disposent, eta mesure qu'ils
s'enrichissent, ils consomment davantage mais peuvent aussi se permettre de
proteger l'environnement. Pour les pays pauvres, le deti consiste a adopter une
trajectoire de croissance durable, tandis que pour les pays riches, il s'agit de
commencer a vivre en se contentant de leur part du patrimoine mondial.
Medio Ambiente
Las economfas de ingreso bajo y mediano tienen el 76% de Ia tierra y el 80%
de los bosques del mundo. Ademas, casi el 60% de su poblacion vive en zonas
rurales y depende de Ia agricultura.
El ritmo de Ia produccion agricola se mantiene a Ia par del crecimiento
de Ia poblacion, pero suele contribuir a Ia degradacion del medio ambiente.
Los metodos de explotacion agricola insostenibles -como el uso excesivo
de agua, plaguicidas y fertilizantes- reducen Ia diversidad biologica,
degradan el suelo y contaminan el agua. El deterioro ambiental tambien
puede perjudicar a Ia agricultura. La destruccion de las cuencas hidrograficas
seca las fuentes de riego, en tanto que Ia contaminacion destruye las
pesquerfas y reduce el rendimiento de los cultivos. Eso obliga a las personas
a usar tierras marginales, con lo que se reduce Ia produccion y se perpetua
Ia pobreza de los que dependen de Ia agricultura
La relacion entre desarrollo y medio ambiente es compleja, pero el crecimiento economico y Ia mejor gestion del medio ambiente pueden
complementarse. Para crecer, los pafses explotan los recursos naturales de
que disponen, y a medida que se vuelven mas ricos consumen mas y a Ia vez
pueden proteger mejor el medio ambiente. El desaffo para los pafses pobres
es adoptar un rumbo sostenible de desarrollo, y para las naciones ricas,
comenzar a vivir con Ia proporcion que les corresponde de los bienes
comunes de Ia humanidad.
2000 World Bank Atlas

ONMENT
-
"'"'l>
0 Less than 10%
0 10-14%
0 15-29%
· .. 0 30-59% ~ .. 0 60%or more 'i > ,
0 No data
8 20 00 World Bank Atlas
Forest area
Forest coverage, 1995 The percentage of total land area that is covered by forest.
Distribution of world population among economies grouped by forest coverage
0 Less than 10% ................................... 0 10-14%
0 15--29% -------------------·-·-·········
0 30-59%
e 60%ormore
0 Nodata
Couvert forestier, 1995 Superficie boisee en pourcentage de Ia superficie totale
des terres.
..(
...
Forest coverage, 1995, percentage of land area
East Asia & Pacific 24
Europe & Central Asia 1----36 Latin America & Caribbean 1--•-•45
Middle East & North Africa 1
South Asia
Sub-Saharan Africa
High income
r.
0 20 40 60 80 100
Cubierta forestal , 1995 Porcentaje de Ia superficie continental del planeta que es
cubierta de bosques.
' 't ;
·-: .. !a.J :-:.. ·~ • :..--•1
\oo •• . -- . ·.;,. · ....
~'.\:" y
~( '!: \: ..... ).,
i;?'
Forest coverage, 1995, percentage of land area
Economies GNP $
millions 1998
Population millions
1998
GNP per capita
$ 1998
. L.e.~.s.~~a.~l.~~ ~ .. y;1.~,!.2.~ ... 733 ........ ?,.?~~ 10-14% 13 3,332,907
15--29%
30-59% 60%ormore ............................. No data
39
45
8
63
. ~~,~.1.~,~ 3,859,143 ........................... 5,520,434
586,953
1,525 2,190 2,227 .~!.2.~~
719 5,370 554 9,960 138 4,240

Deforestacl6n anual, 1990-95 Variaci6n porcentual anual media en Ia superficie cubierta
de bosques. Las cifras con signo negativo indican un
aumento de dicha superficie .
. - .....
.. ., 0 Less than -0.4%
0 -0.4-0.0%
}' 0 0.1-0.3%
0 0.4--1.0%
-' 0 More than 1.0% . 7 0 No data
Annual deforestation, 1990-95, percentage change
Economies GNP Population GNP per $ millions capita
millions 1998 $ 1998 1998
Less than-0.4% 14 -~'?:1.!,.119.?. 219 .. 1.~,!~ -0.4-0.0% 50 ..... 1.~,.3.~~· 732 2,111 7,730
0.1-0.3% 12 ~,~!?.,~:3.! 1,589 3,820 .......................... 0.4-1.0% 32 ....... :1.,~.1.?,~!~ 1,095 1,660 .......................... More than 1.0% 35 .. ~3.Yl.~. 745 1,120
No data 63 586,953 138 4,240
Debolsement annuel, 1990-95 Variation annuelle moyenne de Ia superficie boisee, en pour
centage. Un chiffre negatif indique une augmentation de
Ia superficie boisee.
Annual deforestation, 1990-95, thousands of square kilometers
East Asia & Pacific 30.0
Europe & Central Asia
Latin America & Caribbean
Middle Ea.st & North Africa
South Asia
Sub-Saharan Africa
High income
-20 0 20 40
57.8
60 80
Forest losses
Annual deforestation, 1990-95 The average annual percentage change in forest area.
Negative numbers indicate an increase in forest area.
)
1 I' -!
...
Distribution of world population among economies grouped by annual deforestation
Less than -0.4%
-0.4-0.0%
0.1-0.3%
0.4-1.0%
More than 1.0%
No data
ENVIR
t . . ... . ' ...... -,;.
< .... <-" .. • • ..
t~
'?.
i::/
20 00 World Bank Atlas

ONMENT
"'"" 0 Less than 1, 700
0 1,700-2,999
: .~ 0 3,00o-4,999
· .. 0 5,000-9,999
.. -.... ® 10,000 or more ~1 . :; 0 No data
:o 20 00 Wo rld B a nk Atlas
Freshwater
Freshwater resources per capita, 1998 A country's renewable water resources , including river
flows , divided by the population , in cubic meters.
Distribution of world population among economies grouped by freshwater resources per capita
Less than 1, 700 ....... . ................. 0 1,700-2 ,999 ......................................... 0 3 ,000-4,999 ........................................ 0 5,000-9,999
.......................... e 10 ,000 or more ...... .........................
0 Nodata
"':J
Ressources d'eau douce par habitant, 1998 Total des ressources renouvelables, qui inclut le debit
des cours d'eau, divise par Ia population, en metres cubes.
•' .. {
Freshwater resources per capita, 1998, thousands of cubic meters
East Asia & Pacific
Europe & Central Asia 14.3
Latin America & Caribbean ~-----27.4
Middle East & North Africa
South Asia
Sub-Saharan Africa
High income
r.
0 10 20 30 40 50
Recursos de agua dulce per capita, 1998 El total de recursos hidricos renovables, que incluyen It
rios, divididos por Ia poblaci6n, en metros cubicos.
\ ' ·-:
: ..... ::..:..::·:.. ... -' •.. ~ ... .
-.;;;,. '•' ~~
·:t .... ~ . .. ~ .. , .... t ~ ·:· \.,_,,:.
Freshwater resources per capita, 1998, cubic meters
Economies GNP Population $ millions
millions 1998 1998
GNP per capita
$ 1998
.. L.~.S.~.~~.a.~ .. ~:.!.<l9. 31 ... ~:.9.?.~,.~5.?.. 498 3,860
.. ~:.!.Cl9.:::~.:9.99 28 ....... f:i :.9.?..5.:.3.!!9.... 3,000 .?.:.:l.l.c:J
.. 3.:.~.:9.99 2(). . ... f:i , ~c:J,.S.!~ ........... 548' .. . }~:.S.!c:J
. 5.:.<>.<>?.:::~ :9.9.9 25 .9.:.1..S.f:i .634 ...... ~ ....... ~~,.~c:Jc:J
.. l.c:J:.<l9c:J.".r.'.Y1".r.e. .!:ic:J ......... ~:.9.~,.~.2.9. ................ ~A~.1 .......... ~:.5.c:Jc:J No data 42 543,786 41 13,190
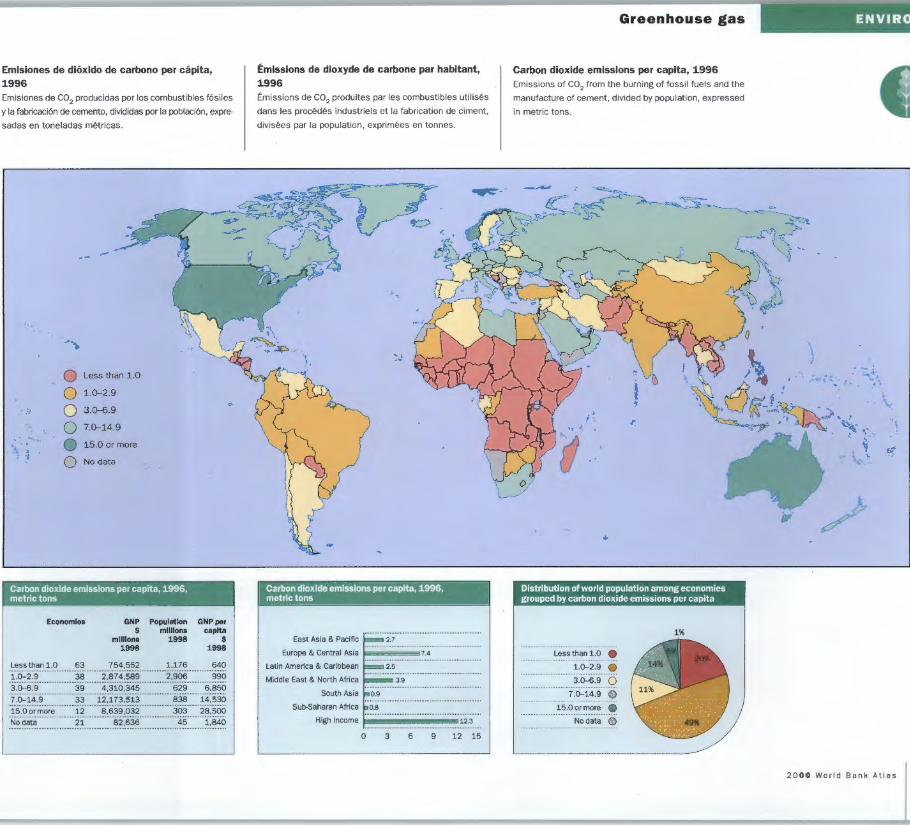
Emlsiones de dioxldo de carbono per capita, 1996 Emisiones de C02 producidas por los combustibles f6siles
y Ia fabricaci6n de cemento, divididas porIa poblaci6n, expre
sadas en tone Iadas metricas.
-
.......
0 Less than 1.0
0 1.0-2.9
: .~ 0 3.0--6.9
·- 0 7.0-14.9
··\ ~ ..... '~ 0 15.0 or more • ·;
0 No data
Carbon dioxide emissions per capita, 1996, metric tons
Economies GNP $
millions 1998
Population millions
1998
GNP per capita
$ 1998
Less than 1. 0 1.0-2.9 3.0-6.9 7.0-14.9
63 754,552 1,176 640
38 :: :~:~?,~;:~~~ 2:!!os 99o 39 4,310,345 .................................. 629 ......... 6.!~~0. 33 12,173,513 838 14,530 ........................................................................................
15.0ormore No data
12 8,639,032 303 21 . 82:636 . 45 "
28,500 1,840
Emissions de dioxyde de carbone par habitant, 1996 Emissions de C02 produites par les combustibles utilises
dans les procedes industrie ls et Ia fabrication de ciment,
divisees par Ia population , exprimees en tonnes.
·~ <
"':J
Carbon dioxide emissions per capita, 1996, metric tons
East Asia & Pacific
Europe & Central Asia ~----7.4
Latin America & Caribbean
Middle East & North Africa
South Asia
Sub-Saharan Africa
3.9
High income 1--------•12.3
0 3 6 9 12 15
Greenhouse gas
Carbon dioxide emissions per capita, 1996 Emissions of C02 from the burning of fossil fuels and the
manufacture of cement, divided by population, expressed
in metric tons .
..
Distribution of world population among economies grouped by carbon dioxide emissions per capita
Less than 1.0
1.0-2.9
3.0-6.9
7.0-14.9
15.0ormore
No data
EN VIR
--: ..... -, ~·· t.
"" ., •
&' . ..
20 00 World Bank Atlas

ONMENT
-
"'"" 0 Less than $2.00
0 $2.00-3.49
. ~ 0 $3.50-4.99
· .. 0 $5.00-6.99
-..... ~ .... • $7.00 or more '1 . . , 0 No data
12 20 00 World Bank Atlas
Energy efficiency
Energy efficiency, 1997 Gross domestic product divided by total energy consumption
in oil equivalent, expressed in international dollars using
purchasing power parity (PPP) rates .
Distribution of world population among economies grouped by GOP per kilogram of energy used
0 Less than $2 .00
0 $2.00-3.49 .............................. 0 $3.50-4.99 ............................... 0 $5.00-<;.99 ..................................... G $7.00ormore
0 Nodata
~-
-:.:
Rendement energetique, 1997 Produit interieur brut divise par Ia consommation totale
d'energie en equivalent petrole , exprime en dollars
internationaux aux taux de Ia parite du pouvoir d'achat (PPA).
GOP per kilogram of energy used, 1997 (PPP $)
East Asia & Pacific 3.7
Europe & Central Asia 2.2
Latin America & Caribbean 5.7
Middle East & North Africa 3.3
South Asia 4.4
Sub-Saharan Africa 2.9
High income 5.5
0 2 4 6
Eficiencia del uso de Ia energia, 1997 Producto interne bruto dividido por el consume total c
energia en el equiva lente en petr61eo, expresado 1
d61ares internacionales utilizando las tasas de paridad d
poder adquisitiro (PPA).
·-~ ~~~ ~--. ~~·
r. "':
•; ~
' , .. '?f
[;j
GOP per kilogram of energy used,1997 (PPP $)
Economies GNP $
millions 1998
Population millions
1998
GNP per capita
$ 1998
Less than $2 .00 15 553,460 448 ........ },.2.~~
)~::~:o.:::~:~~ : ..... --~~ ::::: ~:~j~::?.~~:: ····-~-'~~!... 1,430 $3.50-4.99 31 10,869,236 1,992 5,460 ·$5:oo:::s·:99 ·· ·· 25 ·· 12:383:175 ······ · ·· 9ai 12,620
··$·7:oo·o;:~?.r.e. ......... :t.~ :::::3f7.~:§5.~ ::::::::::.. - ~~! .. ...... ~,1.~~ No data 89 640,002 362 1, 770
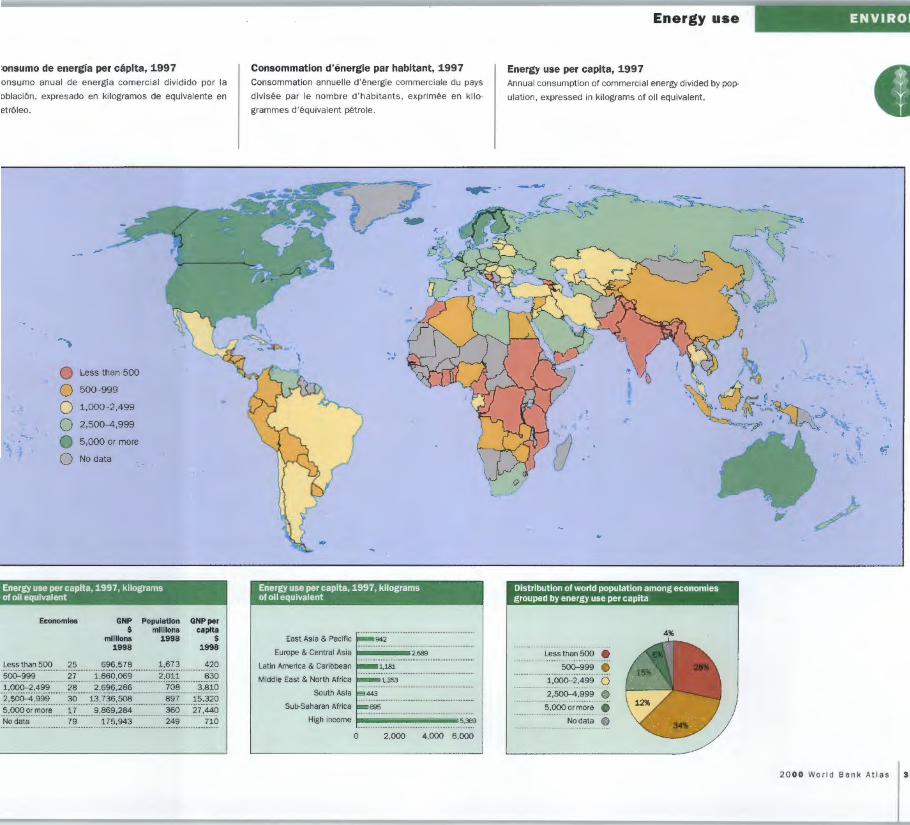
:onsumo de energia per capita, 1997 onsumo anual de energla comercial dividido por Ia
oblaci6n, expresado en kilogramos de equivalente en
etr61eo.
... .....
0 Less than 500
0 500-999
0 1,000-2.499
0 2,500-4,999 ........
5,000 or more ·~.; ; 1 0 No data
Energy use per capita, 1997, kilograms of oil equivalent
Economies GNP $
millions 1998
Population millions
1998
GNP per capita
$ 1998
.. L.~.S.~.~~.a.~.-~99. ......... ?!5 ............. S.~~ :-~7.~.. ...... 1,~!~ .. 420 500-999 27 ........ ~:S.~CJ.:.~~ .............. ?:CJ.~~---· 830
},_(l_<l?:::~ :~~~ . 28 . . ?. :.6.~~, 2.~~-- 708 ......... ~:.S..l.CJ. 2.: !5.o.?.:::'l.:~~~---· 30 ...... 1.~:.!.3.~,-~?~... 897 15,320
.. ~:.()_(l?. ".r .. rll".r.~ ... 17 ........ ~,~~~,_?~ No data 79 175,943
360 .. ?!:~CJ. 249 710
Consommation d'energie par habitant, 1997 Consommation annuelle d'lmergie commerciale du pays
divisee par le nombre d 'habitants , exprimee en kilo
grammes d'equivalent petrole .
Energy use per capita, 1997, kilograms of oil equivalent
East Asia & Pacific
Europe & Central Asia 2.689
Latin America & Caribbean
Middle East & North Africa 1,353
South Asia
Sub-Saharan Africa
High income
0 2,000 4,000
5,369
6,000
Energy use
Energy use per capita, 1997 Annual consumption of commercial energy divided by pop
ulation, expressed in kilograms of oil equivalent.
Distribution of world population among economies grouped by energy use per capita
Less than 500 • 500-999 0 1,000-2,499 0 2. 500-4,999 0
5,000 or more
No data
ENVIRO
\
\ ; . -..
~.~ . .....
~
20 00 Wo rld Ban k Atl as 3 .

-'
1RONMENT
Economy
Land area
thousand SQ.km 1997
Freshwater resources
Available Annual percapita use
cubiC meters % of total 1998 1~98·
Afgh~ni.~t?~. 652.1 .. 2,5~.5..
Albania 27.4 ....... :!.:?, ?.5..8 .. ~. ;'\lg~ri.? .............................. :?.~1..1.... 4 78' American Samoa 0.2
3.3' 31.5'
Fornt coverage Enerouse
Ave<age Total annual GOP per area %of defOfes- Per kilogram
thousaod total tation capita 011 equivalent sq. km land area % kg ppp $' 1995 1995 1990-95 1997 1997
10 38 0.0 317 8.5 19 1 1.2 904 5.3 ...........................
Carbon dloxkle -,.,.,..... metric
tons 1996
0.1 0.6 3.3 4.7 ............................................................................................................................................ ,_,, ....
Andorra 0.5 ..... ............................................. ... . ............................................ ········· ······························- ........................................... . "'~~~~-~---··· ·········· ................ :1.!.~~(:).:!... ~.5..,.!83 0.3 222 18 1.0 ................... ?.?.?. ................ ?..:.f:i ................... .9..:.? .. ":~tig~?-~~~ .1:!~':1.>~~~- 0.4 ...... .. ... .• .... ...• . .... 4 .9 ,'\rg~~!iD.~ ..........•......... ?.,?.=3.f:i:?. . .... 2!.,f!.6..?. ~. 2.8 ' ....... .3~~ - .:1.2 .. _0.3 ........... ~.,?.?..<!.. 6.9 3.7 Armenia .............................................. :2?..:.2. ... 2, 767 .~ .............. ?..!..:!3..~ .................. :3 1:? ........ ····-··=~:?. ········-··-.... ~Z.?... 4.3 1.0 Aruba 0.2 ................................................................ ······························-···································- ------------------------································································· .. ·············· .. -Australia ........................................ .?.,(:)~?.·?.. .. 18,772
Austria ........ ······················- 82.7 ...... 1.:0..,.:3~~ -~-~e..rt:l.?. iJ?.~ ............................................... ~€>.:~... ?.,8_31 ' _Bah~m.?s, .. r~e ......................... !0:0 .. Bahrain 0.7 ············································ . ~an!lla~.e~h . ... . . ...... .... _13<J..2. Barbados Belarus
-~~l.!li .~rl1 . j~:9 • ..... :1.,.?2.1!. .~ Belize .................................... 2..?.:~ . ..... 15.9.·.?..1. .. !. Benin ......................................... 1.:.:1.9..:6. ... ...... ~!.?.~.1..~
4.3 409 ................... :?... 0.0 ... :?.,~.'!. 4.0 16.7 2.7 ' ......... ?.~ ............ ..... 'J? ... ........ .... <!:.<!...... _ },'!?.~ ..... 6..:.?. ................... ..?.:.'! .. .
54.6' 10 11 0.0 ................. ~!.?.~.~ .. 1.3 .............. ... }.:.~ .. .
1.2' 10
0.6 '
74 7
46 42 1.2
6.0 ·····················-··· 1.0 17.7 ............................ 6.8 0.2
3.2 6.0
4.1 10.4 1.6 .............. ··········· ---------------------------- -
377 2.3 0.1 ························· ·····················-···································"''''"''''"'''"''''"'''""'''"''''"' ... ' "
Bermuda .......................................... .<!: .~ .... ....... .. ... ... .. .... ...... ..................... ... 7.4 Bhutan ........................................... '!.!.:9. .... .:!.?.?.§.6.1?. 0 .0 .......................................................................................................... .<!.:~ . -~~l_i~i-~···········-···············-···············- .. :1.,.0..~.:~ .. - ..• :3.§,.15?.5._ ... -.... 0.4 483 45 1.2 548 4.1 1.3
l:l<.>~~i~~D~. I:i.'~'-'e.Jl<.>~i~~---?.1.::0.. __ !il_,~?..?.. . .............. ?..?... •...•...• 53 o.o .............. ~?..9. .. . 8~t~w.~n~ ...................................... ?.§.€>·? ...... ~ .. ~l,:ol .. ' ....... .... 0...:!.' 139 25 0.5
Brazil 8.45(:).5 .1?. •. 1..5.9..'_ 0.5' ... :? ... ?.!.~ 65 0.5 ............ ~ ,95..:1 6.5 Brunei 5.3 ............................ ···········-··· ............ 13 ,.13~.<> 2.5
··························-· 0.9 1.4 1.7
16.8
~~ ~~~~ri? 110.6 .. ?:'1:·156.3_ ' .. 6.8' 2.2
32 29 0.0 ............ 2 ,_'J!!.<J. ............. ~.:.~ ..........• 6.6 0.1 0.0 0.0
~urkiDa.F~~~- .................... ......... ?.?.~.:6. ... ... .. .1. ,.6?~. 0.7 Burundi 25 .7 561 ........................................ Cambodia ............................ _1..7_6.? .. .. 4~.1JO! .. . Cameroon .......................... 465.4 .... 1~. ?.3! .. . 413 3.6 0.3
Canada ........ ~.~2-~_.Q ..... 9?....1.:'!.? ... . 3.0 13.8
Ca~.e yer.de.. . ..................... ..... .'~:9 . 721 0.3
S:~Y.r:"?.~ - ~-~-~~.n.~.~---· 0::3 ................................................................................................................. .......... ······- ...................................................... . ~e.~tr.?l _I~~'.IC~D .. ~~!>.~~Ii". 623.0 . ~:1.,2_5.()_ 0.0
Chad ... ·····················- .... :1.,.~.?.~.:~ ........... 5.~_()~ ' 0.4 ' Channel Islands
299 110
48 0.4 9 0.8
0.1 0.0 ..............................
...................................... ··-····-···-·· .......................... . !:.~i-1~..................................................... 748.8 ..... =3.2..P!H. !:.~i-~~---························- ... !il.,.?..?.f:i.:~. . ..• 2..,?.~?.. l:i~~g -~~~!l,.~_~i~-~ -- .................... -~:.<>.
3.6 .. ..!~... . !~ . . C!:~ ................. !.,.?.?..~ 5.7 18.6 ....... !,?..::!~. 14 0.1 907 3.3
·······-····-···-···- .............................................. ········-··- .............•. ~.,.!?..?. ... _ 10.6
3.4 2.8 3.7
... f:A.~c~o, .C:.~i-~.a. .................................. .9..:9. ··········- .. .. 3.2 ................................................................ Colombia ................. .... :1.,9.~:?.. ..... .2..6..,.!.?.2....... 0.5 530 51 0.5 761 ···························· Comoros .. .... ..... ... . ....................... 2.:.2. ....... 1 ,.13?.4... ... .... .... . ........................................................................ . Congo. D~m: ~~P· .. 2,~67 :1 . 2:!.,1?:4 ... ..... 0:() C9ngo,_ Re~_. 341.5 Costa R1ca 51.1 .................... Cote d'lvoire .... ............. ....... .
195 12 55 18
17 33
311 ................... 0.2 459 3.0 769 .. ..................... .. 0.6 394 ............................ 0 .0 ..... _1.1)8.!. Croatia
Cuba 109.8 .......... :J.,~?.Q 23.5 18 17 1.2 ............ --~'-~~.:!. .... .
8 .2
2.7 2.2 7.7 4.0 4.0
CYP.'.~S. ···························-·····-··· . -~--~- .... _1:,06~ . ~! :? .... .... .... ......... .... ......... .... .... ..... ... - ................ ?..,.?.?.!.... 6.2 Q~~-~~ - ~~p~~-li". .... 77.3 •... :1..·.?.:5.~ .. . . ~-~·13.. 26 34 0.0 ............. 3.,_9?..8. 3.3 Oenmark ......................................... :4?.::'1 ........ ?.•.~.6..9..~. Qji~()U!i ................................... :??.:.2.... 4 72 Dominica 0.8
34 20 00 World Bank Atlas
9.2' 3.3
4 10 0.0 3,!J.~4 6.0
1.7 0.1 0.1 1.9 1.4 0.9 3.9 2.8 7.3
12.3 10.7 0.6 1.1
Land Freshwater resources
FotHt coverace Enerey use cam dk)xl
Average Total annual GOP per -por ca
Available Annual area % of defores- Per kilogram thousand
SQ. km 1997
per capita use thousand total tation capita oil equrvalent meu ton 199
cubiC meters % of total sq. km land area % kg PPP s• Economy 1998 1980--981 1995 1995 1990-95 1997 1997
D~u~ i. ':l!C~-~--~~.P.~!?.U .~ .... Ecuador
Egy~_t •.. J.\'.!'~. ~~p El Salvador 20.7
~-~~a!_or_i".I ... G.~i~~.? ........................... ?S.-1 . Eritrea 101.0 ....................................................................... Estonia 42.3 ........................................................... .E.:!~i~.J>.i!' ................. !.000.0 ~.,.?95 F..~e..r.~~- ~-~-~ ... ~.<l.~ 1.4 RJI ...................................................... !S..:.~ ....... :J..6..,.~§_7 Rnland
0.0
1.3 2.0
0.1 2.2
111 0 1
3 20
33 40
0 5
3 48
1.6 1.6 0.0 3.3
0.0 -1.0
673 713 656 691
··-····-3,8!1
136 14 0.5 287 ·········································-····-····-.....................
······································-·······························-····-200 66 0.1 6,435
France ........................................... ?.?.<!.:.! ... 3 ,_~~13 .~ ............. ?..1:.:.~' .......... 150 27 -1.1 ......... -~·.?.2.'J f.r.e_nc.~ .P.~Ir~e-~i~. .. . 3. 7 Gabon ... ..... ... .. . .................. .... ~.?.! . .J. .. ~.3.8.._9:42 .. 0 .0 179 0.5
0.9 . :L., .:4~~
6.6 4.6 4.7 5.9
2.0 2.1
3.2 5.0
4.5
.....................
1l
l 1l
!
.............. ....................
<>.~'!'bia,J~e ................... !.<l.:9. ....... 13·?.?~' .. . Q.4 C
5.5' 26.0'
1
30
69 9
43 .. ....................................... .
0.0 423 ................ G~or.gia .................................. 6.9J ..... 11,_632' .. Germany .. 349.3 ...... ?.·.1.:6..9 .. ~ 107 31 . . ().() . . 4,2;3.:1,
Ghana ..................................... ?..2..?.:5. ......... ~_,_813?. ~-- 0.6 c,e
10.2 ' 90 ............... 40.. ............. :1.-~. ... ... ... 3?3
Greece ..................................... 128.9 .... (:i,!j6_2 -~ .. 65 51 -2.3 ••• 0
m ?.'J3.?. Greenland 341.7 ...................................................... Grenada 0.3 ............................................. .. .................................................................................................... . Guam Guatemala Guinea
0.6 ............................................................ 108.4 ..... gp:J.CJ. .. 0.6 38 35 ................................ 245.7 ....... :3::1,!3.~.0... 0.3 64 26
.<>.~.i.~~.".:l'l.i~ .... ~.~ •••••••••••••••••••••••••••••••2..1'!.:.1.:. .. 0 •• ~:'1.,?.~.9 ' ••••••••.c:>.:~•~•••••••••• m••~•:,l•••••••••• •••• ••••82 9uya_na.. . ....... 1:!3..?.- !l_ . ?.£35..,~3~- 0.6
Haiti .............................. ?..?:§._ ..... ...1..,~f:i.l3 ................ .0...::'1.... o ..................... 1. ............. .
2.0 536 1.1 0.4
3.4 237 ............................ Honduras 111.9 ........ !3..,.?:?.13 ............... ~.:? ............... :".~ ..................... ?..! ..............• 2.3 532 .l:i~.~~~~'.Y....... 92.3 ...... 1.: .~.,.1'!(:).?. .. ~ 5.2' 17 19 -0.5 ............ ?.,.'J~.:Z ... . Iceland ..................................... Y>9.::3 ... 6P,6_4? ....................................................................... !!., ~13.f:i. lnd1a ............................... . ~,-~T~::Z Indonesia ............................. !.&~.~.: 6. l r.a~, _ l _s l ~n:ic .. ~~~.: .•......... !., 6~?.-<l.
650 .... __ l,OQ8 ..
15
22 61
1
0.0 1.0
479 693
1.7 ...... ... ~., 1.?.~ ..
7.9 5.2 1(
4.5 (
5.7 '
l 21
6.5 (
5.9 4.7 4.0 2.9 4.2 4.5 3.0
(
(
l (
lr.?q .................................. 4~7_.4 0 0.0 .......... ~!.?.~.() ......................... . Ireland ................................ f:iS..- !3... 8 -2.7 ............. .3..,.'!~.:1 Isle of Man ...................................................................................................................................... Israel .................................................... :21).:13 ............ !~.~---· 155.5' 1 5 0.0 3,0.1'!. .. Ita ly 294.1 ~'-~9.-~ . ." ... 34.4' 65 .............•... ?.?....._ -0.1 ..• 2.,~~-~-Jamalca 10.8 .. 3.,.?:?P ............... .?..:~.............. 2 16 7.2 ......... ~,_??..?.._ i?P.~.~ ••••••••••••••••••••m••••••••••••••••••• ••••••••••.?..?.f:i.:.?..... 3.4()? 21.3 251 67 0.1 ••••••••••••••••:4,.0..~••••••• Jordan ................................... ?.il.:!l. 198 ' 51:.:1.~ ................... .9...... 1 2.5 t,_Q81 Kazakhstan ................................. ~,670. 1. .. ....... ?..,.0...?.~ .. ~ ............. ?..0. 7' 105 4 -1.9 ............... ~,-~?..~ l{~nr.a .......................................... ?.6.~.: :!. ...... ~ . QJ.:I. ~ Kiribati 0. 7
~or.e?, _ _!)e_lll.: ~~P: .1\~r.e."., ... Rep, Kuwait
_Kyrgyz_ ~ep~bl_i~ .. Lao PDR Latvia Lebanon 10.2 ....................................................... Lesotho 30.4 ................................................
6.8 '
Liberia 96.3 0.1
13 2 0.3 494
51 0.0 77 0.2
0 4
...... ... ... 4f:l. ...
.. ......................... ..
........ 1_,81)6 .. 1 5 7.8 .......... ~.~13?. 0 0 0 .0
.~i-~Y!'.... 1.759.5 486.3 4 o o.o .. ?. .. ~0...~-Liechtenstein 0.2 ............................................................................................. . .......................................................... ..
6.0
5.8 7.3 2.2 6.0 3.3 1.8 2.0
1(
(
(
1 l 3.9 ~
3.8
3.1 ................ 3.3
Lithuania ....................................... m •• f'i'!.:~ ....... f:i,.?.2.'J .~.. 1.0' 20 30 -0.6 ......... 2. .. ::!!6.. 2.6

Land Freshwater Forest coverage
Average
Energy use Carbon dioxide
emissions Total annual GOP per per captta
Available Annual area %of defores- Per kilogram
thousand sq . km 1997
percapita use thousand total tation capita 011 equivalent metric cubic meters % of total sq. km land area % kg PPP $b tons
1998 198(}-98• 1995 1995 1990-95 1997 1997 1996
u~e.J11b.g~rs . . ...................................... ' ....... ~.,.!5..!. ~a~e<!o~i~, f'YI1 .. 25.4 ...... ? ,.41!3 .. ~!'Sl.~!l~~~!''.. 581.5 ....... ?.~.,.9~.~ 1alawi
~.~.I!'X~i!'._ 1aldives
1ali 1alta
............................ ~~ :.1.: ... 1, 775 ' 328.6 .. ~.1....CJ..1.6.
0.3
.................................. _1,220.2 .......... !iJ. ,.~::l§.. 0.3 265
1arshall Islands
3.8
5.8 5.0' 2.1
1.4 30.0
............................................................................... ........ .
.. . . ............... ... .. .. ............... ......... . 10
151 33
155
39 26 35 47
1.6
2.4 .. .. . ?.,.2.3.7.
4.1
4 .0
19.9 6.4 0.1 0.1 5.6 1.2 .........................................................
116 9 1.0
......... ?. •. 51.5 9.0 0.0 4.7
1aurttania ..................................... ; .,<>.?..?..:.? ........... ~.,.?<>.?. :... 143.0 ' 6 1 0.0 0.0
1.2 1.5 1auritius 2.0 ........ ~ !.8~.!.... 16.4 ' 0 6
~.~X9.1:!~···--···- ·--···-··-- ······--···-· 1exico ;.,.~C?.?.: 7 ......... ~.!.7.:!.!1 --···-··--·~l..:C?. ... 554 29 0.9 ........... 1.:}~!?.! .............. ?..:.!. ..... . 3.8
~~gE~~~!3!.i.~: ... ~~~: ... §!!3!.: .. .. . ............. ·····- --------------------------------------·-----··----- .................... . 1oldova ............................................... :3.~:!?. ......... ?..,.!:Z.:Z ........... ?.5.-..J ... . 4 11 0.0 .............. l.:.,.Q?..~ 2.1 2.8
~onaco .......................................................................................... . ~g~S~Ii ~ . .•.. .1,!;§.6.:5. ...... . 9,.(;?7 2.2 94 ~orocco ......................................... ~:"§} ......... ; .,.QI3Q ............... ?§.:? ................... ??. ........... .
6 9
0 .0 0 .3 0 .7 1.4 0.3
340 9.5 3.6 1.0 0 .1 0.2
~g.~ambiq~e 784.1 ....... !?..,.!:":§.~ 0.3 ' 169 22 461 296
1.6
~yanmar ....................................... 657 .6 ....... ?.~.,.?.1.:?.... 0.4 272 41
Jamibia .............................. 823.3 ....... ?.?..,.~?..~ .. ~ l.e~!' l .. ·-·· ..... . ............ ~".~.:!?. .......... ~.,.:1.:~.9. .. letherlands ............................ _:3.~ :~ . .......... ':J.,.!~.l ~. Jetherlands Anti lles 0 .8 ....................................
0.5 ' 13.8
8.6'
124 15 ..................................................... 48 34 1.1 321 3. 7 0.1
·························-································································· 3 10 0 .0 ......... ~ .. !!O.Q .......... 4:.6.. 10.0
. ... .... .... . ·- . . ....... !?,1313~ 31.0 Jew Caledoma 18.3 . . . . . . .. 8.9 ........... ......................... ...... ... ................ . ................................................................................................. .............. .. ........................................ Jew Zealand 268.0 532 .......................................................................... ~.~."E~g~!'.. 121.4 ..... ~?, 1:1i.L Ji.S~'. ···········-·· .... 1 , ~!5.?.:?. ......... 3,.:20..4 : Jigeri_~..................................... . .. 9.1.9..:§. 2,318 ' Jorthern Mariana Islands ·····························································································-····-J<;>'..:"!'X .. .. ·- ......................... :39E3:13. ...... fl? .. ().l;ol :. >.."'a~ . -·· ........... :212,5 ........... 4.3~ 'akistan 770.9 ........ 1,.~38 ~ 'alau ··· ··· 6:5
100.0 79 0.5 56 1.5' 26
~A~ .......... 1?13. .
0.5 ' 81
.. 1.2~ .. 2 ............ .9 .. 61.0' 17
............................................................................... 'a nama 74.4 0.9 28 -···-··········· ··-····-················-~~pua._~.~.v.'. .. '>..LJ.i'!.~.a ... -·-···- 452.9 ... 1.X.U~.1.9. .. 0.0 369 ................................... ~~'.~1;\U.".X ········-····~.!!?..:? ...... 13.1.,.?.5.9.._ .. . 0.1 115
•eru 1 ,2.§.0.0 ........... 1.,.13.11.: ............ _1.?..:? ........... §?..§. ..... . ·~ilipt>.i~.~~. ··················-···· }~?.: ?.. . ... . 1.·~.9~ 9.1 68 'oland .............................. ......... .'39~:4. ....... .1.,.629.: 19.2 '
'.O.'.~.U.S.~1 .. -·· ... . ... ····-···-~·~.:.?. ..... .?.,.?.?..? .. : ... 10.1 ' •uerto Rico 8.9 ................................ ............................... )at_ar .................................................. :1.:!.:0. ....................... -. ......................... .
87 29
3
lomania ............................... 2..:3.Q.:? ............. 9..,.?2.?...: ............... ~.?..:?.~ 62 !~.~.S.i~~ E~d.~r.~~igD . 16.,?.?13.:5. ........ ~0.., §:1.:~ .. : ... _ 1. 7 ' ..... ?..,.?.??. .. . lwanda 24.7 798 12.2 3 ................................................................................... ;amoa 2.8 ............................................................. ;~g:ror.n~~~d. Pr.i~~it>.e 1.0 . g; ,.??.6. ........... ·- . . ...... -·- .... . ?.~.l!~.!'.~E.~.9.!~ ............................... ~-!~~-~.: .?. 116 ........... ?.9.~.:~..... 2 ~~D.~S~I .. 192.:.?. ............ ~.,.~?..9 .. : ......... - .... ~,§.~ 74
~e.r.c.~~~.I~.S. ......................... ..... ........ .. 0.5 .............. ·······-···························· ~i~!.'.~ . ~~g~". ........................ ····- .... 7.!.:?. ........ ~?..,.9.?. 7 ···--··-··-0..:.2.... 13 ;,ng~I"'Ee.... 0.6 193
~loya..~ ~epu~li£ ...................... -. ... ".?..:.! ....... !.5.., .~~.El )lovenia
>olomon Islands 20.1 ......... !1.,.3?'1 .. 28.0 . :!11,).?.4.5
31.7 1.7
0 20
2.7 11
29 46
2 15
26
2
38 82 29
-0.6 ........... 4. . .435.. 4.0 2.5 551 3.9 .................................................. 0.0
8.0 0 .6 0.1 ········-"··-"·· ....................................... .
........ 9:!! .. 75} ............. 1.::1 .. 0 . 7 .................................................................................................................
-0.2 ......... 5.,.51:>~ ....... :'1·13 ... . 15.3 7.0 0.8
.. .. .. 3,003. 2.9 442 3.9 .......................
13.9 2.1 856 6.1.: ...................... ?..:.!'! .. . Q4 Q5 ........................................................................ 2.6 824 5.5 0.7
53 0 .3 621 7.3 7.2 2 .7 7.1
1 .1 0.9 9.2 4.8 4.2
23 3 .5 520
29 ....... .. -:-9 · ~ ......... 2..,.1.:2:1.: 31 -0.9 ........ 2_.0.5! 31 0.9
............ !?..,.?.??. ····························-27 45 10
0 38
0.0 .......... -. .. 1.:.,.9.'[)! 0.0 ............. 4,.0.1.:.~ 0.2
0 .8 ................ 4.,91:>§. 0.7 315
3.2 1 .7
2.1 4.1
...... -...................... -... -
42.0 5.3
10.7 0 .1 0.8 0.6
13.8 0.4 2.2
18 7
3.0 .............................................................................. 0..:1. .. .
41 54
0.0 ........ 13., (:)§.:1.: -0.1 ........... 3,1.:!!.?.
0.0 ........... :3.,.:2!.~ .. .
2.9 3.0 4.4
21.6 7.4 6.5 0.4
- -
ENVIRO
Economy
Land
thousand sq. km 1997
Freshwater
Available Annual percapita use
cubic meters % of total 1998 1980-981
Somalia 627 .3 ..... 1., ~3Q .. 5.2
so.uth ~fr.ica ... . ....... 1.221.:.<>. ..... 1.,2013.' .se.a'~ .. 499.4 ..... :2.,.?.~.?. ' .. Sn Lanka .............................................. ?.:':? ....... ?..,.~:2_[} ~!: ... ~i.!!s._an~_.Neyjs 0.4 St. Lucia 0.6
26.6 ' 31.7 ' 14.6
Forest coverage Energy use
Average Total annual GOP per area % of defofes- Per ltiioglam
thousand total tat1on capita 011 equmlent sq. km land area % kg ppp $b
1995 1995 1990-95 1997 1997
85 7 .. 0.:2 .......... 2 .. 6~.6 .......... 3. 3 .. . 84 17 0.0 ............... :2,.!.?.9.... . 5 .9 18 28 1.1 386 7.6
............................... ... ... .... . .. ................................................................................................................................................................. -... . St Vincent and the Grenadines 0.4 .........................................................................................................................
Sudan .............. ·········-·· ........ ?,37.6:1? ......... 5., 4.?~. 11.6 416 18 0 .8 414 3 .3
Suriname ..................... _:L!)§.<J. .. '1.13.15,.?.1}. 0 .2 ..... ... ......... . .............................................................. . Swaziland 17.2 .......... ~.,?.~.:2 14.7 ................................................................. . Sweden 411.6 ....... 2!?.,!0..~ ~.... 1.5 ~ ............ ?.4.~ .................... ?~......... 0.0 ................. ?.,.§.§.~ Sw1tzerla.~~................................... 39.6 ........ ?..,.".?..?. .. ~ 4.9' 11 29 0 .0 ............... .?A9.9 .?xr.i!'.~ .. ~.r!'.~-~.~.P_U.':>I.i~ 183.8 ......... ?..,.~?..§.... 32.2 2 1 2.2 983
3.5 6.9 3.0
Carbon dioxide -per capita
metric
tons 1996
0.0 7.3 5.9 0.4 2.5 1.3 1.1 0.1 5.1 0 .4 6.1 6 .3 3.1
!~J.'.~i .st.a.n .................................... 1~0..:13 ....... :1.:3,.01.:.!. .~ 14.9' 4 3 0 .0 562 1 .6 1.0 ............................ Tanzania 883.6 ....... 2..,.!?.Q '.... 1.3' 325 37 1.0 455 ........................ 1.0 0.1
Thailand 510.9 .......... §.,.l:l~.8 .:... 8.1' 116 23 2.6 1,31.~ .............. ~.:.! ....................... ~.:". _ !0!\0 ...... ························-·- ......... 5.4 . .4 ....... 2}>9.2.:. 0.8 ' 12 23 1.4 ····················-··. ... ................. 0.2 :rg~ga .... .... ... .... ..... .... ..... ..... ..... .... .0.:? ............... ·- ... .... .... .... .... .... ..... .... ..... .. . .... ..... ..... . .. ...... . .. -· .. ..... ..... .... ... . -· ....... . 1.2
!r.i.~.i~!'.<! .. a.~~ .. I~~ag~ ........................ ?..::!....... .~, fJ.f!_1 2.:~ ....................... ?. ................. _ 31 Tumsia 155.4 439 ' 69.0' 6 4 ...................................................... .. .............................. . T~rkey .!§.~.:!'. ........... ~.,.?9..!! .. ~ 17.:~.~·········· ..... §.~..... 12 Turkmenistan ..................................... ".?!Ol.:.!l .......... ~.,.§:'!~ .. :_ 52.3' 38 8 .l!e~nd~.. . 199.7 ..... .J.,.:t-5.8 .. '.... o .3 ' 61 31 Ukraine ................................................... ?..!.~.:". .......... ?..,.!.!.§ .. ~ 18.6 '·" 92 16 .IJ.~.ite~ .~'!'.b ... E'.". i'.<l~!l.S.... 83.6 73 .; . .()f!5,o... 1 1 l)~it~d .~ingd.~rT1 ................... 2.:":t.·!'. ......... 2.,.4.?9... 6.4 24 10 United States .......................... ~.,.!?!3..:.:1.... 9,168 ' 18.1' .... ? •.:1.:.2..?. 23 !J.'-U..~.U..~X.... 174.8 }L!J.?~..:... . 9..:?.~ ......... _ ... __ ?_ 5 Uzpekista~ ............... ········-··· 414.2 S.".~?i?.~ 63.4,~···········-···~1 22 Vanuatu 12.2
v~.n~~.~ . ., ~.~ ..... f!l'!. ... .................... 8.?.~.:.~ ...... ?.!.,£3.?.~.' . .. . . .. (). :3.~ ......... :<1:'1.1:> ... ... ... ~0 .. . y1etnam... 325.5 ... 1..1 ,.64..7 .. 6.1 91 28 Y.i rgiD I SI~~d.~J~ .SJ ....................... OJ .. West Bank and Gaza
~~.'!'!'.~., .. ~~P.: 528.0 254 71.5 0 0
~~so..s!~~· .. ~~~~:!MO..~!:.l 102.0 17.?0l. .................... -··········- 18 17
~.'!rT1.~i.a. ....... --- .. .!4.~::<1 _12 ,00_1 ' 1.5 ' 314 42
Zimbabwe .................................. 3!l§:!il. ........... 1..,.7..1.:! .. : .. . 87 23
.. Not available.
1.5 ........ §.,4.1.:.~ .... . 0 .5 738 .............................
1,140
1.2 7.2 5.7 0 .0
0.0 --?;§.!.5 -· 1.0 0 .9
-0.1 ............... ?.,.9.§9. 0.0 ........... !:t.·.~EJ.l ..
-0.5 .............. ..J.,!l§~.
1.1 1.7 5.3
17.5 1 .8 2.9 7.4 0.1 7.8
33.3 9.5
-0.3 0.0
.... .. ?,.9!.§ 3.6 20.0 883 9 .7 1.7 ....... _ .. ,_ .. ,_ .. ,_, __ ,,_,_, .. ,_,_ .. _,,_, .. ____ , __
-2.7 1.1
.... ..lA ......... .... 2.., ~?.!'3. 2.4 1.4 ................... 5~1 ........... ..?:.2 .. .
208 3.5
4 .1 0.4
6.5 0.5
0.8 634 1.2 0 .3 0.6 866 3.1 1.6
Note: Figures In italics are for years other than those specified; the number 0 or 0.0 means zero or less than half the unit shown and not known more precisely. a. Data refer to any year from 1980 to 1998 unless otherwise noted. b. PPP is purchasing power parity; see the technical notes to the Economy section. c. Total water resources include nver flows from other countnes. d. Land area for Betg1um includes Luxembourg. e. Data refer to estimates for years before 1980.
20 00 World Bank Atlas 3
38 2000 World Bank Atlas
Economy
Economic growth expands the opportunities for people to improve their I
ing standards. It also provides the resources to lift people out of the worst fon
of poverty. Between 1980 and 1998 the countries of East Asia and the Paci
led the way-with their GNP per capita rising by almost 7 percent a year. E
the path is not always upward. Many East Asian economies suffered setba<
last year, a consequence of the financial crisis that swept through the dev
oping world. Global economic growth dropped to 1.7 percent in 1999, a
low- and middle-income economies grew more slowly than high-inc01
economies for the first time since 1993.
Economic growth alone will not cure poverty, but good policies that n1
ture a stable economy help to create an environment for reducing pove1
Over the past two decades successful countries have managed their econom
well-keeping inflation in check, holding trade deficits down, using forei
borrowings wisely, and maintaining a healthy rate of domestic investment. T
poorest countries have followed the opposite route. Ethnic conflict, politi1
instability, and bad economic policies have squandered their resources at
in many cases, left them heavily in debt. Debt relief offers them some ho
of starting over, but only if it is combined with a broad-based commitme
to policies and public actions that promote growth and benefit the poor.

~conomie
~a croissance economique ouvre aux etres humains de nouvelles perspectives
!'amelioration de leur niveau de vie. Elle fournit aussi les ressources
)ermettant de les affranchir des pires formes de la pauvrete. Entre 1980 et
l998, les pays d'Asie de l'Est et du Pacifique ont ouvert la voie, avec un PNB
)ar habitant en progression de pres de 7 % par an. Mais la voie n'est pas
.oujours ascendante: en Asie de l'Est, nombreux sont les pays dont l'economie
t marque le pas l'annee derniere du fait de la crise financiere qui a frappe
'ensemble des pays en developpement. Le taux de croissance de l'economie
nondiale est tombe a 1,7% en 1999, et, pour la premiere fois depuis 1993,
es pays a revenu intermediaire et les pays a faible revenu ont progresse plus
entement que les pays a revenu eleve.
La croissance economique a elle seule ne fera pas disparaitre la pauvrete,
rais des politiques avisees qui ont pour effet d'assurer durablement Ia
tabilite de l'economie contribuent a etablir un milieu propice au recul de a pauvrete. Au cours des 20 dernieres annees, les pays florissants ont bien
~ere leur economie : ils ont maitrise !'inflation, controle leurs deficits
:ommerciaux, utilise judicieusement leurs emprunts exterieurs et maintenu
m taux adequat d'investissement interieur. Les pays les plus pauvres ont suivi
a voie opposee : sous l'effet de conflits ethniques, de troubles politiques et
le politiques economiques peu avisees, leurs ressources ont ete dilapidees et
Is se sont retrouves, pour beaucoup, dans une situation d'endettement
:xtreme. L'allegement de Ia dette donne aces pays uncertain espoir de pouvoir
·epartir sur de nouvelles bases, mais uniquement si cela s'accompagne d'un
arge engagement en faveur de politiques et de mesures gouvernementales
JUi encouragent la croissance et qui soient favorables aux pauvres.
Economia
El crecimiento economico aumenta las oportunidades de mejorar las
condiciones de vida de la poblacion. Tambien proporciona los recursos
necesarios para sacar a las personas de las peores condiciones de pobreza.
Los pafses de Asia oriental y el Pacffico estuvieron a Ia vanguardia entre 1980
y 1998, con un aumento de casi 7% anual de su PNB per capita. Pero el camino
no siempre es ascendente. Muchas economfas de Asia oriental sufrieron
reveses el aiio pasado como consecuencia de Ia crisis financiera que afecto
al mundo en desarrollo. El crecimiento economico mundial bajo a 1,7% en
1999, y las economfas de ingreso bajo y mediano crecieron mas lentamente
que las de ingreso alto por primera vez desde 1993.
La pobreza nose eliminara solo con el crecimiento economico, sino con
buenas polfticas propicias para que una economia estable pueda crear un
medio conducente ala reduccion de la pobreza. En las dos ultimas decadas
los pafses que han logrado exito han administrado bien sus economias, al controlar Ia inflacion, reducir sus deficits comerciales, utilizar sabiamente
sus emprestitos externos y mantener una tasa solida de inversion nacional.
Los paises mas pobres han seguido el rumbo contrario. Los conflictos
etnicos, la inestabilidad polftica y las malas polfticas economicas han Jlevado
al despilfarro de sus recursos y, en muchos casos, los han dejado muy
endeudados. El alivio de la carga de la deuda brinda esperanzas de poder
empezar de nuevo, pero solo si se combina con un compromiso am plio con
polfticas y medidas publicas que promuevan el crecimiento y beneficien a
los pobres.
20 00 World Bank Atlas 3
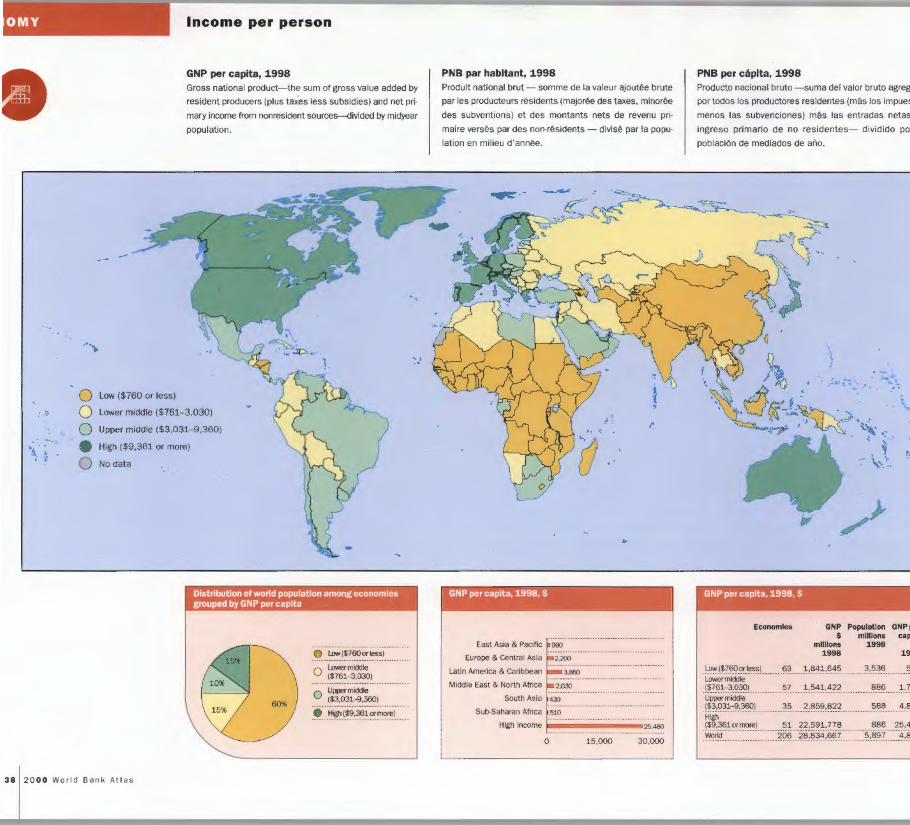
... .....
0 : -~ 0 · .. 0 .......
0 '.\:!. . . 0
Low ($760 or less)
Income per person
GNP per capita, 1998 Gross national product-the sum of gross value added by
resident producers (plus taxes less subsidies) and net pri
mary income from nonresident source5--{jivided by midyear
population.
' .. Lower middle ($761-3,030)
Upper middle ($3,031- 9,360)
High ($9,361 or more)
No data -.
Distribution of world population among economies grouped by GNP per capita
0 Low($760orless)
O Lowermiddle ($761-3,030)
O Uppermiddle ($3,031-9,360) ....................................
0 High($9,361ormore) .............................................
3 8 2 0 00 World Ban k At las
PNB par habitant, 1998 Produit national brut - somme de Ia valeur ajoutee brute
par les producteurs residents (majoree des taxes, minoree
des subventions) et des montants nets de revenu pri
maire verses par des non-residents- divise par Ia popu
lation en milieu d'annee.
GNP per capita, 1998, $
East Asia & Pacific
Europe & Central Asia
Latin America & Caribbean 3.860
Middle East & North Africa
South Asia 430
Sub-Saharan Africa 510
High income ~--------25,480 0 15,000 30,000
'
PNB per capita, 1998 Producto nacional bruto -suma del valor bruto agreg<
por todos los productores residentes (mas los impues
menos las subvenciones) mas las entradas netas
ingreso primario de no residentes- dividido por
poblaci6n de mediados de aiio .
, ..
GNP per capita, 1998, $
Economies GNP Population GNP 1 $ millions cap
millions 1998 1998 19
L9."!(~!El9.~rl".~) 63 ...... 1..·.~.1 ... 1'.~.!> ~.!}~~ 5 Lower middle !~!61.::~.<!:l<J.L 57 1.-!>~1.-~~? . 886 ...... ~.!
35 ?-~!>~-ll~? 588 .... ~ .~ High ($9,361ormore) 51 22,591,778 886 25,4
wartd ••••••• •••••••••.•••••••••• jiJ.~ • ?~-~?~A~? ............ ~ •. 13~! .. ······~ :?

Tasa de creclmlento del PNB per capita, 1990-98 Variaci6n porcentual anual media del PNB per capita real
de un pais. A fin de excluir los efectos de Ia inflaci6n , se
utiliza el PNB medido en precios constantes para calcular
Ia tasa de crecimiento.
"'"!>
0 0 0--0.9%
0 0
~~~ .... €) \. , ·; 0 No data
GNP per capita annual growth rate, 1990-98, percent
Economies GNP Population $ millions
millions 1998 1998
LessthanO% 54 y~:()~,6~:2 653 0-{).9% 22 2,986,824 468 .............. .. ... .. ... .. .. ... ... ... 1.0-1.9% 38 ....... ~.!"~~.()~?. . 925
2.0-2.9% 30 10,861,217 713 .................................. 3.0%ormore 34 .. .. .. .. ~ •. 4~~.25.1 .. 3,020
No data 28 182,639 119
GNP per capita
$ 1998
2,160
6,390
10,700
15,240 1,160
1,540
Taux de croissance du PNB par habitant, 1990-98 Variation annuelle moyenne, en pourcentage, du PNB
reel par habitant, calculee a partir du PNB en prix con·
stants afin de faire abstraction des effets de !' inflation.
Index of GNP per capita, 1980-98, 1980 = 100
300 • East Asia & Pacific
240 Latin America 0 & Caribbean 180 Middle East 0 & North Africa 120
60 • South Asia
• Sub-Saharan Africa
1985 1990 1998
Income growth
GNP per capita growth, 1990-98 The average annual percentage change in a country's real
GNP per capita. To exclude the effects of inflation, constant
price GNP is used in calculating the growth rate .
·' 1 ·. ~ ,, {
Distribution of world population among economies grouped by GNP per capita growth rate
LessthanO%
O-<l.9%
1.0-1.9%
2.0-2.9%
3.0%ormore
No data
\ ;
·-· :.tu('!. .:...-~~
... ·!' •• ~.~
t.
·.;;, '· .. '-:: ·:t
..... ~ .. .,, ..... ' ' ' '4 ~ ... ~'.:.
b '
20 00 World Bank Atlas

' MY
I
-
,.~
0 0 6-9%
0 0
.. -...... 0 \·~ ; 1 0 No data
~ 0 20 00 World Ba nk At la s
Agriculture
Agriculture share In GOP, 1998 The value added in a country's agricultural sector as a per
centage of gross domestic product.
Distribution of world population among economies grouped by agriculture share in GOP
Lessthan 6% ................................................... 0 6-9%
0 1~19%
0 2~29%
e 30%ormore
0 No data
Part de !'agriculture dans le PIB, 1998 Valeur ajoutee du secteur agricole en pourcentage du pro
duit interieur brut.
r
Agriculture share in GOP, 1998, percent
World
Middle-income economies
High-income economies
0 5 10 15 20 25 30
Proporclon de Ia agrlcultura en el PIB, 1998 Valor agregado en el sector agricola de un pais como po
centaje del producto interne brute.
\ . J ·-"-.,;-:..•r. . ...
, ..
Agriculture share in GOP, 1998, percent
Economies GNP $
millions 1998
Population millions
1998
.... -. ~·· i.
~
., t#,
GNP per capita
$ 1998
..L.~.S.~ ~~.a.~--~~ ........... ~15. .?.~,~~~,g?,~ u • }.,~~~ ?,~,.5.~~ 6-9% 23 ...... ~,~3.?.,~?.... 473 ........ ~,-~c:l<:) 1~19%
2~29%
30%ormore
40 2,071,226 1,867 ......................................................... 26 884,291 1, 703 .............................................................
584
1,110 520 450
Nodata 34 491,068 140 3,520
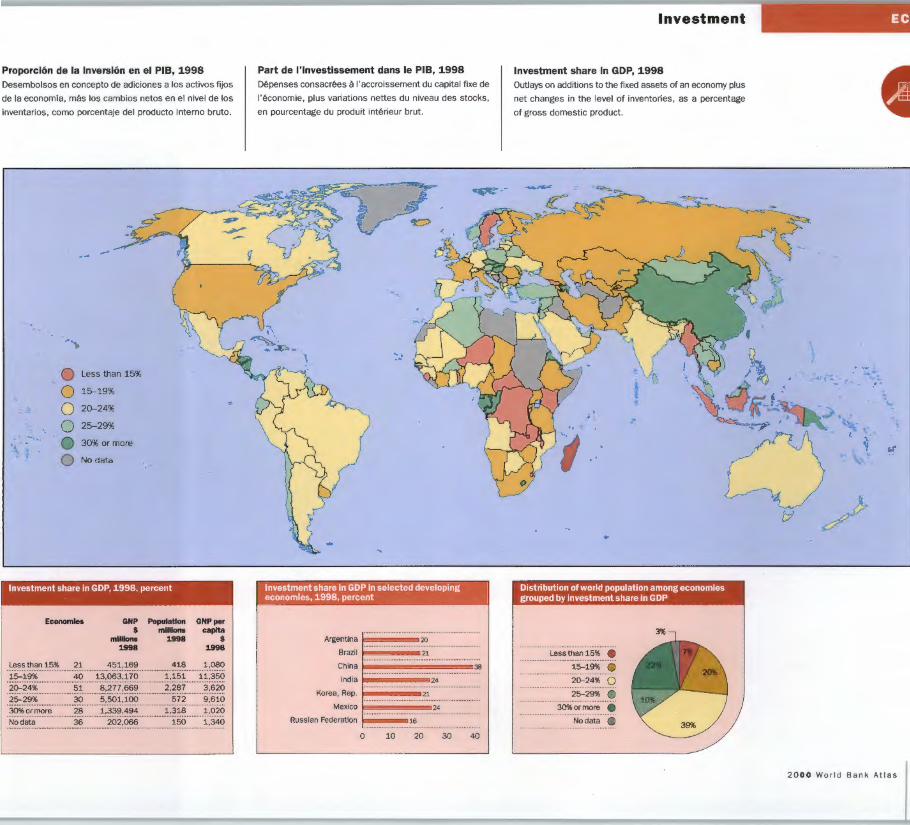
Proporcl6n de Ia Inversion en el PIB, 1998 Desembolsos en concepto de adiciones a los actives fljos
de Ia economla, mas los cambios netos en el nivel de los
inventarios, como porcentaje del producto interne bruto.
-
'""'>
0 Less than 15%
0 15-19%
0 20--24%
0 25-29% -.. • 30% or more . \ ~ 0 No data
Investment share in GOP, 1998, percent
Economies GNP $
millions 1998
Population millions
1998
GNP per capita
$ 1998
L.e.~~~~~~}?~ ....... ?~ ............. ~:;~!-~~!1... . .. 418 ......... :1:!~13.~ 1~~~'l6. .... ........ . 40 g~~,p~ . .. }_,~:;~ ...... ~~!.3.:;~ 20-24% 51 ....... 13.,.2.!!!.~!1 . . 2,287 ......... ~! .6.?.~ 25-29% 30 5,501,100 .................................. 572 ........ !1!.6..1.~
- ~~O.'.IllO.'.e. ........... ?.l3 ~!3.~!1!~~~ .............. },~~13. .......... ~!~?.~ No data 36 202,066 150 1,340 ........................................................................
Part de l ' lnvestissement dans le PIB, 1998 Depenses consacrees a l'accroissement du capital fixe de
l'economie, plus variations nettes du niveau des stocks,
en pourcentage du produit interieur brut.
~~
Investment share in GOP in selected developing economies, 1998, percent
Argentina 20
Brazil 21
China
India 24 ............................ Korea, Rep. 21
Mexico 24
Russian Federation 16 ........................................................ 0 10 20 30
38
40
Investment
Investment share In GOP, 1998 Outlays on additions to the fixed assets of an economy plus
net changes in the level of inventories, as a percentage
of gross domestic product.
Distribution of world population among economies grouped by investment share in GOP
Less than 15%
15-19% 0 20-24% 0 25-29% 0
30%ormore • No data 0
·-· .... '.~
t ,_
.,. ... , ..
20 00 World B a nk Atl as

Economy
GNP
$ millions
1998'
GNP per capita
ppp
lnternat•onal
$' 1998
Average annual
real growth %
1990-98
Agriculture Investment Avetage
%of GOP 1998
%of GOP 1998
annual lnftatlon
rate
% 1990-98
% of GOP
1998
Total extemal
debt
m1 llions 1998
1\of~oh.o~~~osot~~oo 0 0 0000000000000000000000000000000000000000000000000000000000000000000000000000000000000000000000000000000000000000000000000000000000000000000000000000000000000000 00000000 0 00000 00000000000000000000• Albaniaooooooooooooooooooooooooooooooooooooooooooooooooooo? o,?.:L?. 810 2 ,864 ' 2o7 54 16 000 000 000 51.50 0 -201 821 Alge!ia 000 000 000 004 0f3 .?89 0 000 1 ,5?0 ~;~9§' - 1.0 12 27 21.1 0 000 ;J(),f36? _ American Samoa .. .. Andorra ·······················································································;···· ···························· ·······························································
1\ngola
000•0•
00
•••
000
•••
00
•••
00
•••
0 0••• ~ :~7~ •••
000000000000
38o 00000000000
999'00 0
..:S:2 12 20 92403 -23.8 000
1:;!,17:3 ~~~!i(\U~~~~IJ~'!J~d.~ ?.§5. oooooooooo ?. !o~?..O 0 ?.-§~9 304 4 32 2,§ 0 :::?::'l om . ;'\rge~ti~a 290,:;!61, 00 Oo ?..()30 00 11,?28 4o2 6 20 7o8 -4o9 0 Yl<!,()5() _ Armenia 000 000 000 ~' !_2?. 0 460 000 00? ._9~400 -40 7 33 19 34901 - 20.5 800 Aruba r .......................................................................... Australia 00 000 00 3?~:0.0§ 000 ?Cl:fl4Q 000 0 20~ · ?!!5 0 Austria 000 000 000 02:J.fl,609!_ 00 02f3,f!3() 000 0020:3 ·0~<15 0 Azerbarjan 00 000 000 3,821 00 480 2,168
oll.~h.oao'."o~~.OOOT~~ 00000000000000000000000000000000 000000000000000 0000000000000000000000000 ' i~;~~Q Bahrain 00 000 000 000 <!,~_o~ 000 000 !.- fl~.Cl 00 00 10~·0?5.600 oll.~on.o~o~~~oeo~o~ o o ooooooooooooooooo oooooomoooooo<lo~o•o ?.?o4. 350 mo m:L•<I()! Barbados Belarus 000 0000 000 0000 0000 000 0000 000 ?2,303? 0000 000 ?A8Q 000 0000 of3,o!J~40 oll.Elolo!;liour':' 0000 oooooooooooooo ooooooooooooooooooooooo??.oll.:o~ofl§o :;!5,3.§Q ?3.,§?? Belize 0000 000 om 000 0 m .. 00000 0 000000 §03.5. 00 00 2. ,§§.9 00000 0
4.:}0§!
380 857 Benin oooooooooooooooooooomom ooooooooooooooomom 000 ?0,??2. 000 Bermuda
.,.. Bhutan 354 470 000 0000 0~-<1380
00000000 0000000000000 00 00 00 00000000000 0 00000000~,()1.03 ! ,O!_D 00000 :;!,?()?
3 1
20
22 1.7 -4o8 25 205 -202 39 32203 - 34o8 693 .................................. . ................................. .
2o9 -700
105 000 000 00 00 § 00 22
7 302 l oO
6 -002 - 1905 ......................
22 oooooooooooooooooooooooo!lo:ofl -006 16,376 16 2.4 - 205 608
- 307 1.6 Oo5 1.8 102 201 200
13 1
19 39
26 44909 18 203 .................................. 24 3 .1 17
............................... 1001
3 o5
-402 0 000 0000 ~ . 12() . 409
-8o8 338 -8.8 000 1 ,64!_
.............................................................................................................................................. 38 47 15 20 ..................
9 .7 9 .9
- 11.7 120
-7.8 0 00 6 ,0?13. .
000 4,?S)5 000 0} ,0!() 0000 000 ,; . ~96. 000 Oo9 4 21 10o3 3o5 548
.76!0·0?.06.?. <l:fl3() 6,<!§9 1. 7 8 21 347.4 -4o3 ................................ 232,004
:L().Qil.? 0000000 :L ,22.() 4 ,683 000000000000000000000000000000000000?0·0?.!.5. 240 °
0000000000 866'
Burundi 911 140 °0000000000000000
5°61' Cambodi·;;·:::::::::::::::::::::::: .. ::::.:::::.::::::·:?. .. :~.~:~·· 260 .. ::::.::::.i~.~:~~-~ Cameroon 0000 00 0 0000 0 00 0 0 0000 0000000013.:.!.3.? 610 oooooooooooo:L,}o~?.o Canada 0 0000000 0 000000 00 0 5.~(),§!20 0 000 l.~o:o:L!O
~~!'".Y.~rd~ ~a.x'."o~n. oo l o~o~~on.od.o~ oooo
499 0000 ool ,2t:J()o
o~~on.ot.ro~ol oo(lf~ioco~onoooR.~!'~~Ioic :L -Q5.3. 0 0 0 300 Chad 000000000000000000000000000000000000000000000000 000 oo:L,o§5.1loo 0 230 Channel Is lands ' ............................................ Chile 0 0 000 000 !_3,93.50 0000 004 ,9~00 China 0000 0000 00923,56.() 750
f:ione K?n~.OOC::O~io~o~o" 0000000001::!5.013.,0?3.?. 0000 2.!J ,f)§() 0 1\A~~~~ . C::~in.~ Colombia 0 000000000 0 00000 :L9(),§§_7 000000000?0:4.?Q oo 5 ,861 Comoros 197 370 ooooo i.4oo<o
00
.9.~.~.e.9.! ... q~:~:;::~~p··:::::::::::::::::::::::::$.:~~:?.~ .............. :iiO · ·· ··· ··· 7·33 d.
c9neoo,oooR.~Po: ooooooooooooooooooooooooooooooooooooooo:Lo,§o~o~ 680 846 Costa Rica 000000000000000000000000000000 00 00000~,!.7. 01:: 00000 2. ,?.!Q 00000 0000 0?.:8.012. 0000 ~ij~~~ : ly<>.i!~ 00 00 :LO,l~f) 700 000 000 ~.48:'1 000 Croatia 00 000 000 oOo 000 200,713.6.0 000 000:4.,0§?.9 0000000§,§~8.0 Cuba
gypr~s 00 00 oO?,o~fl.o3 0 :L:L ,~?() 00000000:1.!,0?.0~~ ~ze.c~ ~e~u~lr~ 00 000 000 000 00 53 , ()~4 0 0 0 ?.::L?() 00 000 :L?.::L~_7 Denmark 000 000 00 0~ 705 ,:L§O 000 3.!3,()<1() 2.:3,§?.5 [)ii~outi
Dominica 230 00 00030,1?() 000 00 4_, 7_7_7
'2 20 00 World Bank Atlas
3 1.1 -1.8 1.1
-505 200
-203 1.1
2.4
1.7 -3.1 -8o5 -206
200 1.4 0 05
19 33 54 51
18 0
13 39 58 12 15 26
9
2.7 00000000000 ~ -0.2 4
2.7 0000000000000000000 ~ 00 00
......................
15 116.9 ........................... 29 6.6 .................................
9 11.8 15 3208 18
............................ 6 01 1.4 4.4
5.4 8 o3
27 9 .3 ................................. 38 907 .................................
- 301 9,907
-807 :L-}~9
- 11.7 0 000 00 ~,101~. - 708 00 000 00 :;!.21() - 207 9,829
- 503 36,302
301 ooooooo:L?.0'!0·0050~0~ 30 6.4 - 300 ............................... 20 5.4 20 21.5 - 5o 7 0 00 _3~ . 263. . 20 3o9 - 1 7o 8 203
8 0 000 0__1,4?3,_1 000 0 -8.4 12,929 35 00 000 0000 000000 OJO:O:L - 10o9 5 ,119 29 17o6 -4.4 0 Oo0 3.,0!3Do 18 8 07 ................................ 23 131.2
25 307 30 21
.................................. 1307
106
- 1.9 14,852 - 701 0 00 80, 29!_.
-602
- 200 000 0 2.5,3()1 _ - 1.4
4 9 4.4 288 109 1.1 20 25 3 .2 -703 .................................
Economy
GNP
$ mi1hons 19988
GNP per captta
ppp
1nternat10r1al
$' 1998
Average annual
real growth %
1990-98
Agrk:utture Investment Average
%of GOP 1998
%of GOP
1998
annual lnftatlon
rate
% 1990-98
Cumont account balance
%of GOP 1998
Total extema -millions 1998
Dominrcan Republic 000000 000000 .:L4_,062~ 00 000 000 '! ,33! 3.4 0.8 207
12 13 17 12 22
26 10.6 - 201 0000 0000 ~- 4.50:
Ecuador 000 000 0000 oooo 001fl.,<l59 J. ,QO!J 26 32.0 - 11.8 00 00__1f! ,J,41 Egypt, A!a~ R.ep00 0000 000 000 J~-1.8? 00 El Salvador 000000000000000000000000000000000000011,.002.0()07 oOO Eo~~at~>roiaiOOGO~i':'e.~ 000 000 ooo 000 000 <17?000
00 00000 3. -:1.4.§ 000 0 oooOoo 4 ,()()8
22 000000000 oooo 00000 00~-Loo - 3 .3 ooo 0 3:L-9f3• 3o2
1301 17 8 o9 -Oo7 000 0000 ::J ,f33: 85 12.7 -13208 301
Entrea 781 °
0 0 0984' ...........................
Estonia 000 00 00 00 000 00 000 00 00~:0§!8.0 000 0 3 ,3.§() 000000000.?:0?.06.!30 E!hio~iao 6,1690 000 00 ~0_() 00 566 Faeroe Islands t
f'iji ooooooooooooooooooooooooooooooooooooooooooooooooooooooooooooooo:L :.?..~S.o 2,:;!1.() 0000000000004.:.9..~<10 Finland 000 0000 1?£!.()91 00 2:'1.:28() 00 2(),f34_1 r';ance'
00 000 000 000 1 ,4f3f!.J.9~ 00 2<1.2.1.0 oooooooo?:Lo·o?ol.<loooo
o~r~no~hoo E~lynesia 00000000000000000000000000000000000000 000 000000000 0000000000000000 000 Gabon Ooo 000 0000 000 0000 0000 0000 0000 0000 4. - ~0~02 00 000 <1 -1::7.0 00 5,615 ~aiJ1bia, T~eoo 408 340 0 •••• 0 !;42.?'
202 -1.4
206
Oo5 1.8 1.2 1o3 0 03
-005
9 6
50
19 4 2
27
0<3."0"-~~i o~ 000000 000 000 00000000 00 0000005. ·0?.013.010 970 000003.: <1 ?.~ -11.3 26 0<3.~0''-"oao~Y. 00 0 000 0 00 ?. : !?.~.~()? 0 :;!6 . ~7_() 22 ,026 009 0 1 Ghana 000 ~ .26~ 000 390 0 •• 0• ~:?~5~ •00
1.4 10
Greece ooooooooooooooooooooooooooooooooooooooooooooo:L?o3.,}0~<1 0000 11,740 13,~9.4 1.2 00 0000 000 000 § Greenland Grenada 313
p,75~ 000 000 1..§4() 000 0:3 ·0~~400 00 o::J,77.7 0 530 00 ) ,_722
184 160 573 661
1.5 201
- 1.3
23 22 62 35
Guatemala Guinea Guinea-Bissau
~uxan.aoooo Ha1t1 J.. :J-§3 410 •
0 ••• 1;3!9' 0
- 30 7 30 Honduras 000 0000 000 000 0000 000 000 o~.!:j640 740 000 002,_33.8_00 1.4 20
~u~g~rx <1?.,§§9 <1,£!1() ~.§3.?. Oo9 6 Iceland 00 0 0000000 0 000000 _?,60~§0 000 ?.!.-08_:3() 00000000 ?.04.:.7.7.<1 l o5 00000 00 ~ 0 India 000 000 4.2!,0:'10.7.00 lndonesra 000 00 0000 ooooo 0000 oooo 1,3_(),§()() olo r~n.,ooo losoi ~OIT_liocooo~~P.o: oooooooooooooooooo:L90?,0 ?.0~02.0 l ~aq
0
Ire land Isle of Man ................................ Israel 000 000 00 000 000 000 0000 000 009§,<!83 00 l !~ly ooooooooooooooooooooooooooooooooooooooooooooooo :Lo:o:L5.!,9001
440 0000002 ,_()06.90 403 29 20
............................... 41 1001 . ............................... . 29 75.4 ................................ 18 8 00
12 3o7 ................................. 17 1.7 17
00 000 000 ~0 32 18
8 21 23 20
1.7 Oo8 702 4.4
70903 202
28.6 lloO
- 3303 -902
14! 78:
-800 000 000 10,?5:
- 305 6ol 208
19:
-1.4 0000 0000 '! -4.2! - 10o6 47
-7.6 000000 ooooo :Lo,6?.· -0.2
-407 000 0000 §,§8: -401
41 2.8 - 27 06 180
16 21 11 29
11.4 6.7
41.8 1600
11 2303 30 20o6 31 2200 ............................... 18 2o9 24 809 ................................. 14 1202 .. ............................ .
18 4.4
- 5.5 0000 000 '! .§.6! -303 oooo ;:) .?.41 - 2.4 96·
00 000 ~ .§5: -1.0 000 000 1 ,()4: - 209 0000 00 ? .QO: -4o8 0000000020fl. ,o5.81 - 509
- 1.2 0000000000~0~0,020::3 4 o2
Jamaica 000000000000000000000000000000000000000000000000004.:<1013.010 0000 00000010,.!<10 ooO 31 29.1 -4o0
!apa.on. :'1 ,()§~, :1.~9 3.? ,3.?_() 29 002 302 ............................... Jordan 00000 000 000 0 0000 moo 000000000000000000000?.,0?0?.02.0 oooooo :Lo,:Lo5() 20 1
-803 3 25 3 .3 .................................
Kazakhstan 000 0000 000 000 0000 ooo2_(),§Ej6 000 00000 o:Lo,o:3 <1_() 9 17 33007 ................................. fSeon.Ya. 00 1(),?01 350 000
200 26 14 1508 .................................
Kiribati 101 00 000 ~ - ~ !.0000 000 0_3,808() 0 21 0000000000000000000000~ 0000 402 OIS~r.~o~o,oo _l:lo~o'."o:ooo~e. P.oo o .. 000 000 00000 000 0000 000 ofS~r~o". ,OOOR.~P oooooooooooooooooooooooooooooooooo3.!3o?.o·o?o??.OOOoOOO 8 ,600 ooo ~3,286. 0 4o9 5 21 Kuwait 00000 0000 000000000_.0,00 0000 0000 F :.So 0 oooOo 000 000 0§ 00 14 fSy_rgyzo R.oep~~~i~ ooooooooooooooooooooooooooooo:L.__7.!100 380 oOo 02,204! 0 - 7.7 46 18 Lao PDR 0000000000000000 00000000000000000000000000000 oo:l:O!J.O?.OJ. 320 oooooooooooo:l:o§ofl.!Jo 308 53 25 Latvia 000 000 000 000 000 000 000 000 000 005,91,70 00 02 0,042.() 000 000 ,; . ~7_7 00 - 500 5 23 Lebanon 0000 00 0 00 0104 ,0~!50 oOo 0030,05§0 4 ,144 4 o5 12 28 Lesotho 1,:1.§7 570 j~i~~~ 203 11 49 Li beria Libya 0 Liechte nstein ...................................
6.4
15708 1603 71.1 24o0
707
Lithuania 0000 00 000 0000 0000 000 000 0000 9.: ~01! 10 24 11105 .. ................................ .
Ool oooooooooooooo?.o,<lo?.! - 5o5 moo 0000000?.,?.1.: -301 _?,Q:ll
200
1206 000 ~3!;),()9 lO oO
- 1501 0000 000 00~ -1.4:
-601 00 00 0002,<13.0 - 11.1 - 2206 -3504
751 6 ,72.'
69 000 2,10
-1201 ooo oooo 0__1,~5.~

Economy
GNP
$ mrlllons 1998' 1998'
GNP per capita
ppp Average inter- annual
national real growth s• %
1998 1990-98 ....................................................................................................................
~ux~'!'~()~r~~ w. w • •.. • •••.. 1:.!'3,. :2~9. . ~!;,~09 36,703 1.5 .t\1.~.~-~.<J.~~ia, FYR ......... :2,§.~.... ~,.?_90 ········4:2·24o··· -1.4
.~.a.d.a!I~S.~~.' ............................ ~,?.4.! 260 741 - 1.2 Malawi ............ _} ,).§B.. 210 551 0.8 t\1_~1~y~i<l_ .............. !31.-,;3.1,1... 3,670 7,699 Maldives ................................. ........ ?.~6 ... ).,13§ ~~;~3.§~
4.8 4.1 0 .6
Agriculture Investment Average
% of GOP 1998
13 16 47
%of GOP
1998
27
annual Inflation
rate
% 1990-98
5.1 8.2 9.3
Cunent account balance
%of GOP 1998
-4.8 -6.3 -7.1
Total external
debt
mrllions 1998
Mali ....................................... ···- ............. ~ .• E>.~§_ 250 673 Malta ............................. } ,?.0.! !!i.: !iJ.9. : 2~,~0.1~ 12.6 .. ~ ....
21 23
....................... -5.5 -4.7 ·- --- ------····· ------------------ --------------------------------·
.M~rs..~~l.l _ _lsi.~~~.S. . 96 . .. ) .• ?~0 . -6.8 .... .. ... ~ ........ w •• !:0... . ................ . Mauritania ............................... 1.(?.~~ 419 ..... ::::.);50' 1.5 25 21 5.3 7.8 2,589 Mauntius .................................. ~,J..2!'J .. ..... }._!3_0 .......... 8,.:2~6.. 3.8 9 . 24 6 .2 0.8 ....... 2,48:2
~~~~~ .... ........ .......... . J.~?.::Q.~f :::::~;:~§ - :r.;~~!i~:· 05 ·· - 5 .... ···· ··· 24 ··· ········ i9.s ········ ::i:i ···· 1~~;959· fV1icro~es.ia, ~e~ . ~t~ . ............. ?O~ ...... 1.1;!0.0 -2.5 ........... 3_.~ . Moldova ........................... 1.-,f5.?.:2... 380 ....... },.!'J.~?. ···; Monaco
. M9..n.ll~~.i~ .............................................. !3.~:5. 3so . . i.A~3.~ Morocco ................................. 3.~/~~-~- ........ !.,.~~9 3,188 r.10Z~n:tb.i~U.El .............................. .... 3.•.:'.7!3 .. 210 ....... 740° Myan'!'~!
Namibia .................................. ?..;?_~_?." :::·::::--!:;:~~9. :::··::::··:~-:~:~9~ !':l~p~l . ow. ••••• ••••••••••••••• ~!?..!3~. 210 ..... 1,~!31 . Netherlands ....... :38!01,2?..? .... ?4. 780 ... ?_2,_~3.5. Netherlands Antilles "i"" . .... ..
-8.3
-1.5 0.4 3.5 2.9 0.8 2.4 2.1
29
33 17 34 53 10 40
JL.
26
26 23 20
173.9 -20.7 1 ,035 .......................
78.2 -7 .2 739
3.5 -0.4 ......... ?.9.1!!3.! .. 41.1 -12.2 ........ ~ •. ?0!3
12 wo • • • ~:5. :.9 ...................... ?. .• 6.8.0. 19 9.5 5.2 .......................................•
22 . .... .... IJ..9. . -!3:~ 2,~4!3 . 20 2.1 5.2
New Caledonia -0.4 4 1.7 ···-··········--··-- ................................................. . . ............................................. _ ....................... . _r;ew .z.~aland .. . .......... ?.?.,3.?.~ ...... 1::'-.!30.0 16,084 1.4 ................ S.... 21 ........................ 1:.6... -6.1 -~~~-~r~g~_a .......................................•. 1. .• ?.?.!3. 370 ....... "1,896• 2.0 34 33 ......... ....... }?:.~ -29.9 .......... ?,96..8 .llli!l~'. .....................................•....... ~.2.2..3. 200 ............. "7"29• -1.2 41 10 6.8 -::!'l.:~ .............. !.!El.?..~ .. . _Nrgeria . . ........ __ 36,373._ 300 ..7_4() 0.4 32 20 38.7 -10.3 .... .3.<? .• 3..1?. Northern Mariana Islands ···, ·· ........................................................................................... . ........................................................................................................... . !119.r.~~Y ........•............. _ 1!:;2.,.<1.~9 . . ~~,~1,0 ... :2..13,!~!3 3.7 Oman ............ . ................. ............ :: ................... :.: ...... .. -:9-.4 .. . Paki.~tan ........... E31..c<l.!'i.! _ 470 _1,6..??. .... 1.5 Palau 8
.. ~ ,62(! .... :3?-?.29
........................................................................................................................... Panama .................. !3 .• :2..!?. .. :2..,.~~9 ........... 4'-~-~?. ..... . 2. 7 8 33 ............... ?· ~ -13.3 6,689 ~~P.U..~ ... !IIe.w ... c;.~.i~~~ 4,:1,_<!~ 890 2.1 24 30 ........................ !.:.! ............. !.:.~.... . 2,692 ~~'.~(\u~y ....................... __ 9 ,1.!2.. 1.-· !6_0 ... o,o.. 25 21 14.6 - 3 .1 2,305 Peru .. E>.<? .• :'.~! ....... _.?~.~:'.o ... . _P~ilie~_in~s . . . ....... J!l,!'J~!l . . .. !,O?.Q Poland .................................... ~?.! .. ?.8..5 ........ 3_,9!<? ..
7 ................ ?..~.... 33.7 -6.0 ... ~~,=3.9.!. 17
5 21 26
8 .5 26.9 .....................
2.0 ...... '.1.7. .• !1.!!. -4.4 47,708
.P".'.!~£~1- . • -- - .... ~<?.1! .• 3..~.~- ... :1,9,~?0. 2.1 .................. JL. 26 5.8 -6.8 ........................ Puerto Rico ...................... 1.4 .................. ~ ................... !i .............. . '!..? . ................................. . .. ............................................. ;- --· Qatar -5.3 ............ ·························-··· ...................................................................................................................................... . Romanta ........................................... 3..<:>,?.~!3 ......... .!.,.~!39 ............ ?. .. ?..!? ... -0.6 -~~.S..S..i~-~..F..,~.e.'.~!i .~D ......... 3.31,?_7.6 ... ?.2!3<? ....... 1!,18() .. -7.2 Rwanda ·--~~~..?.:'...... 230 -4.3
Samoa 181 ..... !.-0.7() ......... 3. .?.5~ • .. 1.1 -1.0 -~~9.!.~.rll-~ .. a..~.d. .. !~'.ln_~.i~ ............ .3.!3.. 270 1,289
§~~d.i ~_r-~bia ... . ........... ~:'.~·.3..1!.!.... .. l!.,~i.§ ::;.Q;i.~ii~ -2.4 -~~-~-~.ll~ ~ ••••••••••••wwowo ••• ~.§!33. 520 •••• •••• 1,2.!')? 0.5 §~Y~~~I_I~~ --······- 505 ..... l!/~2.9 ........ !0.,!.~..?.-.. - 1.4 Sierra Leone 703 140 445 -6.0 ........................................ ...
~Lnll~e?r.e ............................ !')?.,<!?~ ... ~<J. , 1.79 ........ 2.?..?.9.5.. S.l()~~-~ ~~!'.~~li~ ......................... ! .!'J ... !'l.~.! ....... ~! !~. ······-· 9,624 Slovenia .... !.~·.3.13..5 .. .... . f!.-!!3.9 .. .. 14 •. ~qo Solomon Islands 315 760 ···········-····-··························
6.7 1.1 4.4 0 .3
16 7
47
21
17 4
44 0 4 4
18 113.8 ·····························-···
16 230.9 16 18.1
. .. !i... 4.3 41 57.5
-7 .6 0.4
-7.1 11.4
~,?._13 ... 18~.6.01
1 . 2..~!3 ... 180 246 ..................................................
21 1.4 20 5.6 37
8
......................... 1.4
32.5 34 2.1 ............................. 39 11.4 25 27.0 ..........................
-10.0
-1.7 ........... ~.,86~ -17.1 187
1,243 20.9 . .................. ..
-10.4 9,893 0.0
9.7 2.7 152
Economy
GNP
$ m1llions 1998' 1998'
GNP pet' capfta
PPP Average inter- annual
national real growth s• %
1998 1990-98
A,grk:ulture Investment Averace
%of GOP 1998
%of GbP 1998
annual lnftatlon -
% 1990-98
Current account balance
%of GOP
1998
Textemal debt
millions 1998
Somalia ' ...................................................................................................... ················- ··················-2_,E33.S. . So_ut.~ ~fr.ic~ ... . . 1.313 ,8.68 .. _} ,_3.1() ...... _8,2!')6• -0.1 S.P!'i~ .......................................... !:;§?.,?.~~ ...... ~:'.,.!00 15.~_§0 1. 7 Sri Lanka ............... _1_5,J,.!6. 810 ........ ~ .. ~4.5 3.9 St. Kitts an~ .. l':l~~iS..................... 253 .... E5.,.1.f!9 ........... !OJ. 790 4.9
4 3
21 5
16 10.6 -1.5 ...... ?.4. 712 21 4.2 -0.3 ............................ 25 9.7 .................................. -1.8 ............. 8_,52?. 45 2.9 -23.5 115 ............................... .........................
St. Lucia .................................................. ?..?.!3 .......... ~·.13.E39 ............ ~!.?..9.!. 1.3 8 19 ................... ..3.:.5. -10.5 184 .s.t:. lli.n.c.<'fll .. ~.~- Gr."fl!l<!i.ne~.. 29o ......... ?-.S.6..()___ 4·.4s4 2.4 11 32 2.5 -20.9 .............. :'2o .. S.~.d~~ - .. - !3, 2.:2~ 290 ~;?~~~: 3.6 39 ............. .!~--~ -19.3 .!.1!,!1.~3. Sunname 684 ...... l,.§E).Q . O.l ............ § .... ....... ... § .......... . ~.J.?.:P ... . S."!~zil_~-~~---···········- ......... :1, .• }!3:' ........ !-~2.Q .......... ~,:1:-~5.. -0.1 16 12 12.4 .......................... -0.6 251 . .......................... . Sweden ............................... ??.13,. ~!:;4 ...... ~.5. ,.5.8..<? ...... !.~,?..~8 ....... 9:.6. .. ··········- ........ § .. 2.0 ........................... 14 2.4 Switzerland ..... 2.8<1,J,l!'J ... _ __39.~~.0. .... :2..1!,?..713.. -0.2 sr.r_i!'.~ .. ~'.~~- ~~p~~lic ......... 1:?,§3.:2 ... .! ,.Q2.Q .. 2, 702 1.3 Ta)i~iS.!~". .... ? .25!3 .. 370 1,.Q~l.. -13.4 Tanzanial ................................ J.A.?~. .. 220 483 Thailand ................................... :t~.l.-,!'J16 ....... 2.Af39.. 5,524 T~~~~ .... ..... .... ..... . . .... 1.-,~!:;3 330 !;~5~0
"I~~~~~---··· -···· 173 ......... ! .,.!?.9 .. ...... ~!~.13.7 .. Tr.i."..i~-~.d. .. ~n.~ .. :ro~~eo... !'j.Bll, ........ 4_,_5?.0 ...... J-.2.98. Tunisia . .... ..... .......... ................ 1.9,~~~- .. ?.()§.Q ............ ?.•! .?.'! "I~.r~ey __ . . .. ~t:Jo.-?.3.2 .... ~,:1,§0.... 6,594
0.5 4.4
-0.7 1.2 1.4 2.6 2.9
Turkmenrstan -14.6 ...................................................................
20 1.7 9.3 .............................. . .......................... . 29 8.9 0 .3 ......... ?..:2..4.~?. ..
6 0 moo j •• •••••••••••.3Q<l.:.t:l -4.9 ••••• ! .9!Q 46 15 ••••••••••••••m•• ~~:.~ -11.3 ••••••••••••J,E39.3 .. :1,1 ____ ?.? _ __4,8. ............ ~2 .8 .. S.E> .• !Z~ . 42 14 ......... ~:B... . .......... 1. .. 4.~13. . 38 ...................... § ... 3.:.1! ....... .:::~?.,.1.-_ 65
2 .................. ?.2 ........................ 13:.9 ____ -10.1 ............. .2. •. 1.~3. .. 12 28 ............... '.1.:.!3 -3.4 ...... 1.1_,()7.~ .. 18 25 79.4 0. 9 ....... !Q?,9!.'! ..
.. 2.5 ... ........ f363,4 . -39.5 ............ 2.-?6.?. .. . u!l!'.n..<!~ .•....................•...... 6.,.!'i?.l!. 310 ...... 1.-,9!2~ . 4.3 .. .~? ... !?_ 15.3 -10.4 ........... .3. .• '!~.?. .. Ukraine --~-~ .. ?.0.! .. 980 ......... ~,1.3.9... -11.4 14 21. ............... <1.~9:.<! -3.0 ....... ~.~' ?.1.13. .. U~i!~<! Ara~ -~n:tir!'t~.S. .... :'!l,6!,3 ..... 1.?.,.~!.0 ....... 1.~•.?.!! -1.6 ............... ~ . !i . 2.4 .l!D.it.~~ . J:<if1!ld..O.'.".... 1,264,262 21,410 .... ~.<:>,~.!~.... 2.0 2 16 3.0 United States .J.,9()2.,.9.7E3 ....... ~9,2~_<! ...... 2..~,?.49 2.1 2 19 ......................... !.:.9. -2.7
_ur.u£"-~~ ....•.................... ! .!'J,!'J6.0 ..... § ,_Q!.9 .... !3,.?~1. 3.5 __ ?._ 16 .•........ <12·.?. -1.9 .... .?.,E3Q9 Uzbekistan .... ?..2.,9..0.<! 950 2,044 -2.1 31 .............. !:.9 ................ =3..?.13:.! ........ -0.3 .............. ~,!.!!.? .. Vanuatu 231 ...... 1 • .2E30 .... ··:2" .. §.9.2 ~:: - 2.9
Y~n.~~~~~!' -.. ll.!l.. . ....... !3~,()~13 ..... ..3,?.~9 . .?. .?Q§_ -0.1 Vietnam ...................................... ?..6.,.5~.?..... 350 ... ~-6..8'} .. . 6.5
Y.~!S~~-~~-~~~~-~ JY.-. ~-: )____ '
25
5 26
!".~.s.t .. f!!'n.~ .!'".<!(]~~~ .... .::',263. .. 1 ,560 ................... .! .......... . .v~.lll~.n. ..... f!~P:.. . ... 4.f3J.O... 280 658 -1.1 18 :tueos.l<0a,E.1_1(~r_t>.;~o.n.t.J_ ......................... .................................. .................• _ ............ . _i:arTl~i.~ . w•• •••••••• •w••• •••••••••• ~•?3<1 ... . .. 3~(). 678 -0.9 Zimbabwe ............................... J,21~ ... . 620 ......... 2.!.4.!39 ... ····· .. ::-2:.?.
.. Not available. §See map for range estimate.
17 19
.................... ~,.3 .............. 1..·!! ............. 1;;3 .. 20 .... ~!'l.:.? -2.1 ........ ~?.,oo.J.. 29
36 22
18.5
24.2 -5.3 .. :'.1~8
. .. !3.·?~~--14 ................. !!~: ?.. . ..... !3 .• !31!.5. .. 17 ................... ?.!.:.~ .............................. ~ • .!1..6. ..
Note: Figures in Italics are for years other than those specified; the number 0 or 0.0 means zero or tess than half the un1t shown and not known more precisely. a. Atlas method. b. PPP is purchasing power parity; see the technical notes. c. Estimated to be low income ($760 or less) . d. Estimate is based on regression; others are extrapolated from the latest International Comparison Programme benchmark estimates. e. Estimated to be upper middle income ($3,031-9,360). f. Estimated to be high income ($9,361 or more). g. Estimated to be lower middle 1ncome ($761- 3,030). h. Data for GNP refer to GOP. i. Data include the French overseas departments of French Guiana, Guadeloupe, Martinique, and R~union. j. Data refer to mainland Tanzania only.
20 00 World Bank Atlas

4 2 0 00 Wo r ld Ban k Atlas
States and Markets
There is no ideal size for government spending- it ranges from less than 1
percent of the economy in some countries to more than 40 percent in otl
ers. An effective state, at a minimum, provides law and order, proper
rights, sound macroeconomic management, and protection of the poor an
other vulnerable people in society.
What else should effective states do? They should foster a more open an
competitive business environment while improving their own accountabi
ity and transparency. They also need to build alliances with the private se1
tor, with civil society, with nongovernmental organizations, and with th
international community to ensure sustainable development in the 211
century. One area that holds a great deal of promise for reducing poverty is ted
nological innovation. The more science and technology capacity a countr
has, the more able it is to take advantage of emerging opportunities. Wi t.
the right skills and information, people can combat disease, raise cro
yields, and use new communications technologies to improve access to edt
cation and business opportunities. So science and technology-applie1
wisely and well-can help reduce poverty.
Etat et Marchi
[J n'existe pas de niveau ideal pour les depenses de l'Etat: dans certains pays,
~lles representent moins de 10% de l'economie; dans d'autres, elles depassent
40 %. Au minimum, un Etat efficace assure l'ordre public, le respect des droits
de propriete, une bonne gestion macroeconomique et Ia protection des pauvres
et autres groupes vulnerables au sein de Ia societe.
QueUes autres fonctions un Etat efficace doit-il remplir ? II doit favoriser
un environnement plus ouvert et plus competitif pour les entreprises, tout en
faisant preuve, a son propre niveau, d'une responsabilite et d'une transparence
accrues. II doit egalement nouer des alliances avec le secteur prive, Ia societe
civile, les organisations non gouvernementales et Ia communaute internationale,
pour faire en sorte que l'objectif d'un developpement durable soit atteint au
XXIe siecle. Un element sur lequel on fonde de grands espoirs pour Ia
reduction de Ia pauvrete est !'innovation technologique. Plus un pays est dote
de capacites dans le domaine des sciences et des techniques, mieux il est a me me
de tirer parti des opportunites qui s'offrent a lui. Avec les qualifications et les
informations voulues, on peut combattre les maladies, accroitre Jes rendements
des cultures et utiliser les nouvelles techniques de communications pour
ameliorer l'acces a !'education et aux opportunites economiques. Employees
d'une maniere judicieuse et appropriee, les sciences et techniques peuvent done
contribuer a faire reculer Ia pauvrete.
Estados y Mercados
No hay un volumen ideal de gasto publico, varfa entre menos dellO% de Ia
economfa en algunos pafses y mas del 40% en otros. Un Estado eficaz
asegura, como mfnimo, el imperio de Ia ley y el orden, los derec.hos de Ia
propiedad, una gesti6n macroecon6mica acertada y Ia protecci6n para los
pobres y otras personas vulnerables de Ia sociedad.
(Que mas deberfan hacer los Estados eficaces? Deberfan promover un
medio empresarial mas abierto y competitivo, y aumentar a! mismo tiempo
su propia responsabilidad y transparencia. Tam bien deben formar alianzas
con el sector privado, Ia sociedad civil, las organizaciones no gubernamentales
y Ia comunidad internacional para asegurar el desarrollo sostenible en el siglo
XXI. La innovaci6n tecnol6gica es un ambito que ofrece muy buenas
perspectivas para Ia reducci6n de Ia pobreza. Cuanto mas capacidad cientffica
y tecnol6gica tiene un pafs, tanto mas posibilidades tiene de aprovechar las
oportunidades que se presentan. Con las actitudes y Ia informacion adecuadas, las personas pueden luchar contra las enfermedades, aumentar el rendimiento
de los cultivos y usar las nuevas tecnologfas de Ia comunicaci6n para aumentar
el acceso a Ia educaci6n y las oportunidades de negocios. Es asf que Ia
ciencia y la tecnologfa, aplicadas bien y sabiamente, pueden ayudar a reducir
Ia pobreza.
20 00 World Bank Atlas

S & MARKETS
-
,.~
0 Less than 1.0%
0 1.0-1.9%
: .~ 0 2.0-2.9%
.. 0 3.0-4.9%
.. -·~4 • 5.0%or more . \ 1 0 No data
·6 2 0 00 Wor l d B a n k Atl as
..
Military spending
Military expenditure share in GNP, 1997 Military-related spending of the defense ministry, includ
ing recruiting, training, construction, and the purchase of
military supplies and equipment, but excluding spending
on publi c order and safety, as a percentage of gross
national product.
- .... ~
Distribution of world population among economies grouped by military expenditure as a share of GNP
C> Less than 1.0% ··························································· 0 1.0-1.9%
0 2.0-2.9% ·····························-···························· 0 3.0-4.9%
e 5.0%ormore ·············-······················· 0 Nodata
-: ... '
Part des depenses mllltaires dans le PNB, 1997 Depenses a caractere militaire du ministere de Ia defense,
comprenant les operations de recrutement, les activites de
formation , les travaux de construction et l'achat de materiel
et de fournitures militaires, mais excluant les depenses des
tinees a Ia securite eta l'ordre public, en pourcentage du pro
duit national brut.
Military expenditure as a share ofGNP,1997, percent
East Asia & Pacific 2.5
Europe & Central Asia
Latin America & Caribbean
Middle East & North Africa 1.0
South Asia 3.1
Sub-Saharan Africa
High income
0 2 4 6 8
Proporcion del gasto mllltar en el PNB, 1997 El gasto militar del ministerio de defensa, incluidos el re
tamiento, el adiestramiento, Ia construcci6n y Ia adqu
cion de equipo y suministros militares, pero excluidos
gastos en seguridad y orden publicos, como porcent
del producto nacional bruto.
Military expenditure as a share of GNP, 1997, percent
Economies GNP Population GNP per capita
$ 1998
Less than 1.0%
1.0-1.9% ·························· 2.0-2.9%
3.0-4.9% ......................... 5.0%ormore
No data
$ millions millions 1998
1998
15 .. 3.9.!.,.2..7.?....... 71 ~,.3.:'1<:> 55 . ~<:> ,.!~~,?1.~ ............• ~.!~~? ... ~!.?~<:> 3J. ......... ?.!.5..J.~,?5.~.......... 3.041 1,820
32 ... 1.<:>,.9.~,.9..~... 874 _g_s.~<:> 27 .... _} ,~,-~.5.<:> ..... . .. 5.~~----~'-~~ 44 250,823 64 3,930
···-··············-····-----·--·-··-
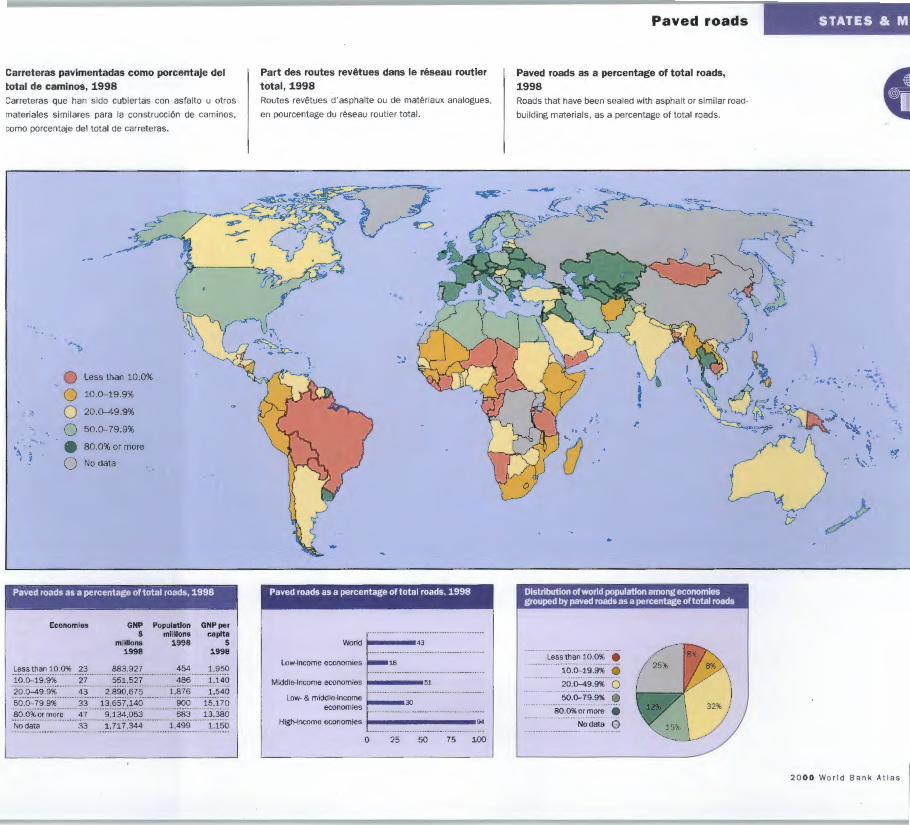
Carreteras pavimentadas como porcentaje del total de caminos, 1998 Carreteras que han sido cubiertas con asfalto u otros
materiales similares para Ia construcci6n de caminos,
como porcentaje del total de carreteras.
-
""'l>
0 Less than 10.0%
0 10.0-19.9%
:.'":: 0 20.0-49.9%
·- 0 50.0-79.9% ... _,_ • 80.0% or more ...
~~ 1 0 No data
Paved roads as a percentage of total roads, 1998
Economies GNP $
millions 1998
Population millions
1998
GNP per capita
$ 1998
Less than 10 .0% 23 ........... ~~!.9..?!.... 454 ......... ~,9.~~ 10.0-19.9% 27 ............. 5.~~!.5.?!. 486 1,140
20.0-49.9% 4~ .. . ~,~~!~!.~ :.:.:::~:~!~ 1,540 50.0-79.9% 33 ..... ~~!~.?!.,.~~~... 900 15,170 80.0%or more 47 9,134,053 683 13,380 ......................................................................... Nodata 33 1,717,344 1,499 1,150
Part des routes revetues dans le reseau routler total , 1998 Routes revetues d'asphalte ou de materiaux analogues,
en pourcentage du reseau routier total.
Paved roads as a percentage of total roads, 1998
World 1----43 Low-income economies
Low- & middle-income economies
High-income economies ~---------94 0 25 50 75 100
Paved roads
Paved roads as a percentage of total roads, 1998 Roads that have been sealed with asphalt or similar road
building materials, as a percentage of total roads.
..
Distribution of world population among economies grouped by paved roads as a percentage of total roads
Less than 10.0% • 10.0-19.9% 0 20.0-49.9% 0 50.0-79.9% 0
80.0%ormore • No data 0
STATES Be M
b '
20 00 World Bank Atlas I

S & MARKETS
-
"' ""l>
0 5 or less
0 6-25
~ .~ 0 26-100
.. 0 101-500 . -.... More than 500
\ > ; 1 0 No data
8 20 00 World Bank Atlas
Telephone lines
Telephone mainlines per 1 ,000 people, 1998 Telephone lines connecting a customer's equipment to the
public switched telephone network, per 1,000 people.
Distribution of world population among economies grouped by telephone mainlines per 1 ,000 people
e 5orless
0 6-25 ....................................................... 0 26-100
0 101-500 .•.. More than 500
0 Nodata
.. ,
Llgnes telephoniques principales pour 1 000 habitants, 1998 Lignes telephoniques raccordant le materiel d'un abonne
au reseau telephonique public commute, pour 1 000
habitants.
Telephone mainlines per 1,000 people, 1998
East Asia & Pacific
Europe & Central Asia
Latin America & Caribbean
Middle East & North Africa
South Asia 19
Sub-Saharan Africa 14
200
High income 1--------567 0 150 300 450 600
Lineas teleffinlcas prlncipales por cada 1.000 personas, 1998 Lineas telef6nicas que conectan el equipo del clientE
Ia red telef6nica publica conmutada, por cada 1.0•
personas.
·-: .... ..... -, .. ~ ...... ·- .... ... t ""
~
Telephone mainlines per 1.000 people, 1998
Economies GNP $
millions 1998
Population millions
1998
GNP per capita
$ 1998
5 or less 2~ ............... ~~~,-~:5. ...... . 627 1,328 2,038
260 430
900 6-25 29 573,875 26-100 48 1,837,693
101-500 75 ......... ~ !.3.?.~,-~!:)l More than 500 25 ...... ~~ '~?.?.,.~~ .. . No data 5 10,256
-~-'~~3. . .. !:) ,~~ 738 p:,20.>
3 3,200

omputadoras personales por cada 1.000 ersonas, 1998 umero estimado de computadoras aut6nomas destinadas
uso individual, por cada 1.000 personas.
""'
.......
0 Less than 5.0
0 5.0-19.9
• .. ':'1 0 20.0-49.9
.. 0 50.0-199.9 . .. ......... • 200.0 or more ·~ >
1 0 No data
Personal computers per l.,OOO people, l.998
Economies GNP Population
Less than 5.0 5.0-19.9
$ millions millions 1998
1998
28 . ..~!,~!ll 1,474
28 },5.~~,~~ ~:~~~
GNP per capita
$ 1998
470 780
2~,.~~.:~ .............. 22 ...... ?.,~~?.,.5..~ .. . 832 ...... ~!.5.~~ 50.0-199.9 24 ....... ?. ,.9.??,.~~··· 253 11.760
200.0 or more 24 ..... ?.~,?~~!.9.6..~ ... 739 ... ?!,3.llo. No data 80 461,142 617 750
Ordlnateurs lndivlduels pour 1 000 habitants, 1998 Nombre estimatif d'ordinateurs destines a l'usage individuel ,
pour 1 000 habitants.
· ~
'
~J
Personal computers per 1,000 people, 1998
East Asia & Pacific
Europe & Central Asia
14.1
34.6
Latin America & Caribbean 34.0
Middle East & North Africa 9.9
South Asia 2.9
Sub-Saharan Africa 7.5
High income 1-------311.2
0 125 250 375
Personal computers
Personal computers per 1,000 people, 1998 The estimated number of self-<:ontained computers designed
to be used by a single individual , per 1,000 people.
Distribution of world population among economies grouped by personal computers per 1,000 people
Less than 5.0 • 5.0-19.9 0
20.0-49.9 0 50.0-199.9 0
200.0 or more
No data
STATES & MA
--~ 0 ....
~}~ . \,-
~ ,.
2000 World Bank Atl as

ES & MARKETS
Private Investment
Stock market capitalIzation
Central Military Electricity Telephone Personal e:ovemment expendl- consum~ mainlines computers
Economy
:1\.t.e.~.a.~i.~.ta.~ ... Albania
:1\. I SO.'.i~ ....
%of GOAb 1997
~~-~~!~~-~---§~-~~-~- --·-- ---------------------···-Andorra
:1\_ns~~"- --·········-····
millions 1999
overall tures tlon per deficit'
% of GOP 1997
-12.0 ································-2.9 ....... ..... - ...
% of GNP 1997
capita
kwh
1997
1.4 B51 .................................... 3 .9 .......... 5!36 ..
20.5 64 ................. ,,,_,,, ........................ ,,,,_, ...
per 1 ,000 people 1998
31
per 1 ,000 people 1998
53 4 .2 ... ................... .
6 O.B 46B A.~!i!IU..a. ... a.~~ .!l.".'.b.~d..a ....
:1\!J!<:~!i.~"-. ................................................. .
Armenia Aruba
92.6 ......... ?.~.,~1.. 18
-1.5 1.2 ................... :1:!.6..?.~ ... . 3.5 _ _1,.1~.1
............................................................................................. Australia .................................. J!O.·f ..... ...£1.!1_.2_83 ... . 0.4 2.2 ....... ....... ?.,}.9!. Austria ........................................... ..'3.1:,.1.:Q?.. -2.7 0.9 ............. §,_0_5!. :1\Z~rbaii_a. n. .............................. .. : · ...................... . :~. -2.2 ................ -~ ·.!3 ........... ..l,.E'i.~~ .. ..
203 44.3 157 4.2 .......................... 367 512 411.6 ........................... 491 233.4
B9 352
Paved roads
% of total 1998
13.3 30.0 68.9
25.0
29.5 100.0
38.7 100.0
92.3 57.4 ~"--~a'.".".~, T-~e .. .. ........... -....... - 3.4 ............................ . ............................. ··········································
Bahrain
f!"_ngl~~-~~~ Barbados
...... ?,:1:55 ___ . -6.0 67.3 B65 ............. .................. .
.... ?,,1_12 ....
10.3 ........... _..7 ,_1.?,!.. 245 93.4 76.9 1.4 76 3 9.5 ................................... 0 .8 424 74.6 95.9 ---------------------------·-·--------·-····· .......................... .
Belarus
f!~lgl~'." . Belize Benin Bermuda Bhutan Bolivia
- 1.6 ................ E .. . 2.,69!.. 241 ............. !3~ .. 6 .. . ........ ?.1.~,£!!5_7 ........... ~:;!.:9 ..................... :l::.!'i..... ..... .... ! ,Q!'i!'i. 500 2B6.0 B0.7 . ........................................................ .
54.9 .............................................. . .......... ........ 1.::.13 ................................................ ~.~ ............. ..1 .:3C>.:~ . 17.0 20.0 59.5 ........................... :1·.::3 ........ ......... 43 7 ....................... .9:.9
................... .... 1.,_!5_99. . .............. ... - 2.1
B40 16 ----------------------------------------------·· ................................. ........................ .
.... ?!:JJ .. :~9.~-~-!~.:~:~:~_:8:~:~~~s~~i~-~::::
~,222.. - 2.3 ..... t9 .. 5.9
391 476
Botswana
Brazil Brunei
f!~l!:~~ia ... Burkina Faso
Burundi ........................ -. Cambodia Cameroon
·····························----
........ :t:.,.9!>.=2. .... 8.4 5.1
B0.6 .... :;!2?. ,!)62 ····· .... 1.:B ............ :t..?.'!~ .. .. .............. ....... .... 4.6 . ..?,534 .. .
42.2 .................. ..!0..6 ..... :;!:1 ··· ··· ··· io . 3,?9~
-5.5 ············································----------------
73.9
2.B 6.1 4.1
0.2 3.0 ..................... 1B1
6~. 91 65
121
2 5
3.9 60. 7
25.5 30.1 9.3 ······························-
0.9 7.5
Canada
ca~ .. .'!~E~_e 88.5 . .. 54~ •. 3.94 - 3.5 1.3 1.~·82.~ 634 330.0
12.5 35.3
51.B 0.9 ............................................................ ~a)'llla.ry _lsl~nd~ .. 160
~~-~!'."..l .. ~fr~~~nJl~P.U.IJ.II£ .... •m• ... ... m ... ... ............ ... .... ••• •• .. .. m• ... 3.9 Chad 54 .1 2. 7 ....................................................... Channel Islands ··········-···························································································-····· ················-···-···················---·················-····
9B 654
3 1
Chile BO.B ......... 61:J ,?.2_B.... 1.9 .................. ?.:~ . ............ ?,.9.1.1 .. 205 China --------------------------------------... H~ng 15o~g_, .C_hina. .
·---~-~~~?..! .. ~-~~-~-~--Colombia
,}?.9.,?9?. .. -1.5 mo ,, • ., , ..... ?.:.?. ..... ,, .. ,, .. ,,., . .,.,,!..:1:~ .... ,, .. ... . . . . ·: 31_,'!,394; . 4:,9!)9.
70
558 409
3.7 BB5 173
.......................................... ----78.0
2.7 ....... -----------------------0.8
4B.2 13.8 8 .9
254.2 100.0 100.0 .....................
27.9 12.0 ....... :1:1)~90 - 3.6 ...................................................... Comoros .............................. c~~go,_D~fT1 · ~eP : ... <::~n~~o , ... R.~e.: . . C,:~sta. .. ~~~.a .. 73.2 f..,.:J..08_
Cote d'lvoire .......................... ...?C>.:2 .............. 1., ~~4: Croatia 2,5B4 Cuba
<::~~r~~ ..... ..... .... ... .... ....... . ?:.f!f..l3 ~z~<'~ - ~ep~IJ.Iic . __ 11,7§!6. Denmark
l:)ji~OU!i . Dominica
.......................... ~1:1, 8§.~
10 20 00 World Bank Atlas
-O.B
-8.6 - 3.8 0.4
- 1.3
-5.3 - 1.1 -1.9
9 5.0 120 0 ·····························································-··· 4 .1 197 B 9.7
0.6 ............ .. ~:.~?.3 .. 172 39.1 21.0 1.1 1B1
6.3 ............... ?.:.4:.~9. 2.3 6.1 1.9 1.7
.... 1.-:.94:~ ?.:.!9.()
... iJ: .B1!. 6,()2!.
12 34B
35 5B5 364 660
.............................. ·························----
.. ~1 .. G 12.6 50.4
. ..... ... ... .. ...... .. .................................. . 252
Prtvate Investment
Stock
""'"' .. capital-
Central Mllftary Electricity Tehlphone Personal c:ovemment expendf. conaump- mainlines computers
Economy
% of GDRb 1997
Ization
millions 1999
overall tures deficit'
% of GOP 1997
% of GNP 1997
tlon per capita
kwh
1997
D.orl1.i~i-~a~ ~e_publi' ............ ~2.:9.. .. 140 0.4 1.1 ................... ~.?.9. ... .. Ecuador B2.9 415 4.0 611 ---------------·---------------- ................ ·····················-······································· _EgyP!.! .. ~r~.b .. R~P.:. .. ........... ~B.:? ....... ..... :J.?..!~:J..l3 .... . -2.0 2.B B03
per 1 ,000 people 1998
93
per 1,000 people 1998
. ............... ·········-···· 7B 1B.5 60 9.1 . ........................ .
Pa
% to 19
4S
1€ 7t
El Salvador 77.3 .............. 1.,_4~!5_ .................. . 0.9 537 BO .. 1S .................................................. -~q~~!'?Ei~!. ~-~-!0~-~ ... 1 .5 13 2.3 ............................................................................. Eritrea 7.B 7 ·································································-···· Estonia
.~.!~.'~P.i~ ... Faeroe Islands
.,,,,.,,.,,,, •m•• m••• •m• •••••••• 1,_7!39 2.5 .................. ..1:?..... 3.466 .................... ?..4:?. .......... 34.4
. ............................. . fiji Finland France
F.r~.n-~~ ... P.~ I_xn~s'a .... Gabon
~~.trl.~.i~ .}~~ G~orgi_a ..
~~E~.~~Y ... Ghana
51.1
.,,.,,, ,.,,,,.,,.,:1•~ •••• ••• •••••••••••••.2! •• 3 ••• omoom om•
544 88 --4.9 2.4 97
554 570 230
......................................... ........ f.?.::t.,?.f.l:l . ....... !19.1.,_4:1l4
.. J .CJ_9.,'!,9?.? .. 916 .......................
-2.5 1.? ........... g§_?.S. ......... _ - 3.5 .... .... ... }·9 . ..... 6,()f3.0
2.0 752 .............................. 33
349.2 207.B
3.7 21 B.6 2 .6 ........................................................
-2.7 .............. ~ -~ .......... :1:·~4:? 115
-1.4 1.6 ....... ?.626 567 304.7 ................................ 0 .7 276 B 1.6 . .......................... .
Greece ................ ?,.~_9.:3........ 522 51.9 Greenland 444
Grenada ................................................................. :: .................................. :.: ...................... ~.: ."-............................... :.: .................................. :.: ................ ?E'i~ .. 95.6 Guam 453
79.B 41 B.3 1.5 5 ........... ..... 2.6 . ···················································································-···
21 22 15
49 64
100
8 35 93 99 24. 91.
61.
27. 16.
Guatemala
Q~.~r'~.~---~u!n~-~~is~-~-~G~y~na ..
......... 2.B,o 3.2 7 .. 10 .
......... ........ 1.:1..... . ......... ... 7.9 Haiti 42 8 Honduras 458 1.3 411 38 ............................... _
..................................................... 23.5
7.6
7.
... 24:-20.
. f!~_nga.r.x .......................... . . l.-!3 ... :3.~.! .... - 2.6 0.4
- 5.6
1. 9 ................ :;!,_!!.4:0.... 336 ................ ?.!!..:§! . 43. 27 . 45. 46 .. 50.1 86.1 94 ..
Iceland India 70.1 ........... 6.4: .• 0.?..! ... Indonesia 77.2 ....... Il34:, .~o?. ... _l_ra.~ , .. ~ .~.la..'."ig...Jle.e.: .. . 55.5 ..... ..1::1.-13..!1. .. Iraq ...................... ·-·· Ireland .......... 2!J.,!J.?.I! ... Isle of Man ·---···-
........... !3~ ,[32() Israel
l_t~lr ... Jamaica
J"_p~n ... Jordan
....... .......................... :.: ............ 5.£!!!.,.!.:'!~ .... ..
... . ........ .......... . Kazakhstan · . .......................... . ~~nxa. .. Kiribati
Liberia
. .. . ........ ?.?3() .. 70.9 .. ?,4§J..S..,.!.!5.!..
...... ........ . . 5..,.?.2! .. . 37
56.0
. .......... ..!~::" .......... 3.()§,5_34:
391
,!, ,_9?.1. ..
0 .0 ........... !.?.,.:'!?.~... 646 ........ }?El.:.:l: 2.B 363 22 2.7 ...........................
-0.7 2.3 329 27 B.2 ···············································-···
3.0 .... :1:·1..6~. . 112 .................. ..:3.f..:.9 4.9 .................. :1::.?..5~..... 31 ........................ . 1.2 ..... 4: · ~.?.~ 435 p~. 1 .
·····························-·····································-·················· .................................... ······-0.4 9.7 ............... ?.·9..~~. 471 217.2 100.(
-3.:.!: ......................... ?.:.9. .................. 4!.~.:1:5. .. 451 166
173.4 39.4
100.! 70. 0.9 2..1?<>. .
.............................. .!:.<:>.... ..?.:.?..'!! 503 237.2 ············-··················· 74.! 100.< -3.3 9.0 ............. 1:.~9.!3 B6 8.7 ..............................
-0.9
- 1.3
O.B - 25.6
1.9
1.3 ............... :;!.?.9.!'i 2.1 127
104 9
35 47
................. ?..S. .. E 2.5 13.( 7.4
6.4
3.4 ...... ~·?..4:?.. .. 433 ................ :I:.S.E'i.:l3 74.~
80.t 91.1 13.t
7.5 .............. :t:.:;!,.!!.!l.E'i..... 236 ............. :1:0.4::!3 .. .. 1.6 ••••••••• , , :1:,3?:;! ••• •••• •••• , ?15m 3.4 6 1.1 ····················-········ 0 .9 .......... _ _1,_7_5_?.. 302 ............................ :.: .................. 3!!.:E 3.0 ............... :1:.§!.3.1:) 194 39.2 95.C 2.5 10
2
6.1 ......... 3 .. ~()5.. B4 630
17.S 6.~
57.1
········································- ----------------- ................................................. . L.i~ya .. Liechtenstein Lithuania •• ~ . 1}[3 -1.9 ••••••• •••••••• ().!J ... moom :1:,.!3:1:!3 .. '" • ~.99. 54.0 91.0
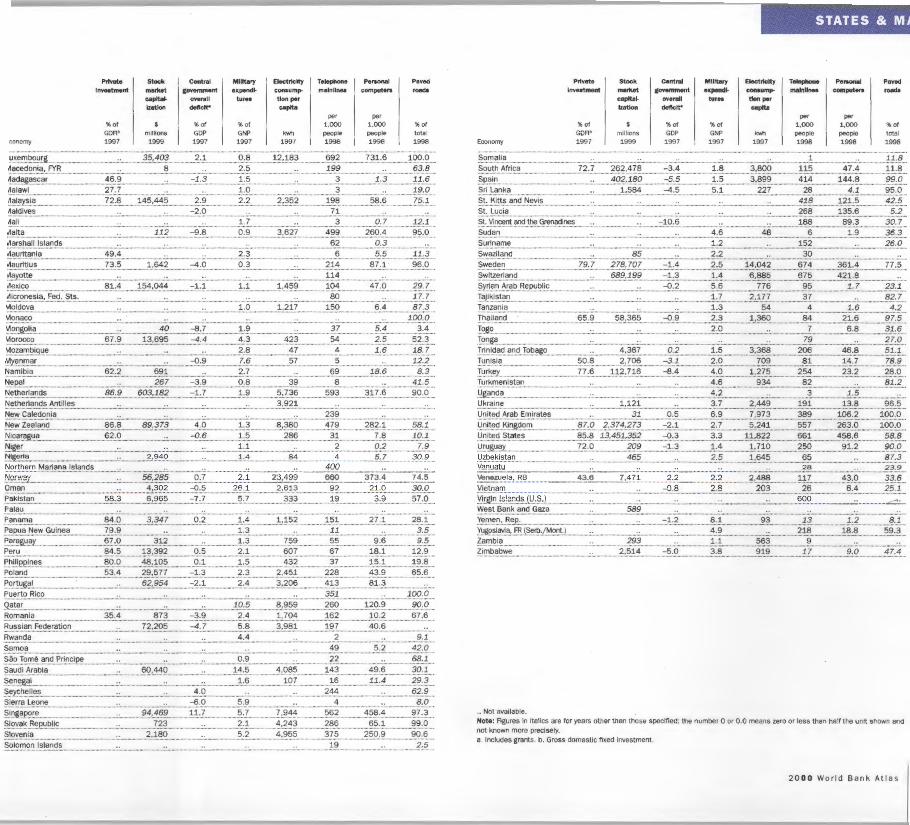
conomy
Prtvato Investment
'I! of GDflb 1997
Stock market capitalIzation
m1111ons 1999
. U..X.~.".:'b.E.~'.!L .................................. . ............ ?.?..:1.9..?. .... 8 ~a~e.d~~i-~: .. FYR. .... .
~.a..d..~ll~.S.~!'.' 46.9 ................................................................................... Aalawi 27 .7
A. .a.I~XS..i". ......................................... .!?:~ ......... !~?..:~:".~ 11aldives ............................................ ........................... .
Central Military a:ovemment expendl-
overall tures deficit'
"' of GOP
1997
'I! of GNP 1997
E*'rlclty Telephone Personal consump- mainlines computers tlon per capita
kwh
1997
per 1 ,000 people 1998
per 1 ,000 people 1998
Paved roado
'I! of total 1998
···--------·----------------2.1 ...................... <:>:.'3. ......... g~.!l.~ .. 692 731.6 100.0
2.5 199 63.8 ........ ····································································-·----- ·························-···-······ - 1 .3 1.5 3 1.3 11 .6 ............................. .. ........................ .
1.0 .......................... ························- 3 .............................. 1.!ii.:P ... . 2.9 ................... ~.·.? ......... ~ :??~ 198 ................... 5.8.:§ ... . 75.1
-2.0 71 .............................................................................................................. 1~ 3 0.7 12.1 A ali
A alta ............................................................................................................................. ......................... ................................ .... .
112 -9.8 0.9 Y1arshall Islands
·············-····-···-···-Y1auritania 49.4 2.3 .................................................. . .......................... .. v1auritius 73.5 .. ! .. 642 -4.0 0.3
........... ?:.?.~? .... 499 260.4 95.0 ·······················-········ 62 0.3 ........................................................
6 5.5 ............................. 11.3 96.0 214 87 .1
.,ayotte ............................................................................................................................................................................................................. !.~:" ................................................................ . v1exico ...... ~~~~L. ...... l..?.:".:Q:"~---·-···-··::-_1.1 1.1 1.:"§9 104 47 .0 .............. ?.9..:!. .. . \'lis.r~n~s..ia , __ ~e.~, .?t~· ... 'Aoldova Vlonaco
1.0 80
150 17.7
6.4 87.3 ··············-··-······---·· ........................................................................................................................................................................................... 100.0
3.4 52.3
~9..n..!l.~li.~ ......................................................................................... ~9. ....... _ 37 5.4 ............................... -8.7 1.9 .................................... 'Aorocco ........................................ ?.?.:9. .............. ~~.:?.9..? ... . ":1oz.~~~igu~ ............ ·········-···· . ~~~~'.':'~.' ......... -· . . . -· ... ...... .... . - .... . Namibia 62.2 691 ·······································································································-!'!~P~ I_ 267 Nethe~ands .................................... !3?.:.9..... 6._03,182 Netherlands Antilles ·········-·····················-··-······ New Caledonia New Zealand 86.8 89,373
.i'l i.~.~~~ll~!' .... ·-·- .•.. .. . §2:() ................ ·- ...... .
-4.4 4.3 423 54 2.5 ............................................................................................................. 2.8 47 4 1.6 18.7 .............................
-0.9 7.6 57 5 12.2 ............................. 2.7 69 18.6 ················- ··············-····-·······················-····································· .. ··
-3.9 .......... (),!! ..... :39. . ...... !! . . .. . 8.3
41.5 90.0 -1.7
4 .0 -0.6
1.9
1.3 ........... 13.·.~.1!.9 .. . 1.5 286 ...................................
239 479
.................................................... 282.1
7.8 58.1 10.1
!'!i_g~~ ------ ------ ----- --- 1.1 2 0.2 7.9
~!.8:!:'_ ~1~ ........................................................................ -~ .. ~~-Q .................. __ ; ._4 ........................ ~~ ................. --~ .. . 5.7 ............ :J0.9 .f-!.o.r_t~e.r.~ ... "''.a_!i~-~-"-..I~I.".~~S.-··-··-····'. ·······-·-··-··-··--···-··-·- 400 ................................................................... . Norway ............. ?15.:.?.f!.?... 0. 7 2.1 23,499. .................... 6.(;;() ................ ~?.~.:~ ..................... !.~:.?. ... . oril!lii . ··· ..... ······················- ·······-····- ..... ~,302 -::?..:?. ..................... ~.l'i:.1.:.......... 2,613 92 21.0 _3g.9 Pakistan ...................................... 51'!::3 ............... 6.,_9_1:)_5 -7.7 ...................... !:;.! ....................... ~.~:! .................... :1.9. .................. 3.:9... ... ?7,() Palau ···················································-··· Panama ................................. !!~: <:> .............. .:3.:.3'!.? ............... 0.:~ ...... . 1.4 ............ ~-·~52 __ 151 27.1
!'.~P.~!' ... !'!.<:"'..§_u_i".~".. 79.9 ··-····-···-····-·····-··- ········-···- ...................... ! :} ................................. 11 .......................... .
28.1 3.5 9.5 !'.~'.~ll~.a.r. ....•.••.•.......... ??.:() .•........... ~:L.~ .............................. .. 1.-} ............... .J.?!l. 55 ........... !l.:El .
Peru. ........................................... ·- 84.5 1~_.392 0.?. ......................... ~:.~- 607 ................. ..... l'i!. .. 18.:1. .................. !.~.:9. .... . !'h.i.l.iepi~~-~- _ .. . . . . ... !!9:9 ....... ~11.1o_;; __ o.1 1.5 432 37 15.1 19.8
65.6 Poland 53.4 ....... ~!l..:.?.?..? ............. -1.3 2.3 2,451 228 .................. ~~.:§! .. !'C>'.!~g_a.l .... ... 62,!i)5._4 -2.1 2.4 . . ~: ?..<:>§ Puerto Rico ·····-········ ····-···· ..................................................................................... ___ _
Q.~!.a..r. . ........ ···- .... .... . •.. .. . .•.. ... - .. ~9.: ?.. ... !!:9.?9_ Romania 35.4 ............................................. _______ _ 873 -3.9 2.4 ········-~ ... ?.<:>.'! Russian Federation -···················································- ..................... !.~.:.~<:>.~ ... 5.8 ......... ~ .. !J..8l, -4.7 Rwanda 4.4 Samoa ..........................................
0.9
413 81.3 . ................................................................ . 351 100.0 ·······························-········································ 260 120.9 90.0 162 10.2 67 .6 197 40.6 .......................................................
2 9.1 ................................ 49 5.2 ................................... 42.0
68.1 22 .s~9...!~m.~ .~n..d. ... ~r.i~_ciJ!" .... ......................................................................................... ········- ····························-Saudi Arabia ........... 13.9..: ~:".9.. ...................................... 14.5 ................... ~:9.13.?...... 143 49 :§ .................. ~9..:.1. .... . _;;e.n.e..!l.~l.... 1 .6 107 16 ................ 1..1.:.4.... 29.3
~~X".~~-~~~--····- ············-···- 4.0 .......................................................... ?..4.:" ................................... ·- 62.9 ~ie_r.r.~ ~eo.n.e.. .. .... ... ..... .......... ... ...... -6.0 5.9 ...................... 4.... . ................... ...'#..:9 ... . ~i."..ll~~.r.e..... ·······-···- 94,_1_69 ......... !!.:.? ...................... 5. 7 ............ ...?. ... ~.~~---· 562 458.4 97.3 §19.Y".~ --~~PU..~II~ .................................................... ..!?..~.................. . _ . _ .. ~.-.! .................... ~:.?..:4.~ .................... ?..1!.§ ....................... §.?..:.1.: .................. !J..~.:Cl .... . Slovenia ........................... ·········- ........................ ··-···- 2,180 ......... ·······- 5 .2 ............... ~ ... 9..?.?....... 375 250.9 90.6 Solomon lslan.c:J.~ ..... .. ................ ........................................................ ... ... .. . .................. ~9.. . 2.5
Economy ··························-
Prtvate Investment
!! of GDAb 1997
Stock market captta._ lzatlon
mill ions 1999
Central Military covemment expend._
overall tures deficit'
'I! of GOP 1997
'I! of GNP 1997
STATES & MA
E~rtctty Telephone Personal conaump- mainlines computers tlon per capita
kwh 1997
per 1,000 people 1998
per 1 ,000 people 1998
P""ed roado
'I! of total 1998
Somalia .... .... .... ... .... ..... .. . .... ... .. .. ...... ..... - ·- .... ! ................................................. ! .!./#. .. . South Africa 72 .7 262,478 -3.4 1.8 ... ~:.13.99. . .................. ! .!?.... 47.4 11.8 .~P..a.in. ......... - ..... -·- -· - -· . . ........ :4c:J?.:.J,f!.c:J .. . -5.5 1.5 ......... ~,.8!)9 ........... :".1.:4 ................... ~:4_4-8 99.0
Sri Lanka ····································- ........ ~.,?13..~·-·· -4.5 5.1 227 28 4.1 95.0
418 ........... _121_.5 .............. '!?.:5.. St. Kitts and Nevis ................................... St. Lucia 268 135.6 5.2 . .................................................................................. . ··--···- ··-····-··--········-·· St. Vincent and the Grenadines -10.6 188 89.3 30.7 ..................................................... .. ............................ .. Sudan
·····························-····-····- 6 1.9 ············-~-6..:.~--4.6 ............................... 48 Suriname 1.2 152 26.0 ..................................................................................... .. . ..... .....................................................................................................................
··-··-···- .... }0 Swaziland 85 . ....................................................................... _ .. 2.2 ···-···-···-···-···-·····-----Sweden ...................... 79J ... ...... ?:.?.f!. •. !.Q!.. -1 .4 ............... ..... 2:.?.... 14,042 .................. §.?.:4 .................. }§.!.:~ .................. .!.!..:?. ... . Switzerland .................................. 689,~99 .... ........... ::~.::! ..................... ! .::" .. _......... 6,_1;!85 675 421.8 sxr.i~~--~_r.a~--~e_p~I:J I_i~ ......................... :.: .............. :::<:'.:~ .................... ?:.El ................. ..... !..!.§. 95 ..................... .1.-.:! 23.1 :raJ.ik.is!an..... ... .......... ........................... ............ . ................................................ ~.:?...... ~, 177 37 ··-···-···-···-···- 82.7 Tanzania ................................................. ····- 1.3 54 4 1.6 4.2 I.h..~_ il.~~~---························- .............. _65.: !J.. . .. ?.13. ,:3§? .............. ::9.:9. 2.3 .. !}.!'.() _ 84 -~-~.:§. ................... 9...!.:.5.. .. . !.~S9. .......................................................................... ................. .......... . ........ 2.:.9. ...................................................................................... 6.8 31.6 T.o~s.a. ............................................................................................................... ·····································- ···-···-· 79 ··-···-····- 27.0 !.'.i.n.i~a.d. .~~~ -T.~~?S9..... . ..... :" : ~§7 0.2 ............. ~:.?. ................. ~:.~.13.13.. 206 .................. :4.?.:!! 51.1 Tunisia ........................................... ?.0.:!! ................. ?..:.?.1?.6 -3.1 .................... ~:.9.. ......................... !..9.9. ........................ 1!.~ ................ 14.7 78.9 Turkey ..?.Z.:§ ......... ! .l.:?..:.!.!.ll. ............. ::1:!.::4 4.0 .................. ! :?..~?. 254 .................. ?~:?. 28.0 Turkmenistan 4.6 934 82 81.2 .. ... . .. ... .. ... ............................. . ..................................................................................... -......•
!:JS.a..n..c!"...... . ........................... ··························- ....................... :".:?.... 3 1.5 Ukraine . ... .... .. .... .. . . .. 1.:1.?.1.. . . . ................. .. ~.-. !. ................... ~:.:4.4.!l .................. ~.!l.:t.... 1~ : '3. ......... 9.?.: ?. .. United Arab Emirates ........................ ············- .................. ~!.··-··-- 0.5 6.9 .......... !.:.9..!_3 389 106.2 100.0 U~it~dKingd_~fl1 ..................... ll!.:.O.. .... .?.:.:3.!.~:.?.??.. -2.1 .............. m •• ~J .. 5,241 ............ ?..?..! .................... ~§}.:Cl ........... 100.0 .IJ.~.i!~~. §.t~!~~ .................................. ~?. :~ .. 13,45~,352 -0.3 3.3 ... 1..! :.'3..22 661 458.6 58.8 ljr_Ufl~~x . .... .... ... ••m••• •••••••• J .?.:O. ••••••• ............... ?.IJ..!il. -1.3 •••m•• • m •••• ! :.:". ... m •• l.:.?~Cl. •••••••••••••• .. ?.?<>..... 91.? ................ !ii9..:.C! .. . Uz.b_e~J~t".~ 465 ......... 2.5 1 , 6~?.. . .. ~? ..................... m •••••••••••••••••••••••••• J!.!-3 Vanuatu ....................................................................................... ?.~..... 23.9
"'.~D.~~-~-~~~.: ... ~13.. 43.6 ? .. ~_?_1_ 2 .2 ....... :;!:.~·-·-···-····- 2.488 11! ...................... ~~.:.9. 33.6 l(ie!na".:' ........ ............ .... ... ... ... ... .... .. . ................................... -!J..·!! ... .... .... 2,? ... j§f 26 .................... 6.:~... . ·25:1 ·· Y.irgi.~ .. l.s..I~~~~-JIJ., §J.. . ..... ····-····- ---·-·- ········- 600 ·····-············· ....•...•... ~.: .... West Bank and Gaza 589 ............................................................................................................................................................................................................................................................................................ :Y.e..".:'~.n..: ... ~~"'···-·········-···············- ::1..:;1 8 .1 93 13 1.2 8.1 YIJ.!l.O.sl..vj~ •. I'J!(~r1J-!.¥gn!:) ................ m •••••••••••••••••••• :'1.-.!l... . .............. ?.!~ ..................... ~.!l..: !! ................... ?..!l..::l. ... . ?.~".:'.~i.". .................................... ·········- 293 ............................................ !.:~.......... 563 9 Zimbabwe ................................................................... ?.:5.!'! ............. ::::?.:9 .... . 3.8 919 17 9.0 47.4
.. Not available. Note: Rgures m italics are for years other than those specified; the number 0 or 0 .0 means zero or less than half the unit shown and not known more precisely. a. Includes grants. b. Gross domestic fixed investment.
20 00 World Bank Atlas
2 200 0 World Bank Atlas
Global Links
Low- and middle-income economies increased their trade faster than hig
income economies did in the last decade. Manufactured goods are now tl
largest part of their exports, displacing food and fuels. And their share
foreign direct investment more than doubled between 1990 and 1998. P
this is evidence of the expanding role of developing countries in the glob
economy.
Globalization-broadly defined as the growing potential and ability of inc
viduals and firms to transact business across national boundaries-increas,
the Opportunities for people in poor countries to prosper. Driving th
process are falling national barriers and declining costs , notably for tran port and communications.
But some aspects of globalization also carry major risks, the more ~
where the domestic policies and institutions for handling such risks a1
weak. The challenge for developing countries is to strengthen their polici•
and institutions to make the most of globalization's opportunities whil
managing the risks and costs. The continuing debate over tariffs and fina1
cia! flows reflects deep suspicion that the benefits of globalization ha"
been oversold. And as globalization proceeds, concerns about envir01
mental and social protection will have to be taken seriously.
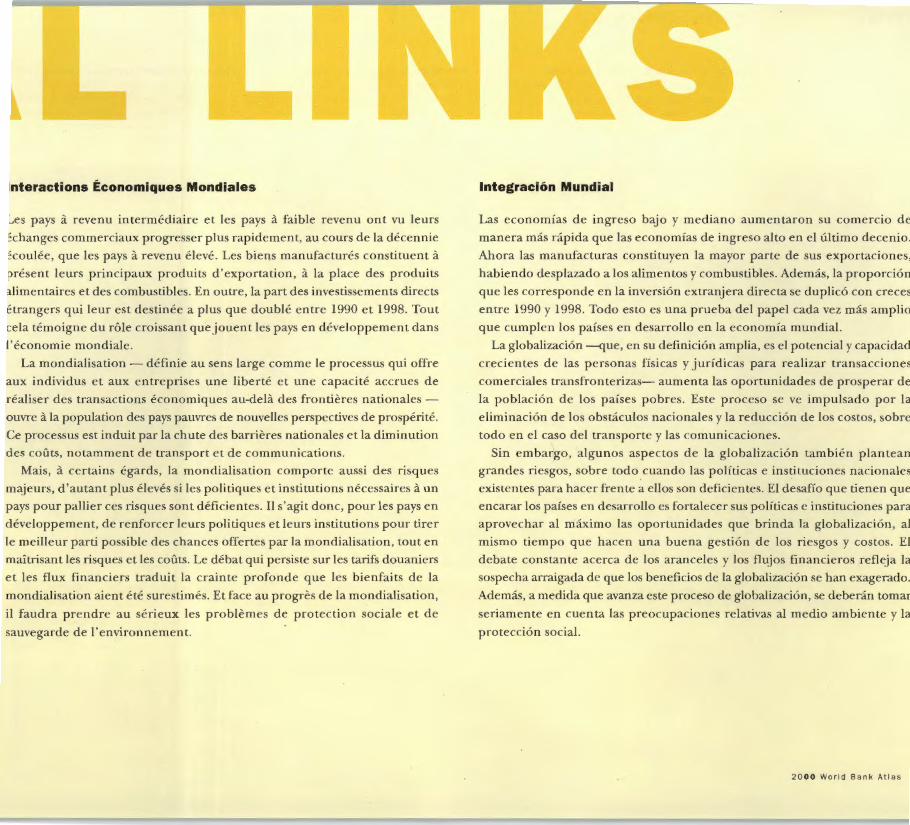
Interactions Economiques Mondiales
es pays a revenu intermediaire et les pays a faible revenu ont vu leurs
~changes commerciaux progresser plus rapidement, au cours de Ia decennie
~coulee, que les pays a revenu eleve. Les biens manufactures constituent a
present leurs principaux produits d'exportation, a Ia place des produits
<liimentaires et des combustibles. En outre, Ia part des investissements directs
etrangers qui leur est destinee a plus que double entre 1990 et 1998. Tout
cela temoigne du role croissant que jouent les pays en developpement dans
l'economie mondiale.
La mondialisation - definie au sens large comme le processus qui offre
aux individus et aux entreprises une liberte et une capacite accrues de
realiser des transactions economiques au-deJa des frontieres nationales -
ouvre a Ia population des pays pauvres de nouvelles perspectives de prosperite.
Ce processus est induit par Ia chute des barrieres nationales et Ia diminution
des couts, notamment de transport et de communications.
Mais, a certains egards, Ia mondialisation comporte aussi des risques
majeurs, d'autant plus eleves si les politiques et institutions necessaires a un
pays pour pallier ces risques sont deficientes . II s'agit done, pour les pays en
developpement, de renforcer leurs politiques et leurs institutions pour tirer
le meilleur parti possible des chances offertes par Ia mondialisation, tout en
maitrisant les risques et les couts. Le de bat qui persiste sur les tarifs douaniers
et les flux financiers traduit Ia crainte profonde que les bienfaits de Ia
mondialisation aient ete surestimes. Et face au progres de Ia mondialisation,
il faudra prendre au serieux les problemes de protection sociale et de
sauvegarde de l'environnement.
lntegracion Mundial
Las economias de ingreso bajo y mediano aumentaron su comercio de
manera mas rapida que las economias de ingreso alto en el ultimo decenio.
Ahora las manufacturas constituyen Ia mayor parte de sus exportaciones,
habiendo desplazado a los alimentos y combustibles. Ademas, la proporcion
que les corresponde en Ia inversion extranjera directa se duplico con creces
entre 1990 y 1998. Todo esto es una prueba del papel cada vez mas amplio
que cumplen los paises en desarrollo en la economia mundial.
La globalizacion -que, en su definicion amplia, es el potencial y capacidad
crecientes de las personas fisicas y juridicas para realizar transacciones
comerciales transfronterizas- aumenta las oportunidades de prosperar de
Ia poblacion de los paises pobres. Este proceso se ve impulsado por Ia
eliminacion de los obstaculos nacionales y Ia reduccion de los costos, sobre
todo en el caso del transporte y las comunicaciones.
Sin embargo, algunos aspectos de la globalizacion tambien plantean
grandes riesgos, sobre todo cuando las politicas e instituciones nacionales
existentes para hacer frente a ellos son deficientes. El desafio que tienen que
encarar los paises en desarrollo es fortalecer sus politicas e instituciones para
aprovechar al maximo las oportunidades que brinda la globalizacion, al
mismo tiempo que hacen una buena gestion de los riesgos y costos. El
debate constante acerca de los aranceles y los flujos financieros refleja Ia
sospecha arraigada de que los beneficios de Ia globalizacion se han exagerado.
Ademas, a medida que avanza este proceso de globalizacion, se deberan tomar
seriamente en cuenta las preocupaciones relativas al medio ambiente y la
proteccion social.
20 00 World Bank Atlas
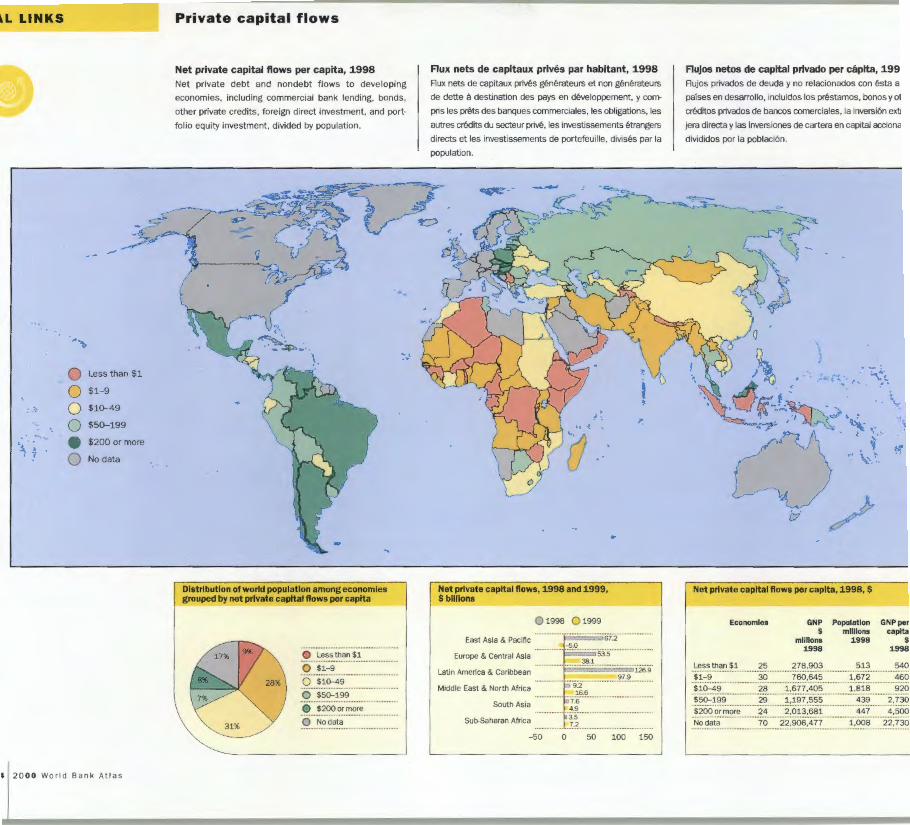
IAL LINKS
-
,.~
0 Less than $1
0 $1-9
: .~ 0 $10-49
.. 0 $50-199 .. -- ... $200 or more ·i.~ ~ .. 0 No data
4 2 0 0 0 Wor l d Ba n k At l as
Private capital flows
Net private capital flows per capita, 1998 Net private debt and nondebt f lows to developing
economies, including commercial bank lending, bonds,
other private credits, foreign direct investment, and port
fo lio equity investment, divided by popu lation.
Distribution of world population among economies grouped by net private capital flows per capita
Less than $1
0 $1- 9
0 $10--49 ............................. 0 $50-199
e $200or more
0 Nodata
•,
Flux nets de capitaux prives par habitant, 1998 Rux nets de capitaux prives generateurs et non generateurs
de dette a destination des pays en developpement, y com
pris les prets des banques commerciales, les obligations, les
autres credits du secteur prive, les investissements etrangers
directs et les investissements de portefeuille , divises par Ia
population.
Net private capital flows, 1998 and 1999, $billions
0 1998 0 1999
East Asia & Pacific ················· ·········· ············61:2··· .... :::5:9. ...... 5'3:5 ''
;Jil.-.lc
-
Europe & Central Asia
Latin America & Caribbean 1-------'126.9
Middle East & North Africa ................................... 9.I·9
9.2 16.6
South Asia ................. "'if .... . Sub-Saharan Africa ................. "3.'5 .. ..
......... !.:~ - 50 0 50 100 150
Flujos netos de capital privado per capita, 199 Rujos privados de deuda y no relacionados con esta a
paises en desarrollo, incluidos los prestamos, bonos y o1
creditos privados de bancos comerciales, Ia inversion ext
jera directa y las inversiones de cartera en capital acciona
divididos por Ia poblaci6n.
Net private capital flows per capita, 1998, $
Economies GNP Population $ millions
millions 1998 1998
GNP per capita
$ 1998
Le~~-~~.a.~.-~.1. ........... 2.?. ........... 2.?.~,.9.2~ ................. ~!.~ .... . 540 460 $1-9
$10--49 '$50:::199 i2iiii ~-, ;n~;~ No data
30
28
29 24
70
760,645 1,672 ....................................... .......................... 1,677,405 1,818 920 ................................................
..... 1.,.1.9.?. ,.5.~~--- 439 2,730
2,013,681 447 4,500 . .......................... 22 ,906,477 1,008 22 ,730
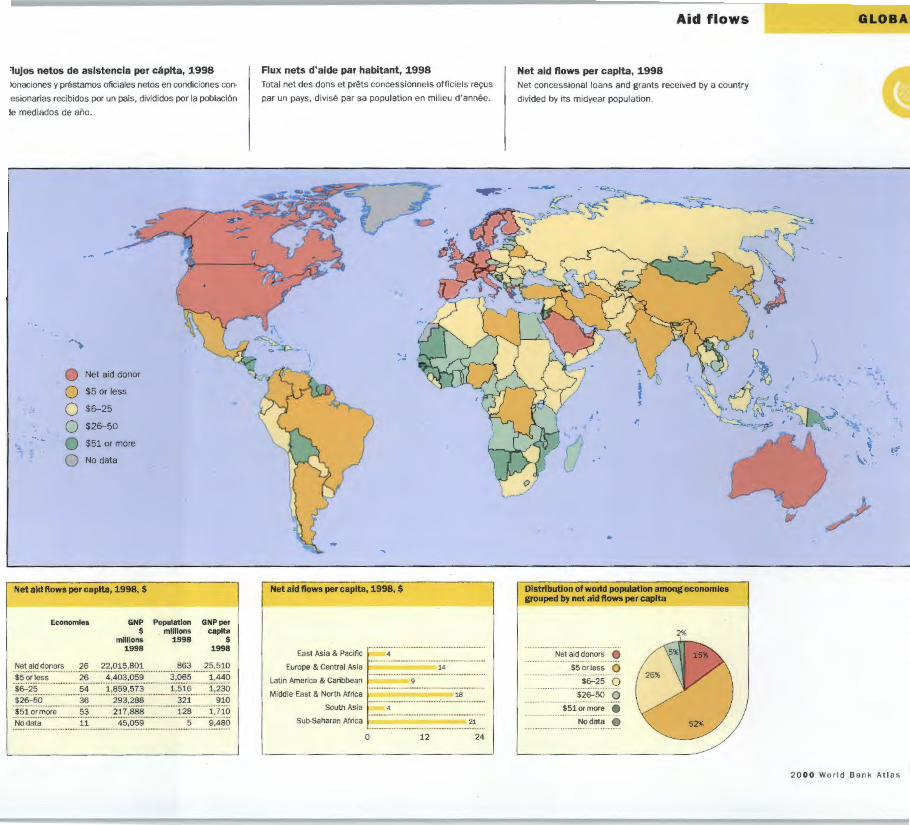
'lujos netos de asistencia per capita, 1998 Jonaciones y prestamos oficiales netos en condiciones con
:esionarias recibidos por un pais, divididos porIa poblaci6n
Je mediados de ano.
-
... ...
0 0 0 $6-25
0 . ~ ~ 0 '\ > i i 0 No data
Net aid flows per capita, 1998, $
Economies GNP $
millions 1998
Population millions
1998
GNP per capita
$ 1998
Net aid donors 26 22,015 ,~9.~ .................... ~63 .. 3.~~:5.~9. ··ii5·;;·ie55······· 26 4,403,059 3,065 1,440
''$&:'25"""''"''''"' 54 · · ·····1~8'59~'573''' 1,516 1,230 ............................ $26-50 36 ............. 2.!l.~~.2.~ 321 910
· $51;; ~;;:;;;: :: .......... :5.~ .......... 2,g~ .. ........ · 128 ······1:11o No data 11 45,059 5 9,480
Flux nets d'aide par habitant, 1998 Total net des dons et prets concessionnels officiels recus
par un pays, divise par sa population en milieu d'annee.
Net aid flows per capita, 1998, $
East Asia & Pacific
Europe & Central Asia 14
Latin America & Caribbean 9
Middle East & North Africa 18
South Asia
Sut>-Saharan Africa 21
0 12 24
Aid flows
Net aid flows per capita, 1998 Net concessional loans and grants received by a country
divided by its midyear population.
Distribution of world population among economies grouped by net aid flows per capita
Net aid donors
$5or less 0 $6-25 0
$26-50 0 $51 or more
No data
GLOBAL
.. • 7..t,. ~(~· .. .......
~ '
... ·.;, .. '-::
'-'.\" .. t .; .. . .,
~ , .. \-.~
2 0 00 World Bank Atl as

IAL LINKS
Trade In MMu- Net
goods factured private exports capnal
%of flows• %of total PPP merchandise
GDJlb exports millions Economy 1998 1998 1998
·······································-
Foreign direct
Investment
%of GOP 1998
Net aid nows
Per %of capita GNP $ 1998 1998
International tourtsm
Receipts
$ millions 1998
Arrivals thousands
1998
.. .. 6 1 ~f&h._~~.~.t.~~···-···- ................................. ,,,_,,, .......................................................................................... . 4 27
678 21
Albania 10.9 68 ..................................................... ................... <!.? ................... ~.:.? .................. ...?.:.l:l ......... -····- 73 54 20 ~~g~ri.". ...
American Samoa 16.4 :::~.:.~?.~- 0.0 13
Andorra ··············································-·······-·· A~g~l~... 33.0 40 4.8
f.<:rl!i!IU.a .~n.~ §a_riJU.d.~ 73.2 ··-··-··-···-···-···-···-
10 ...............................
8.2 28 8 .............................................................. 1.7 148 275
··-···-··--···-··-···-···-··-·--· ... -52
226
~~g~~!I~-~ ............................................. :1..?:.~ 35 ............... :l!l .. f:l\1.~ .... 2.1 0.0 ............ ~.. . .... !J..3§~.. 4,860 Armenia 13.2 54 232 12.2 7.3 36 10 32 ···················. .................. .... .... ... ..... .... .... ... ····-···--·-··-···-··-···- ·······-···-···-···-····-···-··----···-·-·-···-···-····-·····-···-···-····-···-···-· Aruba 76 120 715 64 7 Australia Austria
A.ze.rb.".1ia.n ....
27 .8 29 1. 7 ····-··-L --·- ··-···-··-L·--·-..?..:.~~.?_._ ··-·-·-~.,~§L 69.1 .~~·····························-·· 2.8 ....................... t. .......................... t ........... ..1:~!.~~ ... 17,352 14.0 1,08~ ............. ??.:.! .................... J3 11 125 170
!:l~~~'!'i'~: ... :I~~·-- 39.2 .............. ..1 ..................... ·-· ...... . _.2.3 ................ 1!.:.9.. ......................... ?.?.._ ... ~.:.'!c:J.I:l ........... ~,!'j~.c:J .. Bahrain ..................... .Jf3:.!. 12 0.9 64 366 1.,?50 ~~~~~~ .. ~ ... _ .. ~ Barbados ··············· ......... .
7.0
Belarus 24.1 -·-···-··-····-····-··-
91 57 76
288 -8 .............................
122
!J.~.I.S.iiJ..'!' . _ ............ ·- . ........ 1.?!'.:.1. .. ·-·· . Belize 43.8 13 26 ··-·--···--··-··--··-Benin 19.1 34 ............................................................... .......................................... Bermuda
··································-Bhutan 23.7 -2 ...................................................... ··-···· ................................... Bolivia 15.9 30 860
-~-C?..~D.!~.~-~--~~!"..~.~8~~~~-~---·- ··-···-··-·······--··· Botswana ...................................... ~~-~- . Brazil 9.9 -····-·· ·-····-··· -·· Brunei 68.7
.ll_U. Il!~'!!' _ ···········-···-~?~!J·-·-·-·-···£:!. __ 498
0.7 0.7
2.8 10 51 172 .............................................................. 59 703 512 . ............................................................. .
0.7 0.1 3 22 355 ·····-···---··-···-··--··-·-···-···-·-···-·-----···-···--·-···-. ...... t . . .... .... t ............ 5.:.<1~!. .......... !'.·1..?~.
2.9 2.3 63 99 157 1.5
0.0 10.2
3.3
9.2 35 33 ~.4 9 480 ··················-··-···-14.9 73 8 ........................................................
7.5 ....... 3..9. .. _ .... .1_7.4 ..
2.3 0.0
··-····-··-····-···-···-0 .0 ..................... 1.9
232 15 68 175
2 1
28
................................... . }.:!3!~
....... }! 437 ·············-···-····-···-···
152 369
6 434 100 740
.. ~.!.~~~·-964
. .... } ,Q<JQ . Burl<ina Faso 7. 7 0 0.0 15.5 37 39 140 ············ ............................................................ . . ............................ . Burundi Cambodia Cameroon Canada
4.9 12.5
............. 2···-···-··- o .. ~ __ . ___ f:l,f:l .___ _1.? ______ 1 ······-··-··--.:!.~ .. 118 ·······--------------------------- ---------------·········· ...
1 4.2 11.9 29 157 ........................ Q6 ~1 ~ ~
·······-···-···-···-···--·-···-···-
576 135
2.8 ... ·····-········· ! ......................... .:!: ............... ~ .•. ~9:3 ...... 1.8.:.8:3?. .. ~!'P.:" . .IJe r~." .. _ .................... l:!l·.? ·-·· .................. P 2.8 26.5 312 20 52
(;~¥.'!'.~ .. 1.!;.1~n_(j~-··~."f1.tr.al .. ~~'.i.C.!'.". ... ~.".I'.U~Ii~ .... Chad Channel Islands
9.2 7.2 ········-···-·-·-···-····
............... ···············-···
0 .5 11.6 0.9 10.0
5 34 23
510 6
10
404 20 11
............................. .......... ......... ........ ·············· ..................................................... . Chile 24.7 17 .. ~.:.??..2._.... 5.9 0.1 7 .......... ~LOf3? .......... -... ~.:.!.!~?. .. China .................................. ....... ~} 87 ............. 4.?.:.13.?6 4.6 0.3 2 .......... ~2.:.6c:J.~ ... 25,073 _H.~..".lL~E~ll.:_f::!.li~.~ _:;!?.!!,_!'i _. ____ . ~? _______ ::_ ____ ._::.. __ ··-·--Q,_() ___ .. _. __ 1 __ _.?.:2~:3----· ~'~?.!'i ..
--~.':":'~~: .f::_~i.n.'! ....... ................ ............... ··- .......... ···-···········~· ................ 2.:.t3?.2..... 4,044 Colombia 10.4 32 .. _::l.:.E'.~.Cl-···-···-···-··~.:.C! ...... -.......... c:J:.~.·-·-···--·-··-~---_2~~.... 841 C:E'.!'<:>.'.",;. ... -··---··· ............. ·-~} 2 1.0 18.0 6.!·······-·-·········~.? ....................... 2.!.. C<>..n.e.o.: .. c:Je.'l1: .. ~."e ........................... ~.~:!..... 1 0.0 .. _ .. ?:.<:>. ..... ·-···-···-···-·~···-··--·- 2 32 ~".!J.!!O.c..~."P..: ....... _ ... ~_(} .. ?_··-·--··-··-··"-··- 4 0.2 3.9 23 ................ ~ .... ···- 44 Costa Rica 53.7 56 800 5.3 0.3 8 829 943 Cote d' lvoire 31.4 181 4.0 7.8 55 108 301 -····-·--- ..... ···--·- ............ ····--. - ·····-··---··-··--···--·-- ............................. . Croatra 44.1 76 ................ ~.:.?.?6..... 4.0 ..................... _<:>:.?.... 9 ....... ?:.?::3.3 ... . 4,112
Cuba ··--···-···-··-=·=-··-···-·-··-··"-··-··-·-·-··-··-=~···-···-···-··-·='····-···-···- ··-··-·=·'···-··--···-···-··-?·-··--···...1..:.?.2.?_ ........... !,390 C:XIJ.~U~.. 34.6 ............... ?.:4... . ............... .9.:~ .............. _().~ .... .................. <!? .................... ~.:?..?.! ?.:?_2.3 . c;_ze.c.h_f.l".P.IJ.bl.ic.. 43.5 }:.:3~1.- ·······-···-·! .? ....... ··-···-()J:l_. ____ '\.~----- } ,!:!.~. ..!!3.:.~?.~-Denmarl< ..................... ··-·····. 71.8 65 3.6 .................... t ...................... t. ................. ~.:.?.~.~.... 2,073 c:>J!~<:>.u..~i ···-····- . ····-··-····-···-···-···-·--··-··- ______ ._ ..? _. __ ...l.~rz___ 17.2 . ____ !:1!.____ 4 20 Dominica 49.1 21 8.4 8.3 267 42 66
6 20 00 Wo rl d Bank Atlas
Economy
09.'!'inica.~ .. ReR'!~.hc .... Ecuador ·-··········-···-···-···-····-····-···-···-
.~gypt.: .. !l'.!"~ .. ~ep: ... El Salvador
l:.9'!!"!".~i~l ~i~."!! _
Trade In ~ Net goods factured private
exports capital %of ftows•
%of total PPP merchandise G[)pb exports millions 1998 1998 1998
Foreign direct
Investment
%of GOP 1998
Net aid ftows
Per %of cap1ta
GNP $ 1998 1998
lntematlonal -
Receipts
$ Arrivi millions thousa 1998 199
................... ··························- ·····--·-···-·--·---···-··--···-···--·-······-.. ·-33.1 25.7 10.2 25.2
8 10 44 47
771 4.4 0.8 15 2,142 ............ ? :.~ 584 4.5 . 1.0 14 ...................... 291 5 ··-···-···-····-····-····-···-·---···-···-···-···-··-···-·-·-··-···-··-···-··-·-···-····---··-··---····-···-
...... ~ .. 3!3.?.... 1.3 2.2 31 ............... ~.:.5.?'! ...... .. }•2.. 242 0.1 1.5 30 125 5· ·········-····-········- ·························-····- ................................... ..
24 5.3 6.2 58 2 .............................. Entrea 0 0.0 20.6 41 91 11 . .................................................. ·- ......... ········-···-···- ··-··-···-··-·-···-···-···-···-···-·····-········-···- ··-··-····-···-···-···-.. ·- ··-·········-···--··-···-···-Estonia 58.3 66 714 11.2 1.8 62 534 8:
··················-····· ......................... . . ~.!~i<;>IJ.i!' ... -·-···-·-····- ···········-···········":.? ........................... ·- ......... ·- ..... § 0.1 11 11 Faeroe Islands .. .. ··-···-····-····-···--·-····-···-·-··-···--·-· ·-··-·-·-·-····-···-·--····--·- ··---···-···-··-··-.Fiji . 30.0 ............................. ........... ?.? .................. <1:!! ...................... :2·.<1 ....... _ 46 266 3; .F.i.~!!'!.'L .. -.. ·-···-····-···-··- .-6.~:.~.·---··-·-!3.13. .. _ .. _._._ .. _-..:.:... .... _._JI.L ___ ··---·-L -···-··-·--··t ·--··-·:L..:.t3}:L _____ ._.~,!l.~ France .................................................... <!~:~.. 80 2.0 ....................... t .................. :!'.. ............. ?9:.~_::3.1: .... .... ...!c:J:.<:x.
~r.~.n.c._h _~<>.l)'n_e.,;.i!J_ ..... ..... . .... - .... ..... .... .... ..... - ·- - ·······························-···-····-·~5..~-·-·-··-··-···1.! !>!'.~".~ ......... ··········-····· 51.2 -57 ~.9 0.9 ............... }f:l.... 8 1f !>.!".'!'IJ.i!J ,..!.~". §"<>.'!!i~ !>.."C.'!'~~Y ... Ghana
18.2 13 3.1 9.3 31 33 ~ ·············-·····-···-···-· ............... ············- ··-··-···-····-···-··-···-···-· 7:?. ............... -···· .................. 5.! ............. -! .·0 3.1 ....... .~C> .............. 4?.:3.... 3l
55.0 86 . .......... _ ... ..9..:!! .. _ ··-··-··-···-·L -···- _t ____ ~§.,'!?~ ---~.13.,~ 13.0 42 0.7 9.3 38 274 3~
····················-············ ···························
!>'~.~C..~·························- ......................... J,f:l.f:l .. . ............ ···················-···- 0.8 t t ................... ?..:.!~? ... _ _ :L_Q,!!~ Greenland
37.6 21 6.1 1.9 64 61 1l ·························. . ............................. . ········································-.. .. ....... ···············-····-·--·--···-···-···-····---···-
Grenada Guam Guatemala 18.8 33 621 3.6 1.2 22
__ _l,,~?_S. _ 394
_!,~~ 63
9 ............................. . ........................................................................................................... . Guinea ····-···-····-····-····-····-Guinea-Bissau .......... ....... ..
Haiti
1Q:O 1.5.2 ........................................ 46.6
8.9 Honduras 29.1 .................. ········- ............ -.............. _ !:I.U.."..&ary_ ................ <!?:.~ .. . Iceland 61..1 . .......................................................... .. India 3.9 ----··-···-·-··-···--·-··----··-- ···-·-···-···--·-··-
-9 0.0 10.3 51 1 ··--·-···-···-·----··-·-··-····-·-·-··----·--··-·····-···- .. . 1 ......... .Cl :.2 ... !59:0 .............. 8:2... . ......................... .
·-- _____ §1_1 ____ 13.2 :!.<I~Q ____ :!.!.Q _____ ~ _____ f:l 84 11 0.3 10.5 53 58 15 ................................. 17 193 . 1.6 6.2 52 164 31 ··········-··-··-···-····------.-· ·······-····-···-·-···-··- ··-····-··-·--··-···-·-·-···-···-····-···-··· 82 4,683 4.0 0.5 21 2,.5.c:J.'! ........... l:S..:.<J.<l
9 1.9 ........................ :!:.... t .......... ?c:J.Z. _._,_2_~ 74 6,151 0.6 0.4 2 ··-····-~'!?.'!.. ... - .....• ?,~§.
~ ~~.o~e~i~. 15.2 45 -3.:.!?..!:! .............. _:::0.4 1.5 6·-·····-····-·····~·,.CJ45 .... ~:.f'.c:J: !~~~,..I.~!"'!'~.B~.P..:.... .... -.-·-···-··-··-I:l"i..··-···--·-·-"-···-···---···-···~!l:l:l.--.··-·-.c:J.: .Q__··-···-·2:.1.._._._ .. _ ... _ ... _~-···-··-··-··.:'.!1.._ ... _ . ..1.:.c:>2' l.~a~. .. . . .. .. ... ... ... ... ... . ........................ ···-···· 5 13 5
Ireland ············-····-···-····-····-····-····-··-l·~".Cl-···-·-·--·-··l:l<\--·-···---···-···-"-·-·- 3.6 .... t t .. .:3:?!:if.! .. _····- ... 13.:1!.13.:
Israel .............................. ······- ·······-···-··~.!.L .. -···- 92 ··-···-··"--·-···-·--·! "!l-··-···-·-L! .. __ ._.!?il_. __ .. __ _?..:.t356 ... ~.:.~~.: lt~IX. .... .......... .... _ ~.!.:.~ ...................... f:l.~ ............ -.... ....................... _ 0.2 ................... t .. . ....... t .............. :29..:.f:lc:>~ .......... ~.:.f:l?! Jamaica ............................................. ~9.:.?... 70.. .......................... !'il:l.?. ........... .• ?.J_ .. _ ··-···- .Q,~·--··-- .. ?..·-···-···-·....1..:!~.-·-··...1..:.~?.! ~.a.P.~".._ 21,,} ...................... ~4························- .............. .!?.:!_ ................ t . t ................. ~.:.?.~.? ........ _ ··-~,.~c:J.I Jordan ................................................... 3.:'.:.:1. ......................... 207 ........... _:'!~?-···- 7.1 89 853 .... :!.,~§.! !<E.!!~~~!.<'.rl. -·-··-·- 18.2 ·······-·?.~.-···-···- . ~.:9..!3~ ____ §.: ~-·-·· 1.0 13 289 .K."f1.Ya .................................................... ..:1: 7 :.?.... 24 ................... :::5..?. .......... -.... _.c:>".! - 4.2 16 283 89<
Kiribati 22.7 . _ ·--···-···-···-···- ······-···-··-· ·-··-·--···-···-··- 18.7 201 .................... ·····--1 !<<>.r..".~: ... l?."'!' ... R.~P.: . .......... ...... ........... ......... .. .. .. . . ............ . .......................................... _ 5 ............................. . 13(
~~'.".~:...R..!!P."·---·-·-Kuwait
~Y'.~_R.."P.~~J.i~ Lao PDR Latvia Lebanon
35.6 ·- ~-1.·-···-·--.?.:.~. ___ !.:? ____ .Q:.Cl __ ···-·-·=~- ··--·-··-S. ,f:l~ ...... <1.:.2.5.' ........ ..... .. ~1. . 0.2 ..................... t. ......................... ! .................... 2c:J.!
11.9 38 108 6.4 13.1 46 7 5~ ···-···-···-····-·-···-···-··-·-·--··-··-·-···--··-··-···-·-·-··-···-·-....... ~·.l:l ................. -··· 46 3.6 23.0 ............. 5?.... 80 20C
36.7 58 366 5.6 1.2
182 567 ··-·-·--·-·-·-··----................................... ............................... . ................... !.:.!~0. ..... .
1.5 1.4 6.2
40 56 32 25
··· .. ~·:21:l.!'i 63l Lesotho 31.6 .................................................................................. Liberia
~i.~ra. _ .. Liechtenstein -···-···-····-· -····-··-···-·-·-··-Lithuania 39.6 61
281 33.4 16 ........................... . ...... .
983 8.6 1.2
24 15C
1 18 32 59
34 460 1.416
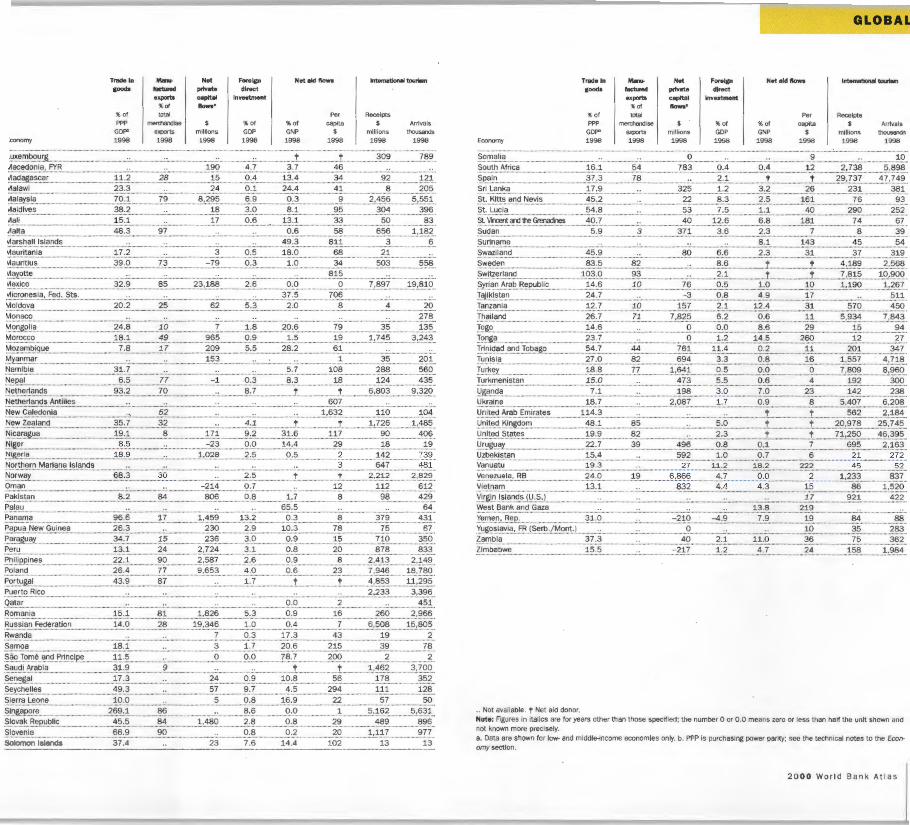
:conomy
Trade In goods
"of ppp
GOP" 1998
ManO> tactured exports
%of total
merchandise
Net prlvato capital flows•
exports millions 1998 1998
................................................................................................... =-~-~~-f!'-~.<:>~'.1\ Aacedonia, FYR. ................................... .. 190
11.2 28 15 ....................................•. <.l.a.~-~ga~.C.!'! v1alawi 23.3 24 ···············································-·········- .............................. . ~~La~~-i!' 70.1 79 .................. 1:! ... ?\l.? v1aldives 38.2 18 ····································································································-····
Foreign direct
Investment
Net aid flows lntematklnal tourism
"of GOP 1998
"of GNP 1998
Per capita
$ 1998
Recetpts $
mi111ons 1998
Arrivals thousands
1998
............. J ........................ t ................... ~~-~---· 789 4.7 3.7 46
··················-····-···-· 0 .4 13.4 34 92 121 ............................. . ................................ . 0.1 24.4 41 8 205 .............................. ································-····· 6.9 0.3 ............................ ~ .................. :? .• ~?.?. ............. 5_,551,. 3.0 8.1 95 304 396
vlali v1alta
15.1 ····-··-··-···-····-···- ................... . 17 ............... .9..:?. .........• 13.1 33 50 . .............................................................. . 83 1,182
6 48.3 97 0.6 58 656 ..................................
vlarshall Islands 49.3 811 3 -··-···-··-···-····-··-······---·· ............................... v1auritania 17.2 18.0 68 21 ............................................................................. 3
-79 0 .5 0 .3
···························· v1auritius 39.0 73 1 .0 34 503 558 ·······-···-··-·····-····---·-
815 ':1 .ax~~e ... ........................................................................................................................ Vlexico .............. ··········--··--··-- ······-··------~-?:.~ 85 ... :2..~,188 2.6 0.0 ..................... .<l. .............. ?. .• ~~.?. ... . 19,810
~i.C.r".~~s.i~,f~~: ~~~-' •.• . .• .......... ... .•.• ........... . . ........ • ................................. . 'Aoldova 20.2 25 62 .................................. Monaco ...................................................................................... ~~.n..&.<>.'L~ 24.8 10 .............. !. .......... .. Morocco 18.1 49 965 ............................................................ . ................................ .
7.8 17 209 ····-···-··-···-····-···-···-····-
. lvi~~O.'.!'!''. .................................................... ··············· ········ ....................... . 153 Namibia 31.7 ········································-
5.3
1.8 0 .9 5.5
37.5 706 ······················· ······· ···················-·····
2.0 8 4 .................................
20.6 79 35 1.5
28.2
··························-······························ 19 ..... ........ .1. .•. !:4.? ... . 61
1 35 ..............................
20 278 135
3,243
201 5.7 108 288 560 ............................. ···································-··
!.'!~.f'~l ..... ........ . ......................... ?.:.? ............ I! .. -1 -0.3 8 .3 18 124 435 .................. Netherlands 93.2 70 .......... .t. 8.7 ································- ·-···-····-t !)_,!l.Q.~ ---~'~:19 ..
607 New Caledonia 52 104 ·········-·······················-···· ·····································- ............ ....... ........ ........... ..... .... .... .... .... .... .... 1 ,63_2 110 New Zealand 35.7 .................................................................................. ~.i.C_".r~g~_a ....... ......................... .......... 19.1 -~!l~'. ............ .. 8.5
-~'S.~r.~-~ ---· 18.9
32 8
. .................................. . 171 -23
1.028
4 .1 .................... t ..................... t. ............ ~.?2~ --- 1,485 406 9.2 31.6 117 90 ··--·-····-···--·--···-···-·-
0.0
..... ?.:.? .... 14.4
0.5 29 18 19 .....................................
2 ......... !:4~ .. 739 ~9!\b~r.~Mar.i".."..~!~ l."..n.d.S. ...................... _ ........................... . 3 647 481 ............................................................................................................................................................ .N..o.r.:-~.~x ... Oman Pakistan Palau ···-···-····-···-···-···-
68.3
.................... .............. !!:.::!
30 2.5 ..................... !.... 't .. ?. •. ?.:!.?..... 2 ,829 ..... ::.?:!.'! .... 0. 7 ············· ......................... ..:t-:2. ....................... :1.:1.::!... 612
0 .8 ........ ..1·.?.. 8 98 429 M 806 ..................................... 6~5 M
Panama .........................................•....... -~~:.?. 17 .................. :!/!!'i.~ 13.2 .................. .2:.~ .............................. 1:! ........................ :3.?..~ ...................... 431 !:.".e~-~--~-~.v.'. .. §.~Ln.~.'! 26.3 ·--·-·····'·'·-·-··--··--···-··::!~() ·······---···:?·'-~·--·· ......... !9. :.~.......... 78 ..................... ?.? .... e1 ~.ar~g~_ay_ _ ........................... ···············-~-~ :.!........... 15 236 3.0 ......... .......... .2:.~ .................... 15 710 350 Peru ............................. ·····························-~-~:.!. 24 .......... :2..,.?.:1.'!...... 3 .1 0.8 20 .................. ~?..?..... 833 ~.hi_l_ iepi _n.~-~--- 22.1 9o ......... ? .. ?!!!. .............. :2..:.~ .............. ..... 9.: .. 9 ............ ...........•.. ~:!............... 2.413 ....... :2..,.!49 Poland........................................................ 26.4 77 9,f3.§.~ ................. ~.0 0.6 23 .............. ?. .. ~:'!.?. 18,780 ~<>.r.t~g~l .... ... . • .• . ... 4:.~ --~ 87 1. 7 .................... t ........................... t. .................. ~ .•. 8.?}.... 11,295 Puerto Rico ······-···--··-·····-- ·············-···-···-···- ·······-- ............ ? .•. ?~.~--- 3,396 Qatar .................................................................... .............................. .. .. . ............ q,_o ___ ................. ? ............................................... ~?:L .. Romania 15.1 81 ... .1..,!!:2..§... 5 .3 0.9 16 260 ..... ? .•. ~~?. .. . fl~_s_sia_n. __ F,ed<:_r~tio~---·· .................... :L:'!-.9.... 28 ............. _1,9_, 3:4§ .. 1.0 0.4 7 ............... ~ .•. 59.8.. .. 15,805 R.wanda 7 0.3 17.3 43 19 2
······································-····- ··········--·-··--· ······-··-····-···-····-
-~~-~9.-~----···············- 18.1 .................................. 3 1.7 20.6 .......... ·-- ~-~?. .. 39 ........... ?.~ . ~~O. .. T<:>n:>~ .. !'~-~ --~'.i."..C.i.~.... 11.5 ......... 0 . .9..:.9. ................... !13.:.!. ...................... ?..00 2
-~~~-d..i __ P.-r.~~i~ •.. . ........................... ~.!,_!;) . ........... ~ . . .................... J ................ :!: ................. .1. .• :'!?.::! ... . §~/1e_g~1...... 17.3 24 0 .9 10.8 56 178 ~~~"--~-~~~~_s___ 49.3 Sierra Leone 10.0 ......... ············· ...................................... . !'.'."!l"..!>.<:>.'~ ..................................... :2.§.~: . .1. _SI_o.v~k ___ R~p-~bl_ic. ............................. -~-?:.?. Slovenia 66.9 ·-···-····-····-···-····--···---··-···- ··--·-···-·····-··-···-Solomon Islands 37.4
86 84 90
57 9.7 111 5 0 .8
4.5 16.9
294 22 57 . ........................................................... ..
8.6 0.0 ............................ ! .................. ? .•. :l.f:i.? ... . 2.8 0 .8 29 489 ......................................................................................
········-···-·-······-···- 0.8 0.2 ......................... ?9. .................... .1. .•. :117 23 7.6 14.4 102 13
2 3,700
352 128
50 5,631
896 977
13
Economy
Somalia
Trade In goods
"of ppp
GOP" 1998
South Africa 16.1
.~e-~ i .n. .. 37.3 Sri Lanka 17.9 St. Kitts and Nevis 45.2 ··········· ............................................................... .
Man .. tactured exports
%of
merchandise
Net private capital flows•
exports millions 1998 1998
Foreign direct
Investment
%of GOP 1998
Net aid ftows
%of GNP 1998
Per capita
$ 1998
GLOBAL I
International tourism
Receipts $
m1llions 1998
Arrivals thousands
1998
........................ .9. ........................................................... ···················-~---·- ··-···-···--··-···-····-···- 10 ... :2. .• .?.:3..13..... 5,898 54 783 0.4 0 .4 12 .................................................................. . .............................. ..
... 7_8 ..... .............. ........ 2.1 .............. t ........................ t... .. ?9, 7_~7 ....... ~.? .•. !.1 .. !! .. 325 1.2 3.2 26 231 381
... J() ................... !l.~ . 22 8.3 2.5 161 ............................ .. ............................ . St. Lucia 54.8 53 7.5 1.1 40 290
74 8
45
252 67 39 54
··-·········-··- .......... ................... ... .............. .................................... . ...................... _____ _ SLVincentandtheGrenadines 40.7 ........................ ~9. 12.6 6.8 181 . ................................ _ Sudan 5.9 3 371 . ........................................................ _ 3.6 2.3
8.1 7
143 Suriname Swazi land Sweden Switzerland
45.9 ··········-· ..... :.:. ....... ·-··--···-···-·?_Q _____________ f:;_,!) _____________ 2.3 31 37 319 83.5 82 8 .6 ............ t ........................... !. .............. :'!...!!!.~.... 2,568
93 ··---- 2.1. ........................... ! ................ t ....... I..!!1..§ __ .!9...~9.9. .. 103.0 ··············-···-·····-···
S.yr_ia.n. A..'~.lll'l~P~I,> I i~ ................. ~:'!:.6 10 ................. . ?.?. 0.5 1.0 ...... .............. 1<J.... . .. ~ · 1.!!0. 1,267 !.~Ji.~i .S.~.~D.... 2~:.!. ........................................................ ::::~·-·-··-··-···9.·8 4 .9 17 ··-···-···-···-·····-···· 511 Tanzania Thailand . ............................ ..
12.7 10 157 2.1 12.4 31 570 450 .............................. ................................... .. ..........................• 26.7 71 ...... I..!l..2.? ... 6.2 0 .6 11 5 ,93~ ............... .? ,843 14.6 0 !.~!I<:>
!.~.".!:.~ ... ·····················-·························· .. ··--................................ .. 0.0
1.2 8.6 ...................... ?.~ ................... 1.5 94
I.'.i.ni~-~.<! .. ~.".~ .. !<:>1,>~~~-9 ...... Tunisia
23.7 0 . .............................................................. . 54.7 44 ............ ...!.6.! .... .
82 694
14.5 260 12 27 . .................................... .. 11.4 0.2 11 201 347 ...............................
3.3 ................ 9.:.13. ... 1§ ................ .1.. •. ??..!.. .......... ~?_1.1;! . !~'.1<-~L ...
27 .0 18.8 77 ................ .1. •. ?.~~ 0.5 ................... 9.:0.... 0 ................ ?. .• !!9.~ .. -. 8 ,960
Turkmen_i~~"--~ ............................................... :1..?.:.() 4 73 5.5 0 .6 4 ....................... !.~::!... 300 !!&~.".d.~ ......... . .......................... !. -.~- ........................................... ~~.?. .............. .:3..:9. .................... 7.0 23 ..................... !~.?. .................... 238 Ukraine ................................................... ... ~!lJ ... . ................... ?,g!!?.... 1.7 0 .9 ..... !l.·-···-·-···..?..,.~Q?__ ______ §_,_?~_S. .. !!.n.i!~~-!-.'!'.~ .. -~'.':'i!~.!e_,;_ 114.3.......................... .... ........ ..... .......... t t 5!>.:2. . _2,184 .l!."..i.!~(j }\i~~~~O'." ................................... ~!!. :.~ 85 ........................................ ......... §,_9. _ ...... T 'f' ................ ?.I:J., .~?..?.......... 25,7 45 l!."..i!<:~. §.~!<:s ··-···---!~~-!,!_______ 82 2.3 ········-·..t.__- ··-··-··-···-·.!. .. ?..1..,.??..9. .......... ~§,~~?. . .l!'..~_gu_!'Y..... 22.7 39 ..................... 4!!.~ 0 .8 0.1 7 695 2,163 Uzbekistan 15.4 592 1.0 o. 7 6 21 272 ········-···-····-··-··-····-···-··-·------ .................................................................................... . Vanuatu 19.3 27 11.2 ................ !!!.:.~.... 222 ........................... ~.? ....................... !:'.~ .. Venezuela, RB ..................................•..... :2:~:,9 ....... _________ .1._~--- 6,8(;.? ............. - .. -~:.!. ··-·-·-···-·9. ·9... . .... ······--?... 1,233 837 Vietnam ............................................... P::L ......................................... !!:3.?.... . ..... :4:.4 ............. :4:~ ........................ !?. ....................... : ~~: ............ :1.,.?.:2..9. .. Yi_rgi_~i_!;@~_~.;.Jl! :?.:L.. ---- ......... ..• ........... .. ................. :!.!.. ............... ~:2.~ .................... '!:2..:2 .. Y.I~S.t. !l~."..k. a.~.c:l G.".'~-- .... ................... ..... .. .. . ............. 1~ ·.1'! ............... ::!.!~. .... . ........................................... . Y.e.r..n.~_n_,__g~p_, _______________________________ 3..!:.1:l - 210 ··---~-!1-···-···-···-·L-!1.. 19.···········-··-···-·1:!.'!.. ...... ··········-··?..!3... ::r.ue9~~~.V.i~, -~.J~~r_ll ,/M.<>..n.~:l •.. .... .. ..... ..... .... ... o... ........ .... .... ...... . . ...... ..19. ... 35 .............. ~s3 Zambia ................................. ···-··········- 37.3 .......... 40 2.1 11.0 ....................... ~-6 75 362 Zimbabwe 15.5 .............................................................. -217 ····························· 1.2 4. 7 .. ..... . .... ?~ ................. ~?.13. .. . 1,984
.. Not available. 1' Net aid donor. Note: Figures in italiCS are for years other than those specified; the number 0 or 0.0 means zero or less than half the unit shown and not known more precisely . a. Data are shown for low- and middle-income economies only. b. PPP is purchasing power parity; see the technical notes to the Eco~ omy section.
20 00 World Bank Atlas

NICAL NOTES
People
The demographic data (population, life expectancy, and infant mortality)
are World Bank estimates and are a combination of observed values and
interpolated and projected estimates. The midyear population estimate
includes all residents regardless of legal status or citizenship. Refugees
not permanently settled in the country of asylum are considered to be
part of the population of their country of origin. The average annual pop.
ulation growth rate is calculated as the exponential change for the period
indicated.
Consumption per capita is private consumption expenditure divided
by the midyear population. Growth in private consumption per capita is
calculated using the least-squares method. Private consumption includes
the consumption expenditures of individuals, households, and nonprofit,
nongovernmental organizations. It includes expenditures on food, cloth
ing, rent, health care , education, transportation, and consumer durables.
Malnutrition refers to the percentage of children under five whose weight
for age is less than minus two standard deviations below the average
for the reference population. The data are from the Subcommittee on Nutri
tion of the United Nations Administrative Committee on Co-ordination.
Access to safe water refers to reasonable access to an adequate amount
of treated or uncontaminated water. This means that sufficient water to
maintain health (about 20 liters a person a day) is available not more
than 200 meters away in urban areas, and is within manageable walk
ing distance for rural households. The net female primary enrollment ratio
compares the number of girls of official school age enrolled in primary
school with the number of girls of official school age in the population.
Enrollment data are from the United Nations Educational , Scientific , and
Cultural Organization . Female labor force estimates are from the Inter
national Labour Organization.
Environment
Land area is the country's total area, excluding the area under inland bod
ies of water. The data on land area and forests are from the Food and Agri
culture Organization. Definitions of forest area vary among countries.
The energy data are from the International Energy Agency and refer to
commercial forms of energy. They include energy from combustible renew
abies and waste . Gross domestic product per kilogram of oil equivalent is
an indicator of energy efficiency. This year's edition employs GDP con
verted to international dollars using purchasing power parity (PPP) rates to
produce comparable and consistent estimates of GDP across countries.
The data on water are based on estimates from the World Resources
Institute and cover domestic, industrial, and agricultural use. Available
freshwater resources refer to internal renewable resources and include river
ftows from other countries. Water use includes nonrenewable water resources
58 2000 World Bank Atla s
from aquifers and desalination plants and therefore can exceed total inter
nal renewable resources.
Carbon dioxide emissions are those stemming from the burning of fos
sil fuels and the manufacture of cement. Data on emissions are from the
Carbon Dioxide Information Analysis Center.
Economy
Gross national product (GNP) is a broad measure of an economy's per
formance; it is the value of the final output of goods and services pro
duced by the residents of an economy plus net primary income from
nonresident sources. U.S. dollar values are obtained from domestic cur
rencies using a three-year weighted average of the official exchange
rate (the Atlas method). For the few countries where the official exchange
rate does not reflect the effective rate applied to foreign transactions,
an alternative conversion factor is applied. The GNP per capita growth
rate is calculated from constant price data in the local currency, using
the least-squares method. The data on national accounts and inflation
are from World Bank and OECD data files .
GNP per capita in international dollars is converted at purchasing power
parity (PPP) rates . PPP is defined as the number of units of a country's
currency required to buy the same amounts of goods and services in the
domestic market as $1 would buy in the United States. The PPP data are
from the International Comparison Programme. The 1998 data are based
on surveys carried out between 1993 and 1996 or on regression
estimates.
The share of agriculture in GDP is calculated from value added esti
mates of agriculture. The share of investment in GDP is based on gross
domestic investment (including changes in inventories). Inflation is mea
sured by the overall price change for all goods and services included in '
GDP. Inflation rates are calculated using the least-squares method. The
current account balance is the sum of net exports of goods, services,
income, and current transfers ; these data are from World Bank and
International Monetary Fund (IMF) data files. The external debt data are
from the World Bank's Debtor Reporting System and refer to debt owed
to nonresidents repayable in foreign currency, goods, or services. Total
external debt is the sum of public , publicly guaranteed , and private
nonguaranteed long-term debt, use of IMF credit, and short-term debt.
times the number of shares outstanding in each country's stock marl
These data are from the International Finance Corporation's Emerg
Markets Database.
The overall budget deficit is current and capital revenue and offir
grants received less total expenditures and lending minus repaymer
These data are from World Bank and IMF data files .
Military expenditures for NATO countries are based on the NATO c
inition, which covers military-related expenditures of the defense minis
(including recruiting, training, construction, and the purchase of mil it;
supplies and equipment) and other ministries. Civilian-related exper
tures of the defense ministry are excluded. Military assistance is incluc
in the expenditures of the donor country, and purchases of milit;
equipment on credit are included at the time the debt is incurred, not
the time of payment. Data for other countries generally cover exper
tures of the ministry of defense (excluding expenditures on public ore
and safety, which are classified separately). Data on military expenditur
are from the U.S. Department of State 's Bureau of Arms Control.
Electricity consumption measures the production of power plants a
combined heat and power plants less distribution losses and own use
heat and power plants. Paved roads are those surfaced with crushed sto
(macadam) and hydrocarbon binder or bituminized agents, with concre1
or with cobblestones. The data on electricity consumption are from t
International Energy Agency; the data on paved roads are from the lnt
national Road Federation. Telephone mainlines per 1,000 people provio
a measure of telephone density. Telephone mainlines refer to the telephor
lines connecting a customer's equipment to the public switched te
phone network. Estimates ofthe number of personal computers (PCs) a
derived from an annual questionnaire by the International Telecommur
cation Union (ITU), supplemented by other sources. The data on telephor
mainlines and PCs are from the ITU.
Global Links
Trade in goods as a share of PPP GDP is the sum of merchandi!
exports and imports measured in current U.S. dollars divided by t~
value of GDP converted to international dollars using purchasir
power parity conversion factors. Manufactured exports include cher
icals, basic manufactured goods, and machinery and transport equi
ment but exclude nonferrous metals. The trade data are from the Wor
States and Markets Trade Organization; shares of manufactured exports are estimated usir
Private investment-that is , outlays by the private sector on additions to the United Nations COMTRADE database.
fixed assets-is often estimated as a residual of gross domestic invest- Net private capital flows consist of private debt and nondebt flow!
ment less consolidated public investment. These data are from the Inter- Private debt flows include commercial bank lending, bonds , and otht
national Finance Corporation 's Trends in Private Investment in Developing private cred its . Private nondebt flows are foreign direct investment an
Countries 1999. Stock market capitalization is the end-year share price portfolio equity investment. Foreign direct investment is net inflow
f investment to acquire a lasting management interest (10 percent
r more of voting stock) in an enterprise operating in an economy other
1an that of the investor. It is the sum of equity capital , reinvestment
·f earnings, other long-term capital, and short-term capital as shown
1 the balance of payments. The data on net private capital flows are
lrawn from World Bank and IMF data files.
Aid data cover net concessional flows to developing countries from
nembers of the Development Assistance Committee of the OECD, mul
ilateral development agencies , and certain Arab countries. These
lata are from the OECD.
International tourism receipts are expenditures by international
nbound visitors, including payments to national carriers for interna
:ional transport. International tourist arrivals are the number of visi
:ors who travel to another country for less than one year. These data
are from the IMF and the World Tourism Organization .
For a more detailed discussion of issues of data quality and mea
surement problems for the above indicators, see About the data for
the relevant tables in World Development Indicators 2000 or in the World
Development Indicators CD-ROM.
Note
Data are shown for economies as they were constituted in 1998, and
historical data are revised to reflect current political arrangements.
Exceptions are noted throughout the tables.
On 1 July 1997 China resumed its exercise of sovereignty over Hong
Kong. On 20 December 1999 China resumed its exercise of sovereignty
over Macao. Data for China do not include data for Hong Kong, China,
Taiwan, China, or Macao, China, unless otherwise noted.
Data for the Democratic Republic of Congo (Congo, Dem. Rep. , in
the table listings) refer to the former Zaire . For clarity, this edition also
uses the formal name of the Republic of Congo (Congo, Rep., in the table
listings).
Data are shown whenever possible for the individual countries formed
from the former Czechoslovakia-the Czech Republic and the Slovak
Republic.
On 25 October 1999 the United Nations Transitional Administration
for East Timor (UNTAET) assumed responsibility for the administration of
East Timor. Data for Indonesia include East Timor.
Data are shown for Eritrea whenever possible, but in most cases before
1992 Eritrea is included in the data for Ethiopia.
Data for Germany refer to the unified Germany unless otherwise noted.
Data for Jordan refer to the East Bank only unless otherwise noted.
In 1991 the Union of Soviet Socialist Republics was dissolved into
15 countries (Armenia, Azerbaijan , Belarus, Estonia, Georgia, Kazakhstan,
Kyrgyz Republic, Latvia, Lithuania, Moldova, Russian Federation, Taj ikistan,
Turkmenistan, Ukraine, and Uzbekistan). Whenever possible, data are
shown for the individual countries .
Data for the Republic of Yemen refer to that country from 1990
onward ; data for previous years refer to aggregated data of the former
People's Democratic Republic of Yemen and the former Yemen Arab
Republic unless otherwise noted.
In December 1999 the official name of Venezuela was changed to
Republica Bolivariana de Venezuela and is listed in the tables as
Venezuela , RB.
Whenever possible, data are shown for the individual countries formed
from the former Socialist Federal Republic of Yugoslavi~snia and Herze
govina, Croatia, the former Yugoslav Republic of Macedonia, Slovenia,
and the Federal Republic of Yugoslavia. All references to the Federal Repub
lic of Yugoslavia in the tables are to the Federal Republic of Yugoslavia
(Serbia/ Montenegro) unless otherwise noted.
Some of the charts refer to regional and income groupings of coun
tries . The regional measures include only low- and middle-income
economies and follow the country composition of the World Bank 's ana
lytical regions , which may differ from common geographic usage (see the
World by Region map at the front of the book). For the income groups,
every economy is classified as low income, middle income, or high
income. Low-income economies are those with a GNP per capita of $760
or less in 1998. Middle-income economies are those with a GNP per capita
of more than $760 but less than $9,361. Lower-middle-income and
upper-middle-income economies are separated at a GNP per capita of
$3,030. High-income economies are those with a GNP per capita of $9,361
or more (see the map spread Income per person in the Economy section).
TECHNICAL N
20 00 World Bank Atla s

S TECHNIQUES
Population
Les donnees demographiques (population, esperance de vie et mortalite
infantile), fruit d'estimations de Ia Banque Mondiale, sont une combinaison
de valeurs observees et d'estimations obtenues par interpolation et
projection. L'estimation de Ia population en milieu d'annee inclut tousles
residents du pays, independamment du statutjuridique et de Ia citoyennete.
Les refugies qui ne sont pas etablis a titre permanent dans le pays ot) ils
ont trouve asile sont comptes dans Ia population de leur pays d'origine.
Le taux annuel moyen d'accroissement de Ia population est calcule comme
!'evolution exponentielle pendant Ia periode consideree.
La consommation par habitant est mesuree en termes de depenses
de consommation privee, divisee par Ia population en milieu d'annee. Le
taux de croissance de Ia consommation privee par habitant est calcule
par Ia methode des moindres carres. La consommation privee recouvre
les depenses de consommation des individus, des menages et des
organismes non gouvernementaux a but non lucratif, en matiere
d'alimentation, d'habillement, de Ioyer, de soins de sante, d'education,
de transport et de biens de consommation durables.
La malnutrition renvoie au pourcentage d'enfants ages de moins
de cinq ans dont le poids pour leur age est inferieur de plus de deux
ecarts types a celui de Ia moyenne de Ia population de reference. Les
donnees utili sees sont celles du Sous.Comite de Ia nutrition du Comite
administratif de coordination des Nations Unies. Le taux net de
scolarisation primaire feminine met en rapport le nombre des filles
d 'age scolaire qui sont inscrites a l 'ecole primaire et le nombre total
des filles d'age scolaire au sein de Ia population . Les donnees sur les
effectifs scolarises proviennent de !'Organisation des Nations Unies
pour !'education, Ia science et Ia culture. Les estimations de Ia part
des femmes dans Ia population active emanent du Bureau international
du travail.
Envlronnement
La superficie des terres correspond a Ia superficie totale d'un pays moins
Ia superficie des eaux interieures. Les donnees sur Ia superficie des terres
et les forets proviennent de !'Organisation des Nations Unies pour
!'alimentation et !'agriculture. La definition des zones boisees varie
selon les pays.
Les donnees sur l'energie proviennent de I'Agence internationale de
l'energie et concernent les formes commerciales d'energie . Elles
comprennent les energie tirees des mutieres renamelables combustibles
et des dechets. Dans cette edition, on a converti les chiffres du PIB en
dollars internationaux en prenant Ia parite du pouvoir d'achat (PPA)
comme facteur de conversion pour obtenir des estimations coherentes
permettant de comparer les differents pays.
0 20 00 World Bank Atlas
Les donnees relatives a l'eau reposent sur des estimations de l' lnstitut
des ressources mondiales et couvrent les usages domestiques, industriels
et agricoles. Les ressources d'eau douce disponibles correspondent au
total des ressources interieures renouvelables , et incluent les cours
d'eau en provenance d'autres pays. Le volume total d'eau consommee
comprend les ressources non renouvelables provenant des nappes
aquiferes et des usines de dessalement et peut done depasser le total
des ressources interieures renouvelables.
Les emissions de dioxyde de carbone prises en compte sont celles
produites par les combustibles fossiles et Ia fabrication de ciment. Les
donnees sur ces emissions proviennent du Centre d'analyse des
informations sur le gaz carbonique.
Economle
Le produit national brut (PNB) est une mesure d 'ensemble de Ia
performance economique d 'un pays ; il represente Ia valeur de Ia
production finale de biens et services assuree par les residents du
pays, plus les montants nets de revenu primaire verses par des non
residents. Les valeurs en dollars des U.S. sont obtenues par conversion
de Ia valeur en monnaie nationale sur Ia base d'un taux de change
officiel moyen pondere sur trois ans (methode de I' Atlas). Pour les
quelques pays ou le taux de change officiel ne correspond pas au taux
de change effectif applique aux transactions avec l'etranger, on utilise
un autre facteur de conversion. Le taux de croissance du PNB par
habitant est calcule a partir de donnees exprimees en prix constants dans
Ia monnaie nationale, par Ia methode des moindres carres. Les donnees
sur les comptes nationaux et !'inflation proviennent des fichiers de
donnees de Ia Banque mondiale et de I'OCDE.
Le PNB par habitant en dollars internationaux est obtenu par conversion
sur Ia base de Ia parite des pouvoirs d'achat (PPA). LaPPA est definie comme
nettes de biens et de services, des revenus et des transferts couran1
ces donnees proviennent des fichiers de donnees de Ia Banque mondi.
et du Fonds Monetaire International (FMI). Les donnees relatives a Ia de
exterieure proviennent du Systeme de notification de Ia dette exteriet
a Ia Banque Mondiale et correspondent aux creances sur des m
residents remboursables en devises, en biens ou en services. La de·
exterieure totale est Ia somme de Ia dette publique, de Ia dette a garan
publique, de Ia dette privee non garantie a long terme, du recours au ere
du FMI et de Ia dette a court terme.
Etat et Marche
L'investissement prive, c'est-&dire les depenses du secteur prive po
Ia formation de capital fixe, est souvent estime par difference ent
l' investissement interieur brut et l'investissement du secteur pub
consolide. Ces donnees proviennent de Ia Societe financiere internation<
("Trends in Private Investment in Developing Countries 1999"). I
capitalisation boursiere est etablie a partir du cours des actions en f
d'annee, multiplie par le nombre d'actions en circulation sur le marct
boursier du pays considere. Ces donnees proviennent de Ia Base c
donnees sur les marches emergents de Ia Societe financiere international
Le deficit budgetaire global est Ia difference entre, d'une part, IE
recettes courantes, les recettes en capital et les dons publics re9us e
d'autre part, les depenses totales et les prets moins les remboursement:
Ces donnees proviennent des fichiers de donnees de Ia Banque Mondial
et du FMI.
Les donnees sur les depenses militaires, dans le cas des pays d
I'OTAN , reposent sur Ia definition etablie par cette organisation , qt
englobe les depenses a caractere militaire effectuees par le minister•
de Ia defense (y compris les operations de recrutement, les activite.
de formation , les travaux de construction et l'achat de materiel et d•
le nombre d'unites de Ia monnaie d'un pays necessaire pour acheter sur fournitures militaires) et les autres ministeres. Les depenses a caracten
le marche interieur Ia meme quantite de biens et services qu 'un dollar civil du ministere de Ia defense en sont exclues. L'aide militaire est inclust
permettrait d'acheter aux Etats-Unis. Les chiffres de 1998 sont bases sur dans les depenses du pays donateur, et les achats de materiel militain
les resultats d'enquetes realisees entre 1993 et 1996 ou sur des effectues a credit sont repertories a Ia date a laquelle Ia creance es
estimations obtenues par regression . Les donnees etablies sur Ia base contractee, et non pas a Ia date de remboursement. Dans le cas de~
des PPA proviennent du Projet de comparaison internationale des Nations autres pays, les donnees englobent generalement les depenses dt
Unies. ministere de Ia defense (a !'exclusion de celles destinees a Ia securite
La part de !'agriculture dans le PIB est calculee a partir des estimations et a l 'ordre publics, qui sont classees separement). Les donnees su1
de Ia valeur ajoutee de !'agriculture. La part de l' investissement dans le les depenses militaires proviennent de Ia U.S. Department of State ' ~
PIB repose sur l'investissement interieur brut (y compris les variations du Bureau of Arms Control.
niveau des stocks). L'inflation est mesuree en termes de variation de La consommation d'electricite correspond a Ia production deE
!'ensemble des prix de tousles biens et services pris en compte dans le centrales electriques et des centrales electrocalogenes, deduction faite
PIB. Le taux d' inflation est calcule par Ia methode des moindres carres. des pertes de distribution et de l'autoconsommation des centrales
Le solde des transactions courantes est Ia somme des exportations electrocalogenes. Les routes amenagees sont des routes recouvertes

e pierres concassees (empierrement), de beton bitumineux ou utilise
vee un liant aux hydrocarbures, ou de paves. Les donnees sur Ia
onsommation d'electricite proviennent de I'Agence internationale de
·energie et celles relatives aux routes revetues , de Ia Federation
outiere internationale. Le nombre de lignes telephoniques principales
>our mille habitants mesure Ia densite de l'equipement telephonique.
'ar I ignes telephoniques principales, on entend les lignes telephoniques
accordant le materiel d'un abonne au reseau telephonique public
:ommute. Les estimations du nombre d'ordinateurs individuels sont tirees
J'un questionnaire annuel administre par I'Union internationale des
:elecommunications (UIT) , complete par d'autres sources. Les donnees
·elatives aux lignes telephoniques principales et aux ordinateurs
ndividuels proviennent de I'UIT.
nombre de visiteurs qui se rendent dans un autre pays pour une periode
de moins d'un an. Ces donnees proviennent du FMI et de I' Organisation
mondiale du tourisme.
Pour une analyse plus detaillee des questions de qualite des donnees
et des problemes de mesure des indicateurs, voir les sections relatives
aux donnees des tableaux correspondants figurant dans World
Development Indicators 2000 ou sur le World Development Indicators CD
ROM .
Note
Les donnees sont presentees pour les pays tels qu'ils etaient constitues
en 1998, et les chiffres se rapportant aux periodes anterieures ont ete
modifies sur Ia base des situations politiques actuelles. Les exceptions
sont signa lees en note aux divers tableaux.
Interactions Economlques Mondlales De puis le 1er juillet 1997, Ia Chine exerce de nouveau sa souverainete
Les echanges de biens et services en pourcentage du PIB correspondent sur Hong Kong. De puis le 20 decembre 1999, Ia Chine exerce de
a Ia somme des exportations et des importations de biens et services, divisee nouveau sa souverainete sur Macao. Sauf indication contra ire, les
par le PI B. Les exportations de biens manufactures englobent les produits donnees pour Ia Chine ne comprennent pas Hong Kong (Chine), Ta"iwan
chimiques, les articles manufactures de base, les machines et le materiel (Chine) et Macao (Chine).
de transport, mais excluent les metaux non ferreux. Les donnees sur les Les donnees sur Ia Republique democratique du Congo (dans les
echanges proviennent du FMI et de Ia Conference des Nations Unies sur le tableaux, • Congo, Dem. Rep. •) se rapportent a l'ex-Za"ire . Pour plus de
commerce et le developpement. clarte , le nom officiel de Ia Republique du Congo est egalement utilise
Les flux nets de capitaux prives recouvrent les flux au titre de Ia dette dans Ia presente edition (dans les tableaux, • Congo, Rep. • ).
privee et les flux de capitaux prives non associes a Ia dette. Les flux au titre Dans Ia mesure du possible, on a presente des donnees distinctes
de Ia dette privee recouvrent les prets des banques commerciales, les pour Ia Republique tcheque et pour Ia Republique slovaque, que couvrait
obligations et autres credits du secteur prive. Les flux prives non associes
a Ia dette sont les investissements etrangers directs nets et les
investissements de portefeuille. Les investissements etrangers directs
sont des investissements effectues pour acquerir des droits durables
(representant au moins 10 % des actions donnant droit de vote) sur une
entreprise fonctionnant dans un pays autre que celui de l'investisseur. lis
representent Ia somme des capitaux pro pres, des benefices reinvestis, des
autres capitaux a long terme et des capitaux a court terme, comme indique
dans Ia balance des paiements. Les donnees sur les flux nets de capitaux
prives proviennent des fichiers de donnees de Ia Banque mondiale et du
FMI.
Les donnees sur l'aide prennent en compte les apports concessionnels
nets aux pays en developpement emanant des pays membres du Comite
d'aide au developpement de I'OCDE, des organismes d'aide multilaterale
au developpement, et certains pays arabes. Elles proviennent de I'OCDE.
Les recettes du tourisme international sont les depenses effectuees
dans le pays d'accueil par les visiteurs internationaux, y compris le
paiement de leurs transports internationaux aux compagnies nationales
de transport. Les arrivees de touristes internationaux representent le
anterieurement Ia Tchecoslovaquie.
Depuis le 25 octobre 1999, le Timor oriental est place sous l'autorite
de !'Administration transitoire des Nations Unies au Timor oriental
(ATNUTO). Les donnees pour l' lndonesie comprennent le Timor oriental.
Dans Ia mesure du possible, des donnees sont presentees separement
pour I'Erythree, mais les donnees anterieures a 1992 presentees pour
I'Ethiopie incluent, dans Ia plupart des cas, I'Erythree.
Sauf indication contraire , les donnees sur I'AIIemagne portent sur
I'AIIemagne unifiee.
Sauf indication contraire , les donnees sur Ia Jordanie se rapportent
uniquement a Ia Rive orientale du Jourdain.
En 1991, I'Union des republiques socialistes sovietiques a ete
scindee en 15 pays (Armenie, Azerbaldjan, Belarus, Estonie, Federation
de Russie, Georgie, Kazakhstan, Lettonie, Lituanie, Moldo_va, Ouzbekistan,
Republique kirghize, Tadjikistan, Turkmenistan et Ukraine). Les donnees
relatives a chaque pays ont ete presentees dans Ia mesure du possible.
En decembre 1999, Republica Bolivariana de Venezuela est devenu
le nom officiel du Venezuela ; il apparait comme • Venezuela, RB • dans
les tableaux.
NOTES TECHN
Les donnees presentees pour Ia Republique du Yemen ne couvrent
pas les annees anterieures a 1990 ; sauf indication contraire, les donnees
indiquees pour ces annees se rapportent a l'ex-Republique democratique
populaire du Yemen eta l'ex-Republique arabe du Yemen.
Dans Ia mesure du possible, on a presente des donnees distinctes
pour les pays que couvrait l 'ex-Yougoslavie - Bosnie-Herzegovine ,
Croatie, ex-Republique yougoslave de Macedoine, Slovenie et Republique
federative de Yougoslavie (Serbie et Montenegro).
Certains des graphiques font reference a des groupements de pays
etablis en fonction de l'appartenance geographique et du revenu. Les
indicateurs regionaux ne couvrent que les pays a revenu faible et
intermediaire, et suivent Ia composition des groupements regionaux
adoptee par Ia Banque mondiale a des fins analytiques, qui peut differer
de Ia composition geographique courante (se reporter a Ia carte Le
monde region par region au debut de I' Atlas). Les pays sont classes en
economies a faible revenu, a revenu intermMiaire ou a revenu eleve sur
Ia base de leur PNB par habitant. Les valeurs retenues ici comme seuil
pour definir ces groupes sont : 760 dollars ou moins en 1998 pour les
pays a faible revenu ; entre 761 dollars et 9 360 dollars pour les pays
a revenu intermediaire, cette categorie etant elle meme divisee en pays
a revenu intermediaire, tranche inferieure, et pays a revenu intermMiaire,
tranche superieure, selon que le PNB par habitant est inferieur ou
superieur a 3 030 dollars ; et au moins 9 361 dollars pour les pays a revenu eleve (se reporter a Ia carte intituh§e Revenu par habitant de Ia
section Economie) .
2000 World Bank Atlas
S TECNICAS
Poblacl6n
Los datos demograficos (poblacion, esperanza de vida y mortalidad
infantil) son estimaciones del Banco Mundial y consisten en una
combinaci6n de valores observados y estimaciones interpoladas y
proyectadas. La estimaci6n de Ia poblacion a mediados del aiio comprende
a todos los residentes , independientemente de su situaci6n juridica o su
ciudadania. Los refugiados que nose han establecido definitivamente en
el pais de asilo se consideran parte de Ia poblacion de su pais de origen.
La tasa media de crecimiento anual de Ia poblacion se calcula como Ia
variaci6n exponencial correspondiente al periodo indicado.
El consumo per capita es el gasto en concepto de consumo privado
dividido por Ia poblaci6n a mediados del aiio. El aumento del consumo
privado per capita se calcula utilizando el metodo de minimos cuadrados.
En el consumo privado se incluyen los gastos de consumo de los
individuos, los hogares y las organizaciones no gubernamentales sin fines
de lucro. Se incluyen los gastos en alimentos, vestido, alquiler, servicios
de salud, educaci6n , transporte, y articulos de consumo duraderos.
La malnutricion se refiere al porcentaje de niiios menores de cinco
aiios cuyo peso para Ia edad se encuentra mas de dos desviaciones
estandar por debajo del promedio para Ia poblaci6n de referencia . Los
datos provienen del Subcomite de Nutrici6n del Comite Administrativo
de Coordinaci6n de las Naciones Unidas. La tasa neta de matricula de
mujeres en Ia escuela primaria es una comparacion entre el numero de
niiias en edad escolar oficial matriculadas en Ia escuela primaria y el
numero total de niiias en edad escolar oficial. Los datos sobre Ia
matricula provienen de Ia Organizaci6n de las Naciones Unidas para Ia
Educaci6n , Ia Ciencia y Ia Cultura. Las estimaciones sobre las mujeres
en Ia poblaci6n activa provienen de Ia Organizaci6n lnternacional del
Trabajo.
Medlo Amblente
La superficie terrestre es Ia superficie total de un pais, excluida Ia
parte del mismo cubierta por masas de agua continentales. Los
datos sobre Ia superficie terrestre y los bosques provienen de Ia
Organizaci6n de las Naciones Unidas para Ia Agricultura y Ia
Alimentaci6n. Las definiciones de lo que constituye una zona forestal
varian de un pais a otro.
Los datos sobre Ia energia provienen del Organismo lnternacional de
Energia y se refieren a las formas de esta que estan disponibles en el
mercado. lncluyen Ia energia producida por medio de combustibles renovables
y desechos. En Ia edici6n del presente aiio se adopta el PIB convertido a
d61ares internacionales utilizando las tasas de paridad del poder adquisitivo
(PPA) para obtener estimaciones comparables y coherentes del PIB en los
distintos paises.
2 2 0 00 World Bank Atlas
Los datos sobre el agua se basan en estimaciones del lnstituto de
Recursos Mundiales y se refieren al uso residencial, industrial y agricola
de este elemento. Los recursos de agua dulce disponibles se refieren
a los recursos internos renovables , e incluyen los nos que nacen en otros
paises. El uso del agua incluye el agua no renovable de los acuiferos y
Ia proveniente de las plantas de desalinizaci6n del agua de mar y, por
lo tanto, las cifras pueden ser mayores que las del total de recursos
renovables internos.
Las emisiones de dioxido de carbono comprenden las procedentes
de Ia quema de combustibles f6siles y Ia fabricaci6n de cemento. Los
datos sobre las emisiones provienen del Carbon Dioxide Information
Analysis Center.
Economia
El producto nacional bruto (PNB) es una medida amplia del desempeiio
de Ia economia de un pais; representa el valor total de los bienes y servicios
producidos por los residentes de un pais mas las entradas netas de ingreso
primario provenientes de no residentes. Los valores en dolares de EE.UU.
se obtienen a partir de las monedas nacionales aplicando un tipo de cambio
oficial medio ponderado correspondiente a tres aiios (el metodo del
Atlas). En el caso de los pocos paises en que el tipo de cambio oficial no
refleja el tipo real aplicado a las transacciones externas, se aplica otro
factor de conversi6n. La tasa de crecimiento del PNB per capita se calcula
a partir de datos en precios constantes en Ia moneda nacional utilizando
el metodo de minimos cuadrados. Los datos sobre las cuentas nacionales
y Ia inflaci6n provienen de los archivos de datos del Banco Mundial y de
Ia OCDE.
El PNB per capita en d61ares internacionales se convierte en funcion
de Ia paridad de poder adquisitivo (PPA). La PPA se define como el
numero de unidades de Ia moneda de un pais que se necesita para
datos del Banco Mundial y el Fondo Monetario lnternacional (FMI). L
datos sobre Ia deuda externa provienen del Sistema de notificaci6n
Ia deuda al Banco Mundial; dicha deuda es Ia contraida frente a entidad
no residentes yes reembolsable en moneda extranjera, bienes o servicic
La deuda externa total es Ia suma de Ia deuda publ ica y con garan·
publica a largo plazo, Ia deuda privada a largo plazo sin garantia,
utilizaci6n del credito del FMI y Ia deuda a corto plazo.
Estados y Mercados
La inversion privada, es decir, los gastos del sector privado en concep
de adiciones a los activos fijos , a menudo se calcula como el residt
de Ia inversi6n interna bruta menos Ia inversi6n publica consolidada. Est<
datos provienen de Ia Corporacion Financiera lnternacional ("Trends
Private Investment in Developing Countries 1999"). La capitalizacion d
mercado de valores corresponde al precio de las acciones al final d
periodo multiplicado por el numero de valores en circulaci6n en Ia bol~
de valores de cada pais. Estos datos provienen de Ia Base de Datos sob
Mercados Emergentes de Ia Corporaci6n Financiera lnternacional.
El deficit fiscal global es el ingreso corriente y el ingreso de capit
mas las donaciones oficiales menos los gastos y prestamos totales menc
los reembolsos. Estos datos provienen de los archivos de datos del Bane
Mundial y el FMI.
Los gastos militares en los paises miembros de Ia OTAN se bass
en Ia definicion de Ia OTAN, que cubre los gastos militares del ministeri
de defensa (incluidos el reclutamiento, el entrenamiento, Ia construcci6r
y Ia adquisicion de equipo y suministros militares) y otros ministerio~
Se excluyen los gastos del ministerio de defensa relativos al sector civi
La asistencia militar se incluye en los gastos del pais don ante y las compra
de equipo militar a credito se incluyen al momento en que Ia deuda e
contraida, no al momento del pago. Los datos sobre otros paise
comprar en el mercado nacionalla misma cantidad de bienes y servicios general mente incluyen los gastos del ministerio de defensa (excluido:
que se podria comprar con un dolar en Estados Unidos. Los datos de los gastos en seguridad y orden publicos, que se clasifican por separado;
1998 esttm basados en estudios realizados entre 1993 y 1996 o en Los datos sobre gasto militar provienen del U.S. Department of State ':
estimaciones de regresion. Los datos relativos a Ia PPA provienen del Bureau of Arms Control.
Programa de Comparacion lnternacional. El con sumo de electricidad es una medida de Ia producci6n de Ia:
La proporcion de Ia agricultura en el PIB se calcula en base a centrales de energia electrica y Ia producci6n combinada de Ia:
estimaciones del valor agregado de Ia agricultura. La proporci6n de Ia centrales termicas y las centrales de energia electrica menos Ia~
inversi6n en el PIB se basa en Ia inversion interna bruta (incluidos los perdidas de transmision y el propio uso de las centrales termicas y Ia~
cam bios en las existencias). La inflaci6n corresponde a las variaciones centrales de energia electrica. Carreteras pavimentadas son las qut
globales de los precios de todos los bienes y servicios incluidos en el estan recubiertas de piedra machacada (macadan) y un aglutinantE
PI B. Las tasas de crecimiento de Ia inflacion se han calculado utilizando hidrocarbonado o sustancias bituminadas con hormig6n, o con guijarros
el metodo de los minimos cuadrados. La balanza de cuenta corriente es Los datos sobre el consumo de electricidad provienen del Organismc
Ia suma de las exportaciones netas de bienes, servicios, ingreso y lnternacional de Energia; los relativos a las carreteras pavimentada~
transferencias corrientes; estos datos provienen de los archivos de se han tornado de Ia Federacion lnternacional de Carreteras. El numerc

le lineas telef6nicas principales por cada 1.000 personas indica Ia
lensidad de teletonos. Lineas telef6nicas principales son las que
:onectan el equipo del cliente a Ia red telef6nica publica conmutada.
.as estimaciones del numero de computadoras personales provienen
le un cuestionario anual preparado por Ia Uni6n lnternacional de
·elecomunicaciones (UIT) y son complementadas con datos de otras
uentes. Los datos sobre las lineas telef6nicas principales y las
;omputadoras personales provienen de Ia UIT.
ntegracl6n Mundlal
::1 intercambio de bienes y servicios en proporci6n del PIB es Ia suma de
as exportaciones e importaciones de bienes y servicios dividida por el PI B.
C:n las exportaciones manufacturadas se incluyen los productos quimicos,
oienes manufacturados basicos, y maquinaria y equipo de transporte, pero
se excluyen los metales no ferrosos. Los datos sobre comercio internacional
provienen del FMI y Ia Conferencia de las Naciones Unidas sobre Comercio
y Desarrollo. Los flujos netos de capital privado comprenden los flujos
privados de deuda y los no relacionados con esta. Los flujos privados de
deuda incluyen los prestamos, bonos y otros creditos privados de bancos
comerciales. Los flujos privados no relacionados con Ia deuda corresponden
a Ia inversi6n extranjera directa y a las inversiones de cartera en capital
accionario. La inversi6n extranjera directa corresponde a las afluencias netas
de inversi6n destinadas a adquirir un control duradero de Ia gesti6n (10%
o mas de las acciones con derecho a voto) en una empresa que lleva a
cabo sus operaciones en un pais que no es el pais del inversionista. Es
Ia suma del capital social, Ia reinversi6n de las utilidades, otros tipos de
capital a largo plazo y capital a cor to plazo tal como aparece en Ia balanza
de pagos. Los datos sobre flujos netos de capital privado provienen de los
archivos de datos del Banco Mundial y el FMI.
Los datos sobre Ia asistencia comprenden los flujos netos de recursos
en condiciones concesionarias de los paises miembros del Comite de
Asistencia para el Desarrollo de Ia OCDE, de organismos multilaterales de
desarrollo, y algunos paises arabes con destino a los paises en desarrollo.
Estos datos provienen de Ia OCDE. Los ingresos provenientes del turismo
internacional corresponden a los gastos incurridos por los visitantes
extranjeros que entran a un pais, incluidos los pagos a empresas nacionales
de transporte internacional. La llegada de turistas extranjeros es el numero
de visitantes que viajan a otro pais por un per'iodo inferior a un afio . Estos
datos provienen del FMI y Ia Organizaci6n Mundial de Turismo.
Para un examen mas detallado de los temas relacionados con Ia
calidad de los datos y los problemas de cuantificaci6n, veanse las
explicaciones sobre los datos contenidas en los correspondientes
cuadros de World Development Indicators 2000 o en el World Development
Indicators CO.ROM.
Nota
Los datos presentados corresponden a los paises segun estos estaban
constituidos en 1998, y los datos hist6ricos han sido corregidos para
indicar los sistemas politicos vigentes. Las excepciones se indican en
los cuadros, segun corresponda.
Ell de julio de 1997 China recuper6 el ejercicio de su soberania sobre
Hong Kong. El 20 de diciembre de 1999 China recuper6 el ejercicio de
su soberania sobre Macao. Salvo indicaci6n en contrario, en los datos
sobre China no se incluyen Hong Kong (China), Taiwan (China) ni Macao
(China).
Los datos correspondientes a Ia Republica Democratica del Congo
(Congo, Dem. Rep. en las listas de los cuadros) se refieren al ex Zaire.
Para mayor claridad, en esta edici6n se utiliza tambien el nombre oficial
de Ia Republica del Congo (Congo, Rep. en las listas de los cuadros).
En Ia medida de lo posible, se presentan datos por separado de los
paises que surgieron de Ia ex Checoslovaquia, a saber, Ia Republica Checa
y Ia Republica Eslovaca.
El 25 de octubre de 1999 Ia Administraci6n de Transici6n de las
Naciones Unidas para Timor Oriental (UNTAET) asumi6 Ia responsabilidad
de Ia administraci6n de Timor Oriental. En los datos sobre Indonesia se
incluye Timor Oriental.
Cuando ha sido posible, se han presentado datos relativos a Eritrea,
pero, hasta 1992, Ia informaci6n sobre esta se incluye en Ia de Etiopia.
Salvo indicaci6n en contrario, los datos correspondientes a Alemania
se refieren a Ia Alemania unificada.
Salvo indicaci6n en contrario, los datos relativos a Jordania se
refieren a Ia Ribera Oriental solamente.
En 1991, Ia Uni6n de Republicas Socialistas Sovieticas se dividi6
oficialmente en 15 paises (Armenia, Azerbaiyan, Belarus, Estonia,
Federaci6n de Rusia, Georgia, Kazajstan, Letonia, Lituania, Moldova,
Republica Kirguisa, Tayikistan, Turkmenistan, Ucrania y Uzbekistan). En
Ia medida de lo posible , se presentan datos por separado para cada
pais .
En diciembre de 1999 Venezuela adopt6 el nombre oficial de
Republica Bolivariana de Venezuela, y aparece en los cuadros como
"Venezuela , RB".
Los datos relativos a Ia Republica del Yemen se refieren a ese pais
a partir de 1990; los datos sobre afios anteriores corresponden a Ia ex
Republica Democratica Popular del Yemen y a Ia ex Republica Arabe del
Yemen, a menos que se indique otra cosa.
En Ia medida de lo posible, se presentan datos por separado de los
paises surgidos de Ia antigua Yugoslavia: Bosnia y Herzegovina, Croacia,
Ia ex Republica Yugoslava de Macedonia, Eslovenia, y Ia Republica
Federativa de Yugoslavia (Serbia y Montenegro).
-
NOTAS TECNI
Algunos de los graticos hacen referencia a las agrupaciones de
paises por regiones o por nivel de ingreso. Las medidas regionales
incluyen unicamente las economias de ingreso bajo y mediano, y estan
basadas en Ia composici6n regional por paises utilizada por el Banco
Mundial a efectos analiticos, que quiza no coincida con el uso geografico
comun (vease el mapa El mundo par regiones, al comienzo de esta
publicaci6n). En lo que se refiere a los grupos de ingreso, las economias
se agrupan segun su nivel de ingreso: bajo, mediano o alto. Economias
de ingreso bajo son las que tienen (1998) un PNB per capita de US$760
o menos. Economias de ingreso mediano son las que tienen un PNB per
capita de mas de US$760 y menos de US$9.361. La linea de separaci6n
entre las economias de ingreso mediano bajo y mediano alto es un PNB
per capita de US$3.030. Las economias de ingreso alto son las que tienen
un PNB per capita de US$9.361 o mas (vease el mapa Income per person
en Ia secci6n Economfa) .
2000 World Bank Atlas

Stock# Price Copies Subtotal
Subtotal
Shipping & Handling
Total US$
{Please Print)_)_}_}_}_}_}_} _} _} _} _} _} _} _} _} _} _} _} _} _} _} _} _} _}
~ _j_j_j_j_j_j_j_j_j_j_j_j_j_j_j_j_j_j_j_j_j_j_j_j_j_j_j
_j_j_j_j_j_j_j_j_j_j_j_j_j_j_j_j_j_j_j_j_j_j_j_j_j_j_j
I _j _} _j _j _j _j _j _j _j _j _j _j _j _j _j _j _j _j _j _j _j _j _} State _}_}
>stol Code_}_}_} _}_} Phone _} _} _}- _} _} _}- _} _} _} _} Ext. _} _} _} _} _}
j of Payment
>sed is my check drown on a U.S. bonk mode payable to the World Bonk
·ge my Q Visa Q MasterCard Q American Express
:ard Account Number _}_}_}_}_}_}_}_}_}_}_}_}_}_}_} Exp. Dote _}_} - _} _} 1
~--------------------------------------------------------------
I Customers in the U.S.: Complete this coupon and return to World Bonk Publications,
P.O . Box 960, Herndon, VA 20172-0960. To charge by credit cord call (800)645-7247
or (703) 661 -1580 or send this completed coupon via fox to (703) 661-1501 .
Customers outside the U.S.: Contact your local distributor for information on prices
I currency and payment terms. If no distributor is listed for your country, fox this order form to
nber above or moil it to World Bonk Publications, P.O. Box 960, Herndon, VA 20172-0960,
)ing and handling charges ore $8.00 per order. If a purchase order is used, actual
g will be charged. For air moil delivery outside the United States, charges ore $13 .00 for one
Js $6.00 for each additional item.
)ool customers in the U.S. only
e (purchase order must be included)
standing order
World Development Indicators 2000
This is the fourth annual edition of the World Bank 's f statistical reference World Development Indicators. Tt winning publication provides an expanded view of the economy for 148 countries--with chapters focusing o people, environment, economy, states and markets, a links, as well as introductions highlighting recent rese development issues. The 2000 edition includes some indicators for 1999.
April 2000. 416 pages. Stock no. 14553 (ISBN 0-8213-4553-2) $60.00
Also available on CD-ROM This comprehensive database contains underlying tim1 for the World Development Indicators and World Bank covering 1960-98 for most indicators and extending t• some. Powerful features allow you to generate maps c and download your results to other software programs
April 2000. Single-user version: stock no. 14554 (ISBN 0-8213-4554-0) $275.00 Network version: stock no. 14555 (ISBN 0.8213-4555-9) $550.00
This year the World Development Indicators is available a! combining the book and single-user CD-ROM. Stock no.: 3.1698. $295.00
World Bank Atlas 2000
One of the Bank's most popular offerings, the Atlas is c a companion to the World Development Indicators. Tabl1 and colorful maps address the development themes of people, environment, economy, states and markets, an< links. This easy-to-use book is an international standard statistical compilations and an ideal reference for office classroom . Text, maps, and references appear in Englisl and Spanish .
April 2000. 64 pages. Stock no. 14552 (ISBN 0-8213-4552-4) $20.00