public disclosure authorized - world...
TRANSCRIPT
Pub
lic D
iscl
osur
e A
utho
rized
Pub
lic D
iscl
osur
e A
utho
rized
Pub
lic D
iscl
osur
e A
utho
rized
Pub
lic D
iscl
osur
e A
utho
rized


Acknowledgements
The team is co-led by Roland Clarke (Program Leader), and Emmanuel Skoufias (Lead Economist). We would like to thank the members of the Brazil Systematic Country Diagnostic (SCD) core team: Magnus Lindelow (Program Leader), Pedro Olinto (Program Leader), Gregor Wolf (Program Leader), Paul Kriss (Program Leader), Paul Procee (Program Leader), Mark Dutz (Lead Economist), Antonio Nucifora (Lead Economist), Boris Utria (Country Operations Advisor), Candyce Rocha (Senior Communications Officer), Hector Gomez Ang (Country Manager), and Eduardo Wallentin (Senior Manager). The core team worked under the strategic guidance of two Country Directors (Deborah Wetzel and Martin Raiser) for which we are most grateful.
The task team leaders (TTLs) and the core team have relied extensively on the knowledge and inputs provided by colleagues from the Brazil Country Team from all the different Global Practices (GPs) and the International Finance Corporation (IFC) and we are all truly thankful for the help and support provided. The table below identifies the team members from the various GPs, who contributed their time, knowledge, and experience on Brazil for the preparation of this SCD:
The World Bank Group Team Team Members
Agriculture Diego Arias, Fatima Amazonas
Climate Change Christophe de Gouvello
Education Barbara Bruns, Rita Almeida, Michael Drabble, Leandro Costa, André Loureiro
Energy and Extractives Christophe de Gouvello
Environment and Natural Resources
Ernesto Sánchez Triana, Klas Sander, Bernadete Lange, Adriana Moreira
Finance and Markets Heinz Rudolph, Mark Dutz, Leyla Castillo, Bujana Perolli, Shanthi Divakaran, Ceyla Pazarbasioglu
Gender Miriam Muller, Renata Mayer Gukovas, Aude-Sophie Rodella
Governance Lorena Viñuela, Laura Zoratto, Etel Patricia Bereslawski, Miguel-Santiago da Silva Oliveira
Health Nutrition, and Population Tania Dmytraczenko, Ezaú Pontes, Magnus Lindelow
IFC Luciana Marchesini, Miguel Angel Rebolledo Dellepiane
Jobs Joana Silva, Rafael Prado Proença, Rita Almeida
Macroeconomics and Fiscal Management
Antonio Nucifora, Rafael Barroso, Edith Kikoni, Fabio Bittar, Cornelius Fleischhaker
MIGA Dan Biller, Jorge Rivas

The World Bank Group Team Team Members
Poverty and Equity Emmanuel Skoufias, Aude-Sophie Rodella, Martha Viveros, Renata Mayer Gukovas, Ali Sharman, Thiago Scot
Social Protection and Labor
Maria Concepcion Steta Gandara, Claudia Baddini, Anna Fruttero, Renata Mayer Gukovas
Trade and Competitiveness
Mark Dutz, Thomas Kenyon, Paulo Correa, Martha Licetti, Tanja Goodwin, Jean François Arvis, Julie Barbet-Gros, Daria Taglioni, Tom Farole, Erik van der Marel, Laura Dachner, Roberto Echandi, Doyle Gallegos, the WDR 2016 team, Pluvia Zuniga, Priyam Saraf, Marialisa Motta
Transport and ICT Georges Bianco Darido, Shomik Mehndiratta, Eric Lancelot, Bianca Bianchi Alves, Satoshi Ogita, Gregoir Gauthier, Alexandre Takahashi
Social, Urban, Rural and Resilience
Josef Lloyd Leitmann, Emanuela Monteiro, Catalina Marulanda, Andres Villaveces, Alberto Coelho Gomes Costa, Frederico Pedroso, Nancy Lozano Gracia
Water Martin Gambrill, Thadeu Abicalil, Erwin de Nys
The team is also very grateful to Flavia Nahmias and Mônica Porcidonio, for preparing the document, the bibliography and the logistics of the SCD. In addition, the following people have provided substantive inputs and guidance: Augusto de la Torre (Chief Economist) and peer reviewers: Indermit Gil (Director, DECDP), Bert Hofman (Country Director, EACCF), and Ana L. Revenga (Senior Director, GPVDR).
IBRDRegional Vice President: Jorge FamiliarCountry Director: Martin RaiserTask Managers: Roland Clarke and Emmanuel Skoufias
IFCVice President: Snezana Stoiljkovic Regional Director: Irene AriasTask Managers: Eduardo Wallentin and Luciana Marchesini
MIGAVice President: Karin FinkelstonDirector: Ravi VishManager: Dan Biller


Retaking the Path to Inclusion, Growth and Sustainability
Executive Summary


i
RETAKING THE PATH TO INCLUSION, GROWTH AND SUSTAINABILTY
1. Brazil is a vast country and its development prospects matter globally. A continental power, Brazil is the fifth largest country on earth (in both land area and population). It covers a vast territory containing the world’s largest rainforest (the Amazon) substantial freshwater resources, valuable agricultural land, and multiple minerals, metals and other natural capital. Its size gives it systemic importance from the environmental point of view as the lung of the earth and also has important consequences for the structure of the economy and political institutions. As with most large economies, it is relatively closed. This tendency has been strengthened by a historical focus on the domestic market as the driver of development. Another implication of Brazil’s size is a relatively high degree of decentralization in a federative structure, which increased further with the return to democracy in the mid-1980s.
2. Brazil’s prospects have attracted particular interest also because it historically was and remains today one of the world’s most unequal societies. Dating back to the original allocation of land during colonial times and more recently to the distribution of economic opportunities and access to basic social services, deep and persistent inequalities have characterized Brazil’s development path. The country’s size and historically high inequality have given debates about inclusive development paths particular resonance both in Brazil and well beyond the country’s borders. A continuously rising state footprint following re-democratization and strong ‘welfarist’ tradition in public policy have been consequences of policy makers’ efforts to address Brazil’s legacy of sharp socioeconomic inequalities.
3. Until the late-1990s, little progress was made in reducing income inequalities in Brazil, but in the past decade Brazil’s socioeconomic progress has been remarkable and internationally noted. From 2003, the country has become recognized for its success in reducing poverty and inequality and its ability to create jobs. Innovative and effective policies to reduce poverty and ensure the inclusion of previously excluded groups have lifted millions of people out of poverty. Nevertheless, even today, in Brazil 5 percent of the population receives 30 percent of the income generated (together with Colombia the highest proportion for any country in Latin America).
4. Brazil has also been assuming global responsibilities. It has been successful in pursuing economic prosperity while protecting its unique natural patrimony. Brazil has become one of the most important emerging new donors, with extensive engagements particularly in Sub-Saharan Africa, and a leading player in international climate negotiations. Brazil’s development path over the past decade has shown that growth with shared prosperity, but balanced with respect for the environment, is possible. Brazilians are rightly proud of these internationally recognized achievements.

ii
EXECUTIVE SUMMARY
5. However, the mood in Brazil has recently turned pessimistic. The shifts in the global economy following the world recession of 2008-2009, rising economic imbalances as the post-crisis stimulus was maintained too long, and in particular the end of the commodity super-cycle after 2011, have severely impacted Brazilian growth prospects, and, in 2015, the country entered recession. Falling government revenues accompanied by increasing expenditure pressures have led to a significant fiscal deficit, denting investor confidence. Administered price increases and one of the largest depreciations among emerging market currencies have driven up inflation, forcing the Central Bank to raise interest rates.
6. The bleak short-term economic outlook raises the risk that social and environmental achievements may not be sustained. Rising unemployment is likely to put pressure on lower-income households, rising inflation is eating into the real value of social transfers, while fiscal pressures accentuate spending trade-offs in the public sector. Economic difficulties also have the potential to sharpen conflicts over land and other natural resources, putting Brazil’s environmental achievements at risk. They may provoke an increase in urban crime and violence with negative social as well as economic consequences.
7. More fundamentally, the changed economic circumstances have exposed shortcomings in Brazil’s development model, epitomized by the struggle to achieve a sustainable fiscal policy. This report argues that the desire for a more inclusive state, after the return to democracy, led to a bias in favor of a large and increasing role for the public sector. Fiscal policy has been constrained by hardwired spending commitments and its sustainability risks being undermined by a burgeoning social security system, which provides substantial benefits to the non-poor. These commitments were affordable during a period of extraordinarily high commodity prices and relatively strong consumption-driven growth. They look unsustainable in the light of the recent shift in Brazil’s terms of trade and the country’s weak underlying growth potential, reflected in the poor track record of productivity growth and lagging performance on a range of indicators of external competitiveness.
8. Against this background, some Brazilians are now asking whether the gains of the past decade might have been an illusion, created by the commodity boom, but unsustainable in today’s less forgiving international environment. The answer provided in this Systematic Country Diagnostic (SCD) is a qualified ‘no’. There is no reason why the recent socioeconomic gains should be reversed; indeed, they might well be extended with the right policies. This will however require substantial shifts in Brazil’s growth model and its fiscal policies, as well as reforms and adjustments in successful policy dimensions such as, for instance, environmental and agricultural policies or social assistance programs. Brazil’s recent history contains several episodes of crises that gave rise to important economic and institutional reforms, which
iii
RETAKING THE PATH TO INCLUSION, GROWTH AND SUSTAINABILTY
alleviated previously binding constraints to further economic and social progress. It also contains several examples of creative policy design overcoming implementation bottlenecks, often through the careful collection of evidence and rigorous monitoring and evaluation (M&E). Another reason to be optimistic is that Brazil’s policy makers today operate in an environment of much stronger accountability because of the increasing role of independent control institutions, the growing strength of non-government actors and the rising aspirations and expectations of the new middle class.
9. Brazil thus finds itself at an important juncture and, to a certain extent, the policy course set today will determine whether the country can sustain the gains of the past and return to a path of solid, inclusive and environmentally sustainable growth. This SCD offers a contribution to the debate about Brazil’s future development. It abstains from formulating specific policy recommendations and rather focuses on highlighting the way in which Brazil’s development challenges and opportunities are closely interlinked. The causal chains identified by the analysis lead to a set of broad priorities, which can serve as background for discussion of concrete reform plans and policies, as well as their feasibility in a complex and fluid political environment. The remainder of this overview first presents the main causal chains traced in this SCD and explains the structure of the report, before providing a chapter-by-chapter summary of the main argument.
The determinants of poverty reduction and shared prosperity—the narrative of this SCD
10. The basic argument of this SCD is that Brazil needs to adjust its fiscal policy and its growth model if the country is to sustain the socioeconomic gains made over the past decade. The story of Brazil’s recent achievements is fundamentally a story of buoyant labor markets, declining wage inequality and progressive social policies, all supported by the boom in commodity prices that began around the turn of the millennium. It coincided with the successful macroeconomic stabilization Brazil achieved in the late 1990s, thus allowing the country to take full advantage of high commodity prices and abundant international liquidity. The improvement in the terms of trade facilitated rapid consumption growth without jeopardizing external balances. This in turn swelled public coffers thanks to a tax system built largely around indirect, consumption-linked taxes, and financed a substantial expansion in social transfers and improvements in access to a range of public services. Consumption-based growth and real exchange rate appreciation favored the domestic services industry, which accounted for the bulk of new employment creation disproportionately benefiting less-skilled workers. Rising formalization, improved social safety nets, and large increases in the minimum wage combined to push up the relative earnings of the less skilled and thus contributed to

iv
EXECUTIVE SUMMARY
falling earnings inequality. Abundant liquidity facilitated access to credit, including among households, thus further reinforcing the consumption-based growth dynamics.
11. By late 2015, the factors that drove socioeconomic progress in the past decade had mostly gone into reverse. International commodity prices have trended down since late 2012, with oil prices recently following suit, global liquidity conditions have tightened since May 2013 and December 2015 saw the first US Federal Funds Rate increase since 2006. Brazil, as most emerging markets, faces a much bleaker international outlook than at most times since the early 2000s. Strong fiscal and financial buffers allowed the country to react to the 2008-2009 global recession with countercyclical fiscal and monetary policies, but in the light of headwinds from the commodity and financial markets and weak underlying growth potential, such measures have failed to stem the gradual deceleration of Brazil’s economy since 2012 to face outright recession in 2015. Indeed, the maintenance of countercyclical policies in the light of the declining growth potential created growing macroeconomic imbalances during 2013 and 2014. As a result, the authorities were forced to correct policy; monetary policy tightened in 2013 and a difficult fiscal adjustment is now under way.
12. With the changed economic outlook, two fundamental weaknesses of Brazil’s economy have come to the fore. First, Brazil has struggled for several decades to generate strong and sustained productivity growth. This weakness is reflected, for instance, in the gradual decline of Brazil’s manufacturing capacity, the small share of high technology products in its own export basket, the bias in employment creation toward relatively low productivity services such as catering and home care, and consequently in the low rate of aggregate growth in gross domestic product (GDP) per worker and in total factor productivity. It is also mirrored in the wide dispersion of productivity levels across firms within industries, suggestive of substantial allocative inefficiencies. The underlying causes of Brazil’s productivity malaise are complex. They include a high cost of finance and doing business, the poor state of the country’s physical infrastructure, limits to competition resulting from domestic regulation as well as relatively high tariff and non-tariff barriers against exports, and muted incentives for innovation, including technology adaptation, due to a myriad of distortive or ineffective government interventions. Another structural constraint to higher productivity growth may lie with the inadequate skills of the labor force, despite the very substantial progress Brazil has made in providing greater access to education.
13. Stronger productivity growth alone will not generate inclusive growth. The hallmark of Brazil’s progress in shared prosperity over the past decade was the extent to which economic growth was reflected in fast job creation and declining earnings inequality. While improvements in the business and regulatory environment and greater public and private

v
RETAKING THE PATH TO INCLUSION, GROWTH AND SUSTAINABILTY
investment will clearly be critical to relaunch economic growth, how this growth translates into the creation of a sufficient number of good jobs for Brazil’s bottom 40 percent (B40) will be equally important. This SCD consequently pays significant attention to the dynamics of Brazil’s labor markets and to the opportunities available to the B40 and the assets at their disposal to avail of such opportunities. Without a return to growth and the adoption of a more sustainable, less commodity and less consumption-dependent growth model, improvements in living standards for the B40 will remain elusive. However, while growth is a necessary condition for shared prosperity, it is not sufficient. Policies that enhance economic opportunities, build human capital and resilience, and recognize the assets of the poor (including their claim over natural resources and land rights) deserve particular attention.
14. The second weakness in Brazil’s economic model is related to the sustainability of public spending commitments in the light of the economy’s underlying growth potential. Brazil’s public sector has continuously grown since the introduction of democracy in the mid-1980s. Fundamentally, this is related with spending commitments that were enshrined in Brazil’s 1988 Constitution and with the nature of the country’s fragmented politics, where access to government funds is a key incentive for building and sustaining political coalitions. The large claim of Brazil’s public sector on the country’s limited domestic savings has traditionally been a source of both macroeconomic instability, which Brazil finally overcame with the Plano Real and the fiscal adjustment of 1999, and a relatively high cost of capital, which remains a problem until today. In light of buoyant revenue performance, fiscal constraints lost some of their salience during the first decade of the 2000s but the substantial expansion of public spending after 2008 and the collapse in revenues since the sharp economic downturn in 2014–2015 have exposed Brazil’s underlying budget rigidities. Without fiscal adjustment, it seems, the country may be stuck with weak investor confidence, high interest rates in the light of concerns over macroeconomic imbalances, and as a result little impetus for a return to investment-driven growth. At the same time, the necessary fiscal adjustment is fraught with important distributional consequences, which may affect Brazil’s future prospects for continued inclusive economic development.
15. Addressing fiscal trade-offs will be critical for the ability of the public sector to redistribute resources (income and services) to the poor, within a sustainable fiscal and macroeconomic framework. The analysis in this SCD highlights that some of the largest public expenditure items in the social sphere benefit mostly the better-off, public pensions being an obvious example. In other areas, including health care or general education, there is ample scope for greater efficiency. Many budget subsidies to various economic sectors may even be harmful, by distorting competition, or may be wasted in poorly planned and executed investment projects. By reforming social security, reducing waste, abolishing inefficient subsidies, and reallocating resources to
vi
EXECUTIVE SUMMARY
those services mostly benefiting the B40, the necessary fiscal adjustment can be made consistent with further social progress. In this regard, particular attention should be placed on safeguarding and even expanding programs and services that protect the most vulnerable, such as women, Afrodescendants, and indigenous peoples, many of whom still suffer discrimination and are particularly subject to violence and insecurity, despite considerable government efforts in recent years, which have begun to bear fruit.
16. Beyond the structural conditions for future job creation and the quality of Brazil’s inevitable fiscal adjustment, the prospects of the B40 are also intrinsically linked with the country’s vast natural assets and its leadership in the global environmental agenda. Many of the poor and vulnerable depend on the natural environment for their livelihoods, such as small-scale agricultural producers, as indigenous communities whose lifestyles are dependent on the preservation of Brazil’s natural habitats, as well as urban dwellers exposed to pollution, water scarcity or power shortages, and the risks of natural disasters. The high population density and large numbers of poor in urban areas characterize the vulnerability to natural hazards in the country, largely driven by the suboptimal land use and planning that characterizes Brazilian cities. With much fewer means to protect or insure themselves against environmental risks, the poor and B40 are particularly affected by the degree to which government policy and regulation manages to balance the needs of economic development with the objective of environmental sustainability. This SCD shows that there is significant scope to reduce the burden of existing regulation and improve their environmental impact, for instance in the management of land and water resources. Indeed, Brazil has the opportunity to position itself as a leader in exploring green growth paths for emerging markets through innovative policy design. This has the potential to create new economic opportunities for the B40 and greatly increase their resilience against climate-related and other natural shocks.
17. The reforms required to preserve Brazil’s socioeconomic achievements and return the country to a sustainable growth path are challenging. Brazil rightly looks back at its recent progress in social inclusion with pride. Some in the country see a direct association with an expansive public sector and fear that regulatory reforms and spending cuts may unwind many of these gains. The analysis of this SCD points in a different direction. Brazil’s political institutions have required compromises that have swelled government commitments even at the cost of significant inefficiencies. In times of tight fiscal constraints, it may be time to review some of these compromises and generate a new consensus in favor of a more efficient, while still inclusive, economic and social model. Brazil’s own history suggests that a new policy consensus has emerged at times of crisis and allowed the country to overcome past institutional constraints to better public sector governance. In the late 1990s, repeated bouts of high inflation finally convinced the political class to establish a new set of institutions –

vii
RETAKING THE PATH TO INCLUSION, GROWTH AND SUSTAINABILTY
the macroeconomic tripod and the fiscal responsibility law – that guaranteed macroeconomic stability for the next 15 years. Likewise today, poor macroeconomic prospects, the decreasing public tolerance of the ‘old ways’ of political deal making, as well as growing pressure for improvements in the quality of services may create incentives for policy makers to align behind a coherent economic strategy and overcome the vested interests that have blocked reform to date. Brazil’s political establishment has already demonstrated leadership and vision in declaring ambitious climate objectives – a national consensus seems to be forming in favor of a future green growth model. All this is reason to be optimistic.
18. The structure of the SCD follows the argument in the previous paragraphs. Chapter 1 summarizes Brazil’s achievements in reducing poverty and boosting incomes of the B40, drawing up a profile of the poor and vulnerable, their main assets, access to markets and public services and susceptibility to various economic risks, as well as the effectiveness of government transfers. Chapter 2 looks at Brazil’s political institutions to get at the root of the country’s fiscal challenges. Chapter 3 examines the consequences of these fiscal challenges for macroeconomic management and traces the evolution of Brazil’s macroeconomic policy framework since the days of high inflation in the late 1980s. Chapter 4 deals with the structural reforms needed to raise the level and types of private investment required to increase productivity growth and competitiveness, with a particular focus on the role of infrastructure. Chapter 5 reviews the scope for efficiency enhancing and socially progressive reallocations of government expenditures. It also analyzes why some vertical government policies, such as the Programa Bolsa Família (PBF) conditional cash transfer (CCT) program, have been so successful, while others—in infrastructure, or in the area of education—have had a more mixed record. Chapter 6 looks at the challenges for improved environmental and natural resource management, and outlines the contours of a future green growth strategy for Brazil. Chapter 7 concludes the SCD and draws out the main constraints to Brazil’s development. In the remainder of this overview, we summarize the responses to the key questions in each chapter.
Who are the poor and bottom 40 percent in Brazil and how did they fare?
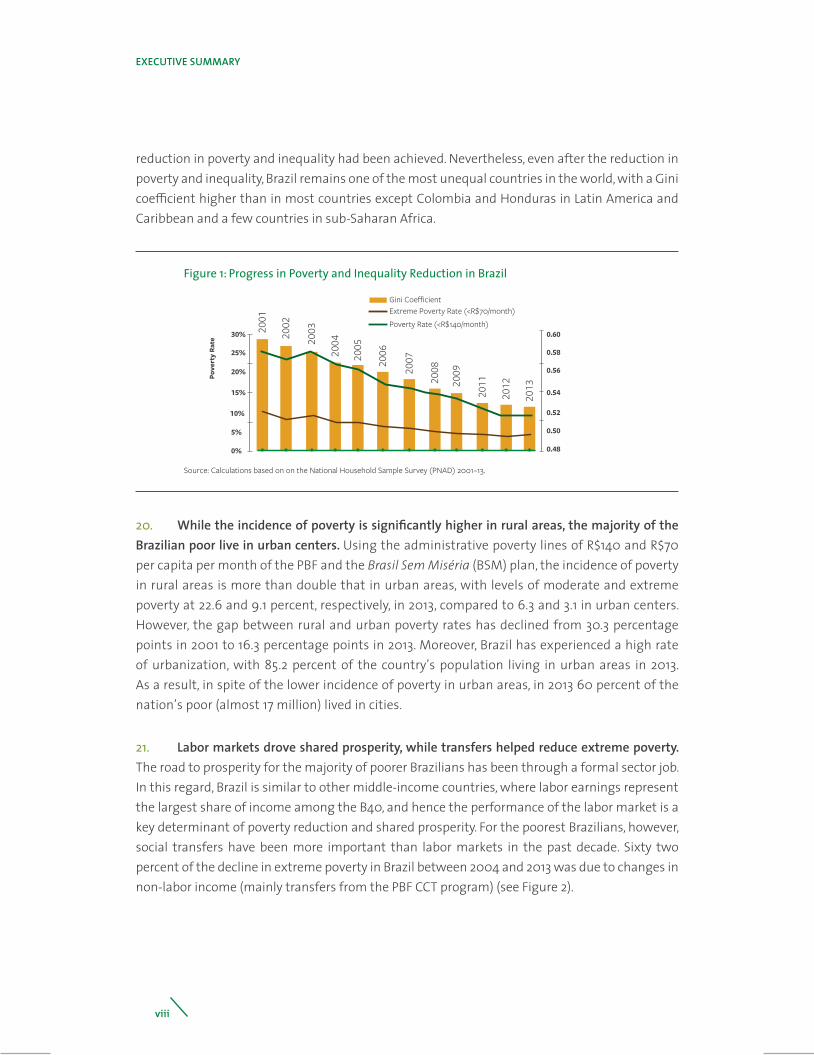
19. Between 2001 and 2013, 24.6 million Brazilians have escaped poverty, although Brazil remains one of the most unequal countries in the world. The reduction in poverty is an achievement of regional significance, representing almost 50 percent of the reduction in poverty in the whole Latin American and Caribbean (LAC) region (Figure 1). Brazil also experienced a rapid decline in inequality over the past decade, with the Gini coefficient of household incomes falling from 0.59 to 0.53. To a large extent, it was due to a policy of social inclusion in the context of a booming economy, fueled by favorable external conditions. Brazil’s achievements were also of historical significance, in that it was the first time in the history of Brazil that a sustained
viii
EXECUTIVE SUMMARY
reduction in poverty and inequality had been achieved. Nevertheless, even after the reduction in poverty and inequality, Brazil remains one of the most unequal countries in the world, with a Gini coefficient higher than in most countries except Colombia and Honduras in Latin America and Caribbean and a few countries in sub-Saharan Africa.
Source: Calculations based on on the National Household Sample Survey (PNAD) 2001–13.
2001
2002
2003
2004
2005
2006
2007
2008
2009
2011
2012
2013
30% 0.60
0.58
0.56
0.54
0.52
0.50
0.48
25%
20%
15%
10%
5%
0%
Pove
rty
Rate
Gini CoefficientExtreme Poverty Rate (<R$70/month)Poverty Rate (<R$140/month)
Figure 1: Progress in Poverty and Inequality Reduction in Brazil
20. While the incidence of poverty is significantly higher in rural areas, the majority of the Brazilian poor live in urban centers. Using the administrative poverty lines of R$140 and R$70 per capita per month of the PBF and the Brasil Sem Miséria (BSM) plan, the incidence of poverty in rural areas is more than double that in urban areas, with levels of moderate and extreme poverty at 22.6 and 9.1 percent, respectively, in 2013, compared to 6.3 and 3.1 in urban centers. However, the gap between rural and urban poverty rates has declined from 30.3 percentage points in 2001 to 16.3 percentage points in 2013. Moreover, Brazil has experienced a high rate of urbanization, with 85.2 percent of the country’s population living in urban areas in 2013. As a result, in spite of the lower incidence of poverty in urban areas, in 2013 60 percent of the nation’s poor (almost 17 million) lived in cities.
21. Labor markets drove shared prosperity, while transfers helped reduce extreme poverty. The road to prosperity for the majority of poorer Brazilians has been through a formal sector job. In this regard, Brazil is similar to other middle-income countries, where labor earnings represent the largest share of income among the B40, and hence the performance of the labor market is a key determinant of poverty reduction and shared prosperity. For the poorest Brazilians, however, social transfers have been more important than labor markets in the past decade. Sixty two percent of the decline in extreme poverty in Brazil between 2004 and 2013 was due to changes in non-labor income (mainly transfers from the PBF CCT program) (see Figure 2).

ix
RETAKING THE PATH TO INCLUSION, GROWTH AND SUSTAINABILTY
Gini
Share of Adults
Poverty R$140 Poverty R$70
Labor income Non labor income
0%
-10%
-20%
-30%
-40%
-50%
-60%
-70%
-20%
-41 %
-14%
-60 %
-26%
-6%
-32 %
-62 %
-39%
Source: Calculated from PNAD 2004-2013
Figure 2: Sources of Reductions in Poverty, Extreme Poverty and Inequality, 2004-2013
22. Brazil’s labor market over the past decade has combined rapid job creation and decreased informality with a considerable compression of the wage distribution. In many emerging markets and in developed economies, policy makers have faced a dilemma: either accept increasing wage inequality as the price to pay for low unemployment, or protect the relative incomes of those in employment but at the cost of increased joblessness or informality among the low-skilled. Brazil was able to avoid this policy dilemma over the period 2003-2013. The result has been a net job creation rate of close to 2 percent per year, and reduced levels of informality.
23. Favorable external conditions have played a critical role in shaping labor market outcomes in Brazil. The commodity price boom prompted significant real exchange rate appreciation and this in turn encouraged the growth of non-tradable domestic services. Rising job opportunities for low-skilled workers in these sectors led to rising incomes, which in turn fed back into growing demand for goods and services such as housing, durable goods, and retail or transportation. In the context of strong aggregate labor demand, the result was a remarkable reduction in the skills premium (Figure 3a).1 However, policy played a role too: widening access to education increased the supply of skills and thus helped lower the
1 A recent report Jobs, Wages and the Latin American Slowdown by de la Torre et al. (2015) notes a similar trend across Latin America. The reasons for declining skills premia are still not entirely understood but likely are not with differences in the skill intensities between tradable and non-tradeable sectors. Instead it seems patterns of demand during the boom were favorable to sectors employing less-skilled workers and the supply curve for less skilled workers seems to have become steeper. It is not clear that these trends are sustainable, raising concerns that the social gains of the past decade may be partially reversed in the coming years.

x
EXECUTIVE SUMMARY
premium, while aggressive increases in the minimum wage succeeded in shifting up the wage share in the economy as a whole. Rising unit labor costs, however, particularly in higher-skill intensive manufacturing, reduced competitiveness and precipitated a decline in profitability, further accentuating the shift towards lower-skill non-tradables (Figure 3b).
1.7
1.7
1.6
1.6
1.5
1.5
1.4
1.4
1.3
1.3
1.2
3.0
2.9
2.8
2.7
2.6
2.5
2.4
2.3
2.2
90
100
110
120
130
140
150
160
170
Source: LAC Equity Lab - Socioeconomic Database for Latin America and Carribean data (CEDLAS and World Bank) and Ipeadata. Note: Skill premium is defined as the ratio of average wages by skill level.
Sources: International Monetary Fund (IMF), Brazilian Institute of Geography and Statistics (IBGE), Inter-Union Department of Statistics and Socioeconomic Studies (DIEESE), World Bank.
1995
1996
1997
1998
1999
2001
2002
2003
2004
2005
2006
2007
2008
2009
2011
2012
2013
2003
2004
2005
2006
2007
2008
2009
2010
2011
2012
2013
2014
Secondary to Primary LHS
Tertiary to Secondary RHS
Labor Prod. (Y/L)
Min. wageAv. Wage
Figure 3: Wage Inequality Fell After 2003, as The Minimum Wage Increased Sharply
(3a) Skill Premium (3b) Productivity And Wages, Index, 2003=100
24. As commodity prices have slumped, it has become clear that the labor market drivers of poverty reduction and shared prosperity cannot be sustained without increasing productivity and investment. The real exchange rate has depreciated sharply, unemployment is increasing, and the decline in wage inequality may well start to go into reverse. Continued increases in the minimum wage are likely only to be compatible with macroeconomic stability in an environment of increasing productivity. In other words, Brazil will need a different growth model to sustain past gains. This will require a new political consensus to support the necessary fiscal and structural reforms. It is therefore important to understand the underlying institutional factors that have shaped the evolution of public policy in Brazil and how they may affect the hard choices Brazil faces today.

xi
RETAKING THE PATH TO INCLUSION, GROWTH AND SUSTAINABILTY
How do Brazil’s political institutions affect the design and implementation of public policy?
25. The reintroduction of democracy in Brazil in 1985 came with the recognition that the huge inequalities of the past were unacceptable and unsustainable and that an inclusive development path was required. Brazil’s socioeconomic history is marked by persistent and huge inequality, between land-owners and slaves, between educated elites and illiterate masses, between privileged and non-privileged business groups, and between the wealthy South and the less developed North and Northeast of the country. The 1988 Constitution sought to redress this legacy and repay the accumulated ‘social debt’. Brazil’s economic institutions in the past three decades have therefore assumed a distinctly ‘welfarist’ orientation, with significant social entitlements enshrined in basic legislation. At the same time, however, the Constitution did not ignore the interests of the still-powerful traditional elites, and the need to balance subnational and national interests in a continent-sized country. The result was a compromise whereby the traditional elites were convinced to share power through generous public sector handouts and a complex system of checks and balances. Thus the political settlement had an important role in setting the course of fiscal policy over the next three decades.
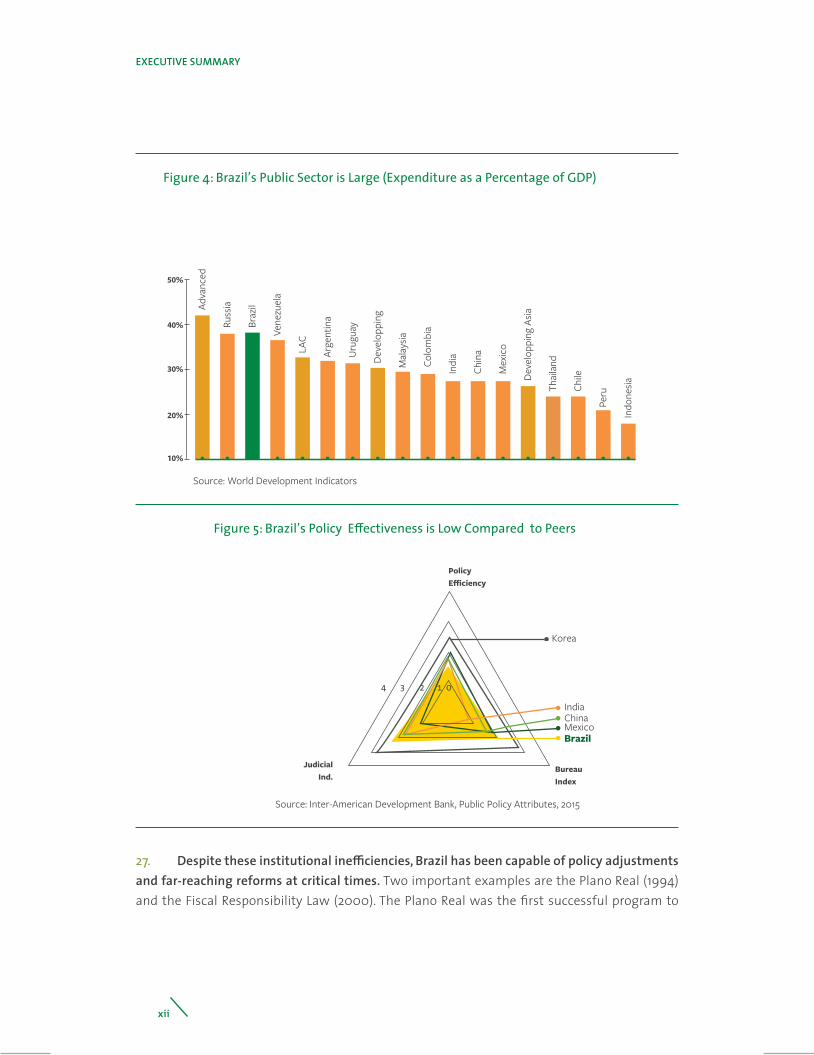
26. Expenditure pressures and difficulties in formulating and implementing policy have been exacerbated by a highly fragmented political setup, and a decentralized federation. Few other countries have more parties represented in parliament and more complex coalitions—the current government, for instance, relies on no less than 13 parties for support in Congress. To this must be added the considerable influence of subnational governments in both the Senate and the Chamber of Deputies, through their state-level political machines, which ensure that the loyalty of deputies to the governors and the states is often stronger than that to their parties. The result is a high degree of political fragmentation. Traditionally, political leaders have forged the necessary deals through the allocation of senior positions in the government (Brazil’s cabinet is one of the largest in the world, with currently 31 ministers and 39 before October 2015) and through a large number of budget amendments in favor of specific regional interests. The consequence has been a large public footprint (Figure 4) and considerable inefficiencies in the formulation and implementation of policy priorities (Figure 5).
xii
EXECUTIVE SUMMARY
Source: World Development Indicators
Adva
nced
Russ
ia
Braz
il
Vene
zuel
a
LAC
Arge
ntin
a
Urug
uay
Dev
elop
ping
Mal
aysia
Colo
mbi
a
Indi
a
Chin
a
Mex
ico
Dev
elop
ping
Asia
Thai
land
Chile
Peru
Indo
nesia
50%
40%
30%
20%
10%
Figure 4: Brazil’s Public Sector is Large (Expenditure as a Percentage of GDP)
4 3 2 1 0
Korea
IndiaChinaMexicoBrazil
PolicyEfficiency
JudicialInd.
BureauIndex
Source: Inter-American Development Bank, Public Policy Attributes, 2015
Figure 5: Brazil’s Policy Effectiveness is Low Compared to Peers
27. Despite these institutional inefficiencies, Brazil has been capable of policy adjustments and far-reaching reforms at critical times. Two important examples are the Plano Real (1994) and the Fiscal Responsibility Law (2000). The Plano Real was the first successful program to

xiii
RETAKING THE PATH TO INCLUSION, GROWTH AND SUSTAINABILTY
reduce Brazil’s chronically high inflation rate. The Constitution was amended to ensure that fiscal policy was aligned in support of monetary policy objectives. After the emerging market crises of the late 1990s, the exchange rate was allowed to float and an inflation-targeting regime was adopted. Combined with prudent fiscal policy, the floating exchange rate regime and the adoption of an inflation target formed the ‘macroeconomic tripod’. In this context, the Fiscal Responsibility Law changed the framework for intergovernmental fiscal relations to make it consistent with the overall sustainability of public finances. The result was more than a decade of relative macroeconomic stability and significant economic and social progress.
28. Brazil’s recent experience also shows that institutional deficiencies can be overcome with good policy design to achieve tremendous development results. The best example of a well-designed policy is the Bolsa Família (PBF), a CCT program to poor families that has not only contributed in a major way to directly reduce poverty, but also improved the access of beneficiaries to basic services, such as public education and social security. Key elements of success of the PBF, which have now been extended into an integrated poverty reduction program – Brasil Sem Miséria – were: (a) a clear objective, (b) an evidence based design, and (c) rigorous Monitoring and Evaluation (M&E). This contains important lessons for other government flagship programs, such as for instance the accelerated growth program (PAC) aiming to encourage more investment in infrastructure. While the PAC clearly satisfies the first condition of success, its record on evidence-based design and M&E is mixed. Brazil will need once more to draw on its capacity to generate institutional innovations at critical times to support critical fiscal and structural reforms needed to put the country back on a sustainable and inclusive growth path.
What adjustments are needed to Brazil’s macroeconomic and fiscal framework to safeguard stability and lay the foundations for a return to sustained growth?
29. In the late 1980s and early 1990s, the macroeconomic landscape was dominated by an unsustainable fiscal deficit, instability, hyperinflation, an extraordinarily high cost of capital and low savings and investment rates. High inflation reflected the fiscal consequences of unresolved distributional conflicts, while the high cost of capital was a consequence of measures to protect financial wealth in times of macroeconomic instability and prevent capital flight. Both public and private savings have historically been low. The Plano Real of 1994 and the subsequent fiscal reforms of the late 1990s managed to bring inflation under control and restore macroeconomic balance, but these reforms did not address the underlying structural problems of chronically low savings, high capital costs and an increasingly overextended and rigid public sector.
xiv
EXECUTIVE SUMMARY
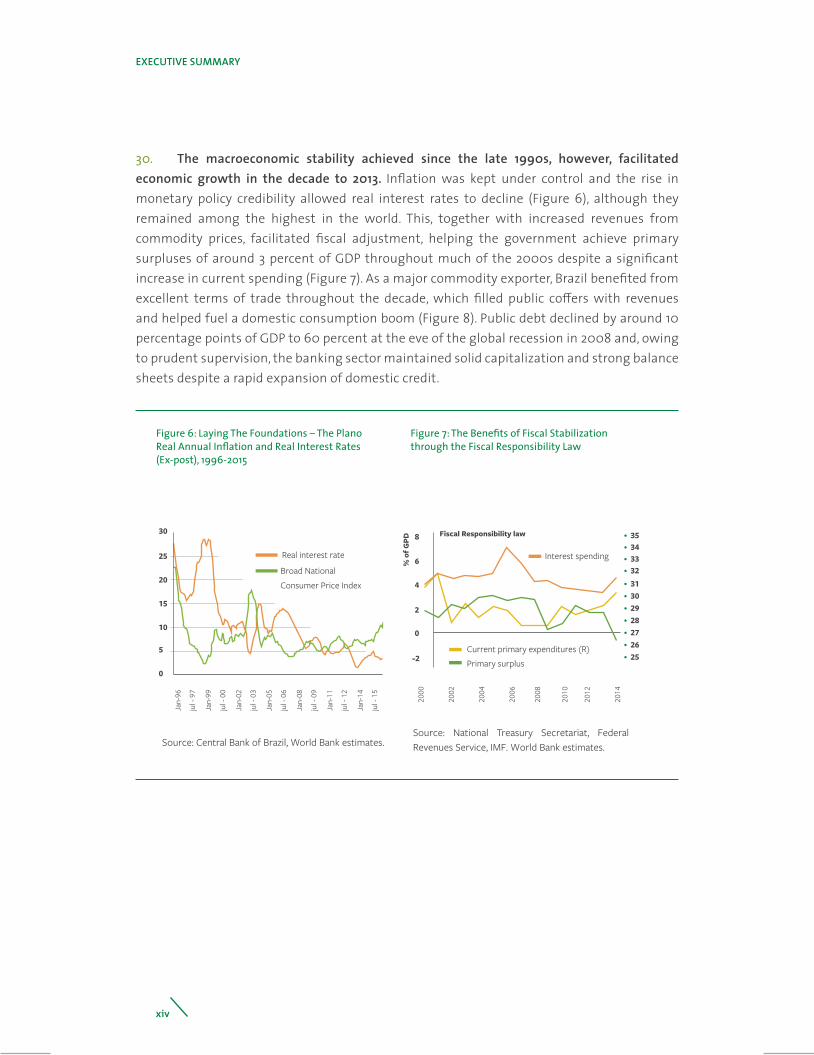
30. The macroeconomic stability achieved since the late 1990s, however, facilitatedeconomic growth in the decade to 2013. Inflation was kept under control and the rise inmonetary policy credibility allowed real interest rates to decline (Figure 6), although theyremained among the highest in the world. This, together with increased revenues fromcommodity prices, facilitated fiscal adjustment, helping the government achieve primarysurpluses of around 3 percent of GDP throughout much of the 2000s despite a significantincrease in current spending (Figure 7). As a major commodity exporter, Brazil benefited fromexcellent terms of trade throughout the decade, which filled public coffers with revenuesand helped fuel a domestic consumption boom (Figure 8). Public debt declined by around 10percentage points of GDP to 60 percent at the eve of the global recession in 2008 and, owingto prudent supervision, the banking sector maintained solid capitalization and strong balance sheets despite a rapid expansion of domestic credit.
Real interest rate
30
25
20
15
100
-2
2
4
6
8 35Fiscal Responsibility law
5
0
Broad National
Consumer Price Index
% o
f GPD
Primary surplusCurrent primary expenditures (R)
Interest spending
Jan-
96
jul -
97
Jan-
99
jul -
00
Jan-
02
jul -
03
Jan-
05
jul -
06
Jan-
08
jul -
09
Jan-
11
jul -
12
Jan-
14
jul -
15
2000
2002
2004
2006
2008
2010
2012
2014
34333231302928272625
Source: Central Bank of Brazil, World Bank estimates.Source: National Treasury Secretariat, Federal Revenues Service, IMF. World Bank estimates.
Figure 6: Laying The Foundations – The Plano Real Annual Inflation and Real Interest Rates (Ex-post), 1996-2015
Figure 7: The Benefits of Fiscal Stabilization through the Fiscal Responsibility Law

xv
RETAKING THE PATH TO INCLUSION, GROWTH AND SUSTAINABILTY
%10
8
6
4
2
0
-2
-4
Net Exports-6
Priv. Consumption Gov. Consumption Investments YoY Growth
2015
*
1997
1998
1999
2001
2002
2003
2004
2005
2006
2007
2008
2009
2010
2011
2012
2014
201320
00
Sources: IBGE and World Bank calculations. * Four quarters to third quarter of 2015
Figure 8: Consumption Driven Growth
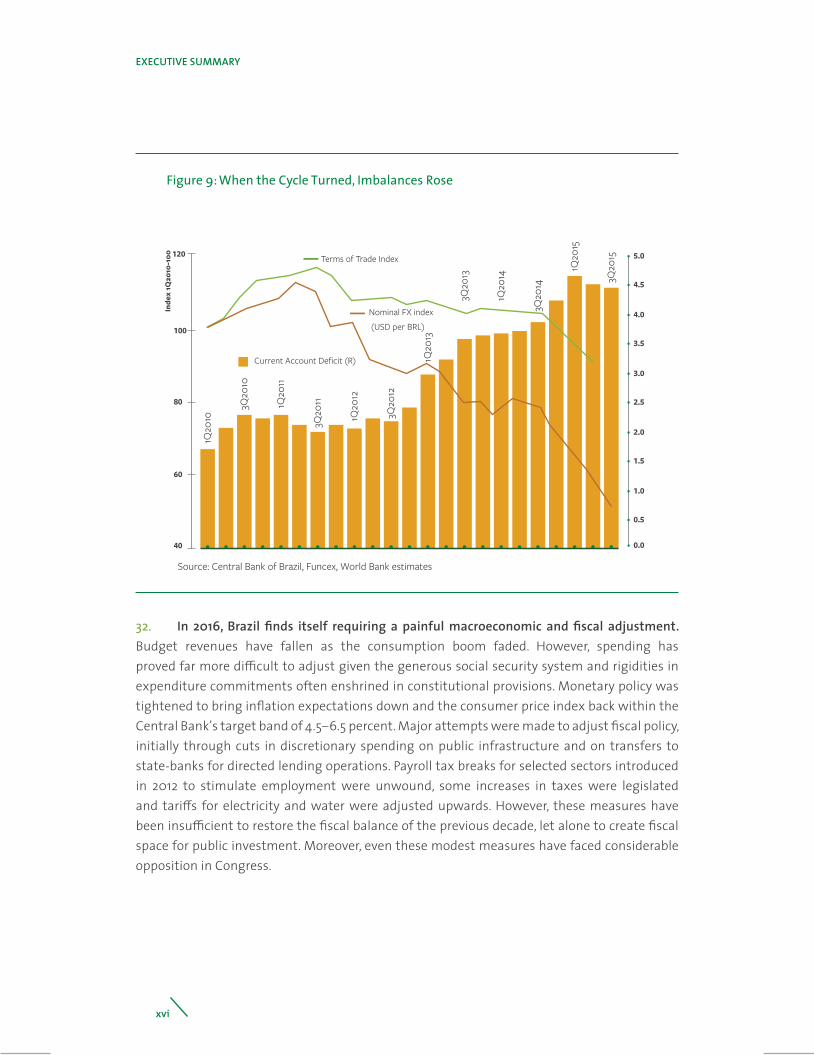
31. Solid fiscal and foreign exchange buffers thus gave Brazil the room to respond to the global recession and recover fast, but were unable to cushion a permanent reduction in the terms of trade, or deal with pre-existing structural constraints. Fueled by a combination of tax breaks and a rapid increase of ‘directed’ credit through the public banks, growth in 2010 bounced back to 7.6 percent. External conditions helped as commodity prices stayed strong in the initial post-recession years and global monetary stimulus led to huge capital inflows into emerging markets, including Brazil. In addition, monetary policy was highly accommodative, with— between 2011 and mid-2013—record low interest rates. However, the fiscal and monetary stimulus could not deal with what was to be a permanent downturn in the terms of trade. Thus, inflationary pressures started to build while growth slowed in the face of the preexisting structural constraints, and the economy became increasingly unbalanced. When the commodity cycle turned and the US Federal Reserve announced the ‘tapering’ of extraordinary bond purchases, Brazil was left exposed to shifting investor sentiment (Figure 9). Consequently, the Real lost more than half of its value against the U.S. dollar between 2011 and the end of 2015, forcing interest rates back up to 14.25 percent. The economy came to a halt, while inflation rose rapidly.
xvi
EXECUTIVE SUMMARY
Nominal FX index
(USD per BRL)
Current Account Deficit (R)
Terms of Trade Index
Source: Central Bank of Brazil, Funcex, World Bank estimates
1Q20
10
Inde
x 1Q
2010
-100
3Q20
10
1Q20
11
3Q20
11
1Q20
12
3Q20
12
1Q20
13
3Q20
13
1Q20
14
3Q20
14
1Q20
15
3Q20
15
40
60
80
100
120
0.5
0.0
1.0
1.5
2.0
2.5
3.0
3.5
4.0
4.5
5.0
Figure 9: When the Cycle Turned, Imbalances Rose
32. In 2016, Brazil finds itself requiring a painful macroeconomic and fiscal adjustment. Budget revenues have fallen as the consumption boom faded. However, spending has proved far more difficult to adjust given the generous social security system and rigidities in expenditure commitments often enshrined in constitutional provisions. Monetary policy was tightened to bring inflation expectations down and the consumer price index back within the Central Bank’s target band of 4.5–6.5 percent. Major attempts were made to adjust fiscal policy, initially through cuts in discretionary spending on public infrastructure and on transfers to state-banks for directed lending operations. Payroll tax breaks for selected sectors introduced in 2012 to stimulate employment were unwound, some increases in taxes were legislated and tariffs for electricity and water were adjusted upwards. However, these measures have been insufficient to restore the fiscal balance of the previous decade, let alone to create fiscal space for public investment. Moreover, even these modest measures have faced considerable opposition in Congress.
xvii
RETAKING THE PATH TO INCLUSION, GROWTH AND SUSTAINABILTY
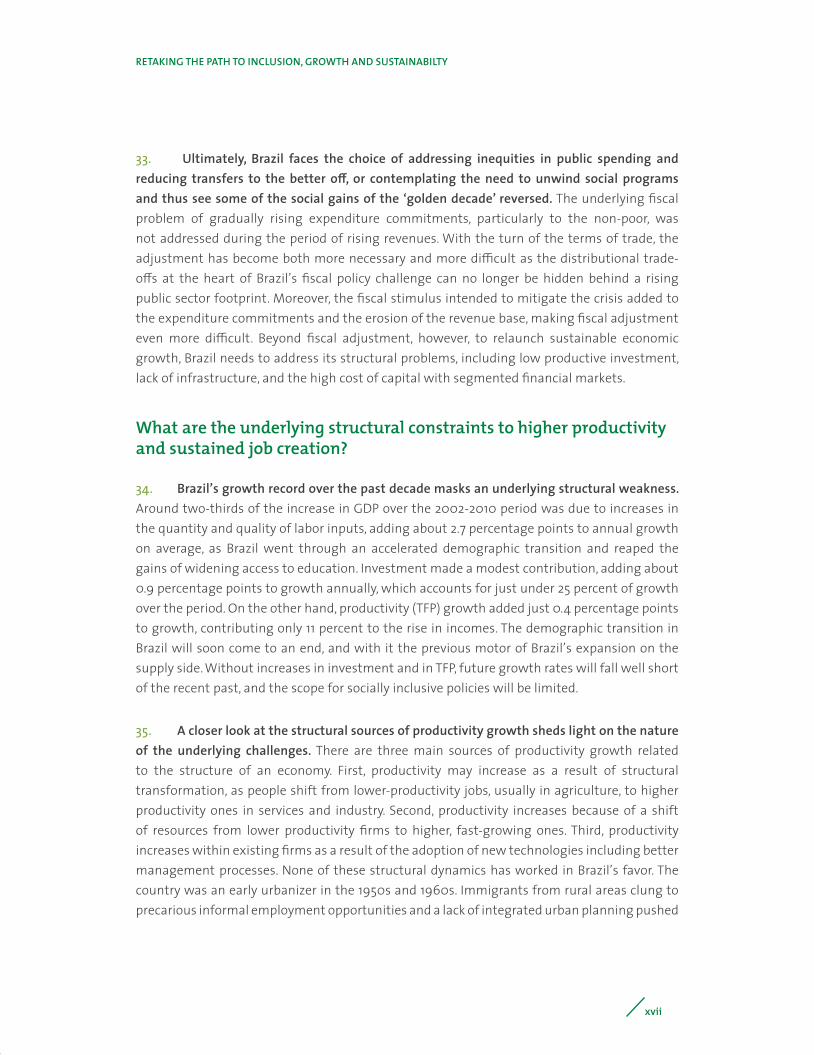
33. Ultimately, Brazil faces the choice of addressing inequities in public spending and reducing transfers to the better off, or contemplating the need to unwind social programs and thus see some of the social gains of the ‘golden decade’ reversed. The underlying fiscal problem of gradually rising expenditure commitments, particularly to the non-poor, was not addressed during the period of rising revenues. With the turn of the terms of trade, the adjustment has become both more necessary and more difficult as the distributional trade-offs at the heart of Brazil’s fiscal policy challenge can no longer be hidden behind a rising public sector footprint. Moreover, the fiscal stimulus intended to mitigate the crisis added to the expenditure commitments and the erosion of the revenue base, making fiscal adjustment even more difficult. Beyond fiscal adjustment, however, to relaunch sustainable economic growth, Brazil needs to address its structural problems, including low productive investment, lack of infrastructure, and the high cost of capital with segmented financial markets.
What are the underlying structural constraints to higher productivity and sustained job creation?
34. Brazil’s growth record over the past decade masks an underlying structural weakness. Around two-thirds of the increase in GDP over the 2002-2010 period was due to increases in the quantity and quality of labor inputs, adding about 2.7 percentage points to annual growth on average, as Brazil went through an accelerated demographic transition and reaped the gains of widening access to education. Investment made a modest contribution, adding about 0.9 percentage points to growth annually, which accounts for just under 25 percent of growth over the period. On the other hand, productivity (TFP) growth added just 0.4 percentage points to growth, contributing only 11 percent to the rise in incomes. The demographic transition in Brazil will soon come to an end, and with it the previous motor of Brazil’s expansion on the supply side. Without increases in investment and in TFP, future growth rates will fall well short of the recent past, and the scope for socially inclusive policies will be limited.
35. A closer look at the structural sources of productivity growth sheds light on the nature of the underlying challenges. There are three main sources of productivity growth related to the structure of an economy. First, productivity may increase as a result of structural transformation, as people shift from lower-productivity jobs, usually in agriculture, to higher productivity ones in services and industry. Second, productivity increases because of a shift of resources from lower productivity firms to higher, fast-growing ones. Third, productivity increases within existing firms as a result of the adoption of new technologies including better management processes. None of these structural dynamics has worked in Brazil’s favor. The country was an early urbanizer in the 1950s and 1960s. Immigrants from rural areas clung to precarious informal employment opportunities and a lack of integrated urban planning pushed

xviii
EXECUTIVE SUMMARY
them into settling in Favelas that sprung up in all major Brazilian cities, where they remained cut-off from the provision of better quality public services. The pattern of consumption and non-tradable intensive growth over the past decade has brought many urban dwellers into formal sector jobs, but this has not led to major increases in aggregate productivity. Between 2000 and 2013, most jobs were created in services subsectors where productivity was flat, some in industry and construction where it declined, while jobs were lost in agriculture, which was the only sector experiencing increasing productivity (Figure 10). As a result, aggregate GDP per worker rose merely 1.3 percent per year from 2000 to 2013, and even during the boom years of 2003–2010, did not exceed 2 percent.
Services Agriculture Industry
Employment Growth
Productivity Growth
41.5%
11.7%
105.6%
-5.5%
50.8%
Source: IBGE, World Bank estimates. -19.6%
Figure 10: Too Few Productivity Gains from Structural Change, 2000-2013
36. Brazil has a few outstanding and internationally recognized enterprises, but for every top performer (such as Embraer), there is a myriad of poorly performing companies that reduce overall productivity. The variation in productivity levels in Brazil is higher than in most of its peers. Interestingly, this pattern is mirrored in the dispersion of management quality across Brazilian firms. Wide disparities in productivity levels and management performance across firms are an indication that competitive pressures do not work well: poor performers survive and good performers fail to attract additional resources. Also most firms are globally isolated and fail to learn from evolving global technologies.
37. Indeed, there is a host of obstacles to market integration and competition in Brazil, including a lack of infrastructure, a large economy relatively closed to external competition, a heavy bureaucratic burden, and a segmented financial market with very high interest rates. First, competition suffers from the poor state of Brazil’s infrastructure, in particular in the area of transport and logistics. This is particularly important given the continental size of Brazil. Not

xix
RETAKING THE PATH TO INCLUSION, GROWTH AND SUSTAINABILTY
only does poor transport and logistic infrastructure reduce the competitiveness of Brazilian producers in global markets, it also reduces the level of economic integration across regions in Brazil, allowing wide differences in productivity and income levels to persist across states. Second, Brazil’s business environment is burdened by heavy regulation. For instance, it takes 83.6 days to open a new business in Brazil, compared to 6.3 days in Mexico and 4 days in the Republic of Korea. Because the cost of entry and operation is high, entrepreneurship is stifled, and incumbents have an advantage over new competitors. Third, Brazil also limits competition and learning opportunities from abroad by maintaining one of the highest rates of effective protection among emerging markets and industrialized countries. High tariffs on imports of intermediates and capital goods mean that in some sectors the effective rate of protection of some domestic producers is in triple digits.
38. A final critical barrier to competition and investment in Brazil is a segmented financial system characterized by significant policy discretion in the allocation of credit. The current arrangements are both a cause and a consequence of Brazil’s historically high cost of capital. Given high market interest rates, the government has attempted to stimulate private investment through directed credits at below-market rates, administered both through state-owned banks and through a series of earmarked credit schemes run by private commercial banks. This led to a sharp increase in the market share of public banks, from 30 to about 55 percent, during 2010–2014. Borrowers that do not have access to directed credits in turn pay high interest rates (real rates of over 15 percent for corporates and 50 percent for households, on average) if they are not priced out of the market altogether. Indeed, the credit market has bifurcated further since the crisis. Directed credit—either granted by state-owned banks or channeled through the large private banks—increased from 35 to 55 percent of total credit to the domestic private sector during 2008-2015 (see Figure 11). The final verdict is not out on the impact of Brazil’s financial sector policies on enterprise productivity, and as a result on their overall costs and benefits. However, they may have reduced the effectiveness of monetary policy by making a substantial share of credit allocation insensitive to changes in the policy rate and they carry significant fiscal costs, which may limit their scope in the future, in the light of the reduced fiscal space.

xx
EXECUTIVE SUMMARY
Selic
05
15
25
35
10
20
30
40
0
5
10
15
20
25
30
Mar
- 11
Jul -
11
Nov
- 11
Mar
- 12
Jul -
12
Nov
- 12
Mar
- 13
Jul -
13
Nov
- 13
Mar
- 14
Jul -
14
Nov
- 14
Mar
- 15
Jul -
15
Source: Central Bank of BrazilSource: Central Bank of Brazil
Earmarked
Nonearmarked Nonearmarked
Earmarked
Mar
- 07
Oct
- 07
May
- 08
Dec
- 08
Jul -
09
Feb
- 10
Sep
- 10
Apr -
11
Nov
- 11
Jun
- 12
Jan
- 13
Aug
- 13
Mar
- 14
Oct
- 14
May
- 15
Figure 11: Directed Credits Increased Post-crisis But With Limited Impact On Investment And Productivity
(11a): Real Interest Rates on New Earmarked and Non-earmarked Credits, Percentages, 2011–15
(11b): Stocks of Earmarked and Non-earmarked Credit to the Private Sector, Percentages of GDP, 2007–15
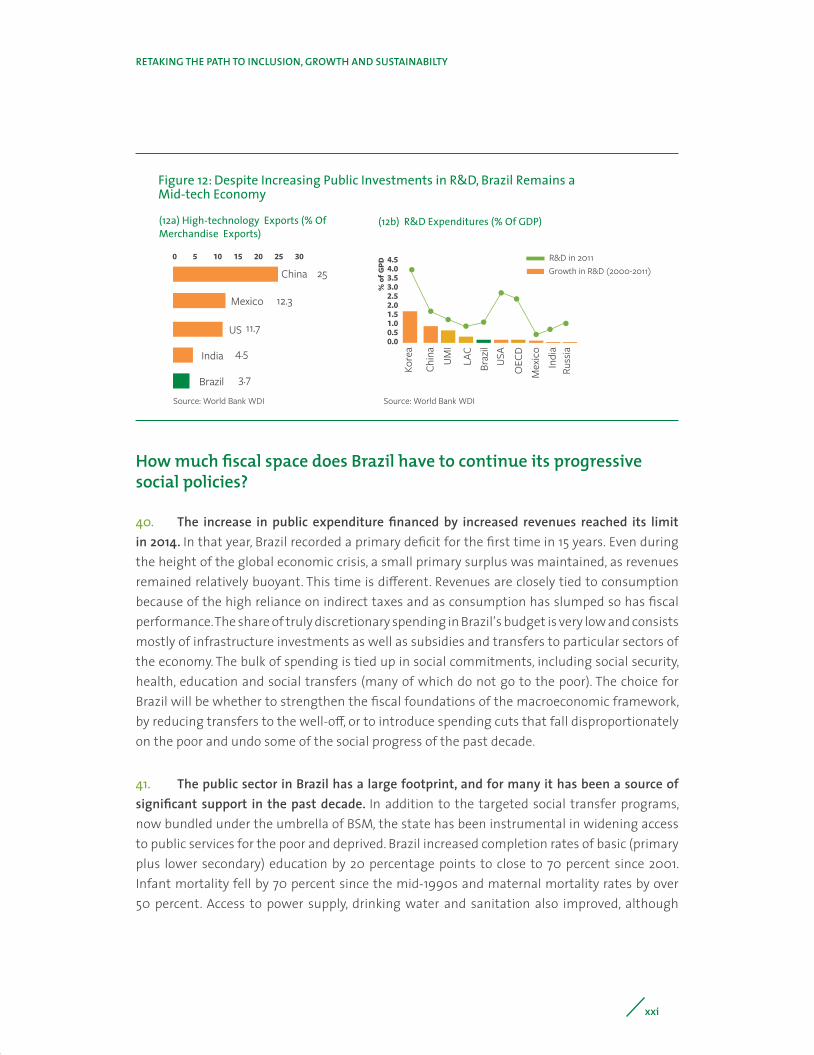
39. Competitive pressures are one key determinant of innovation and productivity upgrading at the firm level. In emerging markets such as Brazil, much innovation is ‘catch-up’ innovation, whereby firms adapt international technologies and processes to local conditions. In the absence of competition, particularly from abroad, however, the incentives for firms to remain connected to the international technological frontier are limited. A smaller share of Brazilian firms than in middle-income and Organization for Economic Cooperation and Development (OECD) peers regularly implement process or product innovations according to World Bank enterprise surveys. In addition, Brazil’s percentage of high technology exports is relatively low compared to peers (Figure 12a). Government efforts in recent years have yielded success in improving the supply of science and technology inputs—Brazil produces many more PhDs than a decade ago and government spends more than many other middle-income countries on research and development (R&D) (Figure 12b). However, these efforts have yet to translate into higher innovation by Brazilian companies. The lack of competitive pressure may be one reason. A dearth of workers with the necessary skills to successfully operate new technologies may be another. Public policy thus may need to go beyond public funding of scientific research and state handouts to support firm-level innovation. Public policy will also need to support citizens to benefit from the opportunities generated by a dynamic and competitive market economy, and protect the poor against economic volatility, structural adjustment and natural risks.
xxi
RETAKING THE PATH TO INCLUSION, GROWTH AND SUSTAINABILTY
Source: World Bank WDI Source: World Bank WDI
25China
12.3Mexico
11.7US
4.5India
3.7Brazil
Growth in R&D (2000-2011)
% o
f GPD
R&D in 2011
Kore
a
Chin
a
UMI
LAC
OEC
D
Braz
ilUS
A
Mex
ico
Indi
aRu
ssia
4.50 5 10 15 20 25 304.03.53.02.52.01.51.00.50.0
Figure 12: Despite Increasing Public Investments in R&D, Brazil Remains a Mid-tech Economy
(12a) High-technology Exports (% Of Merchandise Exports)
(12b) R&D Expenditures (% Of GDP)
How much fiscal space does Brazil have to continue its progressive social policies?
40. The increase in public expenditure financed by increased revenues reached its limit in 2014. In that year, Brazil recorded a primary deficit for the first time in 15 years. Even during the height of the global economic crisis, a small primary surplus was maintained, as revenues remained relatively buoyant. This time is different. Revenues are closely tied to consumption because of the high reliance on indirect taxes and as consumption has slumped so has fiscal performance. The share of truly discretionary spending in Brazil’s budget is very low and consists mostly of infrastructure investments as well as subsidies and transfers to particular sectors of the economy. The bulk of spending is tied up in social commitments, including social security, health, education and social transfers (many of which do not go to the poor). The choice for Brazil will be whether to strengthen the fiscal foundations of the macroeconomic framework, by reducing transfers to the well-off, or to introduce spending cuts that fall disproportionately on the poor and undo some of the social progress of the past decade.
41. The public sector in Brazil has a large footprint, and for many it has been a source of significant support in the past decade. In addition to the targeted social transfer programs, now bundled under the umbrella of BSM, the state has been instrumental in widening access to public services for the poor and deprived. Brazil increased completion rates of basic (primary plus lower secondary) education by 20 percentage points to close to 70 percent since 2001. Infant mortality fell by 70 percent since the mid-1990s and maternal mortality rates by over 50 percent. Access to power supply, drinking water and sanitation also improved, although

xxii
EXECUTIVE SUMMARY
important gaps remain among the poor in the latter area. As a consequence of these important achievements, Brazil compares very well with other middle-income country peers and countries in Latin America and the Caribbean (Figure 13), and these achievements need to be safeguarded.
Source: World Bank WDI (left figure) and LAC Equity Lab (right figure)Note: School enrollment rates and average years of education for Brazil are not available in the WDI.
1
0.750.5
0.25
0
SanitationFacilities
Access To Water
Homicides
Life Expectancy
InfantMortality
PrimarySchool
Enrollment
SchoolEnrollmentAges 15-24
Average YearsOf Education
LACBrazil
Mexico
10.75
0.5
0.250
SanitationFacilities
Access To Water
HomicidesLife Expectancy
InfantMortality
LACBrazil
Synthetic MICS
MIC
Figure 13: Significant Social Progress in Brazil, 2013
How Brazil Fares Against Comparison Countries Brazil vs. Mexico and LAC
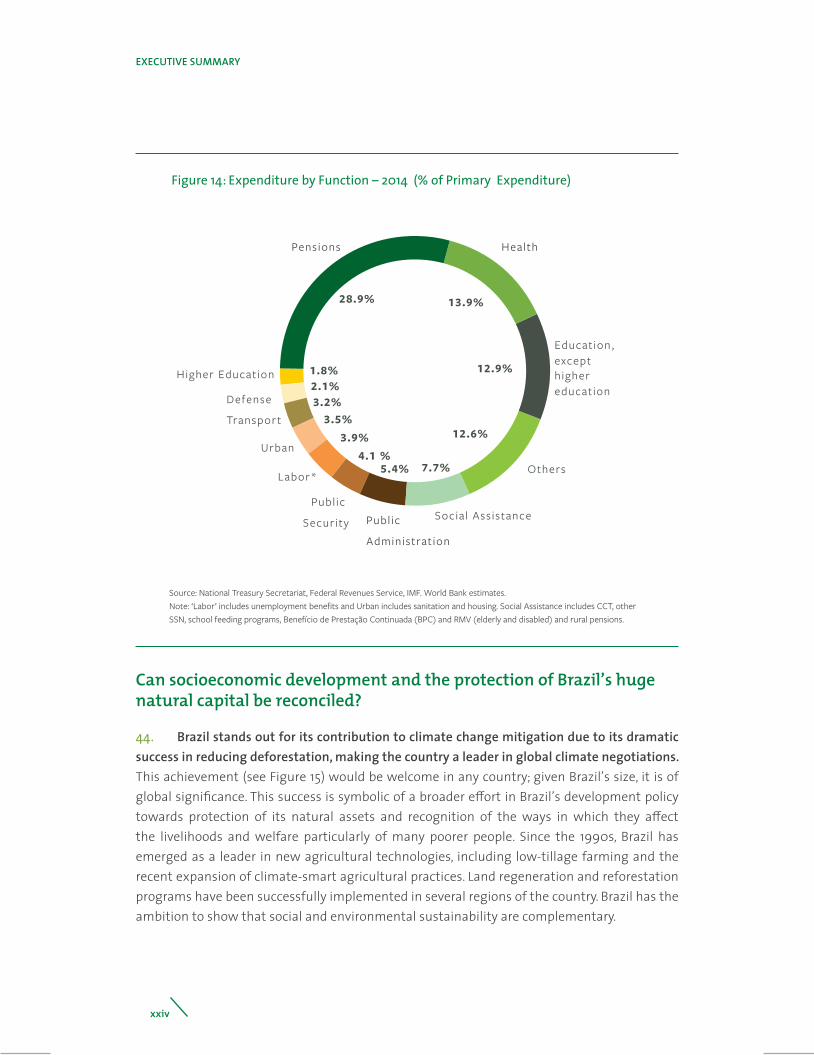
42. There is a lot of scope for continuing progressive social policies if spending is reallocated from entitlement programs, which largely benefit the better-off. Fiscal adjustment and social progress are not contradictory. In 2014, the share of social assistance transfers directly targeting the poor was just 7.7 percent of primary general government spending. Adding primary health, early childhood education and primary education spending, the share increased to 16.4 percent.2 Public administration consumed 5.4 percent of spending, and with multiple overlapping responsibilities and generous civil servant pay packages there would appear to be scope for some savings there (Figure 14). Transfers to businesses, including implicit tax expenditures and transfers through the state banks, exceed 5 percent of GDP, or the equivalent of almost 14 percent of primary expenditure. The bulk of spending is on pensions (not including the semi-contributory rural pensions), an important part of which accrue to public servants and other better-off households. The public pension system has been running deficits, thus directly eating up fiscal space that could be used to protect the poor and vulnerable. Therefore, there are many
2 Data for primary health, early childhood education, and primary education were estimated based on the proportions (relative to overall health and education expenditures) observed in 2012.
xxiii
RETAKING THE PATH TO INCLUSION, GROWTH AND SUSTAINABILTY
opportunities to reduce spending without affecting the poor. Indeed, by creating fiscal space for public investment, and for increased transfers to the unemployed and vulnerable, such cuts would help safeguard the social gains of the past decade.
43. In addition to the reallocation of spending across budget lines, the poor and vulnerable could also benefit from efficiency gains in spending in various areas. Despite significant gains in educational achievements over the past decade, the B40 continue to be disadvantaged by the low quality of publicly provided basic education. Richer households can afford to send their children to better, private schools, thus increasing the chance of acceptance in one of the publicly funded state universities. The poor do not have this option and are thus particularly reliant on government efforts to improve educational quality. The variance in educational outcomes across states with similar socioeconomic conditions suggests there is ample room for policy and good management to make a difference, and for subnational governments to learn from each other. Similar arguments can be made for other public services, such as urban transport, water and sanitation, housing and, importantly, protection from crime and violence. In the case of health care, long waiting lines and poor quality have prompted public dissatisfaction despite considerable improvements in access and the introduction of a tax funded, free system of universal care. Once again, the better-off compensate through additional private health plans; the poor have to stand in the queue. Despite average housing investments3 being around 10 percent of GDP for the last three decades, capacity constraints at the local level, lack of fiscal space, and land acquisition and resettlement issues have bedeviled the implementation of social housing programs like Minha Casa Minha Vida (MCMV). Out of an estimated housing deficit of 27 million units by 2023, 7 million units are for higher-income families. In each of these areas, well-designed policy interventions could help improve the quality of services for all beneficiaries, benefiting in particular poor households that have few opportunities to substitute private provision for poor public services. The poor also stand to benefit from policies that make economic growth compatible with the preservation and enhancement of Brazil’s natural assets and that increase resilience against increasing climate risks.
3 Including government, private, and household investment. Estimates based on ‘ownership of dwelling value added’ variable from National Accounts.
xxiv
EXECUTIVE SUMMARY
Social Assistance
Pensions Health
Others
Education, excepthigher education
Source: National Treasury Secretariat, Federal Revenues Service, IMF. World Bank estimates.Note: ‘Labor’ includes unemployment benefits and Urban includes sanitation and housing. Social Assistance includes CCT, other SSN, school feeding programs, Benefício de Prestação Continuada (BPC) and RMV (elderly and disabled) and rural pensions.
Publ ic
Security Publ ic
Administration
Labor*
Urban
Transport
Defense
Higher Education
13.9%
12.9%
12.6%
7.7%5.4% 4.1 %
3.9%3.5%
3.2%2.1%1.8%
28.9%
Figure 14: Expenditure by Function – 2014 (% of Primary Expenditure)
Can socioeconomic development and the protection of Brazil’s huge natural capital be reconciled?
44. Brazil stands out for its contribution to climate change mitigation due to its dramatic success in reducing deforestation, making the country a leader in global climate negotiations. This achievement (see Figure 15) would be welcome in any country; given Brazil’s size, it is of global significance. This success is symbolic of a broader effort in Brazil’s development policy towards protection of its natural assets and recognition of the ways in which they affect the livelihoods and welfare particularly of many poorer people. Since the 1990s, Brazil has emerged as a leader in new agricultural technologies, including low-tillage farming and the recent expansion of climate-smart agricultural practices. Land regeneration and reforestation programs have been successfully implemented in several regions of the country. Brazil has the ambition to show that social and environmental sustainability are complementary.

xxv
RETAKING THE PATH TO INCLUSION, GROWTH AND SUSTAINABILTY
Source: Instituto Nacional de Pesquisas Espaciais (INPE) 2015
27.820
04
1920
05
14.320
06
11.720
07
12.9
2008
7.5
2009
7.0
2010
6.4
2011
4.6
2012
5.9
2013
5.0
2014
-82%
0
5
10
15
20
25
30
Figure 15: Brazil is a Leader in Climate Change Mitigation Effort
(a) Deforestation in Amazônia Legal between 2004 and 2014, Thousands of square kilometers
Source: Annual estimates of greenhouse gas emissions in Brazil, Ministry of Science, Technology, and Innovation (2014).
EnergyWasteIndustrialProcesses
AgricultureLand Use Change & Foresty
1990
1991 19
92
1993 1994
1995
1996
1997 19
98
1999 20
00
2001 20
02 2003 20
04
2005
2006
2007
2008
2009
2010
2011
2012
2013
0.0Billi
ons
0.5
1.0
1.5
2.0
2.5
3.0
3.5
(b) GHG Emissions– Brazil – 1990-2013 (Co eq)2
45. However, many challenges still remain for Brazil. The management of natural resources such as land and water is inefficient with negative consequences for economic opportunities and sustainability. Despite the increase in agricultural productivity, the variation of productivity across farms remains huge, as a result of which more land needs to be brought under cultivation to compensate for poor yields. Speculative land grabs continue to lead to illegal deforestation and sometimes violent clashes between indigenous people and illegal

xxvi
EXECUTIVE SUMMARY
loggers, despite significant improvements in surveillance and enforcement. Similarly, in water, wide variance exists in the quality of water management across locations, while in addition there is a serious North-South imbalance between water intake and use.
46. Rapid urbanization and the effects of climate change are creating additional risks to sustainable livelihoods. Urban sprawl increases the environment footprint of cities and the spread of precarious housing makes people vulnerable to natural disasters, climate-related or not. Many informal urban settlements are at risk from flooding or have been erected on contaminated land. In Brazil, the vehicle fleet trebled between 2000 and 2015 (Figure 16). The situation is particularly bad in Brazil’s megacities such as São Paulo or Rio de Janeiro, and several medium-sized cities, where transport-related air pollution is becoming a significant health hazard.
2015
2010
2005
200029.8
38.3
60.6
89.7millions
millions
millions
millions
Source: Sistema de Registro Nacional de Veículos Automotores – RENAVAM/DENATRAN
Figure 16: With Prosperity Comes Congestion (Car Ownership Trebled In Brazil in 15 Years)
47. A green growth path is possible for Brazil. Brazil’s land, forest and water resources are assets that if well managed can yield ample economic returns, provide livelihoods, render environmental services and buttress Brazil’s global reputation. Brazil’s cities can become more livable and attractive to global talent and investment alike, if pollution and congestion are reduced, and if weather-related and other disaster risks are mitigated. Public investment will be needed to realize these opportunities, but the private sector can play an important role too, if the right policies are in place. Brazil’s national and subnational governments can already draw on a rich set of experiences. However, in the country’s management of natural resource and environmental protection as in so many other policy fields, the fragmentation of policy making across tiers of government has added to the complexity and reduced the effectiveness of individual programs and initiatives. Dealing with these issues will allow Brazil to realize its ambition to be a leader in green growth among emerging markets.
xxvii
RETAKING THE PATH TO INCLUSION, GROWTH AND SUSTAINABILTY
What are the priority constraints that can be derived from the analysis of this SCD?
48. The priority constraints in Brazil suggested by this SCD follow from the narrative introduced at the beginning of this overview. Three requirements can be derived for sustaining poverty reduction and shared prosperity in Brazil into the future.
49. The first requirement is the creation of sufficient productive and well-remunerated jobs to provide employment opportunities for all Brazilians of working age. This in turn depends on increasing productivity, stimulating investment and innovation, and ensuring that the labor force is sufficiently skilled to meet the demands of the labor market in an upper-middle-income country. Increased investment and innovation are a function of a stable and sustainable fiscal and macroeconomic framework, improvements in the business environment, access to capital at reasonable prices and, above all, increased competition, together providing the conditions for improving productivity.
50. A second basic requirement for continued poverty reduction and shared prosperity is more efficient and better-targeted government spending. This is fundamental to improve access to and the quality of public services and to regain the fiscal space necessary for greater public investment while continuing (and possibly increasing) transfers to the poor and vulnerable. The time has now come to question who receives public resources and for what public purpose. The further reduction of inequality will depend significantly on the state redistributing the resources it allocates away from the non-poor to the poor.
51. The third requirement for improved livelihoods and economic opportunities is the smarter management of Brazil’s natural resources and the better mitigation of environmental pollution and the risk of natural disasters. Three principal issues in natural resource management stand out and affect the B40 directly and indirectly through their effects on growth and incomes. These are the questions of access to land and insecure property rights, water management and, more broadly, the management of the natural environment. All of these issues are ones of governance in which the state acts as a mediator between competing private interests, and to support those (the poor and vulnerable) who are least able to protect their interests.
52. Three criteria were used to identify priority constraints on sustained poverty reduction and shared prosperity. These were: (a) the constraints should have a critical medium and long term impact on the welfare of the B40, including generating synergies and complementarities with relieving other constraints; (b) that any proposed measures should fit into the available

xxviii
EXECUTIVE SUMMARY
resource envelope and be consistent with long-term fiscal and environmental sustainability; and (c) there should be some evidence of impact from other countries or Brazil’s own development experience.
53. By applying these criteria to the three requirements it is possible to identify five priority constraints: (a) Inefficient and not-well targeted spending commitments that consume fiscal space needed for pro-poor spending priorities generate a relatively high tax burden, and—in an unfavorable global context—have become a cause of serious fiscal imbalances. (b) Public sector governance weaknesses and institutional arrangements that complicate the necessary fiscal adjustment and exacerbate inefficiencies in the choice, design and implementation of public programs (including those with private participation). (c) Segmentation of financial markets, lack of long-term credit and high interest rates, which reduces the efficiency of the allocation of capital and negatively affects private investment. (d) A poor business environment, characterized by a complex regulatory framework, an uneven playing field, a very complex tax regime, and an economy relatively closed to trade and competition. (e) Inadequacies in the policy framework for the use and protection of Brazil’s natural resources to maximize the impact of this asset base on the sustainable improvement in the livelihoods of the poor. These priorities are the principal constraints for sustainable and inclusive development. Dealing with these constraints would liberate resources to be allocated to priorities that would support continued inclusive development, such as early childhood development, improved quality of education at all levels, public investments in connectivity, and improved market access for the B40, as well as the expansion of well-targeted social transfers to the most vulnerable, whose livelihoods are threatened by the current economic recession.

xxix
RETAKING THE PATH TO INCLUSION, GROWTH AND SUSTAINABILTY
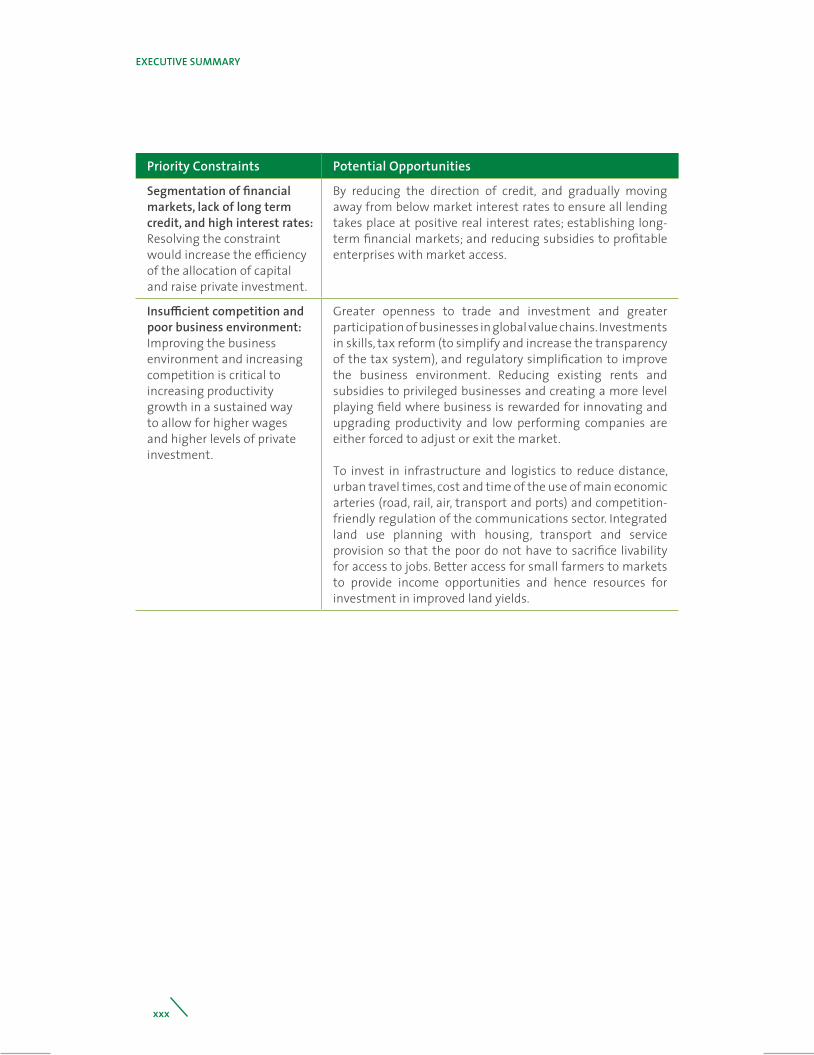
Priority Constraints Potential Opportunities
Lack of fiscal space and large transfer of resources to the non-poor:Resolution of the constraint would allow more investment, provide resources for the B40, reduce levels of taxation and promote macro stability and thereby enable job creation, shared prosperity and poverty reduction.
Zero based review of all expenditure for efficiency, effectiveness and incidence on the poor and non-poor. Possible areas for savings: pension reform; reducing earmarking in the budget; and rationalizing expenditures. Improvements in the framework for fiscal management (including fiscal rules and institutions, the budget preparation and execution, public investment management), will also contribute to create fiscal space and maintain macro-fiscal sustainability. Simplifying the tax system, rationalizing tax expenditures, reducing the use of tax amnesties and improving capital-wealth taxation.
To protect the vulnerable through enhancing the responsiveness of non-contributory safety net programs (for example, PBF) to benefit newly eligible groups, targeting specific groups, such as indigenous populations in remote/isolated areas (Amazon), Afrodescendants and other minorities, and women, reducing crime and violence through cross sectoral programs, increasing support for programs against gender based violence and providing economic opportunities for women.
Public sector governance weaknesses and institutional fragmentation hamper effective long-term policy design, planning and implementation:Dealing with the constraint in the medium term would increase the quality of services and ensure their focus on the B40 in the context of a sustainable and flexible overall policy framework.
Development of institutions and processes focusing on quality of public service delivery, as well as encouraging private sector service delivery (for example, through PPPs, direct local and foreign investment), accompanied by a more systematic implementation of results-based management and evidence-based policy formulation. Through increasing the efficiency, and reducing unequal access to education and health, attracting private resources within a strong quality assurance framework).
Increasing the quality of spending in infrastructure, housing and in science, technology and innovation (including skills upgrading) programs to boost firms’ productivity and thereby generate more and better jobs, through strengthening of public accountability while removing obstacles related to overlapping mandates and poor policy coordination.
xxx
EXECUTIVE SUMMARY
Priority Constraints Potential Opportunities
Segmentation of financial markets, lack of long term credit, and high interest rates:Resolving the constraint would increase the efficiency of the allocation of capital and raise private investment.
By reducing the direction of credit, and gradually moving away from below market interest rates to ensure all lending takes place at positive real interest rates; establishing long-term financial markets; and reducing subsidies to profitable enterprises with market access.
Insufficient competition and poor business environment:Improving the business environment and increasing competition is critical to increasing productivity growth in a sustained way to allow for higher wages and higher levels of private investment.
Greater openness to trade and investment and greater participation of businesses in global value chains. Investments in skills, tax reform (to simplify and increase the transparency of the tax system), and regulatory simplification to improve the business environment. Reducing existing rents and subsidies to privileged businesses and creating a more level playing field where business is rewarded for innovating and upgrading productivity and low performing companies are either forced to adjust or exit the market.
To invest in infrastructure and logistics to reduce distance, urban travel times, cost and time of the use of main economic arteries (road, rail, air, transport and ports) and competition-friendly regulation of the communications sector. Integrated land use planning with housing, transport and service provision so that the poor do not have to sacrifice livability for access to jobs. Better access for small farmers to markets to provide income opportunities and hence resources for investment in improved land yields.


4º
2º
RETA
KIN
TH
E PA
TH F
OR
INCL
USI
VE S
UST
AIN
ABL
E G
ROW
TH