public enterprises survey 2010-2011 - dpe.gov.indpe.gov.in/sites/default/files/1-overview_3.pdf ·...
TRANSCRIPT
PUBLICENTERPRISESSURVEY 2010-2011
GOVERNMENT OF INDIAMINISTRY OF HEAVY INDUSTRIES &
PUBLIC ENTERPRISESDEPARTMENT OF PUBLIC ENTERPRISES
NEW DELHI
OVERVIEWon the Performance of
Central Public Sector Enterprises

Public Enterprises Survey2010-2011
Overview
Annual Report on the Performane ofCentral Public Sector Enterprises
Government of India
Ministry of Heavy Industries and Public EnterprisesDepartment of Public Enterprises
New Delhi

CONTENTS
Page No.
Performance Overview 2010-11 ...................................................................................................1-24
1.1 Indian Economy (2010-11) and CPSEs ...............................................................................................................1
1.2 ProfitabilityRatios ..................................................................................................................................................4
1.3 AggregateBalanceSheet ofCPSEs ......................................................................................................................5
1.4 InvestmentPattern in termsofGrossBlock .........................................................................................................6
1.5 Turnover in CPSEs .................................................................................................................................................9
1.6 Shareof select items in domestic/national production .......................................................................................11
1.7 Contribution toGDP .............................................................................................................................................14
1.8 Contribution to theCentralExchequer ................................................................................................................15
1.9 GovernmentDisinvestment inCPSEs .................................................................................................................16
1.10 Revival ofSickCPSEs .......................................................................................................................................16
1.11 BoardStructure ofCPSEs ....................................................................................................................................16
1.12 Wages/Salaries andEmployeesWelfare .............................................................................................................17
1.13 Employment ..........................................................................................................................................................17
1.14 VoluntaryRetirementScheme (VRS) ..................................................................................................................17
1.15 MemorandumofUnderstanding (MOU) system inCPSEs ..............................................................................18
1.16 MarketCapitalisationofCPSEsStocks .............................................................................................................18
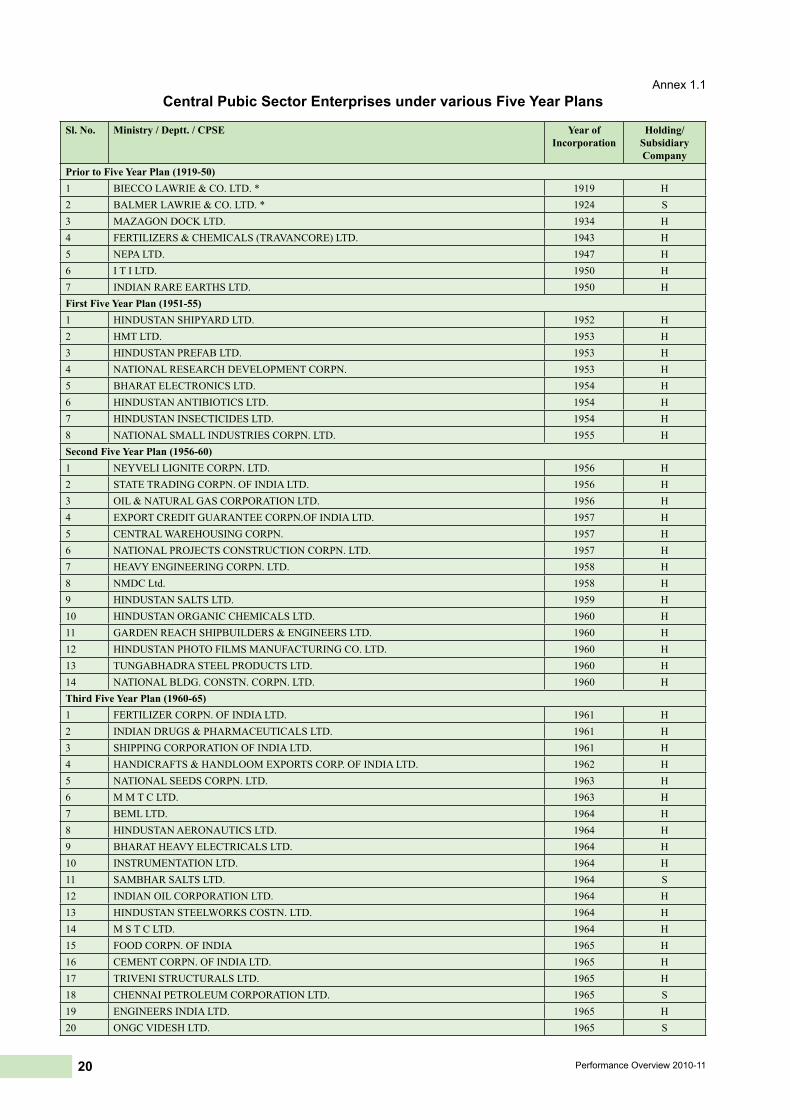
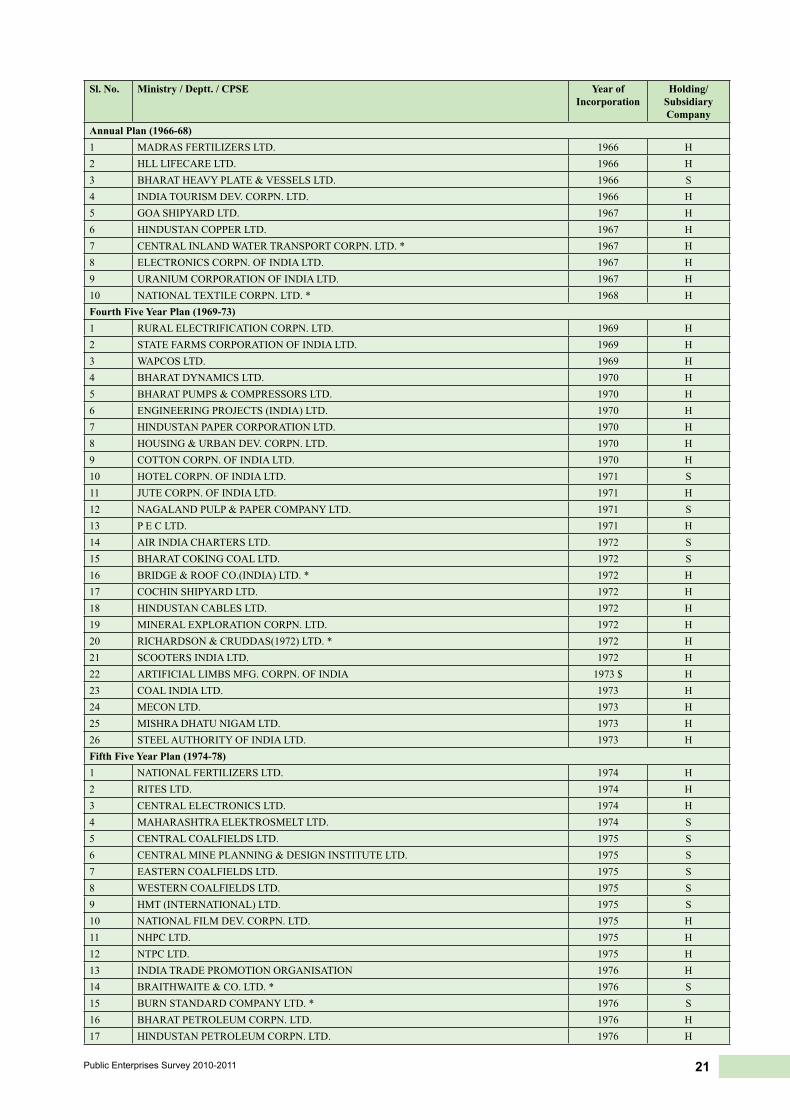
1.17 CentralPubicSectorEnterprises under variousFiveYearPlans ......................................................................20

1Public Enterprises Survey 2010-2011
Public sector enterprises have been set up toserve the broadmacro-economic objectives of highereconomic growth, self-sufficiency in production ofgoods and services, long term equilibrium in balanceof payments and low and stable prices. While therewere only five Central Public Sector Enterprises(CPSEs) with a total investment of ` 29.00 crore atthe time of the First Five Year Plan, there were asmany248CPSEs (excluding 7 InsuranceCompanies)with a total investment of ` 6,66,848 crore as on 31st March, 2011.
A large number of CPSEs have been set up asGreenfield projects consequent to the initiatives takenduring the FiveYear Plans. CPSEs such as NationalTextileCorporation,CoalIndiaLtd.(anditssubsidiaries)have, however, been taken over from the privatesector consequent to their 'nationalization'. Industrialcompanies suchas IndianPetrochemicalsCorporationLtd.,ModernFoodIndustriesLtd.,HindustanZincLtd.,BharatAluminum Company and Maruti Udyog Ltd.,on the other hand,whichwere CPSEs earlier, ceasedto beCPSEs after their 'privatization'.
AlongwithotherpublicsectormajorssuchasState
Bank of India in the banking sector, Life InsuranceCorporationintheinsurancesectorandIndianRailwaysin transportation, the CPSEs are leading companiesof India with significant market-shares in sectorssuch as petroleum, (eg.ONGC,GAIL and IndianOilCorporation),mining(e.g.CoalIndiaLtd.andNMDC),power generation (e.g. NTPC and NHPC), powertransmission(e.g.PowerGridCorporationLtd.),nuclearenergy(e.g.NuclearPowerCorporationofIndiaLtd.),heavyengineering (e.g.BHEL), aviation industry (eg.HindustanAeronauticsLtd.andAirIndiaLtd.),storageandpublicdistributionsystem(eg.FoodCorporationofIndiaandCentralWarehousingCorporation),shippingandtrading(eg.ShippingCorporationofIndiaLtd,andStateTradingCorporationLtd.)andtelecommunication(eg.BSNLandMTNL).
Witheconomicliberalization,post-1991,sectorsthat
wereexclusivepreserveofthepublicsectorenterpriseswereopenedtotheprivatesector.TheCPSEs,therefore,arefacedwithcompetitionfrombothdomesticprivatesectorcompanies(someofwhichhavegrownveryfast)andthelargemulti-nationalcorporations(MNCs).TheturnoverofCPSEslikeCottonCorporationofIndia,ITILtd.,MazgaonDockLtd.,MSTCLtd.,STCLtd.,ONGC
Performance Overview 2010-11Videsh Ltd. andBharat SancharNigamLtd. declinedsignificantly during 2010-11. CPSES like Air IndiaLtd.,BharatSancharNigamLtd.,MahanagarTelephoneNigam Ltd., Hindustan Photofilms & ManufacturingCo. Ltd., and Indian Drugs & Pharmaceuticals Ltd.suffered losses during2010-11.
1.1 Indian Economy (2010-11) and CPSEs
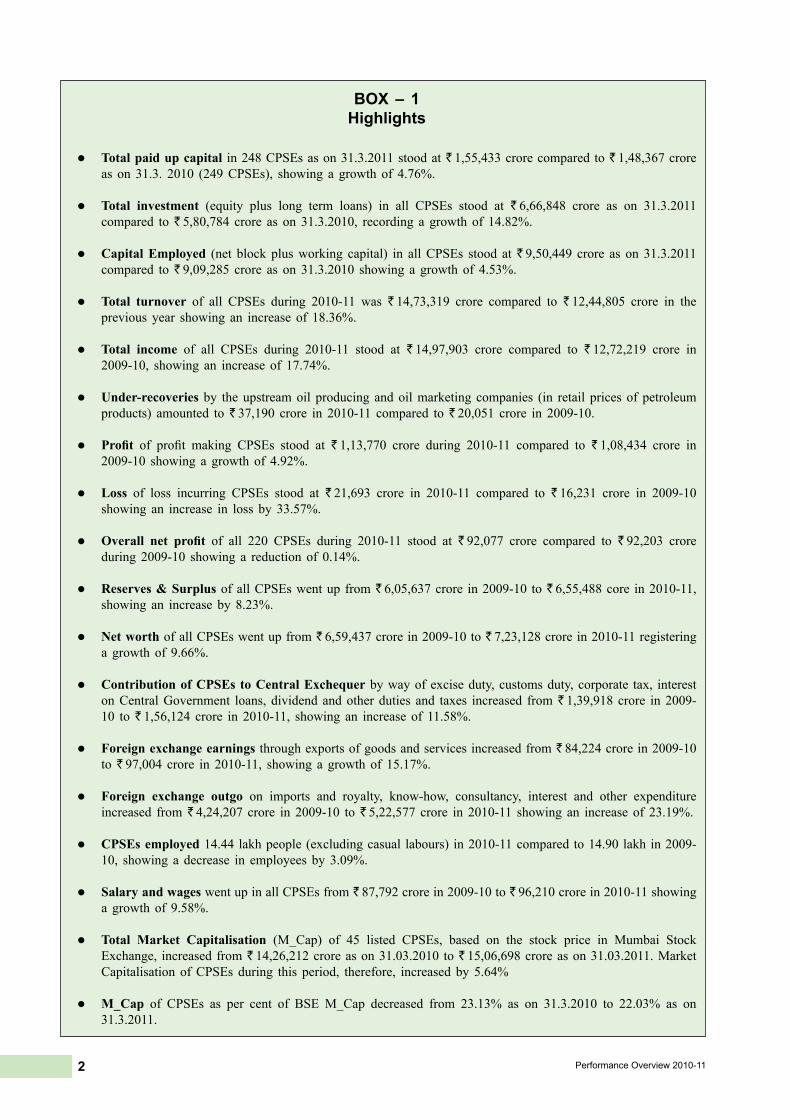
The CPSEs play a critical role in the Indianeconomy. They influence the growth in the economyandareaffectedbytheoverallgrowthintheeconomy.AsagainstthenominalGDPgrowthof18.80percent(at current market price) in 2010-11, the gross valueadditionbyalltheCPSEs(exclusiveofunder-recoveries)grew by 10.03 per cent during the year (if however,‘the under recoveries’ are added, then the gross valueaddition by all CPSEs during the year increased by13.40percent).Theturnoverofpetroleum(Refinery&Marketing),services(Trading&Marketing),electricity(Generation), heavy engineering, minerals & metalsandcoal&ligniteshowedasignificantincreaseduringthe year. Profits / losses of the different CPSEs didnot necessarily correspond to increase or decrease inturnover,as several factorscame intoplay likehigherinputcosts,lowerprices,increaseinsalaryandwages,heavy interest burden and exchange rate fluctuations.ThehighlightsofperformanceofCPSEsduring2010-11 are given inBox1.
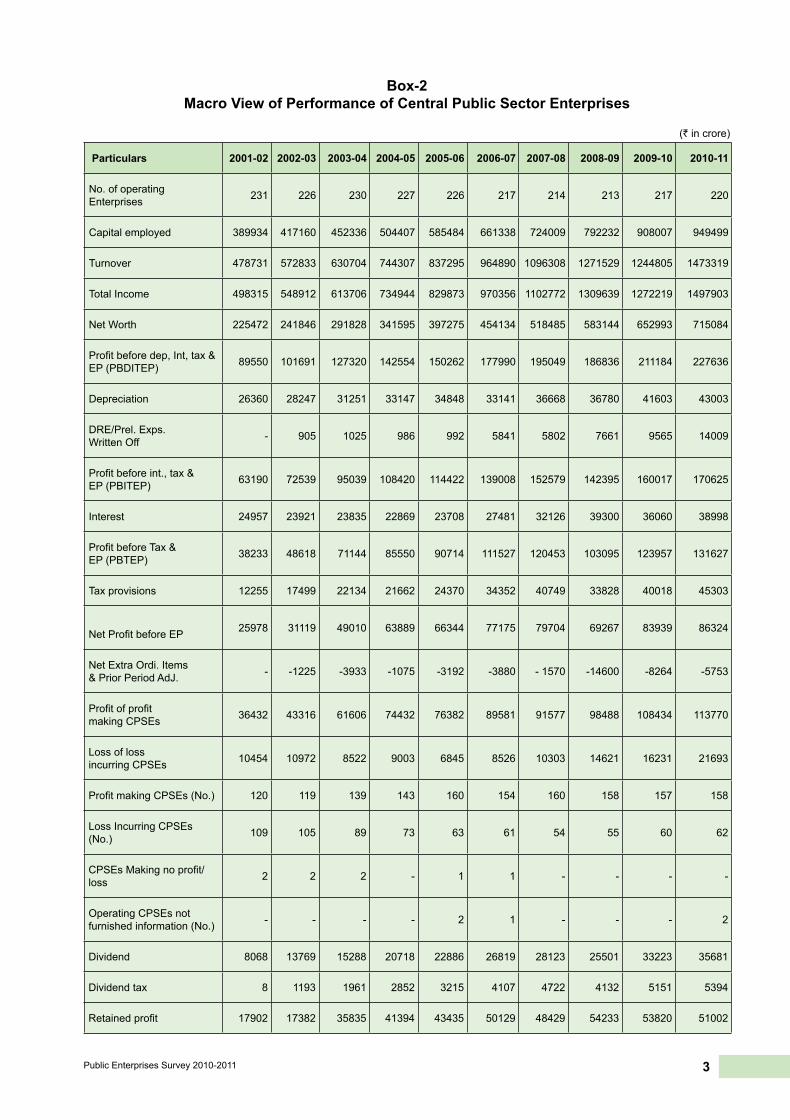
Macroviewof theperformanceofCPSEs,duringthe last tenyears, isshown inBox2.The turnoverofall220operatingCPSEsstoodat` 14,73,319croreascompared to ` 12,44,805 crore in the previous year.During the year 2010-11, the CPSEs earned foreignexchange equal to ` 97,004 crore as compared to` 84,224crorein2009-10.Theforeignexchangeoutgoonimportsandroyalty,know-how,consultancy,interestand other expenditure, on the other hand, increasedfrom ` 4,24,207 crore in 2009-10 to ` 5,22,577 crorein 2010-11 showing an increaseof 23.19%.
The total employee strength inCPSEswas 14.44lakh(excludingcasuallabours)in2010-11ascomparedto 14.90 lakh in 2009-10. The total strength of theemployeesinCPSEshasgonedownby45,981personsdue to superannuation, voluntary retirement etc. ThesalaryandwagesinalltheCPSEswentupfrom` 87,792crorein2009-10to` 96,210crorein2010-11,showinga growthof 9.58%.
2 Performance Overview 2010-11
BOX – 1 Highlights
l Total paid up capital in248CPSEsason31.3.2011stoodat` 1,55,433crorecomparedto` 1,48,367croreas on31.3. 2010 (249CPSEs), showing a growthof 4.76%.
l Total investment (equity plus long term loans) in all CPSEs stood at ` 6,66,848 crore as on 31.3.2011compared to` 5,80,784 crore as on31.3.2010, recording a growthof 14.82%.
l Capital Employed (net blockplusworking capital) in allCPSEs stood at` 9,50,449 crore as on31.3.2011compared to` 9,09,285 crore as on31.3.2010 showing a growthof 4.53%.
l Total turnover of all CPSEs during 2010-11 was ` 14,73,319 crore compared to ` 12,44,805 crore in thepreviousyear showing an increaseof 18.36%.
l Total income of all CPSEs during 2010-11 stood at ` 14,97,903 crore compared to ` 12,72,219 crore in2009-10, showing an increaseof 17.74%.
l Under-recoveries by theupstreamoilproducingandoilmarketingcompanies (in retail pricesofpetroleumproducts) amounted to` 37,190 crore in 2010-11 compared to` 20,051 crore in 2009-10.
l Profit of profit making CPSEs stood at ` 1,13,770 crore during 2010-11 compared to ` 1,08,434 crore in2009-10 showing a growthof 4.92%.
l Loss of loss incurring CPSEs stood at ` 21,693 crore in 2010-11 compared to ` 16,231 crore in 2009-10showing an increase in loss by33.57%.
l Overall net profit of all 220 CPSEs during 2010-11 stood at ` 92,077 crore compared to ` 92,203 croreduring2009-10 showing a reductionof 0.14%.
l Reserves & SurplusofallCPSEswentupfrom` 6,05,637crore in2009-10 to` 6,55,488core in2010-11,showing an increaseby8.23%.
l Net worthofallCPSEswentupfrom` 6,59,437crorein2009-10to` 7,23,128crorein2010-11registeringa growthof 9.66%.
l Contribution of CPSEs to Central Exchequerbywayofexciseduty,customsduty,corporate tax, interestonCentralGovernment loans,dividendandotherduties and taxes increased from` 1,39,918crore in2009-10 to` 1,56,124 crore in 2010-11, showing an increaseof 11.58%.
l Foreign exchange earningsthroughexportsofgoodsandservicesincreasedfrom` 84,224crorein2009-10to` 97,004 crore in 2010-11, showing a growthof 15.17%.
l Foreign exchange outgo on imports and royalty, know-how, consultancy, interest and other expenditureincreased from` 4,24,207 crore in 2009-10 to` 5,22,577 crore in 2010-11 showing an increaseof 23.19%.
l CPSEs employed14.44lakhpeople(excludingcasual labours) in2010-11comparedto14.90lakhin2009-
10, showing a decrease in employeesby3.09%.
l Salary and wageswentupinallCPSEsfrom` 87,792crorein2009-10to` 96,210crorein2010-11showinga growthof 9.58%.
l Total Market Capitalisation (M_Cap) of 45 listed CPSEs, based on the stock price in Mumbai StockExchange, increasedfrom` 14,26,212croreason31.03.2010to` 15,06,698croreason31.03.2011.MarketCapitalisationofCPSEsduring this period, therefore, increasedby5.64%
l M_Cap of CPSEs as per cent of BSEM_Cap decreased from 23.13% as on 31.3.2010 to 22.03% as on31.3.2011.
3Public Enterprises Survey 2010-2011
Box-2Macro View of Performance of Central Public Sector Enterprises
(` in crore)
Particulars 2001-02 2002-03 2003-04 2004-05 2005-06 2006-07 2007-08 2008-09 2009-10 2010-11
No. of operating Enterprises 231 226 230 227 226 217 214 213 217 220
Capital employed 389934 417160 452336 504407 585484 661338 724009 792232 908007 949499
Turnover 478731 572833 630704 744307 837295 964890 1096308 1271529 1244805 1473319
Total Income 498315 548912 613706 734944 829873 970356 1102772 1309639 1272219 1497903
Net Worth 225472 241846 291828 341595 397275 454134 518485 583144 652993 715084
Profit before dep, Int, tax & EP (PBDITEP) 89550 101691 127320 142554 150262 177990 195049 186836 211184 227636
Depreciation 26360 28247 31251 33147 34848 33141 36668 36780 41603 43003
DRE/Prel. Exps. Written Off - 905 1025 986 992 5841 5802 7661 9565 14009
Profit before int., tax & EP (PBITEP) 63190 72539 95039 108420 114422 139008 152579 142395 160017 170625
Interest 24957 23921 23835 22869 23708 27481 32126 39300 36060 38998
Profit before Tax & EP (PBTEP) 38233 48618 71144 85550 90714 111527 120453 103095 123957 131627
Tax provisions 12255 17499 22134 21662 24370 34352 40749 33828 40018 45303
Net Profit before EP 25978 31119 49010 63889 66344 77175 79704 69267 83939 86324
Net Extra Ordi. Items & Prior Period AdJ. - -1225 -3933 -1075 -3192 -3880 - 1570 -14600 -8264 -5753
Profit of profit making CPSEs 36432 43316 61606 74432 76382 89581 91577 98488 108434 113770
Loss of lossincurring CPSEs 10454 10972 8522 9003 6845 8526 10303 14621 16231 21693
Profit making CPSEs (No.) 120 119 139 143 160 154 160 158 157 158
Loss Incurring CPSEs (No.) 109 105 89 73 63 61 54 55 60 62
CPSEs Making no profit/loss 2 2 2 - 1 1 - - - -
Operating CPSEs not furnished information (No.) - - - - 2 1 - - - 2
Dividend 8068 13769 15288 20718 22886 26819 28123 25501 33223 35681
Dividend tax 8 1193 1961 2852 3215 4107 4722 4132 5151 5394
Retained profit 17902 17382 35835 41394 43435 50129 48429 54233 53820 51002
4 Performance Overview 2010-11
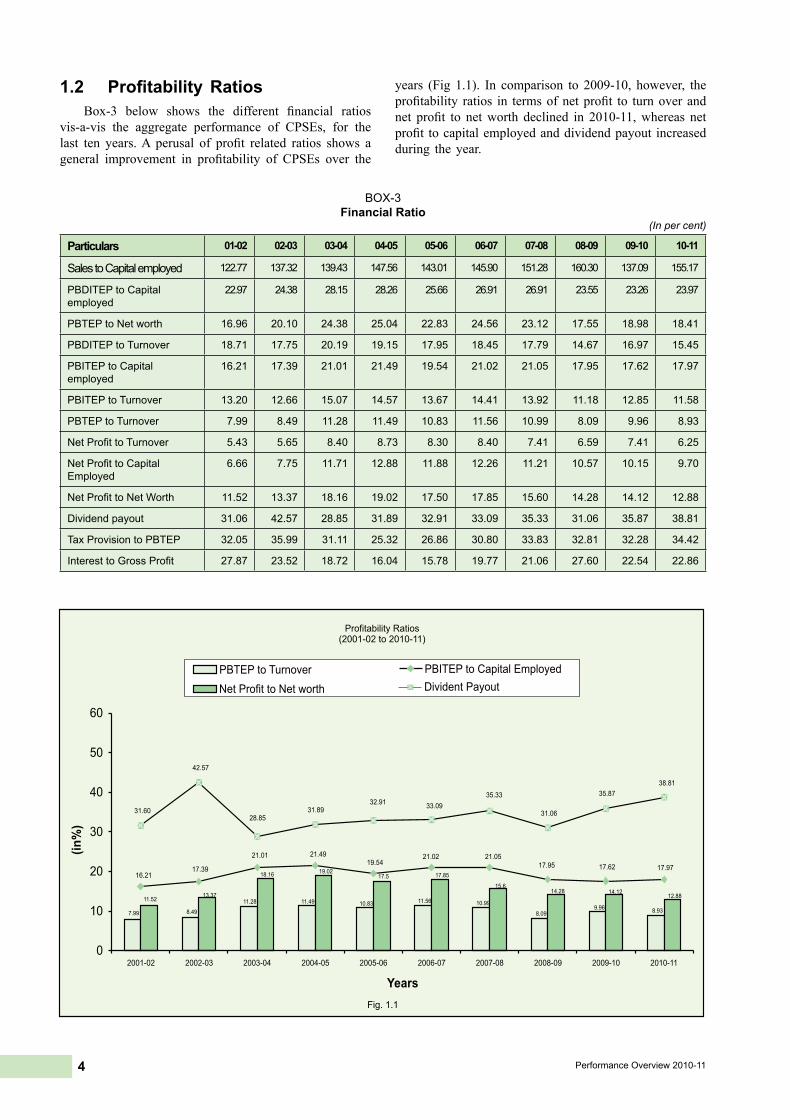
1.2 ProfitabilityRatiosBox-3 below shows the different financial ratios
vis-a-vis the aggregate performance of CPSEs, for thelast ten years.A perusal of profit related ratios shows ageneral improvement in profitability of CPSEs over the
years (Fig 1.1). In comparison to 2009-10, however, theprofitability ratios in termsofnetprofit to turnoverandnet profit to networth declined in 2010-11,whereas netprofit tocapitalemployedanddividendpayout increasedduring theyear.
BOX-3Financial Ratio
(In per cent)
Particulars 01-02 02-03 03-04 04-05 05-06 06-07 07-08 08-09 09-10 10-11
Sales to Capital employed 122.77 137.32 139.43 147.56 143.01 145.90 151.28 160.30 137.09 155.17
PBDITEP to Capital employed
22.97 24.38 28.15 28.26 25.66 26.91 26.91 23.55 23.26 23.97
PBTEP to Net worth 16.96 20.10 24.38 25.04 22.83 24.56 23.12 17.55 18.98 18.41
PBDITEP to Turnover 18.71 17.75 20.19 19.15 17.95 18.45 17.79 14.67 16.97 15.45
PBITEP to Capital employed
16.21 17.39 21.01 21.49 19.54 21.02 21.05 17.95 17.62 17.97
PBITEP to Turnover 13.20 12.66 15.07 14.57 13.67 14.41 13.92 11.18 12.85 11.58
PBTEP to Turnover 7.99 8.49 11.28 11.49 10.83 11.56 10.99 8.09 9.96 8.93
Net Profit to Turnover 5.43 5.65 8.40 8.73 8.30 8.40 7.41 6.59 7.41 6.25
Net Profit to Capital Employed
6.66 7.75 11.71 12.88 11.88 12.26 11.21 10.57 10.15 9.70
Net Profit to Net Worth 11.52 13.37 18.16 19.02 17.50 17.85 15.60 14.28 14.12 12.88
Dividend payout 31.06 42.57 28.85 31.89 32.91 33.09 35.33 31.06 35.87 38.81
Tax Provision to PBTEP 32.05 35.99 31.11 25.32 26.86 30.80 33.83 32.81 32.28 34.42
Interest to Gross Profit 27.87 23.52 18.72 16.04 15.78 19.77 21.06 27.60 22.54 22.86
5Public Enterprises Survey 2010-2011
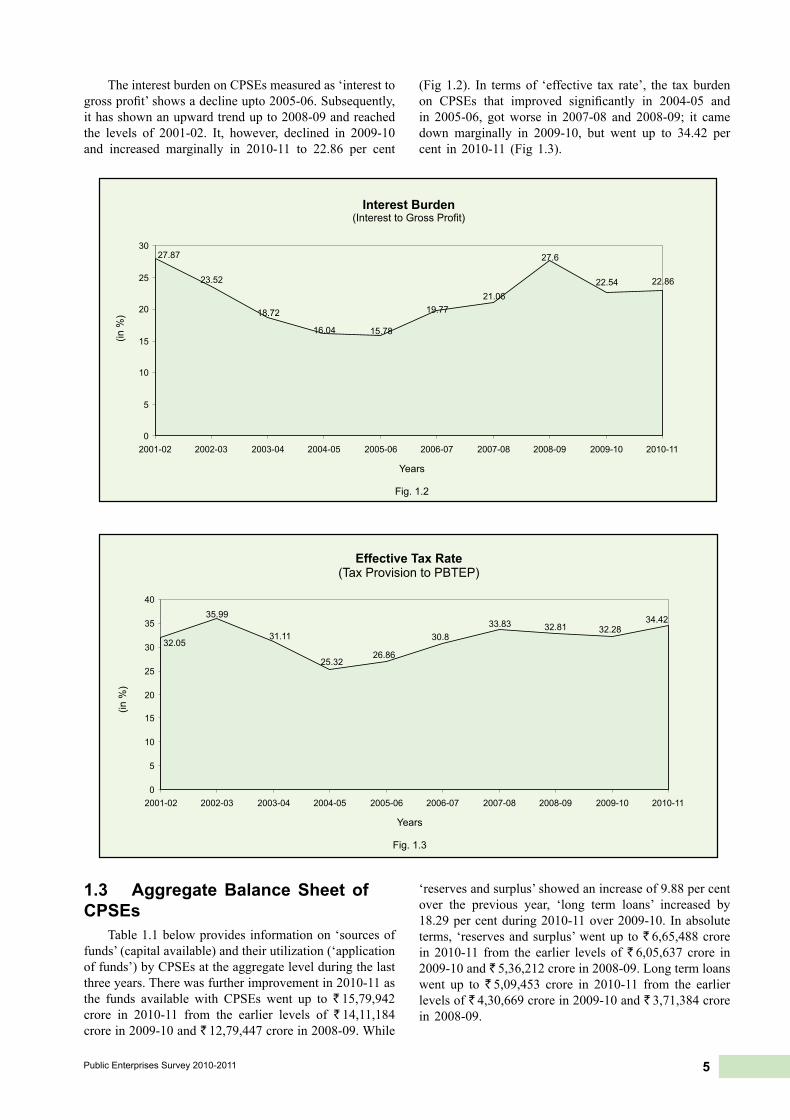
TheinterestburdenonCPSEsmeasuredas‘interesttogrossprofit’showsadeclineupto2005-06.Subsequently,ithasshownanupwardtrendupto2008-09andreachedthe levels of 2001-02. It, however, declined in 2009-10and increased marginally in 2010-11 to 22.86 per cent
(Fig1.2). In termsof ‘effective tax rate’, the taxburdenon CPSEs that improved significantly in 2004-05 andin 2005-06, gotworse in 2007-08 and 2008-09; it camedown marginally in 2009-10, but went up to 34.42 percent in 2010-11 (Fig1.3).
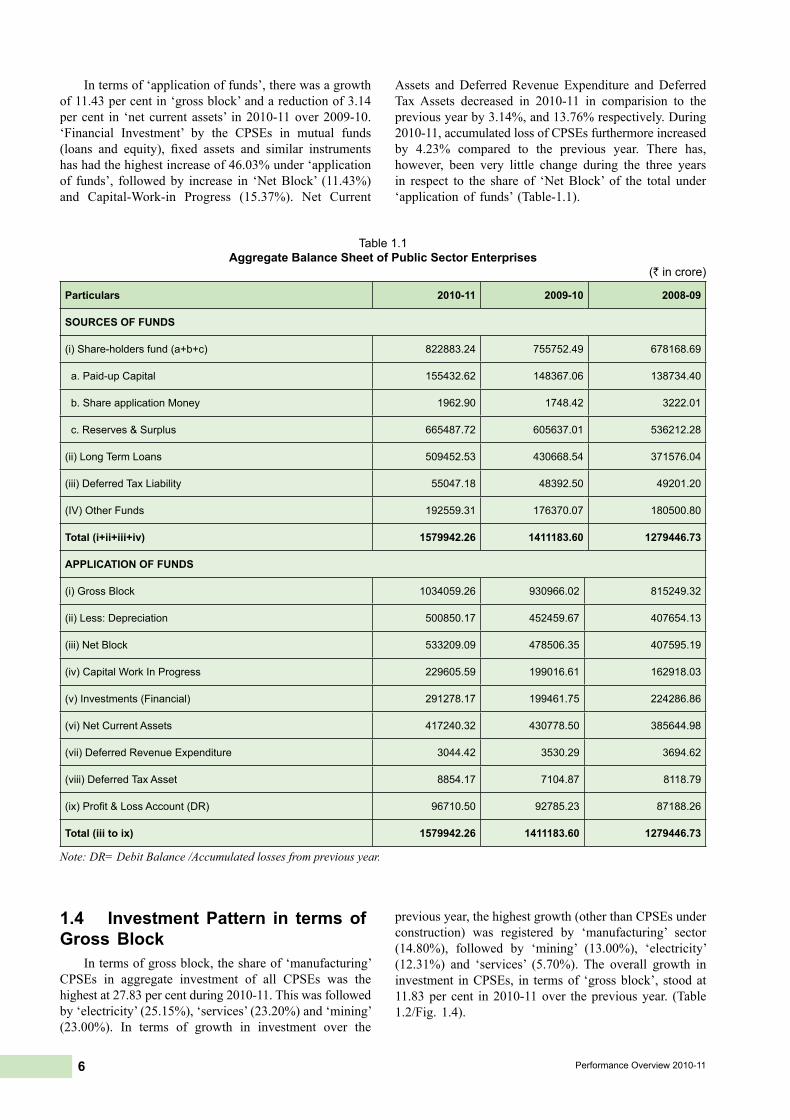
1.3 Aggregate Balance Sheet of CPSEs
Table1.1belowprovidesinformationon‘sourcesoffunds’(capitalavailable)andtheirutilization(‘applicationoffunds’)byCPSEsattheaggregatelevelduringthelastthreeyears.Therewasfurtherimprovementin2010-11asthe funds available with CPSEs went up to ` 15,79,942crore in 2010-11 from the earlier levels of ` 14,11,184crore in 2009-10 and ` 12,79,447crorein2008-09.While
‘reservesandsurplus’showedanincreaseof9.88percentover the previous year, ‘long term loans’ increased by18.29percentduring2010-11over2009-10. Inabsoluteterms, ‘reservesandsurplus’wentup to` 6,65,488crorein 2010-11 from the earlier levels of` 6,05,637 crore in2009-10 and ` 5,36,212crorein2008-09.Longtermloanswent up to ` 5,09,453 crore in 2010-11 from the earlierlevelsof` 4,30,669crorein2009-10and` 3,71,384crorein 2008-09.
6 Performance Overview 2010-11
Intermsof‘applicationoffunds’,therewasagrowthof11.43percentin‘grossblock’andareductionof3.14percent in ‘net current assets’ in2010-11over2009-10.‘Financial Investment’ by the CPSEs in mutual funds(loans and equity), fixed assets and similar instrumentshashadthehighestincreaseof46.03%under‘applicationof funds’, followedby increase in ‘NetBlock’ (11.43%)and Capital-Work-in Progress (15.37%). Net Current
Assets andDeferredRevenue Expenditure andDeferredTaxAssets decreased in 2010-11 in comparision to thepreviousyearby3.14%,and13.76%respectively.During2010-11,accumulatedlossofCPSEsfurthermoreincreasedby 4.23% compared to the previous year. There has,however, been very little change during the three yearsin respect to the share of ‘NetBlock’ of the total under‘applicationof funds’ (Table-1.1).
Table 1.1Aggregate Balance Sheet of Public Sector Enterprises
(` in crore)
Particulars 2010-11 2009-10 2008-09
SOURCES OF FUNDS
(i) Share-holders fund (a+b+c) 822883.24 755752.49 678168.69
a. Paid-up Capital 155432.62 148367.06 138734.40
b. Share application Money 1962.90 1748.42 3222.01
c. Reserves & Surplus 665487.72 605637.01 536212.28
(ii) Long Term Loans 509452.53 430668.54 371576.04
(iii) Deferred Tax Liability 55047.18 48392.50 49201.20
(IV) Other Funds 192559.31 176370.07 180500.80
Total (i+ii+iii+iv) 1579942.26 1411183.60 1279446.73
APPLICATION OF FUNDS
(i) Gross Block 1034059.26 930966.02 815249.32
(ii) Less: Depreciation 500850.17 452459.67 407654.13
(iii) Net Block 533209.09 478506.35 407595.19
(iv) Capital Work In Progress 229605.59 199016.61 162918.03
(v) Investments (Financial) 291278.17 199461.75 224286.86
(vi) Net Current Assets 417240.32 430778.50 385644.98
(vii) Deferred Revenue Expenditure 3044.42 3530.29 3694.62
(viii) Deferred Tax Asset 8854.17 7104.87 8118.79
(ix) Profit & Loss Account (DR) 96710.50 92785.23 87188.26
Total (iii to ix) 1579942.26 1411183.60 1279446.73
Note: DR= Debit Balance /Accumulated losses from previous year.
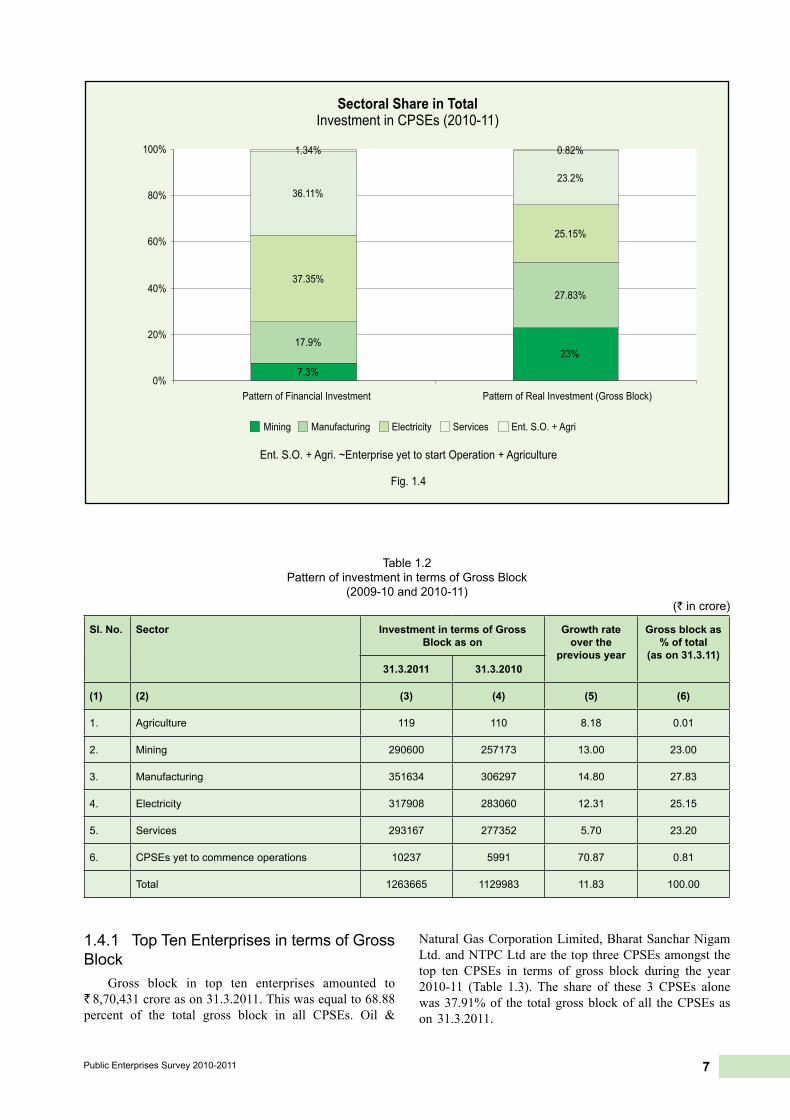
1.4 Investment Pattern in terms of Gross Block
Intermsofgrossblock,theshareof‘manufacturing’CPSEs in aggregate investment of all CPSEs was thehighestat27.83percentduring2010-11.Thiswasfollowedby‘electricity’(25.15%),‘services’(23.20%)and‘mining’(23.00%). In terms of growth in investment over the
previousyear,thehighestgrowth(otherthanCPSEsunderconstruction) was registered by ‘manufacturing’ sector(14.80%), followed by ‘mining’ (13.00%), ‘electricity’(12.31%) and ‘services’ (5.70%). The overall growth ininvestment inCPSEs, in termsof ‘grossblock’, stoodat11.83percent in2010-11over thepreviousyear. (Table1.2/Fig. 1.4).
7Public Enterprises Survey 2010-2011
1.4.1 Top Ten Enterprises in terms of Gross Block
Gross block in top ten enterprises amounted to` 8,70,431croreason31.3.2011.Thiswasequalto68.88percent of the total gross block in all CPSEs. Oil &
NaturalGasCorporationLimited,BharatSancharNigamLtd.andNTPCLtdarethetopthreeCPSEsamongstthetop ten CPSEs in terms of gross block during the year2010-11 (Table 1.3). The share of these 3 CPSEs alonewas37.91%of the totalgrossblockofall theCPSEsason 31.3.2011.
Table 1.2Pattern of investment in terms of Gross Block
(2009-10 and 2010-11)(` in crore)
Sl. No. Sector Investment in terms of Gross Block as on
Growth rate over the
previous year
Gross block as % of total
(as on 31.3.11)31.3.2011 31.3.2010
(1) (2) (3) (4) (5) (6)
1. Agriculture 119 110 8.18 0.01
2. Mining 290600 257173 13.00 23.00
3. Manufacturing 351634 306297 14.80 27.83
4. Electricity 317908 283060 12.31 25.15
5. Services 293167 277352 5.70 23.20
6. CPSEs yet to commence operations 10237 5991 70.87 0.81
Total 1263665 1129983 11.83 100.00
8 Performance Overview 2010-11
1.4.2 Financial Investment in CPSEsFinancial investment (equity plus long term loans)
inall248CPSEsason31.3.2011stood` 6,66,848croreas compared to ` 5,80,784 crore in the previous year,showing an increase by ` 86,064 crore or a growth of14.82percent.
Table 1.4 below shows the sector-wise and cognategroup-wise cumulative investment in CPSEs as on31.3.2010 and 31.3.2011. In terms of share in totalinvestment, the CPSEs in the electricity sector had thehighest share in financial investment (37.35%) as on31.3.2011(Fig.1.4).Thiswasfollowedby‘service’sector(36.11%), ‘manufacturing’ sector (17.90) and ‘mining’sector (7.30%).
Table 1.4Group-wise Investment of CPSEs for three years
(` in crore)Sl.No.
Sector/ Cognate Group Financial Investment31.3.2011 31.3.2010 31.3.2009
(1) (2) (3) (4) (5)I. Agriculture1 Agro Based Industries 185.25 160.71 256.51Sub Total 185.25 160.71 256.51II. Mining2 Coal & Lignite 17004.78 17194.41 18006.803 Crude Oil 26970.87 23119.55 19406.194 Other Minerals & Metals 4710.60 3863.74 3803.94Sub Total 48686.25 44177.70 41216.93III. Manufacturing5 Steel 22364.31 19917.38 14886.516 Petroleum(Refinery & Marketing) 39945.03 36167.27 30567.297 Fertilizers 23849.95 13010.93 12448.138 Chemicals & Pharmaceuticals 5395.88 5808.04 5076.739 Heavy Engineering 3325.44 5302.24 4852.9710 Medium & Light Engineering 7269.69 8225.34 7915.4611 Transportation Equipment 1989.70 1834.26 1867.3612 Consumer Goods 3921.19 3854.59 10020.3413 Textiles 198970 1834.26 1867.36Sub Total 119348.64 101456.69 93923.88IV. Electricity14 Generation 134368.88 125533.98 112412.7315 Transmission 114678.91 91230.33 75124.01Sub Total 249047.79 216764.31 187536.74V. Services16 Trading & Marketing 7193.77 8528.22 11582.5417 Transport Services 31189.44 27002.75 21866.9018 Contract & Construction Services 15520.07 17045.49 13266.1619 Industrial Development & Tech. Consultancy Services 871.29 778.35 812.8820 Tourist Services 162.99 167.66 212.8021 Financial Services 167901.29 143518.20 122207.0422 Telecommunication Services 17958.32 15071.52 17055.98Sub Total 240797.17 212112.19 187004.30
Grand Total 666848.05 580784.02 513532.45
Table 1.3Gross Block in Top Ten Enterprises, as on 31.3.2011
(` in crore)Sl. CPSEs Investment in terms of
Gross Block*Share in total
Gross Block %)(1) (2) (3) (4)1. Oil & Natural Gas Corporation Ltd. 195769.65 15.492. Bharat Sanchar Nigam Ltd. 172338.10 13.643. NTPC Ltd. 111025.78 8.794. Indian Oil Corporation Ltd. 105785.29 8.375. Power Grid Corporation of India Ltd. 76976.37 6.096. Steel Authority of India Ltd. 60489.03 4.797. NHPC Ltd. 39997.37 3.178. Air India Ltd. 37337.31 2.959. Nuclear Power Corporation of India Ltd. 37265.29 2.9410. Hindustan Petroleum Corpn. Ltd. 33447.09 2.65
Total Top Ten (CPSEs) 870431.28 68.88Total Gross Block 1263664.85 -
* Gross Block inclusive of Capital-work-in progress.
9Public Enterprises Survey 2010-2011
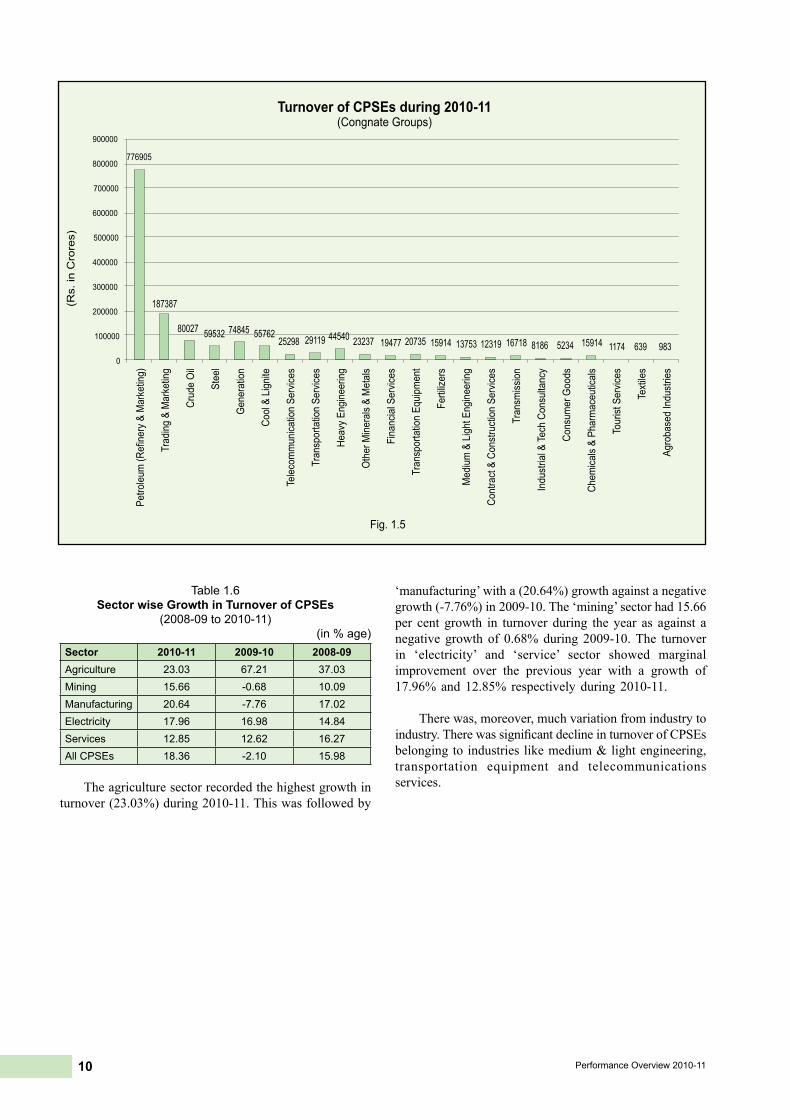
1.5 Turnover in CPSEsGrosssales/turnoverofCPSEshasbeenrobustduring
2010-11.The turnoverofCPSEs (at theaggregate level)
increased by 18.36 per cent in 2010-11 over 2009-10againstdeclineof2.10percentin2009-10over2008-09(Table 1.5&1.6).
Table 1.5Group-wise Turnover in CPSEs
(2008-09 to 2010-11)(` in crore)
Sl.No.
Sector/ Cognate Group Turnover
31.3.2011 31.3.2010 31.3.2009
(1) (2) (3) (4) (5)
I. Agriculture
1 Agro Based Industries 938.11 762.52 456.03
Sub Total 938.11 762.52 456.03
II. Mining
2 Coal & Lignite 55762.47 48556.04 42997.93
3 Crude Oil 80026.52 72946.10 77450.16
4 Other Minerals & Metals 23237.39 15991.69 17984.60
Sub Total 159026.38 137493.83 138432.69
III. Manufacturing
5 Steel 59531.84 55521.87 60057.57
6 Petroleum(Refinery & Marketing) 776905.26 629876.95 703966.35
7 Fertilizers 15914.09 14495.58 17011.72
8 Chemicals & Pharmaceuticals 1581.00 1387.74 1498.06
9 Heavy Engineering 44539.56 35184.78 28855.72
10 Medium & Light Engineering 13753.39 15064.96 11114.62
11 Transportation Equipment 20734.69 21242.57 16394.37
12 Consumer Goods 5234.45 4919.83 4340.73
13 Textiles 638.97 490.28 415.40
Sub Total 938833.25 778184.56 843654.54
IV. Electricity
14 Generation 74844.92 63836.23 55832.60
15 Transmission 16717.86 13782.97 10518.89
Sub Total 91562.78 77619.20 66351.49
V. Services
16 Trading & Marketing 187387.01 161225.79 137268.02
17 Transport Services 29118.94 27329.93 27561.67
18 Contract & Construction Services 12319.08 11862.57 9769.82
19 Industrial Development & Tech. Consultancy Services 8185.59 6554.44 5543.49
20 Tourist Services 1174.11 1021.10 1025.87
21 Financial Services 19476.70 16539.32 13765.12
22 Telecommunication Services 25297.54 26212.09 27706.77
Sub Total 282958.97 250745.24 222640.76
Grand Total 1473319.49 1244805.35 1271535.51
10 Performance Overview 2010-11
Table 1.6 Sector wise Growth in Turnover of CPSEs
(2008-09 to 2010-11)(in % age)
Sector 2010-11 2009-10 2008-09Agriculture 23.03 67.21 37.03Mining 15.66 -0.68 10.09Manufacturing 20.64 -7.76 17.02Electricity 17.96 16.98 14.84Services 12.85 12.62 16.27All CPSEs 18.36 -2.10 15.98
Theagriculturesectorrecordedthehighestgrowthinturnover(23.03%)during2010-11.Thiswasfollowedby
‘manufacturing’witha(20.64%)growthagainstanegativegrowth(-7.76%)in2009-10.The‘mining’sectorhad15.66per cent growth in turnover during the year as against anegative growthof 0.68%during2009-10.The turnoverin ‘electricity’ and ‘service’ sector showed marginalimprovement over the previous year with a growth of17.96%and12.85% respectivelyduring2010-11.
Therewas,moreover,muchvariationfromindustrytoindustry.TherewassignificantdeclineinturnoverofCPSEsbelongingtoindustrieslikemedium&lightengineering,transportation equipment and telecommunicationsservices.
11Public Enterprises Survey 2010-2011
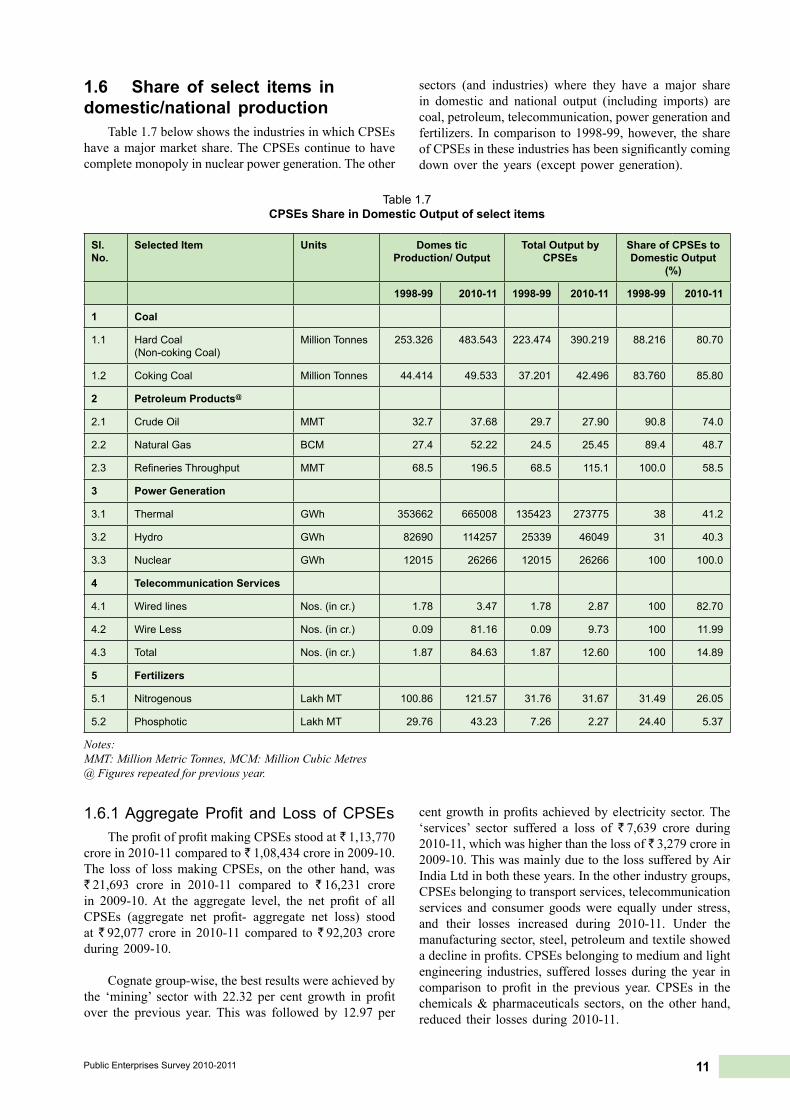
1.6 Share of select items in domestic/national production
Table1.7belowshowstheindustriesinwhichCPSEshaveamajormarketshare.TheCPSEscontinue tohavecompletemonopolyinnuclearpowergeneration.Theother
sectors (and industries) where they have a major sharein domestic and national output (including imports) arecoal,petroleum,telecommunication,powergenerationandfertilizers. Incomparison to1998-99,however, theshareofCPSEsintheseindustrieshasbeensignificantlycomingdownover theyears (except powergeneration).
Table 1.7CPSEs Share in Domestic Output of select items
Sl.No.
Selected Item Units Domes tic Production/ Output
Total Output by CPSEs
Share of CPSEs to Domestic Output
(%)
1998-99 2010-11 1998-99 2010-11 1998-99 2010-11
1 Coal
1.1 Hard Coal(Non-coking Coal)
Million Tonnes 253.326 483.543 223.474 390.219 88.216 80.70
1.2 Coking Coal Million Tonnes 44.414 49.533 37.201 42.496 83.760 85.80
2 Petroleum Products@
2.1 Crude Oil MMT 32.7 37.68 29.7 27.90 90.8 74.0
2.2 Natural Gas BCM 27.4 52.22 24.5 25.45 89.4 48.7
2.3 Refineries Throughput MMT 68.5 196.5 68.5 115.1 100.0 58.5
3 Power Generation
3.1 Thermal GWh 353662 665008 135423 273775 38 41.2
3.2 Hydro GWh 82690 114257 25339 46049 31 40.3
3.3 Nuclear GWh 12015 26266 12015 26266 100 100.0
4 Telecommunication Services
4.1 Wired lines Nos. (in cr.) 1.78 3.47 1.78 2.87 100 82.70
4.2 Wire Less Nos. (in cr.) 0.09 81.16 0.09 9.73 100 11.99
4.3 Total Nos. (in cr.) 1.87 84.63 1.87 12.60 100 14.89
5 Fertilizers
5.1 Nitrogenous Lakh MT 100.86 121.57 31.76 31.67 31.49 26.05
5.2 Phosphotic Lakh MT 29.76 43.23 7.26 2.27 24.40 5.37
Notes:MMT: Million Metric Tonnes, MCM: Million Cubic Metres@ Figures repeated for previous year.
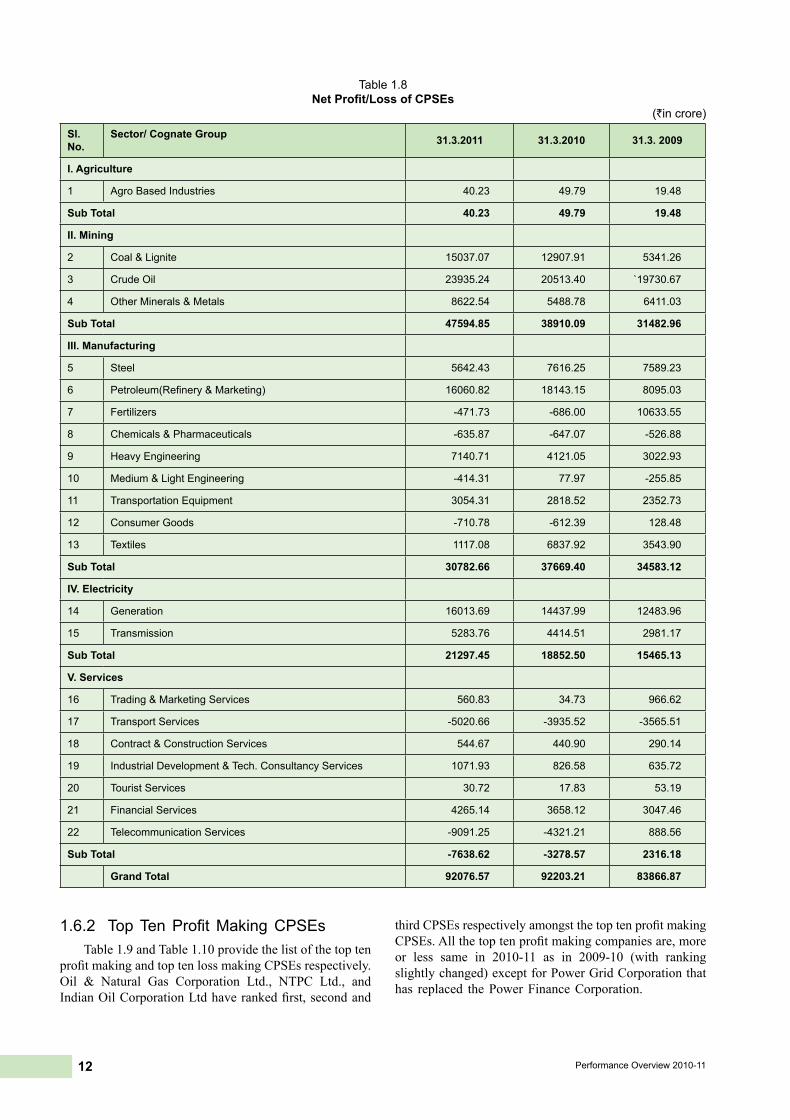
1.6.1 Aggregate Profit and Loss of CPSEsTheprofitofprofitmakingCPSEsstoodat` 1,13,770
crorein2010-11comparedto` 1,08,434crorein2009-10.The loss of lossmakingCPSEs, on the other hand,was` 21,693 crore in 2010-11 compared to ` 16,231 crorein 2009-10.At the aggregate level, the net profit of allCPSEs (aggregate net profit- aggregate net loss) stoodat` 92,077crore in2010-11compared to` 92,203croreduring 2009-10.
Cognategroup-wise,thebestresultswereachievedbythe ‘mining’ sectorwith 22.32 per cent growth in profitover the previous year. Thiswas followed by 12.97 per
centgrowth inprofitsachievedbyelectricity sector.The‘services’ sector suffered a loss of ` 7,639 crore during2010-11,whichwashigherthanthelossof` 3,279crorein2009-10.ThiswasmainlyduetothelosssufferedbyAirIndiaLtdinboththeseyears.Intheotherindustrygroups,CPSEsbelongingtotransportservices,telecommunicationservices and consumer goodswere equally under stress,and their losses increased during 2010-11. Under themanufacturingsector,steel,petroleumandtextileshowedadeclineinprofits.CPSEsbelongingtomediumandlightengineering industries, suffered lossesduring theyear incomparison to profit in the previous year. CPSEs in thechemicals&pharmaceuticals sectors, on theother hand,reduced their losses during2010-11.
12 Performance Overview 2010-11
Table 1.8NetProfit/LossofCPSEs
(`in crore)
Sl.No.
Sector/ Cognate Group 31.3.2011 31.3.2010 31.3. 2009
I. Agriculture
1 Agro Based Industries 40.23 49.79 19.48
Sub Total 40.23 49.79 19.48
II. Mining
2 Coal & Lignite 15037.07 12907.91 5341.26
3 Crude Oil 23935.24 20513.40 `19730.67
4 Other Minerals & Metals 8622.54 5488.78 6411.03
Sub Total 47594.85 38910.09 31482.96
III. Manufacturing
5 Steel 5642.43 7616.25 7589.23
6 Petroleum(Refinery & Marketing) 16060.82 18143.15 8095.03
7 Fertilizers -471.73 -686.00 10633.55
8 Chemicals & Pharmaceuticals -635.87 -647.07 -526.88
9 Heavy Engineering 7140.71 4121.05 3022.93
10 Medium & Light Engineering -414.31 77.97 -255.85
11 Transportation Equipment 3054.31 2818.52 2352.73
12 Consumer Goods -710.78 -612.39 128.48
13 Textiles 1117.08 6837.92 3543.90
Sub Total 30782.66 37669.40 34583.12
IV. Electricity
14 Generation 16013.69 14437.99 12483.96
15 Transmission 5283.76 4414.51 2981.17
Sub Total 21297.45 18852.50 15465.13
V. Services
16 Trading & Marketing Services 560.83 34.73 966.62
17 Transport Services -5020.66 -3935.52 -3565.51
18 Contract & Construction Services 544.67 440.90 290.14
19 Industrial Development & Tech. Consultancy Services 1071.93 826.58 635.72
20 Tourist Services 30.72 17.83 53.19
21 Financial Services 4265.14 3658.12 3047.46
22 Telecommunication Services -9091.25 -4321.21 888.56
Sub Total -7638.62 -3278.57 2316.18
Grand Total 92076.57 92203.21 83866.87
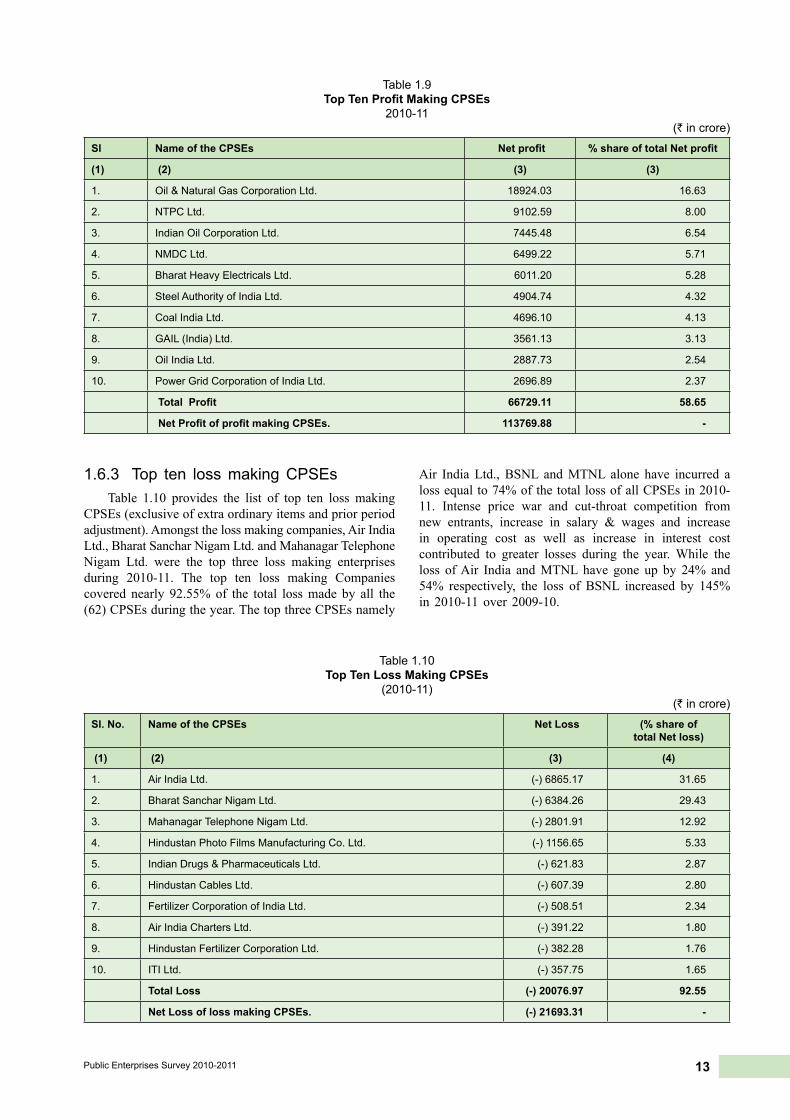
1.6.2 Top Ten Profit Making CPSEsTable1.9andTable1.10providethelistofthetopten
profitmakingandtoptenlossmakingCPSEsrespectively.Oil & Natural Gas Corporation Ltd., NTPC Ltd., andIndianOilCorporationLtdhaverankedfirst,secondand
thirdCPSEsrespectivelyamongstthetoptenprofitmakingCPSEs.Allthetoptenprofitmakingcompaniesare,moreor less same in 2010-11 as in 2009-10 (with rankingslightlychanged)exceptforPowerGridCorporationthathas replaced thePowerFinanceCorporation.
13Public Enterprises Survey 2010-2011
1.6.3 Top ten loss making CPSEs Table 1.10 provides the list of top ten loss making
CPSEs(exclusiveofextraordinaryitemsandpriorperiodadjustment).Amongstthelossmakingcompanies,AirIndiaLtd.,BharatSancharNigamLtd.andMahanagarTelephoneNigam Ltd. were the top three loss making enterprisesduring 2010-11. The top ten loss making Companiescovered nearly 92.55%of the total lossmade by all the(62)CPSEsduringtheyear.ThetopthreeCPSEsnamely
Air India Ltd., BSNL andMTNL alone have incurred alossequalto74%ofthetotallossofallCPSEsin2010-11. Intense price war and cut-throat competition fromnew entrants, increase in salary & wages and increasein operating cost as well as increase in interest costcontributed to greater losses during the year.While theloss ofAir India andMTNL have gone up by 24% and54% respectively, the loss of BSNL increased by 145%in 2010-11 over 2009-10.
Table 1.9TopTenProfitMakingCPSEs
2010-11(` in crore)
Sl Name of the CPSEs Netprofit %shareoftotalNetprofit
(1) (2) (3) (3)
1. Oil & Natural Gas Corporation Ltd. 18924.03 16.63
2. NTPC Ltd. 9102.59 8.00
3. Indian Oil Corporation Ltd. 7445.48 6.54
4. NMDC Ltd. 6499.22 5.71
5. Bharat Heavy Electricals Ltd. 6011.20 5.28
6. Steel Authority of India Ltd. 4904.74 4.32
7. Coal India Ltd. 4696.10 4.13
8. GAIL (India) Ltd. 3561.13 3.13
9. Oil India Ltd. 2887.73 2.54
10. Power Grid Corporation of India Ltd. 2696.89 2.37
TotalProfit 66729.11 58.65
NetProfitofprofitmakingCPSEs. 113769.88 -
Table 1.10Top Ten Loss Making CPSEs
(2010-11) (` in crore)
Sl. No. Name of the CPSEs Net Loss (% share of total Net loss)
(1) (2) (3) (4)
1. Air India Ltd. (-) 6865.17 31.65
2. Bharat Sanchar Nigam Ltd. (-) 6384.26 29.43
3. Mahanagar Telephone Nigam Ltd. (-) 2801.91 12.92
4. Hindustan Photo Films Manufacturing Co. Ltd. (-) 1156.65 5.33
5. Indian Drugs & Pharmaceuticals Ltd. (-) 621.83 2.87
6. Hindustan Cables Ltd. (-) 607.39 2.80
7. Fertilizer Corporation of India Ltd. (-) 508.51 2.34
8. Air India Charters Ltd. (-) 391.22 1.80
9. Hindustan Fertilizer Corporation Ltd. (-) 382.28 1.76
10. ITI Ltd. (-) 357.75 1.65
Total Loss (-) 20076.97 92.55
Net Loss of loss making CPSEs. (-) 21693.31 -
14 Performance Overview 2010-11
1.7 Contribution to GDP
1.7.1 Gross Value Addition by CPSEsThe share of ‘gross value addition’ in CPSEs (net
valueaddition+depreciation)inGrossDomesticProduct(atcurrentmarketprice)stoodat5.96percentin2010-11againstashareof6.44percentin2009-10.If,however,theunder-recoveries of oilmarketing companies (amountingto` 37,190crorein2010-11and` 29,951crorein2009-10) are included, then the share of all CPSEs in GDPgoes up to 6.45 per cent in 2010-11 and 6.75 per centin 2009-10.
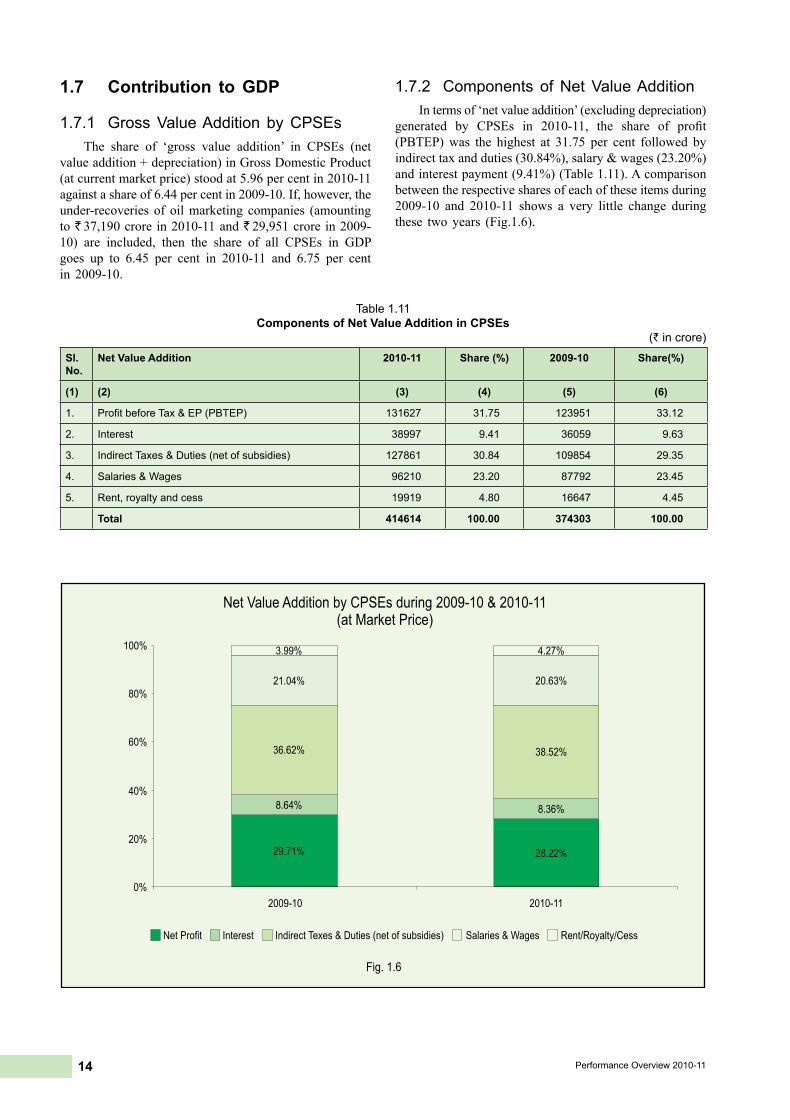
1.7.2 Components of Net Value AdditionIntermsof‘netvalueaddition’(excludingdepreciation)
generated by CPSEs in 2010-11, the share of profit(PBTEP)was the highest at 31.75 per cent followed byindirecttaxandduties(30.84%),salary&wages(23.20%)andinterestpayment(9.41%)(Table1.11).Acomparisonbetweentherespectivesharesofeachoftheseitemsduring2009-10 and 2010-11 shows a very little change duringthese twoyears (Fig.1.6).
Table 1.11Components of Net Value Addition in CPSEs
(` in crore)
Sl. No.
Net Value Addition 2010-11 Share (%) 2009-10 Share(%)
(1) (2) (3) (4) (5) (6)
1. Profit before Tax & EP (PBTEP) 131627 31.75 123951 33.12
2. Interest 38997 9.41 36059 9.63
3. Indirect Taxes & Duties (net of subsidies) 127861 30.84 109854 29.35
4. Salaries & Wages 96210 23.20 87792 23.45
5. Rent, royalty and cess 19919 4.80 16647 4.45
Total 414614 100.00 374303 100.00
15Public Enterprises Survey 2010-2011
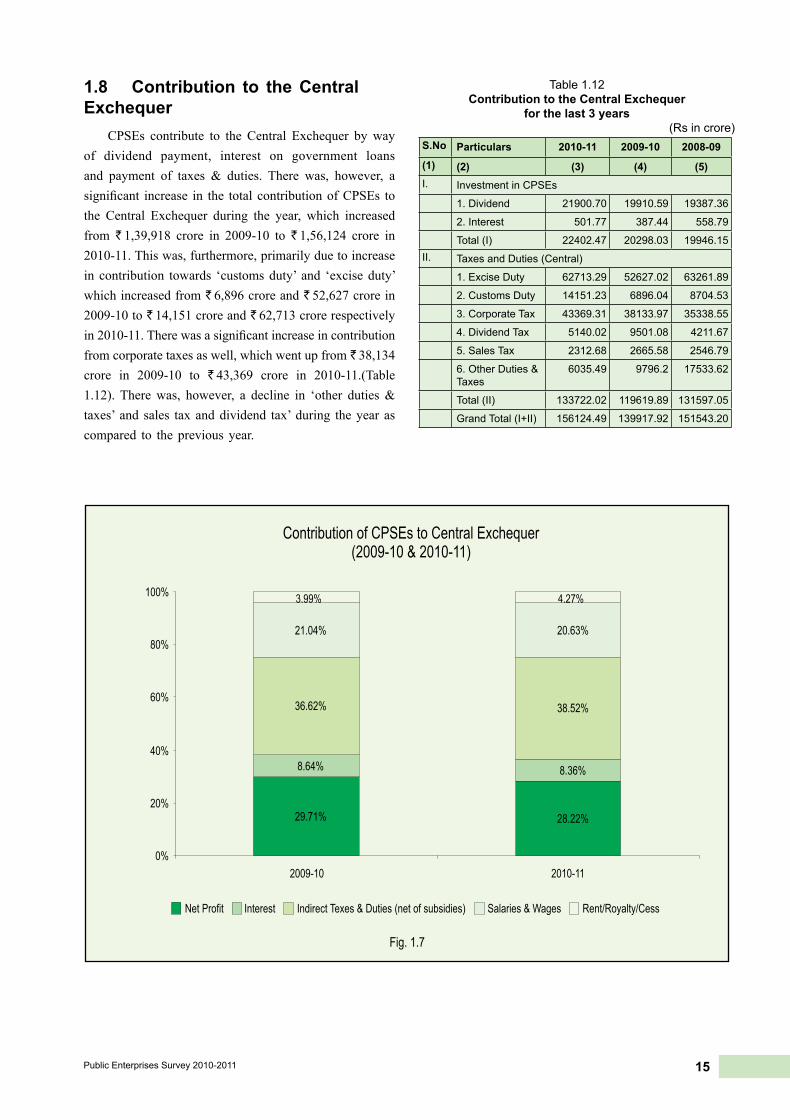
1.8 Contribution to the Central Exchequer
CPSEs contribute to the Central Exchequer by wayof dividend payment, interest on government loansand payment of taxes & duties. There was, however, asignificant increase in the total contributionofCPSEs tothe Central Exchequer during the year, which increasedfrom ` 1,39,918 crore in 2009-10 to ` 1,56,124 crore in2010-11.Thiswas,furthermore,primarilyduetoincreasein contribution towards ‘customsduty’ and ‘exciseduty’whichincreasedfrom` 6,896croreand` 52,627crorein2009-10to` 14,151croreand` 62,713crorerespectivelyin2010-11.Therewasasignificantincreaseincontributionfromcorporatetaxesaswell,whichwentupfrom` 38,134crore in 2009-10 to ` 43,369 crore in 2010-11.(Table1.12). Therewas, however, a decline in ‘other duties&taxes’ and sales taxanddividend tax’during theyear ascompared to thepreviousyear.
Table 1.12Contribution to the Central Exchequer
for the last 3 years(Rs in crore)
S.No Particulars 2010-11 2009-10 2008-09(1) (2) (3) (4) (5)I. Investment in CPSEs
1. Dividend 21900.70 19910.59 19387.36
2. Interest 501.77 387.44 558.79
Total (I) 22402.47 20298.03 19946.15II. Taxes and Duties (Central)
1. Excise Duty 62713.29 52627.02 63261.89
2. Customs Duty 14151.23 6896.04 8704.53
3. Corporate Tax 43369.31 38133.97 35338.55
4. Dividend Tax 5140.02 9501.08 4211.67
5. Sales Tax 2312.68 2665.58 2546.79
6. Other Duties & Taxes
6035.49 9796.2 17533.62
Total (II) 133722.02 119619.89 131597.05
Grand Total (I+II) 156124.49 139917.92 151543.20
16 Performance Overview 2010-11
1.9 Government Disinvestment in CPSEs
Thepolicyon‘DisinvestmentinCPSEs’hasevolvedover the years. Disinvestment of Government equityin CPSEs began in 1991-92. The current policy ondisinvestment was approved by the Government on 5th November,2009.Theobjectiveofdisinvestmentpolicywastodeveloppeople’sownershipofCPSEsand to share intheirwealthandprosperitywhileensuringthatgovernmentequity does not fall below51%andGovernment retainsthemanagement control.
Keeping in view the policy on disinvestment, thefollowing approach to disinvestment inCPSEs has beenadopted:
i) AlreadylistedprofitableCPSEs(notmeetingthemandatoryshareholdingof10%)aretobemadecompliantbyOfferforsalebyGovernmentorbytheCPSEsthroughissueoffreshoracombinationof both.
ii) Unlisted CPSEs with no accumulated lossesand having earned net profit in three precedingconsecutiveyears are to be listed.
iii) Follow-onpublic offerswould be considered inrespectofprofitableCPSEshaving10%orhigherpublic ownership, taking into consideration theneedsforcapitalinvestmentofCPSE,onacasebycasebasisandGovernmentcouldsimultaneouslyor independently offer a portion of its equityshareholding in conjunction.
iv) Disinvestment is to be considered onmerit andon a case to case basis as each CPSE has adifferentequitystructure;financialstrength;fundrequirement;sectorofoperationandfactorsthatdonotpermitauniformpatternofdisinvestment.Thus,disinvestment isconsideredonmeritsandon a case-by-casebasis.
1.10 Revival of Sick CPSEs The condition of sick CPSEs (i.e, CPSEs whose
accumulated losses have exceeded their net worth) hasbeenimprovingovertheyears.ThenumberofsickCPSEs,whichwas105inMarch,2003camedownto64inMarch2011.TheCPSEswerebroughtunderthepurviewofSickIndustrialCompanies(SpecialProvision)Act,1985(SICA)which was subsequently amended in 1991 and madeeffectivefrom1992. Outofthe64 CPSEsregisteredwithBoardforIndustrialandFinancialReconstruction(BIFR)till30.6.2011,theBIFRhasalreadydisposedof48casesofCPSEseitherthroughsanctioningrevivalschemes(15cases),ordeclaring‘nolongersick’(2cases)ordroppingduetonetworthbecomingpositive(5cases)ordismissingthecasesasnon-maintainable(4cases)orderegisteredwithBIFR/others(2cases)orrecommendingwindingup(19
cases)orwindingupnoticeissued(onecase).TheBIFRis yet to take further viewon16 cases ofCPSEs.
The Government subsequently set up the Board forReconstruction of Public Sector Enterprises (BRPSE) inDecember,2004toadvise theGovernment, interalia,onthe measures to restructure/revive, both industrial andnon-industrial CPSEs. Out of the 43 CPSEs, 24 CPSEshavepostedprofits.Outofthese24CPSEs,13havebeendeclared as turnaround companies as they have been inprofits (profit before tax) continuously for three yearsand more.
Up to October 2011, cases of 67 sick CPSEs havebeen referred to BRPSE; out of which the Board hasmaderecommendationsinrespectof62cases.Remaining5 cases were remitted to the concerned administrativeMinistries. Out of these 62 cases as on 31.10.2011, theGovernmenthasapprovedrevivalproposalsinrespectof43 cases ofCPSEs.
1.11 Board Structure of CPSEsTheCPSEsarecategorizedinfourSchedulesnamely
‘A’, ‘B’, ‘C’ and ‘D’ based on various quantitative,qualitative and other factors. The pay scales of ChiefExecutivesandoffulltimeFunctionalDirectorsinCPSEsare determined as per the Schedule of the concernedCPSE. Proposals fromvarious administrativeMinistries/Departments for initial categorization / up-gradation ofCPSEs in appropriate schedule, personal up-gradation,creation of posts in CPSEs, etc. are considered in DPEin consultation with the Public Enterprises SelectionBoard (PESB).
There are 60 Schedule ‘A’, 71 Schedule ‘B’, 46 Schedule‘C’,4Schedule‘D’and67uncategorisedCPSEsason31.3.2011.OneCPSE(THDCIndiaLtd.)hasbeenupgradedfromSchedule‘B’ toSchedule‘A’ ,oneCPSE(HindustanPrefabLtd.hasbeenupgradedfromSchedule‘D’ to ‘C’, one CPSE (Orissa Mineral DevelopmentCorporation) has been categorized as a Schedule ‘B’CPSE and oneCPSE (BisraStoneLimeCompanyLtd.)has been categorized as aSchedule ‘C’CPSE.
1.11.1 Professionalization of BoardsInpursuancetothepolicyonpublicsectorenterprises
being followed since 1991, several measures havebeen taken by the Department of Public Enterprises toprofessionalize the Boards of public enterprises. Theguidelines issued byDPE in 1992 provide for inductionof outside professionals on the Boards of CPSEs aspart-time non-official Directors. The revised guidelinesprovide that the number of functional Directors shouldnot exceed 50% of the actual strength of the Board ofDirectors(BOD)andthenumberofGovernmentnomineeDirectorsontheBODshouldnotexceedtwo.InthecaseoflistedCPSEswithanExecutiveChairman,theguidelinesprovidethatthenumberofnon-officialDirectorsshallbeatleast50%oftheBoardMembers.InthecaseofCPSEswithaNon-executiveChairman,at leastone-thirdof the
17Public Enterprises Survey 2010-2011
Board Members will have to be non-official Directors.TheFunctionalDirectorsincludingtheChiefExecutiveoftheCPSEsareappointedbytheconcernedadministrativeMinistriesontherecommendationofthePublicEnterprisesSelection Board (PESB). It has been decided that thecandidates from State Level Public Enterprises (SLPEs)and the private sector will also be considered as non-internal candidates besides the candidates from CPSEsforselectiontothepostofFunctionalDirectorsinCPSEssubject to the eligibility criteria.
1.12 Wages/ Salaries and Employees Welfare
TheDepartmentofPublicEnterprises(DPE)functionsas the nodal Department in the Government of India,inter-alia,inrespectofpolicyrelatingtowagesettlementsof unionized employees, pay revision of non-unionizedsupervisors and the executives holding posts below theBoard levelandexecutivesat theBoard level inCPSEs.TheCPSEsare largely following the IndustrialDearnessAllowance (IDA) pattern scales of pay. In some cases,Central DearnessAllowance (CDA) pattern of scales ofpay is followed inCPSEs.
1.12.1 Industrial Dearness Allowance (IDA) TheGovernmentpolicyrelatingtopayscalesandpay
patternisbroadlythatallemployeesofCPSEsshouldbeonIDApatternandrelatedscalesofpay.InstructionshadbeenissuedtoalltheadministrativeMinistriesbyDPEinJuly1981andJuly1984thatasandwhenanewCPSEiscreated or established, IDApattern and related scales ofpayshouldbeadoptedab-initio. DPEvideitsO.M.dated10.08.2009 has reiterated that ‘appointments’ including‘promotion’onorafter01.01.1989inCDAscalesofpayhas to be in IDA scales of pay. Therewere all together248CPSEs(excludingBanks,InsuranceCompaniesundertheadministrativecontroloftheCentralGovernmentason31.3.2011).Theyemployed14.44lakhworkmen,clericalstaffandexecutivesason31.3.2011.Outof this,around96%oftheworkmenandexecutivesareonIDApatternand related scales of pay.
The last pay revision for the IDA executives andnon-unionized supervisors was done w.e.f 1.1.97 for aperiod of ten years based on the recommendations ofJusticeMohanCommittee(1stPayRevisionCommittee).The duration of this pay revision was for 10 years i.e.upto 31.12.2006. The Second Pay Revision Committee(2nd PRC), headed by Justice M. Jagannadha Rao, wasconstitutedvidetheGovernmentofIndiaResolutiondated30.11.2006.TheGovernment, after due consideration oftherecommendationsof the2ndPayRevisionCommitteeissued orders on 26.11.2008 and 09.02.2009 for the payrevisionofBoardlevelandbelowBoardlevelexecutives(includingnon-unionized supervisors).
1.12.2 Central Dearness Allowance (CDA)DPEvideitsOMdated14.10.2008and20.1.2009has
revisedthepayscalesoftheemployeesofCPSEsfollowing
CDA pattern w.e.f. 01.01.2006, based on GovernmentdecisioninrespectofCentralGovernmentemployees.Thebenefitofpayrevisionwasallowedonlytotheemployeesof thoseCPSEswhich are not lossmaking and are in aposition to absorb the additional expenditure on accountof pay revision from their own resources without anybudgetarysupportfromtheGovernment.Ithasalsobeenindicated that theBoardofDirectorswouldconsider theproposal of pay revision of all the employees in CPSE,keeping in mind the affordability and capacity of theCPSEtopayandsubmitaproposal to itsAdministrativeMinistry/Department, which will approve the proposalwith theconcurrenceof itsFinancialAdvisor.VideDPEO.M.dated.20.1.2009,guidelineson revisedallowancesfor these employeeshave alsobeen issued.
1.13 EmploymentAson31.3.2011,the248CPSEsemployedover14.44
lakhpeople(excludingcasualworkers).One-fourthofthemanpower belong tomanagerial and supervisory cadres.TheCPSEs have thus a highly skilledworkforce,whichisoneoftheirbasicstrengths.ThedetailsofemploymentinCPSEsandpercapitaemolumentsareshowninTable1.13.
Table 1.13Employment and Average Annual Emoluments
Year Employees (in lakh) (Excl. casual & Daily rated workers)
Total Emoluments (` in crore)
Per Capita Emoluments
(Rupees)
2006-07 16.14 52586 325869
2007-08 15.65 64306 410898
2008-09 15.33 83045 541716
2009-10 14.90 87792 589210
2010-11 14.44 96210 666276
1.14 Voluntary Retirement Scheme (VRS)
TheCPSEsoperateunderdynamicmarketconditions;while, some of them may face shortage of staff, othersmayhaveexcessmanpower.TheGovernment, therefore,initiated a Voluntary Retirement Scheme (VRS) to helprationalize their manpower. The basic parameters of themodelVoluntaryRetirement Scheme (VRS)whichwerenotified by the Government vide Department of PublicEnterprises’ OM dated 5.10.1988 and 6.1.1989 were inforcesince1988tillApril2000.TheGovernmentmodifiedthe scheme and introduced a new scheme of VRS on5.5.2000 and again on 6.11.2001. As per the availableinformation,about3.57lakhemployeesoptedforVoluntaryRetirement Scheme (VRS) during the period beginningwith1988 till 31.3.2011.
1.14.1 Counseling, Retraining and Redeployment (CRR)
Counseling,Retraining andRedeployment (CRR) isanattempttoenabletheVRSopteesinCPSEstoremainproductivepartnersinthesociety.Accordingly,theNational
18 Performance Overview 2010-11
Renewal Fund (NRF) that was established in February,1992, aimed to coverboth theexpensesofVRSand theexpenditure on retraining of retrenched workers in theorganizedsector.ThemainelementsofCRRprogrammeareCounseling,RetrainingandRedeployment.Counselinghelps the rationalized employees to absorb the shock ofleaving the organization, to properlymanage their fundsincludingcompensationandtomotivatethemtofacethechallengesandtore-jointheproductiveprocess.Similarly,retrainingstrengthens their skill / expertise.Theselectedtraininginstitute/nodalagenciesimpartsneed-basedtrainingof 30 days/ 40 days / 60 day’s modules. The trainingleads to redeployment mostly through self-employment.Presently, the objective is to maximize the rate of self-employment. The nodal Agencies, therefore, provideneed based support, linkage with credit institutions andcontinuously followupwith the retrainedpersonnel.
1.15 Memorandum of Understanding (MOU) system in CPSEs
The Memorandum of Understanding (MoU), asapplicable to public sector enterprises, is a negotiateddocument between the government and themanagementof the enterprise specifying clearly the objectives of theagreementandtheobligationsofboththeparties.Themainpurpose of theMoU system is to ensure a level playingfield to thepublic sector enterprisesvis-à-vis theprivatecorporate sector. The ‘management’ of the enterprise is,nevertheless,madeaccountabletothegovernmentthroughpromise for performance or ‘performance contract’.Thegovernment,nevertheless,continues tohavecontroloverthese enterprises through setting targets in thebeginningof the year and by ‘performance evaluation’ at the endof theyear.
Performance evaluation is done based on thecomparisonbetweentheactualachievementsandtheannualtargetsagreeduponbetweenthegovernmentandtheCPSE.The targetsconstituteofbothfinancial andnon-financial
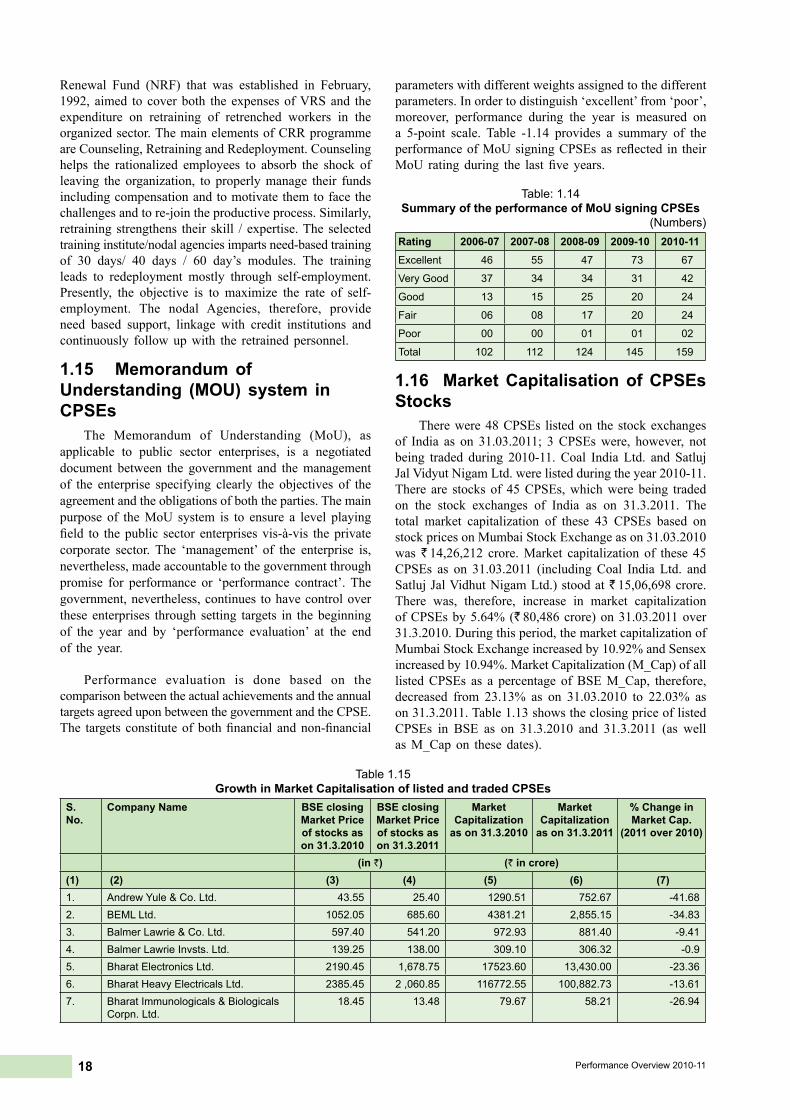
parameterswithdifferentweightsassignedtothedifferentparameters.Inordertodistinguish‘excellent’from‘poor’,moreover, performance during the year is measured ona 5-point scale. Table -1.14 provides a summary of theperformanceofMoUsigningCPSEsas reflected in theirMoU ratingduring the lastfiveyears.
Table: 1.14 Summary of the performance of MoU signing CPSEs
(Numbers)Rating 2006-07 2007-08 2008-09 2009-10 2010-11Excellent 46 55 47 73 67
Very Good 37 34 34 31 42
Good 13 15 25 20 24
Fair 06 08 17 20 24
Poor 00 00 01 01 02
Total 102 112 124 145 159
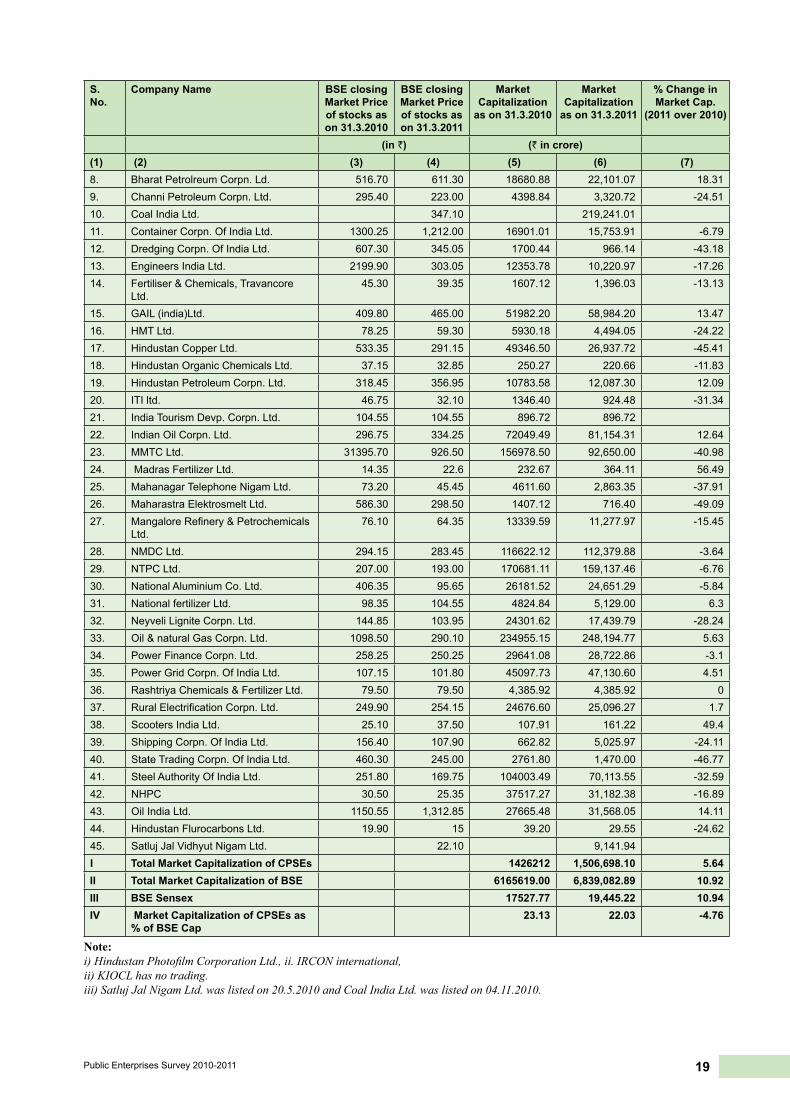
1.16 Market Capitalisation of CPSEs Stocks
Therewere48CPSEs listedon the stockexchangesof India as on 31.03.2011; 3CPSEswere, however, notbeing traded during 2010-11.Coal India Ltd. and SatlujJalVidyutNigamLtd.werelistedduringtheyear2010-11.There are stocksof 45CPSEs,whichwerebeing tradedon the stock exchanges of India as on 31.3.2011. Thetotal market capitalization of these 43 CPSEs based onstockpricesonMumbaiStockExchangeason31.03.2010was ` 14,26,212 crore.Market capitalization of these 45CPSEs as on 31.03.2011 (includingCoal India Ltd. andSatlujJalVidhutNigamLtd.)stoodat` 15,06,698crore.There was, therefore, increase in market capitalizationofCPSEsby5.64%(` 80,486crore)on31.03.2011over31.3.2010.Duringthisperiod,themarketcapitalizationofMumbaiStockExchangeincreasedby10.92%andSensexincreasedby10.94%.MarketCapitalization(M_Cap)ofalllistedCPSEs as a percentage ofBSEM_Cap, therefore,decreased from 23.13% as on 31.03.2010 to 22.03% ason31.3.2011.Table1.13showstheclosingpriceoflistedCPSEs in BSE as on 31.3.2010 and 31.3.2011 (as wellasM_Capon thesedates).
Table 1.15Growth in Market Capitalisation of listed and traded CPSEs
S. No.
Company Name BSE closing Market Price of stocks as on 31.3.2010
BSE closing Market Price of stocks as on 31.3.2011
Market Capitalization
as on 31.3.2010
Market Capitalization
as on 31.3.2011
% Change in Market Cap.
(2011 over 2010)
(in `) (` in crore)(1) (2) (3) (4) (5) (6) (7)1. Andrew Yule & Co. Ltd. 43.55 25.40 1290.51 752.67 -41.682. BEML Ltd. 1052.05 685.60 4381.21 2,855.15 -34.833. Balmer Lawrie & Co. Ltd. 597.40 541.20 972.93 881.40 -9.414. Balmer Lawrie Invsts. Ltd. 139.25 138.00 309.10 306.32 -0.95. Bharat Electronics Ltd. 2190.45 1,678.75 17523.60 13,430.00 -23.366. Bharat Heavy Electricals Ltd. 2385.45 2 ,060.85 116772.55 100,882.73 -13.617. Bharat Immunologicals & Biologicals
Corpn. Ltd.18.45 13.48 79.67 58.21 -26.94
19Public Enterprises Survey 2010-2011
S. No.
Company Name BSE closing Market Price of stocks as on 31.3.2010
BSE closing Market Price of stocks as on 31.3.2011
Market Capitalization
as on 31.3.2010
Market Capitalization
as on 31.3.2011
% Change in Market Cap.
(2011 over 2010)
(in `) (` in crore)(1) (2) (3) (4) (5) (6) (7)8. Bharat Petrolreum Corpn. Ld. 516.70 611.30 18680.88 22,101.07 18.319. Channi Petroleum Corpn. Ltd. 295.40 223.00 4398.84 3,320.72 -24.5110. Coal India Ltd. 347.10 219,241.0111. Container Corpn. Of India Ltd. 1300.25 1,212.00 16901.01 15,753.91 -6.7912. Dredging Corpn. Of India Ltd. 607.30 345.05 1700.44 966.14 -43.1813. Engineers India Ltd. 2199.90 303.05 12353.78 10,220.97 -17.2614. Fertiliser & Chemicals, Travancore
Ltd.45.30 39.35 1607.12 1,396.03 -13.13
15. GAIL (india)Ltd. 409.80 465.00 51982.20 58,984.20 13.4716. HMT Ltd. 78.25 59.30 5930.18 4,494.05 -24.2217. Hindustan Copper Ltd. 533.35 291.15 49346.50 26,937.72 -45.4118. Hindustan Organic Chemicals Ltd. 37.15 32.85 250.27 220.66 -11.8319. Hindustan Petroleum Corpn. Ltd. 318.45 356.95 10783.58 12,087.30 12.0920. ITI ltd. 46.75 32.10 1346.40 924.48 -31.3421. India Tourism Devp. Corpn. Ltd. 104.55 104.55 896.72 896.7222. Indian Oil Corpn. Ltd. 296.75 334.25 72049.49 81,154.31 12.6423. MMTC Ltd. 31395.70 926.50 156978.50 92,650.00 -40.9824. Madras Fertilizer Ltd. 14.35 22.6 232.67 364.11 56.4925. Mahanagar Telephone Nigam Ltd. 73.20 45.45 4611.60 2,863.35 -37.9126. Maharastra Elektrosmelt Ltd. 586.30 298.50 1407.12 716.40 -49.0927. Mangalore Refinery & Petrochemicals
Ltd. 76.10 64.35 13339.59 11,277.97 -15.45
28. NMDC Ltd. 294.15 283.45 116622.12 112,379.88 -3.6429. NTPC Ltd. 207.00 193.00 170681.11 159,137.46 -6.7630. National Aluminium Co. Ltd. 406.35 95.65 26181.52 24,651.29 -5.8431. National fertilizer Ltd. 98.35 104.55 4824.84 5,129.00 6.332. Neyveli Lignite Corpn. Ltd. 144.85 103.95 24301.62 17,439.79 -28.2433. Oil & natural Gas Corpn. Ltd. 1098.50 290.10 234955.15 248,194.77 5.6334. Power Finance Corpn. Ltd. 258.25 250.25 29641.08 28,722.86 -3.135. Power Grid Corpn. Of India Ltd. 107.15 101.80 45097.73 47,130.60 4.5136. Rashtriya Chemicals & Fertilizer Ltd. 79.50 79.50 4,385.92 4,385.92 037. Rural Electrification Corpn. Ltd. 249.90 254.15 24676.60 25,096.27 1.738. Scooters India Ltd. 25.10 37.50 107.91 161.22 49.439. Shipping Corpn. Of India Ltd. 156.40 107.90 662.82 5,025.97 -24.1140. State Trading Corpn. Of India Ltd. 460.30 245.00 2761.80 1,470.00 -46.7741. Steel Authority Of India Ltd. 251.80 169.75 104003.49 70,113.55 -32.5942. NHPC 30.50 25.35 37517.27 31,182.38 -16.8943. Oil India Ltd. 1150.55 1,312.85 27665.48 31,568.05 14.1144. Hindustan Flurocarbons Ltd. 19.90 15 39.20 29.55 -24.6245. Satluj Jal Vidhyut Nigam Ltd. 22.10 9,141.94I Total Market Capitalization of CPSEs 1426212 1,506,698.10 5.64II Total Market Capitalization of BSE 6165619.00 6,839,082.89 10.92III BSE Sensex 17527.77 19,445.22 10.94IV Market Capitalization of CPSEs as
% of BSE Cap 23.13 22.03 -4.76
Note: i) Hindustan Photofilm Corporation Ltd., ii. IRCON international,ii) KIOCL has no trading. iii) Satluj Jal Nigam Ltd. was listed on 20.5.2010 and Coal India Ltd. was listed on 04.11.2010.
20 Performance Overview 2010-11
Annex 1.1 Central Pubic Sector Enterprises under various Five Year Plans
Sl. No. Ministry / Deptt. / CPSE Year of Incorporation
Holding/Subsidiary Company
Prior to Five Year Plan (1919-50) 1 BIECCOLAWRIE&CO.LTD.* 1919 H2 BALMERLAWRIE&CO.LTD.* 1924 S 3 MAZAGONDOCKLTD. 1934 H4 FERTILIZERS&CHEMICALS(TRAVANCORE)LTD. 1943 H5 NEPALTD. 1947 H6 ITILTD. 1950 H7 INDIANRAREEARTHSLTD. 1950 HFirst Five Year Plan (1951-55) 1 HINDUSTANSHIPYARDLTD. 1952 H2 HMTLTD. 1953 H3 HINDUSTANPREFABLTD. 1953 H4 NATIONALRESEARCHDEVELOPMENTCORPN. 1953 H5 BHARATELECTRONICSLTD. 1954 H6 HINDUSTANANTIBIOTICSLTD. 1954 H7 HINDUSTANINSECTICIDESLTD. 1954 H8 NATIONALSMALLINDUSTRIESCORPN.LTD. 1955 HSecond Five Year Plan (1956-60) 1 NEYVELILIGNITECORPN.LTD. 1956 H2 STATETRADINGCORPN.OFINDIALTD. 1956 H3 OIL&NATURALGASCORPORATIONLTD. 1956 H4 EXPORTCREDITGUARANTEECORPN.OFINDIALTD. 1957 H5 CENTRALWAREHOUSINGCORPN. 1957 H6 NATIONALPROJECTSCONSTRUCTIONCORPN.LTD. 1957 H7 HEAVYENGINEERINGCORPN.LTD. 1958 H8 NMDCLtd. 1958 H9 HINDUSTANSALTSLTD. 1959 H10 HINDUSTANORGANICCHEMICALSLTD. 1960 H11 GARDENREACHSHIPBUILDERS&ENGINEERSLTD. 1960 H12 HINDUSTANPHOTOFILMSMANUFACTURINGCO.LTD. 1960 H13 TUNGABHADRASTEELPRODUCTSLTD. 1960 H14 NATIONALBLDG.CONSTN.CORPN.LTD. 1960 HThird Five Year Plan (1960-65) 1 FERTILIZERCORPN.OFINDIALTD. 1961 H2 INDIANDRUGS&PHARMACEUTICALSLTD. 1961 H3 SHIPPINGCORPORATIONOFINDIALTD. 1961 H4 HANDICRAFTS&HANDLOOMEXPORTSCORP.OFINDIALTD. 1962 H5 NATIONALSEEDSCORPN.LTD. 1963 H6 MMTCLTD. 1963 H7 BEMLLTD. 1964 H8 HINDUSTANAERONAUTICSLTD. 1964 H9 BHARATHEAVYELECTRICALSLTD. 1964 H10 INSTRUMENTATIONLTD. 1964 H11 SAMBHARSALTSLTD. 1964 S 12 INDIANOILCORPORATIONLTD. 1964 H13 HINDUSTANSTEELWORKSCOSTN.LTD. 1964 H14 MSTCLTD. 1964 H15 FOODCORPN.OFINDIA 1965 H16 CEMENTCORPN.OFINDIALTD. 1965 H17 TRIVENISTRUCTURALSLTD. 1965 H18 CHENNAIPETROLEUMCORPORATIONLTD. 1965 S 19 ENGINEERSINDIALTD. 1965 H20 ONGCVIDESHLTD. 1965 S
21Public Enterprises Survey 2010-2011
Sl. No. Ministry / Deptt. / CPSE Year of Incorporation
Holding/Subsidiary Company
Annual Plan (1966-68) 1 MADRASFERTILIZERSLTD. 1966 H2 HLLLIFECARELTD. 1966 H3 BHARATHEAVYPLATE&VESSELSLTD. 1966 S 4 INDIATOURISMDEV.CORPN.LTD. 1966 H5 GOASHIPYARDLTD. 1967 H6 HINDUSTANCOPPERLTD. 1967 H7 CENTRALINLANDWATERTRANSPORTCORPN.LTD.* 1967 H8 ELECTRONICSCORPN.OFINDIALTD. 1967 H9 URANIUMCORPORATIONOFINDIALTD. 1967 H10 NATIONALTEXTILECORPN.LTD.* 1968 HFourth Five Year Plan (1969-73) 1 RURALELECTRIFICATIONCORPN.LTD. 1969 H2 STATEFARMSCORPORATIONOFINDIALTD. 1969 H3 WAPCOSLTD. 1969 H4 BHARATDYNAMICSLTD. 1970 H5 BHARATPUMPS&COMPRESSORSLTD. 1970 H6 ENGINEERINGPROJECTS(INDIA)LTD. 1970 H7 HINDUSTANPAPERCORPORATIONLTD. 1970 H8 HOUSING&URBANDEV.CORPN.LTD. 1970 H9 COTTONCORPN.OFINDIALTD. 1970 H10 HOTELCORPN.OFINDIALTD. 1971 S 11 JUTECORPN.OFINDIALTD. 1971 H12 NAGALANDPULP&PAPERCOMPANYLTD. 1971 S 13 PECLTD. 1971 H14 AIRINDIACHARTERSLTD. 1972 S 15 BHARATCOKINGCOALLTD. 1972 S 16 BRIDGE&ROOFCO.(INDIA)LTD.* 1972 H17 COCHINSHIPYARDLTD. 1972 H18 HINDUSTANCABLESLTD. 1972 H19 MINERALEXPLORATIONCORPN.LTD. 1972 H20 RICHARDSON&CRUDDAS(1972)LTD.* 1972 H21 SCOOTERSINDIALTD. 1972 H22 ARTIFICIALLIMBSMFG.CORPN.OFINDIA 1973 $ H23 COALINDIALTD. 1973 H24 MECONLTD. 1973 H25 MISHRADHATUNIGAMLTD. 1973 H26 STEELAUTHORITYOFINDIALTD. 1973 HFifth Five Year Plan (1974-78) 1 NATIONALFERTILIZERSLTD. 1974 H2 RITESLTD. 1974 H3 CENTRALELECTRONICSLTD. 1974 H4 MAHARASHTRAELEKTROSMELTLTD. 1974 S 5 CENTRALCOALFIELDSLTD. 1975 S 6 CENTRALMINEPLANNING&DESIGNINSTITUTELTD. 1975 S 7 EASTERNCOALFIELDSLTD. 1975 S 8 WESTERNCOALFIELDSLTD. 1975 S 9 HMT(INTERNATIONAL)LTD. 1975 S 10 NATIONALFILMDEV.CORPN.LTD. 1975 H11 NHPCLTD. 1975 H12 NTPCLTD. 1975 H13 INDIATRADEPROMOTIONORGANISATION 1976 H14 BRAITHWAITE&CO.LTD.* 1976 S 15 BURNSTANDARDCOMPANYLTD.* 1976 S 16 BHARATPETROLEUMCORPN.LTD. 1976 H17 HINDUSTANPETROLEUMCORPN.LTD. 1976 H
22 Performance Overview 2010-11
Sl. No. Ministry / Deptt. / CPSE Year of Incorporation
Holding/Subsidiary Company
18 NORTHEASTERNELECTRICPOWERCORPORATIONLTD. 1976 H19 IRCONINTERNATIONALLTD. 1976 H20 KIOCLLTD. 1976 H21 CENTRALCOTTAGEINDUSTRIESCORPN.OFINDIALTD. 1976 H22 NORTHEASTERNHANDICRAFTS&HANDLOOMDEV.CORPN.LTD. 1977 H23 ANDAMAN&NICOBARISL.FOREST&PLANT.DEV.CORP.LTD 1977 H24 DREDGINGCORPN.OFINDIALTD. 1977 H25 MANGANESEORE(INDIA)LTD. 1977 H26 HINDUSTANFERTILIZERCORPN.LTD. 1978 H27 PROJECTS&DEVELOPMENTINDIALTD. 1978 H28 RASHTRIYACHEMICALSANDFERTILIZERSLTD. 1978 H29 RAJASTHANDRUGS&PHARMACEUTICALSLTD. 1978 S 30 TELECOMMUNICATIONSCONSULTANTS(INDIA)LTD. 1978 H31 BHARATWAGON&ENGG.CO.LTD.* 1978 HAnnual Plan (1979-80) 1 ORISSADRUGS&CHEMICALSLTD. 1979 S 2 INDIANMEDICINES&PHARMACEUTICALCORPN.LTD. 1979 H3 ANDREWYULE&COMPANYLTD.* 1979 H4 HOOGHLYPRINTINGCOMPANYLTD.* 1979 S 5 FERROSCRAPNIGAMLTD. 1979 S 6 NATIONALJUTEMANUFACTURESCORPORATIONLTD. 1980 HSixth Five Year Plan (1980-84) 1 BENGALCHEMICALS&PHARMACEUTICALSLTD.* 1981 H2 KARNATAKAANTIBIOTICS&PHARMACEUTICALSLTD. 1981 H3 HMTBEARINGSLTD. 1981 S 4 RAJASTHANELECTRONICSANDINSTRUMENTSLTD. 1981 H5 EdCIL(India)Ltd. 1981 H6 NATIONALALUMINIUMCOMPANYLTD. 1981 H7 OILINDIALTD. 1981 H8 BRITISHINDIACORPORATIONLTD.* 1981 H9 STCLLTD. 1982 S 10 NORTHEASTERNREGIONALAGRI.MARKETINGCORP.LTD. 1982 H11 HINDUSTANNEWSPRINTLTD. 1982 S 12 RASHTRIYAISPATNIGAMLTD. 1982 H13 HINDUSTANFLUOROCARBONSLIMITED 1983 S 14 AIRLINEALLIEDSERVICESLTD. 1983 S 15 HSCC(INDIA)LTD. 1983 H16 NATIONALHANDLOOMDEVELOPMENTCORPORATIONLTD. 1983 H17 RANCHIASHOKBIHARHOTELCORPN.LTD. 1983 S 18 UTKALASHOKHOTELCORPN.LTD. 1983 S 19 HINDUSTANVEGETABLEOILSCORPN.LTD.* 1984 H20 VIGNYANINDUSTRIESLTD. 1984 S 21 BBJCONSTRUCTIONCOMPANYLTD. 1984 S 22 TYRECORPORATIONOFINDIALTD.* 1984 H23 GAIL(INDIA)LTD. 1984 H24 HOOGHLYDOCKANDPORTENGINEERSLTD.* 1984 HSeventh Five Year Plan (1985-89) 1 PAWANHANSHELICOPTERSLTD. 1985 H2 NORTHERNCOALFIELDSLTD. 1985 S 3 SOUTHEASTERNCOALFIELDSLTD. 1985 S 4 ASSAMASHOKHOTELCORPN.LTD. 1985 S 5 DONYIPOLOASHOKHOTELLTD. 1985 S 6 MADHYAPRADESHASHOKHOTELCORPN.LTD. 1985 S 7 MAHANAGARTELEPHONENIGAMLTD. 1986 H8 BHARATBHARIUDYOGNIGAMLTD. 1986 H
23Public Enterprises Survey 2010-2011
Sl. No. Ministry / Deptt. / CPSE Year of Incorporation
Holding/Subsidiary Company
9 POWERFINANCECORPORATION 1986 H10 INDIANRAILWAYFINANCECORPORATIONLTD. 1986 H11 PONDICHERRYASHOKHOTELCORPN.LTD. 1986 S 12 INDIANRENEWABLEENERGYDEVT.AGENCYLTD. 1987 H13 BIRDSJUTE&EXPORTSLTD.* 1987 S 14 NUCLEARPOWERCORPN.OFINDIALTD. 1987 H15 MANGALOREREFINERY&PETROCHEMICALSLTD. 1988 S 16 SATLUJJALVIDYUTNIGAMLTD. 1988 H17 TEHRIHYDRODEVELOPMENTCORP.LTD. 1988 H18 CONTAINERCORPORATIONOFINDIALTD. 1988 H19 INDIANVACCINECORP.LTD. 1988 H20 POWERGRIDCORPORATIONOFINDIALTD. 1989 H21 BHARATIMMUNOLOGICALS&BIOLOGICALSCORP.LTD. 1989 H22 NATIONALSCHEDULEDCASTESFINANCE&DEVP.CORPN. 1989 H23 J&KMINERALDEVELOPMENTCORPN.LTD. 1989 S Annual Plan (1990-91)1 BELOPTRONICSDEVICESLTD. 1990 S 2 KONKANRAILWAYCORPORATIONLTD. 1990 HEighth Five Year Plan (1992-96) 1 NATIONALBACKWARDCLASSESFINANCE&DEVP.CO. 1992 H2 MAHANADICOALFIELDLSLTD. 1993 S 3 NUMALIGARHREFINARYLTD. 1993 S 4 ANTRIXCORPORATIONLTD. 1993 H5 BIHARDRUGS&ORGANICCHEMICALSLTD. 1994 S 6 IDPL(TAMILNADU)LTD. 1994 S 7 NATIONALMINORITIESDEVP.&FINANCECORPN. 1994 H8 CERTIFICATIONENGINEERSINTERNATIONALLTD. 1994 S 9 NATIONALINFORMATICSCENTRESERVICESINCORPORATED 1995 H10 BROADCASTENGG.CONSULTANTSINDIALTD. 1995 H11 AIRPORTSAUTHORITYOFINDIALTD. 1996 HNinth Five Year Plan (1997-2001) 1 NATIONALHANDICAPPEDFINANCE&DEVPT.CORPN. 1997 H2 NATIONALSAFAIKARAMCHARISFINANCE&DEVPT.CORPN 1997 H3 PUNJABASHOKHOTELCOMPANYLTD. 1998 S 4 HMTCHINARWATCHESLTD. 1999 S 5 HMTMACHINETOOLSLTD. 1999 S 6 HMTWATCHESLTD. 1999 S 7 INDIANRAILWAYCATERINGANDTOURISMCORPN.LTD. 1999 H8 MUMBAIRAILWAYVIKASCORPORATIONLTD. 1999 H9 ENNOREPORTLTD. 1999 H10 KARNATAKATRADEPROMOTIONORGANISATION 2000 S 11 TAMILNADUTRADEPROMOTIONORGANISATION 2000 S 12 BHARATSANCHARNIGAMLTD. 2000 H13 MILLENNIUMTELECOMLTD. 2000 S 14 NARMADAHYDROELECTRICDEVELOPMENTCORPN.LTD. 2000 S 15 RAILTELCORPORATIONINDIALTD. 2000 H16 BALMERLAWRIEINVESTMENTSLTD. 2001 H17 KUMARAKRUPPAFRONTIERHOTELSLTD. 2001 S 18 NATIONALSCHEDULEDTRIBESFINANCE&DEVP.CORPN. 2001 HTenth Five Year Plan (2002-2006) 1 BRAHMAPUTRAVALLEYFERTILIZERCORPN.LTD. 2002 H2 FCIARAVALIGYPSUM&MINERALS(INDIA)LTD. 2003 H3 AIRINDIAAIRTRANSPORTSERVICESLTD. 2003 S 4 NTPCELECTRICSUPPLYCOMPANYLTD. 2003 S 5 NTPCHYDROLTD. 2003 S 6 NTPCVIDYUTVYAPARNIGAMLTD. 2003 S
24 Performance Overview 2010-11
Sl. No. Ministry / Deptt. / CPSE Year of Incorporation
Holding/Subsidiary Company
7 RAILVIKASNIGAMLTD. 2003 H8 BHARATIYANABHIKIYAVIDYUTNIGAMLTD. 2003 H9 SETHUSAMUDRAMCORPN.LTD. 2004 H10 AIRINDIAENGINEERINGSERVICESLTD. 2006 S 11 NLCTAMILNADUPOWERLTD. 2006 S 12 INDIAINFRASTRUCTUREFINANCECO.LTD. 2006 H13 CHHATTISHGARHSURGUJAPOWERLTD. 2006 S 14 SECURITYPRINTING&MINTINGCORPN.INDIALTD. 2006 H15 BHARATPETRORESOURCESJPDA 2006 S 16 BHARATPETRORESOURCESLTD. 2006 S 17 BRAHAMPUTRACRACKERS&POLYMERLTD. 2006 S 18 COASTALKARNATAKAPOWERLTD. 2006 S 19 COASTALMAHARASHTRAMEGAPOWERLTD. 2006 S 20 KANTIBIJLEEUTPADANNIGAMLTD. 2006 S 21 ORISSAINTEGRATEDPOWERLTD. 2006 S 22 RECTRANSMISSIONPROJECTCO.LTD. 2006 S 23 FRESH&HEALTHYENTERPRISESLTD. 2006 S Eleventh Five Year Plan (2007-2012) 1 AirIndiaLtd. 2007 H2 CENTRALRAILSIDEWAREHOUSINGCO.LTD. 2007 S 3 BHARTIYARAILBIJLEECO.LTD. 2007 S 4 COASTALTAMILNADUPOWERLTD. 2007 S 5 RECPOWERDISTRIBUTIONCO.LTD. 2007 S 6 DEDICATEDFRIGHTCORRIDORCORP.OFINDIALTD. 2007 H7 JAGDISHPURPAPERMILLSLTD. 2008 S 8 CREDAHPCLBIOFUELLTD. 2008 S 9 GAILGASLTD. 2008 S 10 PFCCONSULTINGLTD. 2008 S 11 MJSJCOALLTD. 2009 S 12 MNHSHAKTILTD. 2009 S 13 GHOGARPALLIINTEGRATEDPOWERCOMPANYLTD. 2009 S 14 LOKTAKDOWNSTREAMHYDROELECTRICCORPORATIONLTD. 2009 S 15 SAKHIGOPALINTEGRATEDPOWERCOMPANYLTD. 2009 S 16 BISRASTONELIMECOMPANYLTD. 2010 S 17 EASTERNINVESTMENTLTD. 2010 S 18 HPCLBIOFUELSLTD. 2010 S 19 IRCONINFRASTRUCTURE&SERVICESLTD. 2010 S 20 ORISSAMINERALDEVELOPMENTCOMPANYLTD. 2010 S 21 POWERSYSTEMOPERATIONCORPORATIONLTD. 2010 S 22 TATIYAANDHRAMEGAPOWERLTD. 2010 S 23 BHELELECTRICALMACHINELTD. 2011 S 24 NMDC-CMDLTD. 2008 S 25 RITESINFRASTRUCTURESEVICESLTD. 2011 S
Note: * ~ These enterprises were originally in the private sector, and were taken over by the Government on their falling sick. # ~ SAIL was originally Hindustan Steel Ltd (HSL), which was set up in 1954. $ ~ Coal India Ltd. was originally National Coal Development Corporation(NCDC), which was set up in 1956.

Public Enterprises Survey 2010-11
GOVERNMENT OF INDIAMINISTRY OF HEAVY INDUSTRIES &
PUBLIC ENTERPRISESDEPARTMENT OF PUBLIC ENTERPRISES
NEW DELHI
OVERVIEW
on
the Performance of Central
Public Sector Enterprises