public interest and accountability committee (piac) · republic of ghana public interest and...
TRANSCRIPT
REPUBLIC OF GHANA
PUBLIC INTEREST AND ACCOUNTABILITY COMMITTEE (PIAC)
ESTABLISHED UNDER THE PETROLEUM REVENUE MANAGEMENT ACT,
2011 (ACT 815)
REPORT ON MANAGEMENT OF PETROLEUM REVENUES FOR
YEAR 2016
ANNUAL REPORT

i
CONTENTS
LIST OF TABLES ............................................................................................................................................................... iv
LIST OF FIGURES .............................................................................................................................................................. v
LIST OF ACRONYMS AND ABBREVIATIONS ....................................................................................................... vi
FOREWORD ..................................................................................................................................................................... ix
EXECUTIVE SUMMARY ................................................................................................................................................. xi
Key Findings .................................................................................................................................................................... xi
Recommendations ...................................................................................................................................................... xiv
1. BACKGROUND...................................................................................................................................................... 1
1.1 Introduction .......................................................................................................................................................... 1
1.2 Scope ....................................................................................................................................................................... 1
1.3 Methodology ......................................................................................................................................................... 1
1.4 Outline of the Report ......................................................................................................................................... 2
2. UPDATE FROM PREVIOUS REPORTS ..................................................................................................... 3
3. DEVELOPMENTS IN THE OIL AND GAS SECTOR IN 2016 ............................................................ 7
3.1 KEY Developments in THE UPSTREAM Petroleum Sector............................................................................. 7
3.1.1 INTRODUCTION................................................................................................................................................... 7
3.1.2 Jubilee Field – turret remediation project ................................................................................................ 7
3.1.3 Tweneboa-Enyenra-Ntomme (TEN) Field ............................................................................................... 9
3.1.4 Sankofa-Gye-Nyame (SGN) Field ................................................................................................................ 10
3.1.5 Voltaian Basin Project ..................................................................................................................................... 11
3.1.6 Impact of and Updates on the Maritime Boundary Dispute with LA Cote d’Ivoire ............... 12
3.1.7 Decommissioning of the Saltpond field ................................................................................................... 13
3.1.8. Petroleum Agreements .................................................................................................................................. 13
3.2 STATUS OF Western Corridor Gas Infrastructure Project (WCGIP) ...................................................... 13
4. PETROLEUM PRODUCTION, PRICING AND LIFTING .................................................................... 16
4.1 Crude Oil Production .............................................................................................................................................. 16
4.2 Gas Production .......................................................................................................................................................... 18
4.3. Jubilee Field Cost Of Production ......................................................................................................................... 19
4.4 Crude Oil Liftings...................................................................................................................................................... 21
4.4.1 Jubilee Field................................................................................................................................................. 21
4.4.2 Ten Field ....................................................................................................................................................... 22
4.5 Crude Oil Pricing ...................................................................................................................................................... 23
5. PETROLEUM RECEIPTS AND UTILISATION IN 2016 ...................................................................... 25
5.1 Overview of Petroleum Receipts ................................................................................................................... 25
ii
5.2 Total Petroleum Revenue from 2011 to 2016............................................................................................ 27
5.3 Analysis of 2016 Petroleum Revenues .......................................................................................................... 28
5.3.1 Carried and Participating Interest (CAPI) ...................................................................................... 28
5.3.2 Royalties ....................................................................................................................................................... 28
5.3.3 Corporate Income Tax ............................................................................................................................ 28
5.3.4 Surface Rentals .......................................................................................................................................... 29
5.3.5 Gas Revenue................................................................................................................................................. 30
5.4 Analysis Of 2016 Petroleum Receipts And Budget Projections ............................................................ 31
6. ALLOCATION AND UTILISATION OF 2016 PETROLEUM REVENUE ...................................... 34
6.1 Introduction ........................................................................................................................................................ 34
6.2 Distribution of Petroleum Revenue in 2016 ............................................................................................... 35
6.2.1 Petroleum Revenue Allocation from 2011-2016 ........................................................................ 36
6.3 Distribution Of 2016 Abfa Allocation ........................................................................................................... 38
6.3.1 Introduction ................................................................................................................................................ 38
6.3.2 Disbursement Of 2016 ABFA Allocation ......................................................................................... 38
6.4 Detailed Analysis of 2016 ABFA-Funded expenditure .............................................................................. 39
6.4.1 Roads and Other Infrastructure ......................................................................................................... 39
6.4.2 Agriculture Modernisation ................................................................................................................... 43
6.4.3 Capacity Building (Including Oil and Gas) ..................................................................................... 44
6.4.4 The Public Interest and Accountability Committee .................................................................... 44
6.4.5 Cumulative Expenditure from ABFA on Priority Areas 2011-2016 ..................................... 45
6.5 Utilisation of GNPC Allocation In 2016 ....................................................................................................... 47
6.6 Performance of The Ghana Petroleum Funds............................................................................................. 52
7 OPERATIONS OF GHANA NATIONAL GAS COMPANY.................................................................. 54
8. PROJECTED PETROLEUM REVENUES FOR 2017 .......................................................................... 57
8.1 PIAC’s Views on the Projected Revenues and the Newly Selected Priority Areas ........................... 59
9. SUMMARY OF KEY FINDINGS AND RECOMMENDATIONS ........................................................ 62
9.1 Summary of Key Findings .................................................................................................................................. 62
9.2 Observations and Conclusions ....................................................................................................................... 65
9.3 Recommendations ............................................................................................................................................. 70
10. PIAC ACTIVITY REPORT IN 2016 ......................................................................................................... 72
10.1 PIAC’s Strategic Plan .......................................................................................................................................... 72
10.2 Malaysia Study Tour ........................................................................................................................................... 73
10.3 PIAC Public Fora & Physical Monitoring of ABFA Funded Projects ....................................................... 74
10.4 PIAC Membership .............................................................................................................................................. 76
10.5 Staff Training........................................................................................................................................................ 77
iii
10.6 Citizens Engagement Project ........................................................................................................................... 78
10.7 Launching of 2015 Annual Report ................................................................................................................. 79
10.8 PIAC Website ..................................................................................................................................................... 79
10.9 Consultation With The Ghana National Petroleum Corporation (GNPC) ........................................ 80
10.10 Consultation with IFEJ ...................................................................................................................................... 80
10.11 Meetings with Parliamentary select Committees ....................................................................................... 80
10.12 Financial report .................................................................................................................................................. 81
REFERENCES .................................................................................................................................................................... 82
ANNEXURE ..................................................................................................................................................................... 83
iv
LIST OF TABLES
Table 1: Status of Implementation of Previous Recommendations ............................................ 4
Table 2: Total Disbursement to WCGIP and ICT Projects as at the end of December 2016 ...... 14
Table 3: Crude Oil Production from Jubilee and TEN Fields: January-December, 2016 .......... 17
Table 4: Production of Associated Gas in Ghana, 2016.......................................................... 18
Table 5: Utilisation of Associated Gas in Ghana, 2016 .......................................................... 19
Table 6: Jubilee Field Total and Average Production Costs: 2013-2016 .................................. 20
Table 7: Crude Oil Liftings by Jubilee Partners in 2016 ......................................................... 21
Table 8: Analysis of the Production and Lifting of Crude Oil from 2010-2016 ......................... 22
Table 9: Crude Oil Lifting from TEN Field in 2016 ................................................................. 22
Table 10: Details of the Receipts from the sale of Jubilee Crude Oil in 2016 .......................... 25
Table 11: Sources of 2016 Petroleum Receipts ...................................................................... 26
Table 12: Breakdown of Total Petroleum Receipts from 2011-2016 ........................................ 27
Table 13: Payment of Corporate Income Tax by Jubilee Partners In 2016 .............................. 28
Table 14: Payment of Surface Rentals by Upstream Petroleum Companies in 2016 ................ 29
Table 15: Estimated Surface Rental Payable in 2016 ............................................................. 29
Table 16: Gas Exports from Jubilee Field in 2016 and Expected Revenue .............................. 31
Table 17: 2016 Projected Petroleum Revenues Versus Outturn ............................................. 32
Table 18: Allocation of 2016 Petroleum Revenue ................................................................... 35
Table 19: Disbursements of ABFA to Priority Areas in 2016 .................................................. 39
Table 20: Disbursements from ABFA to GIIF, 2015-2016 ...................................................... 40
Table 21: ABFA Fund Growth Analysis ................................................................................. 41
Table 22: List of Road Projects Supported by ABFA in 2016 .................................................. 42
Table 23: Projects Funded by ABFA in the Agriculture Modernisation Priority Area in 2016 ... 44
Table 24: Utilisation of GNPC’s Share of Petroleum Revenue, 2016 ........................................ 48
Table 25: Breakdown of Other Projects by GNPC in 2016 ...................................................... 49
Table 26: Utilisation of GNPC’s Share of Jubilee Crude Oil Revenue, 2012-2016.................... 50
Table 27: Performance of Ghana Petroleum Funds, 2014-2016 ............................................. 52
Table 28: Gas Exports to GNGC and Derivatives Produced in 2016 ....................................... 54
Table 29: Sale of Processed Petroleum Products by GNGC in 2016 ........................................ 55
Table 30: Payments Received in 2016 and Outstanding Receivables as at the end of 2016 ..... 55
Table 31: Projected Petroleum Receipts for 2016 Using Two Benchmark Prices ...................... 57
Table 32: Distribution of Projected 2017 Petroleum Receipts ................................................. 58
Table 33: Proposed Allocation of ABFA to Priority Areas in 2017 ............................................ 59
Table 34: Citizens’ Preference for ABFA Priority Areas by Regions .......................................... 61
v
LIST OF FIGURES
Figure 1: Picture of FPSO Kwame Nkrumah (L) and Underside of an External Turret (R) .......... 8
Figure 2: Map of TEN Field (L) and Aerial Shot of FPSO J.E.A. MILLS (R) ............................... 10
Figure 3: Map Showing Location of OCTP Project and Artistic Impression of SGN Field .......... 11
Figure 4: Crude Oil Production in Ghana, 2010-2016 ........................................................... 16
Figure 5: Cumulative Crude Oil Production in Ghana, 2010-2016 ......................................... 17
Figure 6: Comparison of Achieved Price for Jubilee and Dated Brent, 2016 ........................... 23
Figure 7: Comparison of 2016 Crude Prices Realised by Jubilee Partners .............................. 24
Figure 8: Contribution of Sources of Petroleum Revenue to Total Receipt in 2016 .................. 27
Figure 9: Distribution of Petroleum Revenues from 2011-2016 .............................................. 36
Figure 10: Annual Distribution of Petroleum Revenues From 2011-2016 ............................... 37
Figure 11: ABFA Allocation to Other Infrastructure Projects, 2016 ........................................ 43
Figure 12: Total Distribution of ABFA to Priority Areas, 2011-2016 ....................................... 45
Figure 13: Yearly Allocation of ABFA to Priority Areas, 2011-2016 ......................................... 45
Figure 14: PIAC’s Analysis of Total Allocation of ABFA to Priority Areas ................................. 46
Figure 15: Total Returns on GPF, 2011-2016 ........................................................................ 53
Figure 16: A Selection of PIAC Members at the High Table During the Launch ....................... 72
Figure 17: PIAC Delegation on the Study Tour ..................................................................... 73
Figure 18: Deputy Regional Minister, PIAC Members and a Cross Section of Participants
During a Presentation in Bolgantanga – Upper East Region................................................... 75
Figure 19: A Selection of PIAC Members and Dignitaries at the Wa Forum – Upper West
Region ................................................................................................................................. 75
Figure 20: Pictures from Project Visits .................................................................................. 76
Figure 21: Swearing-in of new PIAC members by Deputy Minister of Finance ....................... 77
Figure 22: Group Picture of Two PIAC Members with other Trainees ..................................... 78
Figure 23: Cross-section of Participants at Various Fora ....................................................... 79
vi
LIST OF ACRONYMS AND ABBREVIATIONS
ABFA Annual Budget Funding Amount
BCF Billion Cubic Feet
BECE Basic Education Certificate Examination
BOG Bank of Ghana
BOPD Barrels of Oil Per Day
BR Benchmark Revenue
CAPEX Capital Expenditure
CAPI Carried and Participating Interest
CDB China Development Bank
CIT Corporate Income Tax
COLA Crude Oil Lifting Agreement
CTRC Central Tender Review Committee
DfID Department for International Development
EIA Environmental Impact Assessment
EPA Environmental Protection Agency
EPU Economic Planning Unit
EPCI Engineering, Procurement, Construction, and Installation
FEED Front End Engineering and Design
GAAS Ghana Academy of Arts and Sciences
GACL Ghana Airport Company Limited
GBA Ghana Bar Association
GEM Gas Export Manifold
GJA Ghana Journalists Association
GHEITI Ghana Extractive Industries Transparency Initiative
GHF Ghana Heritage Fund
GIIF Ghana Infrastructure Investment Fund
GNGC Ghana National Gas Company
vii
GNPC Ghana National Petroleum Corporation
GOG Government of Ghana
GOGIG Ghana Oil and Gas for Inclusive Growth
GPFs Ghana Petroleum Funds
GPP Gas Processing Plant
GRA Ghana Revenue Authority
GSA Gas Sales Agreement
GSF Ghana Stabilisation Fund
ICAG Institute of Chartered Accountants (Ghana)
IDEA Institute of Democratic and Economic Affairs
IFEG Institute of Financial and Economic Journalists
IRBM Inland Revenue Board of Malaysia
ITLOS International Tribunal for Law of the Sea
KITE Kumasi Institute of Technology and Environment
LOPI Lost of Production Insurance
LPG Liquefied Petroleum Gas
MCA Millennium Compact Account
MDAs Ministries, Departments and Agencies
MMBO Million Barrels of Oil
MMBOE Million of Barrel of Oil Equivalent
MMBTU Million British Thermal Units
MMSCF Million Standard Cubic Feet
MOE Ministry of Education
MOF Ministry of Finance
MPRS Malaysia Petroleum Resources Commission
MT Metric Tonnes
MTA Mahogany, Teak and Akasa
NES National Electrification Scheme
NOC National Oil Company
OCTP Offshore Cape Three Points

viii
OPEX Operating Expenditure
ORF Onshore Receiving Facilities
PA Petroleum Agreement
PFM Public Financial Management
PGISSA Power Generation Infrastructure Support Sub-Account
PHF Petroleum Holding Fund
PIAC Public Interest and Accountability Committee
POD Plan of Development
PRMA Petroleum Revenue Management Act
PSP PIAC Strategic Plan
RCA Root Cause Analysis
SGN Sankofa-Gye Nyame
SOPCL Saltpond Offshore Producing Co. Ltd
SPS Subsea Production System
TCF Trillion Cubic Feet
TEN Tweneboa-Enyenra-Ntomme
VRA Volta River Authority
WCGIP Western Corridor Gas Infrastructure Project
ix
FOREWORD
Since its establishment in September 2011, the Public Interest and Accountability
Committee, (PIAC), has been mandated with the oversight responsibility of monitoring and
evaluating the management of Ghana’s petroleum revenue by the Government and relevant
state institutions.
The Committee’s reports aim at keeping Ghanaians and other interested stakeholders
constantly informed on how the country’s petroleum revenues are being managed, as well
as providing platforms for the citizens’ feedback to be collated and shared with policymakers.
The Committee since its inception has published a total of 11 reports – 6 Annual and 5 Semi-
Annual Reports - covering the period 2011 to 2016. The keen interest with which the
Ghanaian citizenry receive our reports is the Committee’s motivation to independently
analyse the management of the country’s revenue from petroleum production.
The 2016 Annual Report covers the period January to December 2016 and encompasses a
broad range of issues associated with the management of petroleum revenue such as
information on production; liftings; total revenues accrued; allocation and utilisation of these
revenues by government and the management of the funds set aside in the Ghana
Petroleum Funds (Ghana Stabilisation Fund and the Ghana Heritage Fund). The report also
contains an examination of other issues and findings pertinent to the performance of various
institutions charged with responsibilities in the Petroleum Revenue Management Act, 2011
(Act 815) as amended by the Petroleum Revenue Management (Amendment) Act, 2015 (Act
893).
The preparation of this report was supported with information and data from the Ministry of
Finance, Bank of Ghana, Ghana National Petroleum Corporation, Ghana Revenue Authority,
Petroleum Commission, Ghana Infrastructure Investment Fund, Ghana National Gas
Company, Kosmos Energy and Tullow Ghana Limited in the governance of Ghana’s
petroleum revenues.
The year 2016 saw the end of tenure of the second Chairman of the Committee, Prof. Paul
Kingsley Buah-Bassuah (GAAS), and was replaced by Prof. Albert Fiadjoe (GAAS). Mr
Prince Asafu-Adjaye of the Trade Union Congress (TUC) was also replaced by Mr Kwabena
Nyarko-Otoo (TUC). The Committee would like to take this opportunity to express its
profound gratitude and appreciation to these two former Members for defying all odds and
working tirelessly to set the Committee on a strong footing for the future. PIAC wishes these
x
noble citizens well in their future endeavours and hopes to fall on their wealth of experience
and knowledge as and when required.
It is the expectation of the Committee that the public will find time to read the report and
provide feedback during our public engagements following the launch of this report or send
us their comments via email to the following address [email protected] or +233 (0)
302 242 006.
PIAC wishes to acknowledge the immense contribution of the Africa Regional Office of the
Natural Resource Governance Institute (NRGI), for their continuous support to PIAC.
The Committee is also very grateful to the UK’s Department for International Development
(DfID) for the multi-year funding support.
Furthermore, PIAC wishes to acknowledge the support of the GIZ’s Good Financial
Governance Programme for funding some of our public engagements.
Finally, the Committee is very thankful to the Government of Ghana for the budgetary
support given to PIAC for its operations and activities.
The Chairman,
PIAC
xi
EXECUTIVE SUMMARY
The Public Interest and Accountability Committee (PIAC) is established under Section 51 of
the Petroleum Revenue Management Act, 2011 (Act 815) to, among other things, provide
oversight and monitoring regarding the management of petroleum revenues. As part of its
mandate, PIAC is required to prepare and publish two reports – semi and annual reports –
each year detailing how much petroleum revenue has been collected during the period
under review and how the amount so collected has been utilised. The report is also expected
to capture the performance of the Ghana Petroleum Funds (GPFs) and the feedback
received from the citizenry during the PIAC’s public consultations.
This report is the sixth annual report prepared by PIAC. The report has been prepared using
a combination of desk research methods and interviews. The key findings made and
recommendations proffered for action by relevant stakeholder institutions are as follows:
KEY FINDINGS
C R U D E O I L P R O D U C T I O N
1. There was a 13.7% year-on-year decline in crude oil production in Ghana during the
period under review with annual production dropping from 37.41 mmbbls (102,498
bbls) in 2015 to 32.30 mmbbls (73,955 bopd);
2. The decline in production occurred in spite of the fact that Ghana’s 2nd major
production field – the TEN Fields – came on stream in August, 2016 and actually
contributed 16% (5.32 mmbbls) to annual production. The production shortfall would
have been approximately 28% but for the addition of the TEN Fields;
3. Along with the decline in crude oil production, the production of indigenous natural
gas also declined by a similar magnitude of 27% (from 52.455.91 MMScf in 2015 to
38,420 MMScf in 2016) compared only with Jubilee gas production and by 14% when
compared to the combined production from Jubilee and TEN Fields of 44,780
MMScf;
4. The decline in petroleum production in 2016 was caused by a 34-day shutdown of
the Jubilee Field for maintenance from March 31 to May 3, 2016;
xii
5. Approximately seventy-two percent (72%) of the gas produced on the TEN Field was
flared compared to approximately 23% and 6% that was reinjected and used as fuel
for the FPSO respectively;
C R U D E O I L L I F T I N G S A N D M A R K E T I N G
6. The Ghana Group lifted 4.86 mmbbls from the Jubilee Field in 2016, representing
18.06% which is consistent with the Ghana’s shareholding in the Field;
7. The sole lifting undertaken by the Ghana Group from the TEN Field in 2016 also
represented 18.60% of total lifting made by the TEN partners;
8. Ghana’s crude oil from the Jubilee Field was sold at an average achieved price of
US$46.13 per barrel which compares favourably with the average dated Brent price of
US$44.01 as well as the average achieved price of all the other Jubilee Partners
(Tullow – US$41.7/bbl; Anadarko – US$43.93/bbl; and Kosmos – US$45.94/bbl);
9. The other Jubilee Partners however were able to sell a portion of their liftings at a
higher price as a result of their respective hedging policies with Kosmos and Tullow
realising unit prices of US$73.76/barrel and US$61.7/barrel respectively;
P E T R O L E U M R E C E I P T S
10. Actual petroleum receipt in 2016 of US$247.18 million was 29% lower than the
budgeted amount (US$348.42 million) and translates to 38% year-on-year decline in
annual petroleum revenues when compared to the 2015 receipts of US$396.17
million;
11. Except for CIT which exceeded target, none of the other sources of petroleum
revenues achieved set targets, as can be seen from Table 17;
12. Only five (5) out of the 18 licence holders paid surface rental during the period under
review;
13. Ninety-two percent (US$27.31 million) of total CIT received in 2016 was in respect of
tax liabilities that Tullow ought to have paid over the period 2011-2014;
xiii
14. Only US$9.35 million (16.45%) out of total receivables of US$56.79 million from the
sale of raw gas was paid by the off-taker – GNGC – in 2016;
15. Payment of the outstanding receivables for 2016 would have reduced the revenue
shortfall of US$101.24 million by 46% while the shortfall would not have arisen had
the total outstanding indebtedness of GNGC of US$135.49 million been honoured
during the period under review;
A L L O C A T I O N A N D U T I L I S A T I O N O F P E T R O L E U M
R E C E I P T S
16. A total of US$229.03 million (representing approximately 93% of total petroleum
receipts) was allocated during the reporting period;
17. An amount of US$98.38 million (GH¢388.85 million) (representing 70% of the net
amount of US$140.54 million transferred to the GoG for further distribution and
42.95% of actual disbursement) was transferred to the ABFA account in 2016;
18. The remaining 30% (US$42.16 million) of the amount received by GoG to be
distributed to the ABFA and GPFs in 2016 was transferred to the GPFs with the GSF
receiving US$29.51 million (70%) and GHF receiving US$12.65 million;
U T I L I S A T I O N O F A L L O C A T I O N T O G N P C
19. The GNPC received US$88.50 million (representing 38.64% of total petroleum
receipt) in 2016 compared to the US$126.86 million it received in 2015, translating to
a year-on-year drop of 30%;
20. The allocation to GNPC during the review period is the lowest it has received since
distribution of petroleum revenues begun in 2011;
21. For the first time since 2011, the disbursement to GNPC was insufficient to cover the
NOC’s equity financing requirement and expenditure on other exploration and
development projects embarked upon in the course of the reporting period. This
means that GNPC had to rely on its cash reserves, which had been earmarked for
milestone projects, to fund equally important expenditures such as staff cost, general
xiv
operational and administrative expense and the cost of the maritime boundary
dispute with Cote D’Ivoire;
22. An amount of US$12.64 million (classified as ‘capital projects’) was spent
refurbishing GNPC’s landed properties in Accra, Tema and Sekondi-Takoradi;
23. There was a 38% year-on-year increase in the remuneration for Technical and Petro-
business support staff employed to execute GNPC’s work programmes. The cost
rose from US$10.23 million in 2015 to US$16.4 million in 2016;
24. There was a 56% increase in the amount of money spent contesting the Maritime
Boundary Dispute with Cote D’Ivoire at the ITLOS with expenditure rising from
US$1.81 million in 2015 to US$2.83 million in 2016;
25. An amount of US$7.58 million was again spent on the Western Corridor Road
Project;
P E R F O R M A N C E O F T H E G H A N A P E T R O L E U M F U N D S
26. GPFs made a net investment income of US$5.77 million during the period under
review, compared to US$4.5 million in 2015. Of this amount, the GHF brought in
US$4.93 million (85.44%) up from the US$3.97 million earned in 2015 while the GSF
brought in US$0.84 million (14.56%) up from US$0.53 million in 2015; and,
27. The balance on the GHF at the end of 2016 stood at US$276.96 million compared to
US$259.38 million in 2015 while that on the GSF stood at US$207.75 million as
against US$177.40 million in 2015, bringing total combined balance in the GPFs as
at the end of the reporting period to US$484.71 million.
RECOMMENDATIONS
Based on the key findings and some observations/conclusions made/drawn, PIAC has put
forth the following recommendations for the consideration of the relevant authorities:
xv
1. Given that the GNGC may well have been caught up in the vicious cycle of the
indebtedness of the energy sector utilities (which stood at US$2.4 billion at the end of
2016), urgent and drastic measures would have to be devised by all key stakeholders
to ensure immediate payment of the outstanding receivable owed the Ghana
Petroleum Fund in respect of gas sales.
One potential source of funds that could have been used to defray VRA’s
indebtedness to GNGC is the Power Generation and Infrastructure Support Sub-
Account (PGISSA)1 established under the Energy Sector Levy Act, 2015 (Act 899).
However, the proceeds going into the PGISSA have been earmarked for the
repayment of the debt owed by VRA to 11 domestic banks as part of the strategy
introduced by the government to deal with legacy debt problem facing the State-
owned energy sector utilities. Since termination of supply to VRA is not an option as
yet, due to lack of alternative market for lean gas, PIAC is calling for an immediate
meeting between the Government, GNPC and GNGC to agree on a clear roadmap
for the clearing of VRA indebtedness to GNGC;
2. The Ghana Revenue Authority (GRA) must ensure that all outstanding annual
surface rentals are paid with interest;
3. GRA must ensure that auditing of tax returns filed by the Jubilee Partners are carried
out expeditiously so that any additional assessment payable is paid on time;
4. The Bank of Ghana and/or the Ministry of Finance should seek expert advice on
hedging and consider undertaking hedging activities as part of strategies to mitigate
Ghana’s exposure to commodity price risk/volatility associated with future oil
production;
5. GNPC needs to be impressed upon to procure a Loss of Production Insurance
(LOPI) or Business Interruption Insurance if it does not have one already;
1 The PGISSA is to be used to support payment of power utility debt, ensure power supply, power generation and infrastructure support resources and support power infrastructure risk mitigation.
xvi
6. PIAC still maintains that GNPC should desist from spending part of its dwindling
allocations on non-core businesses such as financing of the Western Corridor Roads.
The GNPC explained to PIAC that it was requested to provide financial support for
the said roads because of their position as the Gas Aggregator. The Committee
however holds a different view and wishes to reiterate its suggestion in its 2016
Semi-annual Report that such road projects should either be funded with part of the
ABFA or a separate loan contracted for that purpose thereby freeing funds for critical
investments in the areas of GNPC’s core mandate. Similarly, PIAC is of the view that
GNPC should not be bearing the cost of the ITLOS litigation on behalf of the State
and that such expenditure should be charged either on the Consolidated Fund or
Contingency Fund;
7. GNPC should disclose what steps it is taken to retrieve the US$50 million loan it
advanced to the Ministry of Finance in respect of the Western Corridor Roads;
8. The Government should impress upon the Jubilee Partners to expedite work on the
gas export infrastructure on the TEN Field; and,
9. The ABFA allocation to road infrastructure should continue to be spent on fewer road
projects so as to ensure timely completion of beneficiary projects.
1
SECTION 1
1.0 BACKGROUND
1.1 INTRODUCTION
The Public Interest and Accountability Committee (PIAC), is a citizen-based public oversight
committee created under Section 51 of the Petroleum Revenue Management Act, 2011 (Act
815) to, among other things, ensure that the collections and management of petroleum
revenues in Ghana is consistent with the provisions of Act 815. Section 56 (a) of Act 815
enjoins PIAC to publish two reports – a Semi-annual and an Annual Report – every year.
These reports are intended to provide independent assessment of the management and use
of petroleum revenues in a given year. Consequently, the Committee has, since its
inauguration in 2011, published 10 reports which include 5 Annual Reports (2011-2015) and
five (5) Semi-Annual Reports (2012-2016). This report – the 2016 Annual Report – is the
sixth in the series of PIAC’s annual reports and 11th overall.
1.2 SCOPE
The report covers the period January – December 2016 which among others, analyses
crude oil production and liftings; verifies the accuracy of petroleum revenues declared by
state institutions; assesses allocations of petroleum revenues to support annual budget and
transfers into the Ghana Petroleum Funds as stipulated by the Act; discusses how petroleum
receipts were allocated and utilised, and analyses the performance of the petroleum funds
during the period under review.
1.3 METHODOLOGY
In putting together the report, the Committee combined two research methods – desk study
and key informant interviews. The main sources of the information gathered were the key
stakeholder institutions such as the Ministry of Finance (MOF), the Ghana National
Petroleum Corporation (GNPC), the Bank of Ghana (BOG), the Ghana National Gas
Company (GNGC), the Ghana Revenue Authority (GRA), Petroleum Commission and
Kosmos Energy. The data collected were reviewed and analysed, and where inconsistencies
and/or discrepancies were discovered, follow-up interviews conducted with designated
2
officials at the relevant institution(s).The final draft of the report was sent to the stakeholder
institutions for validation before publication.
1.4 OUTLINE OF THE REPORT
The rest of the report is organised into the following nine (9) sections:
- Section 2 reviews the implementation status of recommendations made in previous
reports of the Committee;
- Section 3 provides an update on happenings in the upstream petroleum sector during
the year under review;
- Section 4 presents information on crude oil and gas production and marketing in
2016;
- Section 5 presents and analyses petroleum receipts from different sources;
- Section 6 discusses how the 2016 petroleum revenues were allocated and utilised;
- Section 7 focuses on the operations and performance of Ghana National Gas
Company;
- Section 8 analyses the reliability or otherwise of forecasted revenues for 2017;
- Section 9 summarises key findings and proffers recommendations; and,
- Section 10 focuses on 2016 PIAC activity report.
3
SECTION 2
2.0 UPDATE FROM PREVIOUS REPORTS
As has become a regular feature of PIAC’s Annual report, this section reviews the
implementation status of various recommendations made by the Committee in previous
reports. Table 1 re-presents selected findings and recommendations from previous reports
and indicates whether or not the recommendations have been acted upon or not.
4
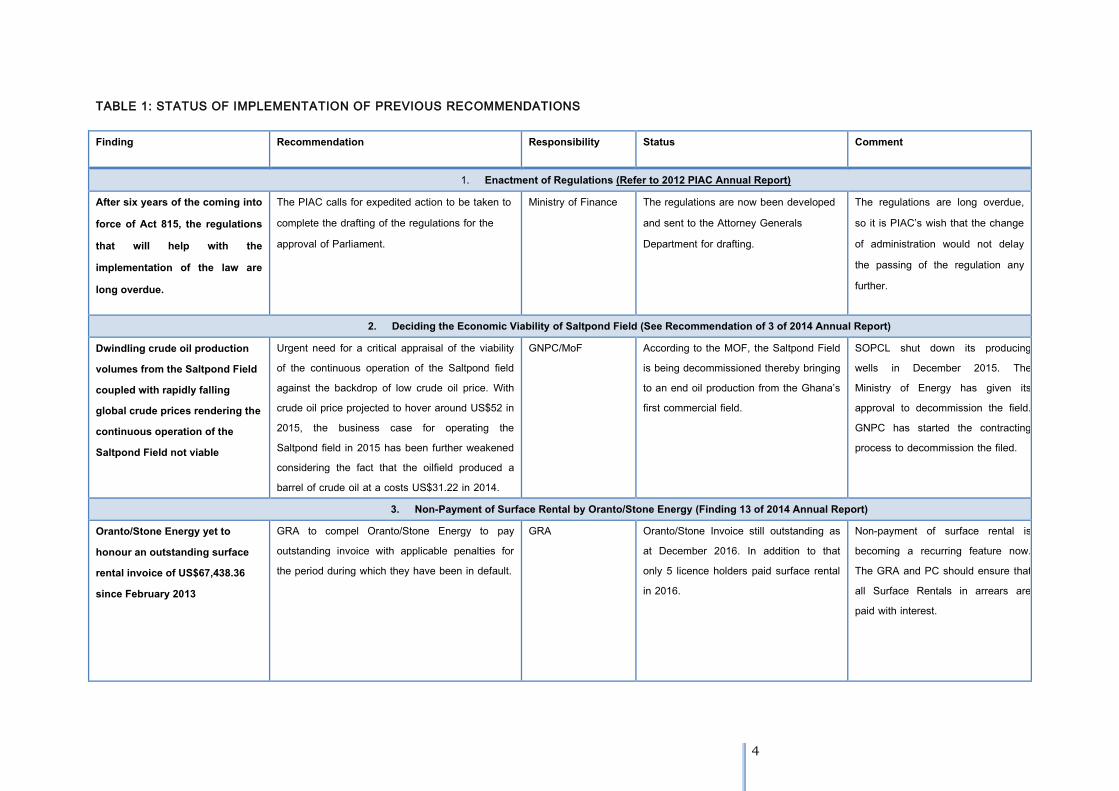
TABLE 1: STATUS OF IMPLEMENTATION OF PREVIOUS RECOMMENDATIONS
Finding Recommendation Responsibility Status Comment
1. Enactment of Regulations (Refer to 2012 PIAC Annual Report) After six years of the coming into force of Act 815, the regulations that will help with the implementation of the law are long overdue.
The PIAC calls for expedited action to be taken to complete the drafting of the regulations for the approval of Parliament.
Ministry of Finance The regulations are now been developed and sent to the Attorney Generals Department for drafting.
The regulations are long overdue, so it is PIAC’s wish that the change of administration would not delay the passing of the regulation any further.
2. Deciding the Economic Viability of Saltpond Field (See Recommendation of 3 of 2014 Annual Report) Dwindling crude oil production volumes from the Saltpond Field coupled with rapidly falling global crude prices rendering the continuous operation of the Saltpond Field not viable
Urgent need for a critical appraisal of the viability of the continuous operation of the Saltpond field against the backdrop of low crude oil price. With crude oil price projected to hover around US$52 in 2015, the business case for operating the Saltpond field in 2015 has been further weakened considering the fact that the oilfield produced a barrel of crude oil at a costs US$31.22 in 2014.
GNPC/MoF According to the MOF, the Saltpond Field is being decommissioned thereby bringing to an end oil production from the Ghana’s first commercial field.
SOPCL shut down its producing wells in December 2015. The Ministry of Energy has given its approval to decommission the field. GNPC has started the contracting process to decommission the filed.
3. Non-Payment of Surface Rental by Oranto/Stone Energy (Finding 13 of 2014 Annual Report) Oranto/Stone Energy yet to honour an outstanding surface rental invoice of US$67,438.36 since February 2013
GRA to compel Oranto/Stone Energy to pay outstanding invoice with applicable penalties for the period during which they have been in default.
GRA Oranto/Stone Invoice still outstanding as at December 2016. In addition to that only 5 licence holders paid surface rental in 2016.
Non-payment of surface rental is becoming a recurring feature now. The GRA and PC should ensure that all Surface Rentals in arrears are paid with interest.
5
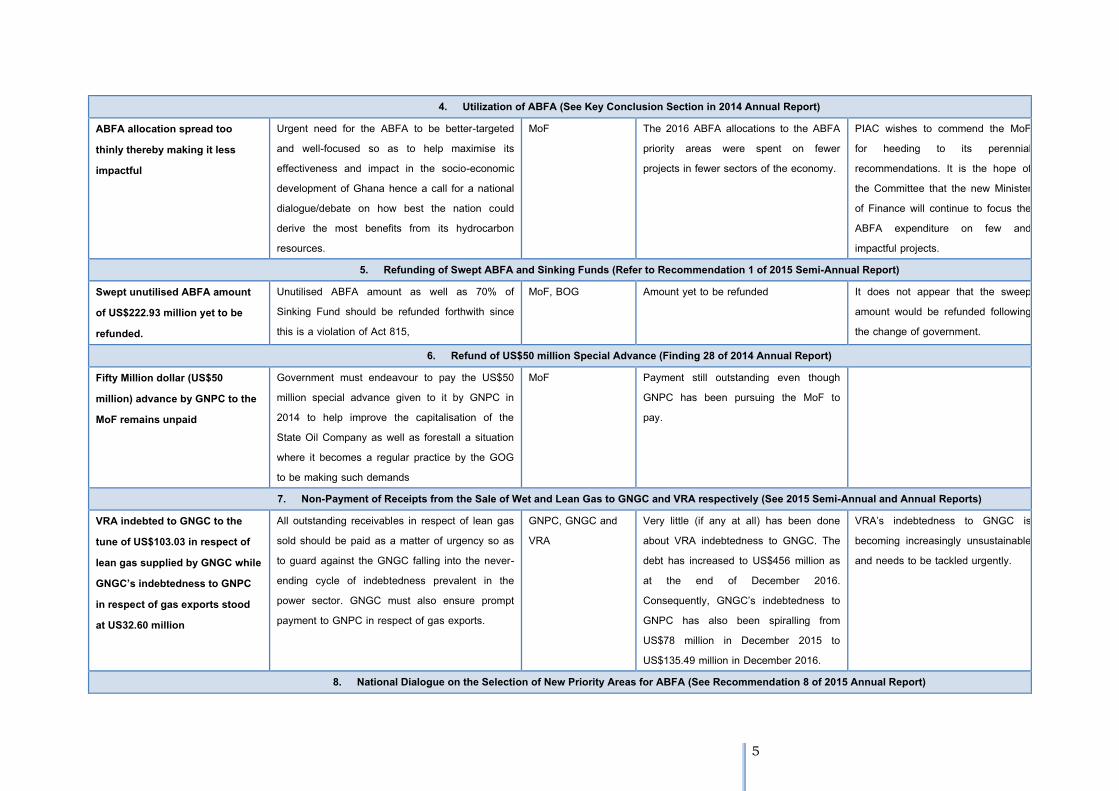
4. Utilization of ABFA (See Key Conclusion Section in 2014 Annual Report) ABFA allocation spread too thinly thereby making it less impactful
Urgent need for the ABFA to be better-targeted and well-focused so as to help maximise its effectiveness and impact in the socio-economic development of Ghana hence a call for a national dialogue/debate on how best the nation could derive the most benefits from its hydrocarbon resources.
MoF The 2016 ABFA allocations to the ABFA priority areas were spent on fewer projects in fewer sectors of the economy.
PIAC wishes to commend the MoF for heeding to its perennial recommendations. It is the hope of the Committee that the new Minister of Finance will continue to focus the ABFA expenditure on few and impactful projects.
5. Refunding of Swept ABFA and Sinking Funds (Refer to Recommendation 1 of 2015 Semi-Annual Report) Swept unutilised ABFA amount of US$222.93 million yet to be refunded.
Unutilised ABFA amount as well as 70% of Sinking Fund should be refunded forthwith since this is a violation of Act 815,
MoF, BOG Amount yet to be refunded It does not appear that the sweep amount would be refunded following the change of government.
6. Refund of US$50 million Special Advance (Finding 28 of 2014 Annual Report) Fifty Million dollar (US$50 million) advance by GNPC to the MoF remains unpaid
Government must endeavour to pay the US$50 million special advance given to it by GNPC in 2014 to help improve the capitalisation of the State Oil Company as well as forestall a situation where it becomes a regular practice by the GOG to be making such demands
MoF Payment still outstanding even though GNPC has been pursuing the MoF to pay.
7. Non-Payment of Receipts from the Sale of Wet and Lean Gas to GNGC and VRA respectively (See 2015 Semi-Annual and Annual Reports) VRA indebted to GNGC to the tune of US$103.03 in respect of lean gas supplied by GNGC while GNGC’s indebtedness to GNPC in respect of gas exports stood at US32.60 million
All outstanding receivables in respect of lean gas sold should be paid as a matter of urgency so as to guard against the GNGC falling into the never-ending cycle of indebtedness prevalent in the power sector. GNGC must also ensure prompt payment to GNPC in respect of gas exports.
GNPC, GNGC and VRA
Very little (if any at all) has been done about VRA indebtedness to GNGC. The debt has increased to US$456 million as at the end of December 2016. Consequently, GNGC’s indebtedness to GNPC has also been spiralling from US$78 million in December 2015 to US$135.49 million in December 2016.
VRA’s indebtedness to GNGC is becoming increasingly unsustainable and needs to be tackled urgently.
8. National Dialogue on the Selection of New Priority Areas for ABFA (See Recommendation 8 of 2015 Annual Report)
6
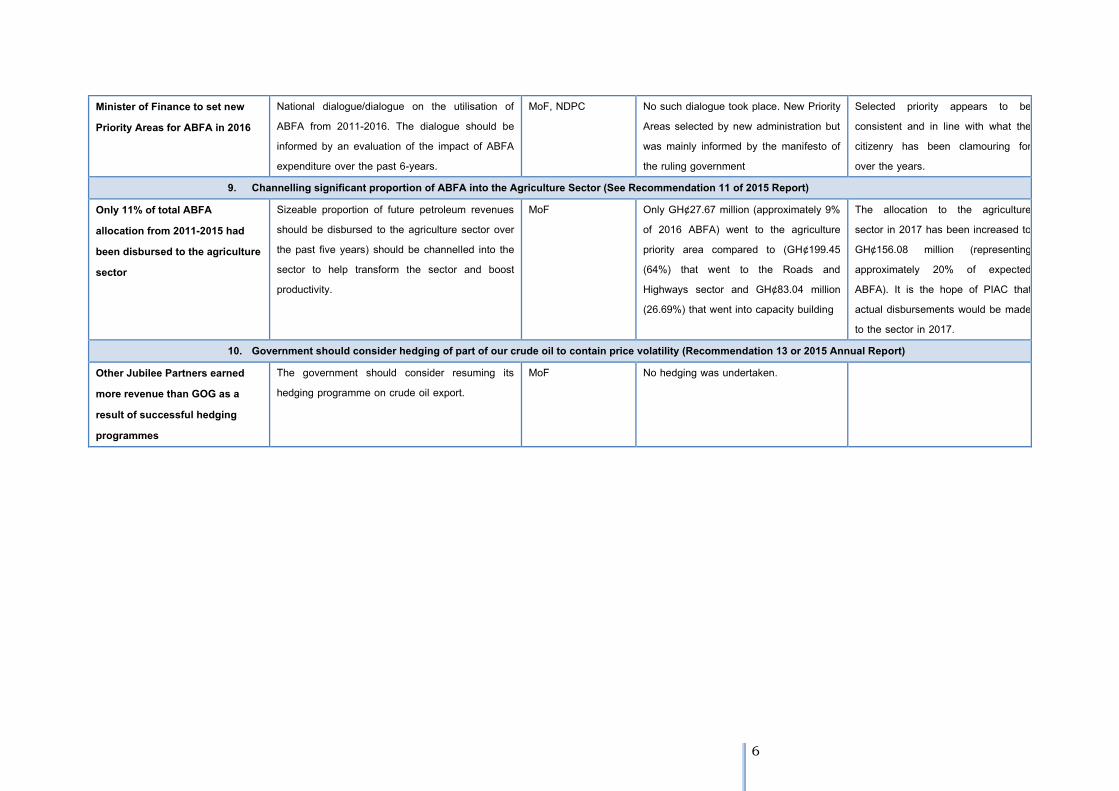
Minister of Finance to set new Priority Areas for ABFA in 2016
National dialogue/dialogue on the utilisation of ABFA from 2011-2016. The dialogue should be informed by an evaluation of the impact of ABFA expenditure over the past 6-years.
MoF, NDPC No such dialogue took place. New Priority Areas selected by new administration but was mainly informed by the manifesto of the ruling government
Selected priority appears to be consistent and in line with what the citizenry has been clamouring for over the years.
9. Channelling significant proportion of ABFA into the Agriculture Sector (See Recommendation 11 of 2015 Report) Only 11% of total ABFA allocation from 2011-2015 had been disbursed to the agriculture sector
Sizeable proportion of future petroleum revenues should be disbursed to the agriculture sector over the past five years) should be channelled into the sector to help transform the sector and boost productivity.
MoF Only GH¢27.67 million (approximately 9% of 2016 ABFA) went to the agriculture priority area compared to (GH¢199.45 (64%) that went to the Roads and Highways sector and GH¢83.04 million (26.69%) that went into capacity building
The allocation to the agriculture sector in 2017 has been increased to GH¢156.08 million (representing approximately 20% of expected ABFA). It is the hope of PIAC that actual disbursements would be made to the sector in 2017.
10. Government should consider hedging of part of our crude oil to contain price volatility (Recommendation 13 or 2015 Annual Report) Other Jubilee Partners earned more revenue than GOG as a result of successful hedging programmes
The government should consider resuming its hedging programme on crude oil export.
MoF No hedging was undertaken.

7
SECTION 3
3.0 DEVELOPMENTS IN THE OIL AND GAS SECTOR IN 2016
3.1 KEY DEVELOPMENTS IN THE UPSTREAM PETROLEUM
SECTOR
3.1.1 INTRODUCTION
The year 2016 was quite eventful and represents a key milestone in Ghana’s quest towards
becoming a major oil producing country. Not only did the country add to its production assets
following the achievement of first oil production from the Tweneboa-Enyenra-Ntomme (TEN)
Field in August 2016, but also the Jubilee Field, which is the first production asset, faced
arguably its biggest challenge yet since 2011 as a result of the damage of the turret bearing of
the FPSO Kwame Nkrumah. The Sankofa-Gye-Nyame (SGN) Project, Ghana’s third major
upstream asset, also made significant progress during the year under review with the Field
reaching two-thirds completion at the end of 2016. Ghana’s total proven oil reserve base as at
the end of 2016 was estimated at 1,253 million barrels of oil equivalent (MMBOE), comprising
898 million barrels of oil and 2,024 billion cubic feet of proven gas reserves compared to
proven oil reserve base of 1,300 MMBOE (comprising 899 million barrels of oil and 2.052
trillion cubic feet (TCF) of natural gas (354MMboe) at the end of 2015 (GNPC, 2017). GNPC’s
core objective of growing reserves has been affected by a slowdown in exploratory activities in
petroleum blocks that have been affected by the ITLOS initial ruling provision of “No Drilling.
Ghana’s upstream industry also continued to attract investors during the period under review
following the signing and ratification of three new Petroleum Agreements by Parliament. The
update on the status of the operations of existing production fields and key projects as at
December 2016 are presented in the rest of the chapter:
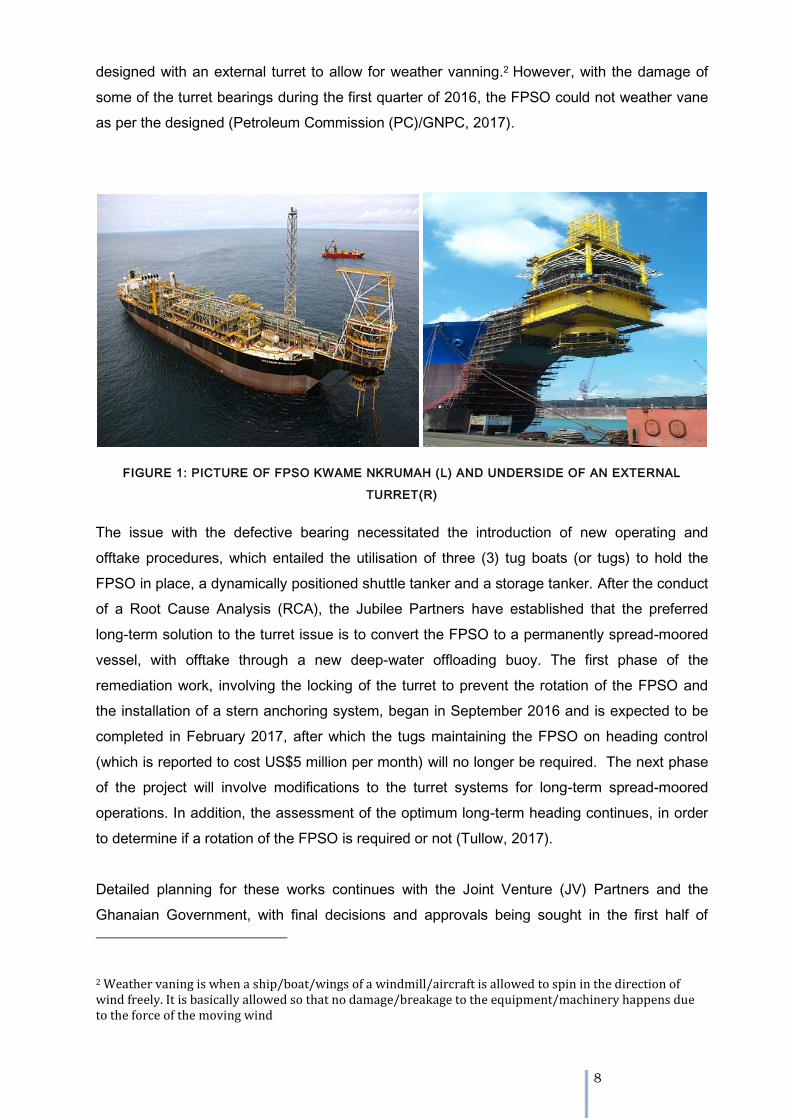
3.1.2 JUBILEE FIELD – TURRET REMEDIATION PROJECT
The Jubilee Field is estimated to hold a recoverable reserve of 618 million barrels (mmbbls)
and 505 billion standard cubic feet (Bcf) of natural gas. A total of over 161 million barrels
(mmbbls) have been produced from the Jubilee Field between November 2010 and December
2015. Oil production from the Field suffered a major setback in February 2016 when the turret
bearing of FPSO Kwame Nkrumah began to malfunction. The FPSO Kwame Nkrumah was
8
designed with an external turret to allow for weather vanning.2 However, with the damage of
some of the turret bearings during the first quarter of 2016, the FPSO could not weather vane
as per the designed (Petroleum Commission (PC)/GNPC, 2017).
FIGURE 1: PICTURE OF FPSO KWAME NKRUMAH (L) AND UNDERSIDE OF AN EXTERNAL
TURRET(R)
The issue with the defective bearing necessitated the introduction of new operating and
offtake procedures, which entailed the utilisation of three (3) tug boats (or tugs) to hold the
FPSO in place, a dynamically positioned shuttle tanker and a storage tanker. After the conduct
of a Root Cause Analysis (RCA), the Jubilee Partners have established that the preferred
long-term solution to the turret issue is to convert the FPSO to a permanently spread-moored
vessel, with offtake through a new deep-water offloading buoy. The first phase of the
remediation work, involving the locking of the turret to prevent the rotation of the FPSO and
the installation of a stern anchoring system, began in September 2016 and is expected to be
completed in February 2017, after which the tugs maintaining the FPSO on heading control
(which is reported to cost US$5 million per month) will no longer be required. The next phase
of the project will involve modifications to the turret systems for long-term spread-moored
operations. In addition, the assessment of the optimum long-term heading continues, in order
to determine if a rotation of the FPSO is required or not (Tullow, 2017).
Detailed planning for these works continues with the Joint Venture (JV) Partners and the
Ghanaian Government, with final decisions and approvals being sought in the first half of
2 Weather vaning is when a ship/boat/wings of a windmill/aircraft is allowed to spin in the direction of wind freely. It is basically allowed so that no damage/breakage to the equipment/machinery happens due to the force of the moving wind

9
2017. Work is expected to be carried out in the third quarter of 2017 (July-September), with an
anticipated facility shutdown of up to 12 weeks, although work continues to optimise and
reduce the shutdown period. The final phase of the project will involve the installation of a
deep water offloading buoy which is planned to be installed in the first half of 2018 (Tullow,
2017, PC, 2017).
The problem with the turret bearing of FPSO Kwame Nkrumah and the consequential
remediation works it engendered significantly curtailed average daily oil production to 73,720
bbls/day in 2016 down from an average daily production of 100,000 bbls/day since 2013.
Meanwhile, the remediation work is also expected to affect oil production between 2017 and
2018 until the work is completed.
3.1.3 TWENEBOA-ENYENRA-NTOMME (TEN) FIELD
The Tweneboa-Enyenra-Ntomme (TEN) project has estimated recoverable reserves of 240
MMboe and 396 bcf of gas (GNPC, 2017). As projected, the TEN Field achieved its highly
anticipated first oil on August 17, 2016 and went on to pump annualised average daily
production of 14,527 bopd between August and December 2016 compared to an initial
planned production of 23,092 bopd. The short fall in production has been attributed mainly to
the later than anticipated first oil date and some early reservoir performance challenges,
notably in the Enyenra reservoir and also inability to drill and complete more wells due to
ITLOS initial ruling provision of “No Drilling”(GNPC, MoF, Tullow, 2017). Total crude oil and
gas produced from the TEN Field was 5.32 million barrels and 6,531 MMScf respectively. A
total of five (5) liftings were carried out on the TEN Field, one (1) of which was undertaken by
GNPC on behalf of the Ghana Group. The first associated and non-associated gas exports are
scheduled for 12 and 24 months, respectively, from first oil (MoF, 2017). Details of petroleum
production from the TEN Field are discussed in Section 4 of the report.

10
FIGURE 2: MAP OF TEN FIELD (L) AND AERIAL SHOT OF FPSO J.E.A. MILLS (R)
In addition to delivered first oil, the following project milestones were achieved in the TEN
Project in 2016:
The gas export pipeline and manifold were installed on the seafloor expected to be tie-
in to Jubilee and GNGC pipeline in February 2017.
Construction Tie-in-Agreement of the Gas Export Manifold (GEM) between the
Operator (Tullow) and GNGC signed;
Negotiations on the commercial terms of the Gas Sales Agreement (GSA) commenced
during the last quarter of 2016;
Construction of Gas Export Line commenced and expected to be completed in
January, 2017 with interconnection to the Jubilee Field scheduled for February/March,
2017.
Commenced Gas re-injection on 13th December, 2016
3.1.4 SANKOFA-GYE-NYAME (SGN) FIELD
The Sankofa-Gye Nyame (SGN) Field (known as the Offshore Cape Three Points (OCTP)
Project) consists of a number of discoveries3 with combined estimated oil and gas reserves of
398.8MMboe which is made up of 204 million barrels of oil (mmbbls) and 1,071 billion cubic
feet (bcf) of gas (GNPC, 2016). First oil from the SGN Field is expected in the third quarter of
2017 and peak at 45,000 barrels of oil a day by 2018, whereas gas production is expected to
start six months later in the first quarter of 2018, with a daily production capacity of 170 million
cubic feet. (GNPC, 2016 and 2017). The Field is operated by ENI Ghana Exploration and
3 The project covers the Sankofa Main, Sankofa East, Gye Nyame, Sankofa East Cenomanian and Sankofa East Campanian fields.
11
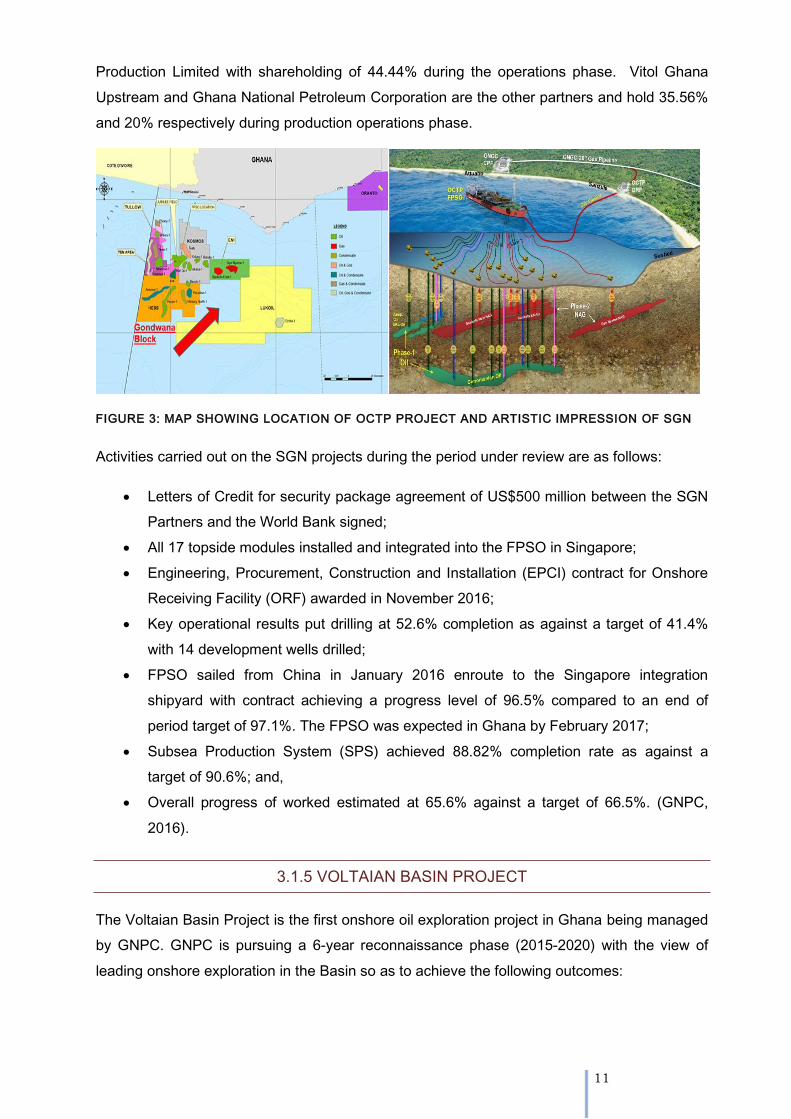
Production Limited with shareholding of 44.44% during the operations phase. Vitol Ghana
Upstream and Ghana National Petroleum Corporation are the other partners and hold 35.56%
and 20% respectively during production operations phase.
FIGURE 3: MAP SHOWING LOCATION OF OCTP PROJECT AND ARTISTIC IMPRESSION OF SGN
Activities carried out on the SGN projects during the period under review are as follows:
Letters of Credit for security package agreement of US$500 million between the SGN
Partners and the World Bank signed;
All 17 topside modules installed and integrated into the FPSO in Singapore;
Engineering, Procurement, Construction and Installation (EPCI) contract for Onshore
Receiving Facility (ORF) awarded in November 2016;
Key operational results put drilling at 52.6% completion as against a target of 41.4%
with 14 development wells drilled;
FPSO sailed from China in January 2016 enroute to the Singapore integration
shipyard with contract achieving a progress level of 96.5% compared to an end of
period target of 97.1%. The FPSO was expected in Ghana by February 2017;
Subsea Production System (SPS) achieved 88.82% completion rate as against a
target of 90.6%; and,
Overall progress of worked estimated at 65.6% against a target of 66.5%. (GNPC,
2016).
3.1.5 VOLTAIAN BASIN PROJECT
The Voltaian Basin Project is the first onshore oil exploration project in Ghana being managed
by GNPC. GNPC is pursuing a 6-year reconnaissance phase (2015-2020) with the view of
leading onshore exploration in the Basin so as to achieve the following outcomes:
12
Determine the thermal maturity of potential source rocks by optimising the right mix of
foreign and local expertise.
Enhance the knowledge base of the relatively unexplored basin which would inform
the effective development of exploration programmes in the near future;
De-risk the basin to justify further investments; and,
Build the capacity of GNPC for operatorship.
In this regard, the GNPC undertook the following activities during the period under review:
Completed technical and financial evaluations of 2D Seismic Acquisition, awaiting
approval from Central Tender Review Committee (CTRC);
Environmental Impact Statement (EIS) (permit plan, waste management plan and
monitoring budget) submitted to the Environmental Protection Agency (EPA) and
permit fees paid;
Security Plan submitted to Petroleum Security Coordinating Committee and the
Regional Security Committee;
Received Expression of Interest from 29 Seismic Processing Companies; 8
companies were shortlisted.
Continued engagement with management and ETC on the evaluation criteria for
engagement of Seismic Data Acquisition Contractor.
3.1.6 IMPACT OF AND UPDATES ON THE MARITIME BOUNDARY DISPUTE WITH
LA COTE D’IVOIRE
As reported in the 2015 PIAC Semi and Annual Reports, Ghana’s burgeoning petroleum
industry suffered a major setback following an interim ruling of the International Tribunal for
the Law of the Sea (ITLOS) regarding the border dispute between Ghana and La Cote
d’Ivoire. As explained at the time, the preliminary ruling of the ITLOS placed a moratorium on
exploration and drilling of new wells in the disputed area. We reported that the decision
affects the drilling of new wells in the TEN Project and other blocks that fall within
the disputed area but it does not affect work required to complete on-going wells.
Concerns were however raised at the time that the TEN Field may end up producing below the
projected levels if the 10 initial development wells drilled before the ITLOS provisional ruling
were not able to produce as much as expected until 2017 when the Tribunal is expected to
give its final ruling. These apprehensions appear to have become a reality because as
reported in Section 3.1.3 of this report, although some of the wells (especially in the Enyenra
reservoir) on the TEN Field under-performed thereby resulting in lower than expected
13
volumes, the TEN Partners could not intervene because of the ITLOS moratorium and had to
manage existing wells in a prudent and sustainable manner (Tullow, 2017).
During the period under review, proceedings at ITLOS continued with both Ghana and La
Cote d’Ivoire submitting their reports (memorial and counter memorials) to the Court. The draft
submissions for the oral hearings were prepared by a team of Ghana’s internal and external
lawyers. The oral court hearing is scheduled to commence from February 6 -17, 2017 while a
final ruling is anticipated in the fourth quarter of 2017.
3.1.7 DECOMMISSIONING OF THE SALTPOND FIELD
PIAC’s repeated call for the cessation of operations on the Saltpond Field due to non-
performance/profitability, was finally answered during the period under review when the
Minister of Petroleum per a letter dated August 18, 2016 formally terminated the Petroleum
Agreement on the Saltpond Field. The GNPC is in the process of decommissioning the Field
in phases. Phase 1 started in October 2016 and entailed the selection of a Consultant to lead
the process. Technical and Financial proposals from shortlisted consultants have been
submitted and evaluations completed. The selection of the consultant was still pending as at
the end of the period under review (Ministry of Finance, 2017).
3.1.8. PETROLEUM AGREEMENTS
The following Petroleum Agreements (PAs) were executed and ratified by Parliament in 2016:
Springfield West Cape Three Points (Block 2)
ENI Ghana Exploration and Production Limited (BLOCK 4)
SWAOCO Onshore/offshore Keta Delta Block
Two of the PAs signed with Springfield and ENI Ghana Exploration and Production Company
Limited (Block 4) were in respect of exploration in the Western Basin while the one signed with
Swiss Africa was in respect of a block in the Accra-Keta basin.
3.2 STATUS OF WESTERN CORRIDOR GAS INFRASTRUCTURE
PROJECT (WCGIP)
As reported in the 2015 PIAC Annual Report, the Western Corridor Gas Infrastructure Project
(WCGIP) was completed in November 2014 and commissioned over a five-month period from
November, 2014 to May 2015. The project has since April 2015 entered its commercial phase
14
and has been processing and selling lean gas to the Volta River Authority (VRA), Liquefied
Petroleum Gas (LPG) to Sage Petroleum and condensates to other companies.
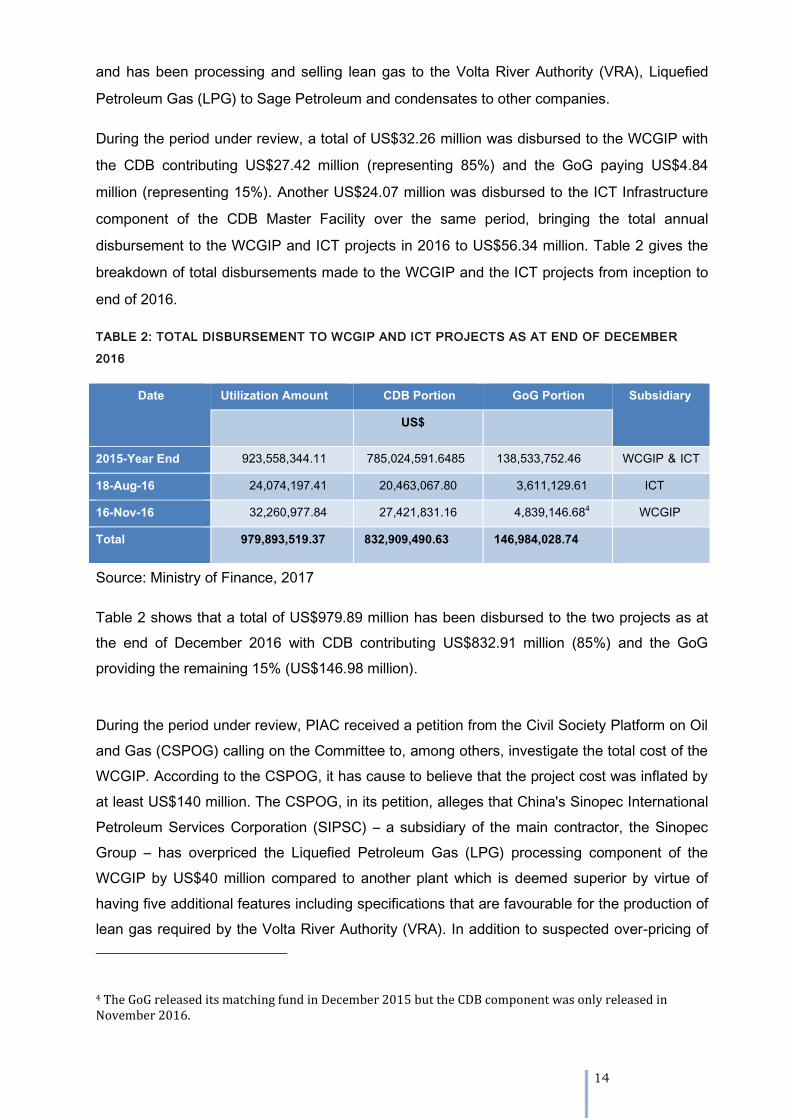
During the period under review, a total of US$32.26 million was disbursed to the WCGIP with
the CDB contributing US$27.42 million (representing 85%) and the GoG paying US$4.84
million (representing 15%). Another US$24.07 million was disbursed to the ICT Infrastructure
component of the CDB Master Facility over the same period, bringing the total annual
disbursement to the WCGIP and ICT projects in 2016 to US$56.34 million. Table 2 gives the
breakdown of total disbursements made to the WCGIP and the ICT projects from inception to
end of 2016.
TABLE 2: TOTAL DISBURSEMENT TO WCGIP AND ICT PROJECTS AS AT END OF DECEMBER
2016
Date Utilization Amount CDB Portion GoG Portion Subsidiary
US$
2015-Year End 923,558,344.11 785,024,591.6485 138,533,752.46 WCGIP & ICT
18-Aug-16 24,074,197.41 20,463,067.80 3,611,129.61 ICT
16-Nov-16 32,260,977.84 27,421,831.16 4,839,146.684 WCGIP
Total 979,893,519.37 832,909,490.63 146,984,028.74
Source: Ministry of Finance, 2017
Table 2 shows that a total of US$979.89 million has been disbursed to the two projects as at
the end of December 2016 with CDB contributing US$832.91 million (85%) and the GoG
providing the remaining 15% (US$146.98 million).
During the period under review, PIAC received a petition from the Civil Society Platform on Oil
and Gas (CSPOG) calling on the Committee to, among others, investigate the total cost of the
WCGIP. According to the CSPOG, it has cause to believe that the project cost was inflated by
at least US$140 million. The CSPOG, in its petition, alleges that China's Sinopec International
Petroleum Services Corporation (SIPSC) – a subsidiary of the main contractor, the Sinopec
Group – has overpriced the Liquefied Petroleum Gas (LPG) processing component of the
WCGIP by US$40 million compared to another plant which is deemed superior by virtue of
having five additional features including specifications that are favourable for the production of
lean gas required by the Volta River Authority (VRA). In addition to suspected over-pricing of
4 The GoG released its matching fund in December 2015 but the CDB component was only released in November 2016.
15
the LPG processing unit, the CSPOG opines that the 45-kilometer shallow water pipelines
installed by SIPSC was estimated to cost about $1.6 million more per kilometre than the deep
water pipeline installed by the Ghana National Petroleum Corporation (GNPC) despite the
shallow water pipelines not meeting the technical requirement of having internal coating.
The CSPOG petition further raises concerns about a possible transfer pricing manipulation by
referring to an arrangement involving SIPSC and its special purpose subsidiary offshore firm
called SAF Petroleum Investments (FZE), registered in Dubai. Under the arrangement, SAF
was expected to make the initial procurement and resell the items to SIPSC, thereby
increasing the transaction cost of the project. According to the CSPOG, unconfirmed report
reaching it indicates that the Ghana Revenue Authority has already recovered over US$10
million in Transfer Pricing-related taxes and penalties while auditing the transaction.
Although the PIAC cannot substantiate the claims being made by CSPOG in its petition, it is of
the view that the offences being alleged are serious enough to warrant further investigations
and thus would be probing further to ascertain the veracity or otherwise of the alleged financial
malpractices. An update of PIAC findings would be presented in the 2017 Semi-Annual
Report.
16
SECTION 4
4.0 PETROLEUM PRODUCTION, PRICING AND LIFTING
4.1 CRUDE OIL PRODUCTION
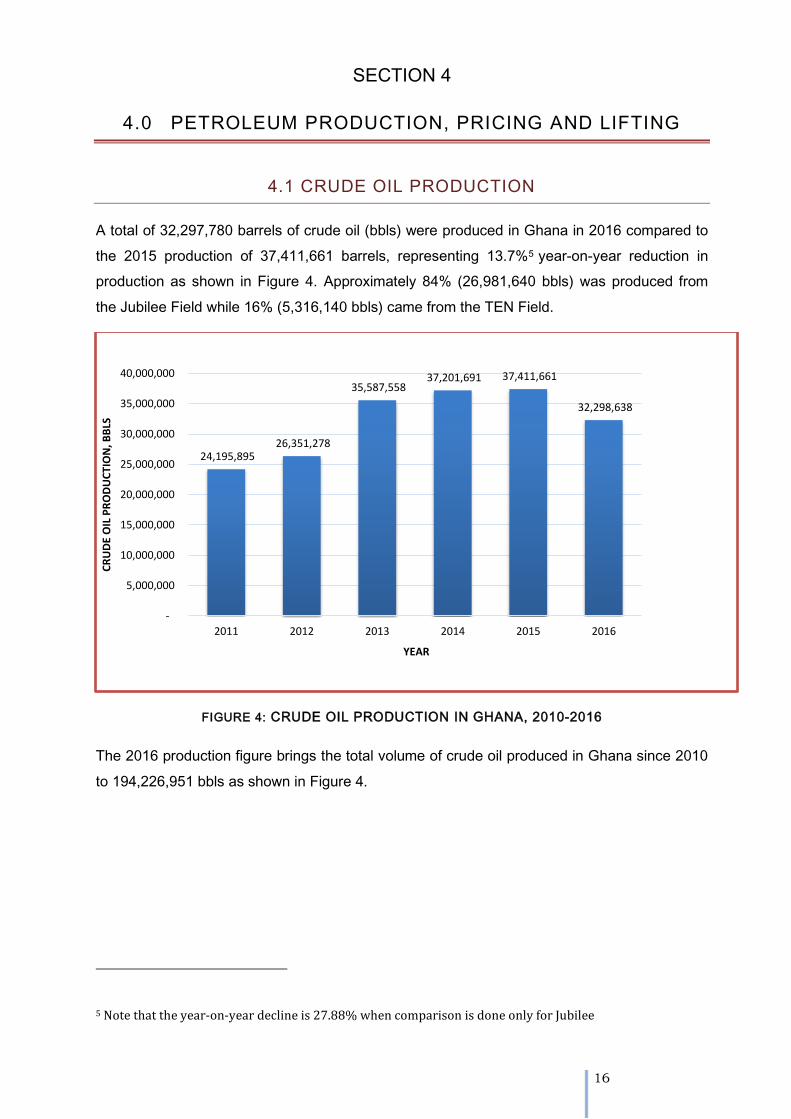
A total of 32,297,780 barrels of crude oil (bbls) were produced in Ghana in 2016 compared to
the 2015 production of 37,411,661 barrels, representing 13.7%5 year-on-year reduction in
production as shown in Figure 4. Approximately 84% (26,981,640 bbls) was produced from
the Jubilee Field while 16% (5,316,140 bbls) came from the TEN Field.
FIGURE 4: CRUDE OIL PRODUCTION IN GHANA, 2010-2016
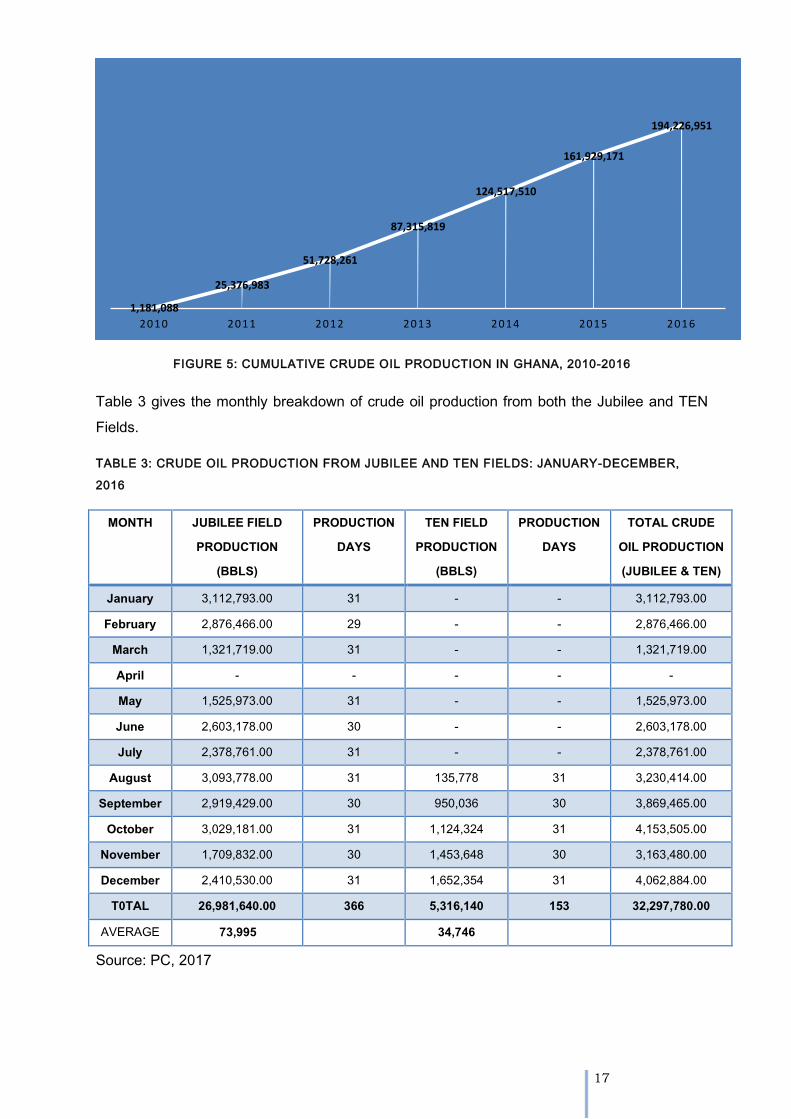
The 2016 production figure brings the total volume of crude oil produced in Ghana since 2010
to 194,226,951 bbls as shown in Figure 4.
5 Note that the year-on-year decline is 27.88% when comparison is done only for Jubilee
24,195,895 26,351,278
35,587,558 37,201,691 37,411,661
32,298,638
-
5,000,000
10,000,000
15,000,000
20,000,000
25,000,000
30,000,000
35,000,000
40,000,000
2011 2012 2013 2014 2015 2016
CR
UD
E O
IL P
RO
DU
CTI
ON
, BB
LS
YEAR
17
FIGURE 5: CUMULATIVE CRUDE OIL PRODUCTION IN GHANA, 2010-2016
Table 3 gives the monthly breakdown of crude oil production from both the Jubilee and TEN
Fields.
TABLE 3: CRUDE OIL PRODUCTION FROM JUBILEE AND TEN FIELDS: JANUARY-DECEMBER,
2016
MONTH JUBILEE FIELD PRODUCTION
(BBLS)
PRODUCTION DAYS
TEN FIELD PRODUCTION
(BBLS)
PRODUCTION DAYS
TOTAL CRUDE OIL PRODUCTION (JUBILEE & TEN)
January 3,112,793.00 31 - - 3,112,793.00 February 2,876,466.00 29 - - 2,876,466.00
March 1,321,719.00 31 - - 1,321,719.00 April - - - - - May 1,525,973.00 31 - - 1,525,973.00 June 2,603,178.00 30 - - 2,603,178.00 July 2,378,761.00 31 - - 2,378,761.00
August 3,093,778.00 31 135,778 31 3,230,414.00 September 2,919,429.00 30 950,036 30 3,869,465.00
October 3,029,181.00 31 1,124,324 31 4,153,505.00 November 1,709,832.00 30 1,453,648 30 3,163,480.00 December 2,410,530.00 31 1,652,354 31 4,062,884.00
T0TAL 26,981,640.00 366 5,316,140 153 32,297,780.00 AVERAGE 73,995 34,746
Source: PC, 2017
1,181,088
25,376,983
51,728,261
87,315,819
124,517,510
161,929,171
194,226,951
2010 2011 2012 2013 2014 2015 2016
18
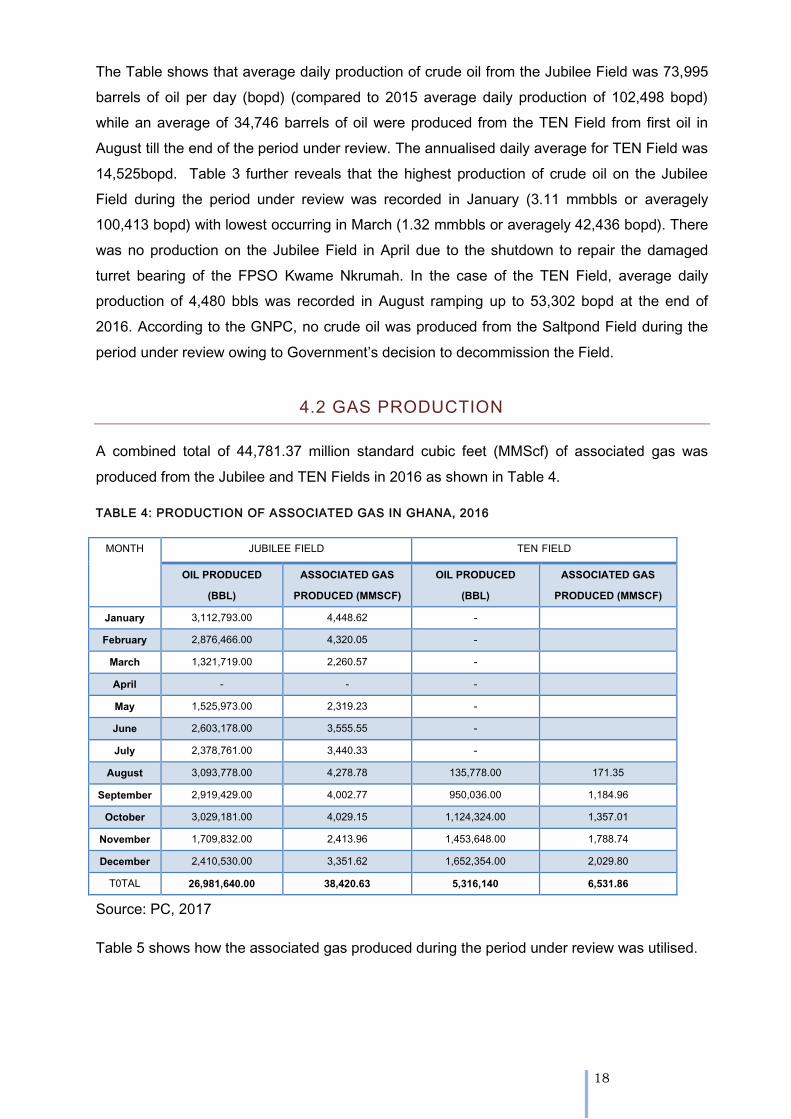
The Table shows that average daily production of crude oil from the Jubilee Field was 73,995
barrels of oil per day (bopd) (compared to 2015 average daily production of 102,498 bopd)
while an average of 34,746 barrels of oil were produced from the TEN Field from first oil in
August till the end of the period under review. The annualised daily average for TEN Field was
14,525bopd. Table 3 further reveals that the highest production of crude oil on the Jubilee
Field during the period under review was recorded in January (3.11 mmbbls or averagely
100,413 bopd) with lowest occurring in March (1.32 mmbbls or averagely 42,436 bopd). There
was no production on the Jubilee Field in April due to the shutdown to repair the damaged
turret bearing of the FPSO Kwame Nkrumah. In the case of the TEN Field, average daily
production of 4,480 bbls was recorded in August ramping up to 53,302 bopd at the end of
2016. According to the GNPC, no crude oil was produced from the Saltpond Field during the
period under review owing to Government’s decision to decommission the Field.
4.2 GAS PRODUCTION
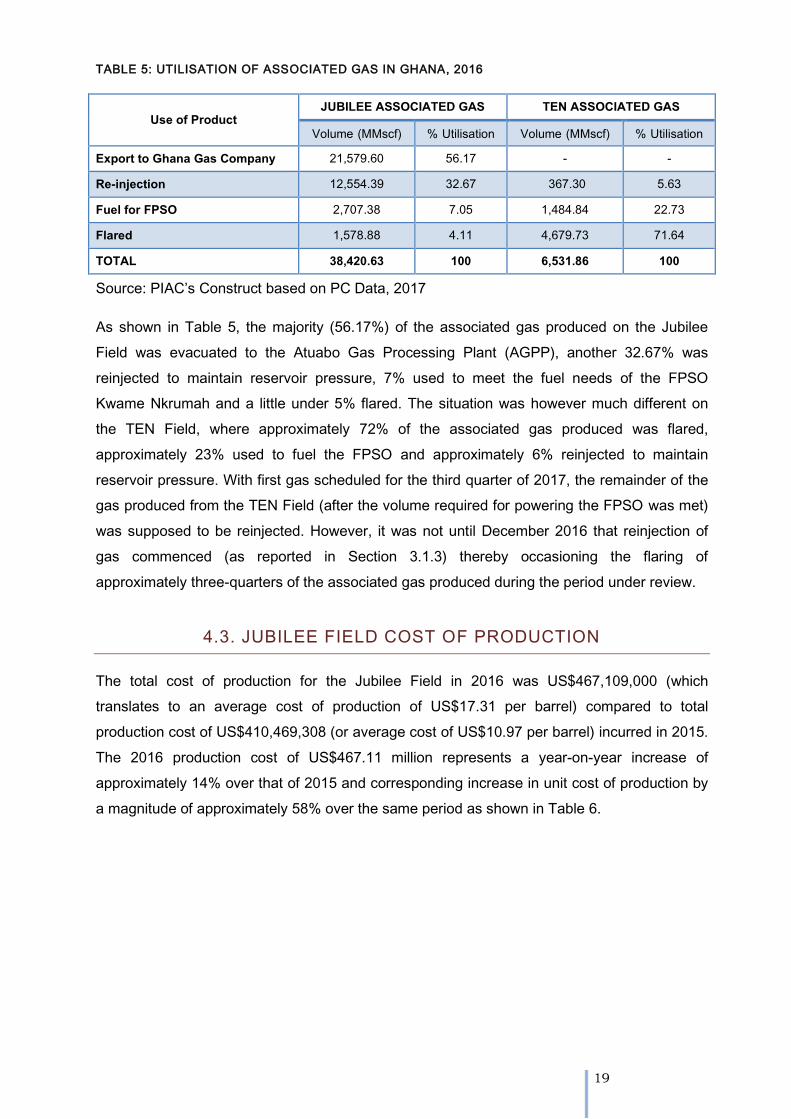
A combined total of 44,781.37 million standard cubic feet (MMScf) of associated gas was
produced from the Jubilee and TEN Fields in 2016 as shown in Table 4.
TABLE 4: PRODUCTION OF ASSOCIATED GAS IN GHANA, 2016
MONTH JUBILEE FIELD TEN FIELD
OIL PRODUCED (BBL)
ASSOCIATED GAS PRODUCED (MMSCF)
OIL PRODUCED (BBL)
ASSOCIATED GAS PRODUCED (MMSCF)
January 3,112,793.00 4,448.62 - February 2,876,466.00 4,320.05 -
March 1,321,719.00 2,260.57 - April - - - May 1,525,973.00 2,319.23 - June 2,603,178.00 3,555.55 -
July 2,378,761.00 3,440.33 - August 3,093,778.00 4,278.78 135,778.00 171.35
September 2,919,429.00 4,002.77 950,036.00 1,184.96 October 3,029,181.00 4,029.15 1,124,324.00 1,357.01
November 1,709,832.00 2,413.96 1,453,648.00 1,788.74 December 2,410,530.00 3,351.62 1,652,354.00 2,029.80
T0TAL 26,981,640.00 38,420.63 5,316,140 6,531.86
Source: PC, 2017
Table 5 shows how the associated gas produced during the period under review was utilised.
19
TABLE 5: UTILISATION OF ASSOCIATED GAS IN GHANA, 2016
Use of Product JUBILEE ASSOCIATED GAS TEN ASSOCIATED GAS
Volume (MMscf) % Utilisation Volume (MMscf) % Utilisation Export to Ghana Gas Company 21,579.60 56.17 - - Re-injection 12,554.39 32.67 367.30 5.63 Fuel for FPSO 2,707.38 7.05 1,484.84 22.73 Flared 1,578.88 4.11 4,679.73 71.64 TOTAL 38,420.63 100 6,531.86 100
Source: PIAC’s Construct based on PC Data, 2017
As shown in Table 5, the majority (56.17%) of the associated gas produced on the Jubilee
Field was evacuated to the Atuabo Gas Processing Plant (AGPP), another 32.67% was
reinjected to maintain reservoir pressure, 7% used to meet the fuel needs of the FPSO
Kwame Nkrumah and a little under 5% flared. The situation was however much different on
the TEN Field, where approximately 72% of the associated gas produced was flared,
approximately 23% used to fuel the FPSO and approximately 6% reinjected to maintain
reservoir pressure. With first gas scheduled for the third quarter of 2017, the remainder of the
gas produced from the TEN Field (after the volume required for powering the FPSO was met)
was supposed to be reinjected. However, it was not until December 2016 that reinjection of
gas commenced (as reported in Section 3.1.3) thereby occasioning the flaring of
approximately three-quarters of the associated gas produced during the period under review.
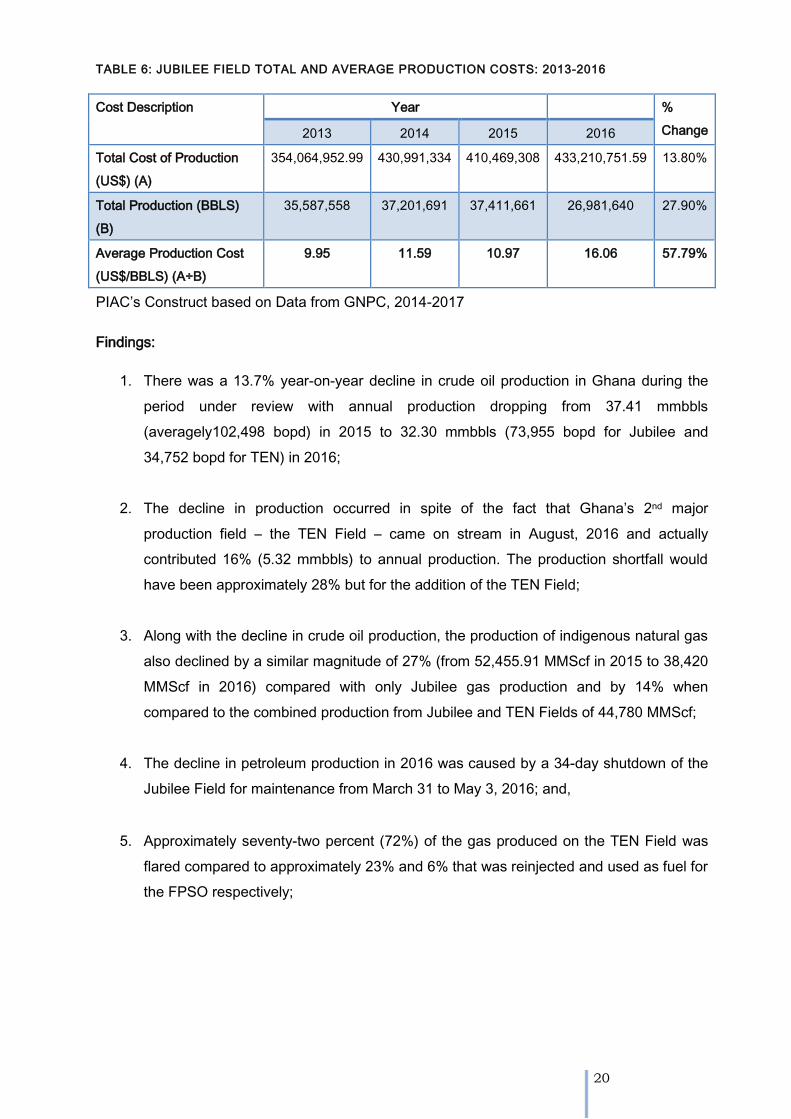
4.3. JUBILEE FIELD COST OF PRODUCTION
The total cost of production for the Jubilee Field in 2016 was US$467,109,000 (which
translates to an average cost of production of US$17.31 per barrel) compared to total
production cost of US$410,469,308 (or average cost of US$10.97 per barrel) incurred in 2015.
The 2016 production cost of US$467.11 million represents a year-on-year increase of
approximately 14% over that of 2015 and corresponding increase in unit cost of production by
a magnitude of approximately 58% over the same period as shown in Table 6.
20
TABLE 6: JUBILEE FIELD TOTAL AND AVERAGE PRODUCTION COSTS: 2013-2016
Cost Description Year %
Change 2013 2014 2015 2016
Total Cost of Production
(US$) (A)
354,064,952.99 430,991,334 410,469,308 433,210,751.59 13.80%
Total Production (BBLS)
(B)
35,587,558 37,201,691 37,411,661 26,981,640 27.90%
Average Production Cost
(US$/BBLS) (A÷B)
9.95 11.59 10.97 16.06 57.79%
PIAC’s Construct based on Data from GNPC, 2014-2017
Findings:
1. There was a 13.7% year-on-year decline in crude oil production in Ghana during the
period under review with annual production dropping from 37.41 mmbbls
(averagely102,498 bopd) in 2015 to 32.30 mmbbls (73,955 bopd for Jubilee and
34,752 bopd for TEN) in 2016;
2. The decline in production occurred in spite of the fact that Ghana’s 2nd major
production field – the TEN Field – came on stream in August, 2016 and actually
contributed 16% (5.32 mmbbls) to annual production. The production shortfall would
have been approximately 28% but for the addition of the TEN Field;
3. Along with the decline in crude oil production, the production of indigenous natural gas
also declined by a similar magnitude of 27% (from 52,455.91 MMScf in 2015 to 38,420
MMScf in 2016) compared with only Jubilee gas production and by 14% when
compared to the combined production from Jubilee and TEN Fields of 44,780 MMScf;
4. The decline in petroleum production in 2016 was caused by a 34-day shutdown of the
Jubilee Field for maintenance from March 31 to May 3, 2016; and,
5. Approximately seventy-two percent (72%) of the gas produced on the TEN Field was
flared compared to approximately 23% and 6% that was reinjected and used as fuel for
the FPSO respectively;
21
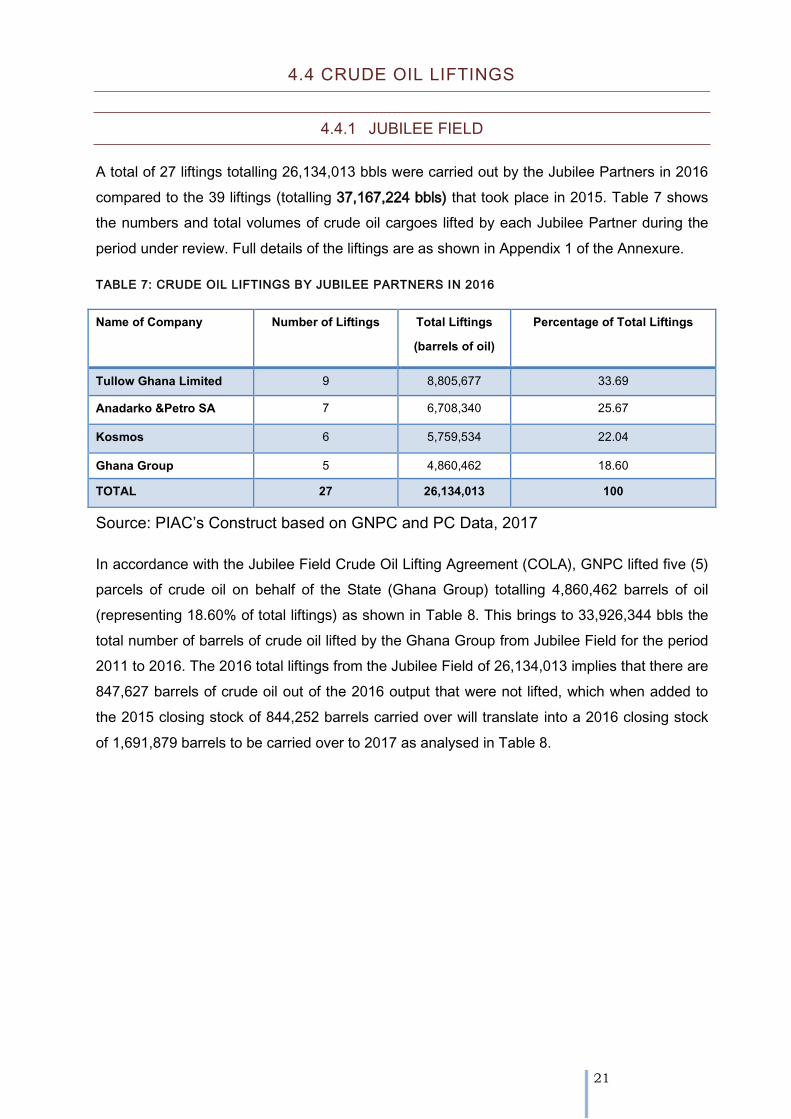
4.4 CRUDE OIL LIFTINGS
4.4.1 JUBILEE FIELD
A total of 27 liftings totalling 26,134,013 bbls were carried out by the Jubilee Partners in 2016
compared to the 39 liftings (totalling 37,167,224 bbls) that took place in 2015. Table 7 shows
the numbers and total volumes of crude oil cargoes lifted by each Jubilee Partner during the
period under review. Full details of the liftings are as shown in Appendix 1 of the Annexure.
TABLE 7: CRUDE OIL LIFTINGS BY JUBILEE PARTNERS IN 2016
Name of Company Number of Liftings Total Liftings (barrels of oil)
Percentage of Total Liftings
Tullow Ghana Limited 9 8,805,677 33.69
Anadarko &Petro SA 7 6,708,340 25.67
Kosmos 6 5,759,534 22.04
Ghana Group 5 4,860,462 18.60 TOTAL 27 26,134,013 100
Source: PIAC’s Construct based on GNPC and PC Data, 2017
In accordance with the Jubilee Field Crude Oil Lifting Agreement (COLA), GNPC lifted five (5)
parcels of crude oil on behalf of the State (Ghana Group) totalling 4,860,462 barrels of oil
(representing 18.60% of total liftings) as shown in Table 8. This brings to 33,926,344 bbls the
total number of barrels of crude oil lifted by the Ghana Group from Jubilee Field for the period
2011 to 2016. The 2016 total liftings from the Jubilee Field of 26,134,013 implies that there are
847,627 barrels of crude oil out of the 2016 output that were not lifted, which when added to
the 2015 closing stock of 844,252 barrels carried over will translate into a 2016 closing stock
of 1,691,879 barrels to be carried over to 2017 as analysed in Table 8.
22
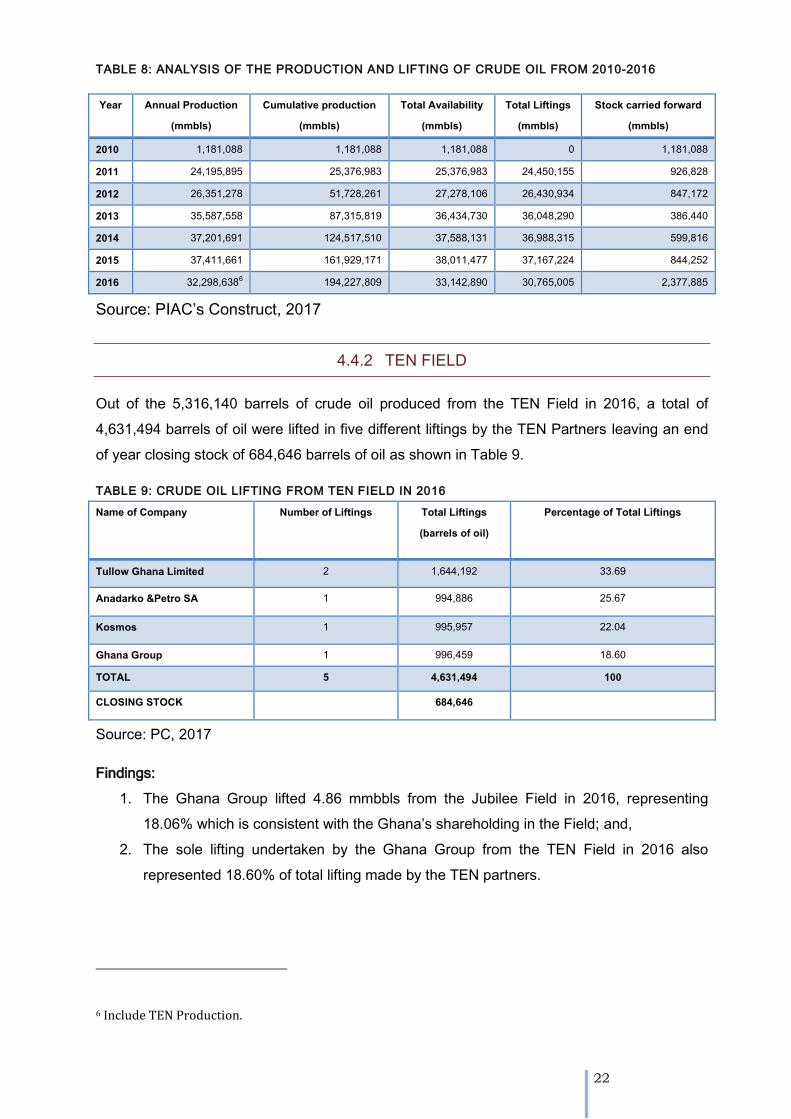
TABLE 8: ANALYSIS OF THE PRODUCTION AND LIFTING OF CRUDE OIL FROM 2010-2016
Year Annual Production (mmbls)
Cumulative production (mmbls)
Total Availability (mmbls)
Total Liftings (mmbls)
Stock carried forward (mmbls)
2010 1,181,088 1,181,088 1,181,088 0 1,181,088 2011 24,195,895 25,376,983 25,376,983 24,450,155 926,828 2012 26,351,278 51,728,261 27,278,106 26,430,934 847,172 2013 35,587,558 87,315,819 36,434,730 36,048,290 386,440 2014 37,201,691 124,517,510 37,588,131 36,988,315 599,816 2015 37,411,661 161,929,171 38,011,477 37,167,224 844,252 2016 32,298,6386 194,227,809 33,142,890 30,765,005 2,377,885
Source: PIAC’s Construct, 2017
4.4.2 TEN FIELD
Out of the 5,316,140 barrels of crude oil produced from the TEN Field in 2016, a total of
4,631,494 barrels of oil were lifted in five different liftings by the TEN Partners leaving an end
of year closing stock of 684,646 barrels of oil as shown in Table 9.
TABLE 9: CRUDE OIL LIFTING FROM TEN FIELD IN 2016
Name of Company Number of Liftings Total Liftings (barrels of oil)
Percentage of Total Liftings
Tullow Ghana Limited 2 1,644,192 33.69
Anadarko &Petro SA 1 994,886 25.67
Kosmos 1 995,957 22.04
Ghana Group 1 996,459 18.60 TOTAL 5 4,631,494 100
CLOSING STOCK 684,646
Source: PC, 2017
Findings:
1. The Ghana Group lifted 4.86 mmbbls from the Jubilee Field in 2016, representing
18.06% which is consistent with the Ghana’s shareholding in the Field; and,
2. The sole lifting undertaken by the Ghana Group from the TEN Field in 2016 also
represented 18.60% of total lifting made by the TEN partners.
6 Include TEN Production.
23
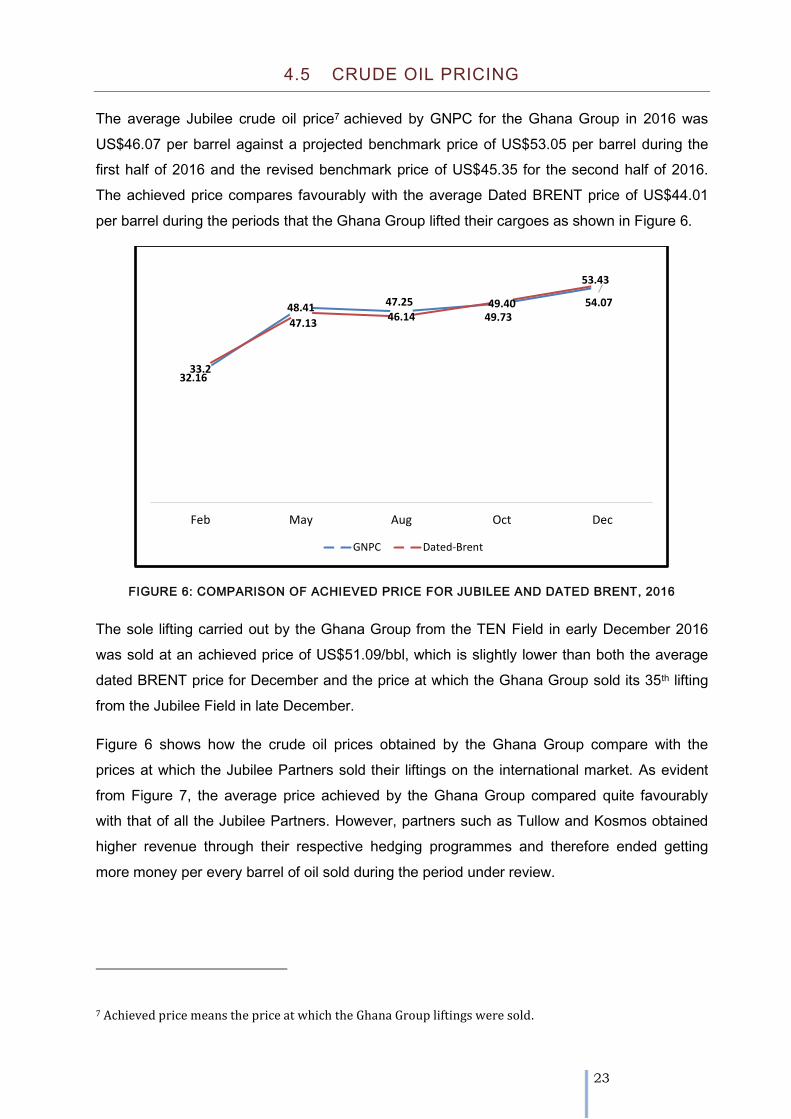
4.5 CRUDE OIL PRICING
The average Jubilee crude oil price7 achieved by GNPC for the Ghana Group in 2016 was
US$46.07 per barrel against a projected benchmark price of US$53.05 per barrel during the
first half of 2016 and the revised benchmark price of US$45.35 for the second half of 2016.
The achieved price compares favourably with the average Dated BRENT price of US$44.01
per barrel during the periods that the Ghana Group lifted their cargoes as shown in Figure 6.
FIGURE 6: COMPARISON OF ACHIEVED PRICE FOR JUBILEE AND DATED BRENT, 2016
The sole lifting carried out by the Ghana Group from the TEN Field in early December 2016
was sold at an achieved price of US$51.09/bbl, which is slightly lower than both the average
dated BRENT price for December and the price at which the Ghana Group sold its 35th lifting
from the Jubilee Field in late December.
Figure 6 shows how the crude oil prices obtained by the Ghana Group compare with the
prices at which the Jubilee Partners sold their liftings on the international market. As evident
from Figure 7, the average price achieved by the Ghana Group compared quite favourably
with that of all the Jubilee Partners. However, partners such as Tullow and Kosmos obtained
higher revenue through their respective hedging programmes and therefore ended getting
more money per every barrel of oil sold during the period under review.
7 Achieved price means the price at which the Ghana Group liftings were sold.
32.16
48.41 47.25 49.40
53.43
33.2
47.1346.14 49.73
54.07
Feb May Aug Oct Dec
GNPC Dated-Brent
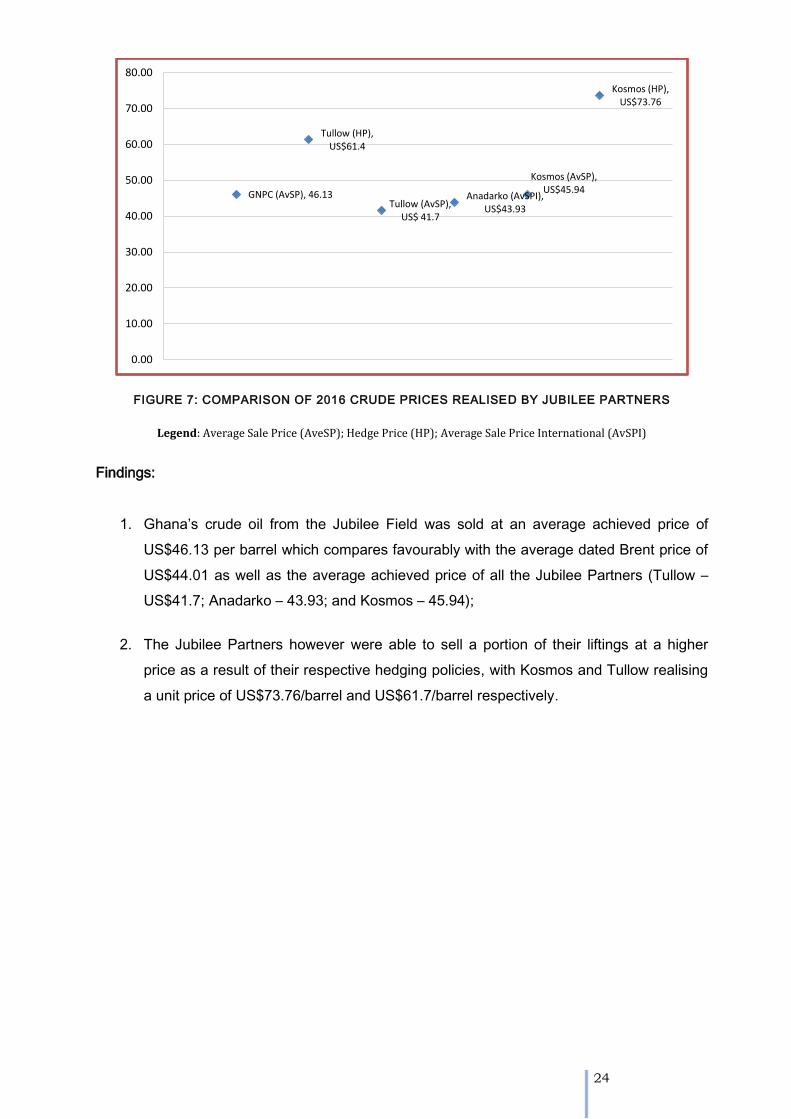
24
FIGURE 7: COMPARISON OF 2016 CRUDE PRICES REALISED BY JUBILEE PARTNERS
Legend: Average Sale Price (AveSP); Hedge Price (HP); Average Sale Price International (AvSPI)
Findings:
1. Ghana’s crude oil from the Jubilee Field was sold at an average achieved price of
US$46.13 per barrel which compares favourably with the average dated Brent price of
US$44.01 as well as the average achieved price of all the Jubilee Partners (Tullow –
US$41.7; Anadarko – 43.93; and Kosmos – 45.94);
2. The Jubilee Partners however were able to sell a portion of their liftings at a higher
price as a result of their respective hedging policies, with Kosmos and Tullow realising
a unit price of US$73.76/barrel and US$61.7/barrel respectively.
GNPC (AvSP), 46.13
Tullow (HP), US$61.4
Tullow (AvSP),US$ 41.7
Anadarko (AvSPI), US$43.93
Kosmos (AvSP), US$45.94
Kosmos (HP), US$73.76
0.00
10.00
20.00
30.00
40.00
50.00
60.00
70.00
80.00
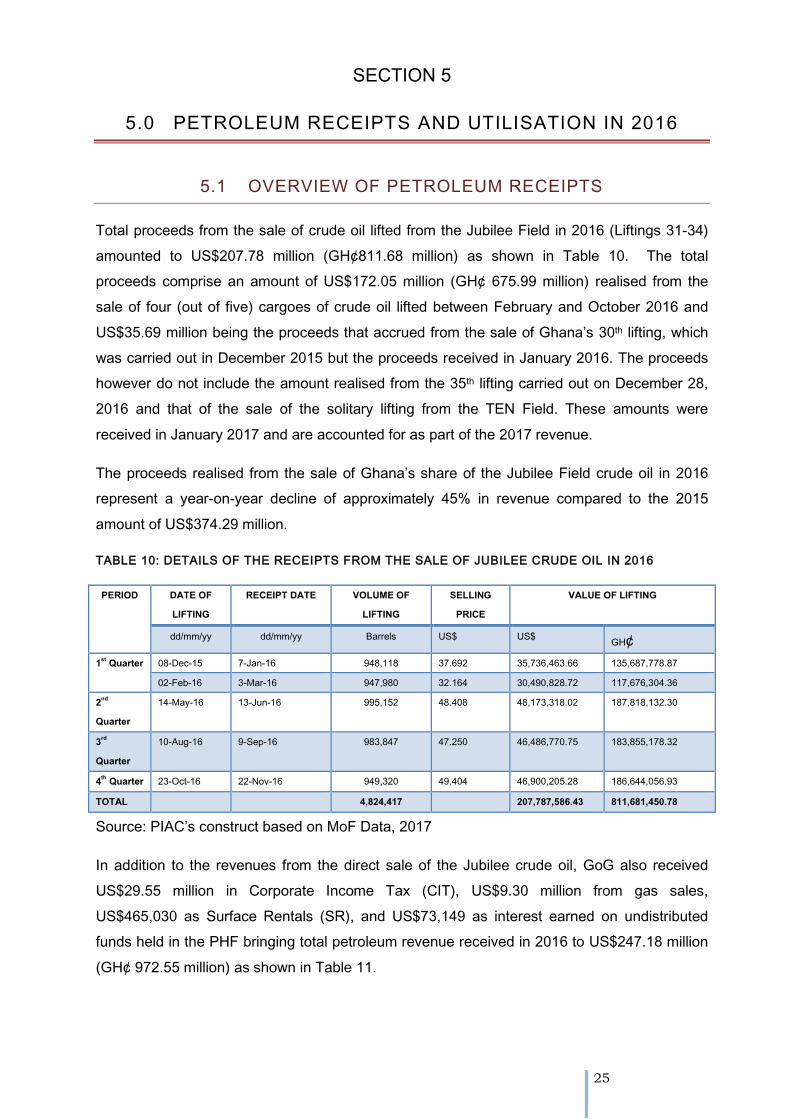
25
SECTION 5
5.0 PETROLEUM RECEIPTS AND UTILISATION IN 2016
5.1 OVERVIEW OF PETROLEUM RECEIPTS
Total proceeds from the sale of crude oil lifted from the Jubilee Field in 2016 (Liftings 31-34)
amounted to US$207.78 million (GH¢811.68 million) as shown in Table 10. The total
proceeds comprise an amount of US$172.05 million (GH¢ 675.99 million) realised from the
sale of four (out of five) cargoes of crude oil lifted between February and October 2016 and
US$35.69 million being the proceeds that accrued from the sale of Ghana’s 30th lifting, which
was carried out in December 2015 but the proceeds received in January 2016. The proceeds
however do not include the amount realised from the 35th lifting carried out on December 28,
2016 and that of the sale of the solitary lifting from the TEN Field. These amounts were
received in January 2017 and are accounted for as part of the 2017 revenue.
The proceeds realised from the sale of Ghana’s share of the Jubilee Field crude oil in 2016
represent a year-on-year decline of approximately 45% in revenue compared to the 2015
amount of US$374.29 million.
TABLE 10: DETAILS OF THE RECEIPTS FROM THE SALE OF JUBILEE CRUDE OIL IN 2016
PERIOD DATE OF LIFTING
RECEIPT DATE VOLUME OF LIFTING
SELLING PRICE
VALUE OF LIFTING
dd/mm/yy dd/mm/yy Barrels US$ US$ GH¢
1st Quarter 08-Dec-15 7-Jan-16 948,118 37.692 35,736,463.66 135,687,778.87 02-Feb-16 3-Mar-16 947,980 32.164 30,490,828.72 117,676,304.36
2nd Quarter
14-May-16 13-Jun-16 995,152 48.408 48,173,318.02 187,818,132.30
3rd Quarter
10-Aug-16 9-Sep-16 983,847 47.250 46,486,770.75 183,855,178.32
4th Quarter 23-Oct-16 22-Nov-16 949,320 49.404 46,900,205.28 186,644,056.93 TOTAL 4,824,417 207,787,586.43 811,681,450.78
Source: PIAC’s construct based on MoF Data, 2017
In addition to the revenues from the direct sale of the Jubilee crude oil, GoG also received
US$29.55 million in Corporate Income Tax (CIT), US$9.30 million from gas sales,
US$465,030 as Surface Rentals (SR), and US$73,149 as interest earned on undistributed
funds held in the PHF bringing total petroleum revenue received in 2016 to US$247.18 million
(GH¢ 972.55 million) as shown in Table 11.

26
TABLE 11: SOURCES OF 2016 PETROLEUM RECEIPTS
Item Unit 1st Quarter 2nd Quarter 3rd Quarter 4th Quarter TOTAL %
Contribution
Jubilee Royalties
US$ 18,438,681 13,412,181 12,942,620.95 13,057,727 57,851,210.69 23.40
Carried and Participating Interest
US$ 47,788,611 34,761,137 33,544,149.80 33,842,478 149,936,375.74
60.66
Surface Rental
US$ 356,844 78,250 - 29,936 465,029.74 0.19
Corporate Income Tax
US$ 2,027,780
204,770 -
27,314,273 29,546,823.00 11.95
Gas Royalties
US$ - 379,554.50 - - 379,554.50 0.15
Gas CAPI 8,923,251.85 8,923,251.85 3.61 PHF Income 19,208.20 8,529.19 24,079.01 21,332.34 73,148.74 0.03 Price Differential
US$ - - - - - -
Total Petroleum Receipts
US$ 77,933,931 48,464,867 46,510,850 46,909,195 247,175,394.26 100 GH¢ 135,687,779 162,926,879 188,926,971 186,679,836 972,547,412.39
Source: BOG, 2017
The 2016 total petroleum receipts that accrued to the Government of Ghana translate to
approximately 38% year-on-year decline in petroleum revenues compared to the 2015 amount
of US$396.17 million. The Ministry of Finance has attributed the shortfall in petroleum
revenues to volatile crude prices and lower than expected crude oil production from both the
Jubilee and TEN Fields.
Figure 8 shows the percentage contribution of the various sources of revenues to total
petroleum receipts in 2016.
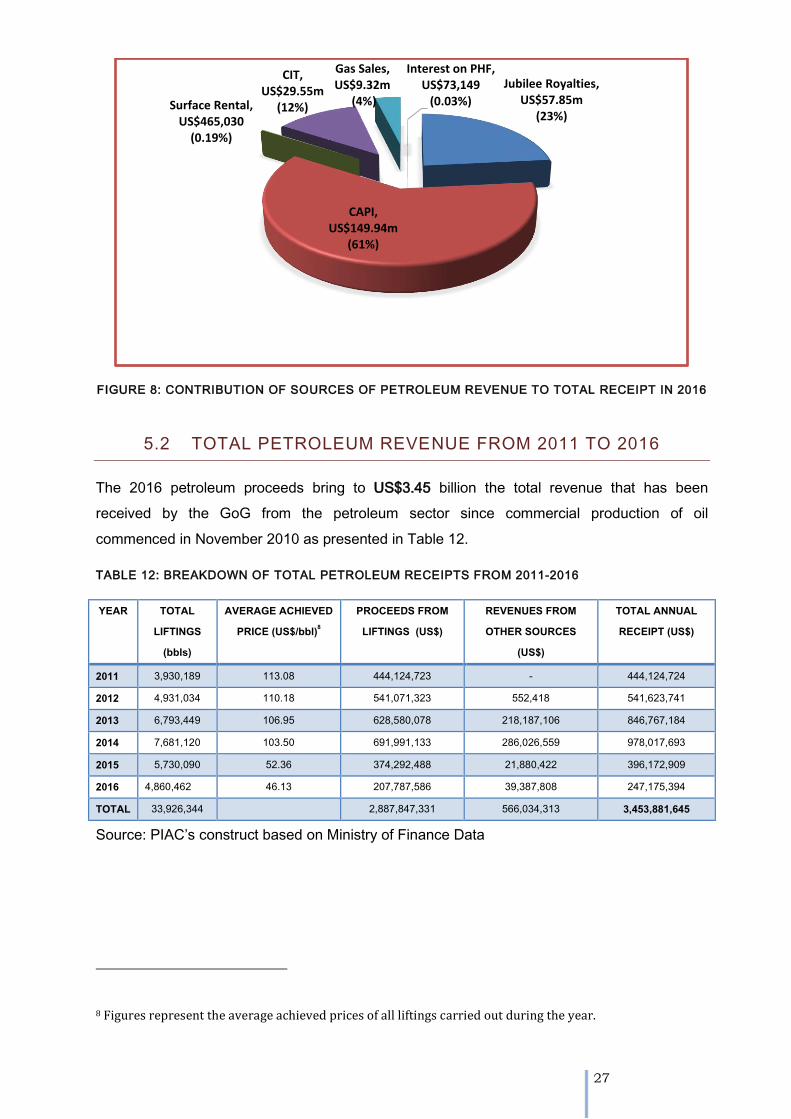
27
FIGURE 8: CONTRIBUTION OF SOURCES OF PETROLEUM REVENUE TO TOTAL RECEIPT IN 2016
5.2 TOTAL PETROLEUM REVENUE FROM 2011 TO 2016
The 2016 petroleum proceeds bring to US$3.45 billion the total revenue that has been
received by the GoG from the petroleum sector since commercial production of oil
commenced in November 2010 as presented in Table 12.
TABLE 12: BREAKDOWN OF TOTAL PETROLEUM RECEIPTS FROM 2011-2016
YEAR TOTAL LIFTINGS
(bbls)
AVERAGE ACHIEVED PRICE (US$/bbl)8
PROCEEDS FROM LIFTINGS (US$)
REVENUES FROM OTHER SOURCES
(US$)
TOTAL ANNUAL RECEIPT (US$)
2011 3,930,189 113.08 444,124,723 - 444,124,724
2012 4,931,034 110.18 541,071,323 552,418 541,623,741 2013 6,793,449 106.95 628,580,078 218,187,106 846,767,184 2014 7,681,120 103.50 691,991,133 286,026,559 978,017,693
2015 5,730,090 52.36 374,292,488 21,880,422 396,172,909 2016 4,860,462 46.13 207,787,586 39,387,808 247,175,394 TOTAL 33,926,344 2,887,847,331 566,034,313 3,453,881,645
Source: PIAC’s construct based on Ministry of Finance Data
8 Figures represent the average achieved prices of all liftings carried out during the year.
Jubilee Royalties, US$57.85m
(23%)
CAPI, US$149.94m
(61%)
Surface Rental, US$465,030
(0.19%)
CIT, US$29.55m
(12%)
Gas Sales, US$9.32m
(4%)
Interest on PHF, US$73,149
(0.03%)
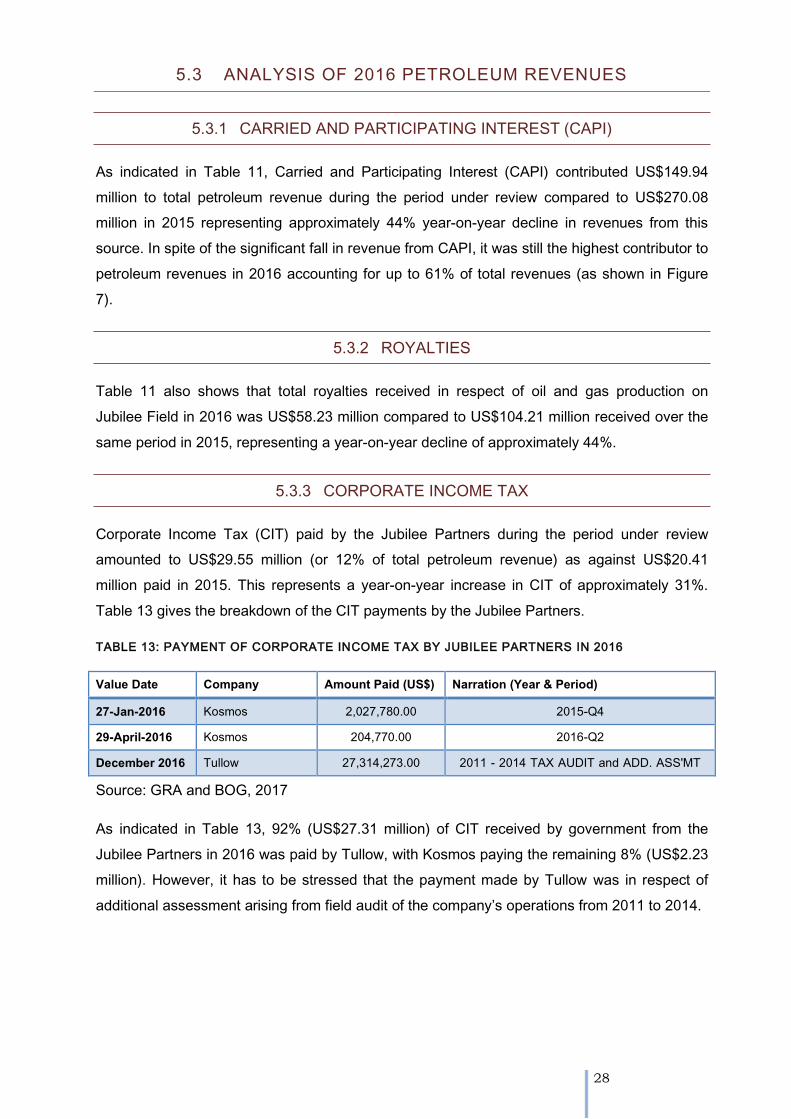
28
5.3 ANALYSIS OF 2016 PETROLEUM REVENUES
5.3.1 CARRIED AND PARTICIPATING INTEREST (CAPI)
As indicated in Table 11, Carried and Participating Interest (CAPI) contributed US$149.94
million to total petroleum revenue during the period under review compared to US$270.08
million in 2015 representing approximately 44% year-on-year decline in revenues from this
source. In spite of the significant fall in revenue from CAPI, it was still the highest contributor to
petroleum revenues in 2016 accounting for up to 61% of total revenues (as shown in Figure
7).
5.3.2 ROYALTIES
Table 11 also shows that total royalties received in respect of oil and gas production on
Jubilee Field in 2016 was US$58.23 million compared to US$104.21 million received over the
same period in 2015, representing a year-on-year decline of approximately 44%.
5.3.3 CORPORATE INCOME TAX
Corporate Income Tax (CIT) paid by the Jubilee Partners during the period under review
amounted to US$29.55 million (or 12% of total petroleum revenue) as against US$20.41
million paid in 2015. This represents a year-on-year increase in CIT of approximately 31%.
Table 13 gives the breakdown of the CIT payments by the Jubilee Partners.
TABLE 13: PAYMENT OF CORPORATE INCOME TAX BY JUBILEE PARTNERS IN 2016
Value Date Company Amount Paid (US$) Narration (Year & Period)
27-Jan-2016 Kosmos 2,027,780.00 2015-Q4 29-April-2016 Kosmos 204,770.00 2016-Q2 December 2016 Tullow 27,314,273.00 2011 - 2014 TAX AUDIT and ADD. ASS'MT
Source: GRA and BOG, 2017
As indicated in Table 13, 92% (US$27.31 million) of CIT received by government from the
Jubilee Partners in 2016 was paid by Tullow, with Kosmos paying the remaining 8% (US$2.23
million). However, it has to be stressed that the payment made by Tullow was in respect of
additional assessment arising from field audit of the company’s operations from 2011 to 2014.
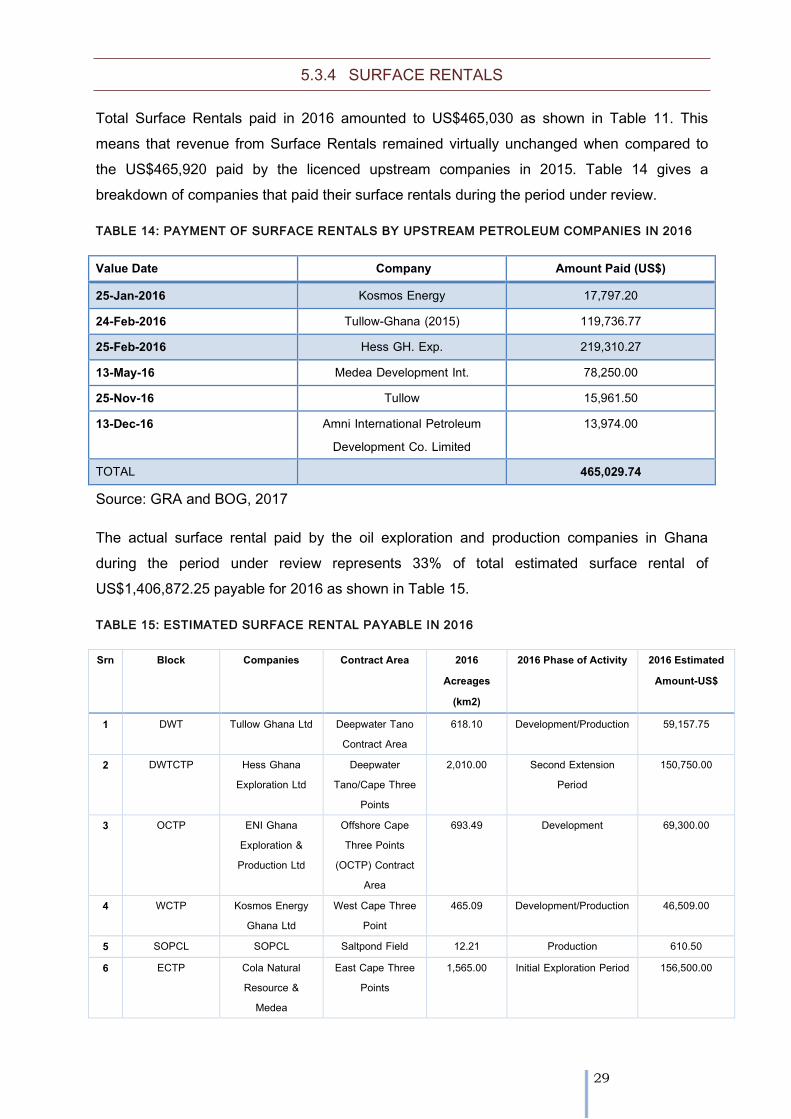
29
5.3.4 SURFACE RENTALS
Total Surface Rentals paid in 2016 amounted to US$465,030 as shown in Table 11. This
means that revenue from Surface Rentals remained virtually unchanged when compared to
the US$465,920 paid by the licenced upstream companies in 2015. Table 14 gives a
breakdown of companies that paid their surface rentals during the period under review.
TABLE 14: PAYMENT OF SURFACE RENTALS BY UPSTREAM PETROLEUM COMPANIES IN 2016
Value Date Company Amount Paid (US$)
25-Jan-2016 Kosmos Energy 17,797.20 24-Feb-2016 Tullow-Ghana (2015) 119,736.77 25-Feb-2016 Hess GH. Exp. 219,310.27 13-May-16 Medea Development Int. 78,250.00 25-Nov-16 Tullow 15,961.50 13-Dec-16 Amni International Petroleum
Development Co. Limited 13,974.00
TOTAL 465,029.74
Source: GRA and BOG, 2017
The actual surface rental paid by the oil exploration and production companies in Ghana
during the period under review represents 33% of total estimated surface rental of
US$1,406,872.25 payable for 2016 as shown in Table 15.
TABLE 15: ESTIMATED SURFACE RENTAL PAYABLE IN 2016
Srn Block Companies Contract Area 2016 Acreages
(km2)
2016 Phase of Activity 2016 Estimated Amount-US$
1 DWT Tullow Ghana Ltd Deepwater Tano Contract Area
618.10 Development/Production 59,157.75
2 DWTCTP Hess Ghana Exploration Ltd
Deepwater Tano/Cape Three
Points
2,010.00 Second Extension Period
150,750.00
3 OCTP ENI Ghana Exploration & Production Ltd
Offshore Cape Three Points
(OCTP) Contract Area
693.49 Development 69,300.00
4 WCTP Kosmos Energy Ghana Ltd
West Cape Three Point
465.09 Development/Production 46,509.00
5 SOPCL SOPCL Saltpond Field 12.21 Production 610.50 6 ECTP Cola Natural
Resource & Medea
East Cape Three Points
1,565.00 Initial Exploration Period 156,500.00

30
Development
7 SDWT AGM/GNPC Explorco (SDWT)
South Deep Water Tano
3,482.00 Initial Exploration Period 174,100.00
8 Shallow Water Tano'
Camac Energy Gh. Ltd
Shallow Water Tano
1,508.00 Initial Exploration Period 75,400.00
9 CENTRAL TANO Amni Ghana Central Tano 278.00 Initial Exploration Period 13,895.00
10 South-West Tano Heritage/Blue Star South West Tano Block
175.00 Initial Exploration Period 8,750.00
11 East Keta Heritage/Blue Star East Keta 2,239.00 Initial Exploration Period 111,950.00
12 SWCTP Sahara Energy Fields Ghana
Shallow Water Cape Three Points
Block
1,500.00 Initial Exploration Period 112,500.00
13 CTPW A-Z Petroleum Products Ltd
South-West Cape Three Points Block
944.00 Initial Exploration Period 47,200.00
14 West Saltpond Britannia -U South West Saltpond
2,050.00 Initial Exploration Period 102,500.00
15 CTPS UB Resources Ltd Cape Three Points South
755.00 Initial Exploration Period 37,750.00
16 CTP-BLOCK 4 Eni Ghana Exploration & Production Ltd
Cape Three points Block 4
1,127.00 Initial Exploration Period 56,350.00
17 Onshore/Offshore Keta
Swiss African Oil Company Limited
Onshore/Offshore Keta Delta Block
3,000.00 Initial Exploration Period 150,000.00
18 WCTP- BLOCK 2 Springfield Exploration and Production Ltd
West Cape Three Points Block 2
673.00 Initial Exploration Period 33,650.00
Total 23,094.89 1,406,872.25
Petroleum Commission, 2016
The fact that only 5 companies paid surface rental in 2016 means that there are potentially 10-
12 other companies who did not pay surface rental during the period under review.
5.3.5 GAS REVENUE
As indicated in Table 5, a total of 21,579.60 MMscf (22,874,723.61 MMBtu) of raw gas was
exported to the Atuabo Gas Processing Plant in 2016. At an agreed gas price of
US$2.9/MMBtu, total sale of raw gas to GNGC in 2016 amounted to US$66.34 million as
shown in Table 16.
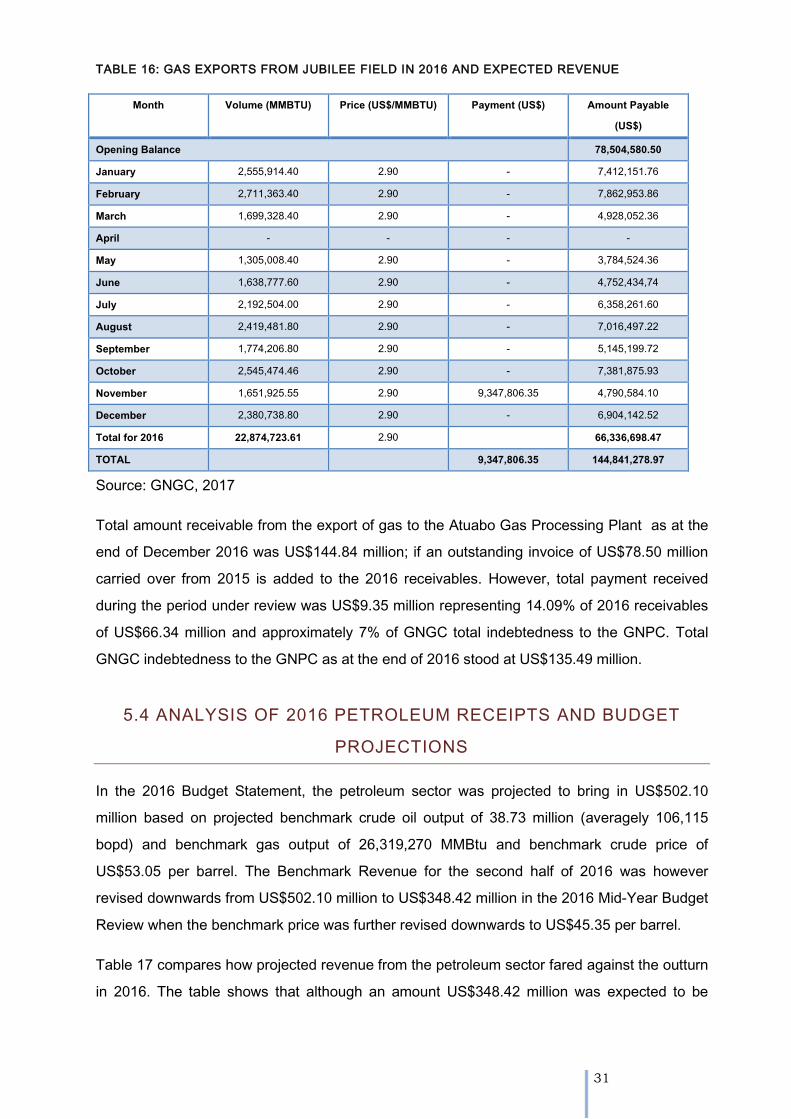
31
TABLE 16: GAS EXPORTS FROM JUBILEE FIELD IN 2016 AND EXPECTED REVENUE
Month Volume (MMBTU) Price (US$/MMBTU) Payment (US$) Amount Payable (US$)
Opening Balance 78,504,580.50 January 2,555,914.40 2.90 - 7,412,151.76 February 2,711,363.40 2.90 - 7,862,953.86 March 1,699,328.40 2.90 - 4,928,052.36 April - - - - May 1,305,008.40 2.90 - 3,784,524.36 June 1,638,777.60 2.90 - 4,752,434,74 July 2,192,504.00 2.90 - 6,358,261.60 August 2,419,481.80 2.90 - 7,016,497.22 September 1,774,206.80 2.90 - 5,145,199.72 October 2,545,474.46 2.90 - 7,381,875.93 November 1,651,925.55 2.90 9,347,806.35 4,790,584.10 December 2,380,738.80 2.90 - 6,904,142.52 Total for 2016 22,874,723.61 2.90 66,336,698.47 TOTAL 9,347,806.35 144,841,278.97
Source: GNGC, 2017
Total amount receivable from the export of gas to the Atuabo Gas Processing Plant as at the
end of December 2016 was US$144.84 million; if an outstanding invoice of US$78.50 million
carried over from 2015 is added to the 2016 receivables. However, total payment received
during the period under review was US$9.35 million representing 14.09% of 2016 receivables
of US$66.34 million and approximately 7% of GNGC total indebtedness to the GNPC. Total
GNGC indebtedness to the GNPC as at the end of 2016 stood at US$135.49 million.
5.4 ANALYSIS OF 2016 PETROLEUM RECEIPTS AND BUDGET
PROJECTIONS
In the 2016 Budget Statement, the petroleum sector was projected to bring in US$502.10
million based on projected benchmark crude oil output of 38.73 million (averagely 106,115
bopd) and benchmark gas output of 26,319,270 MMBtu and benchmark crude price of
US$53.05 per barrel. The Benchmark Revenue for the second half of 2016 was however
revised downwards from US$502.10 million to US$348.42 million in the 2016 Mid-Year Budget
Review when the benchmark price was further revised downwards to US$45.35 per barrel.
Table 17 compares how projected revenue from the petroleum sector fared against the outturn
in 2016. The table shows that although an amount US$348.42 million was expected to be
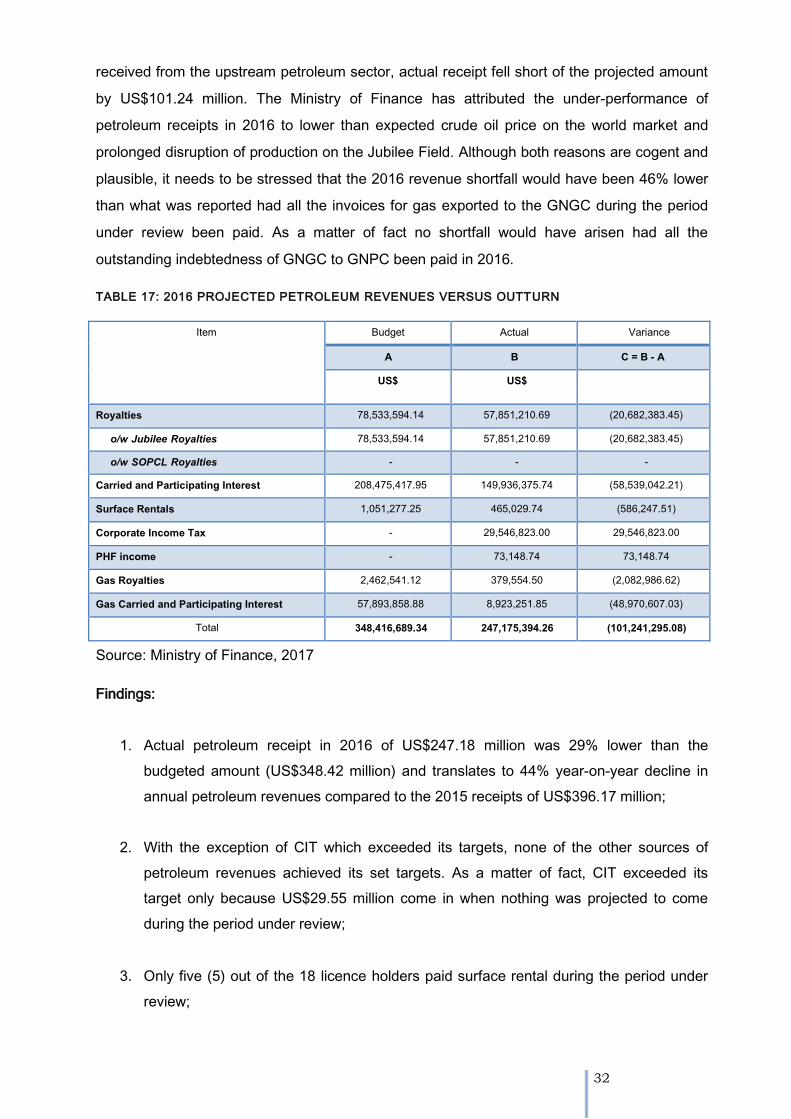
32
received from the upstream petroleum sector, actual receipt fell short of the projected amount
by US$101.24 million. The Ministry of Finance has attributed the under-performance of
petroleum receipts in 2016 to lower than expected crude oil price on the world market and
prolonged disruption of production on the Jubilee Field. Although both reasons are cogent and
plausible, it needs to be stressed that the 2016 revenue shortfall would have been 46% lower
than what was reported had all the invoices for gas exported to the GNGC during the period
under review been paid. As a matter of fact no shortfall would have arisen had all the
outstanding indebtedness of GNGC to GNPC been paid in 2016.
TABLE 17: 2016 PROJECTED PETROLEUM REVENUES VERSUS OUTTURN
Item Budget Actual Variance
A B C = B - A
US$ US$
Royalties 78,533,594.14 57,851,210.69 (20,682,383.45)
o/w Jubilee Royalties 78,533,594.14 57,851,210.69 (20,682,383.45)
o/w SOPCL Royalties - - -
Carried and Participating Interest 208,475,417.95 149,936,375.74 (58,539,042.21)
Surface Rentals 1,051,277.25 465,029.74 (586,247.51)
Corporate Income Tax - 29,546,823.00 29,546,823.00
PHF income - 73,148.74 73,148.74
Gas Royalties 2,462,541.12 379,554.50 (2,082,986.62)
Gas Carried and Participating Interest 57,893,858.88 8,923,251.85 (48,970,607.03)
Total 348,416,689.34 247,175,394.26 (101,241,295.08)
Source: Ministry of Finance, 2017
Findings:
1. Actual petroleum receipt in 2016 of US$247.18 million was 29% lower than the
budgeted amount (US$348.42 million) and translates to 44% year-on-year decline in
annual petroleum revenues compared to the 2015 receipts of US$396.17 million;
2. With the exception of CIT which exceeded its targets, none of the other sources of
petroleum revenues achieved its set targets. As a matter of fact, CIT exceeded its
target only because US$29.55 million come in when nothing was projected to come
during the period under review;
3. Only five (5) out of the 18 licence holders paid surface rental during the period under
review;
33
4. Ninety-two percent (US$27.31 million) of total CIT received in 2016 was in respect of
tax liabilities that Tullow ought to have paid over the period 2011-2014;
5. Only US$9.35 million (14.09%) out of total receivables of US$56.79 million from the
sale of raw gas was paid by the off-taker – GNGC – in 2016; and,
6. Payment of the outstanding receivables for 2016 would have reduced the revenue
shortfall of US$101.24 million by 46% while the shortfall would not have arisen had the
total outstanding indebtedness of GNGC of US$135.49 million been honoured during
the period under review.
34
SECTION 6
6.0 ALLOCATION AND UTILISATION OF 2016 PETROLEUM
REVENUE
6.1 INTRODUCTION
The formula and modalities for allocating Ghana’s petroleum revenue are enshrined in the
PRMA, Act 815 as amended by Act 893. In 2011, the Parliament of Ghana approved an
allocation of 40% of the Carried and Participating Interest (CAPI), net of Equity Financing
Costs (EFC), for GNPC. The GNPC’s share (of the CAPI, net of EFC) was reduced to 30% for
the period 2014-2016 in November 2013 following a proposal made by the Minister of Finance
to Parliament as part of the 2014 Budget Statement in line with Section 7(3b) of the PRMA.
Thus, Government net revenue from petroleum is made up of the remaining 70% of Carried
and Participating Interest, Corporate Income Tax, Royalties and Surface Rental. The PRMA
stipulates that no more than 70% of Government’s share of petroleum revenue for each
financial year should be earmarked as the Annual Budget Funding Amount (ABFA), when the
ABFA quarterly allocation is fully met. The remaining 30% (which is technically the excess
amount) is then transferred to the Ghana Petroleum Funds (GPFs) in accordance with
Sections 18 and 23 of the PRMA. The PRMA further stipulates that no less than 30% of the
amount transferred into the GPFs should be lodged into the Ghana Heritage Fund (GHF), with
the rest going into the Ghana Stabilisation Fund (GSF). This means that the GPFs received
funds only after the net petroleum receipts have exceeded the quarterly ABFA under Act
815.
However, the Petroleum Revenue Management (Amendment) Act, 2015 (Act 893),
stipulates that the net petroleum receipts to the State in every financial year should be
split between the ABFA and GPFs, regardless of the amount, with no less than 30% going
to the GPFs and the remainder designated as ABFA. This effectively guarantees a constant
transfer into the GPFs for all petroleum receipts, net of the allocation to the National Oil
Company (NOC). The allocation of the actual 2016 petroleum revenue was based on the
PRMA, as amended (Act 893).
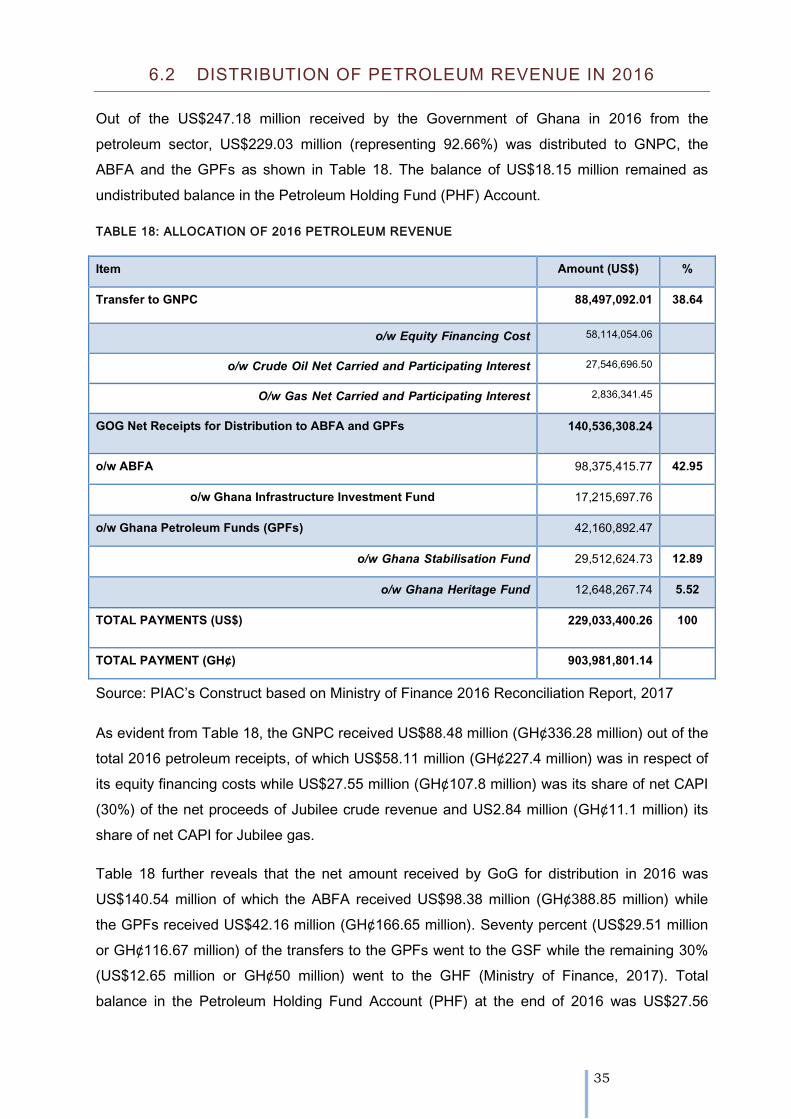
35
6.2 DISTRIBUTION OF PETROLEUM REVENUE IN 2016
Out of the US$247.18 million received by the Government of Ghana in 2016 from the
petroleum sector, US$229.03 million (representing 92.66%) was distributed to GNPC, the
ABFA and the GPFs as shown in Table 18. The balance of US$18.15 million remained as
undistributed balance in the Petroleum Holding Fund (PHF) Account.
TABLE 18: ALLOCATION OF 2016 PETROLEUM REVENUE
Item Amount (US$) %
Transfer to GNPC 88,497,092.01 38.64
o/w Equity Financing Cost 58,114,054.06
o/w Crude Oil Net Carried and Participating Interest 27,546,696.50
O/w Gas Net Carried and Participating Interest 2,836,341.45
GOG Net Receipts for Distribution to ABFA and GPFs 140,536,308.24
o/w ABFA 98,375,415.77 42.95
o/w Ghana Infrastructure Investment Fund 17,215,697.76
o/w Ghana Petroleum Funds (GPFs) 42,160,892.47
o/w Ghana Stabilisation Fund 29,512,624.73 12.89
o/w Ghana Heritage Fund 12,648,267.74 5.52
TOTAL PAYMENTS (US$) 229,033,400.26 100
TOTAL PAYMENT (GH¢) 903,981,801.14
Source: PIAC’s Construct based on Ministry of Finance 2016 Reconciliation Report, 2017
As evident from Table 18, the GNPC received US$88.48 million (GH¢336.28 million) out of the
total 2016 petroleum receipts, of which US$58.11 million (GH¢227.4 million) was in respect of
its equity financing costs while US$27.55 million (GH¢107.8 million) was its share of net CAPI
(30%) of the net proceeds of Jubilee crude revenue and US2.84 million (GH¢11.1 million) its
share of net CAPI for Jubilee gas.
Table 18 further reveals that the net amount received by GoG for distribution in 2016 was
US$140.54 million of which the ABFA received US$98.38 million (GH¢388.85 million) while
the GPFs received US$42.16 million (GH¢166.65 million). Seventy percent (US$29.51 million
or GH¢116.67 million) of the transfers to the GPFs went to the GSF while the remaining 30%
(US$12.65 million or GH¢50 million) went to the GHF (Ministry of Finance, 2017). Total
balance in the Petroleum Holding Fund Account (PHF) at the end of 2016 was US$27.56
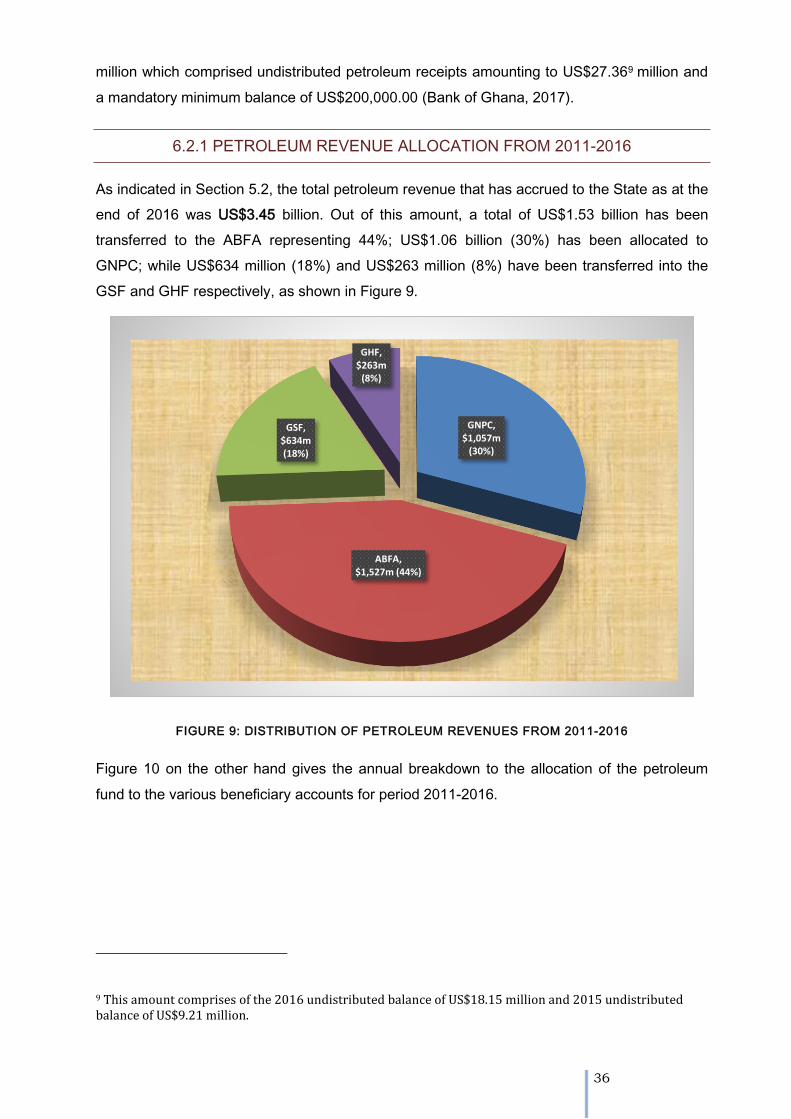
36
million which comprised undistributed petroleum receipts amounting to US$27.369 million and
a mandatory minimum balance of US$200,000.00 (Bank of Ghana, 2017).
6.2.1 PETROLEUM REVENUE ALLOCATION FROM 2011-2016
As indicated in Section 5.2, the total petroleum revenue that has accrued to the State as at the
end of 2016 was US$3.45 billion. Out of this amount, a total of US$1.53 billion has been
transferred to the ABFA representing 44%; US$1.06 billion (30%) has been allocated to
GNPC; while US$634 million (18%) and US$263 million (8%) have been transferred into the
GSF and GHF respectively, as shown in Figure 9.
FIGURE 9: DISTRIBUTION OF PETROLEUM REVENUES FROM 2011-2016
Figure 10 on the other hand gives the annual breakdown to the allocation of the petroleum
fund to the various beneficiary accounts for period 2011-2016.
9 This amount comprises of the 2016 undistributed balance of US$18.15 million and 2015 undistributed balance of US$9.21 million.
GNPC, $1,057m
(30%)
ABFA, $1,527m (44%)
GSF, $634m (18%)
GHF, $263m
(8%)
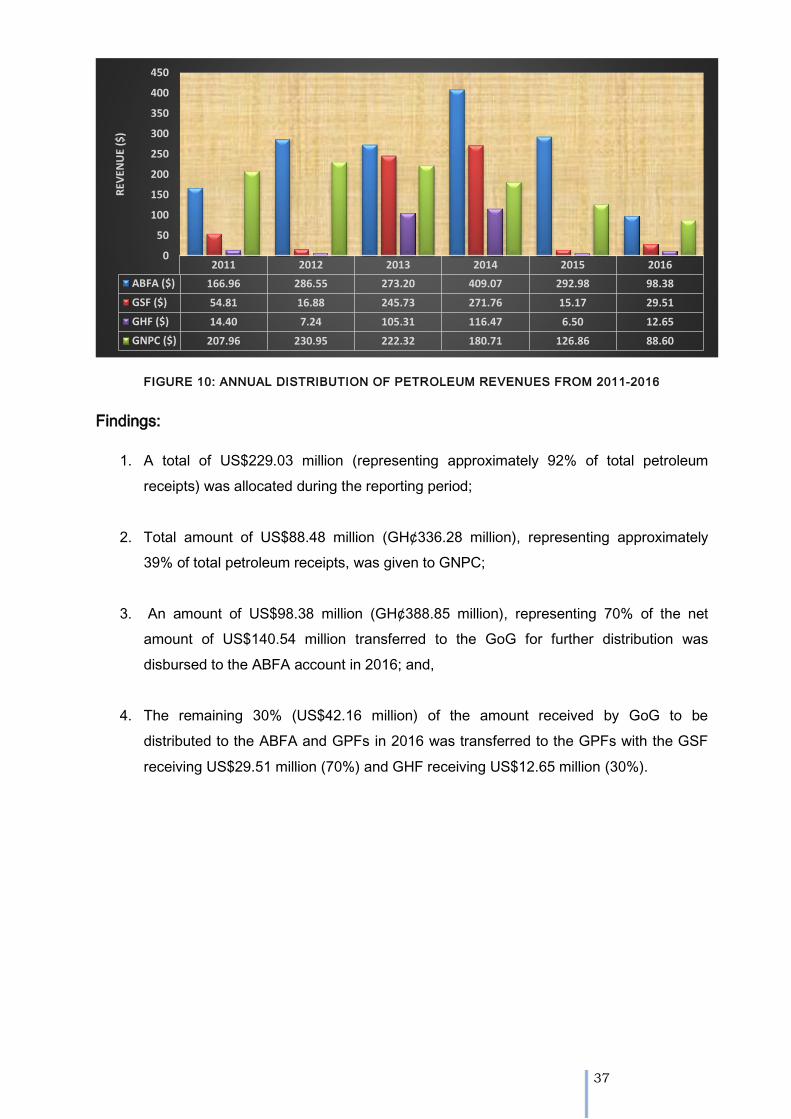
37
FIGURE 10: ANNUAL DISTRIBUTION OF PETROLEUM REVENUES FROM 2011-2016
Findings:
1. A total of US$229.03 million (representing approximately 92% of total petroleum
receipts) was allocated during the reporting period;
2. Total amount of US$88.48 million (GH¢336.28 million), representing approximately
39% of total petroleum receipts, was given to GNPC;
3. An amount of US$98.38 million (GH¢388.85 million), representing 70% of the net
amount of US$140.54 million transferred to the GoG for further distribution was
disbursed to the ABFA account in 2016; and,
4. The remaining 30% (US$42.16 million) of the amount received by GoG to be
distributed to the ABFA and GPFs in 2016 was transferred to the GPFs with the GSF
receiving US$29.51 million (70%) and GHF receiving US$12.65 million (30%).
2011 2012 2013 2014 2015 2016
ABFA ($) 166.96 286.55 273.20 409.07 292.98 98.38
GSF ($) 54.81 16.88 245.73 271.76 15.17 29.51
GHF ($) 14.40 7.24 105.31 116.47 6.50 12.65
GNPC ($) 207.96 230.95 222.32 180.71 126.86 88.60
0
50
100
150
200
250
300
350
400
450
REV
ENU
E ($
)

38
6.3 DISTRIBUTION OF 2016 ABFA ALLOCATION
6.3.1 INTRODUCTION
Section 21(5) of the PRMA enjoins the Minister of Finance to prioritise not more than four
areas to benefit from the use of the ABFA, in the absence of a long term national development
plan, with the view of maximising the development impact of petroleum revenues. Section
21(6) further mandates the initial prioritisation to remain in force for a minimum of three (3)
years before it may be subject to review. Accordingly, the Minister of Finance in the 2011
Budget Review proposed to Parliament that the ABFA should be used for the following four (4)
priority areas for the period 2011- 2013.
Expenditure and Amortisation of Loans for Oil and Gas Infrastructure;
Agriculture Modernisation;
Roads and Other Infrastructure; and,
Capacity Building (including Oil and Gas).
The four priority areas received Parliamentary approval and were allocated ABFA funding for
three years (2011-2013). The same priority areas were proposed by the Minister in November
2013 and approved by Parliament to benefit from ABFA support for the period 2014-2016. Just
like the previous five years, the 2016 ABFA was allocated to the same priority areas.
6.3.2 DISBURSEMENT OF 2016 ABFA ALLOCATION
As indicated in Section 6.1.1, a total amount of GH¢388.85 million (US$98.38 million) was
transferred to the ABFA account during the period under review compared to GH¢1.09 billion
(US$292.98 million) allocated to the ABFA account in 2015. The disbursement of the ABFA
allocations is as shown in Table 19.
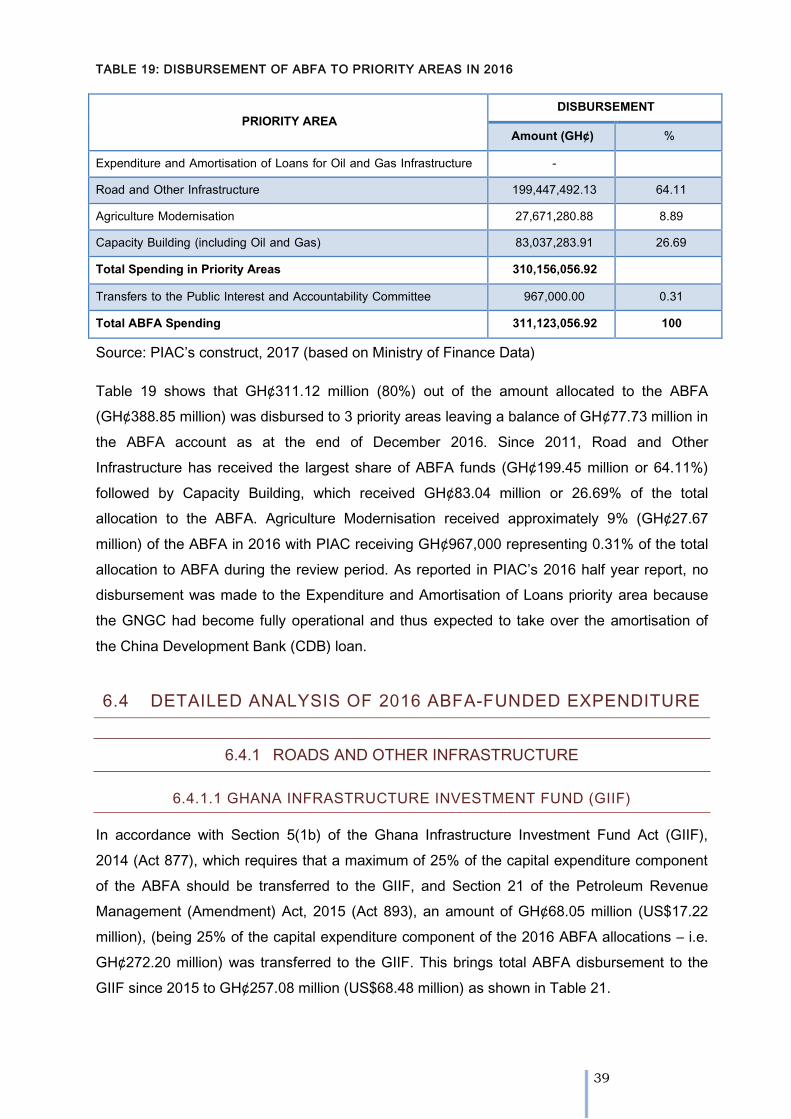
39
TABLE 19: DISBURSEMENT OF ABFA TO PRIORITY AREAS IN 2016
PRIORITY AREA DISBURSEMENT
Amount (GH¢) %
Expenditure and Amortisation of Loans for Oil and Gas Infrastructure -
Road and Other Infrastructure 199,447,492.13 64.11
Agriculture Modernisation 27,671,280.88 8.89 Capacity Building (including Oil and Gas) 83,037,283.91 26.69
Total Spending in Priority Areas 310,156,056.92
Transfers to the Public Interest and Accountability Committee 967,000.00 0.31
Total ABFA Spending 311,123,056.92 100
Source: PIAC’s construct, 2017 (based on Ministry of Finance Data)
Table 19 shows that GH¢311.12 million (80%) out of the amount allocated to the ABFA
(GH¢388.85 million) was disbursed to 3 priority areas leaving a balance of GH¢77.73 million in
the ABFA account as at the end of December 2016. Since 2011, Road and Other
Infrastructure has received the largest share of ABFA funds (GH¢199.45 million or 64.11%)
followed by Capacity Building, which received GH¢83.04 million or 26.69% of the total
allocation to the ABFA. Agriculture Modernisation received approximately 9% (GH¢27.67
million) of the ABFA in 2016 with PIAC receiving GH¢967,000 representing 0.31% of the total
allocation to ABFA during the review period. As reported in PIAC’s 2016 half year report, no
disbursement was made to the Expenditure and Amortisation of Loans priority area because
the GNGC had become fully operational and thus expected to take over the amortisation of
the China Development Bank (CDB) loan.
6.4 DETAILED ANALYSIS OF 2016 ABFA-FUNDED EXPENDITURE
6.4.1 ROADS AND OTHER INFRASTRUCTURE
6.4.1.1 GHANA INFRASTRUCTURE INVESTMENT FUND (GIIF)
In accordance with Section 5(1b) of the Ghana Infrastructure Investment Fund Act (GIIF),
2014 (Act 877), which requires that a maximum of 25% of the capital expenditure component
of the ABFA should be transferred to the GIIF, and Section 21 of the Petroleum Revenue
Management (Amendment) Act, 2015 (Act 893), an amount of GH¢68.05 million (US$17.22
million), (being 25% of the capital expenditure component of the 2016 ABFA allocations – i.e.
GH¢272.20 million) was transferred to the GIIF. This brings total ABFA disbursement to the
GIIF since 2015 to GH¢257.08 million (US$68.48 million) as shown in Table 21.
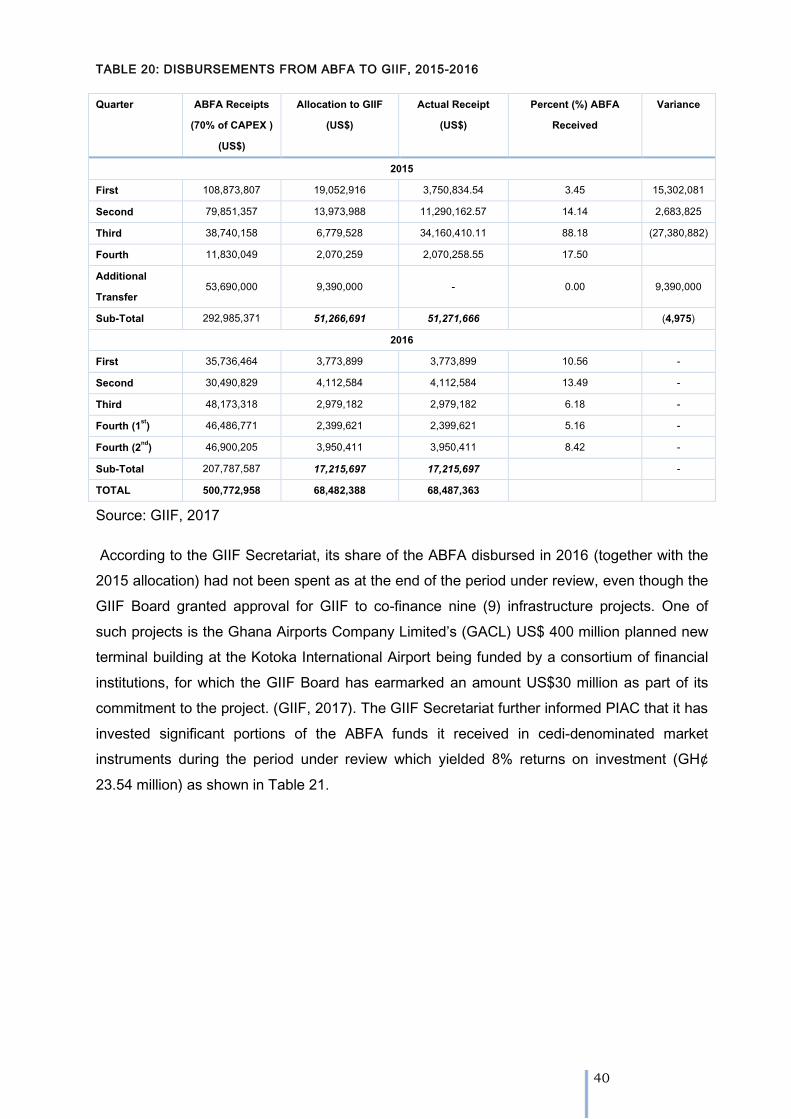
40
TABLE 20: DISBURSEMENTS FROM ABFA TO GIIF, 2015-2016
Quarter ABFA Receipts (70% of CAPEX )
(US$)
Allocation to GIIF (US$)
Actual Receipt (US$)
Percent (%) ABFA Received
Variance
2015 First 108,873,807 19,052,916 3,750,834.54 3.45 15,302,081 Second 79,851,357 13,973,988 11,290,162.57 14.14 2,683,825 Third 38,740,158 6,779,528 34,160,410.11 88.18 (27,380,882) Fourth 11,830,049 2,070,259 2,070,258.55 17.50 Additional Transfer
53,690,000 9,390,000 - 0.00 9,390,000
Sub-Total 292,985,371 51,266,691 51,271,666 (4,975) 2016
First 35,736,464 3,773,899 3,773,899 10.56 - Second 30,490,829 4,112,584 4,112,584 13.49 - Third 48,173,318 2,979,182 2,979,182 6.18 - Fourth (1st) 46,486,771 2,399,621 2,399,621 5.16 - Fourth (2nd) 46,900,205 3,950,411 3,950,411 8.42 - Sub-Total 207,787,587 17,215,697 17,215,697 - TOTAL 500,772,958 68,482,388 68,487,363
Source: GIIF, 2017
According to the GIIF Secretariat, its share of the ABFA disbursed in 2016 (together with the
2015 allocation) had not been spent as at the end of the period under review, even though the
GIIF Board granted approval for GIIF to co-finance nine (9) infrastructure projects. One of
such projects is the Ghana Airports Company Limited’s (GACL) US$ 400 million planned new
terminal building at the Kotoka International Airport being funded by a consortium of financial
institutions, for which the GIIF Board has earmarked an amount US$30 million as part of its
commitment to the project. (GIIF, 2017). The GIIF Secretariat further informed PIAC that it has
invested significant portions of the ABFA funds it received in cedi-denominated market
instruments during the period under review which yielded 8% returns on investment (GH¢
23.54 million) as shown in Table 21.
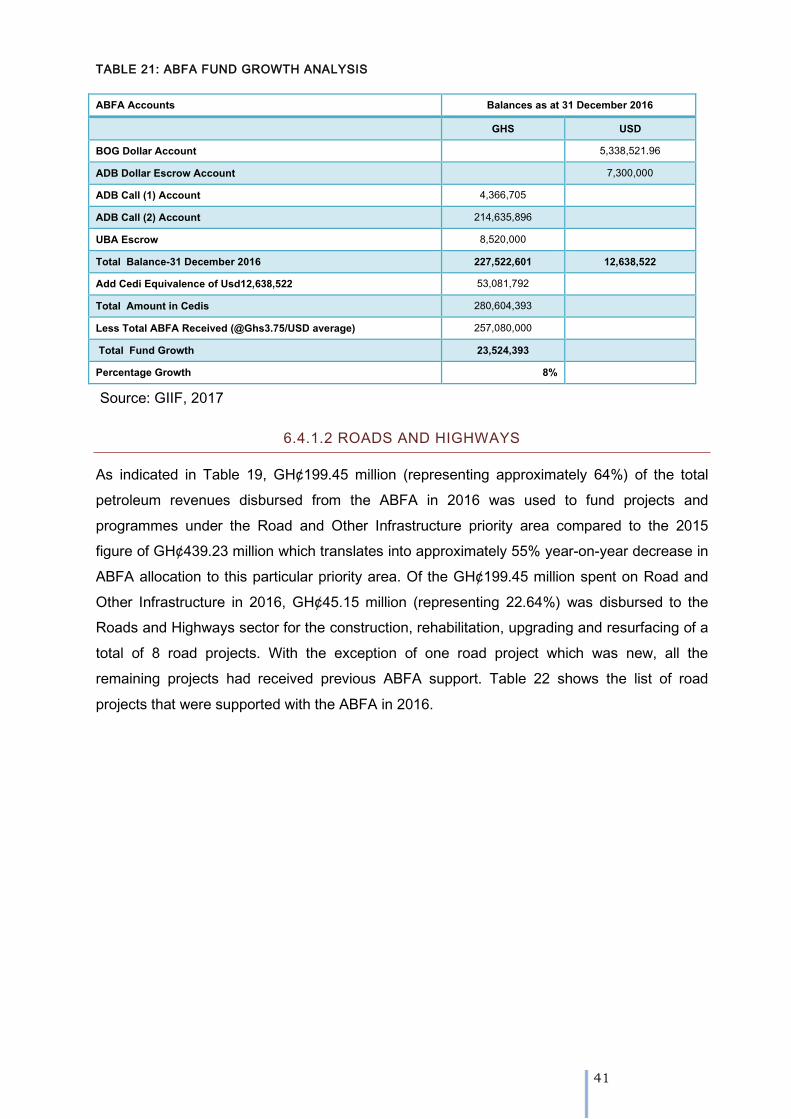
41
TABLE 21: ABFA FUND GROWTH ANALYSIS
ABFA Accounts Balances as at 31 December 2016
GHS USD BOG Dollar Account 5,338,521.96 ADB Dollar Escrow Account 7,300,000 ADB Call (1) Account 4,366,705 ADB Call (2) Account 214,635,896 UBA Escrow 8,520,000 Total Balance-31 December 2016 227,522,601 12,638,522 Add Cedi Equivalence of Usd12,638,522 53,081,792 Total Amount in Cedis 280,604,393
Less Total ABFA Received (@Ghs3.75/USD average) 257,080,000 Total Fund Growth 23,524,393 Percentage Growth 8%
Source: GIIF, 2017
6.4.1.2 ROADS AND HIGHWAYS
As indicated in Table 19, GH¢199.45 million (representing approximately 64%) of the total
petroleum revenues disbursed from the ABFA in 2016 was used to fund projects and
programmes under the Road and Other Infrastructure priority area compared to the 2015
figure of GH¢439.23 million which translates into approximately 55% year-on-year decrease in
ABFA allocation to this particular priority area. Of the GH¢199.45 million spent on Road and
Other Infrastructure in 2016, GH¢45.15 million (representing 22.64%) was disbursed to the
Roads and Highways sector for the construction, rehabilitation, upgrading and resurfacing of a
total of 8 road projects. With the exception of one road project which was new, all the
remaining projects had received previous ABFA support. Table 22 shows the list of road
projects that were supported with the ABFA in 2016.

42
TABLE 22: LIST OF ROAD PROJECTS SUPPORTED BY ABFA IN 2016
NAME OF ROAD PROJECT AMOUNT IN 2016
(GH¢)
NO OF YEARS SUPPORTED
TOTAL SUPPORT RECEIVED (2011-
2016)
REHABILITATION OF OLD ADA AND LIGHT INDUSTRIAL AREA ROADS
8,473,781.07 3 20,224,807.44
PARTIAL RECONSTRUCTION OF TROM SOMANYA ODUMASE KPONG ROAD AS AN ADDENDUM TO UPGRADING OF GOLOKWATI WLI HOHOE ROAD
5,002,380.77 2 13,078,301.47
CONSTRUCTION OF TWIFO PRASO DUNKWA ROAD 3,388,341.50 3 6,030,295.97
UPGRADING OF HO ADIDOME ROAD 2,785,326.08 5 21,811,776.19
CONSTRUCTION OF ROADS AND OTHER INFRASTRUCTURAL AMENITIES FOR THE UNIVRSITY OF HEALTH AND ALLIED SCIENCES AT SOKODE LOKOE NEAR HO
2,264,932.85 2 3,447,109.85
BITUMEN SURFACING OF TADZEVU-DEVEGO-AGORVE JUNCTION FEEDER ROAD
10,710,586.31 1 10,710,586.31
EMERGENCY ASPHALTIC OVERLAY OF ARTERIAL AND COLLECTOR ROADS IN TEMA, NINGO PRAMPRAM, TESHIE NUNGUA AND LA AREAS
9,287,340.36 2 30,845,704.48
CONSTRUCTION OF EASTERN CORRIDOR ROADS 6,238,602.00 2 9,610,369.14
TOTAL 48,151,290.94 115,758,950.85
PIAC’s Construct based on MoF’s Data, 2013-2016
6.4.1.3 OTHER INFRASTRUCTURE PROJECTS
The remaining GH¢ 131.40 million of the 2016 allocations to the ‘Roads and Other
Infrastructure’ priority area was spent on projects in energy (GH¢43.46 million), water
(GH¢23.48 million), Communication (GH¢14.31 million) and transport sectors (GH¢2 million).
The entire disbursement to the energy sector went into the procurement of equipment and
materials for the National Electrification Scheme while the allocation to the water sector was
used to fund 3 on-going coastal protection projects in the Western and Volta Regions. The
disbursement to the communication sector was released as matching fund in respect of the
China Development Bank (CDB) matching fund requirements for the provision of ICT
infrastructure under the CDB Master Facility while the GH¢2.0 million was utilised for the
redevelopment and construction of railway infrastructure in the Western Region. Figure 11
gives a breakdown of the ABFA disbursement to the Road and Other Infrastructure priority
area in 2016.
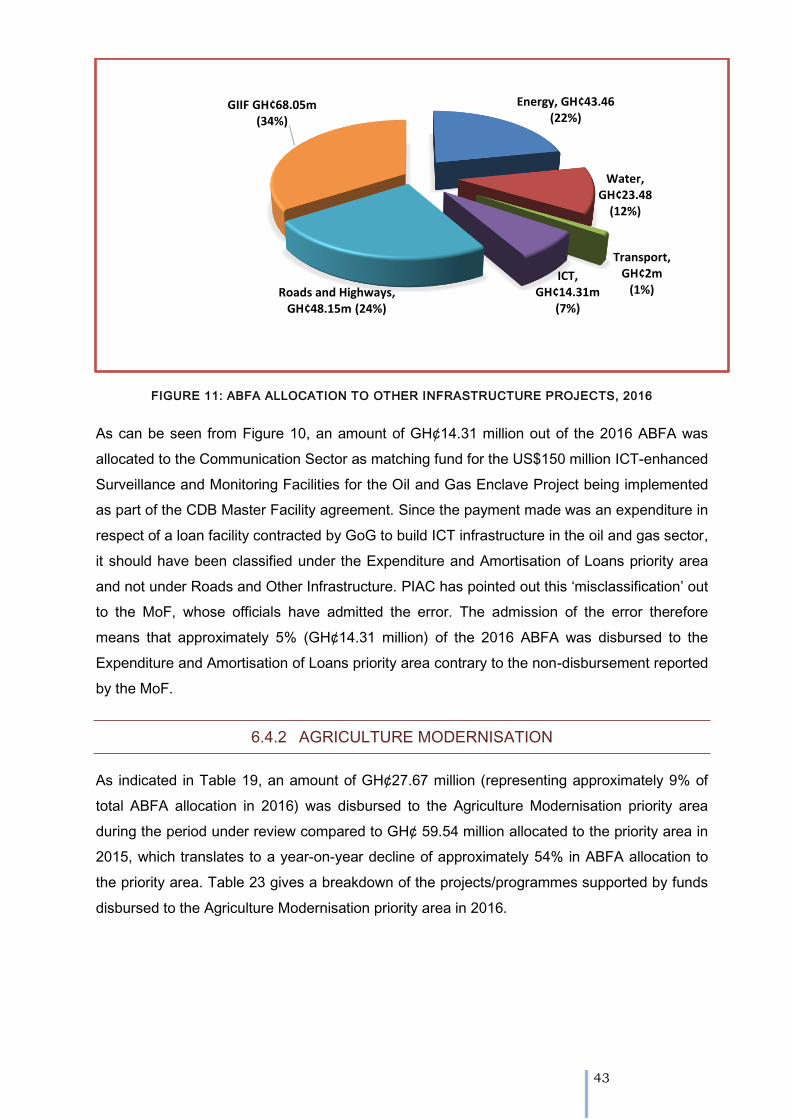
43
FIGURE 11: ABFA ALLOCATION TO OTHER INFRASTRUCTURE PROJECTS, 2016
As can be seen from Figure 10, an amount of GH¢14.31 million out of the 2016 ABFA was
allocated to the Communication Sector as matching fund for the US$150 million ICT-enhanced
Surveillance and Monitoring Facilities for the Oil and Gas Enclave Project being implemented
as part of the CDB Master Facility agreement. Since the payment made was an expenditure in
respect of a loan facility contracted by GoG to build ICT infrastructure in the oil and gas sector,
it should have been classified under the Expenditure and Amortisation of Loans priority area
and not under Roads and Other Infrastructure. PIAC has pointed out this ‘misclassification’ out
to the MoF, whose officials have admitted the error. The admission of the error therefore
means that approximately 5% (GH¢14.31 million) of the 2016 ABFA was disbursed to the
Expenditure and Amortisation of Loans priority area contrary to the non-disbursement reported
by the MoF.
6.4.2 AGRICULTURE MODERNISATION
As indicated in Table 19, an amount of GH¢27.67 million (representing approximately 9% of
total ABFA allocation in 2016) was disbursed to the Agriculture Modernisation priority area
during the period under review compared to GH¢ 59.54 million allocated to the priority area in
2015, which translates to a year-on-year decline of approximately 54% in ABFA allocation to
the priority area. Table 23 gives a breakdown of the projects/programmes supported by funds
disbursed to the Agriculture Modernisation priority area in 2016.
Energy, GH¢43.46(22%)
Water, GH¢23.48
(12%)
Transport, GH¢2m
(1%)ICT,
GH¢14.31m (7%)
Roads and Highways, GH¢48.15m (24%)
GIIF GH¢68.05m (34%)
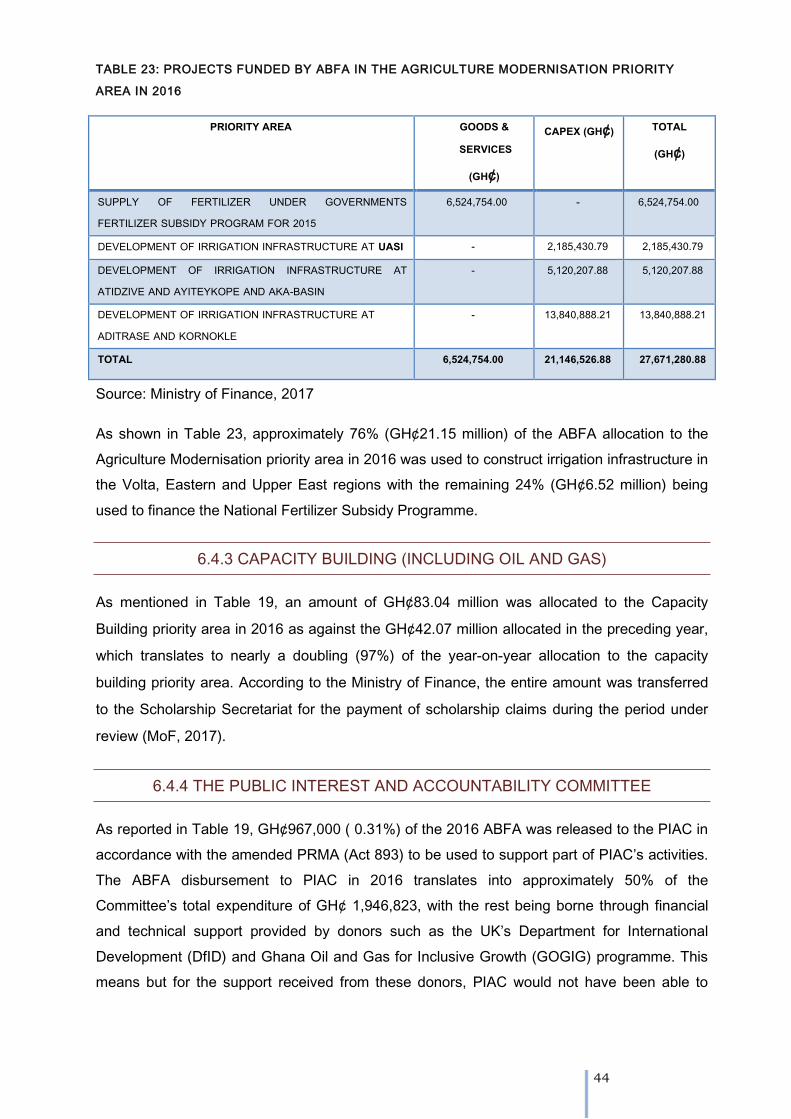
44
TABLE 23: PROJECTS FUNDED BY ABFA IN THE AGRICULTURE MODERNISATION PRIORITY
AREA IN 2016
PRIORITY AREA GOODS & SERVICES
(GH¢)
CAPEX (GH¢) TOTAL
(GH¢)
SUPPLY OF FERTILIZER UNDER GOVERNMENTS FERTILIZER SUBSIDY PROGRAM FOR 2015
6,524,754.00 - 6,524,754.00
DEVELOPMENT OF IRRIGATION INFRASTRUCTURE AT UASI - 2,185,430.79 2,185,430.79
DEVELOPMENT OF IRRIGATION INFRASTRUCTURE AT ATIDZIVE AND AYITEYKOPE AND AKA-BASIN
- 5,120,207.88 5,120,207.88
DEVELOPMENT OF IRRIGATION INFRASTRUCTURE AT ADITRASE AND KORNOKLE
- 13,840,888.21 13,840,888.21
TOTAL 6,524,754.00 21,146,526.88 27,671,280.88
Source: Ministry of Finance, 2017
As shown in Table 23, approximately 76% (GH¢21.15 million) of the ABFA allocation to the
Agriculture Modernisation priority area in 2016 was used to construct irrigation infrastructure in
the Volta, Eastern and Upper East regions with the remaining 24% (GH¢6.52 million) being
used to finance the National Fertilizer Subsidy Programme.
6.4.3 CAPACITY BUILDING (INCLUDING OIL AND GAS)
As mentioned in Table 19, an amount of GH¢83.04 million was allocated to the Capacity
Building priority area in 2016 as against the GH¢42.07 million allocated in the preceding year,
which translates to nearly a doubling (97%) of the year-on-year allocation to the capacity
building priority area. According to the Ministry of Finance, the entire amount was transferred
to the Scholarship Secretariat for the payment of scholarship claims during the period under
review (MoF, 2017).
6.4.4 THE PUBLIC INTEREST AND ACCOUNTABILITY COMMITTEE
As reported in Table 19, GH¢967,000 ( 0.31%) of the 2016 ABFA was released to the PIAC in
accordance with the amended PRMA (Act 893) to be used to support part of PIAC’s activities.
The ABFA disbursement to PIAC in 2016 translates into approximately 50% of the
Committee’s total expenditure of GH¢ 1,946,823, with the rest being borne through financial
and technical support provided by donors such as the UK’s Department for International
Development (DfID) and Ghana Oil and Gas for Inclusive Growth (GOGIG) programme. This
means but for the support received from these donors, PIAC would not have been able to
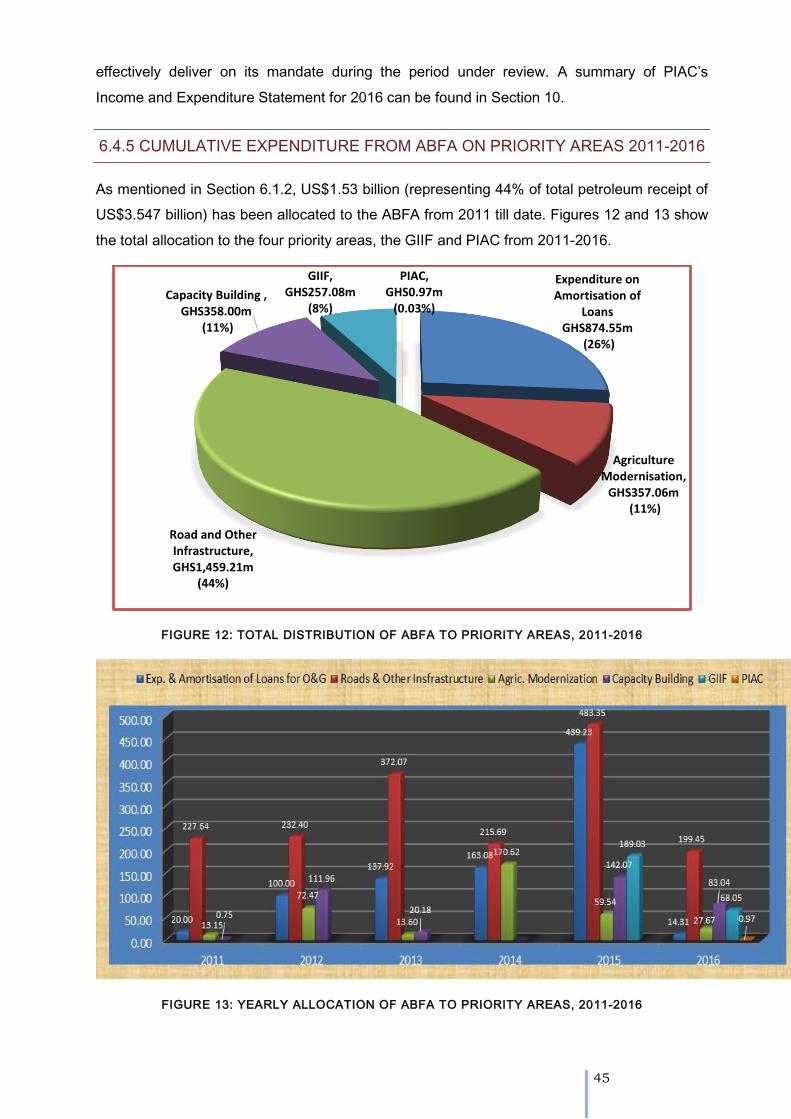
45
effectively deliver on its mandate during the period under review. A summary of PIAC’s
Income and Expenditure Statement for 2016 can be found in Section 10.
6.4.5 CUMULATIVE EXPENDITURE FROM ABFA ON PRIORITY AREAS 2011-2016
As mentioned in Section 6.1.2, US$1.53 billion (representing 44% of total petroleum receipt of
US$3.547 billion) has been allocated to the ABFA from 2011 till date. Figures 12 and 13 show
the total allocation to the four priority areas, the GIIF and PIAC from 2011-2016.
FIGURE 12: TOTAL DISTRIBUTION OF ABFA TO PRIORITY AREAS, 2011-2016
FIGURE 13: YEARLY ALLOCATION OF ABFA TO PRIORITY AREAS, 2011-2016
Expenditure on Amortisation of
Loans GHS874.55m
(26%)
Agriculture Modernisation,
GHS357.06m(11%)
Road and Other Infrastructure, GHS1,459.21m
(44%)
Capacity Building , GHS358.00m
(11%)
GIIF, GHS257.08m
(8%)
PIAC, GHS0.97m
(0.03%)

46
Figure 12 indicates that 44% of the ABFA disbursements from 2011 to date has gone into
Road and Other Infrastructure; 26% utilised as Expenditure and Amortization of Loans for Oil
and Gas Infrastructure; 11% each pushed into Agriculture Modernisation and Capacity
Building respectively; and 8% transferred to the GIIF with PIAC receiving less than 1%
(0.03%).
However, a careful scrutiny of the disbursement of the ABFA to the four priority and other
areas reveals that the actual allocation to the Agriculture Modernisation priority sector over the
six-year period is 33% (GH¢118.39 million) less than what is reported to have been disbursed
following the detection of a wrongful classification of some coastal protection projects
(construction of sea defence walls at Ngyiresia, Adjoa in the Western Region, Sakumono in
the Greater Accra Region and Atokor/Dzita/Anyanui in the Volta Region) in 2014 as projects in
the Fisheries and Aquaculture Sector instead of the Works Sub-Sector of the Ministry of Water
Resources, Works and Housing. Although the said projects have subsequently been classified
as Water Infrastructure under the Roads and Other Infrastructure priority area in the 2015 and
2016 ABFA allocation, the error in 2014 has not been corrected by the MoF. This means that
total ABFA allocation to the Agriculture Modernisation priority area between 2011 and 2016
amounted to GH¢238.67 million representing 7% of the total allocation over the reporting
period while the allocation to the Road and Other Infrastructure priority area was
approximately GH¢1.58 billion (48%) as shown in Figure 14.
FIGURE 14: PIAC’S ANALYSIS OF TOTAL ALLOCATION OF ABFA TO PRIORITY AREAS
Expenditure on Amortisation of
Loans GHS874.55m
(26%)
Agriculture Modernisation
GHS238.67m (7%)
Road and Other InfrastructureGHS1,577.60m
(48%)
Capacity Building GHS358.00m
11%
GIIF, GHS257.08m
(8%)
47
Figure 14 also captures the expenditure on the ICT project disbursed in 2016, which PIAC
explained earlier in Section 6.3.1.3 as having been misclassified, under the Expenditure and
Amortisation of Loans priority area.
6.5 UTILISATION OF GNPC ALLOCATION IN 2016
As indicated in Table 19, US$88.50 million of the 2016 total petroleum receipts (representing
38.64%) was paid to GNPC as equity financing costs and its share of net proceeds compared
US$126.86 million received by the National Oil Company (NOC) in 2015. The disbursement to
GNPC in 2016 could only cover 61% of the NOC’s total expenditure of US$144.52 million
incurred during the period under review. According to the GNPC, the difference of US$55.95
million was financed through the Corporation’s cash balance of US$124.06 million carried over
from 2015, leaving cash-on-hand, pending projects milestone disbursements of US$68.03
million, as shown in Table 24.
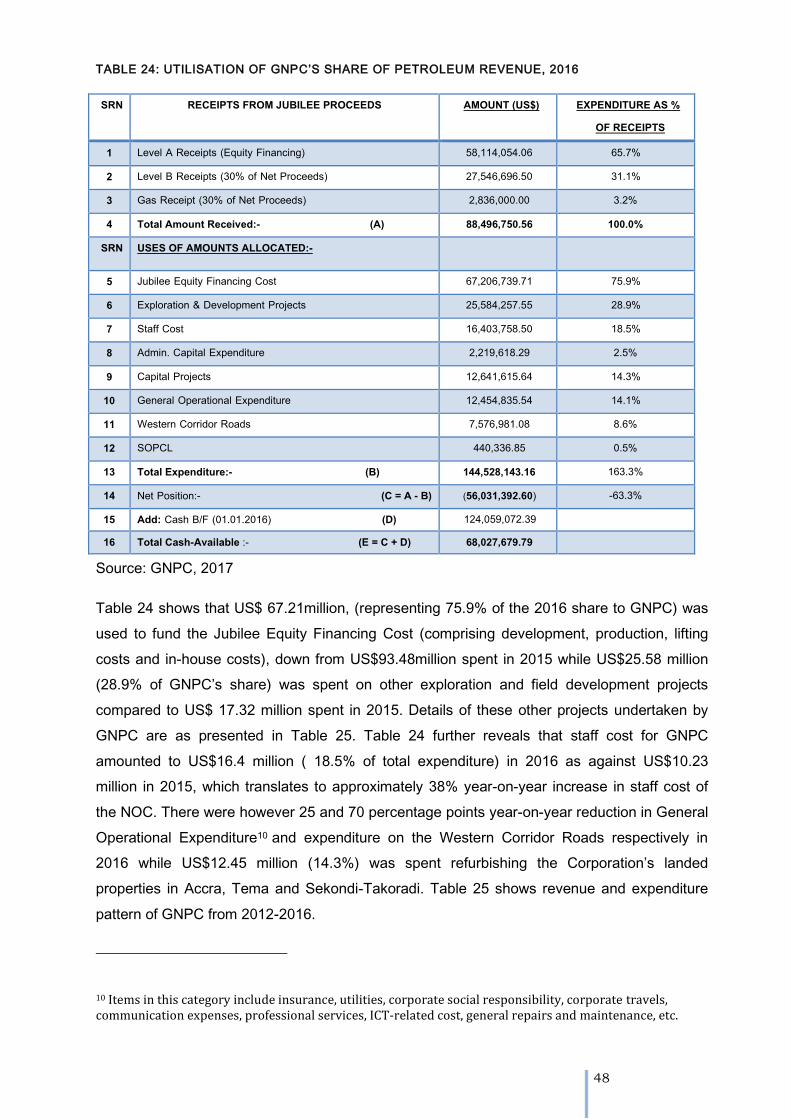
48
TABLE 24: UTILISATION OF GNPC’S SHARE OF PETROLEUM REVENUE, 2016
SRN RECEIPTS FROM JUBILEE PROCEEDS AMOUNT (US$) EXPENDITURE AS % OF RECEIPTS
1 Level A Receipts (Equity Financing) 58,114,054.06 65.7%
2 Level B Receipts (30% of Net Proceeds) 27,546,696.50 31.1%
3 Gas Receipt (30% of Net Proceeds) 2,836,000.00 3.2%
4 Total Amount Received:- (A) 88,496,750.56 100.0%
SRN USES OF AMOUNTS ALLOCATED:-
5 Jubilee Equity Financing Cost 67,206,739.71 75.9%
6 Exploration & Development Projects 25,584,257.55 28.9%
7 Staff Cost 16,403,758.50 18.5%
8 Admin. Capital Expenditure 2,219,618.29 2.5%
9 Capital Projects 12,641,615.64 14.3%
10 General Operational Expenditure 12,454,835.54 14.1%
11 Western Corridor Roads 7,576,981.08 8.6%
12 SOPCL 440,336.85 0.5%
13 Total Expenditure:- (B) 144,528,143.16 163.3%
14 Net Position:- (C = A - B) (56,031,392.60) -63.3%
15 Add: Cash B/F (01.01.2016) (D) 124,059,072.39
16 Total Cash-Available :- (E = C + D) 68,027,679.79
Source: GNPC, 2017
Table 24 shows that US$ 67.21million, (representing 75.9% of the 2016 share to GNPC) was
used to fund the Jubilee Equity Financing Cost (comprising development, production, lifting
costs and in-house costs), down from US$93.48million spent in 2015 while US$25.58 million
(28.9% of GNPC’s share) was spent on other exploration and field development projects
compared to US$ 17.32 million spent in 2015. Details of these other projects undertaken by
GNPC are as presented in Table 25. Table 24 further reveals that staff cost for GNPC
amounted to US$16.4 million ( 18.5% of total expenditure) in 2016 as against US$10.23
million in 2015, which translates to approximately 38% year-on-year increase in staff cost of
the NOC. There were however 25 and 70 percentage points year-on-year reduction in General
Operational Expenditure10 and expenditure on the Western Corridor Roads respectively in
2016 while US$12.45 million (14.3%) was spent refurbishing the Corporation’s landed
properties in Accra, Tema and Sekondi-Takoradi. Table 25 shows revenue and expenditure
pattern of GNPC from 2012-2016.
10 Items in this category include insurance, utilities, corporate social responsibility, corporate travels, communication expenses, professional services, ICT-related cost, general repairs and maintenance, etc.
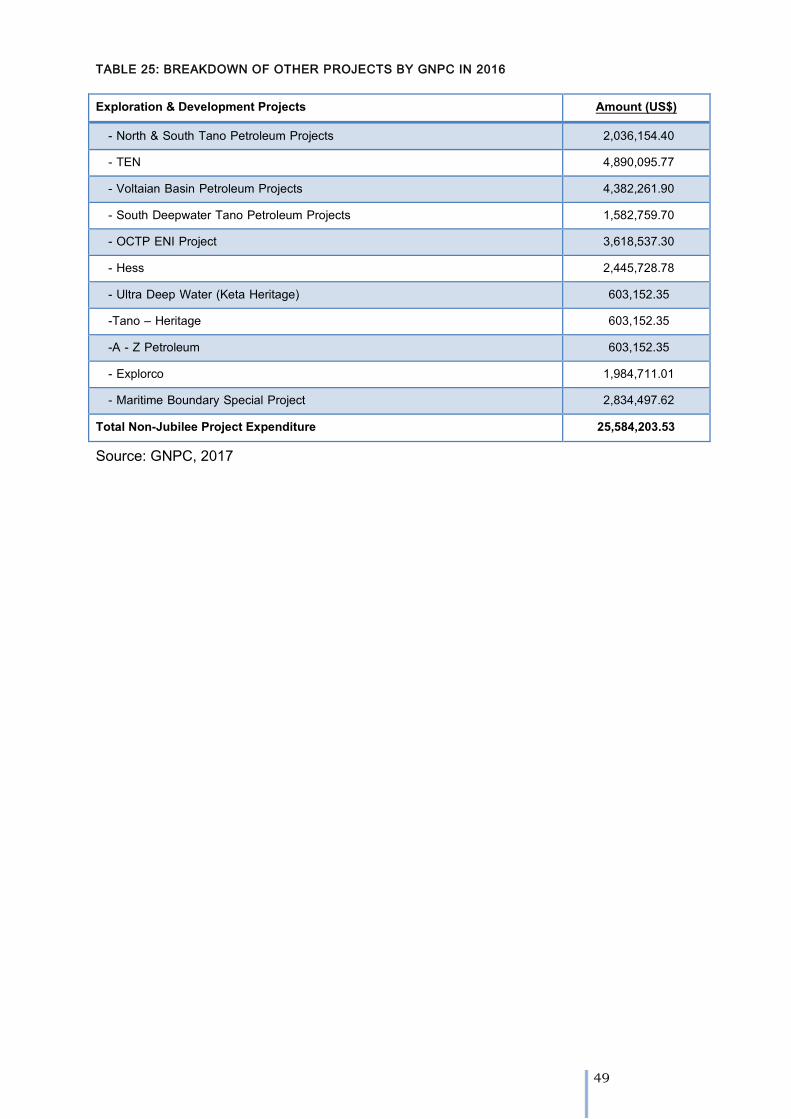
49
TABLE 25: BREAKDOWN OF OTHER PROJECTS BY GNPC IN 2016
Exploration & Development Projects Amount (US$)
- North & South Tano Petroleum Projects 2,036,154.40 - TEN 4,890,095.77
- Voltaian Basin Petroleum Projects 4,382,261.90
- South Deepwater Tano Petroleum Projects 1,582,759.70 - OCTP ENI Project 3,618,537.30
- Hess 2,445,728.78
- Ultra Deep Water (Keta Heritage) 603,152.35
-Tano – Heritage 603,152.35
-A - Z Petroleum 603,152.35
- Explorco 1,984,711.01 - Maritime Boundary Special Project 2,834,497.62
Total Non-Jubilee Project Expenditure 25,584,203.53
Source: GNPC, 2017
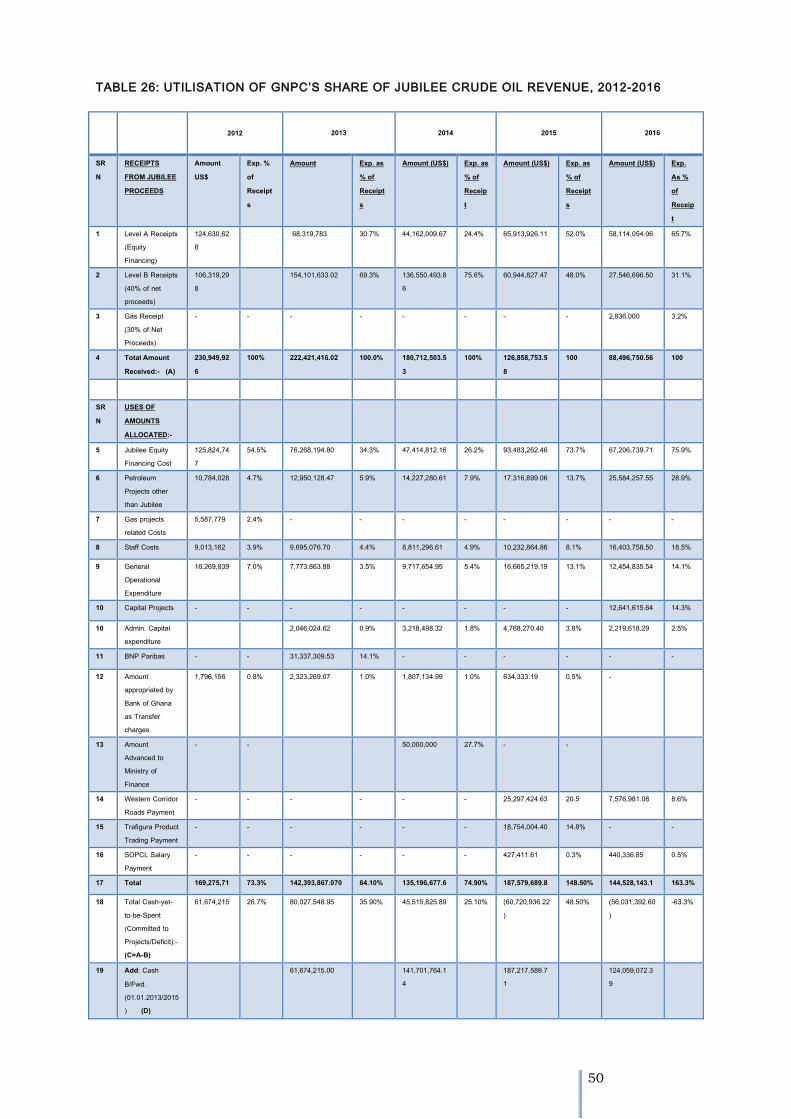
50
TABLE 26: UTILISATION OF GNPC’S SHARE OF JUBILEE CRUDE OIL REVENUE, 2012-2016
2012
2013 2014 2015 2016
SRN
RECEIPTS FROM JUBILEE PROCEEDS
Amount US$
Exp. % of Receipts
Amount Exp. as % of Receipts
Amount (US$) Exp. as % of Receipt
Amount (US$) Exp. as % of Receipts
Amount (US$) Exp. As % of Receipt
1 Level A Receipts (Equity Financing)
124,630,628
68,319,783 30.7% 44,162,009.67 24.4% 65,913,926.11 52.0% 58,114,054.06 65.7%
2 Level B Receipts (40% of net proceeds)
106,319,298
154,101,633.02 69.3% 136,550,493.86
75.6% 60,944,827.47 48.0% 27,546,696.50 31.1%
3 Gas Receipt (30% of Net Proceeds)
- - - - - - - - 2,836,000 3.2%
4 Total Amount Received:- (A)
230,949,926
100% 222,421,416.02 100.0% 180,712,503.53
100% 126,858,753.58
100 88,496,750.56 100
SRN
USES OF AMOUNTS ALLOCATED:-
5 Jubilee Equity Financing Cost
125,824,747
54.5% 76,268,194.80 34.3% 47,414,812.16 26.2% 93,483,262.46 73.7% 67,206,739.71 75.9%
6 Petroleum Projects other than Jubilee
10,784,028 4.7% 12,950,128.47 5.9% 14,227,280.61 7.9% 17,316,899.06 13.7% 25,584,257.55 28.9%
7 Gas projects related Costs
5,587,779 2.4% - - - - - - - -
8 Staff Costs 9,013,162 3.9% 9,695,076.70 4.4% 8,811,296.61 4.9% 10,232,864.86 8.1% 16,403,758.50 18.5%
9 General Operational Expenditure
16,269,839 7.0% 7,773,863.88 3.5% 9,717,654.95 5.4% 16,665,219.19 13.1% 12,454,835.54 14.1%
10 Capital Projects - - - - - - - - 12,641,615.64 14.3%
10 Admin. Capital expenditure
2,046,024.62 0.9% 3,218,498.32 1.8% 4,768,270.40 3.8% 2,219,618.29 2.5%
11 BNP Paribas - - 31,337,309.53 14.1% - - - - - -
12 Amount appropriated by Bank of Ghana as Transfer charges
1,796,156 0.8% 2,323,269.07 1.0% 1,807,134.99 1.0% 634,333.19 0.5% -
13 Amount Advanced to Ministry of Finance
- - 50,000,000 27.7% - -
14 Western Corridor Roads Payment
- - - - - - 25,297,424.63 20.5 7,576,981.08 8.6%
15 Trafigura Product Trading Payment
- - - - - - 18,754,004.40 14.8% - -
16 SOPCL Salary Payment
- - - - - - 427,411.61 0.3% 440,336.85 0.5%
17 Total Expenditure:- (B)
169,275,711
73.3% 142,393,867.0707
64.10% 135,196,677.64
74.90%
187,579,689.80
148.50%
144,528,143.16
163.3%
18 Total Cash-yet-to-be-Spent (Committed to Projects/Deficit):- (C=A-B)
61,674,215 26.7% 80,027,548.95 35.90% 45,515,825.89
25.10% (60,720,936.22)
48.50% (56,031,392.60)
-63.3%
19 Add: Cash B/Fwd. (01.01.2013/2015) (D)
61,674,215.00 141,701,764.14
187,217,589.71
124,059,072.39
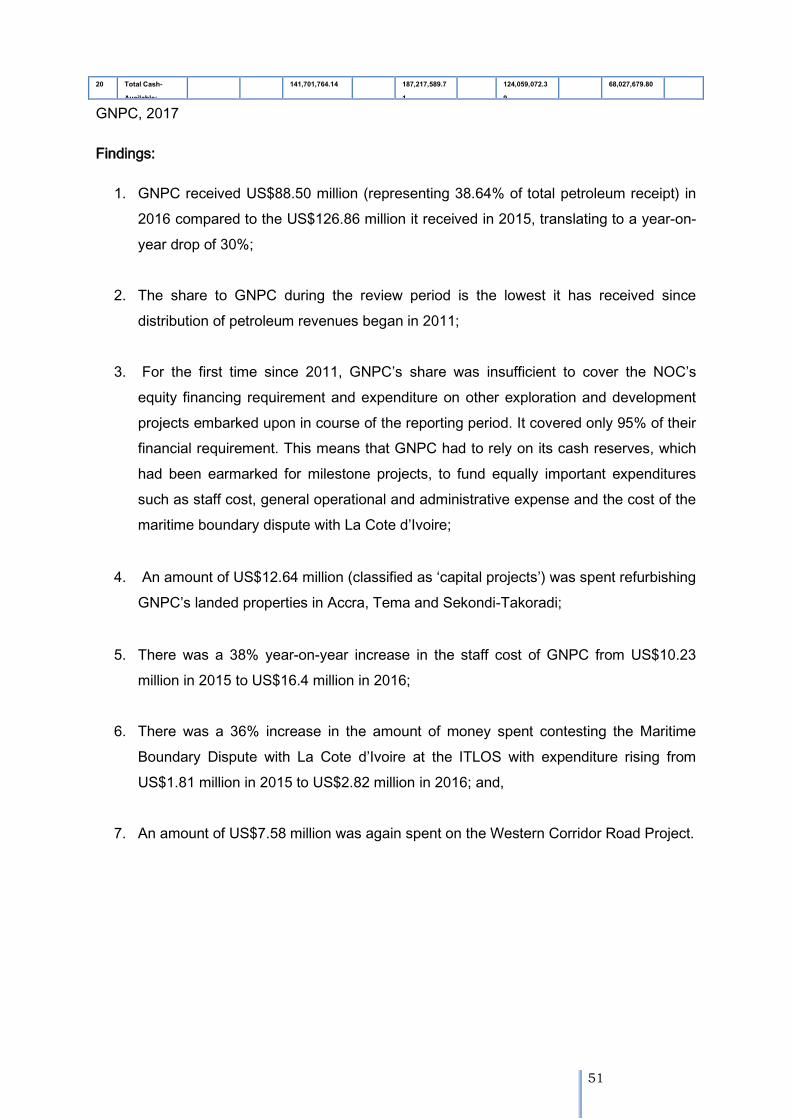
51
20 Total Cash-Available:- (E=C+D)
141,701,764.14 187,217,589.71
124,059,072.39
68,027,679.80
GNPC, 2017
Findings:
1. GNPC received US$88.50 million (representing 38.64% of total petroleum receipt) in
2016 compared to the US$126.86 million it received in 2015, translating to a year-on-
year drop of 30%;
2. The share to GNPC during the review period is the lowest it has received since
distribution of petroleum revenues began in 2011;
3. For the first time since 2011, GNPC’s share was insufficient to cover the NOC’s
equity financing requirement and expenditure on other exploration and development
projects embarked upon in course of the reporting period. It covered only 95% of their
financial requirement. This means that GNPC had to rely on its cash reserves, which
had been earmarked for milestone projects, to fund equally important expenditures
such as staff cost, general operational and administrative expense and the cost of the
maritime boundary dispute with La Cote d’Ivoire;
4. An amount of US$12.64 million (classified as ‘capital projects’) was spent refurbishing
GNPC’s landed properties in Accra, Tema and Sekondi-Takoradi;
5. There was a 38% year-on-year increase in the staff cost of GNPC from US$10.23
million in 2015 to US$16.4 million in 2016;
6. There was a 36% increase in the amount of money spent contesting the Maritime
Boundary Dispute with La Cote d’Ivoire at the ITLOS with expenditure rising from
US$1.81 million in 2015 to US$2.82 million in 2016; and,
7. An amount of US$7.58 million was again spent on the Western Corridor Road Project.

52
6.6 PERFORMANCE OF THE GHANA PETROLEUM FUNDS
As indicated in Table 18, a total amount of US$42.16 million was released to the GPFs in
2016 compared to the 2015 transfer of US$21.67 million representing approximately 95%
year-on-year increase in the allocation of funds to the GPFs. Of the total amount that was
transferred to the GPFs during the year under review, the GSF received US$29.51 million
(70%) compared to the US$15.17 million (70%) transferred in 2015 while the GHF received
US$12.65 million (30%) as against US$6.50 million allocated in the previous year. The 2016
disbursements to the GPFs brings total disbursements to the GPFs since to 2011 till date to
US$897 million with the GSF receiving US$634 million (18%) and GHF receiving US$263
million (8%) as presented in Figure 9.
According to the Ministry of Finance and the Bank of Ghana, the GHF earned a cumulative
return on investment of 1.79% in 2016 compared to 0.25% in 2015 while the GSF yielded a
total return on investments of 0.58% during the same period as against 0.33% in 2015.
Table 27 shows the quarterly and annual returns on GPFs from 2014 to 2016.
TABLE 27: PERFORMANCE OF GHANA PETROLEUM FUNDS, 2014-2016
GHANA PETROLEUM FUNDS
Quarter End Current Returns Total Return year to date
Stabilisation
(%)
Heritage
(%) Stabilisation
(%) Heritage
(%)
2014 March 0.133 0.406 0.809 1.554
June 0.71 2.44 1.47 5.37
September -0.04 0.32 1.43 5.7
December 0.18 1.92 1.61 7.73
2015
March 0.32 1.8 0.32 1.8
June 0.02 -2.3 0.33 -0.64
September 0.04 1.74 0.38 1.18
December -0.01 -0.97 0.33 0.25
2016 March 0.18 2.96 0.18 2.96
June 0.15 1.91 0.33 4.93
September 0.13 0.27 0.46 5.21
December 0.12 -3.25 0.58 1.79
Source: Bank of Ghana, 2017

53
The returns earned on the GPFs in 2016 translate to total investment income of US$5.77
million with GHF contributing US$4.93 million (85.44%) compared to US$3.97 million in 2015
and GSF bringing in US$0.84 million (14.56%), up from US$0.53 million in 2015. This brings
to US$18.91 million total returns on the GPFs since 2011, with GHF and GSF accounting for
US$14.39 million (76%) and US$4.52 million (24%) respectively as shown in Figure 15.
FIGURE 15: TOTAL RETURNS ON GPF, 2011-2016
No withdrawals were made from the GSF during the period under review leaving a closing
book balance of US$207.75 million while the balance on GHF stood at US$276.96 million
over the period ending December 31, 2016. Table A-2 in the Annexure presents the
performance of the GPFs from 2011-2016.
Findings:
1. GPFs made a net investment income of US$5.77 million during the period under
review, compared to US$4.5 million in 2015. Of this amount, the GHF brought in
US$4.93 million (85.44%), up from the US$3.97 million earned in 2015 while the GSF
brought in US$0.84 million (14.56%), up from US$0.53 million in 2015;
2. The balance on the GHF at the end of 2016 stood at US$276.96 million compared to
US$259.38 million in 2015 while that on the GSF stood at US$207.75 million as
against US$177.40 million in 2015 bringing total combined balance in the GPFs as at
the end of the reporting period to US$484.71 million.
GSF, 4,515,105.49, (24%)
GHF, 14,392,136.36,
(76%)
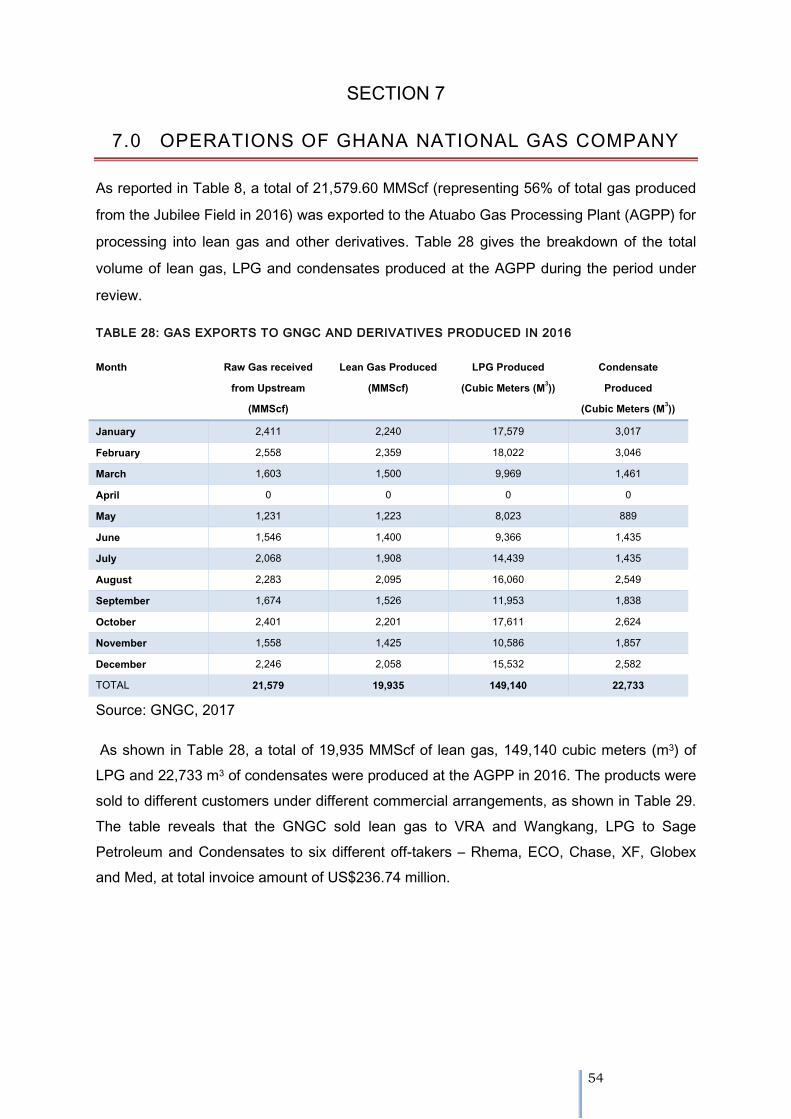
54
SECTION 7
7.0 OPERATIONS OF GHANA NATIONAL GAS COMPANY
As reported in Table 8, a total of 21,579.60 MMScf (representing 56% of total gas produced
from the Jubilee Field in 2016) was exported to the Atuabo Gas Processing Plant (AGPP) for
processing into lean gas and other derivatives. Table 28 gives the breakdown of the total
volume of lean gas, LPG and condensates produced at the AGPP during the period under
review.
TABLE 28: GAS EXPORTS TO GNGC AND DERIVATIVES PRODUCED IN 2016
Month Raw Gas received from Upstream
(MMScf)
Lean Gas Produced (MMScf)
LPG Produced (Cubic Meters (M3))
Condensate Produced
(Cubic Meters (M3))
January 2,411 2,240 17,579 3,017 February 2,558 2,359 18,022 3,046 March 1,603 1,500 9,969 1,461 April 0 0 0 0 May 1,231 1,223 8,023 889 June 1,546 1,400 9,366 1,435 July 2,068 1,908 14,439 1,435 August 2,283 2,095 16,060 2,549 September 1,674 1,526 11,953 1,838 October 2,401 2,201 17,611 2,624 November 1,558 1,425 10,586 1,857 December 2,246 2,058 15,532 2,582 TOTAL 21,579 19,935 149,140 22,733
Source: GNGC, 2017
As shown in Table 28, a total of 19,935 MMScf of lean gas, 149,140 cubic meters (m3) of
LPG and 22,733 m3 of condensates were produced at the AGPP in 2016. The products were
sold to different customers under different commercial arrangements, as shown in Table 29.
The table reveals that the GNGC sold lean gas to VRA and Wangkang, LPG to Sage
Petroleum and Condensates to six different off-takers – Rhema, ECO, Chase, XF, Globex
and Med, at total invoice amount of US$236.74 million.
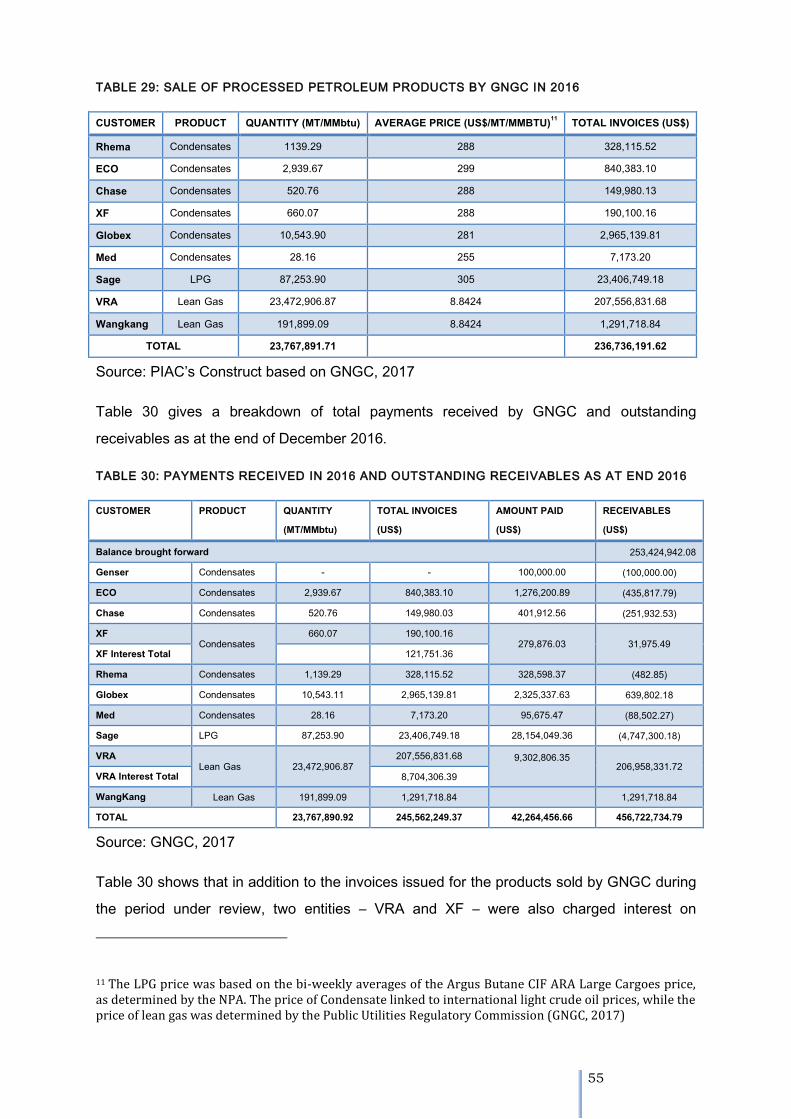
55
TABLE 29: SALE OF PROCESSED PETROLEUM PRODUCTS BY GNGC IN 2016
CUSTOMER PRODUCT QUANTITY (MT/MMbtu) AVERAGE PRICE (US$/MT/MMBTU)11 TOTAL INVOICES (US$)
Rhema Condensates 1139.29 288 328,115.52 ECO Condensates 2,939.67 299 840,383.10 Chase Condensates 520.76 288 149,980.13 XF Condensates 660.07 288 190,100.16 Globex Condensates 10,543.90 281 2,965,139.81 Med Condensates 28.16 255 7,173.20 Sage LPG 87,253.90 305 23,406,749.18 VRA Lean Gas 23,472,906.87 8.8424 207,556,831.68
Wangkang Lean Gas 191,899.09 8.8424 1,291,718.84 TOTAL 23,767,891.71 236,736,191.62
Source: PIAC’s Construct based on GNGC, 2017
Table 30 gives a breakdown of total payments received by GNGC and outstanding
receivables as at the end of December 2016.
TABLE 30: PAYMENTS RECEIVED IN 2016 AND OUTSTANDING RECEIVABLES AS AT END 2016
CUSTOMER PRODUCT QUANTITY (MT/MMbtu)
TOTAL INVOICES (US$)
AMOUNT PAID (US$)
RECEIVABLES (US$)
Balance brought forward 253,424,942.08 Genser Condensates - - 100,000.00 (100,000.00) ECO Condensates 2,939.67 840,383.10 1,276,200.89 (435,817.79) Chase Condensates 520.76 149,980.03 401,912.56 (251,932.53) XF
Condensates 660.07 190,100.16
279,876.03 31,975.49 XF Interest Total 121,751.36 Rhema Condensates 1,139.29 328,115.52 328,598.37 (482.85) Globex Condensates 10,543.11 2,965,139.81 2,325,337.63 639,802.18 Med Condensates 28.16 7,173.20 95,675.47 (88,502.27) Sage LPG 87,253.90 23,406,749.18 28,154,049.36 (4,747,300.18) VRA
Lean Gas 23,472,906.87 207,556,831.68 9,302,806.35
206,958,331.72
VRA Interest Total 8,704,306.39 WangKang Lean Gas 191,899.09 1,291,718.84 1,291,718.84 TOTAL 23,767,890.92 245,562,249.37 42,264,456.66 456,722,734.79
Source: GNGC, 2017
Table 30 shows that in addition to the invoices issued for the products sold by GNGC during
the period under review, two entities – VRA and XF – were also charged interest on
11 The LPG price was based on the bi-weekly averages of the Argus Butane CIF ARA Large Cargoes price, as determined by the NPA. The price of Condensate linked to international light crude oil prices, while the price of lean gas was determined by the Public Utilities Regulatory Commission (GNGC, 2017)
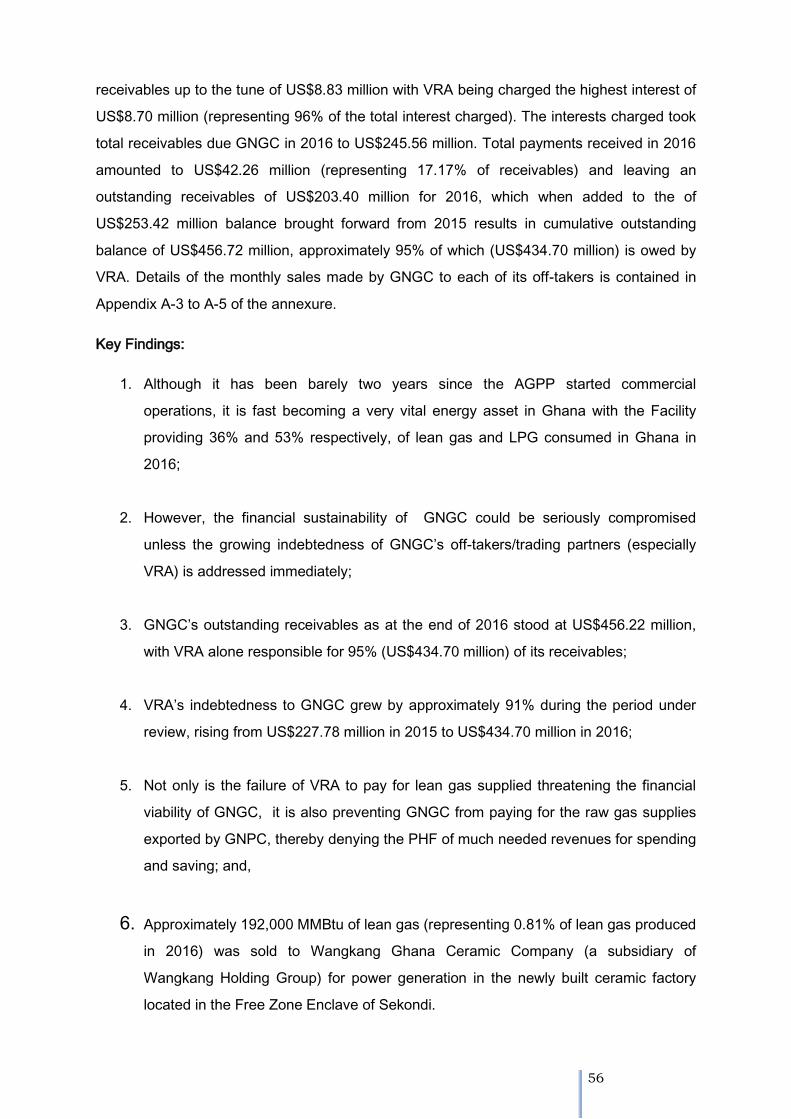
56
receivables up to the tune of US$8.83 million with VRA being charged the highest interest of
US$8.70 million (representing 96% of the total interest charged). The interests charged took
total receivables due GNGC in 2016 to US$245.56 million. Total payments received in 2016
amounted to US$42.26 million (representing 17.17% of receivables) and leaving an
outstanding receivables of US$203.40 million for 2016, which when added to the of
US$253.42 million balance brought forward from 2015 results in cumulative outstanding
balance of US$456.72 million, approximately 95% of which (US$434.70 million) is owed by
VRA. Details of the monthly sales made by GNGC to each of its off-takers is contained in
Appendix A-3 to A-5 of the annexure.
Key Findings:
1. Although it has been barely two years since the AGPP started commercial
operations, it is fast becoming a very vital energy asset in Ghana with the Facility
providing 36% and 53% respectively, of lean gas and LPG consumed in Ghana in
2016;
2. However, the financial sustainability of GNGC could be seriously compromised
unless the growing indebtedness of GNGC’s off-takers/trading partners (especially
VRA) is addressed immediately;
3. GNGC’s outstanding receivables as at the end of 2016 stood at US$456.22 million,
with VRA alone responsible for 95% (US$434.70 million) of its receivables;
4. VRA’s indebtedness to GNGC grew by approximately 91% during the period under
review, rising from US$227.78 million in 2015 to US$434.70 million in 2016;
5. Not only is the failure of VRA to pay for lean gas supplied threatening the financial
viability of GNGC, it is also preventing GNGC from paying for the raw gas supplies
exported by GNPC, thereby denying the PHF of much needed revenues for spending
and saving; and,
6. Approximately 192,000 MMBtu of lean gas (representing 0.81% of lean gas produced
in 2016) was sold to Wangkang Ghana Ceramic Company (a subsidiary of
Wangkang Holding Group) for power generation in the newly built ceramic factory
located in the Free Zone Enclave of Sekondi.
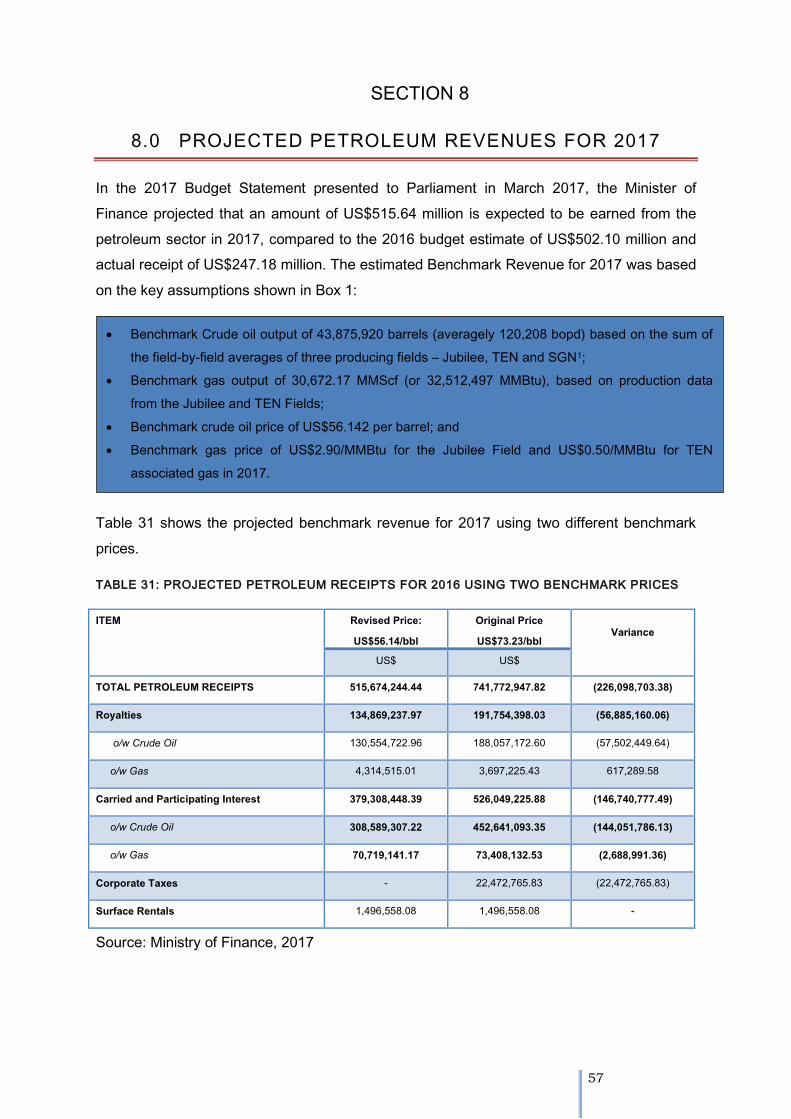
57
SECTION 8
8.0 PROJECTED PETROLEUM REVENUES FOR 2017
In the 2017 Budget Statement presented to Parliament in March 2017, the Minister of
Finance projected that an amount of US$515.64 million is expected to be earned from the
petroleum sector in 2017, compared to the 2016 budget estimate of US$502.10 million and
actual receipt of US$247.18 million. The estimated Benchmark Revenue for 2017 was based
on the key assumptions shown in Box 1:
Table 31 shows the projected benchmark revenue for 2017 using two different benchmark
prices.
TABLE 31: PROJECTED PETROLEUM RECEIPTS FOR 2016 USING TWO BENCHMARK PRICES
ITEM Revised Price: US$56.14/bbl
Original Price US$73.23/bbl Variance
US$ US$
TOTAL PETROLEUM RECEIPTS 515,674,244.44 741,772,947.82 (226,098,703.38)
Royalties 134,869,237.97 191,754,398.03 (56,885,160.06)
o/w Crude Oil 130,554,722.96 188,057,172.60 (57,502,449.64)
o/w Gas 4,314,515.01 3,697,225.43 617,289.58
Carried and Participating Interest 379,308,448.39 526,049,225.88 (146,740,777.49)
o/w Crude Oil 308,589,307.22 452,641,093.35 (144,051,786.13)
o/w Gas 70,719,141.17 73,408,132.53 (2,688,991.36)
Corporate Taxes - 22,472,765.83 (22,472,765.83)
Surface Rentals 1,496,558.08 1,496,558.08 -
Source: Ministry of Finance, 2017
Benchmark Crude oil output of 43,875,920 barrels (averagely 120,208 bopd) based on the sum of
the field-by-field averages of three producing fields – Jubilee, TEN and SGN1;
Benchmark gas output of 30,672.17 MMScf (or 32,512,497 MMBtu), based on production data
from the Jubilee and TEN Fields;
Benchmark crude oil price of US$56.142 per barrel; and
Benchmark gas price of US$2.90/MMBtu for the Jubilee Field and US$0.50/MMBtu for TEN
associated gas in 2017.
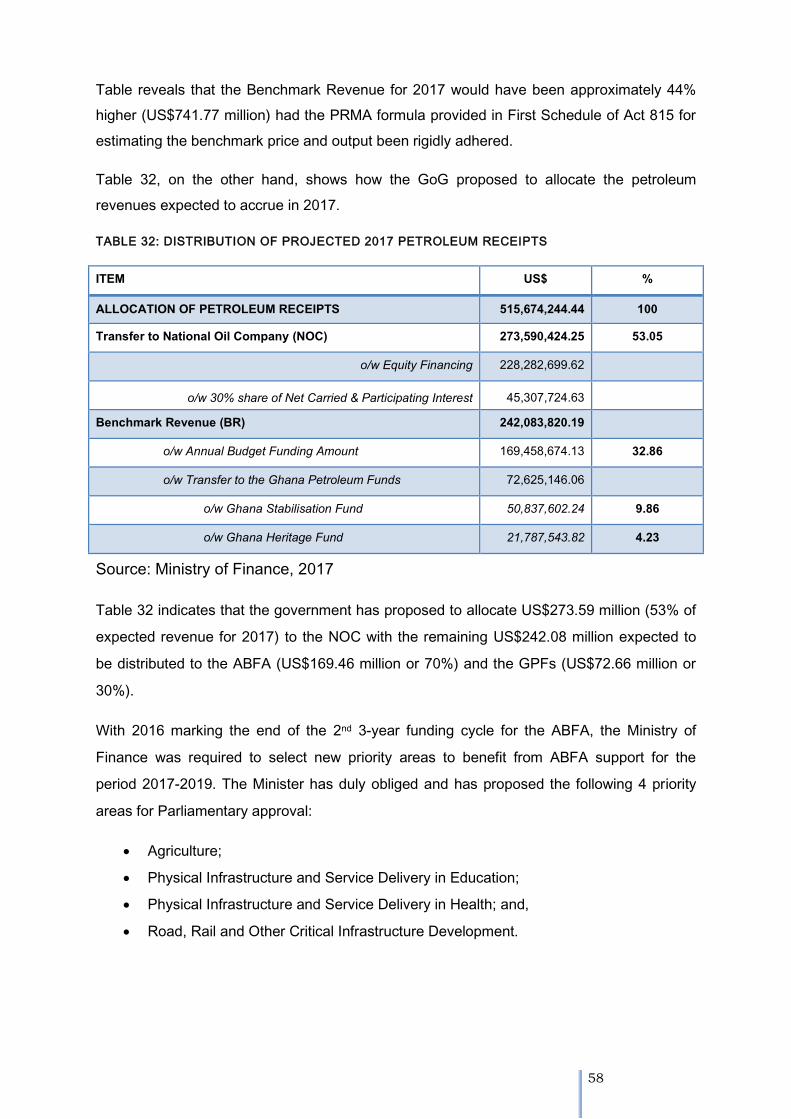
58
Table reveals that the Benchmark Revenue for 2017 would have been approximately 44%
higher (US$741.77 million) had the PRMA formula provided in First Schedule of Act 815 for
estimating the benchmark price and output been rigidly adhered.
Table 32, on the other hand, shows how the GoG proposed to allocate the petroleum
revenues expected to accrue in 2017.
TABLE 32: DISTRIBUTION OF PROJECTED 2017 PETROLEUM RECEIPTS
ITEM US$ %
ALLOCATION OF PETROLEUM RECEIPTS 515,674,244.44 100
Transfer to National Oil Company (NOC) 273,590,424.25 53.05
o/w Equity Financing 228,282,699.62
o/w 30% share of Net Carried & Participating Interest 45,307,724.63
Benchmark Revenue (BR) 242,083,820.19
o/w Annual Budget Funding Amount 169,458,674.13 32.86
o/w Transfer to the Ghana Petroleum Funds 72,625,146.06
o/w Ghana Stabilisation Fund 50,837,602.24 9.86
o/w Ghana Heritage Fund 21,787,543.82 4.23
Source: Ministry of Finance, 2017
Table 32 indicates that the government has proposed to allocate US$273.59 million (53% of
expected revenue for 2017) to the NOC with the remaining US$242.08 million expected to
be distributed to the ABFA (US$169.46 million or 70%) and the GPFs (US$72.66 million or
30%).
With 2016 marking the end of the 2nd 3-year funding cycle for the ABFA, the Ministry of
Finance was required to select new priority areas to benefit from ABFA support for the
period 2017-2019. The Minister has duly obliged and has proposed the following 4 priority
areas for Parliamentary approval:
Agriculture;
Physical Infrastructure and Service Delivery in Education;
Physical Infrastructure and Service Delivery in Health; and,
Road, Rail and Other Critical Infrastructure Development.
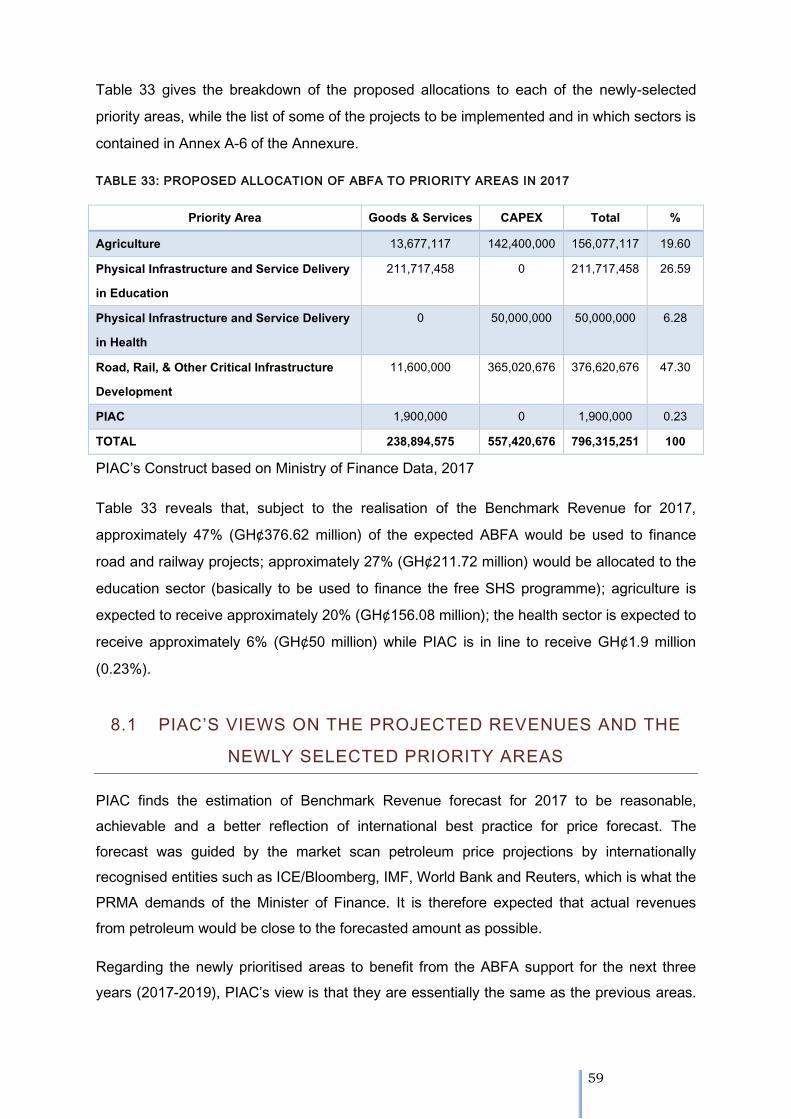
59
Table 33 gives the breakdown of the proposed allocations to each of the newly-selected
priority areas, while the list of some of the projects to be implemented and in which sectors is
contained in Annex A-6 of the Annexure.
TABLE 33: PROPOSED ALLOCATION OF ABFA TO PRIORITY AREAS IN 2017
Priority Area Goods & Services CAPEX Total % Agriculture 13,677,117 142,400,000 156,077,117 19.60 Physical Infrastructure and Service Delivery in Education
211,717,458 0 211,717,458 26.59
Physical Infrastructure and Service Delivery in Health
0 50,000,000 50,000,000 6.28
Road, Rail, & Other Critical Infrastructure Development
11,600,000 365,020,676 376,620,676 47.30
PIAC 1,900,000 0 1,900,000 0.23 TOTAL 238,894,575 557,420,676 796,315,251 100
PIAC’s Construct based on Ministry of Finance Data, 2017
Table 33 reveals that, subject to the realisation of the Benchmark Revenue for 2017,
approximately 47% (GH¢376.62 million) of the expected ABFA would be used to finance
road and railway projects; approximately 27% (GH¢211.72 million) would be allocated to the
education sector (basically to be used to finance the free SHS programme); agriculture is
expected to receive approximately 20% (GH¢156.08 million); the health sector is expected to
receive approximately 6% (GH¢50 million) while PIAC is in line to receive GH¢1.9 million
(0.23%).
8.1 PIAC’S VIEWS ON THE PROJECTED REVENUES AND THE
NEWLY SELECTED PRIORITY AREAS
PIAC finds the estimation of Benchmark Revenue forecast for 2017 to be reasonable,
achievable and a better reflection of international best practice for price forecast. The
forecast was guided by the market scan petroleum price projections by internationally
recognised entities such as ICE/Bloomberg, IMF, World Bank and Reuters, which is what the
PRMA demands of the Minister of Finance. It is therefore expected that actual revenues
from petroleum would be close to the forecasted amount as possible.
Regarding the newly prioritised areas to benefit from the ABFA support for the next three
years (2017-2019), PIAC’s view is that they are essentially the same as the previous areas.
60
With the exception of the “Expenditure on Amortisation of Loans for Oil and Gas
Infrastructure’’ priority area which was dropped entirely, all the other priority areas were
maintained. Capacity building, for example, could still find its way back into ABFA
expenditures under ‘…service delivery in health and education’. The only difference
however, would be that it may be restricted to only those two sectors as opposed to 8
sectors where capacities were reported to have been built in the two previous prioritisation
cycles.
The newly prioritised areas appear to be more specific than the previous ones with two of
them lifted verbatim from Section 21(3) of the PRMA, while the other two have been
paraphrased from the same section. This notwithstanding, PIAC’s assessment of the
implementation of the ABFA mechanisms over the past six years has shown that even
though four priority areas are selected, in actual practice expenditures sometimes cover all
the 13 preselected priority areas within the PRMA. On the face of the projects/programmes
earmarked to benefit from ABFA support in 2017 (see Annex A-4), it does not look like ABFA
would be spread thinly, at least in 2017. However, one area where the government might be
tempted to maintain the status quo could be the roads and highway sector, if what happened
in the past six years12 is anything to go by.
As indicated in Table A-4, an amount GH¢187.25 million of expected ABFA has been
earmarked for road infrastructure in 2017, but with no specifics as to which roads are to be
funded. However, the budget contains a tall list of projects many of which have benefited
from ABFA support in the past hence the concern that the government could be tempted to
continue funding some or all of those projects.
In the last two editions of PIAC’s Annual Report, the Committee strongly urged the Minister
of Finance to conduct an impact evaluation of ABFA funded projects from 2011-2016 and
use the findings as the basis for selecting the priority areas for 2017-2019. PIAC has not
been informed if any such review/evaluation was conducted leading to the selected priority
areas. A careful look at the 2016 Manifesto of the current administration points to the fact
that the selection of the priority areas were informed largely by some of the key policies
proffered in the party’s manifesto. That notwithstanding, PIAC is pleased that the selected
priority areas are consistent with the areas identified by the majority of Ghanaians it engaged
in 60 districts across the country between August and September, 2016 as captured in Table
34.
12 A total of 182 Roads and Road related projects received ABFA support in the Roads and Highways sector from 2011-2016

61
TABLE 34: CITIZENS’ PREFERENCE FOR ABFA PRIORITY AREAS BY REGIONS
Region Ranked Priorities 1st 2nd 3rd 4th 5th 6th
Eastern Agriculture and Industry
Healthcare Rural Development
Social Welfare
Portable Water Housing Delivery
Volta Agriculture and Industry
Healthcare Rural Development
Social Welfare
Portable Water Housing Delivery
Central Agriculture an Industry
Education Health Roads Energy Finishing of Uncompleted Projects Greater
Accra Agriculture and Industry
Education Health Security Rural Development
Western Agriculture and Industry
Health Education Roads Water N/A
Brong Ahafo
Agriculture and Industry
Rural Development
Health Water Science and Technology
Environment
Northern Agriculture and Industry
Roads Education Health Water N/A
Upper West
Agriculture and Industry
Education Roads Health - N/A
Ashanti Agriculture and Industry
Roads Rural Development
Health Social Welfare Education
Source: PIAC District Stakeholder Engagement Forum, 2016
As evident from Table 34, agriculture and industry was selected by participants at the forums
as the topmost priority in all the regions, while education and health care were ranked
second, third or fourth in the majority of the regions. The highest ranking received by road
infrastructure was 2nd and even that was in only two regions with only two other regions
selecting it as their 3rd and 4th priority respectively. Thus, the four priority areas selected by
the Minister of Finance, are consistent with the citizen’s preferences as expressed at the
PIAC Town Hall Meetings. It is the Committee’s proposes that a lot more petroleum
revenues be allocated to the agriculture sector given the importance attached to the sector
by Ghanaians. The previous situation where modernisation of agriculture was prioritised but
received only 7% of ABFA support between 2011 and 2016 must be avoided.
62
SECTION 9
9.0 SUMMARY OF KEY FINDINGS AND
RECOMMENDATIONS
9.1 SUMMARY OF KEY FINDINGS
C R U D E O I L P R O D U C T I O N
1. There was a 13.7% year-on-year decline in crude oil production in Ghana during the
period under review with annual production dropping from 37.41 mmbbls (102,498
bbls) in 2015 to 32.30 mmbbls (73,995 bopd);
2. The decline in production occurred in spite of the fact that Ghana’s 2nd major
production field – the TEN Fields – came on stream in August, 2016 and actually
contributed 16% (5.32 mmbbls) to annual production. The production shortfall would
have been approximately 28% but for the addition of the TEN Fields;
3. Along with the decline in crude oil production, the production of indigenous natural
gas also declined by a similar magnitude of 27% (from 52.455.91 MMScf in 2015 to
38,420 MMScf in 2016) compared only with Jubilee gas production and by 14% when
compared to the combined production from Jubilee and TEN Fields of 44,780
MMScf;
4. The decline in petroleum production in 2016 was caused by a 34-day shutdown of
the Jubilee Field for maintenance from March 31 to May 3, 2016;
5. Seventy-one percent (71%) of the gas produced on the TEN Fields had to be
discarded or flared as a results of the absence of subsea gas export line between the
TEN and Jubilee development;
C R U D E O I L L I F T I N G S A N D M A R K E T I N G
6. The Ghana Group lifted 4.86 mmbbls from the Jubilee Field in 2016, representing
18.06% which is consistent with the Ghana’s shareholding in the Field;
63
7. The sole lifting undertaken by the Ghana Group from the TEN Field in 2016 also
represented 18.60% of total lifting made by the TEN partners;
8. Ghana’s crude oil from the Jubilee Field were sold at an average achieved price of
US$46.13 per barrel which compares favourably with the average dated Brent price of
US$44.01 as well as the average achieved price of all the Jubilee Partners (Tullow –
US$41.7; Anadarko – US$43.93; and Kosmos – US$45.94);
9. The Jubilee Partners however were able to sell their liftings at a higher price as a
results of their respective hedging policies with Kosmos and Tullow realising unit
prices of US$73.76/barrel and US$61.7/barrel respectively;
P E T R O L E U M R E C E I P T S
10. Actual petroleum receipt in 2016 of US$247.18 was 29% lower than the budgeted
amount (US$348.42 million) and translates to 44% year-on-year reduction in annual
petroleum revenues when compared to the 2015 receipts of US$396.17 million;
11. With the exception of CIT which exceeded its targets, none of the others sources of
petroleum revenues achieved its set targets;
12. Only five (5) out of the 18 licence holders paid surface rental during the period under
review;
13. Ninety-two percent (US$27.31 million) of total CIT received in 2016 was in respect
tax liabilities that Tullow ought to have paid over the period 2011-2014;
14. Only US$9.35 (16.45%) out of total receivables of US$56.79 million from the sale of
raw gas was paid by the off-taker – GNGC – in 2016;
15. Payment of the outstanding receivables for 2016 would have reduced the revenue
shortfall of US$101.24 million by 46% while the shortfall would not have arisen had
the total outstanding indebtedness of GNGC of US$135.49 million been honoured
during the period under review;
64
A L L O C A T I O N A N D U T I L I S A T I O N O F P E T R O L E U M
R E C E I P T S
16. A total of US$229.03 million (representing approximately 92% of total petroleum
receipts) was allocated during the reporting period;
17. An amount of US$98.38 million (GH¢388.85 million) (representing 70% of the net
amount of US$140.54 million transferred to the GoG for further distribution and
42.95% of actual disbursement) was transferred to the ABFA account in 2016;
18. The remaining 30% (US$42.16 million) of the amount received by GoG to be
distributed to the ABFA and GPFs in 2016 was transferred to the GPFs with the GSF
receiving US$29.51 million (70%) and GHF receiving US$12.65 million;
U T I L I S A T I O N O F A L L O C A T I O N T O G N P C
19. The GNPC received US$88.50 million (representing 38.64% of total petroleum
receipt) in 2016 compared to the US$126.86 million it received in 2015, translating to
a year-on-year drop of 30%;
20. The allocation to GNPC during the review period is the lowest it has received since
distribution of petroleum revenues begun in 2011;
21. For the first time since 2011, the disbursement to GNPC was insufficient to cover
(only covered up to 95% of the amount needed to cover both) the NOC’s equity
financing requirement and expenditure on other exploration and development
projects embarked upon in the course of the reporting period. This means that GNPC
had to rely on its cash reserves, which had been earmarked for milestone projects, to
fund equally important expenditures such as staff cost, general operational and
administrative expense and the cost of the maritime boundary dispute with the Ivory
Coast;
22. An amount of US$12.64 million (classified as ‘capital projects’) was spent
refurbishing GNPC’s landed properties in Accra, Tema and Sekondi-Takoradi;
23. There was a 38% year-on-year increase in the staff cost of GNPC from US$10.23
million in 2016 to US%16.4 million in 2016;
65
24. There was a 36% increase in the amount of money spent contesting the Maritime
Boundary Dispute with Ivory Coast at the ITLOS with expenditure rising from
US$1.81 million in 2015 to US$2.82 million in 2016;
25. An amount of US$7.58 million was again spent on the Western Corridor Road
Project;
P E R F O R M A N C E O F G H A N A P E T R O L E U M F U N D S
26. GPFs made a net investment income of US$5.77 million during the period under
review, compared to US$4.5 million in 2015. Of this amount, the GHF brought in
US$4.93 million (85.44%) up from the US$3.97 million earned in 2015 while the GSF
brought in US$0.84 million (14.56%) up from US$0.53 million in 2015; and,
27. The balance on the GHF at the end of 2016 stood at US$276.96 million compared to
US$259.38 million in 2015 while that on the GSF stood at US$207.75 million as
against US$177.40 million in 2015 bringing total combined balance in the GPFs as at
the end of the reporting period to US$484.71.
9.2 OBSERVATIONS AND CONCLUSIONS
DEALING WITH COMMODITY PRICE RISKS AND BUSINESS INTERRUPTIONS
Certainly, there is no gainsaying the fact that Ghana’s petroleum receipts have been
experiencing steady decline since 2014 when a record US$978.02 million was accrued by
the sector. As explained repeatedly in previous reports, the collapse in global crude price
from an average of US$100 per barrel in 2013 to current levels of around sub-US$45 per
barrel has been the proximate cause of the decline in petroleum revenue. In 2016 however,
the effect of the price volatility was further compounded by decline in production volumes
occasioned by disruptions in production as a result of damage to the FPSO turret bearing, as
highlighted earlier on in this report.
Although the combined effect of price and production fall affected all the Jubilee Partners
alike, PIAC has observed that the 3 other Jubilee Partners – Tullow, Kosmos and Anadarko
– were able to mitigate their impacts on their revenues through successful hedging and
insurance policies they undertook. As explained earlier on in the report, both Kosmos and
66
Tullow were able to realise higher prices for a portion of their crude oil liftings as a result of
their hedging policy undertaken to mitigate their exposure to commodity price risk. In
addition to the net revenues received through hedging, all the other Jubilee Partners
received substantial income through the corporate Loss of Production Income (LOPI)
insurance policies, with Kosmos receiving US$ 74.8 million of LOPI proceeds, Tullow
claiming US$90.1 million and Anadarko US$31 million in respect of the turret bearing
damage on the FPSO Kwame Nkrumah during the period under review (Tullow, Kosmos,
Anadarko, 2017).
In the case of Ghana, there was no record of proceeds accruing under any business
interruption insurance claim in the Reconciliation Report on Petroleum Revenues submitted
to Parliament by the Ministry of Finance, the Bank of Ghana’s Semi Annual Report for the
second half of 2016 or the GRA Report to PIAC during the reporting period, or was there any
mention made in respect of receivables due. PIAC’s conclusion therefore is that, the Ghana
Group may not have procured any such LOPI in respect of the Jubilee Field. Follow-up with
GNPC confirms that the Ghana Group has no such insurance policy because they had
believed that Tullow’s (the Operator of field) insurance cover all partners.
FAILURE TO COLLECT DUE REVENUES
PIAC is concerned that some components of petroleum revenue that fell due during the
period under review (as well as some accumulated arrears) were either not collected or paid
by responsible entities. The largest and most blatant of them is GNGC’s failure or inability to
pay for gas supplied by GNPC since late 2014, which has led to an accumulated outstanding
debt of US$135 million dollars. The Committee has been informed that GNGC has not been
able to honour GNPC’s invoices due to VRA’s inability to pay their outstanding debt, which is
now assessed to be over US$454 million and although the Committee and the GNGC have
flagged the dire consequences of the continuous indebtedness of VRA to GNGC in its 2015
Annual and 2016 Semi-Annual Reports, nothing appears to have been done to resolve the
issue. Of equal concern to the Committee is the fact that Ministry of Finance has repeatedly
failed to report on the arrears both in the 2015 Annual and the Reconciliation Reports on the
Petroleum Funds to Parliament nor have they factored the arrears in their estimation of the
benchmark revenues for the successive years, especially where such arrears is of the same
magnitude as the expected royalties.

67
Another area of concern is the payment of surface rentals. The Committee is disappointed
that only five companies paid the annual rentals for their acreages in 2016 compared to nine
in the preceding year. Payment of surface rental was legislated in Section 18 of the PNDC
Law 84 and maintained in Section 86 of the Petroleum (Exploration and Production) Act 919
of 2016. According to Section 86 (2), the Minister of Petroleum shall prescribe the amount to
be paid, except that where the amount is not prescribed, the annual acreage fees shall be
provided in accordance with the terms of a petroleum agreement in respect of the area to
which the agreement relates (Act, 919). The basis for assessing surface rental as outlined in
Section 12.2(e) of the Model Petroleum Agreement is as follows:
Phase of Operation Rental Payable
Initial Period US$30/per sq.km
1st Extension Period US$50 per sq. km
2nd Extension Period US$75 per sq.km
Development and Production Area US$100 per sq.km
The assessment of the 2016 Surface Rental in Table 15 was thus based on the schedule
above. Per Section 2.11 of the Model Petroleum Agreement, annual surface rental is
supposed to be paid at the beginning of each contract year in accordance with the provision
of Article 12.2(e), so it is therefore difficult to understand why only five companies had paid
surface rental as at the end of 2016. PIAC has requested GRA to provide it with dates on
which invoices for the payment of surface rental was issued to the licensed owners and to
explain why the invoices have not been honoured so as to determine whether penalties are
payable for non-payment.
Again, as pointed out in Section 5.3.3, 92% (US$27.31 million) of the CIT paid in 2016 was
in respect of audits and additional assessment of Tullow’s operations between the period
2011 and 2014. While PIAC is happy that the GRA has audited Tullow’s tax returns and
ensured that the additional assessment has been paid, the Committee is concerned about
how long it took the GRA to determine that additional tax revenue is due Ghana.
PIAC is also interested in knowing what led to such a significant discrepancy in Tullow’s
assessment vis-à-vis that of the GRA. It is important for this to be established so as to
institute measures to avoid the reoccurrence of this in future.
68
EMERGENCE OF POTENTIAL COMPETITION FOR LEAN GAS
PIAC was a little bit surprised to notice that GNGC supplied lean gas to another company
(Wangkang) other than VRA, considering the fact that total lean gas produced by GNGC is
insufficient to meet the combined demand of the VRA plants as well as the AMERI plant in
the Western enclave, which unlike the VRA plants runs solely on natural gas. Although the
volume of gas supplied to Wangkang was less than 1% of the total lean gas produced in
2016, the emergence of more credible off-takers (such as IPPs) coupled with VRA’s inability
to pay for gas supplied could create serious competition for VRA for the supply of lean gas
from GNGC. The competition could become even fiercer if and when the proposed
interconnection of the Western Corridor pipeline and the West Africa Gas Pipeline for a
reverse flow of the Jubilee gas becomes a reality in the coming months. Although PIAC in
its 2016 Semi-Annual overtly encouraged the GNGC to develop and explore these other
markets as a means of ensuring the financial sustainability of its business, the Committee is
not oblivious of the acute and strategic importance of lean gas from the AGPP to VRA’s
ability to deliver affordable and reliable supply of electricity in Ghana and would therefore
rather VRA remains the foundation (if not sole) off-taker of the lean gas from GNGC. Urgent
steps ought to be taken to avoid another VRA-WAGP-N-Gas drama playing out in the
foreseeable future.
UTILISATION OF 2016 ABFA
The 2016 ABFA was disbursed to the fewest ever number of projects/programmes since the
introduction of the mechanism in 2011. So few were the projects that the detail list could fit
into the main body of this report rather than the annexure as has been the practice since
2013 when the MoF started publishing the list as part of the Reconciliation Report. From an
average of 51 road projects per year over the five (5) years preceding 2016, the number of
road projects supported by the ABFA dropped to eight (8) in 2016, of which only one (1) was
a new project compared to an average of 36 new projects that were being introduced each
year from 2011-2015. Similarly, the allocations to other infrastructure was spent on a handful
of projects/programmes with all the disbursements to the energy sector going into the
procurement of materials for the National Electrification Scheme while only three sea
defence wall projects (two on-going projects and one new) were funded under water
infrastructure. Allocation to the Agriculture Modernisation priority area was spent on fertiliser
subsidy programme and three irrigation projects while the entire disbursement to the
Capacity Building priority area was for outstanding scholarship claims.
69
The disbursement of the 2016 ABFA is even more remarkable, considering the fact that it
was an election year. Compared to the 2012 financial year (which was an election year), the
ABFA was used to fund projects and programmes in 12 different sectors. PIAC is satisfied
that its perennial call to the Minister of Finance to concentrate the utilisation of ABFA on
smaller number of projects selected from few sectors of the economy has been heeded. It is
the Committee’s hope that this practice would continue so as to ensure efficient allocation of
our petroleum revenues.
DELAY IN THE EVACUATION OF RAW GAS FROM THE TEN FIELD
PIAC is, to say the least, unhappy that significant volumes of raw gas produced from the
TEN Field is being flared, while there is such a high demand for lean gas and other
derivatives on shore. As presented in this report, 71% of the gas produced in 2016 was
flared. With first associated gas export not due until August 2017 (at the earliest) and non-
associated gas not expected until 2018, a lot more natural gas would be flared during the
first half of 2017. The Committee cannot fathom why construction of the US$100 million
approximately 30 kilometre 12-inch bi-directional13 gas import/export subsea pipeline could
not have been timed to coincide with first oil in August 2016, especially when a decision was
taken by the Jubilee Partners to fast-track the Field into operation in August 2016 with gas
production, instead of the scheduled August 2017 for first gas.
In fact, it was not until July, 2016 (barely one month before first oil) that the Chief Executive
Officer of Tullow Ghana announced that the operators of the Field were in discussions with
the Government of Ghana to fast-track export of gas for power generation ahead of
schedule. It is unclear how quickly gas exports could be fast-tracked to bring the much-
needed resource onshore. What is clear however is that the period between August 2016
and whenever gas export from the Jubilee Field would be achieved, would represent a
missed opportunity to have earned additional revenue, reduce the cost of electricity
generation, and minimise the adverse environmental effects associated with the flaring of
gas.
13 The pipeline will import gas from the Jubilee for commissioning of gas compression and handling system at the TEN FPSO prior to first oil

70
9.3 RECOMMENDATIONS
It the light of the foregoing, PIAC wishes to submit the following recommendations for the
consideration of the relevant authorities:
1. Given that the GNGC may well have been caught up in the vicious cycle of the
indebtedness of the energy sector utilities (which stood at US$2.4 billion at the end of
2016), urgent and drastic measures would have to be devised by all key stakeholders to
ensure immediate payment of the outstanding receivable owed the Ghana Petroleum
Fund in respect of gas sales.
One potential source of funds that could have been used to defray VRA’s indebtedness
to GNGC is the Power Generation and Infrastructure Support Sub-Account (PGISSA)14
established under the Energy Sector Levy Act, 2015 (Act 899). However, the proceeds
going into the PGISSA have been earmarked for the repayment of the debt owed by
VRA to 11 domestic banks as part of the strategy introduced by the government to deal
with legacy debt problem facing the State-owned energy sector utilities. Since
termination of supply to VRA is not an option as yet, due to lack of alternative market for
lean gas, PIAC is calling for an immediate meeting between the Government, GNPC and
GNGC to agree on a clear roadmap for the clearing of VRA indebtedness.
2. The Ghana Revenue Authority (GRA) must ensure that all outstanding annual surface
rentals are paid with interest;
3. GRA must ensure that auditing of tax returns filed by the Jubilee Partners are carried out
expeditiously so that any additional assessment payable is paid on time;
4. The Bank of Ghana and/or the Ministry of Finance should seek expert advice on
hedging and consider undertaking hedging activities as part of strategies to mitigate
Ghana’s exposure to commodity price risk/volatility associated with future oil production;
5. GNPC needs to be impressed upon to procure a Loss of Production Insurance (LOPI) or
Business Interruption Insurance if it does not have one already;
14 The PGISSA is to be used to support payment of power utility debt, ensure power supply, power generation and infrastructure support resources and support power infrastructure risk mitigation.
71
6. PIAC still maintains that GNPC should desist from spending part of its dwindling
allocations on non-core businesses such as financing of the Western Corridor Roads.
The GNPC explained to PIAC that it was requested to provide financial support for the
said roads because of their position as the Gas Aggregator. The Committee however
holds a different view and wishes to reiterate its suggestion in its 2016 Semi-annual
Report that such road projects should either be funded with part of the ABFA or a
separate loan contracted for that purpose thereby freeing funds for critical investments in
the areas of GNPC’s core mandate. Similarly, PIAC’s is of the view that GNPC should
not be bearing the cost of the ITLOS litigation on behalf of the State and that such
expenditure should be charged either on the Consolidated Fund or Contingency Fund;
7. GNPC should disclose what steps it is taken to retrieve the US$50 million loan it
advanced to the Ministry of Finance in respect of the Western Corridor Roads.
8. The Government should impress upon the Jubilee Partners to expedite work on the gas
export infrastructure;
9. The ABFA allocation to road infrastructure should continue to be spent on fewer road
projects so as to ensure timely completion of beneficiary projects.
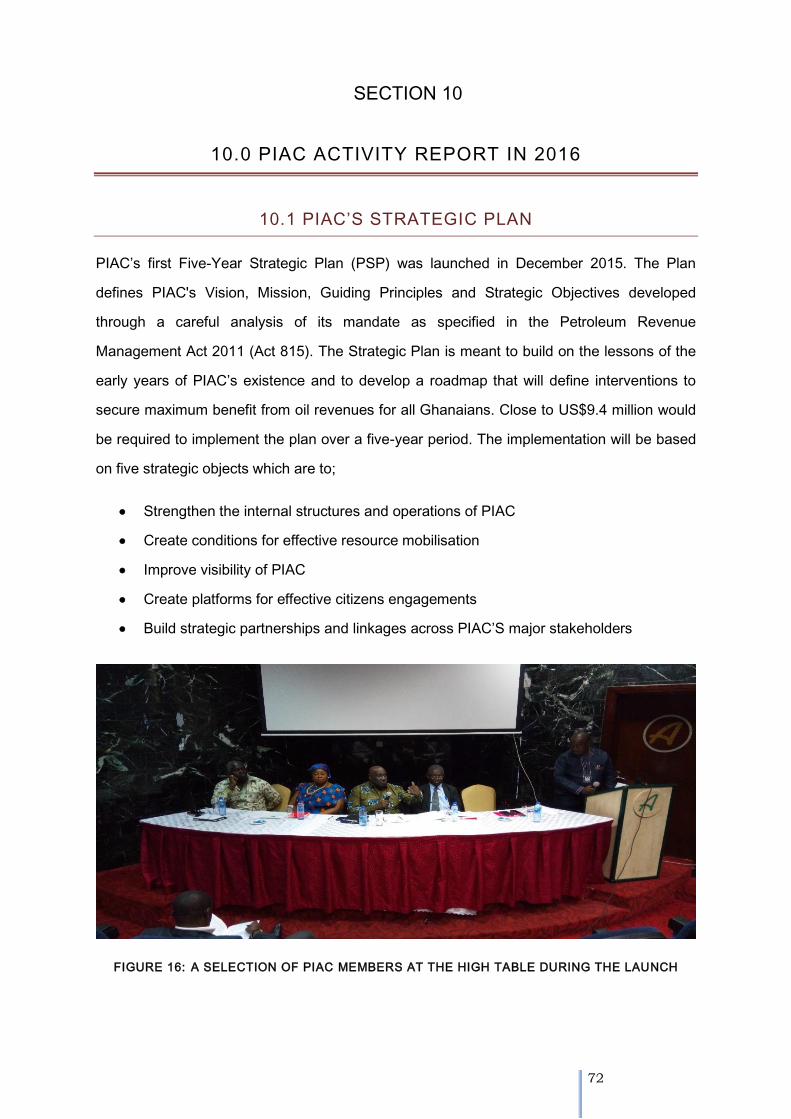
72
SECTION 10
10.0 PIAC ACTIVITY REPORT IN 2016
10.1 PIAC’S STRATEGIC PLAN
PIAC’s first Five-Year Strategic Plan (PSP) was launched in December 2015. The Plan
defines PIAC's Vision, Mission, Guiding Principles and Strategic Objectives developed
through a careful analysis of its mandate as specified in the Petroleum Revenue
Management Act 2011 (Act 815). The Strategic Plan is meant to build on the lessons of the
early years of PIAC’s existence and to develop a roadmap that will define interventions to
secure maximum benefit from oil revenues for all Ghanaians. Close to US$9.4 million would
be required to implement the plan over a five-year period. The implementation will be based
on five strategic objects which are to;
Strengthen the internal structures and operations of PIAC
Create conditions for effective resource mobilisation
Improve visibility of PIAC
Create platforms for effective citizens engagements
Build strategic partnerships and linkages across PIAC’S major stakeholders
FIGURE 16: A SELECTION OF PIAC MEMBERS AT THE HIGH TABLE DURING THE LAUNCH
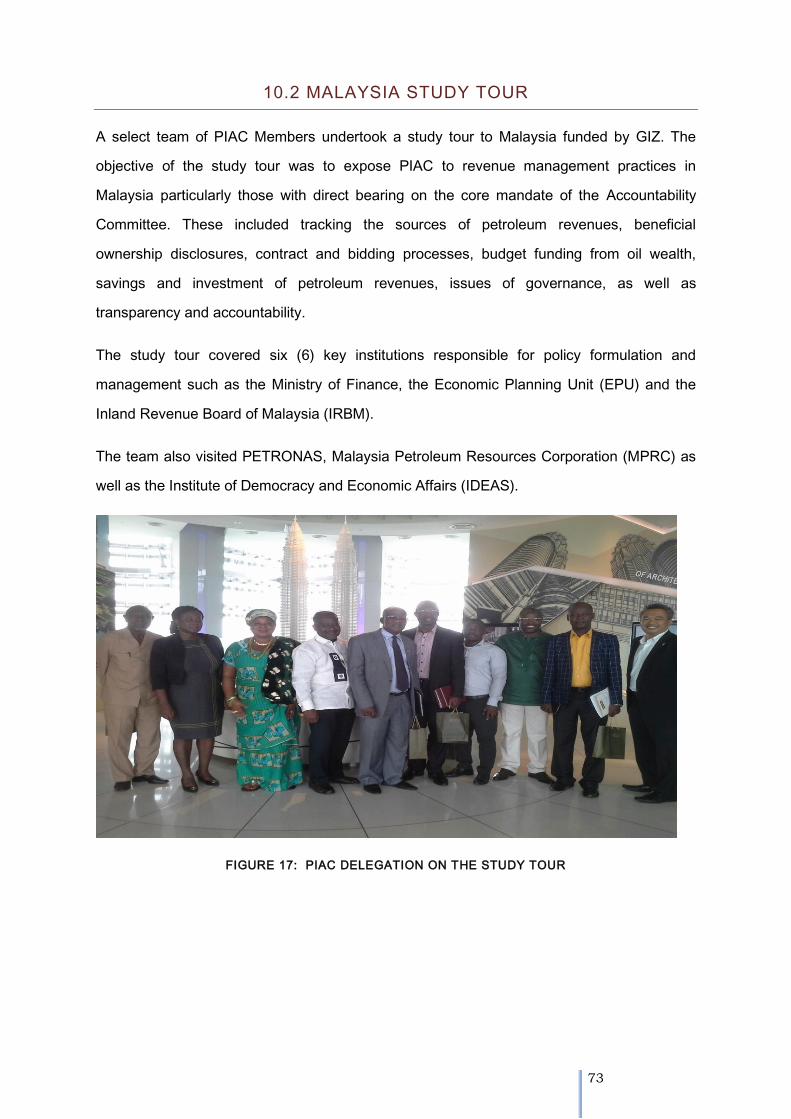
73
10.2 MALAYSIA STUDY TOUR
A select team of PIAC Members undertook a study tour to Malaysia funded by GIZ. The
objective of the study tour was to expose PIAC to revenue management practices in
Malaysia particularly those with direct bearing on the core mandate of the Accountability
Committee. These included tracking the sources of petroleum revenues, beneficial
ownership disclosures, contract and bidding processes, budget funding from oil wealth,
savings and investment of petroleum revenues, issues of governance, as well as
transparency and accountability.
The study tour covered six (6) key institutions responsible for policy formulation and
management such as the Ministry of Finance, the Economic Planning Unit (EPU) and the
Inland Revenue Board of Malaysia (IRBM).
The team also visited PETRONAS, Malaysia Petroleum Resources Corporation (MPRC) as
well as the Institute of Democracy and Economic Affairs (IDEAS).
FIGURE 17: PIAC DELEGATION ON THE STUDY TOUR
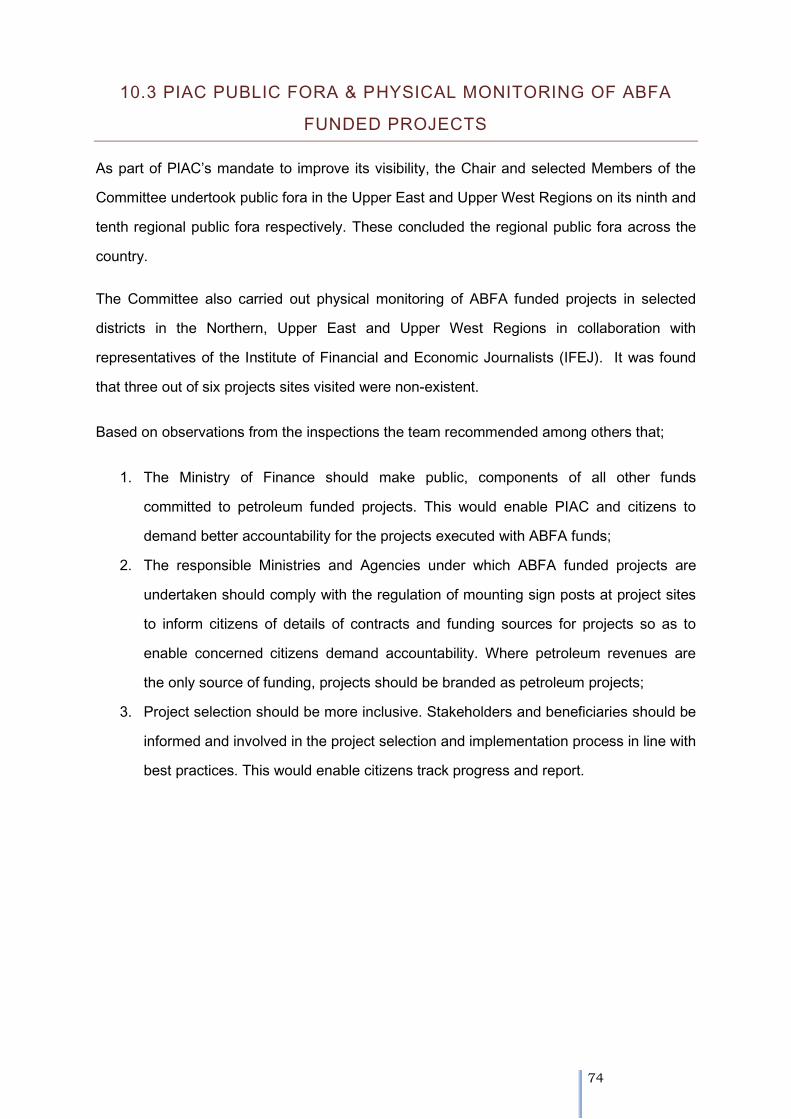
74
10.3 PIAC PUBLIC FORA & PHYSICAL MONITORING OF ABFA
FUNDED PROJECTS
As part of PIAC’s mandate to improve its visibility, the Chair and selected Members of the
Committee undertook public fora in the Upper East and Upper West Regions on its ninth and
tenth regional public fora respectively. These concluded the regional public fora across the
country.
The Committee also carried out physical monitoring of ABFA funded projects in selected
districts in the Northern, Upper East and Upper West Regions in collaboration with
representatives of the Institute of Financial and Economic Journalists (IFEJ). It was found
that three out of six projects sites visited were non-existent.
Based on observations from the inspections the team recommended among others that;
1. The Ministry of Finance should make public, components of all other funds
committed to petroleum funded projects. This would enable PIAC and citizens to
demand better accountability for the projects executed with ABFA funds;
2. The responsible Ministries and Agencies under which ABFA funded projects are
undertaken should comply with the regulation of mounting sign posts at project sites
to inform citizens of details of contracts and funding sources for projects so as to
enable concerned citizens demand accountability. Where petroleum revenues are
the only source of funding, projects should be branded as petroleum projects;
3. Project selection should be more inclusive. Stakeholders and beneficiaries should be
informed and involved in the project selection and implementation process in line with
best practices. This would enable citizens track progress and report.
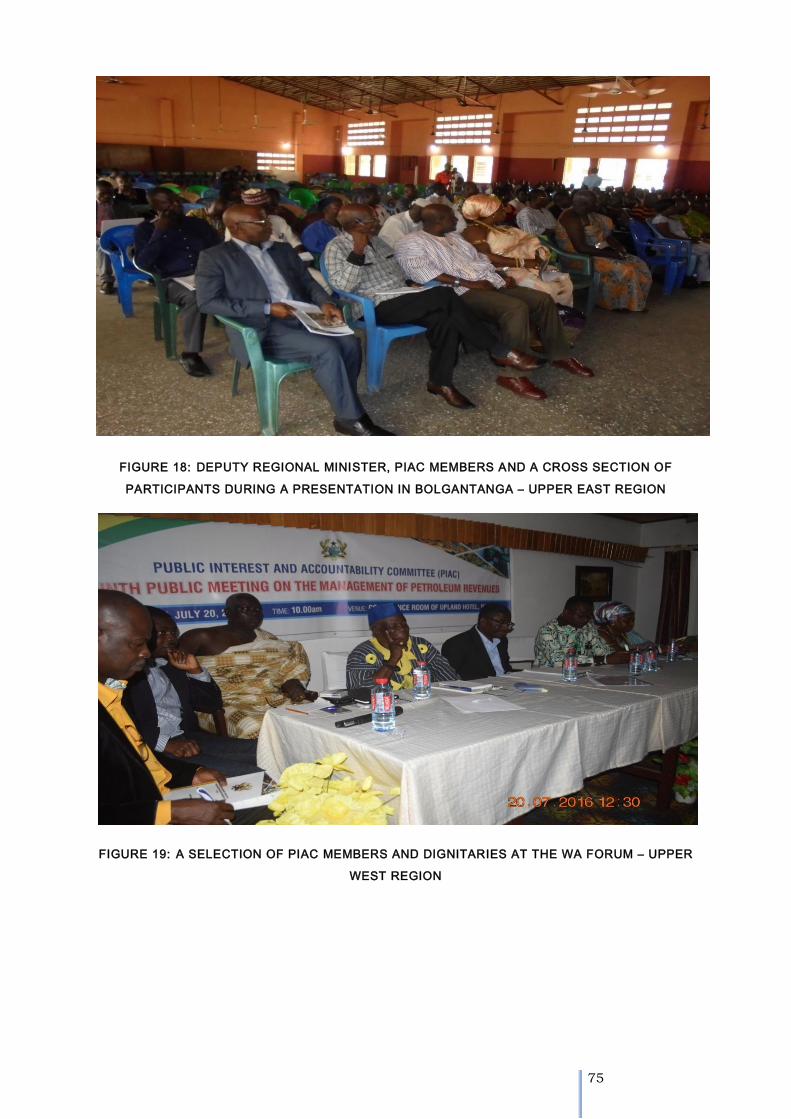
75
FIGURE 18: DEPUTY REGIONAL MINISTER, PIAC MEMBERS AND A CROSS SECTION OF
PARTICIPANTS DURING A PRESENTATION IN BOLGANTANGA – UPPER EAST REGION
FIGURE 19: A SELECTION OF PIAC MEMBERS AND DIGNITARIES AT THE WA FORUM – UPPER
WEST REGION
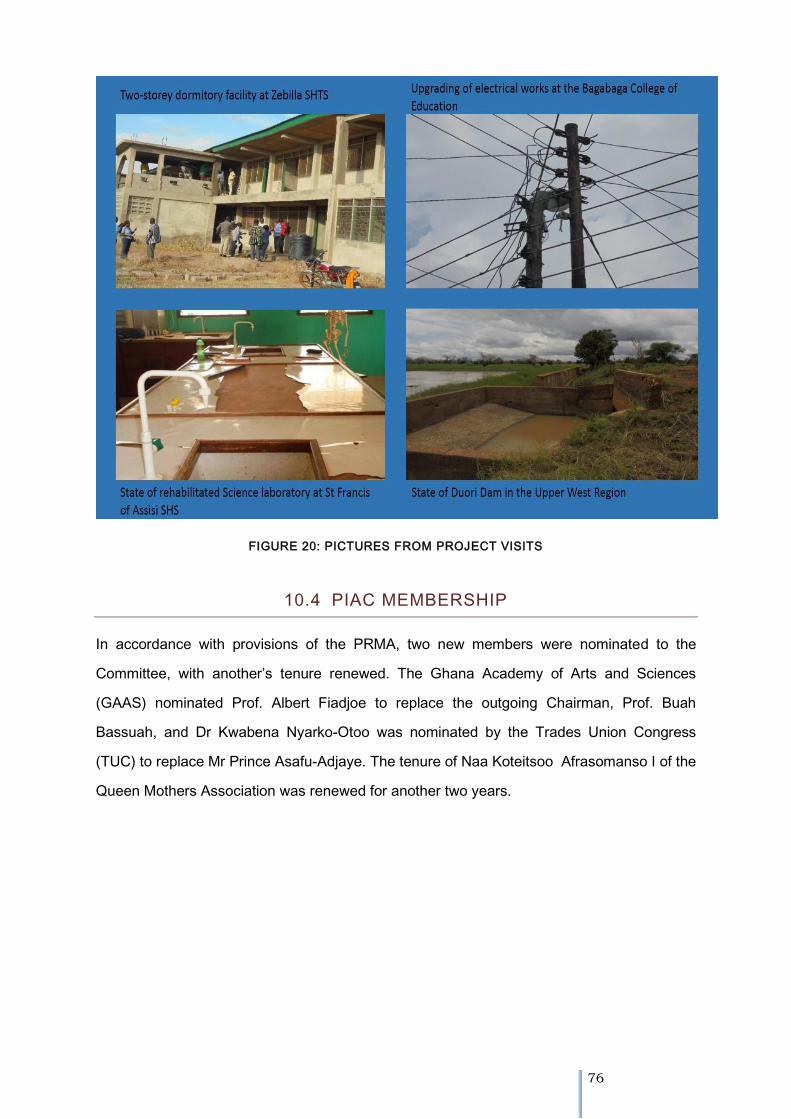
76
FIGURE 20: PICTURES FROM PROJECT VISITS
10.4 PIAC MEMBERSHIP
In accordance with provisions of the PRMA, two new members were nominated to the
Committee, with another’s tenure renewed. The Ghana Academy of Arts and Sciences
(GAAS) nominated Prof. Albert Fiadjoe to replace the outgoing Chairman, Prof. Buah
Bassuah, and Dr Kwabena Nyarko-Otoo was nominated by the Trades Union Congress
(TUC) to replace Mr Prince Asafu-Adjaye. The tenure of Naa Koteitsoo Afrasomanso I of the
Queen Mothers Association was renewed for another two years.
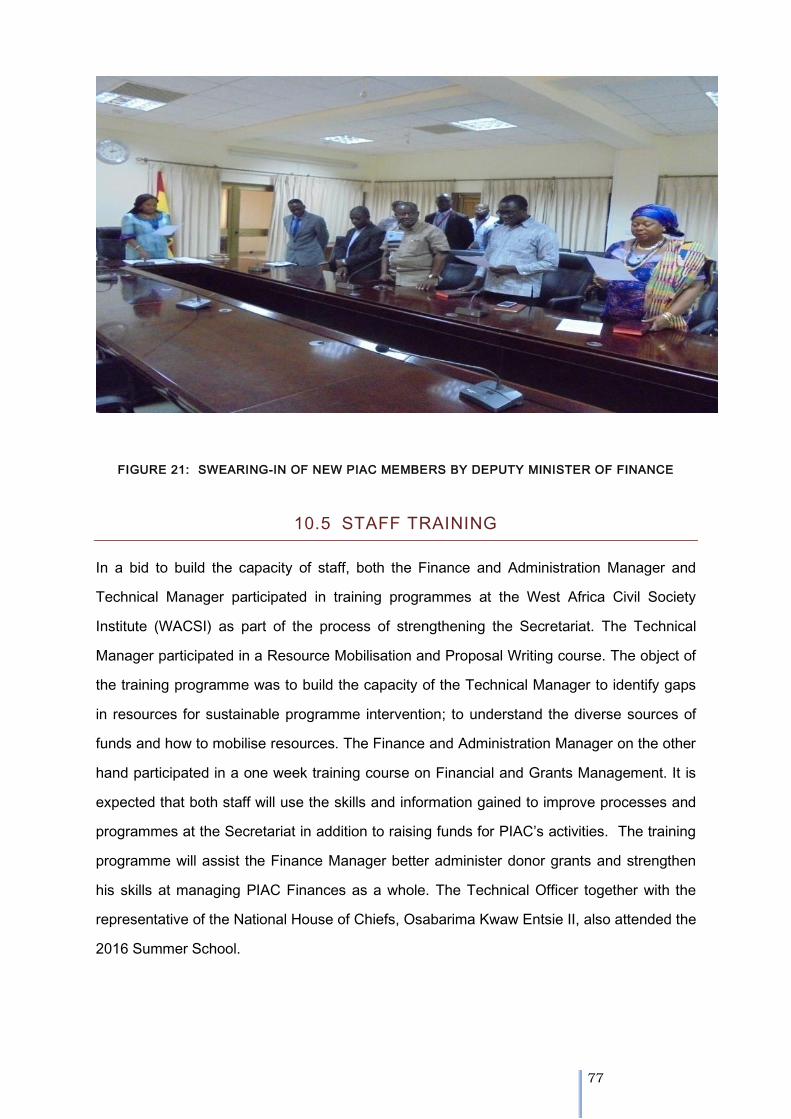
77
FIGURE 21: SWEARING-IN OF NEW PIAC MEMBERS BY DEPUTY MINISTER OF FINANCE
10.5 STAFF TRAINING
In a bid to build the capacity of staff, both the Finance and Administration Manager and
Technical Manager participated in training programmes at the West Africa Civil Society
Institute (WACSI) as part of the process of strengthening the Secretariat. The Technical
Manager participated in a Resource Mobilisation and Proposal Writing course. The object of
the training programme was to build the capacity of the Technical Manager to identify gaps
in resources for sustainable programme intervention; to understand the diverse sources of
funds and how to mobilise resources. The Finance and Administration Manager on the other
hand participated in a one week training course on Financial and Grants Management. It is
expected that both staff will use the skills and information gained to improve processes and
programmes at the Secretariat in addition to raising funds for PIAC’s activities. The training
programme will assist the Finance Manager better administer donor grants and strengthen
his skills at managing PIAC Finances as a whole. The Technical Officer together with the
representative of the National House of Chiefs, Osabarima Kwaw Entsie II, also attended the
2016 Summer School.
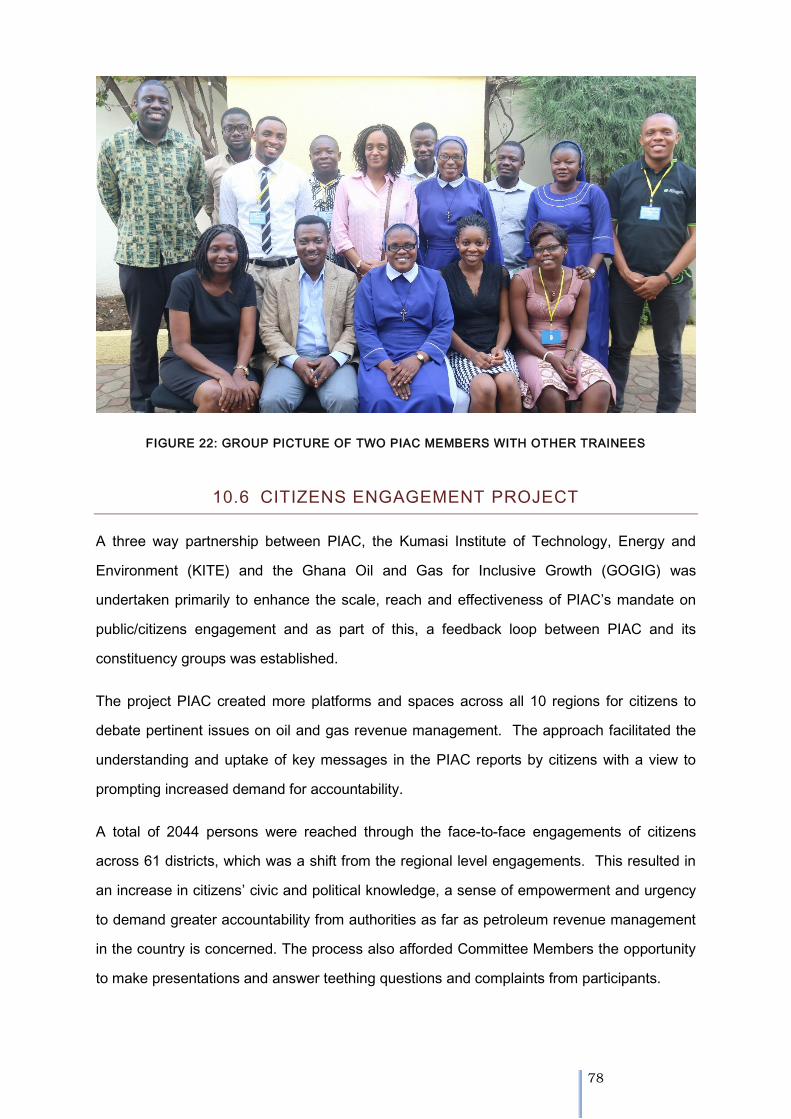
78
FIGURE 22: GROUP PICTURE OF TWO PIAC MEMBERS WITH OTHER TRAINEES
10.6 CITIZENS ENGAGEMENT PROJECT
A three way partnership between PIAC, the Kumasi Institute of Technology, Energy and
Environment (KITE) and the Ghana Oil and Gas for Inclusive Growth (GOGIG) was
undertaken primarily to enhance the scale, reach and effectiveness of PIAC’s mandate on
public/citizens engagement and as part of this, a feedback loop between PIAC and its
constituency groups was established.
The project PIAC created more platforms and spaces across all 10 regions for citizens to
debate pertinent issues on oil and gas revenue management. The approach facilitated the
understanding and uptake of key messages in the PIAC reports by citizens with a view to
prompting increased demand for accountability.
A total of 2044 persons were reached through the face-to-face engagements of citizens
across 61 districts, which was a shift from the regional level engagements. This resulted in
an increase in citizens’ civic and political knowledge, a sense of empowerment and urgency
to demand greater accountability from authorities as far as petroleum revenue management
in the country is concerned. The process also afforded Committee Members the opportunity
to make presentations and answer teething questions and complaints from participants.
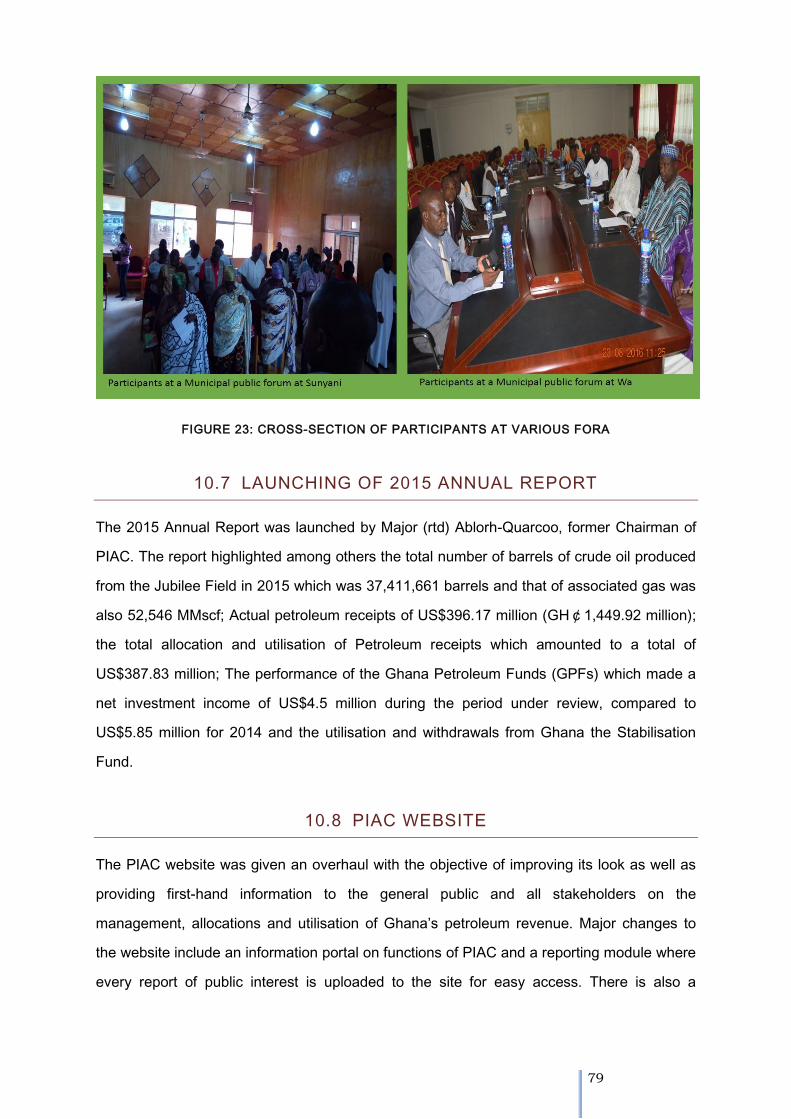
79
FIGURE 23: CROSS-SECTION OF PARTICIPANTS AT VARIOUS FORA
10.7 LAUNCHING OF 2015 ANNUAL REPORT
The 2015 Annual Report was launched by Major (rtd) Ablorh-Quarcoo, former Chairman of
PIAC. The report highlighted among others the total number of barrels of crude oil produced
from the Jubilee Field in 2015 which was 37,411,661 barrels and that of associated gas was
also 52,546 MMscf; Actual petroleum receipts of US$396.17 million (GH¢1,449.92 million);
the total allocation and utilisation of Petroleum receipts which amounted to a total of
US$387.83 million; The performance of the Ghana Petroleum Funds (GPFs) which made a
net investment income of US$4.5 million during the period under review, compared to
US$5.85 million for 2014 and the utilisation and withdrawals from Ghana the Stabilisation
Fund.
10.8 PIAC WEBSITE
The PIAC website was given an overhaul with the objective of improving its look as well as
providing first-hand information to the general public and all stakeholders on the
management, allocations and utilisation of Ghana’s petroleum revenue. Major changes to
the website include an information portal on functions of PIAC and a reporting module where
every report of public interest is uploaded to the site for easy access. There is also a
80
feedback module for whistle blowers to send information on perceived corruption without
blowing their cover and a newsletter module for the general public and stakeholders to
enable them receive free monthly and quarterly subscription information on the activities of
PIAC. A ‘statistics’ portal has also been added to provide detailed data on petroleum
production, liftings, receipts and allocation, payment of Corporate Income Taxes (CIT) by
companies, returns on the Ghana Petroleum Funds (GPFs), ABFA distribution, allocation,
utilisation and projects.
10.9 CONSULTATION WITH THE GHANA NATIONAL PETROLEUM
CORPORATION (GNPC)
A consultative interaction between PIAC and the GNPC was held in April 2016. The purpose
of the meeting was to deepen collaboration with GNPC and to explore efficient ways of
obtaining reports on their activities. The Acting Chief Executive of GNPC, Mr. Alex Mould
and 12 members of the Senior Management team participated in the consultation.
10.10 CONSULTATION WITH IFEJ
A media Interaction between PIAC and members of IFEJ (International Federation of
Economic Journalists) took place in Koforidua in the year under review. The Committee was
represented by Dr Steve Manteaw and Mr Mohammed Affum. The PIAC Secretariat was
represented by the Technical Manager, Mark Agyemang.
The interaction, organised by GIZ was to give the journalists an opportunity to interrogate the
2015 Annual Report of PIAC. Secondly, it was to provide the journalists an understanding of
the report and to carry out a critical analysis of it to the citizenry through their various media
outlets.
10.11 MEETINGS WITH PARLIAMENTARY SELECT COMMITTEES
During the period under review, a meeting was held with the Finance Committee of
Parliament focusing on PIAC’s 2014 Annual Report, specifically to explore ways of
implementing PIAC recommendations and challenges facing PIAC as a whole. PIAC also
held consultations with the Public Accounts Committee of Parliament, with representation

81
from selected Members of the Committee on, Mines & Energy and Finance. In attendance
were six members of PIAC including the Chairman and Vice and three secretariat staff.
Other Parliamentary Service staff as well as representatives from GIZ was also present. The
consultation covered the 2014 PIAC reports.
10.12 FINANCIAL REPORT
The Public Interest and Accountability Committee (PIAC) presented a budget of GHC
1,162,435 for year 2016 to the Government of Ghana. An allocation of GHC 967,000 was
made by the Government from the Annual Budget Funding Amount in compliance with
Amended Petroleum Revenue Management Act, 2015 (Act 893) and the same was released
for the programmes and activities of the Committee.
Additionally, the Ministry of Finance released an amount of GHC 379,051 in year 2016 in
respect of the Committee’s budget for year 2015.
The Committee notes with commendation to the Government of Ghana the 46.7% increase
in its allocation to the Committee for year 2016 over that of 2015.
The Committee continues to receive complementary financial support from the donor
community for its programmes and activities. Notable are British Department for International
Development/Natural Resource Governance Institute (DFID/NRGI), the Ghana Oil and Gas
for Inclusive Growth (GOGIG) and the German Development Cooperation (GIZ).
82
REFERENCES
Anadarko, 2017. Providing for Today: Investing for Tomorrow. 2016 Annual Report
BOG, 2017, Petroleum Holding Fund and Ghana Petroleum Fund, Semi Annual Report, July
1 – December 31, 2016
BOG, 2016, Petroleum Holding Fund and Ghana Petroleum Fund, Semi Annual Report,
January – June 30, 2016
GNGC, 2017, Ghana National Gas Company Operations Report to PIAC (January-
December 2016)’
GNPC, 2017, ‘Report on Petroleum Operations (January to December, 2016), Submitted to
PIAC
GRA, 2017, Summary of Payments into the PHF: January-December 2016
Kosmos Energy, 2017. 2016 Annual Report
Ministry of Finance, 2017 “2017 Budget Statement and Economic Policy”
Ministry of Finance, 2017, Annual and Reconciliation Report on Petroleum Holding Funds
Petroleum Commission, 2017. “Petroleum Revenue Report, January-December”, 2016,
Report Submitted to PIAC
Petroleum Revenue Management Act, 2010 (Act, 815)
Petroleum Revenue Management (Amended) Act, 2015 (Act, 893)
Tullow Oil Plc, 2017. 2016 Full Year Report
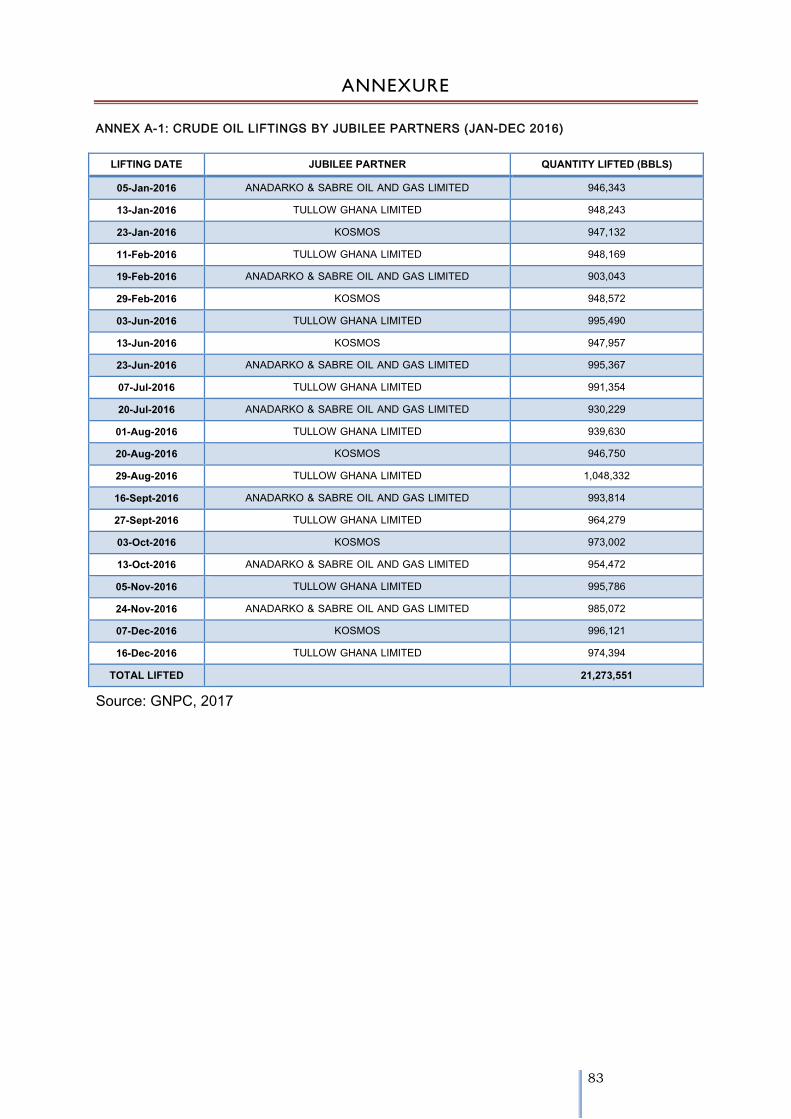
83
ANNEXURE
ANNEX A-1: CRUDE OIL LIFTINGS BY JUBILEE PARTNERS (JAN-DEC 2016)
LIFTING DATE JUBILEE PARTNER QUANTITY LIFTED (BBLS)
05-Jan-2016 ANADARKO & SABRE OIL AND GAS LIMITED 946,343 13-Jan-2016 TULLOW GHANA LIMITED 948,243 23-Jan-2016 KOSMOS 947,132 11-Feb-2016 TULLOW GHANA LIMITED 948,169 19-Feb-2016 ANADARKO & SABRE OIL AND GAS LIMITED 903,043 29-Feb-2016 KOSMOS 948,572
03-Jun-2016 TULLOW GHANA LIMITED 995,490 13-Jun-2016 KOSMOS 947,957 23-Jun-2016 ANADARKO & SABRE OIL AND GAS LIMITED 995,367 07-Jul-2016 TULLOW GHANA LIMITED 991,354 20-Jul-2016 ANADARKO & SABRE OIL AND GAS LIMITED 930,229 01-Aug-2016 TULLOW GHANA LIMITED 939,630 20-Aug-2016 KOSMOS 946,750 29-Aug-2016 TULLOW GHANA LIMITED 1,048,332 16-Sept-2016 ANADARKO & SABRE OIL AND GAS LIMITED 993,814 27-Sept-2016 TULLOW GHANA LIMITED 964,279 03-Oct-2016 KOSMOS 973,002 13-Oct-2016 ANADARKO & SABRE OIL AND GAS LIMITED 954,472 05-Nov-2016 TULLOW GHANA LIMITED 995,786 24-Nov-2016 ANADARKO & SABRE OIL AND GAS LIMITED 985,072 07-Dec-2016 KOSMOS 996,121 16-Dec-2016 TULLOW GHANA LIMITED 974,394
TOTAL LIFTED 21,273,551
Source: GNPC, 2017
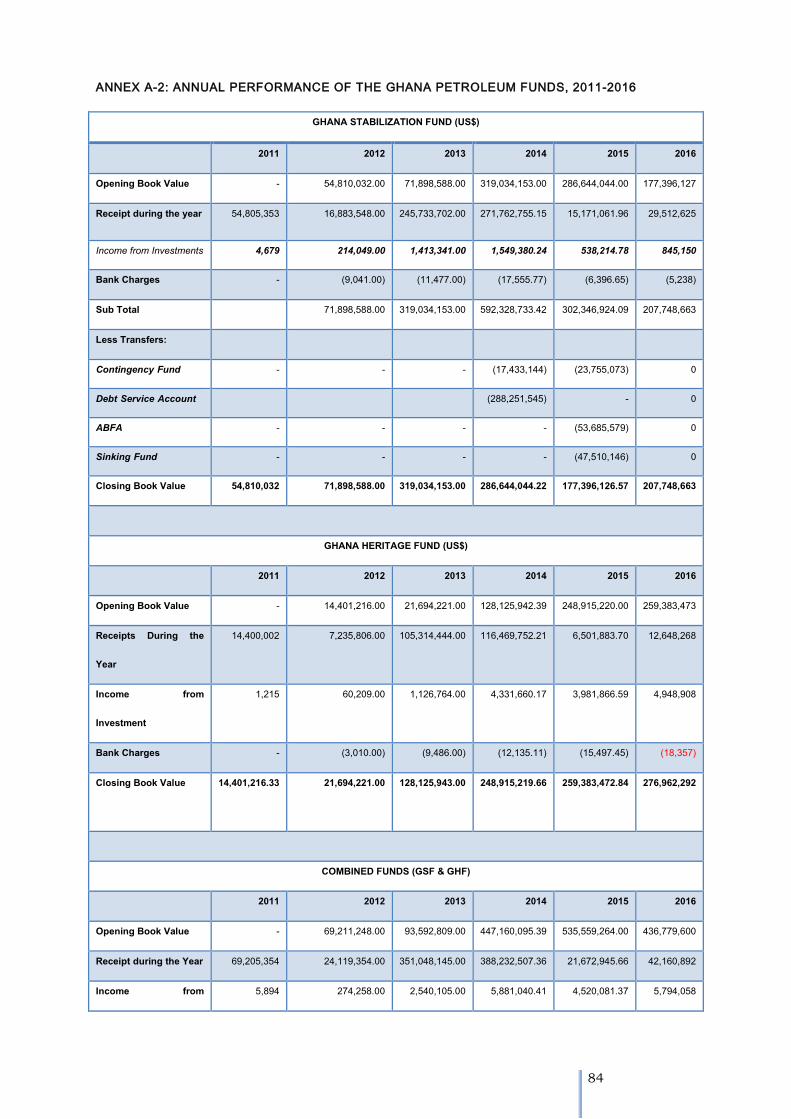
84
ANNEX A-2: ANNUAL PERFORMANCE OF THE GHANA PETROLEUM FUNDS, 2011-2016
GHANA STABILIZATION FUND (US$)
2011 2012 2013 2014 2015 2016
Opening Book Value - 54,810,032.00 71,898,588.00 319,034,153.00 286,644,044.00 177,396,127
Receipt during the year 54,805,353 16,883,548.00 245,733,702.00 271,762,755.15 15,171,061.96 29,512,625
Income from Investments 4,679 214,049.00 1,413,341.00 1,549,380.24 538,214.78 845,150
Bank Charges - (9,041.00) (11,477.00) (17,555.77) (6,396.65) (5,238)
Sub Total 71,898,588.00 319,034,153.00 592,328,733.42 302,346,924.09 207,748,663
Less Transfers:
Contingency Fund - - - (17,433,144) (23,755,073) 0
Debt Service Account (288,251,545) - 0
ABFA - - - - (53,685,579) 0
Sinking Fund - - - - (47,510,146) 0
Closing Book Value 54,810,032 71,898,588.00 319,034,153.00 286,644,044.22 177,396,126.57 207,748,663
GHANA HERITAGE FUND (US$)
2011 2012 2013 2014 2015 2016
Opening Book Value - 14,401,216.00 21,694,221.00 128,125,942.39 248,915,220.00 259,383,473
Receipts During the
Year
14,400,002 7,235,806.00 105,314,444.00 116,469,752.21 6,501,883.70 12,648,268
Income from
Investment
1,215 60,209.00 1,126,764.00 4,331,660.17 3,981,866.59 4,948,908
Bank Charges - (3,010.00) (9,486.00) (12,135.11) (15,497.45) (18,357)
Closing Book Value 14,401,216.33 21,694,221.00
128,125,943.00 248,915,219.66 259,383,472.84 276,962,292
COMBINED FUNDS (GSF & GHF)
2011 2012 2013 2014 2015 2016
Opening Book Value - 69,211,248.00 93,592,809.00 447,160,095.39 535,559,264.00 436,779,600
Receipt during the Year 69,205,354 24,119,354.00 351,048,145.00 388,232,507.36 21,672,945.66 42,160,892
Income from 5,894 274,258.00 2,540,105.00 5,881,040.41 4,520,081.37 5,794,058

85
Investments
Bank Charges - (12,051.00) (20,963.00) (29,691.88) (21,894.10) (23,595)
Sub-Total 69,211,248 93,592,809.00 447,160,096.00 841,243,952.28 561,730,396.93 484,710,955
Less Transfer to:
Contingency Fund - - - (17,433,144) (23,755.072.85) -
Debt Servicing
Account
0.00 0.00 0.00 (288,251,545)
0.00 0.00
ABFA 0.00 0.00 0.00 (53,685,578.98) 0.00
Sinking Fund 0.00 0.00 0.00 0.00 (47,510,145.69) 0.00
Closing Book Value 69,211,248 93,592,809.00 447,160,096.00 535,559,263.88 436,779,599.41 484,710,955
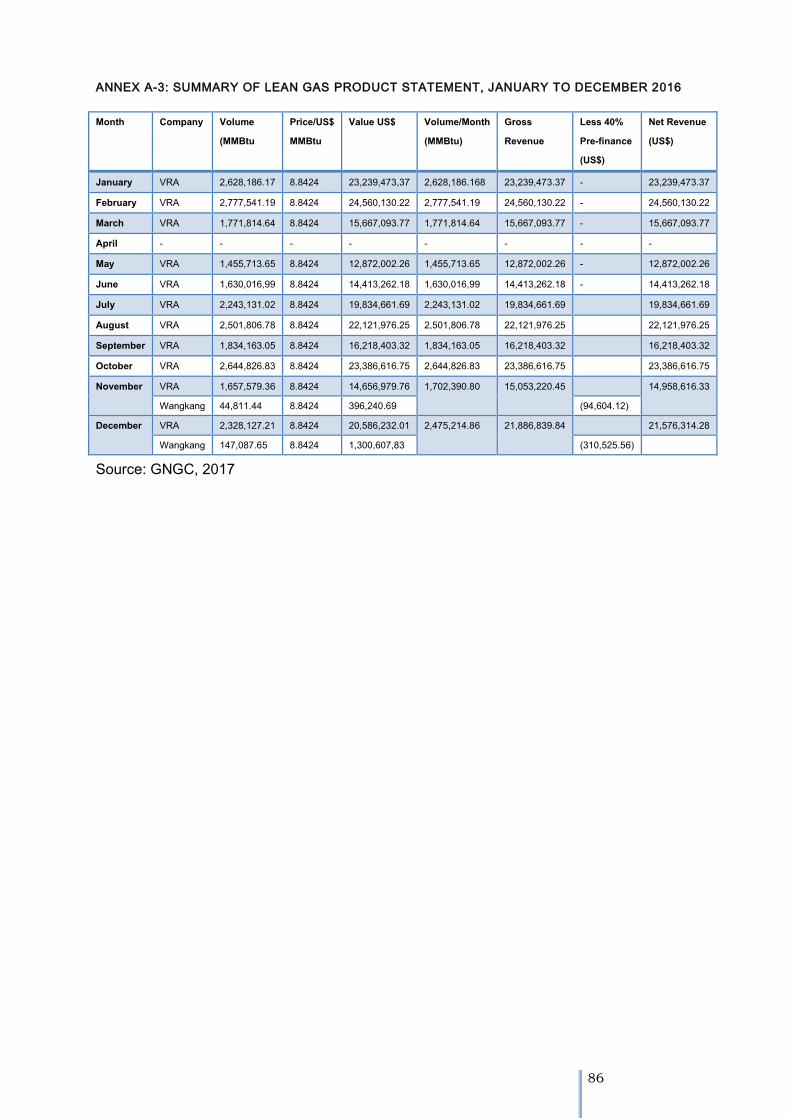
86
ANNEX A-3: SUMMARY OF LEAN GAS PRODUCT STATEMENT, JANUARY TO DECEMBER 2016
Month Company Volume (MMBtu
Price/US$ MMBtu
Value US$ Volume/Month (MMBtu)
Gross Revenue
Less 40% Pre-finance (US$)
Net Revenue (US$)
January VRA 2,628,186.17 8.8424 23,239,473,37 2,628,186.168 23,239,473.37 - 23,239,473.37 February VRA 2,777,541.19 8.8424 24,560,130.22 2,777,541.19 24,560,130.22 - 24,560,130.22 March VRA 1,771,814.64 8.8424 15,667,093.77 1,771,814.64 15,667,093.77 - 15,667,093.77 April - - - - - - - - May VRA 1,455,713.65 8.8424 12,872,002.26 1,455,713.65 12,872,002.26 - 12,872,002.26 June VRA 1,630,016,99 8.8424 14,413,262.18 1,630,016,99 14,413,262.18 - 14,413,262.18 July VRA 2,243,131.02 8.8424 19,834,661.69 2,243,131.02 19,834,661.69 19,834,661.69 August VRA 2,501,806.78 8.8424 22,121,976.25 2,501,806.78 22,121,976.25 22,121,976.25 September VRA 1,834,163.05 8.8424 16,218,403.32 1,834,163.05 16,218,403.32 16,218,403.32 October VRA 2,644,826.83 8.8424 23,386,616.75 2,644,826.83 23,386,616.75 23,386,616.75 November VRA 1,657,579.36 8.8424 14,656,979.76 1,702,390.80 15,053,220.45 14,958,616.33
Wangkang 44,811.44 8.8424 396,240.69 (94,604.12) December VRA 2,328,127.21 8.8424 20,586,232.01 2,475,214.86 21,886,839.84 21,576,314.28
Wangkang 147,087.65 8.8424 1,300,607,83 (310,525.56)
Source: GNGC, 2017
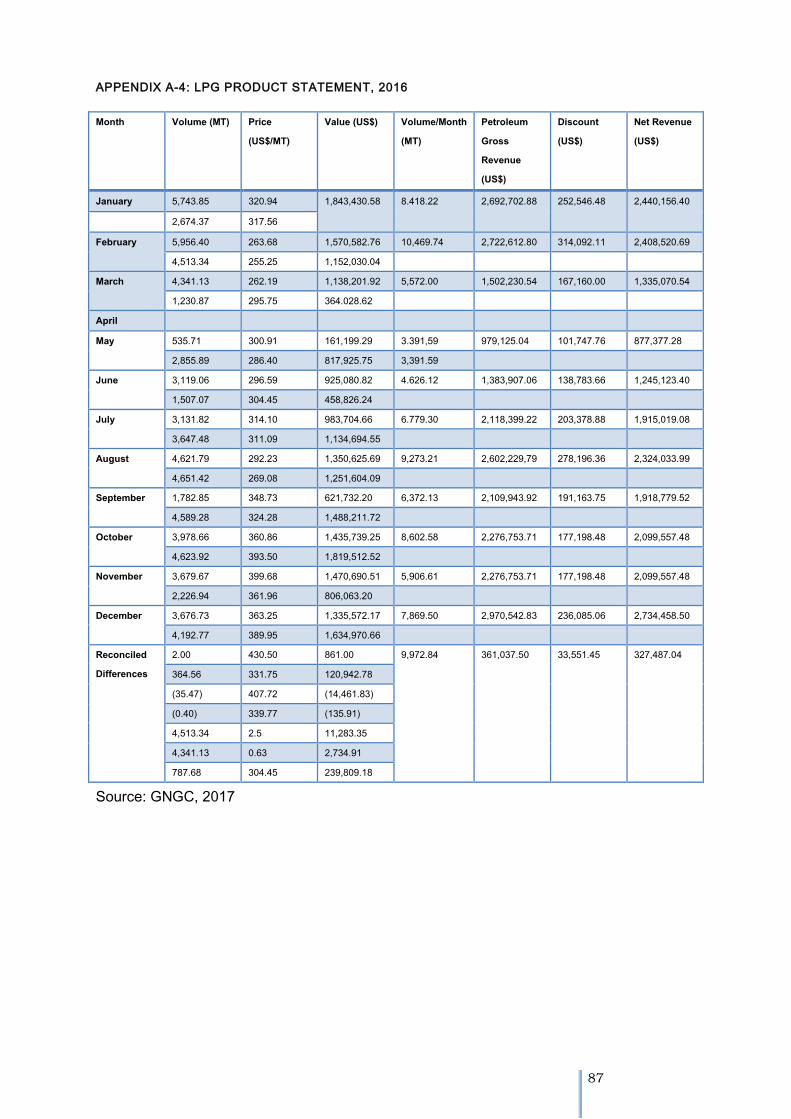
87
APPENDIX A-4: LPG PRODUCT STATEMENT, 2016
Month Volume (MT) Price (US$/MT)
Value (US$) Volume/Month (MT)
Petroleum Gross Revenue (US$)
Discount (US$)
Net Revenue (US$)
January 5,743.85 320.94 1,843,430.58 8.418.22 2,692,702.88 252,546.48 2,440,156.40 2,674.37 317.56 February 5,956.40 263.68 1,570,582.76 10,469.74 2,722,612.80 314,092.11 2,408,520.69
4,513.34 255.25 1,152,030.04 March 4,341.13 262.19 1,138,201.92 5,572.00 1,502,230.54 167,160.00 1,335,070.54
1,230.87 295.75 364.028.62 April May 535.71 300.91 161,199.29 3.391,59 979,125.04 101,747.76 877,377.28
2,855.89 286.40 817,925.75 3,391.59 June 3,119.06 296.59 925,080.82 4.626.12 1,383,907.06 138,783.66 1,245,123.40
1,507.07 304.45 458,826.24 July 3,131.82 314.10 983,704.66 6.779.30 2,118,399.22 203,378.88 1,915,019.08
3,647.48 311.09 1,134,694.55 August 4,621.79 292.23 1,350,625.69 9,273.21 2,602,229,79 278,196.36 2,324,033.99
4,651.42 269.08 1,251,604.09 September 1,782.85 348.73 621,732.20 6,372.13 2,109,943.92 191,163.75 1,918,779.52
4,589.28 324.28 1,488,211.72 October 3,978.66 360.86 1,435,739.25 8,602.58 2,276,753.71 177,198.48 2,099,557.48
4,623.92 393.50 1,819,512.52 November 3,679.67 399.68 1,470,690.51 5,906.61 2,276,753.71 177,198.48 2,099,557.48
2,226.94 361.96 806,063.20 December 3,676.73 363.25 1,335,572.17 7,869.50 2,970,542.83 236,085.06 2,734,458.50
4,192.77 389.95 1,634,970.66 Reconciled Differences
2.00 430.50 861.00 9,972.84 361,037.50 33,551.45 327,487.04 364.56 331.75 120,942.78 (35.47) 407.72 (14,461.83) (0.40) 339.77 (135.91) 4,513.34 2.5 11,283.35 4,341.13 0.63 2,734.91 787.68 304.45 239,809.18
Source: GNGC, 2017
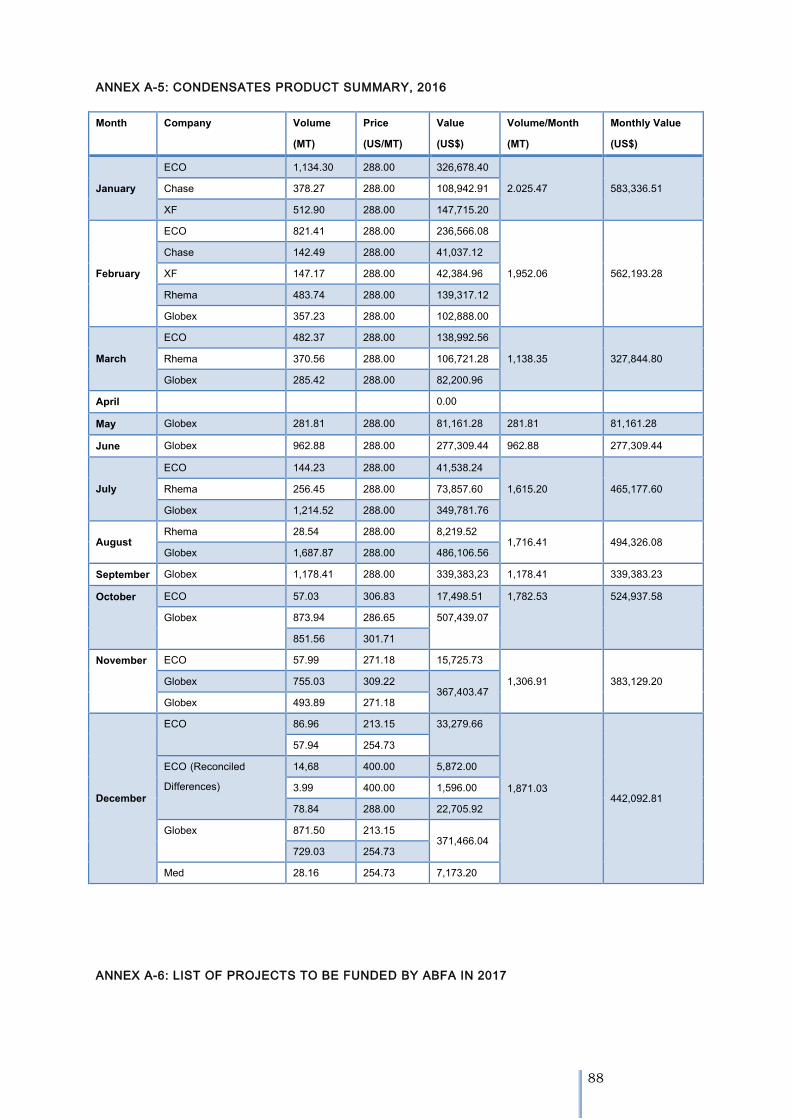
88
ANNEX A-5: CONDENSATES PRODUCT SUMMARY, 2016
Month Company Volume (MT)
Price (US/MT)
Value (US$)
Volume/Month (MT)
Monthly Value (US$)
January ECO 1,134.30 288.00 326,678.40
2.025.47 583,336.51 Chase 378.27 288.00 108,942.91 XF 512.90 288.00 147,715.20
February
ECO 821.41 288.00 236,566.08
1,952.06 562,193.28 Chase 142.49 288.00 41,037.12 XF 147.17 288.00 42,384.96 Rhema 483.74 288.00 139,317.12 Globex 357.23 288.00 102,888.00
March ECO 482.37 288.00 138,992.56
1,138.35 327,844.80 Rhema 370.56 288.00 106,721.28 Globex 285.42 288.00 82,200.96
April 0.00 May Globex 281.81 288.00 81,161.28 281.81 81,161.28 June Globex 962.88 288.00 277,309.44 962.88 277,309.44
July ECO 144.23 288.00 41,538.24
1,615.20 465,177.60 Rhema 256.45 288.00 73,857.60 Globex 1,214.52 288.00 349,781.76
August Rhema 28.54 288.00 8,219.52
1,716.41 494,326.08 Globex 1,687.87 288.00 486,106.56
September Globex 1,178.41 288.00 339,383,23 1,178.41 339,383.23 October ECO 57.03 306.83 17,498.51 1,782.53 524,937.58
Globex 873.94 286.65 507,439.07 851.56 301.71
November ECO 57.99 271.18 15,725.73 1,306.91 383,129.20 Globex 755.03 309.22
367,403.47 Globex 493.89 271.18
December
ECO 86.96 213.15 33,279.66
1,871.03
442,092.81
57.94 254.73 ECO (Reconciled Differences)
14,68 400.00 5,872.00 3.99 400.00 1,596.00 78.84 288.00 22,705.92
Globex 871.50 213.15 371,466.04
729.03 254.73 Med 28.16 254.73 7,173.20
ANNEX A-6: LIST OF PROJECTS TO BE FUNDED BY ABFA IN 2017
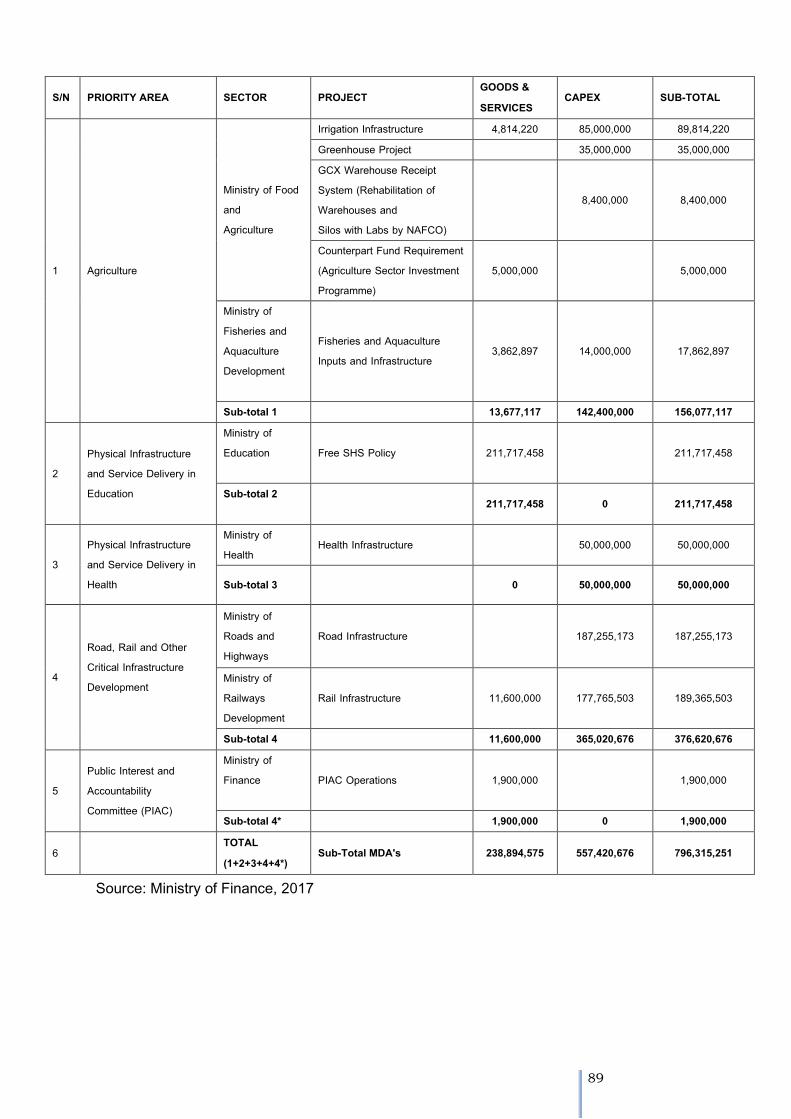
89
S/N PRIORITY AREA SECTOR PROJECT GOODS & SERVICES
CAPEX SUB-TOTAL
1 Agriculture
Ministry of Food and Agriculture
Irrigation Infrastructure 4,814,220 85,000,000 89,814,220 Greenhouse Project 35,000,000 35,000,000 GCX Warehouse Receipt System (Rehabilitation of Warehouses and Silos with Labs by NAFCO)
8,400,000 8,400,000
Counterpart Fund Requirement (Agriculture Sector Investment Programme)
5,000,000 5,000,000
Ministry of Fisheries and Aquaculture Development
Fisheries and Aquaculture Inputs and Infrastructure
3,862,897 14,000,000 17,862,897
Sub-total 1 13,677,117 142,400,000 156,077,117
2 Physical Infrastructure and Service Delivery in Education
Ministry of Education
Free SHS Policy 211,717,458 211,717,458
Sub-total 2
211,717,458 0 211,717,458
3 Physical Infrastructure and Service Delivery in Health
Ministry of Health
Health Infrastructure 50,000,000 50,000,000
Sub-total 3 0 50,000,000 50,000,000
4
Road, Rail and Other Critical Infrastructure Development
Ministry of Roads and Highways
Road Infrastructure 187,255,173 187,255,173
Ministry of Railways Development
Rail Infrastructure 11,600,000 177,765,503 189,365,503
Sub-total 4 11,600,000 365,020,676 376,620,676
5 Public Interest and Accountability Committee (PIAC)
Ministry of Finance
PIAC Operations 1,900,000 1,900,000
Sub-total 4* 1,900,000 0 1,900,000
6 TOTAL (1+2+3+4+4*)
Sub-Total MDA's 238,894,575 557,420,676 796,315,251
Source: Ministry of Finance, 2017

90