public utilities commission of the state of … · use a competitive process for contracted...
TRANSCRIPT

BEFORE THE PUBLIC UTILITIES COMMISSIONOF THE STATE OF CALIFORNIA
Order Instituting Rulemaking on the Commission’s Own Motion to Adopt New Safety and Reliability Regulations for Natural Gas Transmission and Distribution Pipelines and Related Ratemaking Mechanisms
(U 39 G)
Rulemaking 11-02-019
PACIFIC GAS AND ELECTRIC COMPANY’S NATURAL GAS TRANSMISSION PIPELINE REPLACEMENT OR TESTING IMPLEMENTATION PLAN
WILLIAM V. MANHEIMKERRY C. KLEIN
Pacific Gas and Electric Company77 Beale Street, B30ASan Francisco, CA 94105Telephone: (415) 973-6628Facsimile: (415) 973-5520E-Mail: [email protected]
Attorneys forPACIFIC GAS AND ELECTRIC COMPANY
Dated: August 26, 2011

TABLE OF CONTENTS
Page
-i-
I. INTRODUCTION ............................................................................................................. 1
II. PIPELINE MODERNIZATION PROGRAM................................................................... 7
A. Introduction and Overview .................................................................................... 7
B. Pipeline Pressure Testing And Replacement Plan ................................................. 8
1. Pipeline Threat Model And Methodology ................................................. 8
2. Decision Tree, Manufacturing Threats .................................................... 10
3. Decision Tree, Fabrication And Construction Threats ............................ 12
4. Decision Tree, Corrosion And Latent Mechanical Damage Threats ....... 14
5. Prioritization Of Segments For Pressure Testing Or Replacement ......... 15
6. Decision Tree Results – Work To Be Completed By The Pipeline Modernization Program ........................................................................... 17
7. Strength Testing ....................................................................................... 18
a. Phase 1 Strength Testing.............................................................. 19
b. Phase 2 Strength Testing.............................................................. 19
8. Pipeline Replacement............................................................................... 19
a. Phase 1 Pipeline Replacement ..................................................... 19
b. Phase 2 Pipeline Replacement ..................................................... 20
9. In-Line Inspection.................................................................................... 21
III. VALVE AUTOMATION PROGRAM ........................................................................... 21
A. Introduction and Overview .................................................................................. 21
B. Pipe Segment Selection for Automation.............................................................. 22
1. Criteria For Installation of RCVs In Highly Populated Areas................. 23
2. Criteria For Installation of ASVs at Earthquake Fault Crossings............ 24
C. Automated Valve Spacing ................................................................................... 26
D. Pipe Segment Prioritization ................................................................................. 27
E. Phase 1 Valve Installations .................................................................................. 28
F. SCADA Enhancements........................................................................................ 30
G. Phase 1 Valve Automation Program Costs.......................................................... 31
IV. PIPELINE RECORDS INTEGRATION PROGRAM.................................................... 32
A. Introduction and Overview .................................................................................. 32

TABLE OF CONTENTS(continued)
Page
-ii-
B. MAOP Project...................................................................................................... 33
C. Gas Transmission Asset Management Project..................................................... 33
V. INTERIM SAFETY ENHANCEMENT MEASURES................................................... 35
A. Introduction and Overview .................................................................................. 35
B. Interim Pressure Reductions as an Interim Safety Enhancement Measure.......... 35
C. Increased Leak Surveys and Patrols As Interim Safety Enhancement Measures .............................................................................................................. 36
VI. REPORTING REQUIREMENTS ................................................................................... 37
VII. COST ESTIMATE AND RATEMAKING PROPOSAL................................................ 39
A. Introduction and Overview .................................................................................. 39
B. Phase 1 Cost Recovery......................................................................................... 39
C. Balancing Accounts ............................................................................................. 41
1. Backbone Subaccount.............................................................................. 42
2. Local Transmission Subaccount .............................................................. 42
3. Storage Subaccount.................................................................................. 43
D. Natural Gas Transmission Pipeline Safety and Reliability Memorandum Account (NGTPRSMA)....................................................................................... 43
E. Advice Letter to Adjust Approved Spend Forecasts............................................ 44
F. Cost Estimates and Revenue Requirements......................................................... 44
G. Rates..................................................................................................................... 46
1. Cost Allocation ........................................................................................ 46
2. Rate Proposal ........................................................................................... 47
VIII. NOTICE AND SERVICE................................................................................................ 48
IX. EXHIBITS ....................................................................................................................... 49
X. CONCLUSION................................................................................................................ 50
1
BEFORE THEPUBLIC UTILITIES COMMISSIONOF THE STATE OF CALIFORNIA
Order Instituting Rulemaking on the Commission’s Own Motion to Adopt New Safety and Reliability Regulations for Natural Gas Transmission and Distribution Pipelines and Related Ratemaking Mechanisms
(U 39 G)
Rulemaking 11-02-019
PACIFIC GAS AND ELECTRIC COMPANY’S NATURAL GAS TRANSMISSION PIPELINE REPLACEMENT OR TESTING IMPLEMENTATION PLAN
I. INTRODUCTION
Pacific Gas and Electric Company (“PG&E”) files this Natural Gas Transmission
Pipeline Replacement or Testing Implementation Plan (“Pipeline Safety Enhancement Plan” or
“Implementation Plan”) in compliance with Decision 11-06-017, issued June 9, 2011 by the
California Public Utilities Commission (“CPUC” or “Commission”) with the goal of enhancing
safety and improving operations. Ultimately, when the Pipeline Safety Enhancement Plan is
completed, PG&E will have comprehensively assessed all 5,786 miles of its natural gas
transmission pipelines. This Pipeline Safety Enhancement Plan represents a clear break from the
way California and its utilities approached pipeline safety in the past, and the way it will be
approached in the future. The result of this effort will be tougher, safer standards for pipeline
safety that will better serve PG&E’s customers and the public.
Gas pipeline infrastructure in California and across the United States contains a wide
range of pipeline types and vintages. Like other parts of our country’s infrastructure, natural gas
transmission pipelines were generally constructed with the best available design tools,
technology, materials, and techniques. Over time, as those methods and materials improved, the
2
regulations and codes governing the construction of pipelines have also evolved to require more
effective inspection and control techniques, resulting in better quality and confidence in pipeline
integrity. One of those changes, adopted by federal regulators in 1970, required all new gas
transmission lines to have their Maximum Allowable Operating Pressure (“MAOP”) established
through rigorous pressure testing and records validation. However, the regulation
“grandfathered” older pipelines, allowing their MAOP to be set according to their actual
operating pressure over the previous five years. Following the San Bruno accident, the
Commission has rightly insisted on a more rigorous standard for older pipelines. PG&E fully
supports this new direction. Based on this order, PG&E has undertaken a massive and
unprecedented program to pressure test or replace every pipeline without complete pressure test
records and validate the MAOP of older pipelines through a rigorous, records-based analysis.
The actions and investments outlined in the Pipeline Safety Enhancement Plan are the
roadmap for taking PG&E’s pipeline safety to this new level. There are four main components
to PG&E’s Pipeline Safety Enhancement Plan:
(1) Pipeline Modernization – PG&E will establish a known margin of safety on every
gas transmission pipeline segment and verify pipeline integrity through strength testing, pipeline
replacement and pressure reductions, and will retrofit pipelines to accommodate the use of In
Line Inspection (“ILI”) tools.
(2) Valve Automation – PG&E will install automated valves in highly populated
areas and where pipelines cross active seismic faults so gas can be remotely or automatically
shut off in the event of a pipeline rupture. In addition, PG&E will upgrade its Supervisory
Control and Data Acquisition (“SCADA”) system to allow operators in its Gas Control Center to
quickly detect a rupture and isolate nearby sections of pipeline.

3
(3) Pipeline Records Integration – PG&E proposes to transition away from reliance
on traditional paper records and move to a fully electronic asset management system. PG&E
will consolidate its gas transmission pipeline data and records systems, collect and verify all
pipeline strength tests and pipeline features data necessary to calculate the MAOP for all gas
transmission pipelines and associated components, and implement a new, electronic data
management system that will enhance system operations, maintenance, inspections and
regulatory compliance.
(4) Interim Safety Enhancement Measures – To enhance the safety margin of
pipelines prior to testing or replacing them, PG&E has nearly completed MAOP validation for its
HCA pipelines, has already reduced pressure on many pipelines, and increased the number of
patrols and leak surveys. It will expand these interim safety enhancement measures and
complete MAOP validation of its non-HCA pipelines under the Pipeline Safety Enhancement
Plan.
The Pipeline Safety Enhancement Plan has two phases. Phase 1, which has already
begun, will carry through 2014. It targets pipeline segments that are in highly populated urban
areas, have vintage seam welds that do not meet modern manufacturing, fabrication or
construction standards or were “grandfathered” under previous regulations, and have not been
strength tested. During Phase 1, PG&E plans to replace 186 miles of transmission pipelines,
strength test more than 780 miles, retrofit about 200 miles to permit in-line inspections, and in-
line inspect over 200 miles. In addition, 228 gas shut-off valves will be replaced, automated and
upgraded to enable PG&E to remotely or automatically shut off the flow of gas in the event of a
pipe rupture.

4
Phase 2 will begin in 2015 and will target non-strength-tested urban pipelines without
manufacturing threats operating below 30% Specified Minimum Yield Strength (“SMYS”), all
non-High Consequence Area (“HCA”) rural pipelines, and previously strength-tested pipelines
(not tested to 49 CFR Part 192 Subpart J requirements). At its conclusion, PG&E will have
assessed all 5,786 miles of its transmission pipelines and will have implemented industry-leading
safety standards and practices for its entire system. We believe this work, under the CPUC’s
direction, will significantly enhance the integrity and operating safety margin of PG&E’s natural
gas transmission system and restore public confidence in the safety and integrity of PG&E’s gas
operations.
Through both phases of work, PG&E will conduct extensive customer and community
outreach to inform the public, including local government officials, of any field activities that
may impact them. PG&E will strive to minimize customer outages and public disruptions while
working safely and ensuring strict regulatory and environmental compliance.
PG&E will also employ comprehensive program management to ensure quality and
control costs. An External Program Advisory Board, made up of industry experts, will help
monitor and oversee program performance. PG&E will deploy qualified union labor and will
use a competitive process for contracted services.
PG&E seeks Commission approval of the work scope proposed for both Phase 1 and
Phase 2 of the Pipeline Safety Enhancement Plan. However, this filing only requests cost
recovery for Phase 1. Phase 2 timing and cost recovery will be addressed in a subsequent filing
for rates effective January 1, 2015, consistent with PG&E’s Gas Transmission and Storage
(“GT&S”) rate case cycle.
The actions and investments outlined in this Pipeline Safety Enhancement Plan present

5
the roadmap for taking PG&E’s system to the new, higher safety standards being set by the
Commission. When these new standards are in place, California’s pipeline safety rules will be
the strongest in the country. PG&E forecasts spending approximately $2.2 billion to meet these
new standards from 2011-2014, which results in revenue requirements of about $247 million in
2012, $221 million in 2013, and $300 million in 2014.1/ The rate impacts are discussed in
Chapter 10 of PG&E’s prepared testimony, “Cost Allocation and Rates.” Importantly, as shown
on Table 1-1, PG&E’s cost recovery request does not include more than one-half billion dollars
in costs which will be absorbed by PG&E’s shareholders. This shareholder allocation proposal
does not address or resolve the historic recordkeeping issues being investigated by the
Commission in the Gas Records OII.
///
///
///
///
///
///
///
///
///
///
1/ The requested rate adjustment is significantly lower than the total expenditures because: (1) the rate
recovery request has been reduced to reflect PG&E’s shareholder allocation of Pipeline Safety Enhancement Plan costs; and (2) rate recovery for capital projects under the plan will be spread out over the useful lives of the capital assets, typically 40 years or more.

6
TABLE 1-1PACIFIC GAS AND ELECTRIC COMPANY
SUMMARY OF SHAREHOLDER ALLOCATION ($ IN MILLIONS)
Line No. Description 2010 2011 2012 2013 2014 Total
1 2011 Implementation Plan Work (a)2 2011 Expense Forecast (Including
Contingency) – $220.7 – – – $220.73 2011 In-Service Capital-Related Costs – 1.4 – – – 1.4
4 Work On Post-1970s Pipe (b)5 Post-1970 MAOP Validation – 38.5 $36.4 $11.0 – 85.96 Post-1970 Strength Testing – 0.5 6.4 1.7 $3.2 11.8
7 Non-Implementation Plan Activities (c) $63.3 152.1 – – – 215.4
8 Total Shareholder Cost Allocation $63.3 $413.2 $42.8 $12.7 $3.2 $535.2
(a) PG&E proposes to have shareholders absorb all 2011 Pipeline Safety Enhancement Plan costs. Plan costs incurred in 2012-2014 would be eligible for cost recovery.
(b) Any costs for MAOP validation or strength testing of post-1970 pipelines will be absorbed by shareholders. PG&E is only seeking recovery for strength testing and MAOP validation costs for pre-1970 pipelines, which were “grandfathered” under existing federal regulations.
(c) Includes activities such as gathering gas system records and documents, leak survey and repair, emergency response, responding to requests for information and documentation, customer outreach, and supporting the NTSB, CPUC, and IRP investigations. PG&E expects to incur additional costs (at shareholder expense) in 2012-2014 related to these non-implementation plan activities, but does not have a forecast beyond 2011 at this time.
The Pipeline Safety Enhancement Plan also includes a number of procedures and
reporting requirements that increase accountability and ensure that PG&E only receives funding
for capital projects or expenses for projects or work that is completed. This precludes
reallocation of funds earmarked for the Pipeline Safety Enhancement Plan to other utility uses.
PG&E will regularly report to the CPUC and to the public our progress, including expenditures,
budget forecasts and changes in scope and prioritization for projects.
As directed by the CPUC, this Pipeline Safety Enhancement Plan contains PG&E’s
proposed scope of work and prioritized schedule, as well as associated cost estimates and
ratemaking proposals. PG&E also submits prepared testimony and workpapers, which provide
more detail and explain the rationale behind the proposal. PG&E’s cost estimates and project
7
implementation schedule assume that PG&E receives Commission approval of Phase 1 early in
2012.
The Pipeline Safety Enhancement Plan2/ is organized as follows:
Section II: Pipeline Modernization Program Section III: Valve Automation ProgramSection IV: Pipeline Records Integration ProgramSection V: Interim Safety Enhancement MeasuresSection VI: Reporting RequirementsSection VII: Cost Estimate and Ratemaking ProposalSection VIII: Notice and ServiceSection IX: ExhibitsSection X: Conclusion
II. PIPELINE MODERNIZATION PROGRAM
A. Introduction and Overview
PG&E’s Pipeline Modernization Program (“Pipeline Program”) is a multiyear plan to
eliminate the grandfathering for all gas transmission pipelines installed prior to 1970, and to
validate the operating margin of safety on all Department of Transportation (“DOT”)-defined gas
transmission pipelines owned and operated by PG&E in California.
The Pipeline Program proposes to: (1) pressure test or replace all in-service natural gas
transmission pipelines in California that do not have verifiable records of a pressure test in
accordance with 49 CFR section 192.619, excluding subsection 49 CFR 192.619(c); (2) set forth
criteria on which pipeline segments are identified for replacement instead of pressure testing; (3)
provide a priority-ranked schedule for pressure testing and replacement of pipe not previously
pressure tested; and (4) set forth criteria for use in deciding to retrofit pipelines to allow for ILI
tools.
Phase 1 of the Pipeline Program, starting immediately, will focus on pipeline segments
2/ The Pipeline Safety Enhancement Plan is interchangeably referred to as the “Implementation Plan.”

8
that are operating within urban areas without a documented pressure test to 49 CFR 192
Subpart J requirements. It will cover pipeline segments within Class 2, 3, or 4 (whether HCA or
not) and Class 1 HCA. Phase 2 will begin in 2015, and will focus on completing the rest of the
work, primarily on non-strength-tested rural pipelines, urban non-strength-tested pipelines
operating below 30% SMYS, and all previously tested pipelines that were not tested to 49 CFR
Part 192 Subpart J requirements.
The Implementation Plan includes the methodology and criteria to be used to determine
specific actions to be taken on each unique pipe segment, such as strength testing, replacement,
and/or retrofitting for ILI, and a prioritization methodology for completing the work within
Phase 1 and Phase 2. In addition, the Implementation Plan provides a high level summary of the
work proposed for Phase 2. The scope, schedule, and cost recovery for Phase 2 of the Pipeline
Program will be addressed in a future Commission proceeding.
More detailed descriptions, technical bases and cost estimates for the Pipeline Program
work are provided in the accompanying testimony and workpapers supporting Chapter 3, “Gas
Transmission Pipeline Modernization Program.” Cost recovery for Phase 1 work is discussed in
Chapter 8, “Cost Recovery.” In addition, the need for flexibility in the work scope as new and
better information is received about the transmission pipelines, as well as reporting requirements
to track PG&E’s progress against its forecasts, are also discussed in Chapter 8.
B. Pipeline Pressure Testing And Replacement Plan
1. Pipeline Threat Model And Methodology
PG&E’s plan uses a deterministic model (i.e., “if this―then this”) to identify and phase
pipe segments for strength testing or replacement, if they have not been previously tested in
accordance with 49 CFR 192.619, excluding 192.619 (c). The purpose of this approach is to
appropriately schedule work based on the probability of failure for each pipe segment. This

9
methodology was developed by PG&E engineers to address the greatest threats to older
pipelines, in consultation with a leading industry expert, whose report is attached as Exhibit 3C
to the accompanying testimony. The model is based on five industry recognized pipeline threats:
(1) manufacturing-related threats; (2) fabrication and construction-related threats; (3) internal
corrosion; (4) external corrosion; and (5) latent third-party and mechanical damage threats.
Within each threat, additional decision criteria were added, such as verifiable strength testing
records, SMYS at maximum operating pressure (“MOP”), and class location or HCA, to refine
appropriate actions for each pipe segment.
The threat model and decision criteria methodology are contained below in the three
Decision Trees (one for each of the pipeline threats, with internal/external corrosion and latent
mechanical damage combined), and also on a single 11x17 page as Attachment 3A to Chapter 3
of the accompanying testimony. For a complete description of the Decision Tree and
justification for its use, refer to Chapter 3 of the accompanying testimony, “Gas Transmission
Pipeline Modernization Plan.”
The Decision Trees were designed to assess for the threat at the pipe segment level. A
pipe segment is any pipe component with consistent characteristics, such as pipe diameter, wall
thickness, pipe grade, yield strength, year of installation, pipe coating, long seam type, girth joint
type, girth weld method, MOP, HCA, pressure test date, pressure test medium, test pressure, and
class location.
As a key part of the Pipeline Safety Enhancement Plan, every gas transmission pipe
segment, including gas gathering pipe, has been analyzed with the Decision Tree to determine a
recommended action — such as strength test, replacement of pipe, or ILI — to establish a known
margin of safety. Each action is denoted by an “Action Box.” Actions are prioritized as either
10
Phase 1 or Phase 2, as shown below. A brief summary of the decision criteria and recommended
actions derived within each threat category is included below.
2. Decision Tree, Manufacturing Threats
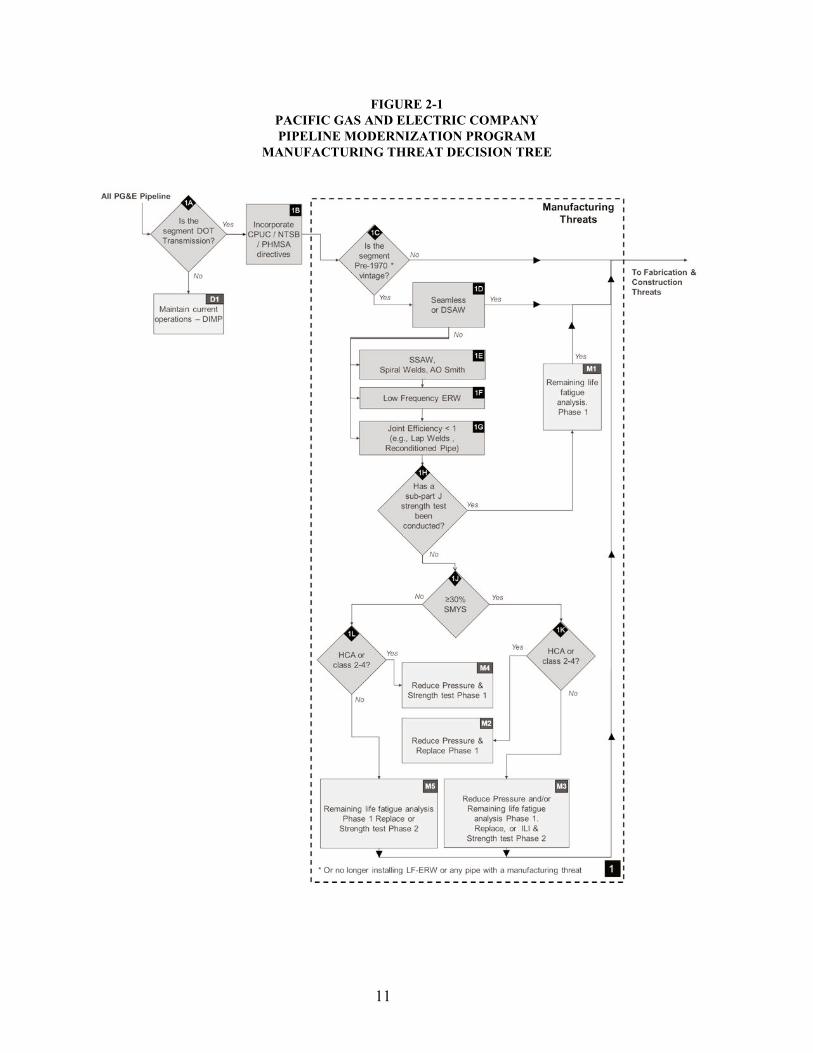
The Decision Tree in Figure 2-1 addresses pipeline manufacturing threats. It identifies
pipe segments whose integrity may be threatened as a result of the methods used to manufacture
the pipe. Pipe vintage, long seam type, and proof of a past strength test are important
considerations in this determination. The stress level at which each segment operates (SMYS at
MOP), and its proximity to people are used to decide whether strength testing or pipe
replacement is the appropriate mitigation measure.
///
///
///
///
///
///
///
///
///
///
///
///
///
///
///
11
FIGURE 2-1PACIFIC GAS AND ELECTRIC COMPANYPIPELINE MODERNIZATION PROGRAM
MANUFACTURING THREAT DECISION TREE

12
3. Decision Tree, Fabrication And Construction Threats
The Decision Tree in Figure 2-2 addresses pipeline fabrication and construction threats,
particularly pipe joining methods and fittings. Pipe vintage, girth weld design and method, and
proof of a past strength test are important considerations. As with manufacturing issues, the
appropriate mitigation measure will depend on the stress level at which the segment operates,
and its proximity to people.
///
///
///
///
///
///
///
///
///
///
///
///
///
///
///
///
///
///

13
FIGURE 2-2PACIFIC GAS AND ELECTRIC COMPANYPIPELINE MODERNIZATION PROGRAM
FABRICATION & CONSTRUCTION THREAT DECISION TREE

14
4. Decision Tree, Corrosion And Latent Mechanical Damage Threats
The Decision Tree shown in Figure 2-3 addresses internal and external corrosion and
latent third-party or mechanical damage.3/ Again, appropriate mitigation measures will depend
on the stress levels at which these segments operate, proximity to people, past pressure testing,
and whether the segment was included in the Transmission Integrity Management Program
(“TIMP”), pursuant to CFR 49 192 Subpart O.
///
///
///
///
///
///
///
///
///
///
///
///
///
///
///
3/ Latent third-party or mechanical damage refers to damage to PG&E pipelines that is unknown to PG&E
because the party that caused the damage was either unaware that the damage occurred, or chose not to report that the damage had occurred.

15
FIGURE 2-3PACIFIC GAS AND ELECTRIC COMPANYPIPELINE MODERNIZATION PROGRAM
CORROSION & LATENT MECHANICAL DAMAGE THREAT DECISION TREE
5. Prioritization Of Segments For Pressure Testing Or Replacement
The Decision Trees provide the foundation for prioritizing the Pipeline Modernization
Plan into two phases. Phase 1 consists of pipe segments within urban areas that have not been
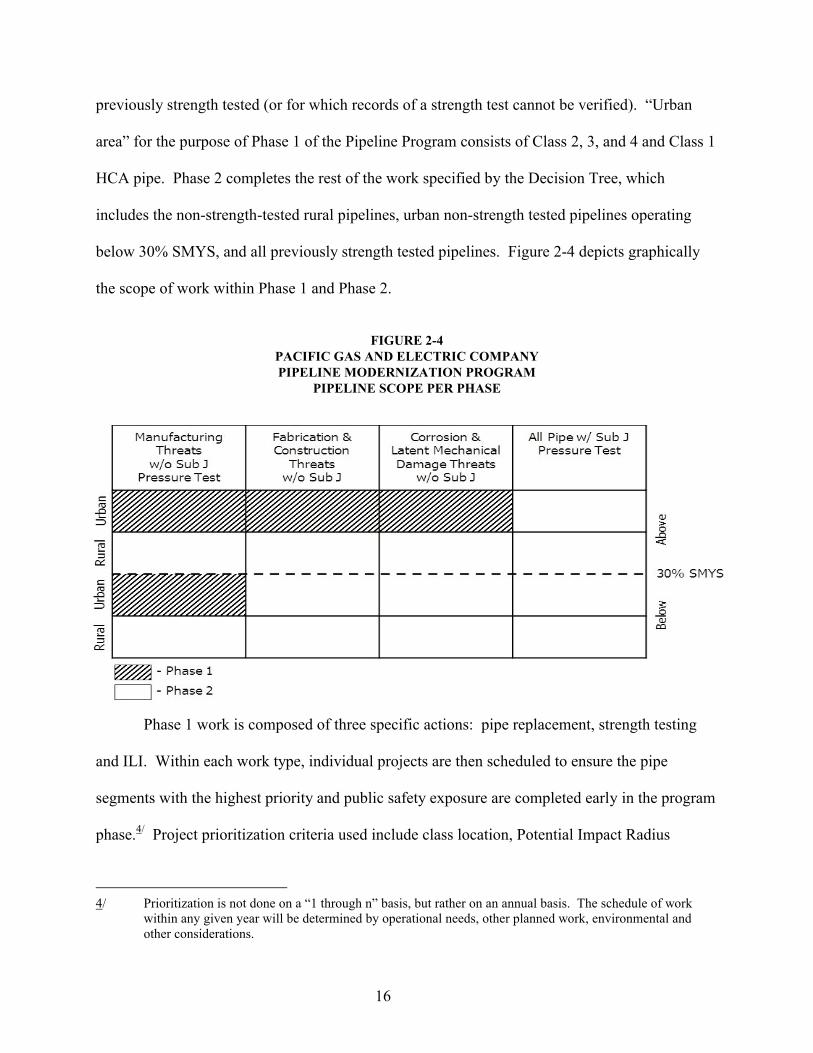
16
previously strength tested (or for which records of a strength test cannot be verified). “Urban
area” for the purpose of Phase 1 of the Pipeline Program consists of Class 2, 3, and 4 and Class 1
HCA pipe. Phase 2 completes the rest of the work specified by the Decision Tree, which
includes the non-strength-tested rural pipelines, urban non-strength tested pipelines operating
below 30% SMYS, and all previously strength tested pipelines. Figure 2-4 depicts graphically
the scope of work within Phase 1 and Phase 2.
FIGURE 2-4PACIFIC GAS AND ELECTRIC COMPANYPIPELINE MODERNIZATION PROGRAM
PIPELINE SCOPE PER PHASE
Phase 1 work is composed of three specific actions: pipe replacement, strength testing
and ILI. Within each work type, individual projects are then scheduled to ensure the pipe
segments with the highest priority and public safety exposure are completed early in the program
phase.4/ Project prioritization criteria used include class location, Potential Impact Radius
4/ Prioritization is not done on a “1 through n” basis, but rather on an annual basis. The schedule of work
within any given year will be determined by operational needs, other planned work, environmental and other considerations.
17
(“PIR”)5/ and inclusion in an HCA, and are discussed in more detail in Chapter 3.
PG&E’s project prioritization model will serve as the basis for developing an annual
project schedule, but the sequence of project completion will change based on other factors such
as public safety, project routing, permitting environmental considerations, efforts to schedule
work to minimize service interruptions to customers, scheduling integration with other planned
work and third party utilities, weather, geographic location, and efficient use and mobilization of
resources.
6. Decision Tree Results – Work To Be Completed By The Pipeline Modernization Program
The Phase 1 scope is based on information from PG&E’s gas transmission Geographic
Information System (“GIS”) and updated pipeline information from the MAOP Records
Validation Project as of June 30, 2011. Due to the inherent uncertainty of estimating these costs
(e.g., unknowns such as land ownership (easement/franchise), biological surveys for threatened
and endangered species and cultural resources, general public and elected official engagement,
construction equipment access and permitting restrictions), PG&E also has included appropriate
contingency requests with this submission. On average, the contingency is about 21% of the
estimated cost. The contingency is addressed in Chapter 7, “Implementation Plan Management
Approach and Estimate Risk Quantification.”
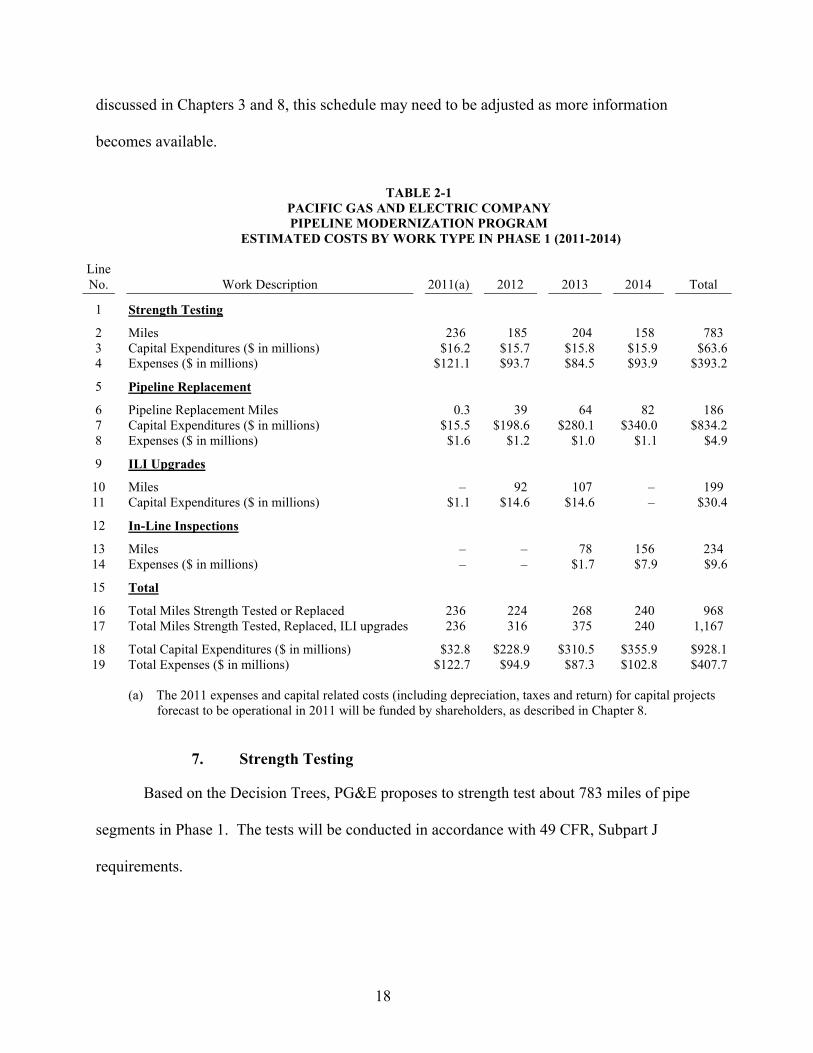
Table 2-1 reflects PG&E’s estimated schedule and costs, without contingency. Project-
specific details are provided in Chapter 3 of the accompanying testimony, “Gas Transmission
Pipeline Modernization Program” and in the associated workpapers and attachments. As
5/ PIR generally refers to the radius of a circle within which the potential failure of a pipeline could have
significant impact on people or property. PIR is a function of the pipe diameter and the pressure of the natural gas in the pipe, and is proportional to the heat intensity of the initial flame should a pipeline rupture ignite.
18
discussed in Chapters 3 and 8, this schedule may need to be adjusted as more information
becomes available.
TABLE 2-1PACIFIC GAS AND ELECTRIC COMPANYPIPELINE MODERNIZATION PROGRAM
ESTIMATED COSTS BY WORK TYPE IN PHASE 1 (2011-2014)
Line No. Work Description 2011(a) 2012 2013 2014 Total
1 Strength Testing
2 Miles 236 185 204 158 7833 Capital Expenditures ($ in millions) $16.2 $15.7 $15.8 $15.9 $63.64 Expenses ($ in millions) $121.1 $93.7 $84.5 $93.9 $393.2
5 Pipeline Replacement
6 Pipeline Replacement Miles 0.3 39 64 82 1867 Capital Expenditures ($ in millions) $15.5 $198.6 $280.1 $340.0 $834.28 Expenses ($ in millions) $1.6 $1.2 $1.0 $1.1 $4.9
9 ILI Upgrades
10 Miles – 92 107 – 19911 Capital Expenditures ($ in millions) $1.1 $14.6 $14.6 – $30.4
12 In-Line Inspections
13 Miles – – 78 156 23414 Expenses ($ in millions) – – $1.7 $7.9 $9.6
15 Total
16 Total Miles Strength Tested or Replaced 236 224 268 240 96817 Total Miles Strength Tested, Replaced, ILI upgrades 236 316 375 240 1,167
18 Total Capital Expenditures ($ in millions) $32.8 $228.9 $310.5 $355.9 $928.119 Total Expenses ($ in millions) $122.7 $94.9 $87.3 $102.8 $407.7
(a) The 2011 expenses and capital related costs (including depreciation, taxes and return) for capital projects forecast to be operational in 2011 will be funded by shareholders, as described in Chapter 8.
7. Strength Testing
Based on the Decision Trees, PG&E proposes to strength test about 783 miles of pipe
segments in Phase 1. The tests will be conducted in accordance with 49 CFR, Subpart J
requirements.

19
a. Phase 1 Strength Testing
Phase 1 strength testing6/ addresses the following types of pipe:
Pipe manufactured by processes known to produce less robust weld seams by
current standards, or weld seams with poor fracture toughness. These include
pre-1970, low-frequency electric resistant weld (“ERW”), flash welded, single
submerged arc weld (“SSAW”), furnace butt welded, and lap welded pipe
operating between 20% and 30% SMYS in urban areas.
All urban-area pipes operating at or above 30% SMYS, without an adequate
strength test, unless scheduled for replacement.
b. Phase 2 Strength Testing
During Phase 2, PG&E forecasts the need to strength test an additional 1,700 miles of
pipeline. The following types of pipe will be tested during Phase 2:
All urban area pipes operating below 30% SMYS, without an adequate pressure
test, that are not scheduled to be replaced.
All identified pipe not previously strength tested or replaced in Phase 1, which
includes pipe located in Class 1 non-HCA (rural areas) without an adequate
pressure test.
In addition, strength testing may also be used as a means to ensure the previously measured
safety margin has not been jeopardized during the pipe’s service life.
8. Pipeline Replacement
a. Phase 1 Pipeline Replacement
As a result of its analysis and prioritization, PG&E estimates that it will replace 186 miles
6/ PG&E will use hydrostatic testing for most of its Phase 1 strength tests. In rare exceptions, PG&E may use
inert gas where doing so complies with federal pipeline regulations.
20
of pipeline during Phase 1 of the Pipeline Program. During Phase 1, PG&E will replace the
following types of pipe:
Pipe manufactured by processes generally thought to produce less robust weld
seams by current standards, or weld seams with poor fracture toughness, including
pre-1970, low-frequency ERW, flash welded, SSAW, furnace butt welded, lap
welded, and hammer welded pipe operating at or above 30% SMYS in urban
areas.
Pipelines constructed with welding techniques generally thought to produce low
toughness or girth welds such as oxygen-acetylene welds, bell-to-bell chill ring
welds, bell and spigot welds, and pre-1940 arc welds operating at or above 30%
SMYS in urban areas.
b. Phase 2 Pipeline Replacement
During Phase 2, PG&E will replace the following types of pipe:
Pipe operating above 30% SMYS with any features whose presence may interfere
with effective and successful ILI that can reliably assess for a multitude of other
important integrity concerns.
Any pipe that is determined unlikely to pass the required 49 CFR 192 Subpart J
strength test.7/
Any pipe constructed with obsolete pipe joining methods or fittings for which an
engineering condition assessment indicates a need for replacement.
The rate of pipeline replacement within Phase 2 is forecasted at 25 to 50 miles per year.
7/ PG&E anticipates that some pipeline segments will fail a strength test, and will therefore need to be
replaced. This is a placeholder in anticipation of that additional pipeline replacement.
21
9. In-Line Inspection
As part of the Pipeline Program, PG&E proposes to retrofit all pipelines operating above
30% SMYS, and many below 30% SMYS, to accommodate inspections using current intelligent
“pigging” technologies. The majority of ILI work will be conducted in Phase 2. Phase 1
includes 199 miles of pipeline retrofit for ILI and 234 miles of actual in-line inspections (or “ILI
runs”). These ILI pipeline segments are located on the L-300 backbone system and on three
urban pipelines located within the South Bay and San Francisco Peninsula.
The system-wide ILI program will be used to provide assurance that the margin of safety
from any previously conducted strength test has not been compromised since the time of the test.
Where ILI is not feasible in pipelines operating below 30% SMYS, PG&E will continue strength
testing, pipe replacement, or other actions to assure the margin of safety is not compromised. As
a result of the Decision Tree analysis, PG&E forecasts the percentage of total pipeline miles
retrofitted for ILI to increase from 22% to 26% by the end of Phase 1 (2014), and to 70% of the
gas transmission system by the completion of Phase 2.
III. VALVE AUTOMATION PROGRAM
A. Introduction and Overview
This section of PG&E’s Implementation Plan describes PG&E’s Valve Automation
Program. The objective of the Valve Automation Program is to minimize the potential
consequences of an extended duration natural gas-fueled fire created by a gas pipeline rupture
(and work in concert with first responders) by expanding the use of automated gas transmission
pipeline system isolation valves (“automated valves”). There are two types of automated valves
included in the program: (1) Remote Control Valves (“RCV”); and (2) Automatic Shut-off
Valves (“ASV”). PG&E will install RCVs, which are remotely closed by operators in the Gas
Control Center, in heavily populated areas. PG&E will prioritize installation of RCVs on

22
pipeline segments based on population density (i.e., class location, presence of HCA, and PIR).
In addition, PG&E will install ASVs, which are automatically closed by local controls at the
valve site, on pipelines in populated areas that cross active earthquake faults where the fault
poses a potentially significant threat to the line. A detailed description of RCV and ASV criteria
is included in Chapter 4 of PG&E’s testimony accompanying the Implementation Plan, “Gas
Transmission Valve Automation Program.”
As part of the Valve Automation Program, PG&E will enhance its SCADA system to
allow operators in its Gas Control Center to quickly detect a rupture and isolate the affected
section of pipeline. The program will also replace valves being automated where needed to
assure that the pipeline is capable of in-line inspection. RCVs will be designed so they can also
be ASVs should design criteria or system parameters change.
PG&E will implement the Valve Automation Program in two phases. This
Implementation Plan presents the proposed locations, schedule and cost estimates for Phase 1
implementation (2011-2014). In addition, the Implementation Plan provides a preliminary
overview for the Phase 2 implementation (2015 and beyond). The scope, schedule and cost
recovery for Phase 2 of the Valve Automation Program, beginning January 1, 2015, will be
addressed in a subsequent proceeding.
B. Pipe Segment Selection for Automation
This section describes two decision trees — one based on population density and the
other based on earthquake fault crossings — to determine which pipe segments should be
equipped with automated isolation capability. These decision trees were developed as a result of
extensive benchmarking both nationally and internationally, and in consultation with a leading
industry expert. The main focus of the Valve Automation Program is retrofitting existing gas
23
transmission lines. However, PG&E will also evaluate all new pipeline projects and replacement
pipeline projects for valve automation.
1. Criteria For Installation of RCVs In Highly Populated Areas
PG&E proposes to install RCVs on DOT-defined gas transmission pipeline segments
within Class 3 and 4 areas and Class 1 and 2 HCAs that exceed minimum threshold criteria for
pipe size and operating pressure as defined using a PIR calculation. For more populated Class 3
HCA and Class 4 areas, the minimum threshold criteria are reduced to recognize the higher
potential consequence.
Specifically, PG&E will install RCVs on all DOT-defined gas transmission pipelines
within Class 3 and 4 areas that meet one of these criteria:
(1) PIR > 200 feet for pipe located in Class 3 areas.(2) PIR > 150 feet for pipe segments located in areas with a predominance of Class 3
HCA.(3) PIR > 100 feet for pipe located in Class 4 areas.
///
///
///
///
///
///
///
///
///
///
///
24
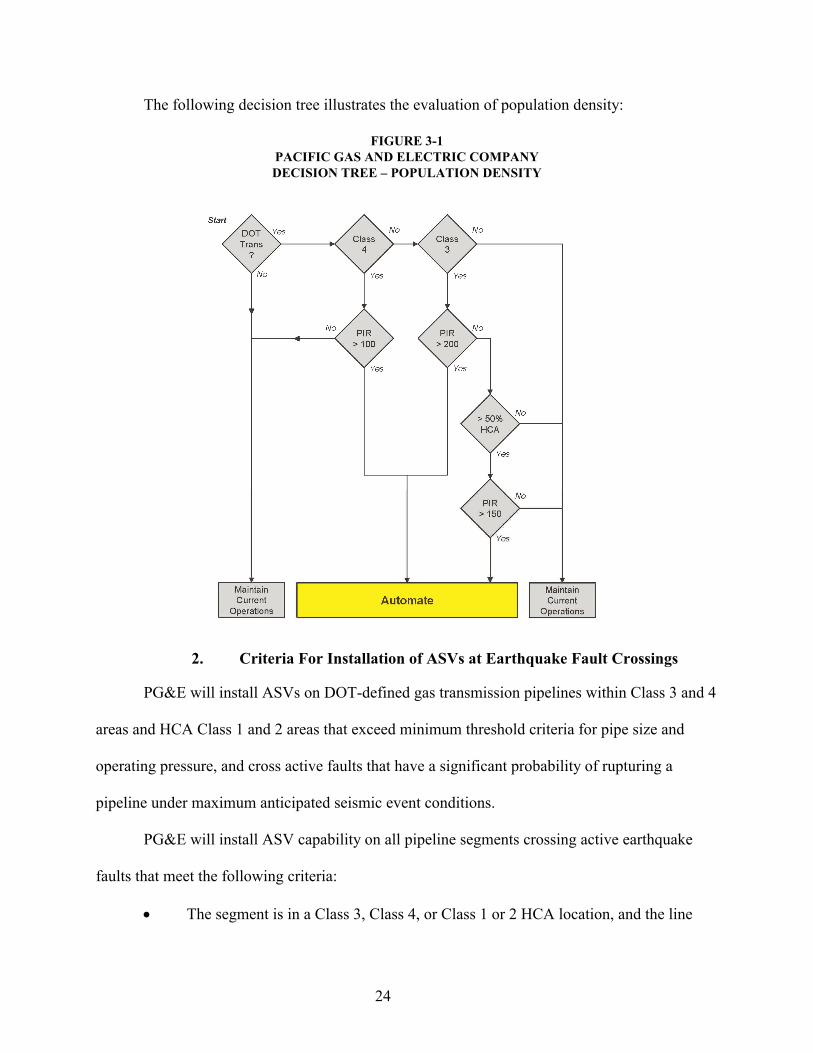
The following decision tree illustrates the evaluation of population density:
FIGURE 3-1PACIFIC GAS AND ELECTRIC COMPANYDECISION TREE – POPULATION DENSITY
2. Criteria For Installation of ASVs at Earthquake Fault Crossings
PG&E will install ASVs on DOT-defined gas transmission pipelines within Class 3 and 4
areas and HCA Class 1 and 2 areas that exceed minimum threshold criteria for pipe size and
operating pressure, and cross active faults that have a significant probability of rupturing a
pipeline under maximum anticipated seismic event conditions.
PG&E will install ASV capability on all pipeline segments crossing active earthquake
faults that meet the following criteria:
The segment is in a Class 3, Class 4, or Class 1 or 2 HCA location, and the line
25
segment had a PIR of greater than or equal to 150 feet.
The earthquake fault is deemed a significant risk of causing a pipeline rupture as
defined by the potential magnitude and likely frequency of a major earthquake
event and the susceptibility of the pipe segment to rupture during a major event.
The earthquake fault is considered active and is identified as having a greater than
two percent probability of a 6.7 or greater magnitude earthquake event within the
next 30 years.
The rupture risk to the pipeline has not been mitigated by pipeline design.
For pipelines crossing earthquake faults in sparsely populated areas, such crossings
are included in an existing PG&E program8/ that addresses design of pipelines
crossing active earthquake faults, and are not part of the Valve Automation
Program.
///
///
///
///
///
///
///
///
///
8/ Under an existing program that has been in place for many years, PG&E reviews whether the risk of
rupture due to an earthquake can be mitigated by design, i.e., the pipeline segment crossing the fault is re-designed to withstand the maximum displacement expected from a fault rupture. This is a different and complementary mitigative measure to installing automated valves.
26
FIGURE 3-2PACIFIC GAS AND ELECTRIC COMPANY
DECISION TREE – EARTHQUAKE FAULT CROSSING
There are two alternatives within the “Automate” box of the earthquake fault crossing
decision tree. Where crossings are deemed a potentially significant threat to the pipeline, ASVs
will be installed that will also have RCV capability. These valves will closely bracket the fault.
Where only a low threat exists, the fault crossing will be able to be isolated with RCVs installed
at the same general spacing as for valves equipped with RCVs in the Population Density
Decision Tree.
C. Automated Valve Spacing
The objective of the Valve Automation Program is to enable PG&E to quickly shut off
the flow of gas in response to a gas pipeline rupture.
27
The following guidelines apply to the Valve Automation Program:
Valve spacing distances should limit the potential number of customers
being fed off of a pipe segment to no more than 50,000.
The maximum spacing between valves is targeted to be:
For Class 3 locations – 8 miles
For Class 4 locations – 5 miles
In general, these guidelines utilize the valve spacing requirements specified in the CFR
for pipelines in Class 3 and 4 areas, and then it was confirmed that utilizing these criteria as the
maximum spacing requirements did not substantially increase the total overall anticipated time to
isolate and vent gas in the event of a pipeline rupture. Generally, these guidelines target less
than 10 minutes for blowdown for a full pipeline rupture.
In either case, the maximum distance may be slightly exceeded, to permit a valve to be
automated in a way that is more accessible or minimizes public impact. Where automatic valves
are installed at earthquake fault crossings, these valves will closely bracket the fault.
D. Pipe Segment Prioritization
Determination of phase priorities was based on two primary factors: population density
and PIR. Table 3-1 shows the various miles of PG&E gas transmission pipeline by class, HCA
and PIR value, and highlights the focus of Phases 1, 2A and 2B.
///
///
///
///
///
28
TABLE 3-1PACIFIC GAS AND ELECTRIC COMPANY
PIPE MILES BY PIR, CLASS AND HCA
LineNo. PIR
HCAClass 3&4
Non-HCAClass 3&4
Class 3&4Miles
HCAClass 1&2
Non-HCAClass 1&2
TotalMiles
1 501+ 132(a) 23(c) 155 56 1,806 2,0162 301-500 208(a) 68(c) 277 10 394 6803 251-300 98(b) 41(c) 139 3 289 4314 201-250 133(b) 71(c) 204 4 313 5215 151-200 153(b) 128 281 4 284 5696 101-150 161 268 430 3 453 886
7 0-100 60 179 239 1 418 658
8 Totals 947 778 1,715 80 3,958 5,763_______________
(a) Focus of Phase 1.
(b) Focus of Phase 2A.
(c) Focus of Phase 2B. Phase 2B also includes unsustained pipe lengths of Phase 1 & 2A segments.
Note: The pipe mileage table is based upon a January 3, 2011 GIS database snapshot for all DOT gas transmission designated pipe (not including Gas Gathering). All mileage statistics for the Valve Automation Program and pipe segment analysis are based upon this data snapshot.
E. Phase 1 Valve Installations
Figure 3-3 highlights the core area of Phase 1 valve automation work. Approximately
60% of the miles slated for valve automation in Phase 1 are located in the Peninsula, South East
Bay and South Bay. Other significant areas of work include Sacramento, Stockton, Fairfield,
Bakersfield and Morgan Hill, and the Highway 4 corridor between Antioch and Highway 80 in
the East Bay. All sites identified by symbols (i.e., circles, squares and triangles) are locations
where specific types of valve automation work will be implemented as part of Phase 1.
///
///
///
///
///
29
FIGURE 3-3PACIFIC GAS AND ELECTRIC COMPANY
MAP OF CORE PHASE 1 VALVE AUTOMATION
///
///
///
///
///
///
///
30
Table 3-2 provides additional details on the specific valve automation work by year and
geographical area.
TABLE 3-2PACIFIC GAS AND ELECTRIC COMPANY
VALVES AUTOMATED BY AREA IN PHASE 1 (2011-2014)
Line No. Geographical Area
Existing Valves
Automated
Replaced or New Valves Automated
Automated Valves
Upgrade
Total Valves Automated in
Phase I
1 Peninsula (2011 Construction) 12 8 9 292 Peninsula (2012 Construction) 12 17 10 393 San Jose 13 2 6 214 Antioch to Richmond 27 7 3 375 Oakland to Fremont to Livermore 20 4 2 266 Brentwood Area 3 5 5 137 Sacramento Area 6 5 1 128 Vallejo-Fairfield Area 15 2 0 179 Stockton-Modesto Area 17 0 1 18
10 Bakersfield Area 5 0 2 711 Eureka Area 3 0 2 5
12 Barstow Area 2 0 2 4
13 Total 135 50 43 228
_______________
Note: Based upon preliminary analysis of existing valve installation conditions.
F. SCADA Enhancements
To ensure proper use of automated valves, the Pipeline Safety Enhancement Plan will
provide Gas Control Operators with additional information, tools, and training to help them
quickly detect and respond to pipeline ruptures. As part of this program, SCADA enhancements
include:
1. Additional SCADA monitoring points for pressures and flows.
2. Detailed SCADA viewing tools that provide a comprehensive understanding of individual pipeline conditions in real-time, the potential effects (e.g., downstream pressures and flows) if a pipeline segment is isolated, and pipeline configuration and constraints.
3. Specific pipeline segment shutdown protocols to provide clear instructions on actions to be taken to quickly and effectively isolate a segment.

31
4. Situational awareness tools, which utilize advanced composite alarming, and best practice alarm management methodology to highlight issues requiring immediate operator action.
5. Interactive tools that will allow operators to quickly access GIS physical pipeline information in relationship to SCADA points, and to geographically locate SCADA points.
6. Training simulation tools to prepare gas operators for potential line rupture scenarios.
These enhancements will be done in alignment with work on Control Room
Management. In addition, as recommended by the Independent Review Panel, PG&E will
conduct a study to evaluate potential SCADA expansion and improvement. As part of this
assessment, PG&E will hire an external expert to review PG&E’s gas SCADA system, and best
practices for the use of SCADA systems by other gas pipeline companies and related industries.
A description of the study scope is included in Chapter 4 of PG&E’s testimony accompanying
the Implementation Plan, “Gas Transmission Valve Automation Program.”
G. Phase 1 Valve Automation Program Costs
The Valve Automation Program consists of capital and expense work. The capital work
is primarily related to the valve automation projects. The expense work consists of SCADA
enhancement projects, including additional Gas Operator training requirements, and recurring
incremental operating and maintenance (“O&M”) expenses associated with the new equipment.
Due to the highly varying degree of accuracy for these estimates, contingency is addressed on a
program level in Chapter 7, “Implementation Plan Management Approach and Estimate Risk
Quantification.” No contingency was included in individual project cost estimates. Table 3-3
provides an overview of the total forecasted costs, without contingency. Project-specific details
are provided in Chapter 4 of the accompanying testimony, “Gas Transmission Valve Automation
Program,” and in the associated workpapers and attachments.
32
TABLE 3-3PACIFIC GAS AND ELECTRIC COMPANY
VALVE AUTOMATION PROGRAMCOSTS BY WORK TYPE IN PHASE 1 (2011-2014)
$ IN MILLIONS (NOMINAL)Line No. Work Description 2011(a) 2012 2013 2014 Total
1 Capital Expenditure Request
2 Valve Automation $13.6 $33.4 $43.2 $22.5 $112.73 Valve Automation-StanPac – 2.0 4.6 – 6.6
Flow Meter Installations – 3.9 5.3 3.3 12.54 SCADA Enhancements 0.1 0.2 0.2 0.2 0.7
5 Valve Automation – Total Capital Expenditures $13.7 $39.5 $53.3 $26.0 $132.5
6 Expense Request
7 SCADA Enhancements $0.8 $1.8 $1.8 $2.2 $6.68 Reoccurring Operations and Maintenance – 0.8 1.3 1.6 3.79 Program Planning and Development 0.8 – – – 0.8
10 Valve Automation – Total Expenses $1.6 $2.6 $3.1 $3.8 $11.1
11 Valve Automation Total (Capital and Expense) $15.3 $42.1 $56.4 $29.8 $143.6
(a) The 2011 expenses and capital related costs (including depreciation, taxes and return) for capital projects forecast to be operational in 2011 will be funded by shareholders, as described in Chapter 8.
IV. PIPELINE RECORDS INTEGRATION PROGRAM
A. Introduction and Overview
The objective of the Pipeline Records Integration Program is to: (1) validate the MAOP
of PG&E’s gas transmission pipelines based upon the pipeline features data (“MAOP Project”);
and (2) substantially upgrade gas transmission processes and record management infrastructure,
allowing PG&E to transition from reliance on traditional paper records and consolidate pipeline
information into two electronic information systems (SAP and GIS) (“Gas Transmission Asset
Management,” or “GTAM” Project). Included within the scope of the project is the development
of new business processes and mobile computers intended to allow field maintenance and
construction crews to improve the quality and efficiency of future information collected about
the gas transmission system to support future operations, maintenance and risk management

33
decision making. This program is described in greater detail in Chapter 5 of the accompanying
testimony, “Pipeline Records Integration Program.”
B. MAOP Project
PG&E will collect and verify all pipeline strength tests and pipeline features data
necessary to re-calculate the MAOP of pipelines and all associated components. The original
source documentation, which includes the characteristics and specifications of each pressure-
containing component of the pipeline, is used to support the MAOP calculation for each
component, and the resulting MAOP for each pipeline. The inventory will include electronic
links to source information about each pipeline and each component in order to enhance
transparency to the source used to derive critical data.
Given the scale of this effort, the MAOP Project is separated into three parts, with interim
deliverables defined along the way. The three parts will be executed in sequential order per a
priority established based on perceived potential risk.
The first part of the MAOP Project involved a comprehensive search of records to locate
and scan all strength test records in an interim electronic database for all Class 3 and 4 pipeline
segments, plus all HCA segments in Class 1 and 2, for a total of 1,805 miles. PG&E is not
requesting cost recovery for Part 1. Part 2 of the MAOP Project is currently underway and is
focused on validating the MAOP for HCA pipelines. PG&E is not seeking cost recovery of the
MAOP validation of pipelines installed after 1970. Part 3 consists of MAOP validation of all
remaining gas transmission pipelines in PG&E’s system. It is anticipated that the MAOP
Validation work will be completed in 2013.
C. Gas Transmission Asset Management Project
The GTAM Project will substantially enhance and improve: the amount and the types of
information that PG&E collects and maintains electronically about its pipeline system; the
34
business processes for collecting, validating and retaining pipeline data; the traceability of
materials used in the construction and maintenance of PG&E’s natural gas transmission
pipelines; and PG&E’s ability to assess and mitigate potential public safety risks.
The GTAM Project establishes a technology infrastructure that supports enhanced new
business processes to ensure data reliability is maintained (on an ongoing basis beyond the
completion of the Pipeline Records Integration Program) and enables improved decision making
capabilities related to the risks and integrity of the gas transmission system. There are four
primary objectives of the project.
First, all asset data (location/connectivity, specification/features, and
maintenance/inspection history) are tracked, managed, and stored using a software product and
data management technique called linear referencing, which is a best practice for
viewing/analyzing pipeline features, characteristics, and event history relative to specific
reference points along the entire length of gas transmission pipelines.
Second, materials are tracked in a traceable chain from receipt by PG&E through the
operating life of the component. Key features that would be tracked include the manufacturer,
characteristics of the component, manufacturer ratings, and factory test results.
Third, work management and data capture pertaining to maintenance and inspection
processes (including Mark and Locate and Leak Survey) are more efficient, accurate, timely, and
complete with rigorous quality assurance embedded. This will be accomplished by eliminating
paper-based maintenance and inspection work processes and implementing automated work
processes that manage Leak Survey, Mark and Locate, and preventative/corrective maintenance
work from scheduling of work, field capture of information, verification/quality review of field-
captured data, through updating of the Core Systems.

35
Fourth, tools are in place that enable integration of all underlying asset data (including
event history such as leaks, dig-ins, etc.) to provide the full picture of asset health and condition
with ability to perform risk and integrity analytics.
The implementation schedule for the GTAM Project includes a series of four distinct
phases, over a period of approximately 3.5 years (fourth quarter 2011 through first quarter 2015).
A more detailed schedule and cost information can be found in Chapter 5.
V. INTERIM SAFETY ENHANCEMENT MEASURES
A. Introduction and Overview
PG&E’s Implementation Plan includes the following interim safety enhancement
measures, in addition to the MAOP validation discussed above: (1) pressure reductions; and (2)
increased leak surveys and patrols. Each activity is discussed in Chapter 6 of the accompanying
testimony, “Interim Safety Enhancement Measures.”
B. Interim Pressure Reductions as an Interim Safety Enhancement Measure
An interim pressure reduction may be called for on a pipeline segment under the
following circumstances: (1) the MAOP Validation process (described above) identifies a
segment where the calculated MAOP is lower than current operating pressure and pressure
should be reduced to the calculated MAOP on an interim basis; or (2) the Pipeline Program
Decision Trees identify an interim pressure reduction as a recommended mitigation measure.
This section addresses how PG&E will coordinate and implement such interim pressure
reductions under the Implementation Plan.
First, the MAOP Validation process may identify the need to take an interim pressure
reduction on a pipe segment. Under this process, an MAOP will be calculated for each segment
that has not been pressure tested. If the MAOP Validation determines that the MAOP should be
lower than current operations, PG&E will take action to implement an interim pressure reduction

36
on the segment. These interim pressure reductions will remain in effect until the pipe segment is
tested or replaced under the Pipeline Program.
Second, under the Pipeline Program Decision Trees, the recommended action for some
pipeline segments is to reduce pressure on an interim basis until a later corrective action can be
accomplished. If a pressure reduction is indicated for a pipe segment under the Pipeline Program
Decision Trees, PG&E will reduce the operating pressure on that segment by 20 pounds per
square inch gauge (“psig”) below the segment MAOP until corrective actions have been
accomplished.
PG&E has specific design criteria standards to avoid customer outages and ensure safe
and reliable service. Any interim pressure reduction implemented under the Implementation
Plan will consider the safety impacts of customer outages along with pipeline integrity safety
margins. PG&E will reduce operating pressure on a segment indicated by the Pipeline Program
Decision Tree by 20 psig below MOP, provided that design criteria standards can be met,
thereby avoiding the safety issues associated with customer outages. If the design standard
cannot be met with the 20 psig interim pressure reduction, PG&E will reduce pressure to a level
at which the design standard can be met. PG&E has already implemented certain interim
pressure reductions and will complete its implementation of interim pressure reductions called
for in the Pipeline Modernization Program Decision Trees no later than 30 days after final CPUC
approval of the Implementation Plan.
C. Increased Leak Surveys and Patrols As Interim Safety Enhancement Measures
For those pipe segments that are in Class 4, Class 3, Class 2 and Class 1 HCAs and do
not have records of prior pressure testing (and are therefore included in the scope of the
Implementation Plan), starting January 1, 2012, leak surveys will be conducted six times per year

37
until the segment is tested, or replaced. PG&E also will perform leak surveys six times per year
on those segments operating under 30% SMYS in Class 2 to 4 and Class 1 HCAs that are
planned to be strength tested and inspected in Phase 2 (Pipeline Modernization Program
Decision Tree box C3).
Starting January 1, 2012, PG&E will conduct additional patrols on the same segments of
its gas transmission system discussed above. These patrols will be conducted six times annually.
The Backbone Transmission system will continue to be patrolled monthly (quarterly code
compliance patrols and monthly reliability patrols).
VI. REPORTING REQUIREMENTS
This section of the Implementation Plan describes PG&E’s proposed Implementation
Plan Report (“Report”). The focus of the Report is to provide status updates on the
Implementation Plan work completed, in progress and forecast, and to note any planning
approaches that provide further insight on the decision-making approaches used by PG&E to
manage the Implementation Plan.
This reporting will be similar to that approved in PG&E’s 2011 GT&S Rate Case (Gas
Accord V) Decision 11-04-031. The report will be submitted on March 1 and September 19 of
each year. PG&E will file this progress report together with the report approved in Decision
11-04-031. PG&E will serve the Report on the Directors of the Consumer Protection and Safety
Division and Energy Division, and on the service list for those parties in this Gas Safety OIR.
The Report will include the following:
The Report will provide the progress of the physical work planned and completed,
including the miles of pipe replaced, number of valves replaced, number of ILI
9/ Depending on the timing of the Commission decision on this Implementation Plan, PG&E may seek
clarification of the timing of the initial report.
38
retrofits, number of in-line inspections, and miles of hydrotesting.
The Report will identify and describe each Implementation Plan capital project and
O&M work activity, which were planned to start during the reporting period, and
the project costs associated with each project or work activity exceeding $250,000.
For each Implementation Plan project or work activity with a cost exceeding
$250,000, the Report will identify and describe each capital project, and O&M
work activities, that were started, underway, or completed during the reporting
period, the amount spent on each project and activity during the reporting period,
the amount spent during that calendar year, and the total amount spent on each
project or activity. The Report will include the start date, the completion date or
anticipated completion date, and a description of the work that was performed
during the reporting period. If PG&E began a project or O&M activity during the
reporting period that was not previously identified as a planned project or activity
in a prior Report, PG&E will provide an explanation of why that project or activity
proceeded ahead of other projects or activities that were previously listed as a
planned project or activity.
The Report will describe the amount of funds budgeted at the beginning of each
calendar year and over the Implementation Plan Phase 1 period (2011-2014), as
well as the amount spent during the reporting period and for that calendar year, for
each Major Work Category (“MWC”) related to Implementation Plan for capital
expenditures and for O&M activities. If PG&E does not spend the entire amount
budgeted for Implementation Plan related capital projects or O&M activities,
PG&E will provide an explanation in its Report. Similarly, if PG&E spends in
39
excess of the amount budgeted for these capital projects or O&M activities, PG&E
will provide an explanation in its Report.
PG&E also proposes to give the Consumer Protection and Safety Division and the Energy
Division authority to increase the Report threshold amount if they deem it appropriate by
notifying the Executive Director in writing, and serving the notice on the service list in this
proceeding.
VII. COST ESTIMATE AND RATEMAKING PROPOSAL
A. Introduction and Overview
This section of the Implementation Plan describes the ratemaking approach for the
Implementation Plan and provides a summary of the Phase 1 costs. The Implementation Plan
work is separated into two phases. Phase 1 is 2011 through 2014, and Phase 2 is 2015 and
beyond. The proposed cost recovery approach is presented for Phase 1 costs below.
The key elements of the cost recovery plan include: (1) an approved forecast for capital
expenditures and expenses; (2) ability to file a Tier 3 advice letter to address changed
circumstances that lead to a change in scope, schedule, or costs; (3) refunds to customers for any
unspent expenses at the end of Phase 1; (4) recovery of capital costs only after a project becomes
operational; and (5) a shareholder cost allocation proposal. PG&E will recover the annual
revenue requirements through new gas rate components included in the Customer Class Charges
recovered in the end-use rates paid by core and noncore gas customers.
Phase 2 ratemaking and cost recovery will be addressed as part of a subsequent filing
with the Commission.
B. Phase 1 Cost Recovery
In Decision 11-06-017, the Commission ordered PG&E to propose a cost allocation
40
between shareholders and ratepayers.10/ PG&E proposes that shareholders will pay for all
program expenses incurred in 2011 under the Implementation Plan, as well as the capital-related
revenues for 2011. Cost recovery for the final three years of Phase 1 of the Implementation Plan
(2012-2014) are proposed to be recoverable in rates.
Upon approval of the Implementation Plan, the Phase 1 forecast for capital expenditures
and expenses, as forecast in Chapters 3 through 7 of the accompanying testimony, is adopted.
These forecasts are the project budget and are binding for the four-year period unless the
Commission authorizes a mid-program modification. If changed circumstances lead to a change
in the Phase 1 project scope, schedule or costs that would cause the program to exceed the
Phase 1 approved forecast, PG&E may request authorization to file a Tier 3 advice letter to
request cost recovery of the amounts exceeding the approved forecast. If the Commission does
not approve the request for a change in the Phase 1 approved forecast or modifies the request,
PG&E will adjust its work scope in Phase 1 and prioritize work within the constraints of the
authorized forecast, potentially moving the work to Phase 2 of the Implementation Plan.
The Pipeline Program uses the Gas Transmission GIS for its source data. However, as
discussed in Chapter 5, the system may contain errors and be missing data, which PG&E is
working to resolve. Where PG&E does not have and cannot obtain sufficient and reliable data
pertaining to a particular threat, the Pipeline Program makes the conservative assumption that the
pipeline segment being evaluated is vulnerable to that threat. PG&E has an extensive records
review underway for all gas transmission pipelines and will update the GIS database to ensure
accuracy and dependability, as described in Chapter 5. Updates received from the data
validation team have been, and will continue to be, incorporated into the Pipeline Program to
10/ Ordering Paragraph 10.

41
ensure the appropriate work plans are developed from the most accurate pipeline information
possible. During preliminary project engineering, PG&E engineers will review the paper records
and job files for the segment of interest, to ensure the Pipeline Program is using the most
accurate information before the line is replaced, strength tested, and/or retrofitted for ILI. As
additional corrections and updates are necessary, PG&E will assess and update the Pipeline
Program work plan at least once a year, or more frequently as appropriate.
PG&E will establish a new balancing account to record the difference between the
Phase 1 adopted forecast and recorded expenses. Should PG&E spend less than the amount
authorized by the Commission for the customer-funded portion of Phase 1 (2012-2014), then a
refund of the balance will be given to customers through the Gas Pipeline Safety (“GPS”) rate
component. Under this approach, PG&E will only spend more than the authorized amount for
Phase 1 if the Commission authorizes a modification to the Phase 1 forecast through the advice
letter process, as described later in this Implementation Plan.
For capital expenditures, the associated revenue requirements will be incorporated into
rates beginning January 1 following the in-service date of a capital project. The revenues
recorded and collected for Phase 1 would be limited to the Commission adopted target for capital
spending.11/ All pipeline segments replaced as part of the Implementation Plan will be treated as
a capital expenditure.
C. Balancing Accounts
PG&E proposes to establish two new balancing accounts to track the revenue
requirements for the recorded costs relative to the revenue collected.
PG&E will establish two new Gas Pipeline Safety Balancing Accounts (“GPSBA”); one
11/ The associated revenue requirements for the capital projects that become operative in 2014, the final year
of Phase 1 of the Implementation Plan, will be included in rates beginning 2015.
42
for core gas customers and another for noncore gas customers, with separate subaccounts for
each sub-component of the GPS rate component, to record the revenue requirements related to
the actual cost incurred and actual revenue collected for the Implementation Plan and to provide
a “true-up” to ensure that PG&E will only recover in rates costs that are actually expended on
Implementation Plan program elements. Disposition of the balance of the GPSBA will be in
PG&E’s Annual Gas True-up (“AGT”) process. The revenue recorded in the GPSBA will be
collected through a new GPS rate component of the Customer Class Charge.
Each GPSBA will record, on a monthly basis, the revenue requirements associated with
the actual incurred O&M and A&G expenses, and capital expenditures for in-service capital
projects, as well as associated revenue collected through core and noncore GPS rates. Any
resulting over-collection or under-collection will be trued up annually via PG&E’s AGT advice
letter.
PG&E shall establish three subaccounts in both GPS balancing accounts, each related to
the Backbone, Local Transmission, and Storage revenue requirements established in this
proceeding. Into each of these subaccounts, PG&E will record actual incurred O&M and A&G
expenses, and capital expenditures for in-service capital projects, as well as the associated
revenues collected through the subcomponents of the GPS rates. The subaccounts are described
as follows:
1. Backbone Subaccount
The Backbone Subaccount records the difference between the Phase 1 Implementation
Plan Backbone revenue requirement and recorded revenue collected through the GPS backbone
rate component.
2. Local Transmission Subaccount
The Local Transmission Subaccount records the difference between the Phase 1
43
Implementation Plan Local Transmission revenue requirement and recorded revenue collected
through the GPS local transmission rate component.
3. Storage Subaccount
The Storage subaccount records the difference between the Phase 1 Implementation Plan
Storage revenue requirement and recorded revenue collected through the GPS storage rate
component.
As mentioned above, PG&E proposes to also establish a Gas Pipeline Expense Balancing
Account (GPEBA) to record the difference in aggregate between the recorded expense of the
customer-funded portion of the Implementation Plan incurred during Phase 1 (2012 – 2014) and
the forecast expense authorized by the Commission.
D. Natural Gas Transmission Pipeline Safety and Reliability Memorandum Account (NGTPRSMA)
PG&E requests that the Commission approve PG&E’s May 5, 2011 Motion to establish
the NGTPRSMA and allow PG&E to begin tracking and recording its actual revenue
requirement for its 2011 and subsequent Implementation Plan costs to this memorandum
account. The memorandum account would be modified to reflect PG&E’s shareholder allocation
proposal. This will allow PG&E to track the actual expenditures on Implementation Plan
activities that will be borne by shareholders in 2011. In addition, in the event that the GPSBA is
not established by January 1, 2012, the memorandum account will record and track 2012
expenditures under the Implementation Plan, which would be eligible for cost recovery. The
2012 and subsequent amounts recorded in the NGTPSRMA would be transferred to the GPEBA
(actual expense) and GPSBA (in-service capital) upon the Commission’s approval of the
Implementation Plan.

44
E. Advice Letter to Adjust Approved Spend Forecasts
PG&E requests authorization to submit a Tier 3 advice letter, requesting authority for a
mid-program increase in the approved costs forecasts. In its advice letter filing, PG&E will
describe the work to be completed within the adopted forecasts and the additional costs required
to complete the remaining Phase 1 work or other work the Commission may order PG&E to
complete that is incremental to the initial Phase 1 forecast. Tier 3 advice letters require a
Resolution and approval by the Commission. The public and interested parties will have an
opportunity to protest and comment on such a request. In the event that the funding request
made in the advice letter is not approved, or only partially approved, PG&E will be required to
manage and reprioritize the remaining work scope within the approved forecast, potentially
resulting in a shift of some projects to Phase 2 of the Implementation Plan.
F. Cost Estimates and Revenue Requirements
PG&E requests authorization to recover approximately $1,963.2 million of $2,183.9
million in total costs expected to be incurred from 2011 through 2014 for Phase 1 of the
Implementation Plan. The total forecast expenses and capital expenditures are summarized in
Tables 7-1 and 7-2, respectively.
///
///
///
///
///
///
///
///
45
TABLE 7-1PACIFIC GAS AND ELECTRIC COMPANY
SUMMARY OF IMPLEMENTATION PLAN PHASE 1 EXPENSES($ IN MILLIONS)
Line No. Description 2011(a) 2012 2013 2014 Total
1 Pipeline Modernization Program $122.7 $94.9 $87.3 $102.8 $407.72 Valve Automation Program 1.6 2.6 3.1 3.8 11.13 Pipeline Records Integration Program 55.7 88.1 32.4 7.2 183.44 Interim Safety Enhancement Measures - 1.0 1.1 1.1 3.25 Program Management Office 1.6 3.5 3.4 3.4 11.96 Contingency 39.1 41.0 27.5 25.6 133.27 Total Expenses $220.7 $231.1 $154.8 $143.9 $750.5
(a) The 2011 expenses will be funded by shareholders, as described in Chapter 8.
TABLE 7-2PACIFIC GAS AND ELECTRIC COMPANY
SUMMARY OF IMPLEMENTATION PLAN PHASE 1 CAPITAL EXPENDITURES($ IN MILLIONS)
Line No. Description 2011(a) 2012 2013 2014 Total
1 Pipeline Modernization Program $32.8 $228.9 $310.5 $355.9 $928.12 Valve Automation Program 13.7 39.5 53.3 26.0 132.53 Pipeline Records Integration Program 7.4 42.3 27.2 25.7 102.64 Interim Safety Enhancement Measures - - - - -5 Program Management Office 3.0 6.6 6.7 6.6 22.96 Contingency 12.0 67.0 82.6 85.7 247.3
7 Total Capital Expenditures $68.9 $384.3 $480.3 $499.9 $1,433.4
(a) The 2011 capital related costs (including depreciation, taxes and return) for capital projects forecast to be operational in 2011, forecast at $1.4 million, will be funded by shareholders, as described in Chapter 8.
Under PG&E’s proposed shareholder cost allocation proposal, the 2011 expense cost,
forecast at $220.7 million, and the 2011 capital related revenues, forecast at $1.4 million,12/
would be excluded from cost recovery and would be funded by shareholders. The adjusted costs
are shown in Table 7-3.
12/ The capital related revenues are for capital projects forecast as operational in 2011. These include revenues
to cover depreciation, taxes and return.

46
TABLE 7-3PACIFIC GAS AND ELECTRIC COMPANY
SUMMARY OF IMPLEMENTATION PLAN PHASE 1 COSTS BY TYPEADJUSTED TO INCLUDE SHAREHOLDER COST ALLOCATION
($ IN MILLIONS)
Line No. Description 2011(a) 2012 2013 2014 Total
1 Expenses $220.7 $231.1 $154.8 $143.9 $750.52 Capital Expenditures 68.9 384.3 480.3 499.9 1,433.4
3 Total Costs $289.6 $615.4 $635.1 $643.8 $2,183.94 Less: 2011 Expenses (220.7) - - - (220.7)
5 Net Costs PG&E is Requesting for Recovery $68.9 $615.4 $635.1 $643.8 $1,963.2
(a) The 2011 expenses, forecast at $220.7 million, and capital related costs (including depreciation, taxes and return) for capital projects forecast to be operational in 2011, forecast at $1.4 million, will be funded by shareholders, as described in Chapter 8.
Table 7-4 shows the revenue requirement to be collected from customers under PG&E’s
ratemaking proposal.
TABLE 7-4PACIFIC GAS AND ELECTRIC COMPANY
2011-2014 REVENUE REQUIREMENT REQUEST($ IN THOUSANDS)
Line No. Revenue Requirement 2011 2012 2013 2014
Total2011-2014
1 Capital-Only Revenue Requirement – $13,205 $63,981 $154,816 $232,002
2 Expense-Only Revenue Requirement – 234,074 156,852 145,825 536,751
3 Total – $247,279 $220,833 $300,641 $768,753
G. Rates
1. Cost Allocation
This section presents PG&E’s cost allocation for annual Implementation Plan revenue
requirements associated with Backbone Transmission, Local Transmission and Storage services.
PG&E will allocate its annual Implementation Plan Backbone Transmission-related
revenue requirements to core and noncore customers based on their annual percentages of
47
Backbone Transmission revenue requirement responsibility13/ established in the Gas Accord V
Settlement, approved by the Commission in Decision 11-04-031.
PG&E will allocate its annual Implementation Plan Local Transmission-related revenue
requirements to core and noncore customers based on their annual percentages of Local
Transmission revenue requirement responsibility established in the Gas Accord V Settlement.
PG&E will allocate its target annual Implementation Plan gas Storage-related revenue
requirements to core and noncore customers based on their annual percentages of gas Storage
revenue requirement responsibility established in the Gas Accord V Settlement.
2. Rate Proposal
This section presents PG&E’s proposal for recovery of annual Implementation Plan
revenue requirements for 2012-2014. PG&E will recover its annual authorized Implementation
Plan revenue requirements for 2012-2014 through new GPS rate components included in the
Customer Class Charges recovered in the end-use rates paid by PG&E’s core and noncore
customers. The GPS rates will provide discrete Implementation Plan rate components that can
be used to accurately track recovery of PG&E’s annual Implementation Plan revenue
requirements. The GPS rate components included in the Customer Class Charge for core and
noncore customers are developed by combining the core customer classes into a single class and
by combining the noncore customer classes into a single class and developing two average GPS
rates—one for core and one for noncore customers. GPS rates are then calculated by dividing
the total Implementation Plan Local Transmission, Backbone Transmission and gas Storage costs
allocated to core and noncore customers by the total Average-Year throughput forecast adopted
13/ Noncore revenue requirement responsibility does not include the Backbone Transmission revenue
requirement associated with incremental Line 401 Backbone Transmission service provided under PG&E rate Schedule G-XF - Pipeline Expansion Firm Intrastate Transportation Service.

48
for combined core and combined noncore customers in PG&E’s Gas Accord V Settlement.
Consistent with the methodology adopted for treatment of Local Transmission costs in
Gas Accord IV Decision 07-09-045 and continued in Decision 11-04-031: (1) wholesale
customers pay the noncore GPS rate; and (2) annual Implementation Plan Local Transmission
revenue requirements are not included in the GPS rates paid by PG&E’s noncore Industrial and
Electric Generation customers taking service at the Backbone Transmission level. The GPS rates
paid by PG&E’s noncore Industrial and Electric Generation customers taking service at the
Backbone Transmission level will only include an allocation of annual Implementation Plan
Backbone Transmission and gas Storage revenue requirements.14/
VIII. NOTICE AND SERVICE
Within twenty (20) days from the date of filing, PG&E will publish in newspapers of
general circulation in each county in its service territory a notice of filing this Implementation
Plan, and will mail a notice describing this Implementation Plan to the Attorney General of
California, the Department of General Services, and the city and county governments within
PG&E’s service territory. A list of the cities and counties to which the Notice will be sent is
attached to this Implementation Plan as Exhibit F. A similar notice will be included in the
regular bills mailed to PG&E’s customers within forty-five (45) days of the filing date of this
Implementation Plan.
In addition, PG&E will serve this Implementation Plan on the service list for the Gas
Safety OIR (R.11-02-019) and on the service list for PG&E’s 2011 GT&S Rate Case (A.09-09-
013). PG&E will serve an electronic transmittal that provides a link to the website location of
14/ PG&E’s Gas Accord III Settlement adopted by the Commission in Decision 04-12-050 provided for
Backbone Transmission level end-use service for certain noncore industrial and electric generation customers. Customers qualifying for this service do not pay a Local Transmission rate component. However, they continue to be responsible for all other rate components in their end-user tariffs.

49
this filing and exhibits. In addition, a Notice of Availability of the Implementation Plan,
testimony, work papers and exhibits will be served in accordance with Rule 1.9(c) of the
Commission’s Rules of Practice and Procedure.
IX. EXHIBITS
The following exhibits are appended to this Implementation Plan:
Exhibit A Pipeline Modernization Program Project Summary
Exhibit B Valve Automation Program Project Summary
Exhibit C Statement of PG&E’s Presently Effective Gas Rates
Exhibit D Statement of Proposed Rate Changes
Exhibit E Results of Operations at Proposed Rates
Exhibit F List of cities and counties to which Notice will be sent
///
///
///
///
///
///
///
///
///
///
///
///
///
50
X. CONCLUSION
PG&E respectfully requests that the Commission: (1) adopt PG&E’s Implementation
Plan as an efficient and cost-effective way to provide a pedigree of safety for each segment of
PG&E’s 5,786 mile gas transmission system; and (2) allow PG&E to recover in rates from 2012-
2014 its costs for executing the Implementation Plan.
Respectfully submitted,
By: /s/ William V. Manheim WILLIAM V. MANHEIM
WILLIAM V. MANHEIMKERRY C. KLEINPacific Gas and Electric Company77 Beale Street, B30ASan Francisco, CA 94105Telephone: (415) 973-6628Facsimile: (415) 973-5520E-Mail: [email protected]
Attorneys forPACIFIC GAS AND ELECTRIC COMPANY
Dated: August 26, 2011
Exhibit A
Pipeline Modernization Program Project Summary
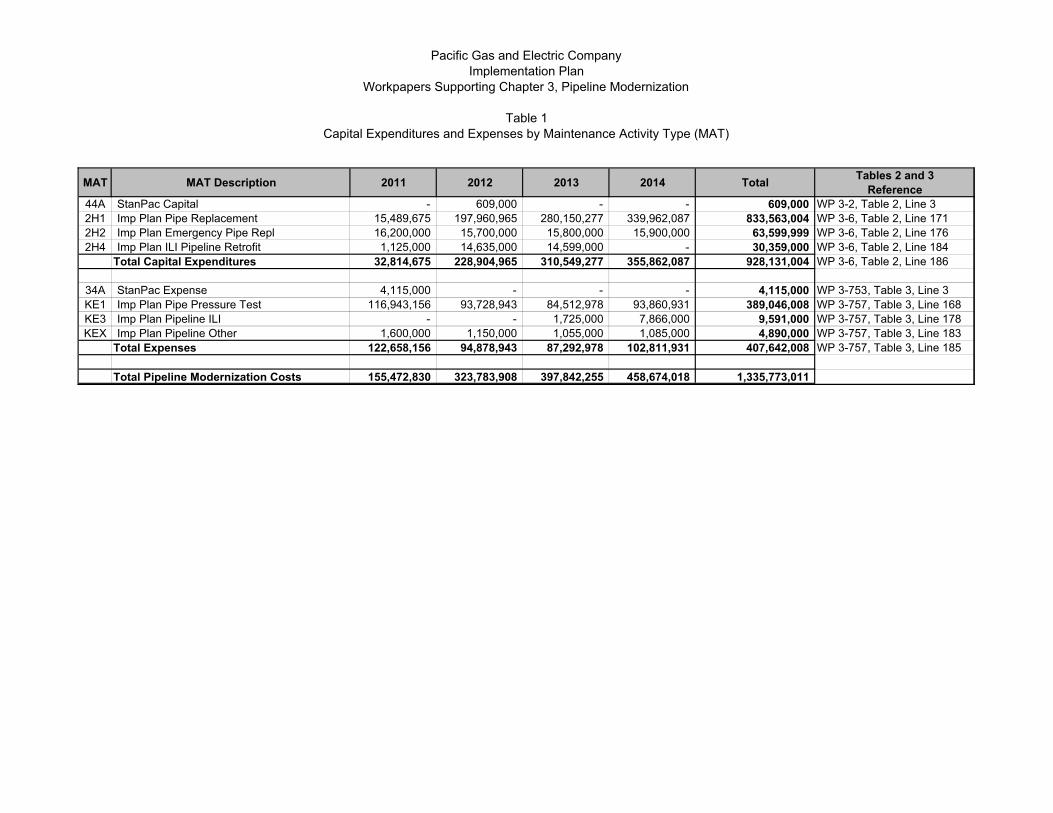
Pacific Gas and Electric CompanyImplementation Plan
Workpapers Supporting Chapter 3, Pipeline Modernization
Table 1 Capital Expenditures and Expenses by Maintenance Activity Type (MAT)
MAT MAT Description 2011 2012 2013 2014 Total Tables 2 and 3Reference
44A StanPac Capital - 609,000 - - 609,000 WP 3-2, Table 2, Line 32H1 Imp Plan Pipe Replacement 15,489,675 197,960,965 280,150,277 339,962,087 833,563,004 WP 3-6, Table 2, Line 1712H2 Imp Plan Emergency Pipe Repl 16,200,000 15,700,000 15,800,000 15,900,000 63,599,999 WP 3-6, Table 2, Line 1762H4 Imp Plan ILI Pipeline Retrofit 1,125,000 14,635,000 14,599,000 - 30,359,000 WP 3-6, Table 2, Line 184
Total Capital Expenditures 32,814,675 228,904,965 310,549,277 355,862,087 928,131,004 WP 3-6, Table 2, Line 186
34A StanPac Expense 4,115,000 - - - 4,115,000 WP 3-753, Table 3, Line 3KE1 Imp Plan Pipe Pressure Test 116,943,156 93,728,943 84,512,978 93,860,931 389,046,008 WP 3-757, Table 3, Line 168KE3 Imp Plan Pipeline ILI - - 1,725,000 7,866,000 9,591,000 WP 3-757, Table 3, Line 178KEX Imp Plan Pipeline Other 1,600,000 1,150,000 1,055,000 1,085,000 4,890,000 WP 3-757, Table 3, Line 183
Total Expenses 122,658,156 94,878,943 87,292,978 102,811,931 407,642,008 WP 3-757, Table 3, Line 185
Total Pipeline Modernization Costs 155,472,830 323,783,908 397,842,255 458,674,018 1,335,773,011

Pacific Gas and Electric CompanyImplementation Plan
Workpapers Supporting Chapter 3, Pipeline Modernization
Table 2 Capital Expenditures by Maintenance Activity Type (MAT)
LineNo Order PSRS Id Order Description MAT Operative
Date 2011 2012 2013 2014 Total WorkpaperReference
MapReference
1 97000512 24254 SP-3 REPL 0.04mi MP 167.28-198.48 PH1 44A 7/1/2012 - 235,000 - - 235,000 WP 3-7 WP 3-5792 97000661 24909 SP4Z REPL 0.07mi MP 8.21-8.29 PH1 44A 7/1/2012 - 374,000 - - 374,000 WP 3-11 WP 3-5803 Total MAT 44A - StanPac Capital - 609,000 - - 609,00045 30842206 23796 L-021C REPL 0.75MI MP 31.84-35.05 PH1 2H1 12/1/2014 - - 496,000 4,464,000 4,960,000 WP 3-14 WP 3-5816 30843897 24052 L-021D REPL 2.26MI MP 18.96-24.49 PH1 2H1 12/1/2013 - 1,453,000 13,076,000 - 14,529,000 WP 3-17 WP 3-5827 30842239 23727 L-021F REPL 4.24MI MP 0.00-21.16 PH1 2H1 12/1/2013 1,755 2,043,245 18,366,000 - 20,411,000 WP 3-20 WP 3-5838 30843899 24055 L-021H REPL 0.61MI MP 0.00-6.42 PH1 2H1 12/1/2014 - - 239,000 2,148,000 2,387,000 WP 3-24 WP 3-5849 30842207 23790 L-050A REPL 0.24MI MP 16.81-17.03 PH1 2H1 12/1/2014 - - 139,000 1,255,000 1,394,000 WP 3-28 WP 3-58510 30842247 23758 L-050A-1 REPL 0.09MI MP 0.66-2.32 PH1 2H1 7/1/2012 - 603,000 - - 603,000 WP 3-31 WP 3-58611 30843924 24059 L-057A REPL 7.60MI MP 8.97-16.68 PH1 2H1 12/1/2013 150,000 2,511,000 25,444,000 - 28,105,000 WP 3-34 WP 3-58712 30843925 24060 L-057A-MT REPL 0.03MI MP 0.56-0.58 PH1 2H1 7/1/2014 - - - 203,000 203,000 WP 3-37 WP 3-58813 30842170 23799 L-057B REPL 0.01MI MP 10.32-10.32 PH1 2H1 7/1/2012 - 1 - - 1 WP 3-40 WP 3-58914 30842171 23818 L-101 REPL 0.02MI MP 9.28-9.30 PH1 2H1 7/1/2012 - 1 - - 1 WP 3-43 WP 3-59015 30842130 23728 L-103 REPL 7.75MI MP 5.68-23.56 PH1 2H1 12/1/2014 150,000 2,649,000 - 26,008,000 28,807,000 WP 3-46 WP 3-59116 30865387 24897 L-105A-1 REPL 0.01MI MP 0.00-0.00 PH1 2H1 7/1/2012 - 162,000 - - 162,000 WP 3-49 WP 3-59217 30865388 24898 L-105N-3 REPL 0.03MI MP 0.00-0.00 PH1 2H1 7/1/2013 - - 185,000 - 185,000 WP 3-52 WP 3-59318 30865389 24899 L-105N-5 REPL 0.10MI MP 36.39-36.47 PH1 2H1 7/1/2012 - 507,000 - - 507,000 WP 3-55 WP 3-59419 30843913 24077 L-108_1 REPL 1.06MI MP 37.14-38.17 PH1 2H1 12/1/2014 25,000 - 328,000 3,181,000 3,534,000 WP 3-58 WP 3-59520 30842211 23815 L-108_2 REPL 2.58MI MP 48.20-50.69 PH1 2H1 12/1/2014 25,000 - 1,016,000 9,116,000 10,157,000 WP 3-61 WP 3-59621 30865390 24900 L-108_3 REPL 3.06MI MP 63.50-73.58 PH1 2H1 12/1/2013 25,000 1,273,000 11,434,000 - 12,732,000 WP 3-64 WP 3-59722 P.03741 23365 L-109_1 REPL 3.70MI MP 3.41-9.89 PH1 2H1 12/1/2012 5,300,000 27,315,000 - - 32,615,000 WP 3-67 WP 3-59823 30842248 23724 L-109_2 REPL 4.65MI MP 0.49-16.93 PH1 2H1 12/1/2013 150,000 3,156,000 34,070,000 - 37,376,000 WP 3-70 WP 3-59924 30842212 23704 L-109_3 REPL 6.06MI MP 16.93-24.00 PH1 2H1 12/1/2014 150,000 350,000 4,431,000 43,470,000 48,401,000 WP 3-74 WP 3-60025 30842214 23692 L-109_4 REPL 6.84MI MP 24.84-33.26 PH1 2H1 12/1/2014 150,000 350,000 3,459,000 35,626,000 39,585,000 WP 3-78 WP 3-60126 30842224 23795 L-109_5 REPL 0.13MI MP 34.39-45.84 PH1 2H1 12/1/2012 132,000 1,190,000 - - 1,322,000 WP 3-81 WP 3-60227 30842215 23832 L-111A REPL 6.61MI MP 19.30-27.53 PH1 2H1 12/1/2012 1,887,000 28,532,000 - - 30,419,000 WP 3-84 WP 3-60328 30843920 24084 L-114_1 REPL 0.06MI MP 16.51-16.57 PH1 2H1 7/1/2012 - 285,000 - - 285,000 WP 3-87 WP 3-60429 30841472 23688 L-114_2 REPL 7.50MI MP 9.03-28.98 PH1 2H1 12/1/2012 616,000 35,431,000 - - 36,047,000 WP 3-90 WP 3-60530 30842216 23888 L-116 REPL 0.04MI MP 0.00-0.03 PH1 2H1 7/1/2013 - - 112,000 - 112,000 WP 3-95 WP 3-60631 30865391 24901 L-118-1 REPL 0.02MI MP 0.01-0.03 PH1 2H1 7/1/2013 - - 236,000 - 236,000 WP 3-98 WP 3-60732 30842245 23743 L-118A REPL 6.87MI MP 5.62-12.55 PH1 2H1 12/1/2013 150,000 1,895,000 18,296,000 - 20,341,000 WP 3-101 WP 3-60833 30842164 23791 L-119B REPL 0.29MI MP 8.96-9.22 PH1 2H1 12/1/2013 - 104,000 939,000 - 1,043,000 WP 3-104 WP 3-60934 30865392 24902 L-119B-1 REPL 0.03MI MP 0.00-0.03 PH1 2H1 7/1/2012 - 129,000 - - 129,000 WP 3-107 WP 3-61035 30842218 23822 L-123 REPL 4.17MI MP 0.00-7.51 PH1 2H1 12/1/2014 25,000 - 1,005,000 9,023,000 10,053,000 WP 3-110 WP 3-61136 30843915 24079 L-124A REPL 4.32MI MP 20.63-26.27 PH1 2H1 12/1/2013 - 1,698,000 15,280,000 - 16,978,000 WP 3-113 WP 3-61237 30842219 23793 L-125 REPL 1.31MI MP 0.00-0.00 PH1 2H1 12/1/2014 277 - 451,723 4,065,000 4,517,000 WP 3-116 WP 3-61338 30841610 23677 L-130 REPL 0.48MI MP 0.00-0.50 PH1 2H1 12/1/2013 - 385,000 3,463,000 - 3,848,000 WP 3-119 WP 3-61439 30841473 23694 L-131_1 REPL 1.70MI MP 42.35-57.47 PH1 2H1 12/1/2012 1,198,000 10,485,000 - - 11,683,000 WP 3-122 WP 3-61540 30841475 23746 L-131_2 REPL 0.29MI MP 8.15-43.49 PH1 2H1 12/1/2012 135,000 1,212,000 - - 1,347,000 WP 3-126 WP 3-616
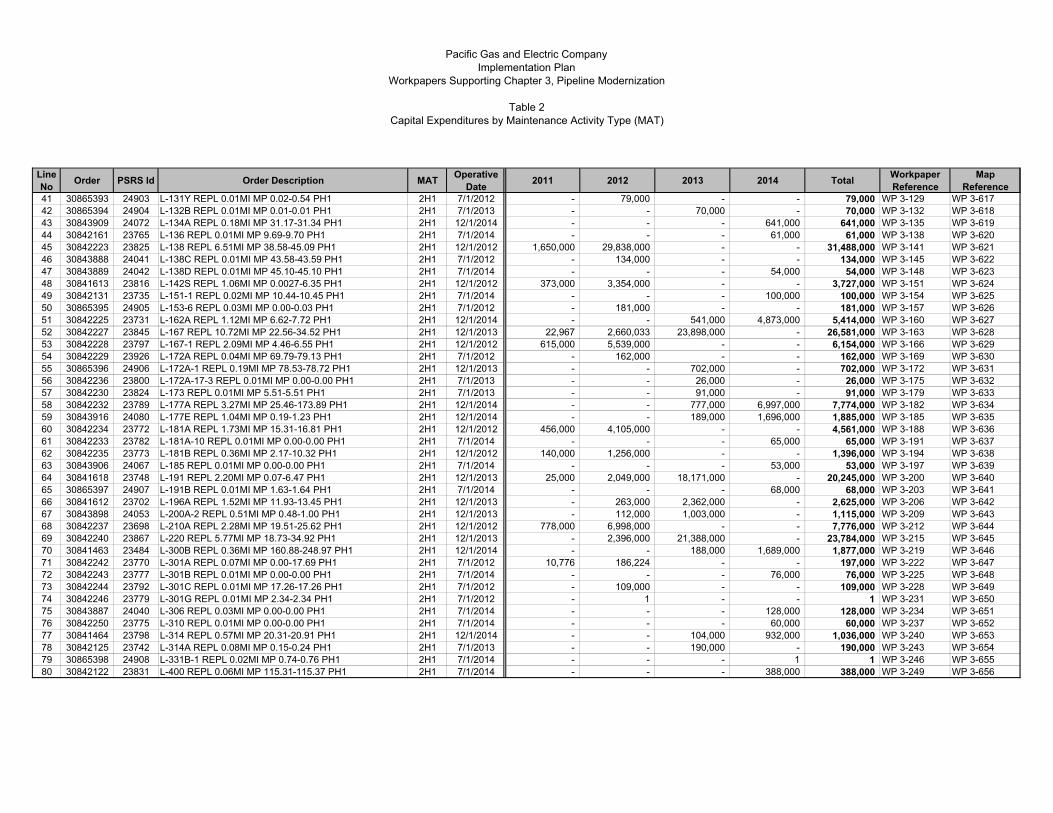
Pacific Gas and Electric CompanyImplementation Plan
Workpapers Supporting Chapter 3, Pipeline Modernization
Table 2 Capital Expenditures by Maintenance Activity Type (MAT)
LineNo Order PSRS Id Order Description MAT Operative
Date 2011 2012 2013 2014 Total WorkpaperReference
MapReference
41 30865393 24903 L-131Y REPL 0.01MI MP 0.02-0.54 PH1 2H1 7/1/2012 - 79,000 - - 79,000 WP 3-129 WP 3-61742 30865394 24904 L-132B REPL 0.01MI MP 0.01-0.01 PH1 2H1 7/1/2013 - - 70,000 - 70,000 WP 3-132 WP 3-61843 30843909 24072 L-134A REPL 0.18MI MP 31.17-31.34 PH1 2H1 12/1/2014 - - - 641,000 641,000 WP 3-135 WP 3-61944 30842161 23765 L-136 REPL 0.01MI MP 9.69-9.70 PH1 2H1 7/1/2014 - - - 61,000 61,000 WP 3-138 WP 3-62045 30842223 23825 L-138 REPL 6.51MI MP 38.58-45.09 PH1 2H1 12/1/2012 1,650,000 29,838,000 - - 31,488,000 WP 3-141 WP 3-62146 30843888 24041 L-138C REPL 0.01MI MP 43.58-43.59 PH1 2H1 7/1/2012 - 134,000 - - 134,000 WP 3-145 WP 3-62247 30843889 24042 L-138D REPL 0.01MI MP 45.10-45.10 PH1 2H1 7/1/2014 - - - 54,000 54,000 WP 3-148 WP 3-62348 30841613 23816 L-142S REPL 1.06MI MP 0.0027-6.35 PH1 2H1 12/1/2012 373,000 3,354,000 - - 3,727,000 WP 3-151 WP 3-62449 30842131 23735 L-151-1 REPL 0.02MI MP 10.44-10.45 PH1 2H1 7/1/2014 - - - 100,000 100,000 WP 3-154 WP 3-62550 30865395 24905 L-153-6 REPL 0.03MI MP 0.00-0.03 PH1 2H1 7/1/2012 - 181,000 - - 181,000 WP 3-157 WP 3-62651 30842225 23731 L-162A REPL 1.12MI MP 6.62-7.72 PH1 2H1 12/1/2014 - - 541,000 4,873,000 5,414,000 WP 3-160 WP 3-62752 30842227 23845 L-167 REPL 10.72MI MP 22.56-34.52 PH1 2H1 12/1/2013 22,967 2,660,033 23,898,000 - 26,581,000 WP 3-163 WP 3-62853 30842228 23797 L-167-1 REPL 2.09MI MP 4.46-6.55 PH1 2H1 12/1/2012 615,000 5,539,000 - - 6,154,000 WP 3-166 WP 3-62954 30842229 23926 L-172A REPL 0.04MI MP 69.79-79.13 PH1 2H1 7/1/2012 - 162,000 - - 162,000 WP 3-169 WP 3-63055 30865396 24906 L-172A-1 REPL 0.19MI MP 78.53-78.72 PH1 2H1 12/1/2013 - - 702,000 - 702,000 WP 3-172 WP 3-63156 30842236 23800 L-172A-17-3 REPL 0.01MI MP 0.00-0.00 PH1 2H1 7/1/2013 - - 26,000 - 26,000 WP 3-175 WP 3-63257 30842230 23824 L-173 REPL 0.01MI MP 5.51-5.51 PH1 2H1 7/1/2013 - - 91,000 - 91,000 WP 3-179 WP 3-63358 30842232 23789 L-177A REPL 3.27MI MP 25.46-173.89 PH1 2H1 12/1/2014 - - 777,000 6,997,000 7,774,000 WP 3-182 WP 3-63459 30843916 24080 L-177E REPL 1.04MI MP 0.19-1.23 PH1 2H1 12/1/2014 - - 189,000 1,696,000 1,885,000 WP 3-185 WP 3-63560 30842234 23772 L-181A REPL 1.73MI MP 15.31-16.81 PH1 2H1 12/1/2012 456,000 4,105,000 - - 4,561,000 WP 3-188 WP 3-63661 30842233 23782 L-181A-10 REPL 0.01MI MP 0.00-0.00 PH1 2H1 7/1/2014 - - - 65,000 65,000 WP 3-191 WP 3-63762 30842235 23773 L-181B REPL 0.36MI MP 2.17-10.32 PH1 2H1 12/1/2012 140,000 1,256,000 - - 1,396,000 WP 3-194 WP 3-63863 30843906 24067 L-185 REPL 0.01MI MP 0.00-0.00 PH1 2H1 7/1/2014 - - - 53,000 53,000 WP 3-197 WP 3-63964 30841618 23748 L-191 REPL 2.20MI MP 0.07-6.47 PH1 2H1 12/1/2013 25,000 2,049,000 18,171,000 - 20,245,000 WP 3-200 WP 3-64065 30865397 24907 L-191B REPL 0.01MI MP 1.63-1.64 PH1 2H1 7/1/2014 - - - 68,000 68,000 WP 3-203 WP 3-64166 30841612 23702 L-196A REPL 1.52MI MP 11.93-13.45 PH1 2H1 12/1/2013 - 263,000 2,362,000 - 2,625,000 WP 3-206 WP 3-64267 30843898 24053 L-200A-2 REPL 0.51MI MP 0.48-1.00 PH1 2H1 12/1/2013 - 112,000 1,003,000 - 1,115,000 WP 3-209 WP 3-64368 30842237 23698 L-210A REPL 2.28MI MP 19.51-25.62 PH1 2H1 12/1/2012 778,000 6,998,000 - - 7,776,000 WP 3-212 WP 3-64469 30842240 23867 L-220 REPL 5.77MI MP 18.73-34.92 PH1 2H1 12/1/2013 - 2,396,000 21,388,000 - 23,784,000 WP 3-215 WP 3-64570 30841463 23484 L-300B REPL 0.36MI MP 160.88-248.97 PH1 2H1 12/1/2014 - - 188,000 1,689,000 1,877,000 WP 3-219 WP 3-64671 30842242 23770 L-301A REPL 0.07MI MP 0.00-17.69 PH1 2H1 7/1/2012 10,776 186,224 - - 197,000 WP 3-222 WP 3-64772 30842243 23777 L-301B REPL 0.01MI MP 0.00-0.00 PH1 2H1 7/1/2014 - - - 76,000 76,000 WP 3-225 WP 3-64873 30842244 23792 L-301C REPL 0.01MI MP 17.26-17.26 PH1 2H1 7/1/2012 - 109,000 - - 109,000 WP 3-228 WP 3-64974 30842246 23779 L-301G REPL 0.01MI MP 2.34-2.34 PH1 2H1 7/1/2012 - 1 - - 1 WP 3-231 WP 3-65075 30843887 24040 L-306 REPL 0.03MI MP 0.00-0.00 PH1 2H1 7/1/2014 - - - 128,000 128,000 WP 3-234 WP 3-65176 30842250 23775 L-310 REPL 0.01MI MP 0.00-0.00 PH1 2H1 7/1/2014 - - - 60,000 60,000 WP 3-237 WP 3-65277 30841464 23798 L-314 REPL 0.57MI MP 20.31-20.91 PH1 2H1 12/1/2014 - - 104,000 932,000 1,036,000 WP 3-240 WP 3-65378 30842125 23742 L-314A REPL 0.08MI MP 0.15-0.24 PH1 2H1 7/1/2013 - - 190,000 - 190,000 WP 3-243 WP 3-65479 30865398 24908 L-331B-1 REPL 0.02MI MP 0.74-0.76 PH1 2H1 7/1/2014 - - - 1 1 WP 3-246 WP 3-65580 30842122 23831 L-400 REPL 0.06MI MP 115.31-115.37 PH1 2H1 7/1/2014 - - - 388,000 388,000 WP 3-249 WP 3-656

Pacific Gas and Electric CompanyImplementation Plan
Workpapers Supporting Chapter 3, Pipeline Modernization
Table 2 Capital Expenditures by Maintenance Activity Type (MAT)
LineNo Order PSRS Id Order Description MAT Operative
Date 2011 2012 2013 2014 Total WorkpaperReference
MapReference
81 30841476 23736 DFM-0107-01 REPL 0.24MI MP 0.00-0.24 PH1 2H1 12/1/2014 - - 122,000 1,100,000 1,222,000 WP 3-254 WP 3-65782 30842180 23774 DFM-0107-02 REPL 0.02MI MP 0.00-0.01 PH1 2H1 7/1/2014 - - - 102,000 102,000 WP 3-257 WP 3-65883 30842132 23739 DFM-0205-01 REPL 0.01MI MP 0.00-0.00 PH1 2H1 7/1/2014 - - - 65,000 65,000 WP 3-260 WP 3-65984 30842128 23693 DFM-0223-03 REPL 0.07MI MP 0.00-0.00 PH1 2H1 7/1/2014 - - - 131,000 131,000 WP 3-263 WP 3-66085 30842163 23781 DFM-0401-10 REPL 0.01MI MP 0.00-0.01 PH1 2H1 7/1/2014 - - - 80,000 80,000 WP 3-266 WP 3-66186 30841720 23759 DFM-0403-10 REPL 0.01MI MP 0.00-0.00 PH1 2H1 7/1/2014 - - - 57,000 57,000 WP 3-269 WP 3-66287 30842168 23849 DFM-0404-11 REPL 0.04MI MP 0.00-0.04 PH1 2H1 7/1/2013 - - 230,000 - 230,000 WP 3-272 WP 3-66388 30842175 23786 DFM-0405-01 REPL 8.04MI MP 2.04-12.36 PH1 2H1 12/1/2013 - 3,571,000 32,100,000 - 35,671,000 WP 3-275 WP 3-66489 30842129 23729 DFM-0405-16 REPL 0.01MI MP 0.00-0.00 PH1 2H1 7/1/2014 - - - 57,000 57,000 WP 3-279 WP 3-66590 30842176 23811 DFM-0603-01 REPL 0.58MI MP 0.00-0.57 PH1 2H1 12/1/2013 - 183,000 1,528,000 - 1,711,000 WP 3-282 WP 3-66691 30843921 24085 DFM-0604-06 REPL 0.01MI MP 0.00-0.00 PH1 2H1 7/1/2014 1,242 - - 55,758 57,000 WP 3-286 WP 3-66792 30842189 23780 DFM-0604-16 REPL 0.50MI MP 0.00-0.500 PH1 2H1 12/1/2013 - 113,000 1,021,000 - 1,134,000 WP 3-289 WP 3-66893 30842196 23760 DFM-0611-08 REPL 0.06MI MP 0.00-0.06 PH1 2H1 7/1/2013 446 - 336,554 - 337,000 WP 3-292 WP 3-66994 30842203 23725 DFM-0614-10 REPL 0.09MI MP 0.00-0.00 PH1 2H1 7/1/2014 1,312 - - 511,688 513,000 WP 3-295 WP 3-67095 30842238 23707 DFM-0617-06 REPL 0.01MI MP 10.63-10.63 PH1 2H1 7/1/2014 - - - 110,000 110,000 WP 3-298 WP 3-67196 30842194 23716 DFM-0619-05 REPL 0.08MI MP 1.29-1.38 PH1 2H1 7/1/2014 - - - 731,000 731,000 WP 3-301 WP 3-67297 30842177 23930 DFM-0627-01 REPL 0.02MI MP 0.00-0.02 PH1 2H1 7/1/2013 - - 189,000 - 189,000 WP 3-304 WP 3-67398 30842199 23855 DFM-0630-01 REPL 0.14MI MP 0.00-10.55 PH1 2H1 12/1/2014 - - 29,000 265,000 294,000 WP 3-307 WP 3-67499 30865351 24882 DFM-0630-06 REPL 0.10MI MP 0.00-0.10 PH1 2H1 12/1/2014 - - 36,000 320,000 356,000 WP 3-310 WP 3-675
100 30865352 24883 DFM-0804-01 REPL 0.01MI MP 0.21-1.16 PH1 2H1 7/1/2012 - 84,000 - - 84,000 WP 3-313 WP 3-676101 30865353 24884 DFM-0804-03 REPL 0.02MI MP 0.00-0.02 PH1 2H1 7/1/2014 - - - 135,000 135,000 WP 3-316 WP 3-677102 30843917 24081 DFM-0809-01 REPL 0.03MI MP 0.00-0.03 PH1 2H1 7/1/2014 - - - 158,000 158,000 WP 3-319 WP 3-678103 30842204 23722 DFM-0810-01 REPL 0.03MI MP 0.00-0.03 PH1 2H1 7/1/2014 - - - 80,000 80,000 WP 3-322 WP 3-679104 30865355 24885 DFM-0837-01 REPL 0.03MI MP 1.52-1.54 PH1 2H1 7/1/2014 - - - 133,000 133,000 WP 3-325 WP 3-680105 30865356 24886 DFM-1013-02 REPL 0.01MI MP 0.00-0.00 PH1 2H1 7/1/2014 - - - 62,000 62,000 WP 3-328 WP 3-681106 30865357 24887 DFM-1017-01 REPL 0.01MI MP 0.01-0.01 PH1 2H1 7/1/2013 - - 72,000 - 72,000 WP 3-331 WP 3-682107 30842178 23807 DFM-1020-01 REPL 2.69MI MP 0.00-2.69 PH1 2H1 12/1/2014 25,000 - 797,000 7,146,000 7,968,000 WP 3-334 WP 3-683108 30842179 23810 DFM-1024-02 REPL 0.02MI MP 0.00-0.02 PH1 2H1 7/1/2014 - - - 108,000 108,000 WP 3-337 WP 3-684109 30841611 23686 DFM-1202-12 REPL 0.01MI MP 1.90-1.92 PH1 2H1 7/1/2013 - - 76,000 - 76,000 WP 3-340 WP 3-685110 30842181 23685 DFM-1202-15 REPL 0.02MI MP 0.00-0.02 PH1 2H1 7/1/2012 - 101,000 - - 101,000 WP 3-343 WP 3-686111 30842127 23711 DFM-1202-16 REPL 0.08MI MP 0.00-0.08 PH1 2H1 7/1/2013 - - 342,000 - 342,000 WP 3-346 WP 3-687112 30842182 23828 DFM-1209-01 REPL 0.34MI MP 4.29-4.64 PH1 2H1 12/1/2014 - - 116,000 1,044,000 1,160,000 WP 3-349 WP 3-688113 30842221 23717 DFM-1209-05 REPL 0.03MI MP 4.99-5.02 PH1 2H1 7/1/2014 1,360 - - 222,640 224,000 WP 3-352 WP 3-689114 30842183 23821 DFM-1213-01 REPL 0.26MI MP 0.55-3.51 PH1 2H1 7/1/2014 - - - 632,000 632,000 WP 3-355 WP 3-690115 30842220 23726 DFM-1220-01 REPL 0.01MI MP 0.86-0.86 PH1 2H1 7/1/2013 - - 63,000 - 63,000 WP 3-358 WP 3-691116 30865358 24888 DFM-1302-01 REPL 0.01MI MP 0.00-0.00 PH1 2H1 7/1/2013 - - 133,000 - 133,000 WP 3-361 WP 3-692117 30842172 23830 DFM-1302-02 REPL 0.01MI MP 0.00-0.00 PH1 2H1 7/1/2013 - - 82,000 - 82,000 WP 3-364 WP 3-693118 30842185 23802 DFM-1306-01 REPL 0.04MI MP 1.48-4.19 PH1 2H1 7/1/2013 - - 325,000 - 325,000 WP 3-367 WP 3-694119 30865359 24889 DFM-1306-06 REPL 0.02MI MP 0.00-0.01 PH1 2H1 7/1/2013 - - 179,000 - 179,000 WP 3-370 WP 3-695120 30842186 23805 DFM-1307-06 REPL 0.03MI MP 0.00-0.00 PH1 2H1 7/1/2014 - - - 160,000 160,000 WP 3-373 WP 3-696
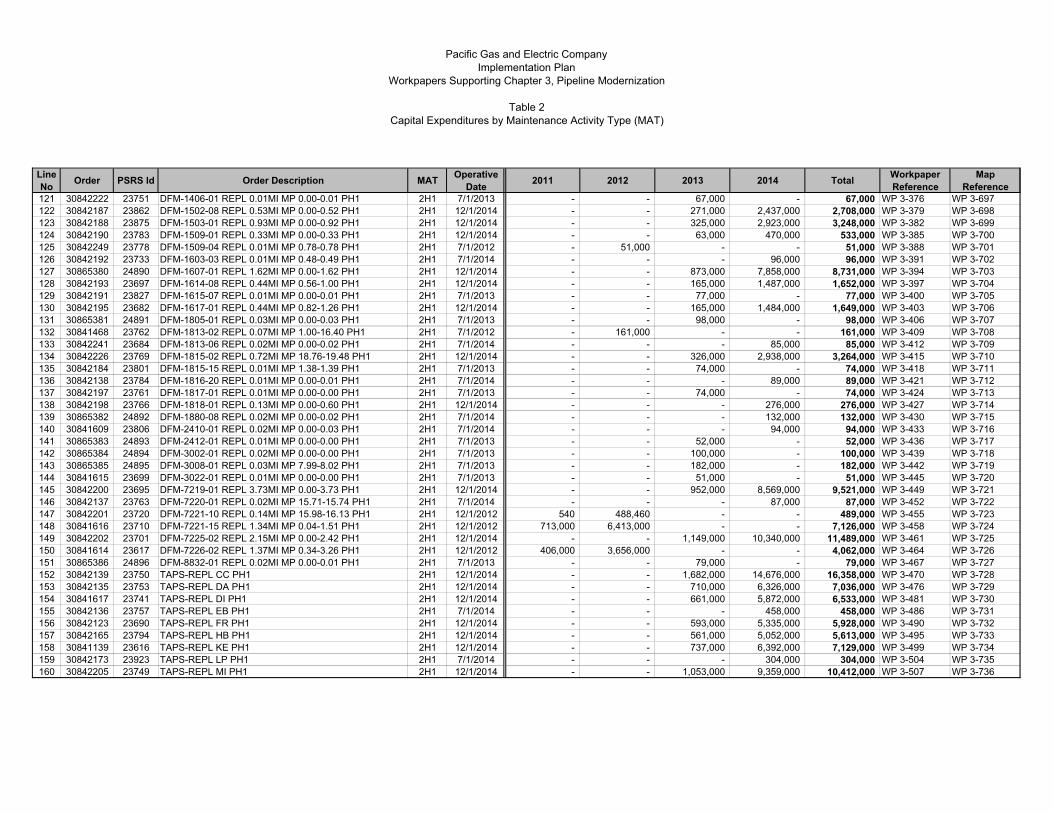
Pacific Gas and Electric CompanyImplementation Plan
Workpapers Supporting Chapter 3, Pipeline Modernization
Table 2 Capital Expenditures by Maintenance Activity Type (MAT)
LineNo Order PSRS Id Order Description MAT Operative
Date 2011 2012 2013 2014 Total WorkpaperReference
MapReference
121 30842222 23751 DFM-1406-01 REPL 0.01MI MP 0.00-0.01 PH1 2H1 7/1/2013 - - 67,000 - 67,000 WP 3-376 WP 3-697122 30842187 23862 DFM-1502-08 REPL 0.53MI MP 0.00-0.52 PH1 2H1 12/1/2014 - - 271,000 2,437,000 2,708,000 WP 3-379 WP 3-698123 30842188 23875 DFM-1503-01 REPL 0.93MI MP 0.00-0.92 PH1 2H1 12/1/2014 - - 325,000 2,923,000 3,248,000 WP 3-382 WP 3-699124 30842190 23783 DFM-1509-01 REPL 0.33MI MP 0.00-0.33 PH1 2H1 12/1/2014 - - 63,000 470,000 533,000 WP 3-385 WP 3-700125 30842249 23778 DFM-1509-04 REPL 0.01MI MP 0.78-0.78 PH1 2H1 7/1/2012 - 51,000 - - 51,000 WP 3-388 WP 3-701126 30842192 23733 DFM-1603-03 REPL 0.01MI MP 0.48-0.49 PH1 2H1 7/1/2014 - - - 96,000 96,000 WP 3-391 WP 3-702127 30865380 24890 DFM-1607-01 REPL 1.62MI MP 0.00-1.62 PH1 2H1 12/1/2014 - - 873,000 7,858,000 8,731,000 WP 3-394 WP 3-703128 30842193 23697 DFM-1614-08 REPL 0.44MI MP 0.56-1.00 PH1 2H1 12/1/2014 - - 165,000 1,487,000 1,652,000 WP 3-397 WP 3-704129 30842191 23827 DFM-1615-07 REPL 0.01MI MP 0.00-0.01 PH1 2H1 7/1/2013 - - 77,000 - 77,000 WP 3-400 WP 3-705130 30842195 23682 DFM-1617-01 REPL 0.44MI MP 0.82-1.26 PH1 2H1 12/1/2014 - - 165,000 1,484,000 1,649,000 WP 3-403 WP 3-706131 30865381 24891 DFM-1805-01 REPL 0.03MI MP 0.00-0.03 PH1 2H1 7/1/2013 - - 98,000 - 98,000 WP 3-406 WP 3-707132 30841468 23762 DFM-1813-02 REPL 0.07MI MP 1.00-16.40 PH1 2H1 7/1/2012 - 161,000 - - 161,000 WP 3-409 WP 3-708133 30842241 23684 DFM-1813-06 REPL 0.02MI MP 0.00-0.02 PH1 2H1 7/1/2014 - - - 85,000 85,000 WP 3-412 WP 3-709134 30842226 23769 DFM-1815-02 REPL 0.72MI MP 18.76-19.48 PH1 2H1 12/1/2014 - - 326,000 2,938,000 3,264,000 WP 3-415 WP 3-710135 30842184 23801 DFM-1815-15 REPL 0.01MI MP 1.38-1.39 PH1 2H1 7/1/2013 - - 74,000 - 74,000 WP 3-418 WP 3-711136 30842138 23784 DFM-1816-20 REPL 0.01MI MP 0.00-0.01 PH1 2H1 7/1/2014 - - - 89,000 89,000 WP 3-421 WP 3-712137 30842197 23761 DFM-1817-01 REPL 0.01MI MP 0.00-0.00 PH1 2H1 7/1/2013 - - 74,000 - 74,000 WP 3-424 WP 3-713138 30842198 23766 DFM-1818-01 REPL 0.13MI MP 0.00-0.60 PH1 2H1 12/1/2014 - - - 276,000 276,000 WP 3-427 WP 3-714139 30865382 24892 DFM-1880-08 REPL 0.02MI MP 0.00-0.02 PH1 2H1 7/1/2014 - - - 132,000 132,000 WP 3-430 WP 3-715140 30841609 23806 DFM-2410-01 REPL 0.02MI MP 0.00-0.03 PH1 2H1 7/1/2014 - - - 94,000 94,000 WP 3-433 WP 3-716141 30865383 24893 DFM-2412-01 REPL 0.01MI MP 0.00-0.00 PH1 2H1 7/1/2013 - - 52,000 - 52,000 WP 3-436 WP 3-717142 30865384 24894 DFM-3002-01 REPL 0.02MI MP 0.00-0.00 PH1 2H1 7/1/2013 - - 100,000 - 100,000 WP 3-439 WP 3-718143 30865385 24895 DFM-3008-01 REPL 0.03MI MP 7.99-8.02 PH1 2H1 7/1/2013 - - 182,000 - 182,000 WP 3-442 WP 3-719144 30841615 23699 DFM-3022-01 REPL 0.01MI MP 0.00-0.00 PH1 2H1 7/1/2013 - - 51,000 - 51,000 WP 3-445 WP 3-720145 30842200 23695 DFM-7219-01 REPL 3.73MI MP 0.00-3.73 PH1 2H1 12/1/2014 - - 952,000 8,569,000 9,521,000 WP 3-449 WP 3-721146 30842137 23763 DFM-7220-01 REPL 0.02MI MP 15.71-15.74 PH1 2H1 7/1/2014 - - - 87,000 87,000 WP 3-452 WP 3-722147 30842201 23720 DFM-7221-10 REPL 0.14MI MP 15.98-16.13 PH1 2H1 12/1/2012 540 488,460 - - 489,000 WP 3-455 WP 3-723148 30841616 23710 DFM-7221-15 REPL 1.34MI MP 0.04-1.51 PH1 2H1 12/1/2012 713,000 6,413,000 - - 7,126,000 WP 3-458 WP 3-724149 30842202 23701 DFM-7225-02 REPL 2.15MI MP 0.00-2.42 PH1 2H1 12/1/2014 - - 1,149,000 10,340,000 11,489,000 WP 3-461 WP 3-725150 30841614 23617 DFM-7226-02 REPL 1.37MI MP 0.34-3.26 PH1 2H1 12/1/2012 406,000 3,656,000 - - 4,062,000 WP 3-464 WP 3-726151 30865386 24896 DFM-8832-01 REPL 0.02MI MP 0.00-0.01 PH1 2H1 7/1/2013 - - 79,000 - 79,000 WP 3-467 WP 3-727152 30842139 23750 TAPS-REPL CC PH1 2H1 12/1/2014 - - 1,682,000 14,676,000 16,358,000 WP 3-470 WP 3-728153 30842135 23753 TAPS-REPL DA PH1 2H1 12/1/2014 - - 710,000 6,326,000 7,036,000 WP 3-476 WP 3-729154 30841617 23741 TAPS-REPL DI PH1 2H1 12/1/2014 - - 661,000 5,872,000 6,533,000 WP 3-481 WP 3-730155 30842136 23757 TAPS-REPL EB PH1 2H1 7/1/2014 - - - 458,000 458,000 WP 3-486 WP 3-731156 30842123 23690 TAPS-REPL FR PH1 2H1 12/1/2014 - - 593,000 5,335,000 5,928,000 WP 3-490 WP 3-732157 30842165 23794 TAPS-REPL HB PH1 2H1 12/1/2014 - - 561,000 5,052,000 5,613,000 WP 3-495 WP 3-733158 30841139 23616 TAPS-REPL KE PH1 2H1 12/1/2014 - - 737,000 6,392,000 7,129,000 WP 3-499 WP 3-734159 30842173 23923 TAPS-REPL LP PH1 2H1 7/1/2014 - - - 304,000 304,000 WP 3-504 WP 3-735160 30842205 23749 TAPS-REPL MI PH1 2H1 12/1/2014 - - 1,053,000 9,359,000 10,412,000 WP 3-507 WP 3-736

Pacific Gas and Electric CompanyImplementation Plan
Workpapers Supporting Chapter 3, Pipeline Modernization
Table 2 Capital Expenditures by Maintenance Activity Type (MAT)
LineNo Order PSRS Id Order Description MAT Operative
Date 2011 2012 2013 2014 Total WorkpaperReference
MapReference
161 30842124 23718 TAPS-REPL NB PH1 2H1 12/1/2014 - - 246,000 2,165,000 2,411,000 WP 3-509 WP 3-737162 30842162 23776 TAPS-REPL NV PH1 2H1 12/1/2014 - - 1,024,000 9,063,000 10,087,000 WP 3-514 WP 3-738163 30842133 23740 TAPS-REPL PN PH1 2H1 12/1/2014 - - 1,128,000 10,087,000 11,215,000 WP 3-518 WP 3-739164 30842174 23928 TAPS-REPL SA PH1 2H1 12/1/2014 - - 1,490,000 11,621,000 13,111,000 WP 3-524 WP 3-740165 30842166 23817 TAPS-REPL SF PH1 2H1 12/1/2014 - - 257,000 2,309,000 2,566,000 WP 3-530 WP 3-741166 30842169 23787 TAPS-REPL SI PH1 2H1 12/1/2014 - - 497,000 2,974,000 3,471,000 WP 3-533 WP 3-742167 30842126 23689 TAPS-REPL SJ PH1 2H1 12/1/2014 - - 847,000 7,606,000 8,453,000 WP 3-538 WP 3-743168 30842134 23744 TAPS-REPL SO PH1 2H1 12/1/2014 - - 139,000 1,251,000 1,390,000 WP 3-543 WP 3-744169 30841474 23706 TAPS-REPL ST PH1 2H1 12/1/2014 - - 1,878,000 16,824,000 18,702,000 WP 3-546 WP 3-745170 30842160 23785 TAPS-REPL YO PH1 2H1 12/1/2014 - - 1,562,000 13,017,000 14,579,000 WP 3-551 WP 3-746171 Total MAT 2H1 - Imp Plan Pipe Replacement 15,489,675 197,960,965 280,150,277 339,962,087 833,563,004172173 30843926 24030 Emergency Pipe Replacement 2H2 12/31/2014 2,000,000 2,000,000 2,000,000 2,000,000 8,000,000 WP 3-557 n/a174 30846247 24158 Strength Test-Capital Valves and Testheads 2H2 12/31/2014 6,700,000 3,700,000 3,800,000 3,900,000 18,100,000 WP 3-558 n/a175 30866501 25002 Post StrengthTest Emergency Replacements 2H2 12/31/2014 7,500,000 10,000,000 10,000,000 10,000,000 37,500,000 WP 3-559 n/a176 Total MAT 2H2 - Imp Plan Emergency Pipe Repl 16,200,000 15,700,000 15,800,000 15,900,000 63,599,999177178 30847124 24009 L-131 MP 50.5-57.4 UPGRADE PH-1 2H4 11/1/2012 150,000 1,500,000 357,000 - 2,007,000 WP 3-560 WP 3-747179 30846928 24025 L-132 MP 31.9-38.4 UPGRADE PH-1 2H4 11/1/2012 75,000 1,500,000 462,000 - 2,037,000 WP 3-563 WP 3-748180 30846926 24023 L-300A MP 299-352 UPGRADE PH-1 2H4 11/1/2013 150,000 1,000,000 6,935,000 - 8,085,000 WP 3-566 WP 3-749181 30846925 24021 L-300A MP 353-391 UPGRADE PH-1 2H4 11/1/2012 300,000 4,534,000 - - 4,834,000 WP 3-570 WP 3-750182 30846924 24017 L-300B MP 299-353 UPGRADE PH-1 2H4 11/1/2013 150,000 1,000,000 6,845,000 - 7,995,000 WP 3-573 WP 3-751183 30846923 24012 L-300B MP 353-390 UPGRADE PH-1 2H4 11/1/2012 300,000 5,101,000 - - 5,401,000 WP 3-576 WP 3-752184 Total MAT 2H4 - Imp Plan ILI Pipeline Retrofit 1,125,000 14,635,000 14,599,000 - 30,359,000185186 Total Pipeline Modernization Capital Projects 32,814,675 228,904,965 310,549,277 355,862,087 928,131,004
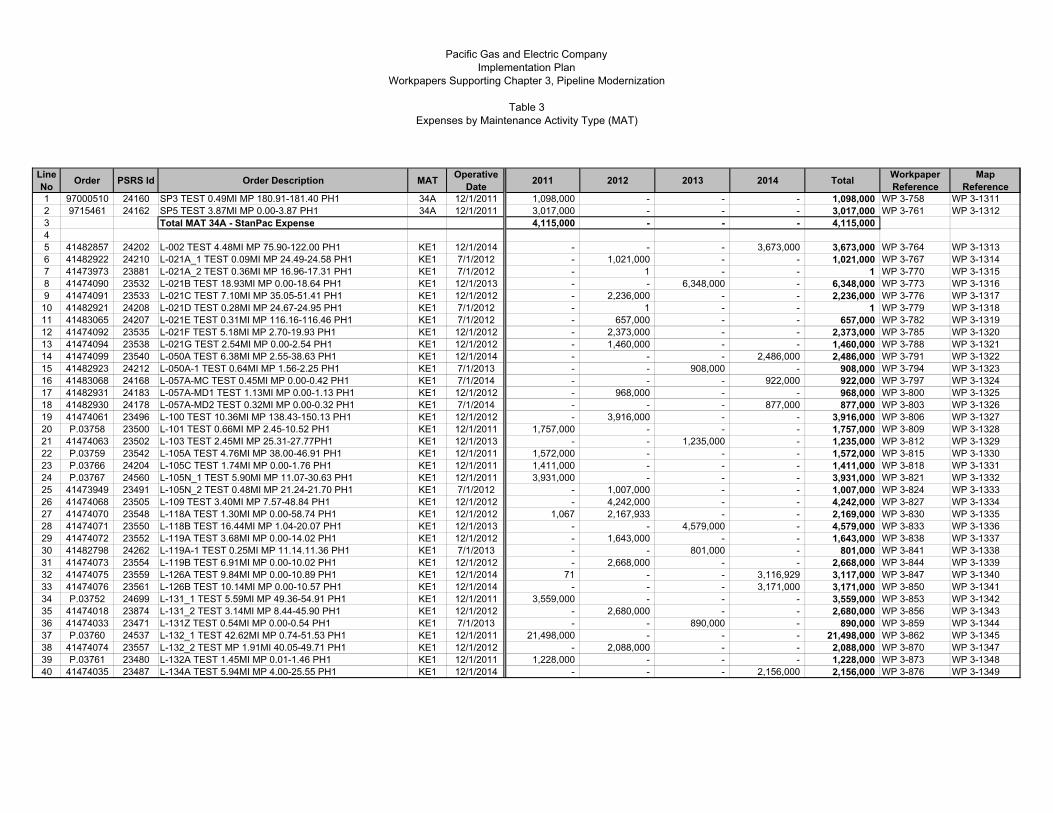
Pacific Gas and Electric CompanyImplementation Plan
Workpapers Supporting Chapter 3, Pipeline Modernization
Table 3 Expenses by Maintenance Activity Type (MAT)
LineNo Order PSRS Id Order Description MAT Operative
Date 2011 2012 2013 2014 Total WorkpaperReference
MapReference
1 97000510 24160 SP3 TEST 0.49MI MP 180.91-181.40 PH1 34A 12/1/2011 1,098,000 - - - 1,098,000 WP 3-758 WP 3-13112 9715461 24162 SP5 TEST 3.87MI MP 0.00-3.87 PH1 34A 12/1/2011 3,017,000 - - - 3,017,000 WP 3-761 WP 3-13123 Total MAT 34A - StanPac Expense 4,115,000 - - - 4,115,00045 41482857 24202 L-002 TEST 4.48MI MP 75.90-122.00 PH1 KE1 12/1/2014 - - - 3,673,000 3,673,000 WP 3-764 WP 3-13136 41482922 24210 L-021A_1 TEST 0.09MI MP 24.49-24.58 PH1 KE1 7/1/2012 - 1,021,000 - - 1,021,000 WP 3-767 WP 3-13147 41473973 23881 L-021A_2 TEST 0.36MI MP 16.96-17.31 PH1 KE1 7/1/2012 - 1 - - 1 WP 3-770 WP 3-13158 41474090 23532 L-021B TEST 18.93MI MP 0.00-18.64 PH1 KE1 12/1/2013 - - 6,348,000 - 6,348,000 WP 3-773 WP 3-13169 41474091 23533 L-021C TEST 7.10MI MP 35.05-51.41 PH1 KE1 12/1/2012 - 2,236,000 - - 2,236,000 WP 3-776 WP 3-131710 41482921 24208 L-021D TEST 0.28MI MP 24.67-24.95 PH1 KE1 7/1/2012 - 1 - - 1 WP 3-779 WP 3-131811 41483065 24207 L-021E TEST 0.31MI MP 116.16-116.46 PH1 KE1 7/1/2012 - 657,000 - - 657,000 WP 3-782 WP 3-131912 41474092 23535 L-021F TEST 5.18MI MP 2.70-19.93 PH1 KE1 12/1/2012 - 2,373,000 - - 2,373,000 WP 3-785 WP 3-132013 41474094 23538 L-021G TEST 2.54MI MP 0.00-2.54 PH1 KE1 12/1/2012 - 1,460,000 - - 1,460,000 WP 3-788 WP 3-132114 41474099 23540 L-050A TEST 6.38MI MP 2.55-38.63 PH1 KE1 12/1/2014 - - - 2,486,000 2,486,000 WP 3-791 WP 3-132215 41482923 24212 L-050A-1 TEST 0.64MI MP 1.56-2.25 PH1 KE1 7/1/2013 - - 908,000 - 908,000 WP 3-794 WP 3-132316 41483068 24168 L-057A-MC TEST 0.45MI MP 0.00-0.42 PH1 KE1 7/1/2014 - - - 922,000 922,000 WP 3-797 WP 3-132417 41482931 24183 L-057A-MD1 TEST 1.13MI MP 0.00-1.13 PH1 KE1 12/1/2012 - 968,000 - - 968,000 WP 3-800 WP 3-132518 41482930 24178 L-057A-MD2 TEST 0.32MI MP 0.00-0.32 PH1 KE1 7/1/2014 - - - 877,000 877,000 WP 3-803 WP 3-132619 41474061 23496 L-100 TEST 10.36MI MP 138.43-150.13 PH1 KE1 12/1/2012 - 3,916,000 - - 3,916,000 WP 3-806 WP 3-132720 P.03758 23500 L-101 TEST 0.66MI MP 2.45-10.52 PH1 KE1 12/1/2011 1,757,000 - - - 1,757,000 WP 3-809 WP 3-132821 41474063 23502 L-103 TEST 2.45MI MP 25.31-27.77PH1 KE1 12/1/2013 - - 1,235,000 - 1,235,000 WP 3-812 WP 3-132922 P.03759 23542 L-105A TEST 4.76MI MP 38.00-46.91 PH1 KE1 12/1/2011 1,572,000 - - - 1,572,000 WP 3-815 WP 3-133023 P.03766 24204 L-105C TEST 1.74MI MP 0.00-1.76 PH1 KE1 12/1/2011 1,411,000 - - - 1,411,000 WP 3-818 WP 3-133124 P.03767 24560 L-105N_1 TEST 5.90MI MP 11.07-30.63 PH1 KE1 12/1/2011 3,931,000 - - - 3,931,000 WP 3-821 WP 3-133225 41473949 23491 L-105N_2 TEST 0.48MI MP 21.24-21.70 PH1 KE1 7/1/2012 - 1,007,000 - - 1,007,000 WP 3-824 WP 3-133326 41474068 23505 L-109 TEST 3.40MI MP 7.57-48.84 PH1 KE1 12/1/2012 - 4,242,000 - - 4,242,000 WP 3-827 WP 3-133427 41474070 23548 L-118A TEST 1.30MI MP 0.00-58.74 PH1 KE1 12/1/2012 1,067 2,167,933 - - 2,169,000 WP 3-830 WP 3-133528 41474071 23550 L-118B TEST 16.44MI MP 1.04-20.07 PH1 KE1 12/1/2013 - - 4,579,000 - 4,579,000 WP 3-833 WP 3-133629 41474072 23552 L-119A TEST 3.68MI MP 0.00-14.02 PH1 KE1 12/1/2012 - 1,643,000 - - 1,643,000 WP 3-838 WP 3-133730 41482798 24262 L-119A-1 TEST 0.25MI MP 11.14.11.36 PH1 KE1 7/1/2013 - - 801,000 - 801,000 WP 3-841 WP 3-133831 41474073 23554 L-119B TEST 6.91MI MP 0.00-10.02 PH1 KE1 12/1/2012 - 2,668,000 - - 2,668,000 WP 3-844 WP 3-133932 41474075 23559 L-126A TEST 9.84MI MP 0.00-10.89 PH1 KE1 12/1/2014 71 - - 3,116,929 3,117,000 WP 3-847 WP 3-134033 41474076 23561 L-126B TEST 10.14MI MP 0.00-10.57 PH1 KE1 12/1/2014 - - - 3,171,000 3,171,000 WP 3-850 WP 3-134134 P.03752 24699 L-131_1 TEST 5.59MI MP 49.36-54.91 PH1 KE1 12/1/2011 3,559,000 - - - 3,559,000 WP 3-853 WP 3-134235 41474018 23874 L-131_2 TEST 3.14MI MP 8.44-45.90 PH1 KE1 12/1/2012 - 2,680,000 - - 2,680,000 WP 3-856 WP 3-134336 41474033 23471 L-131Z TEST 0.54MI MP 0.00-0.54 PH1 KE1 7/1/2013 - - 890,000 - 890,000 WP 3-859 WP 3-134437 P.03760 24537 L-132_1 TEST 42.62MI MP 0.74-51.53 PH1 KE1 12/1/2011 21,498,000 - - - 21,498,000 WP 3-862 WP 3-134538 41474074 23557 L-132_2 TEST MP 1.91MI 40.05-49.71 PH1 KE1 12/1/2012 - 2,088,000 - - 2,088,000 WP 3-870 WP 3-134739 P.03761 23480 L-132A TEST 1.45MI MP 0.01-1.46 PH1 KE1 12/1/2011 1,228,000 - - - 1,228,000 WP 3-873 WP 3-134840 41474035 23487 L-134A TEST 5.94MI MP 4.00-25.55 PH1 KE1 12/1/2014 - - - 2,156,000 2,156,000 WP 3-876 WP 3-1349

Pacific Gas and Electric CompanyImplementation Plan
Workpapers Supporting Chapter 3, Pipeline Modernization
Table 3 Expenses by Maintenance Activity Type (MAT)
LineNo Order PSRS Id Order Description MAT Operative
Date 2011 2012 2013 2014 Total WorkpaperReference
MapReference
41 41474036 23489 L-137B TEST 5.29MI MP 0.00-7.37 PH1 KE1 12/1/2013 - - 2,220,000 - 2,220,000 WP 3-879 WP 3-135042 41474080 23510 L-138 TEST 17.09MI MP 22.04-45.39 PH1 KE1 12/1/2012 - 5,841,000 - - 5,841,000 WP 3-882 WP 3-135143 41474037 23493 L-142N TEST 11.67MI MP 0.00-14.05 PH1 KE1 12/1/2012 - 4,373,000 - - 4,373,000 WP 3-886 WP 3-135244 41474038 23495 L-142S TEST 2.28MI MP 0.02-11.48 PH1 KE1 12/1/2012 - 1,637,000 - - 1,637,000 WP 3-891 WP 3-135345 P.03762 24548 L-147 TEST 2.88MI MP 0.40-3.40 PH1 KE1 12/1/2011 2,491,000 - - - 2,491,000 WP 3-894 WP 3-135446 41474082 23513 L-148 TEST 17.62MI MP 0.00-17.63 PH1 KE1 12/1/2011 3,922,000 - - - 3,922,000 WP 3-897 WP 3-135547 41474083 23515 L-150 TEST 6.63MI MP 6.15-18.09 PH1 KE1 12/1/2013 - - 2,699,000 - 2,699,000 WP 3-900 WP 3-135648 41474084 23517 L-151 TEST 0.42MI MP 10.81-11.23 PH1 KE1 7/1/2014 - - - 894,000 894,000 WP 3-903 WP 3-135749 P.03764 24554 L-153_1 TEST 17.35MI MP 0.00-22.87PH1 KE1 12/1/2011 9,189,000 - - - 9,189,000 WP 3-906 WP 3-135850 41473934 23582 L-153_2 TEST 10.86MI MP 3.58-27.88PH1 KE1 12/1/2012 - 4,607,000 - - 4,607,000 WP 3-911 WP 3-135951 41474040 23498 L-158-1 TEST 2.58MI MP 11.07-13.65 PH1 KE1 12/1/2014 - - - 1,296,000 1,296,000 WP 3-914 WP 3-136052 41474041 23499 L-162A TEST 1.69MI MP 4.41-9.03 PH1 KE1 12/1/2013 - - 1,338,000 - 1,338,000 WP 3-917 WP 3-136153 41474042 23501 L-172A TEST 2.11MI MP 35.51-67.50 PH1 KE1 12/1/2012 - 2,407,000 - - 2,407,000 WP 3-920 WP 3-136254 41474043 23503 L-177A TEST 0.33MI MP 88.50-88.83 PH1 KE1 7/1/2012 - 828,000 - - 828,000 WP 3-923 WP 3-136355 41474044 23506 L-177B TEST 6.65MI MP 0.86-7.51 PH1 KE1 12/1/2013 - - 2,221,000 - 2,221,000 WP 3-926 WP 3-136456 41474046 23509 L-181B TEST 1.55MI MP 0.64-2.17 PH1 KE1 12/1/2013 - - 1,076,000 - 1,076,000 WP 3-929 WP 3-136557 41482928 24217 L-183 TEST 0.32MI MP 5.96-6.29 PH1 KE1 7/1/2014 - - - 876,000 876,000 WP 3-932 WP 3-136658 41474086 23521 L-186 TEST 2.08MI MP 9.20-26.13 PH1 KE1 12/1/2014 - - - 1,681,000 1,681,000 WP 3-935 WP 3-136759 41474087 23524 L-187 TEST 39.21MI MP 22.58-65.70 PH1 KE1 12/1/2013 - - 9,681,000 - 9,681,000 WP 3-938 WP 3-136860 P.03765 24555 L-191 TEST 3.98MI MP 2.74-10.57 PH1 KE1 12/1/2011 2,415,000 - - - 2,415,000 WP 3-942 WP 3-136961 41474047 23511 L-191-1 TEST 10.07MI MP 9.59-35.83 PH1 KE1 12/1/2012 - 3,494,000 - - 3,494,000 WP 3-945 WP 3-137062 41474048 23514 L-191A TEST 4.89MI MP 0.00-4.84 PH1 KE1 12/1/2014 - - - 1,714,000 1,714,000 WP 3-948 WP 3-137163 41474089 23494 L-195A3-1 TEST 0.48MI MP 0.00-0.48 PH1 KE1 7/1/2013 - - 878,000 - 878,000 WP 3-951 WP 3-137264 41474060 23527 L-196A TEST 0.46MI MP 11.49-11.93 PH1 KE1 7/1/2014 - - - 902,000 902,000 WP 3-954 WP 3-137365 41474051 23520 L-197B TEST 5.18MI MP 0.00-5.49 PH1 KE1 12/1/2014 - - - 1,762,000 1,762,000 WP 3-957 WP 3-137466 41474052 23522 L-197C-1 TEST 2.34MI MP 14.73-17.05 PH1 KE1 12/1/2014 - - - 1,251,000 1,251,000 WP 3-960 WP 3-137567 41482859 24205 L-197C-2 TEST 2.88MI MP 0.55-3.43 PH1 KE1 12/1/2014 - - - 1,350,000 1,350,000 WP 3-963 WP 3-137668 41482793 24264 L-200A-1 TEST 0.34MI MP 1.08-1.42 PH1 KE1 7/1/2012 - 829,000 - - 829,000 WP 3-966 WP 3-137769 41474101 23525 L-210B TEST 13.54MI MP 7.57-25.98 PH1 KE1 12/1/2012 - 4,965,000 - - 4,965,000 WP 3-969 WP 3-137870 41482927 24216 L-210C TEST 0.10MI MP 31.64-31.74 PH1 KE1 7/1/2012 - 1 - - 1 WP 3-972 WP 3-137971 41474095 23528 L-220 TEST 4.58MI MP 23.14-27.68 PH1 KE1 12/1/2014 - - - 1,661,000 1,661,000 WP 3-975 WP 3-138072 P.03754 24495 L-300A_1 TEST 80.13MI MP 0.29-502.24 PH1 KE1 12/1/2011 32,911,000 - - - 32,911,000 WP 3-978 WP 3-138173 41474039 23497 L-300A_2 TEST 17.20MI MP 230.32-490.59 PH1 KE1 12/1/2012 - 11,359,000 - - 11,359,000 WP 3-985 WP 3-138474 P.03754 24492 L-300A-1 TEST 0.61MI MP 156.40-157.01 PH1 KE1 12/1/2011 1,128,000 - - - 1,128,000 WP 3-989 WP 3-138575 P.03756 24521 L-300B_1 TEST 71.84MI MP 0.00-218.67 PH1 KE1 12/1/2011 24,871,000 - - - 24,871,000 WP 3-992 WP 3-138676 41483066 24219 L-300B_2 TEST 12.35MI MP 148.90-283.14 PH1 KE1 12/1/2014 - - - 6,348,000 6,348,000 WP 3-998 WP 3-138877 41474056 23536 L-303 TEST 1.16MI MP 19.21-20.43 PH1 KE1 2/1/2012 - 1,524,000 - - 1,524,000 WP 3-1001 WP 3-138978 41474096 23529 L-306 TEST 7.24MI MP 0.00-70.02 PH1 KE1 12/1/2012 - 3,555,000 - - 3,555,000 WP 3-1004 WP 3-139079 41474097 23530 L-314 TEST 4.34MI MP 20.91-24.92 PH1 KE1 12/1/2014 - - - 1,617,000 1,617,000 WP 3-1007 WP 3-139180 41474098 23492 L-318-12 TEST 2.02MI MP 0.00-0.00 PH1 KE1 12/1/2014 - - - 1,193,000 1,193,000 WP 3-1010 WP 3-1392

Pacific Gas and Electric CompanyImplementation Plan
Workpapers Supporting Chapter 3, Pipeline Modernization
Table 3 Expenses by Maintenance Activity Type (MAT)
LineNo Order PSRS Id Order Description MAT Operative
Date 2011 2012 2013 2014 Total WorkpaperReference
MapReference
81 41483067 24220 L-331A TEST 0.34MI MP 8.06-8.40 PH1 KE1 7/1/2013 - - 1 - 1 WP 3-1013 WP 3-139382 41474057 23539 L-400_1 TEST 17MI MP 80.04-298.84 PH1 KE1 12/1/2013 - - 10,051,000 - 10,051,000 WP 3-1016 WP 3-139483 41483064 24201 L-400_2 TEST 17.5MI MP 122.22-139.73 PH1 KE1 12/1/2014 - - - 13,089,000 13,089,000 WP 3-1019 WP 3-139584 P.03757 23551 L-400-3 TEST 4.00MI MP 295.91-299.91 PH1 KE1 12/1/2011 2,424,000 - - - 2,424,000 WP 3-1022 WP 3-139685 41474031 23531 L-401 TEST 0.80MI MP 323.44-326.76 PH1 KE1 12/1/2012 - 1,973,000 - - 1,973,000 WP 3-1025 WP 3-139786 41473886 23556 DFM-0115-01 TEST 0.40MI MP 0.00-0.41 PH1 KE1 12/1/2014 - - - 897,000 897,000 WP 3-1028 WP 3-139887 41473887 23558 DFM-0126-01 TEST 0.07MI MP 1.76-1.84 PH1 KE1 7/1/2012 - 1 - - 1 WP 3-1031 WP 3-139988 41473888 23560 DFM-0141-01 TEST 0.43MI MP 0.00-0.42 PH1 KE1 7/1/2014 - - - 896,000 896,000 WP 3-1034 WP 3-140089 41482926 24215 DFM-0210-01 TEST 6.27MI MP 0.00-6.62 PH1 KE1 12/1/2013 - - 2,154,000 - 2,154,000 WP 3-1037 WP 3-140190 41473891 23566 DFM-0211-01 TEST 0.68MI MP 0.00-0.68 PH1 KE1 7/1/2014 - - - 680,000 680,000 WP 3-1040 WP 3-140291 41473985 23927 DFM-0213-02 TEST 0.87MI MP 0.00-0.91 PH1 KE1 7/1/2014 - - - 981,000 981,000 WP 3-1043 WP 3-140392 41473893 23570 DFM-0215-01 TEST 0.95MI MP 0.00-0.98 PH1 KE1 7/1/2013 - - 962,000 - 962,000 WP 3-1046 WP 3-140493 41473895 23574 DFM-0401-01 TEST 5.44MI MP 0.03-5.48 PH1 KE1 12/1/2012 - 1,733,000 - - 1,733,000 WP 3-1049 WP 3-140594 41473897 23578 DFM-0402-01 TEST 0.69MI MP 0.27-2.36 PH1 KE1 7/1/2012 - 1,370,000 - - 1,370,000 WP 3-1052 WP 3-140695 41473920 23584 DFM-0405-01 TEST 3.25MI MP 1.09-16.54 PH1 KE1 12/1/2013 - - 1,255,000 - 1,255,000 WP 3-1055 WP 3-140796 41473922 23588 DFM-0406-03 TEST 0.76MI MP 0.08-0.81 PH1 KE1 7/1/2014 - - - 955,000 955,000 WP 3-1059 WP 3-140897 41473923 23590 DFM-0407-01 TEST 4.36MI MP 0.00-4.34 PH1 KE1 12/1/2012 - 1,079,000 - - 1,079,000 WP 3-1062 WP 3-140998 41473924 23563 DFM-0601-01 TEST 0.36MI MP 0.09-0.46 PH1 KE1 7/1/2014 - - - 556,000 556,000 WP 3-1065 WP 3-141099 41473925 23565 DFM-0604-01 TEST 1.08MI MP 0.00-4.71 PH1 KE1 12/1/2013 - - 1,234,000 - 1,234,000 WP 3-1068 WP 3-1411
100 41473926 23567 DFM-0604-06 TEST 2.29MI MP 0.00-2.28 PH1 KE1 12/1/2014 - - - 1,240,000 1,240,000 WP 3-1071 WP 3-1412101 41473927 23569 DFM-0604-07 TEST 6.25MI MP 0.01-6.41 PH1 KE1 12/1/2013 - - 2,096,000 - 2,096,000 WP 3-1074 WP 3-1413102 41473930 23575 DFM-0611-01 TEST 1.07MI MP 0.00-1.07 PH1 KE1 12/1/2012 - 978,000 - - 978,000 WP 3-1077 WP 3-1414103 41473931 23577 DFM-0611-02 TEST 1.50MI MP 0.00-1.91 PH1 KE1 12/1/2012 - 1,023,000 - - 1,023,000 WP 3-1080 WP 3-1415104 41482853 24196 DFM-0611-05 TEST 0.12MI MP 0.00-0.06 PH1 KE1 7/1/2012 - 909,000 - - 909,000 WP 3-1084 WP 3-1416105 41473962 23884 DFM-0621-01 TEST 0.68MI MP 0.02-0.70 PH1 KE1 7/1/2014 - - - 909,000 909,000 WP 3-1087 WP 3-1417106 41473936 23587 DFM-0630-01 TEST 0.07MI MP 1.33-1.40 PH1 KE1 7/1/2014 - - - 831,000 831,000 WP 3-1090 WP 3-1418107 41473965 23835 DFM-0638-02 TEST 1.24MI MP 1.69-2.93 PH1 KE1 12/1/2014 - - - 1 1 WP 3-1093 WP 3-1419108 41473966 23843 DFM-0651-01 TEST 0.86MI MP 1.01-1.87 PH1 KE1 7/1/2012 - 1 - - 1 WP 3-1096 WP 3-1420109 41473969 23861 DFM-0813-01 TEST 1.30MI MP 0.00-1.29 PH1 KE1 12/1/2012 - 1,002,000 - - 1,002,000 WP 3-1099 WP 3-1421110 41473970 23866 DFM-0813-02 TEST 0.50MI MP 0.00-0.50 PH1 KE1 7/1/2014 - - - 910,000 910,000 WP 3-1102 WP 3-1422111 41473971 23871 DFM-0814-05 TEST 0.31MI MP 0.00-0.31 PH1 KE1 7/1/2013 - - 849,000 - 849,000 WP 3-1105 WP 3-1423112 41473972 23876 DFM-0817-01 TEST 1.31MI MP 0.00-1.30 PH1 KE1 12/1/2013 - - 1,034,000 - 1,034,000 WP 3-1108 WP 3-1424113 41473974 23885 DFM-1004-01 TEST 0.35MI MP 4.40-4.75 PH1 KE1 7/1/2014 - - - 882,000 882,000 WP 3-1111 WP 3-1425114 41473975 23892 DFM-1023-01 TEST 2.83MI MP 0.00-2.83 PH1 KE1 12/1/2013 - - 1,249,000 - 1,249,000 WP 3-1114 WP 3-1426115 41473976 23894 DFM-1027-01 TEST 1.21MI MP 3.46-6.58 PH1 KE1 12/1/2014 - - - 1,293,000 1,293,000 WP 3-1117 WP 3-1427116 41483062 24193 DFM-1027-04 TEST 0.92MI MP 0.70-1.62 PH1 KE1 12/1/2014 - - - 992,000 992,000 WP 3-1120 WP 3-1428117 41482847 24187 DFM-1202-01 TEST 2.13MI MP 0.00-2.13 PH1 KE1 12/1/2012 - 1,367,000 - - 1,367,000 WP 3-1123 WP 3-1429118 41482846 24186 DFM-1202-02 TEST 0.39MI MP 2.00-2.39 PH1 KE1 7/1/2013 - - 1,000,000 - 1,000,000 WP 3-1126 WP 3-1430119 41482845 24185 DFM-1202-03 TEST 0.39MI MP 0.00-0.39 PH1 KE1 7/1/2014 - - - 889,000 889,000 WP 3-1129 WP 3-1431120 41473979 23901 DFM-1202-16 TEST 2.50MI MP 0.08-2.58 PH1 KE1 12/1/2013 - - 1,245,000 - 1,245,000 WP 3-1132 WP 3-1432
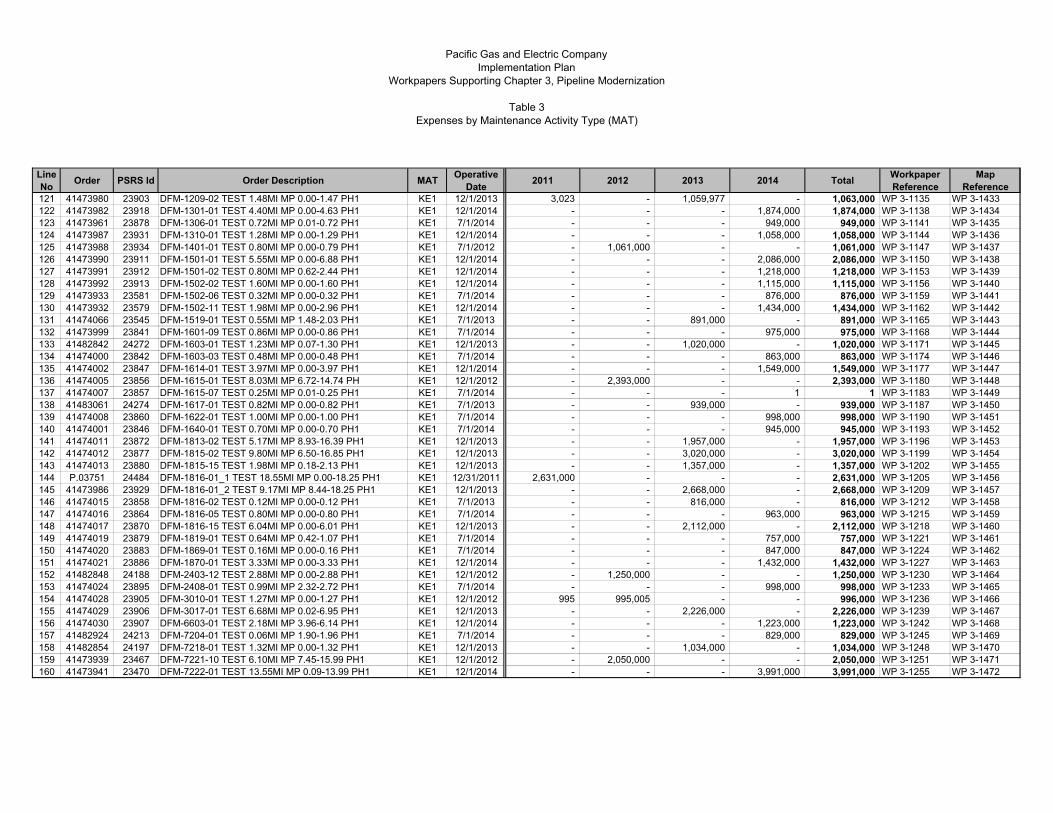
Pacific Gas and Electric CompanyImplementation Plan
Workpapers Supporting Chapter 3, Pipeline Modernization
Table 3 Expenses by Maintenance Activity Type (MAT)
LineNo Order PSRS Id Order Description MAT Operative
Date 2011 2012 2013 2014 Total WorkpaperReference
MapReference
121 41473980 23903 DFM-1209-02 TEST 1.48MI MP 0.00-1.47 PH1 KE1 12/1/2013 3,023 - 1,059,977 - 1,063,000 WP 3-1135 WP 3-1433122 41473982 23918 DFM-1301-01 TEST 4.40MI MP 0.00-4.63 PH1 KE1 12/1/2014 - - - 1,874,000 1,874,000 WP 3-1138 WP 3-1434123 41473961 23878 DFM-1306-01 TEST 0.72MI MP 0.01-0.72 PH1 KE1 7/1/2014 - - - 949,000 949,000 WP 3-1141 WP 3-1435124 41473987 23931 DFM-1310-01 TEST 1.28MI MP 0.00-1.29 PH1 KE1 12/1/2014 - - - 1,058,000 1,058,000 WP 3-1144 WP 3-1436125 41473988 23934 DFM-1401-01 TEST 0.80MI MP 0.00-0.79 PH1 KE1 7/1/2012 - 1,061,000 - - 1,061,000 WP 3-1147 WP 3-1437126 41473990 23911 DFM-1501-01 TEST 5.55MI MP 0.00-6.88 PH1 KE1 12/1/2014 - - - 2,086,000 2,086,000 WP 3-1150 WP 3-1438127 41473991 23912 DFM-1501-02 TEST 0.80MI MP 0.62-2.44 PH1 KE1 12/1/2014 - - - 1,218,000 1,218,000 WP 3-1153 WP 3-1439128 41473992 23913 DFM-1502-02 TEST 1.60MI MP 0.00-1.60 PH1 KE1 12/1/2014 - - - 1,115,000 1,115,000 WP 3-1156 WP 3-1440129 41473933 23581 DFM-1502-06 TEST 0.32MI MP 0.00-0.32 PH1 KE1 7/1/2014 - - - 876,000 876,000 WP 3-1159 WP 3-1441130 41473932 23579 DFM-1502-11 TEST 1.98MI MP 0.00-2.96 PH1 KE1 12/1/2014 - - - 1,434,000 1,434,000 WP 3-1162 WP 3-1442131 41474066 23545 DFM-1519-01 TEST 0.55MI MP 1.48-2.03 PH1 KE1 7/1/2013 - - 891,000 - 891,000 WP 3-1165 WP 3-1443132 41473999 23841 DFM-1601-09 TEST 0.86MI MP 0.00-0.86 PH1 KE1 7/1/2014 - - - 975,000 975,000 WP 3-1168 WP 3-1444133 41482842 24272 DFM-1603-01 TEST 1.23MI MP 0.07-1.30 PH1 KE1 12/1/2013 - - 1,020,000 - 1,020,000 WP 3-1171 WP 3-1445134 41474000 23842 DFM-1603-03 TEST 0.48MI MP 0.00-0.48 PH1 KE1 7/1/2014 - - - 863,000 863,000 WP 3-1174 WP 3-1446135 41474002 23847 DFM-1614-01 TEST 3.97MI MP 0.00-3.97 PH1 KE1 12/1/2014 - - - 1,549,000 1,549,000 WP 3-1177 WP 3-1447136 41474005 23856 DFM-1615-01 TEST 8.03MI MP 6.72-14.74 PH KE1 12/1/2012 - 2,393,000 - - 2,393,000 WP 3-1180 WP 3-1448137 41474007 23857 DFM-1615-07 TEST 0.25MI MP 0.01-0.25 PH1 KE1 7/1/2014 - - - 1 1 WP 3-1183 WP 3-1449138 41483061 24274 DFM-1617-01 TEST 0.82MI MP 0.00-0.82 PH1 KE1 7/1/2013 - - 939,000 - 939,000 WP 3-1187 WP 3-1450139 41474008 23860 DFM-1622-01 TEST 1.00MI MP 0.00-1.00 PH1 KE1 7/1/2014 - - - 998,000 998,000 WP 3-1190 WP 3-1451140 41474001 23846 DFM-1640-01 TEST 0.70MI MP 0.00-0.70 PH1 KE1 7/1/2014 - - - 945,000 945,000 WP 3-1193 WP 3-1452141 41474011 23872 DFM-1813-02 TEST 5.17MI MP 8.93-16.39 PH1 KE1 12/1/2013 - - 1,957,000 - 1,957,000 WP 3-1196 WP 3-1453142 41474012 23877 DFM-1815-02 TEST 9.80MI MP 6.50-16.85 PH1 KE1 12/1/2013 - - 3,020,000 - 3,020,000 WP 3-1199 WP 3-1454143 41474013 23880 DFM-1815-15 TEST 1.98MI MP 0.18-2.13 PH1 KE1 12/1/2013 - - 1,357,000 - 1,357,000 WP 3-1202 WP 3-1455144 P.03751 24484 DFM-1816-01_1 TEST 18.55MI MP 0.00-18.25 PH1 KE1 12/31/2011 2,631,000 - - - 2,631,000 WP 3-1205 WP 3-1456145 41473986 23929 DFM-1816-01_2 TEST 9.17MI MP 8.44-18.25 PH1 KE1 12/1/2013 - - 2,668,000 - 2,668,000 WP 3-1209 WP 3-1457146 41474015 23858 DFM-1816-02 TEST 0.12MI MP 0.00-0.12 PH1 KE1 7/1/2013 - - 816,000 - 816,000 WP 3-1212 WP 3-1458147 41474016 23864 DFM-1816-05 TEST 0.80MI MP 0.00-0.80 PH1 KE1 7/1/2014 - - - 963,000 963,000 WP 3-1215 WP 3-1459148 41474017 23870 DFM-1816-15 TEST 6.04MI MP 0.00-6.01 PH1 KE1 12/1/2013 - - 2,112,000 - 2,112,000 WP 3-1218 WP 3-1460149 41474019 23879 DFM-1819-01 TEST 0.64MI MP 0.42-1.07 PH1 KE1 7/1/2014 - - - 757,000 757,000 WP 3-1221 WP 3-1461150 41474020 23883 DFM-1869-01 TEST 0.16MI MP 0.00-0.16 PH1 KE1 7/1/2014 - - - 847,000 847,000 WP 3-1224 WP 3-1462151 41474021 23886 DFM-1870-01 TEST 3.33MI MP 0.00-3.33 PH1 KE1 12/1/2014 - - - 1,432,000 1,432,000 WP 3-1227 WP 3-1463152 41482848 24188 DFM-2403-12 TEST 2.88MI MP 0.00-2.88 PH1 KE1 12/1/2012 - 1,250,000 - - 1,250,000 WP 3-1230 WP 3-1464153 41474024 23895 DFM-2408-01 TEST 0.99MI MP 2.32-2.72 PH1 KE1 7/1/2014 - - - 998,000 998,000 WP 3-1233 WP 3-1465154 41474028 23905 DFM-3010-01 TEST 1.27MI MP 0.00-1.27 PH1 KE1 12/1/2012 995 995,005 - - 996,000 WP 3-1236 WP 3-1466155 41474029 23906 DFM-3017-01 TEST 6.68MI MP 0.02-6.95 PH1 KE1 12/1/2013 - - 2,226,000 - 2,226,000 WP 3-1239 WP 3-1467156 41474030 23907 DFM-6603-01 TEST 2.18MI MP 3.96-6.14 PH1 KE1 12/1/2014 - - - 1,223,000 1,223,000 WP 3-1242 WP 3-1468157 41482924 24213 DFM-7204-01 TEST 0.06MI MP 1.90-1.96 PH1 KE1 7/1/2014 - - - 829,000 829,000 WP 3-1245 WP 3-1469158 41482854 24197 DFM-7218-01 TEST 1.32MI MP 0.00-1.32 PH1 KE1 12/1/2013 - - 1,034,000 - 1,034,000 WP 3-1248 WP 3-1470159 41473939 23467 DFM-7221-10 TEST 6.10MI MP 7.45-15.99 PH1 KE1 12/1/2012 - 2,050,000 - - 2,050,000 WP 3-1251 WP 3-1471160 41473941 23470 DFM-7222-01 TEST 13.55MI MP 0.09-13.99 PH1 KE1 12/1/2014 - - - 3,991,000 3,991,000 WP 3-1255 WP 3-1472
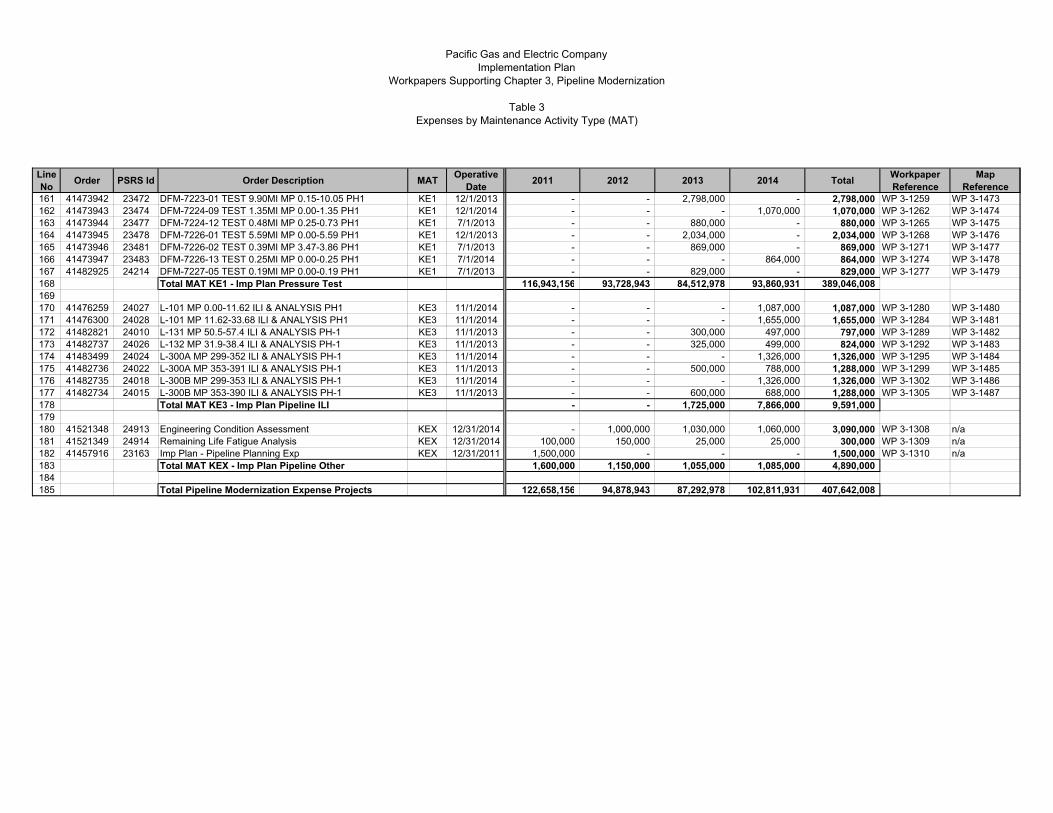
Pacific Gas and Electric CompanyImplementation Plan
Workpapers Supporting Chapter 3, Pipeline Modernization
Table 3 Expenses by Maintenance Activity Type (MAT)
LineNo Order PSRS Id Order Description MAT Operative
Date 2011 2012 2013 2014 Total WorkpaperReference
MapReference
161 41473942 23472 DFM-7223-01 TEST 9.90MI MP 0.15-10.05 PH1 KE1 12/1/2013 - - 2,798,000 - 2,798,000 WP 3-1259 WP 3-1473162 41473943 23474 DFM-7224-09 TEST 1.35MI MP 0.00-1.35 PH1 KE1 12/1/2014 - - - 1,070,000 1,070,000 WP 3-1262 WP 3-1474163 41473944 23477 DFM-7224-12 TEST 0.48MI MP 0.25-0.73 PH1 KE1 7/1/2013 - - 880,000 - 880,000 WP 3-1265 WP 3-1475164 41473945 23478 DFM-7226-01 TEST 5.59MI MP 0.00-5.59 PH1 KE1 12/1/2013 - - 2,034,000 - 2,034,000 WP 3-1268 WP 3-1476165 41473946 23481 DFM-7226-02 TEST 0.39MI MP 3.47-3.86 PH1 KE1 7/1/2013 - - 869,000 - 869,000 WP 3-1271 WP 3-1477166 41473947 23483 DFM-7226-13 TEST 0.25MI MP 0.00-0.25 PH1 KE1 7/1/2014 - - - 864,000 864,000 WP 3-1274 WP 3-1478167 41482925 24214 DFM-7227-05 TEST 0.19MI MP 0.00-0.19 PH1 KE1 7/1/2013 - - 829,000 - 829,000 WP 3-1277 WP 3-1479168 Total MAT KE1 - Imp Plan Pressure Test 116,943,156 93,728,943 84,512,978 93,860,931 389,046,008169170 41476259 24027 L-101 MP 0.00-11.62 ILI & ANALYSIS PH1 KE3 11/1/2014 - - - 1,087,000 1,087,000 WP 3-1280 WP 3-1480171 41476300 24028 L-101 MP 11.62-33.68 ILI & ANALYSIS PH1 KE3 11/1/2014 - - - 1,655,000 1,655,000 WP 3-1284 WP 3-1481172 41482821 24010 L-131 MP 50.5-57.4 ILI & ANALYSIS PH-1 KE3 11/1/2013 - - 300,000 497,000 797,000 WP 3-1289 WP 3-1482173 41482737 24026 L-132 MP 31.9-38.4 ILI & ANALYSIS PH-1 KE3 11/1/2013 - - 325,000 499,000 824,000 WP 3-1292 WP 3-1483174 41483499 24024 L-300A MP 299-352 ILI & ANALYSIS PH-1 KE3 11/1/2014 - - - 1,326,000 1,326,000 WP 3-1295 WP 3-1484175 41482736 24022 L-300A MP 353-391 ILI & ANALYSIS PH-1 KE3 11/1/2013 - - 500,000 788,000 1,288,000 WP 3-1299 WP 3-1485176 41482735 24018 L-300B MP 299-353 ILI & ANALYSIS PH-1 KE3 11/1/2014 - - - 1,326,000 1,326,000 WP 3-1302 WP 3-1486177 41482734 24015 L-300B MP 353-390 ILI & ANALYSIS PH-1 KE3 11/1/2013 - - 600,000 688,000 1,288,000 WP 3-1305 WP 3-1487178 Total MAT KE3 - Imp Plan Pipeline ILI - - 1,725,000 7,866,000 9,591,000179180 41521348 24913 Engineering Condition Assessment KEX 12/31/2014 - 1,000,000 1,030,000 1,060,000 3,090,000 WP 3-1308 n/a181 41521349 24914 Remaining Life Fatigue Analysis KEX 12/31/2014 100,000 150,000 25,000 25,000 300,000 WP 3-1309 n/a182 41457916 23163 Imp Plan - Pipeline Planning Exp KEX 12/31/2011 1,500,000 - - - 1,500,000 WP 3-1310 n/a183 Total MAT KEX - Imp Plan Pipeline Other 1,600,000 1,150,000 1,055,000 1,085,000 4,890,000184185 Total Pipeline Modernization Expense Projects 122,658,156 94,878,943 87,292,978 102,811,931 407,642,008
Exhibit B
Valve Automation Program Project Summary

Pacific Gas and Electric CompanyImplementation Plan
Workpapers Supporting Chapter 4, Valve Automation
Table 1Capital Expenditures and Expenses by Maintenance Activity Type (MAT)
MAT MAT Description 2011 2012 2013 2014 Total Tables 2 and 3Reference
44A StanPac Capital - 1,948,663 4,610,471 - 6,559,134 WP 4-2, Table 2, Line 102H3 Imp Plan Valve Automation 13,686,700 37,599,704 48,714,483 25,968,238 125,969,125 WP 4-4, Table 2, Line 92
Total Capital Expenditures 13,686,700 39,548,367 53,324,954 25,968,238 132,528,258 WP 4-4, Table 2, Line 94
KE4 Imp Plan Station Other 803,206 2,581,376 3,108,541 3,813,648 10,306,771 WP 4-278, Table 3, Line 3KEX Imp Plan Pipeline Other 800,000 - - - 800,000 WP 4-278, Table 3, Line 6
Total Expenses 1,603,206 2,581,376 3,108,541 3,813,648 11,106,771 WP 4-278, Table 3, Line 8
Total Valve Automation Costs 15,289,906 42,129,743 56,433,495 29,781,886 143,635,029

Pacific Gas and Electric CompanyImplementation Plan
Workpapers Supporting Chapter 4, Valve Automation
Table 2Capital Expenditures by Maintenance Activity Type (MAT)
LineNo Order PSRS Id Order Description MAT Operative
Date 2011 2012 2013 2014 Total WorkpaperReference
MapReference
1 97000502 23619 VALVE AUTO - ANTIOCH TERMINAL, PH. 1 44A 3/31/2013 - 108,147 153,864 - 262,011 WP 4-5 WP 4-1982 97000503 23620 VALVE AUTO - ANTIOCH TOWN METER STA, PH. 1 44A 3/31/2013 - 695,382 989,344 - 1,684,726 WP 4-7 WP 4-1993 97000501 23621 VALVE AUTO - SP3-LINE 191 MTR STA, PH. 1 44A 3/31/2013 - 546,380 777,354 - 1,323,734 WP 4-9 WP 4-2004 97000521 23622 VALVE AUTO - LOS MEDANOS, PH. 1 44A 3/31/2013 - 299,031 425,442 - 724,473 WP 4-11 WP 4-2015 97000504 23623 VALVE AUTO - CONCORD METER STA, PH. 1 44A 6/30/2013 - 128,029 967,286 - 1,095,315 WP 4-13 WP 4-2026 97000505 23624 VALVE AUTO - VINE HILL, PH. 1 44A 6/30/2013 - 93,189 704,062 - 797,251 WP 4-15 WP 4-2037 97000506 23626 VALVE AUTO - "C" STREET STA, PH. 1 44A 6/30/2013 - 44,189 333,859 - 378,048 WP 4-17 WP 4-2048 97000507 23627 VALVE AUTO - FRANKLIN CANYON, PH. 1 44A 6/30/2013 - 12,252 92,564 - 104,816 WP 4-19 WP 4-2059 97000508 23629 VALVE AUTO - SAN PABLO, PH. 1 44A 6/30/2013 - 22,064 166,696 - 188,760 WP 4-21 WP 4-20610 Total MAT 44A - StanPac Capital - 1,948,663 4,610,471 - 6,559,134 1112 30842306 23442 VALVE AUTO - MILPITAS TERMINAL, PH. 1 2H3 12/31/2011 2,740,284 87,395 - - 2,827,679 WP 4-23 WP 4-20713 30842318 23440 VALVE AUTO - SIERRA VISTA STN, PH. 1 2H3 12/31/2011 907,628 28,947 - - 936,575 WP 4-26 WP 4-20814 30842310 23441 VALVE AUTO - RENGSTORFF STN, PH. 1 2H3 12/31/2011 2,174,999 69,367 - - 2,244,366 WP 4-28 WP 4-20915 30842297 23439 VALVE AUTO - LARKSPUR DR, PH. 1 2H3 12/31/2011 2,758,056 87,962 - - 2,846,018 WP 4-30 WP 4-21016 30842314 23438 VALVE AUTO - SAN ANDREAS, PH. 1 2H3 12/31/2011 945,614 30,158 - - 975,772 WP 4-33 WP 4-21117 30842291 23380 VALVE AUTO - HEALY STATION, PH. 1 2H3 12/31/2011 460,725 14,694 - - 475,419 WP 4-35 WP 4-21218 30840648 23379 VALVE AUTO - SF GAS LOAD CENTER, PH. 1 2H3 12/31/2011 1,157,871 36,928 - - 1,194,799 WP 4-37 WP 4-21319 30842276 23462 VALVE AUTO - CROSSMAN AVE, PH. 1 2H3 3/31/2012 2,164,894 69,044 - - 2,233,938 WP 4-39 WP 4-21420 30842323 23594 VALVE AUTO - VAN BUREN & RINGWOOD, PH. 1 2H3 9/30/2012 44,130 2,229,826 - - 2,273,956 WP 4-41 WP 4-21521 30842274 23597 VALVE AUTO - COMMERCIAL WAY, PH. 1 2H3 9/30/2012 46,932 2,371,409 - - 2,418,341 WP 4-43 WP 4-21622 30842271 23598 VALVE AUTO - BIRCH & S. DELAWARE, PH. 1 2H3 9/30/2012 47,291 2,389,581 - - 2,436,872 WP 4-45 WP 4-21723 30842302 23599 VALVE AUTO - LOMITA PARK, PH. 1 2H3 9/30/2012 7,757 391,932 - - 399,689 WP 4-47 WP 4-21824 30842290 23600 VALVE AUTO - HAMLIN COURT, PH. 1 2H3 9/30/2012 31,327 1,582,896 - - 1,614,223 WP 4-49 WP 4-21925 30842316 23601 VALVE AUTO - SAND HILL, PH. 1 2H3 9/30/2012 55,416 2,800,107 - - 2,855,523 WP 4-52 WP 4-22026 30842283 23602 VALVE AUTO - EDGEWOOD, PH. 1 2H3 9/30/2012 72,427 3,659,656 - - 3,732,083 WP 4-55 WP 4-22127 30843884 23603 VALVE AUTO - CRYSTAL SPRINGS, PH. 1 2H3 12/31/2012 - 2,447,714 219,285 - 2,666,999 WP 4-58 WP 4-22228 30842289 23970 VALVE AUTO - HALF MOON BAY TAP, PH. 1 2H3 12/31/2012 - 653,658 58,560 - 712,218 WP 4-61 WP 4-22329 30842319 23604 VALVE AUTO - SULLIVAN AVE, PH. 1 2H3 12/31/2012 - 367,937 32,963 - 400,900 WP 4-63 WP 4-22430 30842299 23605 VALVE AUTO - LAWRENCE & LAKEHAVEN, PH. 1 2H3 12/31/2012 - 3,003,316 269,060 - 3,272,376 WP 4-65 WP 4-22531 30842303 23606 VALVE AUTO - MARTIN STATION, PH. 1 2H3 12/31/2012 - 333,672 29,893 - 363,565 WP 4-68 WP 4-22632 30842270 23607 VALVE AUTO - BAYSHORE & GENEVA, PH. 1 2H3 12/31/2012 - 849,104 76,069 - 925,173 WP 4-70 WP 4-22733 30842312 23608 VALVE AUTO - ROUSSEAU STREET, PH. 1 2H3 12/31/2012 - 2,530,287 226,682 - 2,756,969 WP 4-72 WP 4-22834 30842280 23609 VALVE AUTO - DIANA, PH. 1 2H3 12/31/2012 - 1,421,651 127,362 - 1,549,013 WP 4-75 WP 4-22935 30842293 23611 VALVE AUTO - HWY 101 & SCHELLER, PH. 1 2H3 12/31/2012 - 614,352 55,038 - 669,390 WP 4-77 WP 4-23036 30842287 23613 VALVE AUTO - FONTANOSO, PH. 1 2H3 3/31/2013 - 375,786 534,643 - 910,429 WP 4-79 WP 4-23137 30842269 23971 VALVE AUTO - ANZAR TAP STATION, PH. 1 2H3 3/31/2013 - 692,378 985,070 - 1,677,448 WP 4-81 WP 4-23238 30842266 23614 VALVE AUTO - ALUM ROCK, PH. 1 2H3 3/31/2013 - 430,359 612,287 - 1,042,646 WP 4-83 WP 4-23339 30842261 23615 VALVE AUTO - 7A & 7B PLS, PH. 1 2H3 3/31/2013 - 416,267 592,237 - 1,008,504 WP 4-85 WP 4-23440 30842305 23618 VALVE AUTO - MAYBURY, PH. 1 2H3 3/31/2013 - 281,692 400,773 - 682,465 WP 4-88 WP 4-235

Pacific Gas and Electric CompanyImplementation Plan
Workpapers Supporting Chapter 4, Valve Automation
Table 2Capital Expenditures by Maintenance Activity Type (MAT)
LineNo Order PSRS Id Order Description MAT Operative
Date 2011 2012 2013 2014 Total WorkpaperReference
MapReference
41 30847360 24281 VALVE AUTO - ANTIOCH TERMINAL, PH. 1 2H3 3/31/2013 - 1,206,191 1,716,090 - 2,922,281 WP 4-90 WP 4-19842 30847361 24283 VALVE AUTO - ANTIOCH TOWN MTR STA, PH. 1 2H3 3/31/2013 - 811,279 1,154,234 - 1,965,513 WP 4-92 WP 4-19943 30847366 24284 VALVE AUTO - SP3-LINE 191 MTR STA, PH. 1 2H3 3/31/2013 - 257,251 366,000 - 623,251 WP 4-94 WP 4-20044 30847362 24285 VALVE AUTO - CONCORD METER STA, PH. 1 2H3 6/30/2013 - 67,011 506,285 - 573,296 WP 4-96 WP 4-20245 30847363 24286 VALVE AUTO - "C" STREET STA, PH. 1 2H3 6/30/2013 - 40,919 309,153 - 350,072 WP 4-98 WP 4-20446 30847364 24287 VALVE AUTO - FRANKLIN CANYON, PH. 1 2H3 6/30/2013 - 104,227 787,455 - 891,682 WP 4-100 WP 4-20547 30847365 24288 VALVE AUTO - SAN PABLO, PH. 1 2H3 6/30/2013 - 134,053 1,012,797 - 1,146,850 WP 4-102 WP 4-20648 30842277 23630 VALVE AUTO - CRYSTAL RANCH, PH. 1 2H3 6/30/2013 - 194,241 1,467,532 - 1,661,773 WP 4-104 WP 4-23649 30842326 23631 VALVE AUTO - WALNUT AVE, PH. 1 2H3 6/30/2013 - 133,041 1,005,152 - 1,138,193 WP 4-106 WP 4-23750 30842286 23632 VALVE AUTO - FOLEY'S RANCH CROSSOVER, PH. 1 2H3 9/30/2013 - 17,362 876,480 - 893,842 WP 4-108 WP 4-23851 30842324 23633 VALVE AUTO - VARGAS CROSSOVER, PH. 1 2H3 9/30/2013 - 18,559 936,887 - 955,446 WP 4-110 WP 4-23952 30842295 23634 VALVE AUTO - IRVINGTON, PH. 1 2H3 9/30/2013 - 79,506 4,013,688 - 4,093,194 WP 4-112 WP 4-24053 30842317 23972 VALVE AUTO - SHERIDAN RD, PH. 1 2H3 9/30/2013 - 7,027 354,757 - 361,784 WP 4-115 WP 4-24154 30842300 23635 VALVE AUTO - LIVERMORE & AIRWAY, PH. 1 2H3 9/30/2013 - 19,827 1,000,928 - 1,020,755 WP 4-117 WP 4-24255 30842279 23636 VALVE AUTO - DALTON CROSSOVER, PH. 1 2H3 9/30/2013 - 21,593 1,090,080 - 1,111,673 WP 4-119 WP 4-24356 30842301 23637 VALVE AUTO - LIVERMORE JUNCTION, PH. 1 2H3 9/30/2013 - 14,992 756,811 - 771,803 WP 4-121 WP 4-24457 30842320 23638 VALVE AUTO - THORTON AVE, PH. 1 2H3 9/30/2013 - 29,694 1,499,042 - 1,528,736 WP 4-123 WP 4-24558 30842268 23645 VALVE AUTO - ALVARADO, PH. 1 2H3 9/30/2013 - 15,383 776,561 - 791,944 WP 4-125 WP 4-24659 30842329 23647 VALVE AUTO - WINTON AVE, PH. 1 2H3 12/31/2013 - - 582,788 52,166 634,954 WP 4-127 WP 4-24760 30842285 23649 VALVE AUTO - FAIRWAY AVE, PH. 1 2H3 12/31/2013 - - 727,579 65,126 792,705 WP 4-129 WP 4-24861 30842260 23651 VALVE AUTO - 51ST AVENUE, PH. 1 2H3 12/31/2013 - - 2,290,229 204,999 2,495,228 WP 4-131 WP 4-24962 30842259 23655 VALVE AUTO - 4TH & JEFFERSON, PH. 1 2H3 12/31/2013 - - 2,042,581 182,832 2,225,413 WP 4-133 WP 4-25063 30842273 23657 VALVE AUTO - BRENTWOOD TERMINAL, PH. 1 2H3 12/31/2013 - - 4,328,642 387,458 4,716,100 WP 4-136 WP 4-25164 30842296 23659 VALVE AUTO - LAKES VALVE LOT, PH. 1 2H3 12/31/2013 - - 746,147 66,788 812,935 WP 4-139 WP 4-25265 30842272 23661 VALVE AUTO - BIXLER RD, PH. 1 2H3 12/31/2013 - - 1,429,014 127,911 1,556,925 WP 4-141 WP 4-25366 30842308 23663 VALVE AUTO - PALM TRACT, PH. 1 2H3 12/31/2013 - - 327,672 29,330 357,002 WP 4-143 WP 4-25467 30842258 23665 VALVE AUTO - 24TH & 20TH AVE, PH. 1 2H3 3/31/2014 - - 994,821 1,414,145 2,408,966 WP 4-145 WP 4-25568 30842330 23669 VALVE AUTO - YOLO CAUSWAY BLVD. TIE, PH. 1 2H3 3/31/2014 - - 720,293 1,023,902 1,744,195 WP 4-147 WP 4-25669 30842307 23673 VALVE AUTO - N SAC UGND HLDR, PH. 1 2H3 3/31/2014 - - 772,922 1,098,715 1,871,637 WP 4-149 WP 4-25770 30842313 23675 VALVE AUTO - SAC GAS LOAD CENTER, PH. 1 2H3 3/31/2014 - - 455,793 647,913 1,103,706 WP 4-151 WP 4-25871 30842309 23679 VALVE AUTO - PARAMOUNT COURT, PH. 1 2H3 3/31/2014 - - 705,071 1,002,264 1,707,335 WP 4-154 WP 4-25972 30842322 23674 VALVE AUTO - VALERO REFINERY TAP, PH. 1 2H3 3/31/2014 - - 840,734 1,195,110 2,035,844 WP 4-156 WP 4-26073 30842281 23672 VALVE AUTO - EAST FAIRFIELD CROSSOVER, PH. 1 2H3 3/31/2014 - - 495,353 704,148 1,199,501 WP 4-158 WP 4-26174 30842284 23670 VALVE AUTO - FAIRFIELD CROSSOVER, PH. 1 2H3 3/31/2014 - - 676,185 961,202 1,637,387 WP 4-160 WP 4-26275 30842275 23668 VALVE AUTO - CORDELIA, PH. 1 2H3 6/30/2014 - - 248,522 1,876,016 2,124,538 WP 4-163 WP 4-26376 30842311 23667 VALVE AUTO - RIPON-MODESTO, PH. 1 2H3 6/30/2014 - - 108,371 818,059 926,430 WP 4-166 WP 4-26477 30842265 23664 VALVE AUTO - AIRPORT & YOSEMITE, PH. 1 2H3 6/30/2014 - - 218,027 1,645,817 1,863,844 WP 4-168 WP 4-26578 30842263 23662 VALVE AUTO - AIRPORT & FRENCH CAMP, PH. 1 2H3 6/30/2014 - - 101,547 766,545 868,092 WP 4-170 WP 4-26679 30842264 23660 VALVE AUTO - AIRPORT & SORONA, PH. 1 2H3 6/30/2014 - - 101,841 768,764 870,605 WP 4-172 WP 4-26780 30842327 23658 VALVE AUTO - WEST LANE & HAMMERTOWN, PH. 1 2H3 6/30/2014 - - 214,528 1,619,405 1,833,933 WP 4-174 WP 4-268

Pacific Gas and Electric CompanyImplementation Plan
Workpapers Supporting Chapter 4, Valve Automation
Table 2Capital Expenditures by Maintenance Activity Type (MAT)
LineNo Order PSRS Id Order Description MAT Operative
Date 2011 2012 2013 2014 Total WorkpaperReference
MapReference
81 30842262 23656 VALVE AUTO - 8 MILE PLS, PH. 1 2H3 6/30/2014 - - 75,134 567,165 642,299 WP 4-176 WP 4-26982 30842298 23654 VALVE AUTO - LAS VINAS STA, PH. 1 2H3 6/30/2014 - - 54,332 410,139 464,471 WP 4-178 WP 4-27083 30841471 23652 VALVE AUTO - UNION AVE METER REG STA, PH. 1 2H3 9/30/2014 - - 14,072 709,761 723,833 WP 4-180 WP 4-27184 30841470 23650 VALVE AUTO - GOSFORD RD MTR STA, PH. 1 2H3 9/30/2014 - - 18,429 929,516 947,945 WP 4-182 WP 4-27285 30841469 23648 VALVE AUTO - BAKERSFIELD TAP, PH. 1 2H3 9/30/2014 - - 17,210 868,077 885,287 WP 4-184 WP 4-27386 30841958 23973 VALVE AUTO - CUMMINGS CREEK, PH. 1 2H3 9/30/2014 - - 3,606 181,870 185,476 WP 4-186 WP 4-27487 30842321 23974 VALVE AUTO - TOMPKINS HILL, PH. 1 2H3 9/30/2014 - - 13,581 685,036 698,617 WP 4-188 WP 4-27588 30841467 23646 VALVE AUTO - 2AX PLS, PH. 1 2H3 9/30/2014 - - 7,123 359,293 366,416 WP 4-190 WP 4-27689 30841466 23644 VALVE AUTO - MOJAVE RIVER CROSSING, PH. 1 2H3 9/30/2014 - - 22,188 1,119,151 1,141,339 WP 4-192 WP 4-27790 30842294 23975 VALVE AUTO - INSTALL FLOW METERING, PH. 1 2H3 9/30/2014 31,348 3,919,473 5,270,294 3,239,615 12,460,730 WP 4-194 n/a91 30864263 24923 VALVE AUTO - SCADA ENHANCEMENTS 2H3 12/31/2014 40,000 240,000 240,000 240,000 760,000 WP 4-196 n/a92 Total MAT 2H3 - Imp Plan Valve Automation 13,686,700 37,599,704 48,714,483 25,968,238 125,969,125 9394 Total Valve Automation Capital Projects 13,686,700 39,548,367 53,324,954 25,968,238 132,528,258
Pacific Gas and Electric CompanyImplementation Plan
Workpapers Supporting Chapter 4, Valve Automation
Table 3Expenses by Maintenance Activity Type (MAT)
LineNo Order PSRS Id Order Description MAT Operative
Date 2011 2012 2013 2014 Total WorkpaperReference
MapReference
1 41474104 23355 VALVE AUTO SCADA ENHANCEMENTS KE4 12/31/2014 803,206 1,830,559 1,810,423 2,207,585 6,651,773 WP 4-279 n/a2 41482824 24155 VALVE AUTO M&O, PH. 1 KE4 12/31/2014 - 750,817 1,298,118 1,606,063 3,654,998 WP 4-281 n/a3 Total MAT KE4 - Imp Plan Station Other 803,206 2,581,376 3,108,541 3,813,648 10,306,771 45 41416677 22725 Imp Plan - Valve Planning Expense KE4 12/31/2011 800,000 - - - 800,000 WP 4-283 n/a6 Total MAT KEX - Imp Plan Pipeline Other 800,000 - - - 800,000 78 Total Valve Automation Expense Projects 1,603,206 2,581,376 3,108,541 3,813,648 11,106,771
Exhibit C
Statement of PG&E’s Presently Effective Gas Rates
August 2011 1 Pacific Gas and Electric Company
Gas RateFinder August 2011 Volume 40-G, No. 8
The Gas RateFinder is produced by the Pacific Gas and Electric Company Analysis and Rates Department as a quick reference to most PG&E gas rates, for both PG&E employees and customers. It does not replace tariff sheets.
This Gas RateFinder contains core and noncore gas price changes for the month of August 2011.
To view the current Gas RateFinder
and 2010/2009/2008 editions, please visit PG&E’s Internet site at: http://www.pge.com/tariffs (Select #17)
Questions about PG&E’s rates or
tariffs can be E-mailed to: [email protected], or by phone by calling 1-800-743-5000.
Contents
I - Core Gas Rates Residential Schedules* G-1, GM, GS, GT,
GL-1, GML, GSL, and GTL ............................ ..2 Res. Baseline Territories and Quantities........ ..2 Residential Natural Gas Vehicle*.................... ..3 Core Commercial
Schedules G-NR1* and G-NR2* ..................... ..4 Schedule G-CT.................................................. ..5 Natural Gas Vehicle
Schedules G-NGV1* and G-NGV2* ………….6 Schedule G-NGV4............................................ ..7
Public Purpose Program Surcharge Schedule G-PPPS ………………….……………8
II - Noncore Gas Rates Customer-Procured Gas Franchise Fee Schedule G-SUR*………………………………..10
III - Gas Transportation Rates Gas Transportation Service
Schedule G-NT ................................................. ...11 Gas Transportation to Cogeneration Facilities and Electric Generation Schedule G-EG ................................................. ...12 Wholesale and Gas Balancing Service Schedules G-WSL and G-BAL....................... ...13 Annual Firm Transportation:
On-System -- Schedule G-AFT................... ...14 Off-System -- Schedule G-AFTOFF ........... ...16 Seasonal Firm Transportation: On-System -- Schedule G-SFT.................... ...18 As-Available Transportation: On-System -- Schedule G-AA……………. ..20 Off-System -- Schedule G-AAOFF ............. ..21 Negotiated Firm Transportation: On-System -- Schedule G-NFT……………...22 Off-System -- Schedule G-NFTOFF ........... ...24 Negotiated As-Available Transportation: On-System -- Schedule G-NAA ................. ...26 Off-System -- Schedule G-NAAOFF.......... ...27
[*Rates Change Monthly]

Gas RateFinder Core Gas Rates
August 2011 2 Pacific Gas and Electric Company
I - Core Gas Rates
Residential Gas Rates The residential gas rates below are effective August 1, 2011, through August 31, 2011.
SCHEDULES
G-1, GM, GS, GT SCHEDULES
GL-1, GML, GSL, GTL BASELINE EXCESS BASELINE EXCESS
Procurement Charge (per therm) $0.64931 $0.64931 $0.64931 $0.64931 Transportation Charge (per therm) $0.48036 $0.76858 $0.48036 $0.76858 Care Discount n/a n/a -$0.22593 -$0.28358 Total Residential Schedule Charge1/ $1.12967 $1.41789 $0.90374 $1.13431 Schedule G-PPPS (Public Purpose Program Surcharge)1/ (per therm)
$0.08400
$0.08400
$0.05959
$0.05959
Minimum Transportation Charge (G-1 Only)2/ (per day) $0.09863 Discount (per day) GS & GSL only (per dwelling unit) $0.20900 $0.20900 GT & GTL only (per installed space) $0.48200 $0.48200 Minimum Average Rate Limiter (per therm) Eliminated August 1, 2010, due to BCAP D. 10-06-035 -- --
1/Schedule G-PPPS needs to be added to the Total Charge for bill calculation. See Schedule G-PPPS. 2/The Transportation Charge will be no less than the Minimum Transportation Charge. The Minimum Transportation Charge does not apply to submetered tenants of master-metered customers served under gas Rate Schedules GS and GT.
Baseline Territories and QuantitiesWINTER
(November 1 – March 31) SUMMER
(April 1 - October 31)
TERRITORY INDIVIDUALLY METERED
MASTER METERED (GM & GML only) TERRITORY INDIVIDUALLY
METERED MASTER METERED
(GM & GML only)
Monthly Daily Monthly Daily Monthly Daily Monthly Daily
P 66 2.18 30 0.99 P 15 0.49 11 0.36
Q 62 2.05 25 0.83 Q 21 0.69 18 0.59
R 56 1.85 52 1.72 R 15 0.49 15 0.49
S 59 1.95 23 0.76 S 15 0.49 11 0.36
T 54 1.79 35 1.16 T 21 0.69 18 0.59
V 52 1.72 35 1.16 V 22 0.72 17 0.56
W 54 1.79 30 0.99 W 15 0.49 10 0.33
X 62 2.05 25 0.83 X 19 0.62 12 0.39
Y 80 2.64 33 1.09 Y 27 0.88 19 0.62 To calculate bills use daily quantity (monthly provided for information purposes only).

Gas RateFinder Core Gas Rates
August 2011 3 Pacific Gas and Electric Company
Residential Natural Gas Vehicle Rates The residential h
natural gas vehicle rates below are effective August 1, 2011, througAugust 31, 2011.
SCHEDULE G1-NGV
SCHEDULE GL1-NGV
Customer Charge (per day) $0.41425 $0.33140 Procurement Charge (per therm) $0.53916 $0.53916 Transportation Charge (per therm) $0.24403 $0.24403 Care Discount n/a -$0.15664 Total G1-NGV or GL1-NGV Schedule Charge1/ $0.78319 $0.62655
Schedule G-PPPS (Public Purpose Program Surcharge)1/ (per therm) $0.08400 $0.05959
1/Schedule G-PPPS needs to be added to the Total Charge for bill See Sched
&E’s
ral Gas
ion
natural gas Service Territory.
calculation. ule G-PPPS.
This rate schedule applies to natural gas service to Core End-Use Customers on PGTransmission and/or Distribution Systems. Service on this schedule is an option to thosecustomers for whom Schedule G-1 or GL-1 applies** and is for residential use where a NatuVehicle (NGV) has been leased or purchased and a home refueling appliance (HRA) has been installed for the sole purpose of compressing natural gas for use as a motor-vehicle fuel for the personal vehicle(s) owned or leased by the customer served under this rate schedule. Compressof natural gas to the pressure required for its use as motor-vehicle fuel will be performed by the Customer’s equipment at the Customer’s designated premises only.
chedule G1-NGV and GL1-NGV applies everywhere within PG&E’sSCustomers are responsible for federal and state taxes applicable to fuels for vehicular use.
ertification C In order to receRefueling Appliance Certification (Form No. 79-1047) to PG&E.
urcharges
ive service under this rate schedule, customers must provide a Natural Gas Home
S Customers served under this schedule in conjunction with Schedule G-CT, or in conjunction with
noncore service, are subject to a franchise fee surcharge under Schedule G-SUR for gas volumes purchased from parties other than PG&E and transported by PG&E. Customers served under thisschedule are subject to a gas Public Purpose Program (PPP) Surcharge under Schedule G-PPPS.
lternate Procurement ServiceA Customers may procure gas supply from a party other than PG&E by taking service on this
o
nd
schedule in conjunction with Schedule G-CT – Core Gas Aggregation Service. Customers whprocure their own gas supply will not pay the Procurement Charge component on this rate schedule shown above and will be subject to the applicable rates specified in Schedule G-CT. **Schedule GL-1 applies to applicants who qualify for California Rates for Energy (CARE) under the eligibility acertification criteria set forth in Rules 19.1, 19.2, or 19.3.
Gas RateFinder Gas Transportation Rates
August 2011 4 Pacific Gas and Electric Company
Core Commercial Gas Rates Rates below are effective August 1, 2011, through August 31, 2011.
Small Commercial: Schedule G-NR1 (Usage less than 20,800 therms per month)* HIGHEST AVERAGE DAILY USAGE**
0 - 5.0 THERMS
5.1 - 16.0 THERMS
16.1 - 41.0 THERMS
41.1 - 123.0 THERMS
123.1 & UP THERMS
Customer Charge (per day) $0.27048 $0.52106 $0.95482 $1.66489 $2.14936 PER THERM SUMMER WINTER FIRST 4,000
THERMS EXCESS
THERMS FIRST 4,000
THERMS EXCESS THERMS
Procurement Charge (per therm) $0.56602 $0.56602 $0.56602 $0.56602 Transportation Charge (per therm) $0.30289 $0.11883 $0.36983 $0.14509
Total G-NR1 Schedule Charge1/ $0.86891 $0.68485 $0.93585 $0.71111 Schedule G-PPPS (Public Purpose Program Surcharge)1/ (per therm)
$0.05078
$0.05078
$0.05078
$0.05078
*Excluding months during which usage is less than 200 therms. **Based on customer’s highest Average Daily Usage (ADU) determined from among the billing periods occurring within the last twelve months, including current billing period. PG&E calculates the ADU for each billing period by dividing the total usage by the number of days in the billing period.
Large Commercial: Schedule G-NR2 (Usage greater than 20,800 therms per month)* PER DAY PER THERM
SUMMER WINTER
FIRST 4,000 THERMS
EXCESS THERMS
FIRST 4,000 THERMS
EXCESS THERMS
Customer Charge $4.95518 Procurement Charge $0.46801 $0.46801 $0.46801 $0.46801 Transportation Charge $0.30289 $0.11883 $0.36983 $0.14509
Total G-NR2 Schedule Charge1/ $0.77090 $0.58684 $0.83784 $0.61310 Schedule G-PPPS (Public Purpose Program Surcharge)1/
$0.09366
$0.09366
$0.09366
$0.09366
*Excluding months during which usage is less than 200 therms. 1/Schedule G-PPPS needs to be added to the Total Charge for bill calculation. Prior to April 1, 2005, the transportation rate included the PPP surcharge mandated by state. Effective April 1, 2005, gas PPP surcharges are removed from gas transportation rates. See Schedule G-PPPS for details and CARE rate.
G-NR1 and G-NR2 Seasons: Summer: April 1 through Oct. 31
Winter: November 1 through March 31

Gas RateFinder Gas Transportation Rates
August 2011 5 Pacific Gas and Electric Company
Core Gas Aggregation Rates Core Gas Aggregation Service: Schedule G-CT Schedule G-CT applies to transportation of natural gas for Core End-Use Customers who aggregate their gas volumes and who obtain natural gas supply service from a source other than PG&E. The provisions of Schedule G-CT apply to Core End-Use Customers and to the party who supplies them with natural gas and provides or obtains services necessary to deliver such gas to PG&E's Distribution System. Rule 23 (Tariff Book) also sets forth terms and conditions applicable to Core Gas Aggregation Service. A group of Core End-Use Customers who aggregate their gas volumes comprise a Core Transport Group (Group). The minimum aggregate gas volume for a Group is 12,000 decatherms per year. The Customer must designate a Core Transport Agent (CTA), who is responsible for providing gas aggregation services to Customers in the Group as described in Rule 23. Aggregation of multiple loads at a single facility or aggregation of loads at multiple facilities shall not change the otherwise-applicable rate schedule for a specific facility. Customers electing service under this schedule must request such service for one hundred percent of the core load served by the meter. Schedule G-CT must be taken in conjunction with a core rate schedule.
Core volumes are eligible for service under this schedule, whether or not noncore volumes are also delivered to the same premises. However, core volumes cannot be aggregated with noncore volumes in order to meet the minimum therm requirement for noncore service. Service to core volumes associated with noncore volumes under this schedule applies to all core volumes on the noncore premises. CTAs, on behalf of a Group, may receive service on PG&E’s Backbone Transmission System by utilizing Schedules G-AFT, G-SFT, G-AA, G-NFT, or G-NAA.
Rates Customers taking service under Schedule G-CT will receive and pay for service under their otherwise-applicable core rate schedule in addition to the rate shown below, except that Customers who procure their own gas supply do not pay the Procurement Charge specified on their otherwise-applicable core rate schedule.
Additional Charges Pursuant to Schedule G-SUR, Customers will be subject to a franchise fee surcharge for gas volumes purchased from parties other than PG&E and transported by PG&E. Customers are also responsible for any applicable costs, taxes and/or fees incurred by PG&E in receiving gas to be delivered to such Customers.
See Schedule G-CT for further details.

Gas RateFinder Gas Transportation Rates
August 2011 6 Pacific Gas and Electric Company
Natural Gas Vehicle Rates
The Schedule G-NGV1 and G-NGV2 rates shown below are effective August 1, 2011, through August 31, 2011.
Natural Gas Service For Compression On Customer's Premises: Schedule G-NGV1 (Rates change monthly)
Schedule G-NGV1 applies to the sale of uncompressed natural gas for the sole purpose of compressing it for use as a motor-vehicle fuel. Compression of natural gas to the pressure required for its use as motor-vehicle fuel will be performed by the Customer's equipment at the Customer's designated premises only. PER DAY PER THERM
Customer Charge $0.44121 Procurement Charge $0.46364 Transportation Charge $0.11529
Total G-NGV1 Schedule Charge $0.57893 Schedule G-PPPS (Public Purpose Program Surcharge)1/ $0.02674
Note: The gas procurement charge and total rates generally change on the 1st day of each month. (Transportation rates do not change monthly.) See Schedule G-NGV1 for further details.
Compressed Natural Gas Service on PG&E’s Premises: Schedule G-NGV2 (Rates change monthly)
Schedule G-NGV2 applies to the sale of compressed natural gas (CNG) at PG&E-owned natural gas fueling stations to customers who use CNG as a motor fuel. PER MONTH PER THERM
Procurement Charge $0.46364 Transportation Charge $1.36774
Total G-NGV2 Schedule Charge $1.83138 Per Gasoline Gallon Equivalent $2.33684 Schedule G-PPPS (Public Purpose Program Surcharge)1/ $0.02674
Note: The gas procurement charge and total rates generally change on the 5th business day of each month. (Transportation rates do not change monthly.) See Schedule G-NGV2 for further details. 1/Schedule G-PPPS needs to be added to the Total Charge for bill calculation.
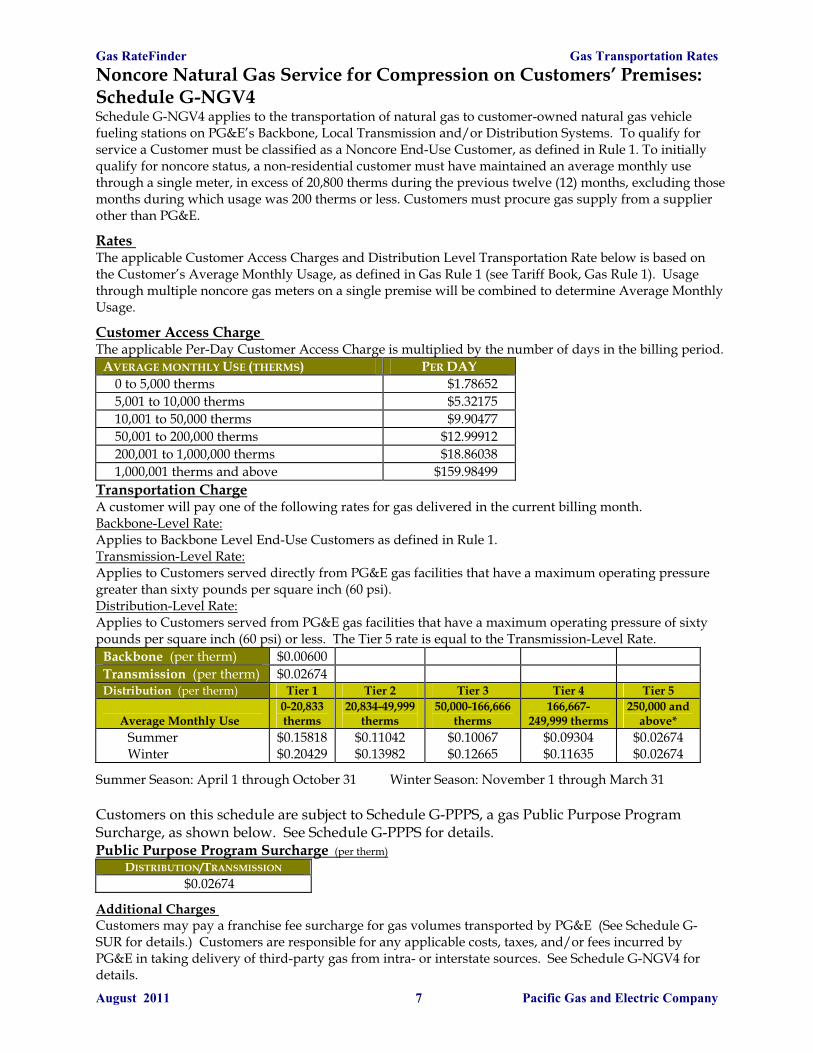
Gas RateFinder Gas Transportation Rates
August 2011 7 Pacific Gas and Electric Company
Noncore Natural Gas Service for Compression on Customers’ Premises: Schedule G-NGV4 Schedule G-NGV4 applies to the transportation of natural gas to customer-owned natural gas vehicle fueling stations on PG&E’s Backbone, Local Transmission and/or Distribution Systems. To qualify for service a Customer must be classified as a Noncore End-Use Customer, as defined in Rule 1. To initially qualify for noncore status, a non-residential customer must have maintained an average monthly use through a single meter, in excess of 20,800 therms during the previous twelve (12) months, excluding those months during which usage was 200 therms or less. Customers must procure gas supply from a supplier other than PG&E.
Rates The applicable Customer Access Charges and Distribution Level Transportation Rate below is based on the Customer’s Average Monthly Usage, as defined in Gas Rule 1 (see Tariff Book, Gas Rule 1). Usage through multiple noncore gas meters on a single premise will be combined to determine Average Monthly Usage.
Customer Access Charge The applicable Per-Day Customer Access Charge is multiplied by the number of days in the billing period.
AVERAGE MONTHLY USE (THERMS) PER DAY 0 to 5,000 therms $1.78652 5,001 to 10,000 therms $5.32175 10,001 to 50,000 therms $9.90477 50,001 to 200,000 therms $12.99912 200,001 to 1,000,000 therms $18.86038 1,000,001 therms and above $159.98499
Transportation Charge A customer will pay one of the following rates for gas delivered in the current billing month. Backbone-Level Rate: Applies to Backbone Level End-Use Customers as defined in Rule 1. Transmission-Level Rate: Applies to Customers served directly from PG&E gas facilities that have a maximum operating pressure greater than sixty pounds per square inch (60 psi). Distribution-Level Rate: Applies to Customers served from PG&E gas facilities that have a maximum operating pressure of sixty pounds per square inch (60 psi) or less. The Tier 5 rate is equal to the Transmission-Level Rate.
Backbone (per therm) $0.00600 Transmission (per therm) $0.02674 Distribution (per therm) Tier 1 Tier 2 Tier 3 Tier 4 Tier 5
Average Monthly Use
0-20,833 therms
20,834-49,999 therms
50,000-166,666 therms
166,667-249,999 therms
250,000 and above*
Summer Winter
$0.15818 $0.20429
$0.11042 $0.13982
$0.10067 $0.12665
$0.09304 $0.11635
$0.02674 $0.02674
Summer Season: April 1 through October 31 Winter Season: November 1 through March 31 Customers on this schedule are subject to Schedule G-PPPS, a gas Public Purpose Program Surcharge, as shown below. See Schedule G-PPPS for details. Public Purpose Program Surcharge (per therm)
DISTRIBUTION/TRANSMISSION $0.02674
Additional Charges Customers may pay a franchise fee surcharge for gas volumes transported by PG&E (See Schedule G-SUR for details.) Customers are responsible for any applicable costs, taxes, and/or fees incurred by PG&E in taking delivery of third-party gas from intra- or interstate sources. See Schedule G-NGV4 for details.
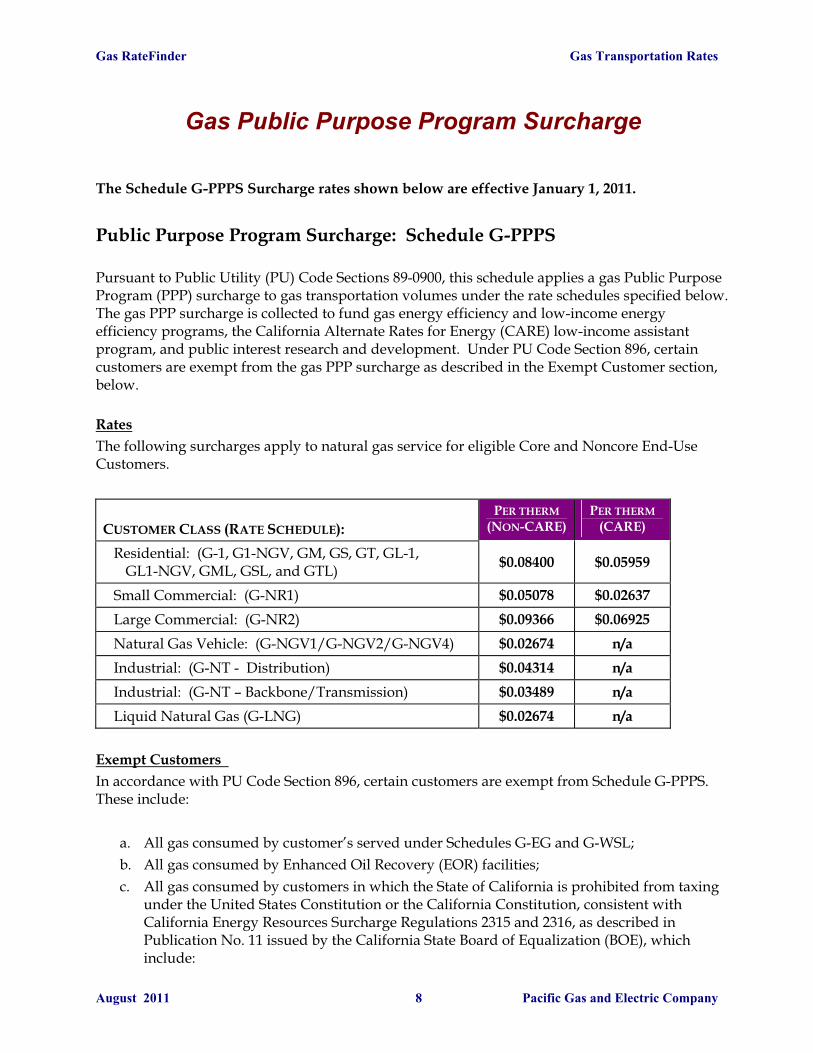
Gas RateFinder Gas Transportation Rates
August 2011 8 Pacific Gas and Electric Company
Gas Public Purpose Program Surcharge
The Schedule G-PPPS Surcharge rates shown below are effective January 1, 2011.
Public Purpose Program Surcharge: Schedule G-PPPS Pursuant to Public Utility (PU) Code Sections 89-0900, this schedule applies a gas Public Purpose Program (PPP) surcharge to gas transportation volumes under the rate schedules specified below. The gas PPP surcharge is collected to fund gas energy efficiency and low-income energy efficiency programs, the California Alternate Rates for Energy (CARE) low-income assistant program, and public interest research and development. Under PU Code Section 896, certain customers are exempt from the gas PPP surcharge as described in the Exempt Customer section, below. Rates The following surcharges apply to natural gas service for eligible Core and Noncore End-Use Customers.
CUSTOMER CLASS (RATE SCHEDULE):
PER THERM (NON-CARE)
PER THERM (CARE)
Residential: (G-1, G1-NGV, GM, GS, GT, GL-1, GL1-NGV, GML, GSL, and GTL) $0.08400 $0.05959
Small Commercial: (G-NR1) $0.05078 $0.02637 Large Commercial: (G-NR2) $0.09366 $0.06925 Natural Gas Vehicle: (G-NGV1/G-NGV2/G-NGV4) $0.02674 n/a Industrial: (G-NT - Distribution) $0.04314 n/a Industrial: (G-NT – Backbone/Transmission) $0.03489 n/a Liquid Natural Gas (G-LNG) $0.02674 n/a
Exempt Customers In accordance with PU Code Section 896, certain customers are exempt from Schedule G-PPPS. These include:
a. All gas consumed by customer’s served under Schedules G-EG and G-WSL; b. All gas consumed by Enhanced Oil Recovery (EOR) facilities; c. All gas consumed by customers in which the State of California is prohibited from taxing
under the United States Constitution or the California Constitution, consistent with California Energy Resources Surcharge Regulations 2315 and 2316, as described in Publication No. 11 issued by the California State Board of Equalization (BOE), which include:

Gas RateFinder Gas Transportation Rates
August 2011 9 Pacific Gas and Electric Company
Public Purpose Program Surcharge (cont’d)
1. The United States, its unincorporated agencies and instrumentalities; 2. Any incorporated agency of instrumentality of the United States wholly owned by
either the United States or by a corporation wholly owned by the United States; 3. The American National Red Cross, its chapters and branches; 4. Insurance companies, including title insurance companies, subject to taxation under
California Constitution, Article XIII, Section 28, or it’s successor; 5. Enrolled Indians purchasing and consuming natural gas on Indian reservations; and 6. Federal Credit unions organized in accordance with the provisions of the Federal
Credit Union Act. Exempt Customer Bill Adjustments: PG&E will annually review its customer accounts and make appropriate bill adjustments to return any surcharge amounts received from exempt customers, plus applicable interest, within 30 days after identification of such exempt customers, unless previously refunded from the State Treasury. PG&E will inform BOE of any refunds issued to customers. See Schedule G-PPPS for further details.
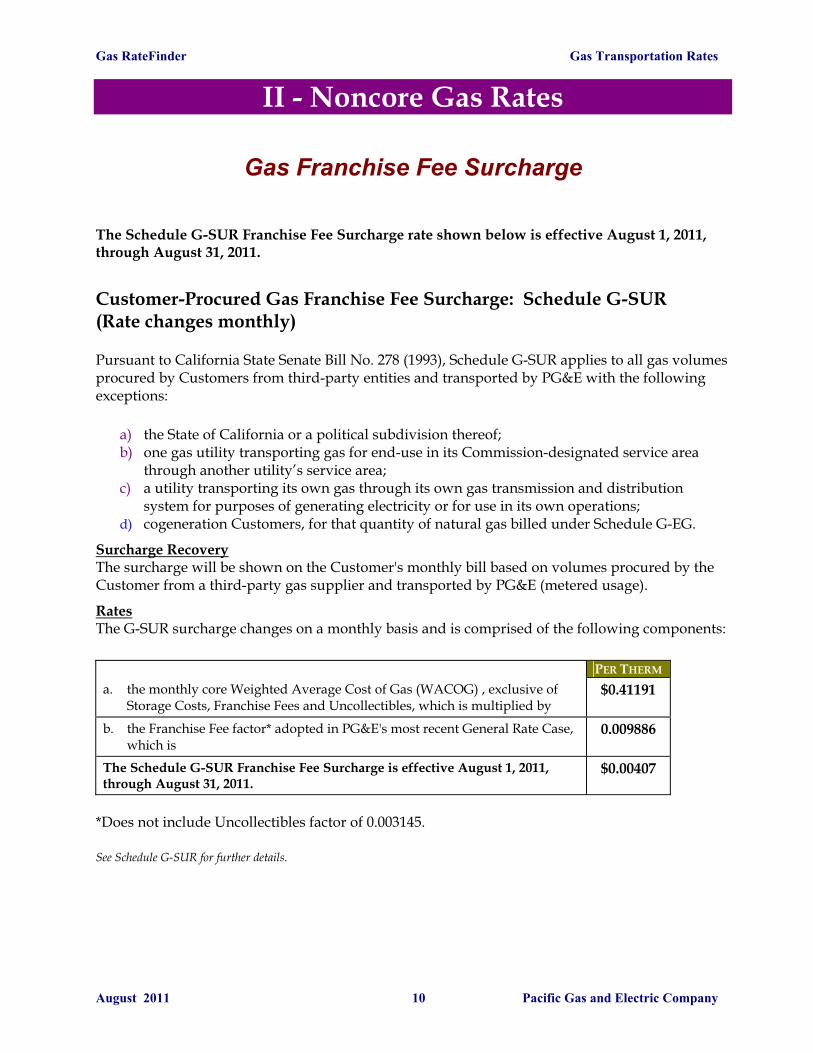
Gas RateFinder Gas Transportation Rates
August 2011 10 Pacific Gas and Electric Company
II - Noncore Gas Rates
Gas Franchise Fee Surcharge
The Schedule G-SUR Franchise Fee Surcharge rate shown below is effective August 1, 2011, through August 31, 2011.
Customer-Procured Gas Franchise Fee Surcharge: Schedule G-SUR (Rate changes monthly)
Pursuant to California State Senate Bill No. 278 (1993), Schedule G-SUR applies to all gas volumes procured by Customers from third-party entities and transported by PG&E with the following exceptions:
a) the State of California or a political subdivision thereof; b) one gas utility transporting gas for end-use in its Commission-designated service area
through another utility’s service area; c) a utility transporting its own gas through its own gas transmission and distribution
system for purposes of generating electricity or for use in its own operations; d) cogeneration Customers, for that quantity of natural gas billed under Schedule G-EG.
Surcharge Recovery The surcharge will be shown on the Customer's monthly bill based on volumes procured by the Customer from a third-party gas supplier and transported by PG&E (metered usage).
Rates The G-SUR surcharge changes on a monthly basis and is comprised of the following components:
PER THERM a. the monthly core Weighted Average Cost of Gas (WACOG) , exclusive of
Storage Costs, Franchise Fees and Uncollectibles, which is multiplied by $0.41191
b. the Franchise Fee factor* adopted in PG&E's most recent General Rate Case, which is
0.009886
The Schedule G-SUR Franchise Fee Surcharge is effective August 1, 2011, through August 31, 2011.
$0.00407
*Does not include Uncollectibles factor of 0.003145. See Schedule G-SUR for further details.
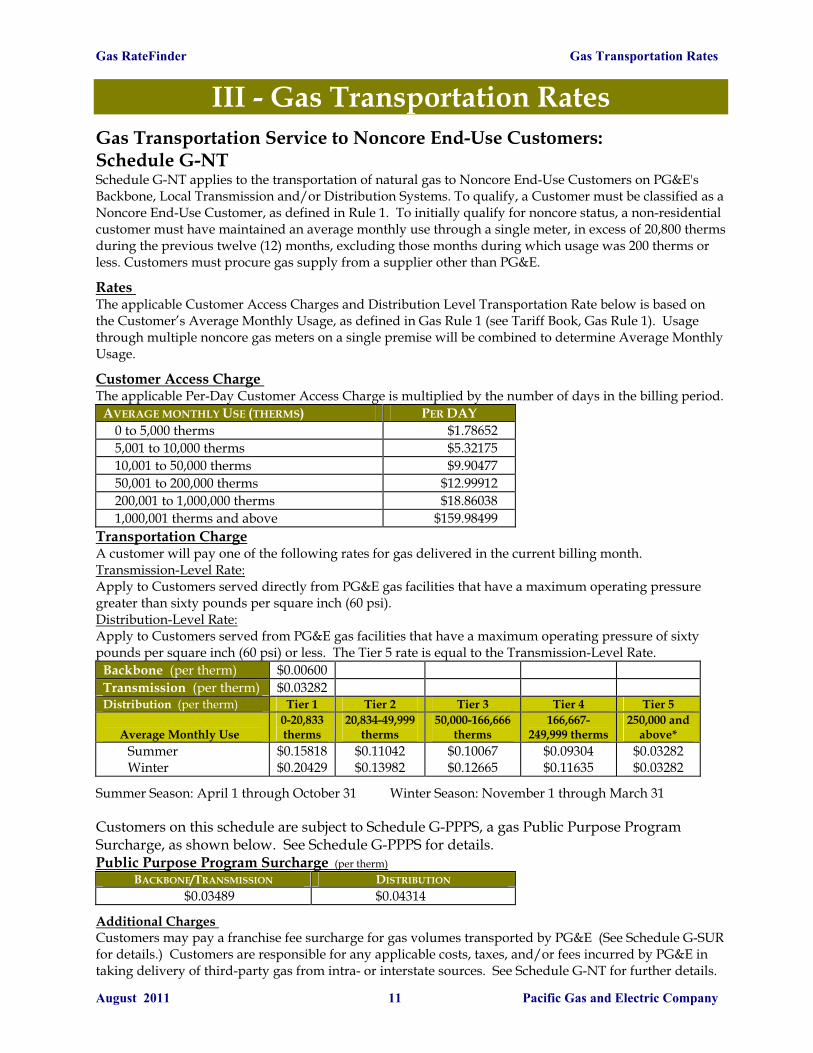
Gas RateFinder Gas Transportation Rates
August 2011 11 Pacific Gas and Electric Company
III - Gas Transportation Rates
Gas Transportation Service to Noncore End-Use Customers: Schedule G-NT Schedule G-NT applies to the transportation of natural gas to Noncore End-Use Customers on PG&E's Backbone, Local Transmission and/or Distribution Systems. To qualify, a Customer must be classified as a Noncore End-Use Customer, as defined in Rule 1. To initially qualify for noncore status, a non-residential customer must have maintained an average monthly use through a single meter, in excess of 20,800 therms during the previous twelve (12) months, excluding those months during which usage was 200 therms or less. Customers must procure gas supply from a supplier other than PG&E.
Rates The applicable Customer Access Charges and Distribution Level Transportation Rate below is based on the Customer’s Average Monthly Usage, as defined in Gas Rule 1 (see Tariff Book, Gas Rule 1). Usage through multiple noncore gas meters on a single premise will be combined to determine Average Monthly Usage.
Customer Access Charge The applicable Per-Day Customer Access Charge is multiplied by the number of days in the billing period.
AVERAGE MONTHLY USE (THERMS) PER DAY 0 to 5,000 therms $1.78652 5,001 to 10,000 therms $5.32175 10,001 to 50,000 therms $9.90477 50,001 to 200,000 therms $12.99912 200,001 to 1,000,000 therms $18.86038 1,000,001 therms and above $159.98499
Transportation Charge A customer will pay one of the following rates for gas delivered in the current billing month. Transmission-Level Rate: Apply to Customers served directly from PG&E gas facilities that have a maximum operating pressure greater than sixty pounds per square inch (60 psi). Distribution-Level Rate: Apply to Customers served from PG&E gas facilities that have a maximum operating pressure of sixty pounds per square inch (60 psi) or less. The Tier 5 rate is equal to the Transmission-Level Rate.
Backbone (per therm) $0.00600 Transmission (per therm) $0.03282 Distribution (per therm) Tier 1 Tier 2 Tier 3 Tier 4 Tier 5
Average Monthly Use
0-20,833 therms
20,834-49,999 therms
50,000-166,666 therms
166,667-249,999 therms
250,000 and above*
Summer Winter
$0.15818 $0.20429
$0.11042 $0.13982
$0.10067 $0.12665
$0.09304 $0.11635
$0.03282 $0.03282
Summer Season: April 1 through October 31 Winter Season: November 1 through March 31 Customers on this schedule are subject to Schedule G-PPPS, a gas Public Purpose Program Surcharge, as shown below. See Schedule G-PPPS for details. Public Purpose Program Surcharge (per therm)
BACKBONE/TRANSMISSION DISTRIBUTION $0.03489 $0.04314
Additional Charges Customers may pay a franchise fee surcharge for gas volumes transported by PG&E (See Schedule G-SUR for details.) Customers are responsible for any applicable costs, taxes, and/or fees incurred by PG&E in taking delivery of third-party gas from intra- or interstate sources. See Schedule G-NT for further details.
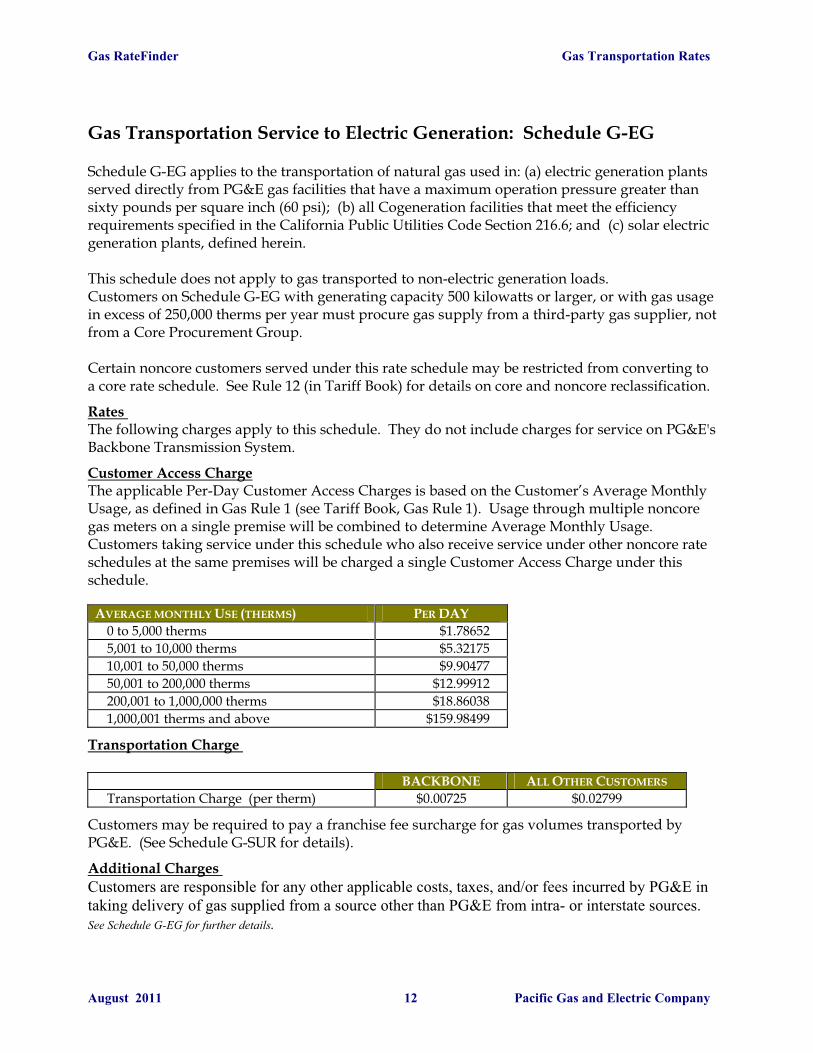
Gas RateFinder Gas Transportation Rates
August 2011 12 Pacific Gas and Electric Company
Gas Transportation Service to Electric Generation: Schedule G-EG
Schedule G-EG applies to the transportation of natural gas used in: (a) electric generation plants served directly from PG&E gas facilities that have a maximum operation pressure greater than sixty pounds per square inch (60 psi); (b) all Cogeneration facilities that meet the efficiency requirements specified in the California Public Utilities Code Section 216.6; and (c) solar electric generation plants, defined herein. This schedule does not apply to gas transported to non-electric generation loads. Customers on Schedule G-EG with generating capacity 500 kilowatts or larger, or with gas usage in excess of 250,000 therms per year must procure gas supply from a third-party gas supplier, not from a Core Procurement Group. Certain noncore customers served under this rate schedule may be restricted from converting to a core rate schedule. See Rule 12 (in Tariff Book) for details on core and noncore reclassification.
Rates The following charges apply to this schedule. They do not include charges for service on PG&E's Backbone Transmission System.
Customer Access Charge The applicable Per-Day Customer Access Charges is based on the Customer’s Average Monthly Usage, as defined in Gas Rule 1 (see Tariff Book, Gas Rule 1). Usage through multiple noncore gas meters on a single premise will be combined to determine Average Monthly Usage. Customers taking service under this schedule who also receive service under other noncore rate schedules at the same premises will be charged a single Customer Access Charge under this schedule.
AVERAGE MONTHLY USE (THERMS) PER DAY 0 to 5,000 therms $1.78652 5,001 to 10,000 therms $5.32175 10,001 to 50,000 therms $9.90477 50,001 to 200,000 therms $12.99912 200,001 to 1,000,000 therms $18.86038 1,000,001 therms and above $159.98499
Transportation Charge
BACKBONE ALL OTHER CUSTOMERS Transportation Charge (per therm) $0.00725 $0.02799
Customers may be required to pay a franchise fee surcharge for gas volumes transported by PG&E. (See Schedule G-SUR for details).
Additional Charges Customers are responsible for any other applicable costs, taxes, and/or fees incurred by PG&E in taking delivery of gas supplied from a source other than PG&E from intra- or interstate sources. See Schedule G-EG for further details.
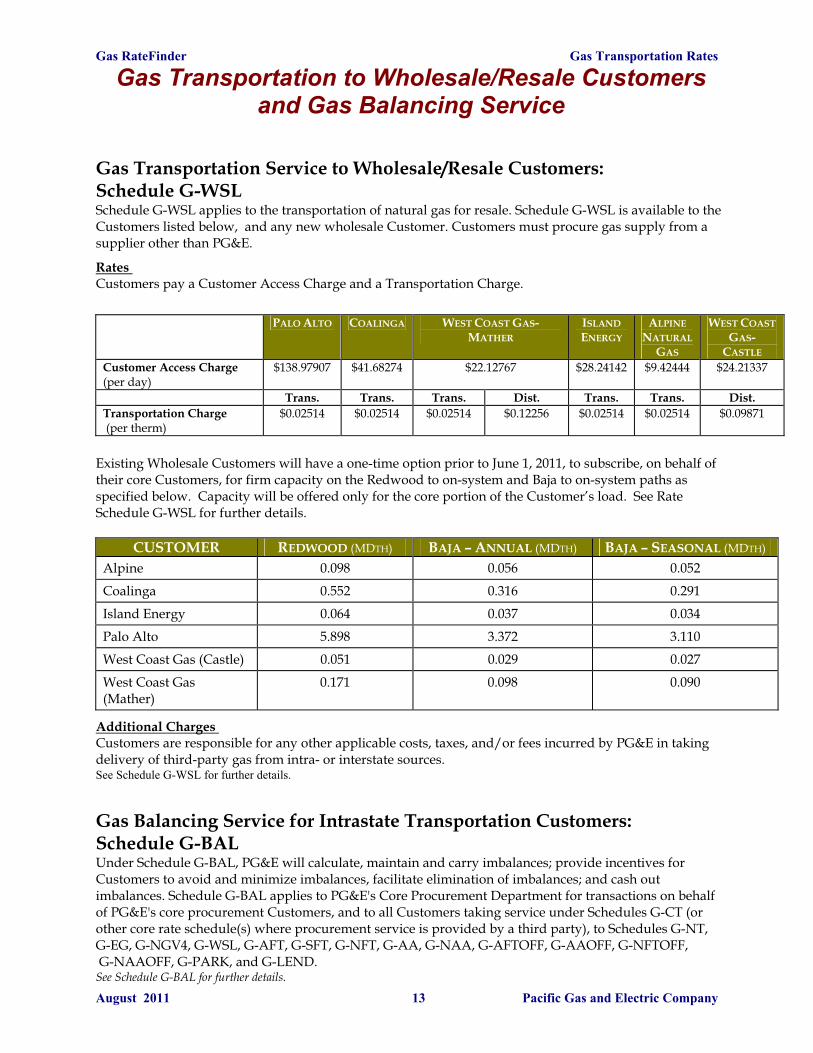
Gas RateFinder Gas Transportation Rates
August 2011 13 Pacific Gas and Electric Company
Gas Transportation to Wholesale/Resale Customers
as Transportation Service to Wholesale/Resale Customers:
o the
and Gas Balancing Service
GSchedule G-WSL Schedule G-WSL applies to the transportation of natural gas for resale. Schedule G-WSL is available tCustomers listed below, and any new wholesale Customer. Customers must procure gas supply from a supplier other than PG&E.
Rates Customers pay a Customer Access Charge and a Transportation Charge.
P A ALO LTO C OALINGA W C GEST OAST AS-MATHER
ISLAND ENERGY
ALPINE NATURAL
GAS
WEST COAST GAS-
CASTLE Customer Access Charge (per day)
$138.97907 $41.68274 $22.12767 $28.24142 $9.42444 $24.21337
Trans. Trans. Trans ist. . D Trans. Trans. Dist. Transportation Charge
per therm) $0.02514 $0.02514 $0.02514 $0.12256 $0.02514 $0.02514 $0.09871
(
lesale Customers will have a one-time option prior to June 1, 2011, to subscribe, on behalf of Eth
xisting Whoeir core Customers, for firm capacity on the Redwood to on-system and Baja to on-system paths as
specified below. Capacity will be offered only for the core portion of the Customer’s load. See Rate Schedule G-WSL for further details.
CUSTOMER REDWOOD (MDTH) BAJA – ANNUAL (MDTH) BAJA – SEASONAL (MDTH) Alpine 0.098 0.056 0.052
Coalinga 0.552 0.316 0.291
Island Energy 0.064 0.037 0.034
Palo Alto 5.898 3.372 3.110
West Coast Gas (Castle) 0.051 0.029 0.027
West Coast Gas (Mather)
0.171 0.098 0.090
Additional Charges r applicable costs, taxes, and/or fees incurred by PG&E in taking
as Balancing Service for Intrastate Transportation Customers:
ives for
half
See Schedule G-BAL for further details.
Customers are responsible for any othedelivery of third-party gas from intra- or interstate sources. See Schedule G-WSL for further details.
GSchedule G-BAL Under Schedule G-BAL, PG&E will calculate, maintain and carry imbalances; provide incentCustomers to avoid and minimize imbalances, facilitate elimination of imbalances; and cash out imbalances. Schedule G-BAL applies to PG&E's Core Procurement Department for transactions on beof PG&E's core procurement Customers, and to all Customers taking service under Schedules G-CT (or other core rate schedule(s) where procurement service is provided by a third party), to Schedules G-NT, G-EG, G-NGV4, G-WSL, G-AFT, G-SFT, G-NFT, G-AA, G-NAA, G-AFTOFF, G-AAOFF, G-NFTOFF, G-NAAOFF, G-PARK, and G-LEND.
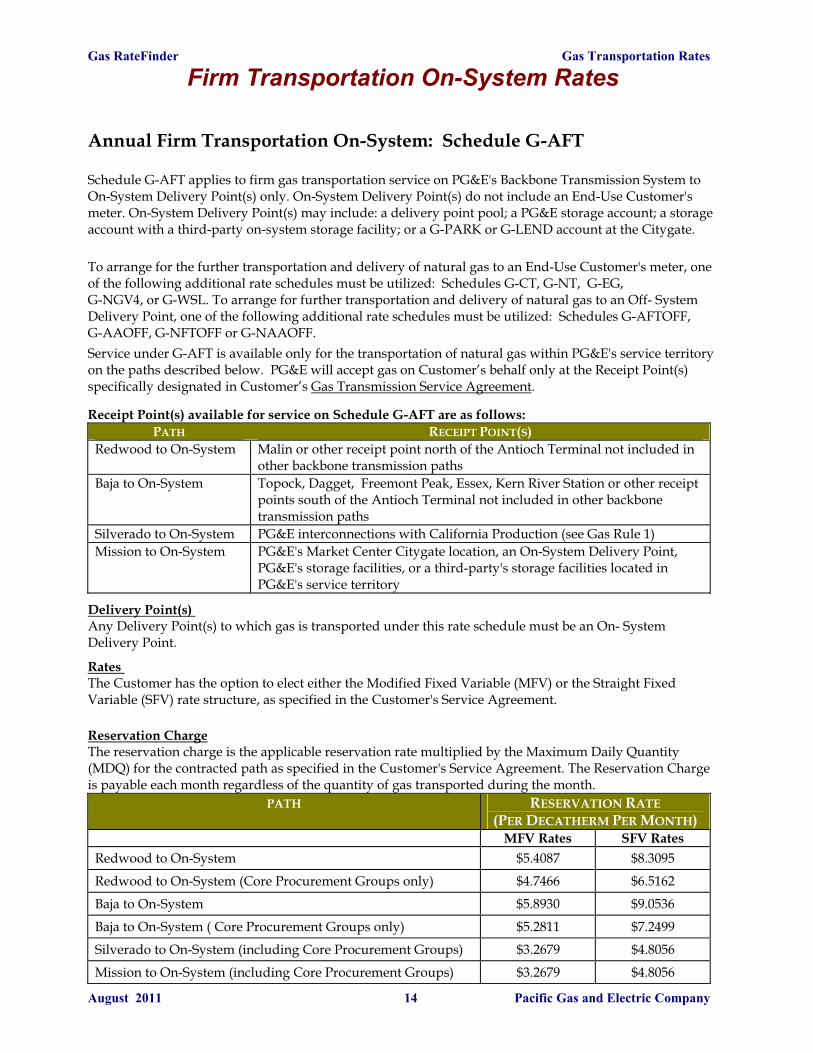
Gas RateFinder Gas Transportation Rates
August 2011 14 Pacific Gas and Electric Company
Annual Firm
chedule G-AFT applies to firm gas transportation service on PG&E's Backbone Transmission System to -Use Customer's e account; a storage
ccount with a third-party on-system storage facility; or a G-PARK or G-LEND account at the Citygate.
Delivery Point, one of the following additional rate schedules must be utilized: Schedules G-AFTOFF,
Firm Transportation On-System Rates
Transportation On-System: Schedule G-AFT SOn-System Delivery Point(s) only. On-System Delivery Point(s) do not include an Endmeter. On-System Delivery Point(s) may include: a delivery point pool; a PG&E storaga
To arrange for the further transportation and delivery of natural gas to an End-Use Customer's meter, one of the following additional rate schedules must be utilized: Schedules G-CT, G-NT, G-EG, G-NGV4, or G-WSL. To arrange for further transportation and delivery of natural gas to an Off- System
G-AAOFF, G-NFTOFF or G-NAAOFF. Service under G-AFT is available only for the transportation of natural gas within PG&E's service territory on the paths described below. PG&E will accept gas on Customer’s behalf only at the Receipt Point(s) specifically designated in Customer’s Gas Transmission Service Agreement.
Receipt Point(s) available for service on Schedule G-AFT are as follows: PATH RECEIPT POINT(S)
Redwood to On-System Malin or other receipt point north of the Antioch Terminal not included in other backbone transmission paths
Baja to On-System Topock, Dagget, Freemont Peak, Essex, Kern River Station or other receipt points south of the Antioch Terminal not included in other backbone transmission paths
Silverado to On-System ia Production (see Gas Rule 1) PG&E interconnections with CalifornMission to On-System
tory
PG&E's Market Center Citygate location, an On-System Delivery Point, PG&E's storage facilities, or a third-party's storage facilities located inPG&E's service terri
Delivery Point(s) (s) toAny Delivery Point wh
Delivery Point. ich gas is transported under this rate schedule must be an On- System
Rates The Customer has the option to elect either the Modified Fixed Variable (MFV) or the Straight FixedVariable (SFV) rate structure, as specified in the Customer's Service Agreement.
Reservation Charge The reservation charge is the applicable reservation rate multiplied by the Maximum Daily Quantity (MDQ) for the contracted path as specified in the Customer's Service Agreement. The Reservation Charge is payable each month regardless of the quantity of gas transported during the month.
PATH R R ESERVATION ATE(PER DECATHERM PER MONTH)
MFV Rates SFV Rates Redwood to On-System $5.4087 $8.3095
Redwood to On-System (Core Procurement Groups only) $4.7466 $6.5162
Baja to On-System $5.8930 $9.0536
Baja to On-System ( Core Procurement Groups only) $5.2811 $7.2499
Silverado to On-System (including Core Procurement Groups) $3.2679 $4.8056
Mission to On-System (including Core Procurement Groups) $3.2679 $4.8056
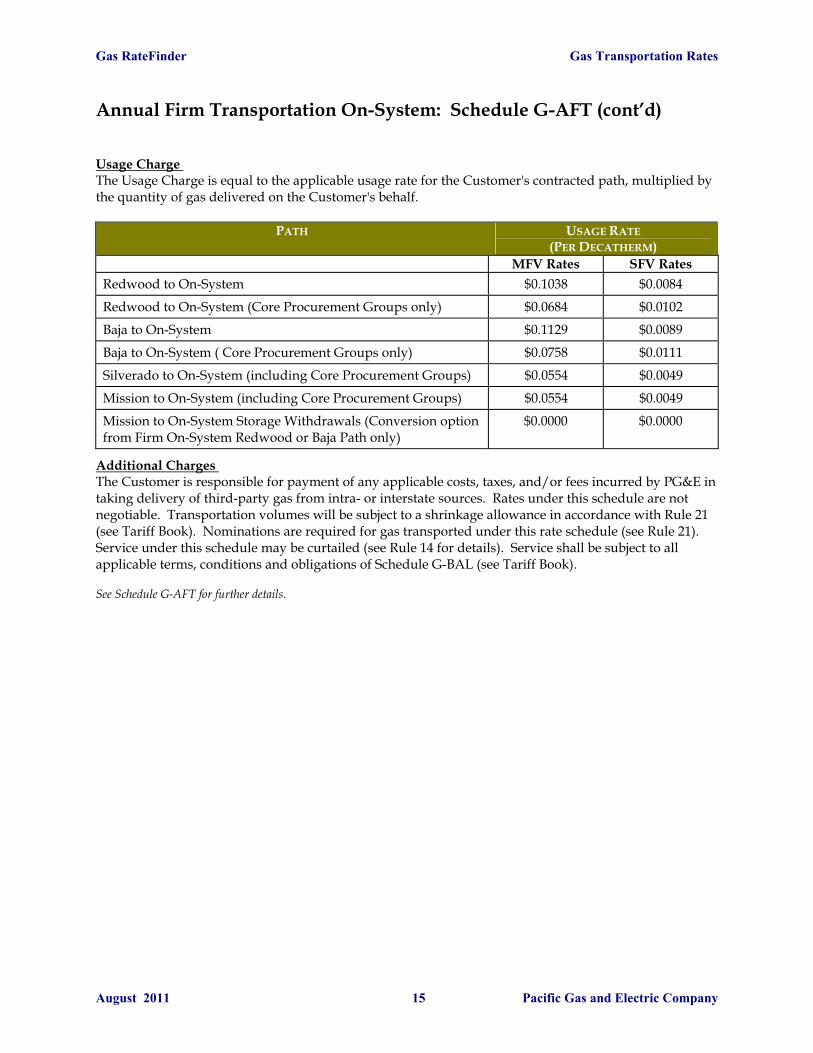
Gas RateFinder Gas Transportation Rates
August 2011 15 Pacific Gas and Electric Company
Annual Firm Transportation On-System: Schedule G-AFT (cont’d) Usage Charge
The Usage Charge is equal to the applicable usage rate for the Customer's contracted path, multiplied by the quantity of gas delivered on the Customer's behalf.
PATH USAGE RATE (PER DECATHERM)
MFV Rates SFV Rates Redwood to On-System $0.1038 $0.0084
Redwood to On-System (Core Procurement Groups only) $0.0684 $0.0102
Baja to On-System $0.1129 $0.0089
Baja to On-System ( Core Procurement Groups only) $0.0758 $0.0111
Silverado to On-System (including Core Procurement Groups) $0.0554 $0.0049
Mission to On-System (including Core Procurement Groups) $0.0554 $0.0049
Mission to On-System Storage Withdrawals (Conversion option from Firm On-System Redwood or Baja Path only)
$0.0000 $0.0000
Additional Charges The Customer is responsible for payment of any applicable costs, taxes, and/or fees incurred by PG&E in taking delivery of third-party gas from intra- or interstate sources. Rates under this schedule are not negotiable. Transportation volumes will be subject to a shrinkage allowance in accordance with Rule 21 (see Tariff Book). Nominations are required for gas transported under this rate schedule (see Rule 21). Service under this schedule may be curtailed (see Rule 14 for details). Service shall be subject to all applicable terms, conditions and obligations of Schedule G-BAL (see Tariff Book). See Schedule G-AFT for further details.

Gas RateFinder Gas Transportation Rates
August 2011 16 Pacific Gas and Electric Company
Transportation Off-System: Schedule G-AFTOFF
ervice on PG&E's Backbone Transmission System the Off-System Delivery Points. Schedule G-AFTOFF is available only for the transportation of natural
gas within PG&E's service terr n the specific paths described below for of ries. PG&E will accept gas on Customer’s behalf only at the Receipt Point(s) specifically er’s Gas
Firm Transportation Off-System Rates Annual Firm Schedule G-AFTOFF applies to firm gas transportation sto
itory o f-system delivedesignated in Custom
Transmission Service Agreement.
R FF are as foeceipt Point(s) available for service on Schedule G-AFTO llows: PATH RECEIPT POINT(S)
Redwood to Off-System Malin or other receipt point north of the An minal not included in on paths
tioch Terother backbone transmissi
Baja to Off-System Topock, Dagget, Freemont Peak, Essex, Ker tation or o ipt n River S ther recepoints south of the Antioch Terminal not included in other backbone transmission paths
Silverado to Off-System PG&E interconnections with California Pro see Gas Ruduction ( le 1) Mission to Off-System PG&E's Market Center Citygate location, an On-System Delivery Point,
PG&E's storage facilities or a third-party's storage facilities located in PG&E's service territory
Firm Off-System Delivery Points Kern River Station to Southern California Gas Company Fremont Peak to Kern River Gas Transmission
Backhaul Off-System Points ll off-system interconnection points are available as backhaul delivery points undA er this schedule if the
ul nominations. Backhaul service is limited to the quantities of gas being
Alternative Delivery Points
upstream pipeline accepts backhadelivered from the upstream pipeline.
If the Customer elects the Modified Fixed Variable (MFV) rate structure under Schedule G-AFTOFF, the Delivery Point under this schedule shall be limited to a Firm Off-System Delivery Point. If the Customer elects the Straight Fixed Variable (SFV) rate structure under G-AFTOFF, the Customer may specify an On-System Delivery Point within the transmission path contracted by Customer as an alternate delivery point.
Rates The Customer has the option to elect either the Modified Fixed Variable (MFV) or the Straight Fixed Variable (SFV) rate structure, which will be specified in the Customer's Service Agreement.

Gas RateFinder Gas Transportation Rates
August 2011 17 Pacific Gas and Electric Company
Annual Firm Transportation Off-System: Schedule G-AFTOFF (cont’d)
Reservation Charge The reservation charge is the applicable reservation rate multiplied by the Maximum Daily Quantity
DQ) for the contracted path as specified in the Customer's Service Agreement. The Reservation Charge (Mis payable each month regardless of the quantity of gas transported during the month.
PATH RESERVATION RATE(PER DECATHERM PER MONTH)
MFV Rates SFV Rates
Redwood to Off-System $5.4087 $8.3095
Baja to Of m $5.8930 $9.0f-Syste 536
Silverado to Off-System $5.4087 $8.3095
Mission to Off-System $5.4087 $8.3095
Usage Charge T al t d by the quantity of gas delivered
he Usage Charge is equ o the applicable usage rate for the Customer's contracted path, multiplie on the Customer's behalf.
PATH USAGE RATE(PER DECATHERM)
MFV RATES SFV R ATES Redwood to Off-System $0.1038 $0.0084
Baja to Off-System $0.1129 $0.0089
Silverado to Off-System $0.1038 $0.0084
Mission to Off-System $0.1038 $0.0084
Additional Charges The Customer is responsible for payment of any applicable costs, taxes, and/or fees incurred by PG&E in taking delivery of third-party gas from intra- or interstate sources. Rates under this schedule are not negotiable. Transportation volumes will be subject to a shrinkage allowance in accordance with Rule 21 (see Tariff Book). Nominations are required for gas transported under this rate schedule (see Rule 21). Service under this schedule may be curtailed (see Rule 14 for details). Service shall be subject to all
See Schedule G-AFTOFF for further details.
applicable terms, conditions and obligations of Schedule G-BAL (see Tariff Book).
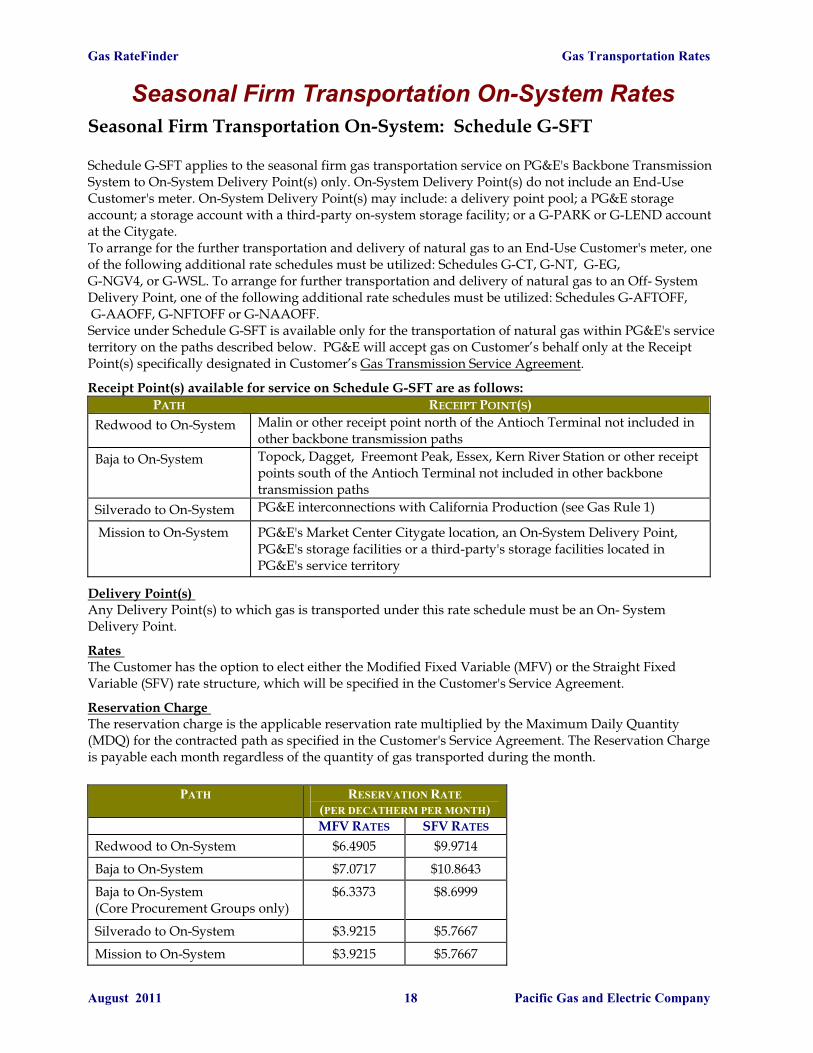
Gas RateFinder Gas Transportation Rates
August 2011 18 Pacific Gas and Electric Company
Seasonal Firm Transportation On-System: Schedule G-SFT
sion
&E storage account; a storage account with a third-party on-system storage facility; or a G-PARK or G-LEND account at the CityTo arrange f urther transp l gas to an End-Use Customer's meter, one of the following additional rate dules G-CT, G-NT, G-EG, G-NGV4, or G-WSL. To arrange for furt ransport ural gas to an Off- System D ollowi onal rate schedules must be utilized: Schedules G-AFTOFF, FF or G-NAAService under Schedule G-SFT is available only for th tion of natural gas within PG&E's service t ribed b &E will ac on Customer’s behalf only at the Receipt P nated in er’s Gas Tr on Service Agreement
Seasonal Firm Transportation On-System Rates
Schedule G-SFT applies to the seasonal firm gas transportation service on PG&E's Backbone TransmisSystem to On-System Delivery Point(s) only. On-System Delivery Point(s) do not include an End-Use Customer's meter. On-System Delivery Point(s) may include: a delivery point pool; a PG
gate. or the f ortation and delivery of natura
ust be u schedules mher t
tilized: Scheation and delivery of nat
elivery Point, one of the f ng additiG-AAOFF, G-NFTO OFF.
e transportaerritory on the paths desc elow. PG cept gas oint(s) specifically desig Custom ansmissi .
eceipt Point(s) available for service on Schedule G-SFT are as follows: RPATH RECEIPT POINT(S)
Redwood to On-System Malin or other receipt point north of the Antioch Terminal not included in other backbone transmission paths
Baja to On-System Topock, Dagget, Freemont Peak, Essex, Kern River Station or other receipt points south of the Antioch Terminal not included in other backbone transmission paths
Silverado to On-System PG&E int California Production (see Gas Rule 1) erconnections with
Mission to On-System PG Cente tion, an On-System Delivery Point, PG& ge facilities d-party's storage facilities located in PG& e territory
&E's Market r Citygate locaE's stora or a thirE's servic
Delivery Point(s) A which g ported un ate schedule must be an On- System Delivery Point
ny Delivery Point(s) to.
as is trans der this r
Rates The Customer has the option to elect either the Modified Fixed Variable (MFV) or the Straight Fixed Variable (SFV) rate structure, which will be specified in the Customer's Service Agreement.
Reservation Charge The reservation charge is the applicable reservation rate multiplied by the Maximum Daily Quantity(MDQ) for the contracted path as specified in the Customer's Service Agreement. Th
e Reservation Charge
is payable each month regardless of the quantity of gas transported during the month.
PATH RESERVATION RATE(PER DECATHERM PER MONTH)
MFV RATES SFV RATES Redwood to On-System $6.4905 $9.9714
Baja to On-System $7.0717 $10.8643
Baja to On-System (Core Procurement Groups only)
$6.3373 $8.6999
Silverado to On-System $3.9215 $5.7667
Mission to On-System $3.9215 $5.7667
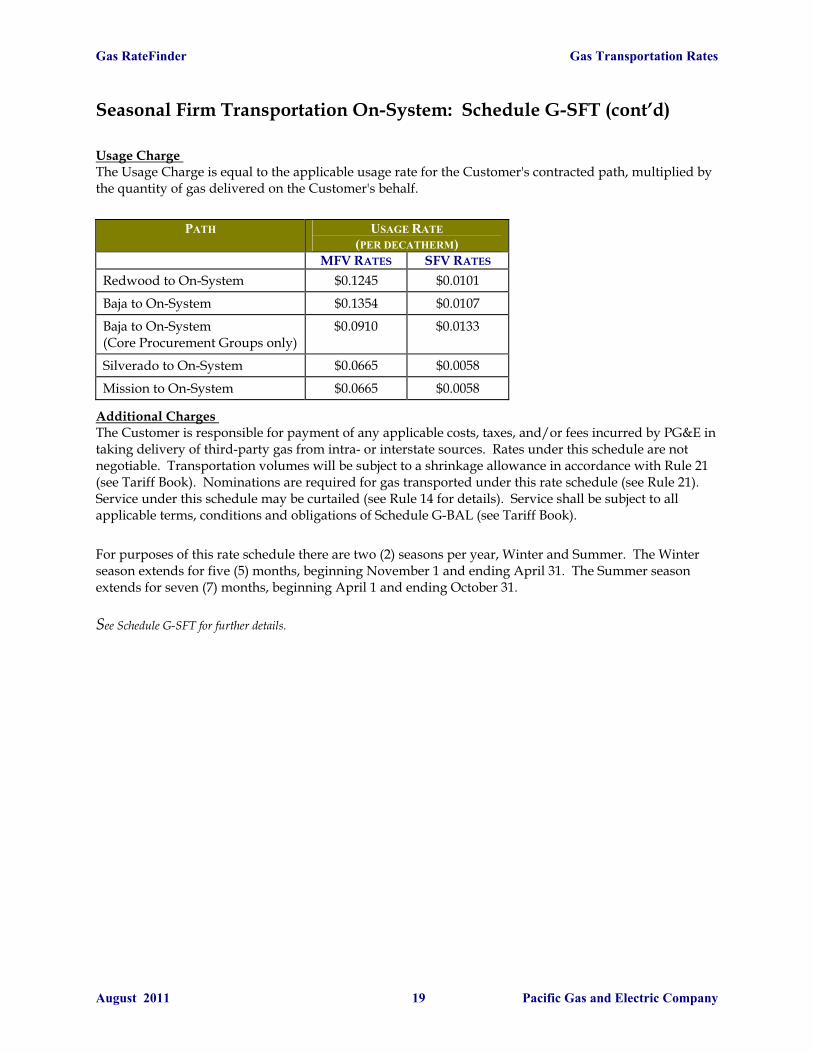
Gas RateFinder Gas Transportation Rates
August 2011 19 Pacific Gas and Electric Company
Seasonal Firm Transportation On-System: Schedule G-SFT (cont’d)
Usage Charge The Usage Charge is equal to the applicable usage rate for the Customer's contracted path, multiplied by the quantity of gas delivered on the Customer's behalf.
PATH USAGE RATE(PER DECATHERM)
MFV RATES SFV RATES Redwood to On-System $0.1245 $0.0101
Baja to On-System $0.1354 $0.0107
Baja to On-System (Core Procurement Groups only)
$0.0910 $0.0133
Silverado to On-System $0.0665 $0.0058
Mission to On-System $0.0665 $0.0058
Additional Charges he Customer is responsibT le
ta rd-partn tation v(see Tariff Book). Nominatio 1). Service under t le l a ns
For purposes of this rate sch ter season extends for five (5) m er 1 and ending April 31. The Summer season
) months, beginning April 1 and ending October 31.
for further details.
for payment of any applicable costs, taxes, and/or fees incurred by PG&E in king delivery of thiegotiable. Transpor
y gas from intra- or interstate sources. Rates under this schedule are not olumes will be subject to a shrinkage allowance in accordance with Rule 21 ns are required for gas transported under this rate schedule (see Rule 2
his schedupplicable terms, conditio
may be curtailed (see Rule 14 for details). Service shall be subject to al and obligations of Schedule G-BAL (see Tariff Book).
edule there are two (2) seasons per year, Winter and Summer. The Winonths, beginning Novemb
extends for seven (7 See Schedule G-SFT

Gas RateFinder Gas Transportation Rates
August 2011 20 Pacific Gas and Electric Company
pool; a PG&E storage account; a storage account with a third-party on-system storage facility; or a G-PARK or G-LEND account at the CitygateTo arrange for the further transportation an l gas to an End-Use Customer's meter, one of the following additional rate sched tilized: Schedules G-CT, G-NT, G-EG, G-NGV4, or G-WSL. To arrange for furt ortation and delivery of natural gas to an Off- System D f the following add te schedules must be utilized: Schedules G-AFTOFF, G-AAOFF, G-NFTOFF or G-NAAOFF. S ilab r the tra on of natural gas within PG&E's service t w. PG&E will accept gas on Customer’s behalf only at the Receipt P ated in Customer’s Gas Transmission Service Agreement
As-Available Transportation On-System Rates s-Available Transportation On-System: Schedule G-AA A
Schedule G-AA applies to As-available gas transportation service on PG&E's Backbone Transmission System to On-System Delivery Point(s) only. On-System Delivery Point(s) do not include an End-Use Customer's meter. On-System Delivery Point(s) may include: a delivery point
. d delivery of natura
ules must be uher transp
elivery Point, one o itional ra
ervice under Schedule G-AA is avaerritory on the paths described belo
le only fo nsportati
oint(s) specifically design .
Receipt Point(s) available for service on Schedule G-AA are as follows: PATH RECEIPT POINT(S)
Redwood to On-System Malin or other receipt point north of the Antioch Terminal not included in other backbone transmission paths
Baja to On-System Topock, Dagget, Freemont Peak, Essex, Kern River Station or other receipt points south of the Antioch Terminal not included in other backbone transmission paths
Silverado to On-System PG&E interconnections with California Production (see Gas Rule 1)
M on to On-System PG&E's Market Center Citygate location, an On-System Delivery Point, issiPG&E's storage facilities or a third-party's storage facilities located in PG&E's service territory
Delivery Point(s) s is transported under this rate schedule must be an On- System
ates
Any Delivery Point(s) to which gaDelivery Point.
R The Customer shall pay a Usage Charge for each decatherm equal to the applicable usage rate for the contracted path, multiplied by the quantity of gas delivered on the Customer’s behalf.
Usage ChargePATH USAGE RATE
(PER DECATHERM) Redwood to On-System $0.3379
Baja to On-System $0.3679
Silverado to On-System $0.1954
Mission to On-System $0.0000
Additional Charges The Customer is responsible for payment of any applicable costs, taxes, and/or fees incurred by PG&E in taking delivery of third-party gas from intra- or interstate sources. Rates under this schedule are not negotiable. Transportation volumes will be subject to a shrinkage allowance in accordance with Rule 21 (see Tariff Book). Nominations are required for gas transported under this rate schedule (see Rule 21). Service under this schedule may be curtailed (see Rule 14 for details). Service shall be subject to all applicable terms, conditions and obligations of Schedule G-BAL (see Tariff Book). See Schedule G-AA for further details.
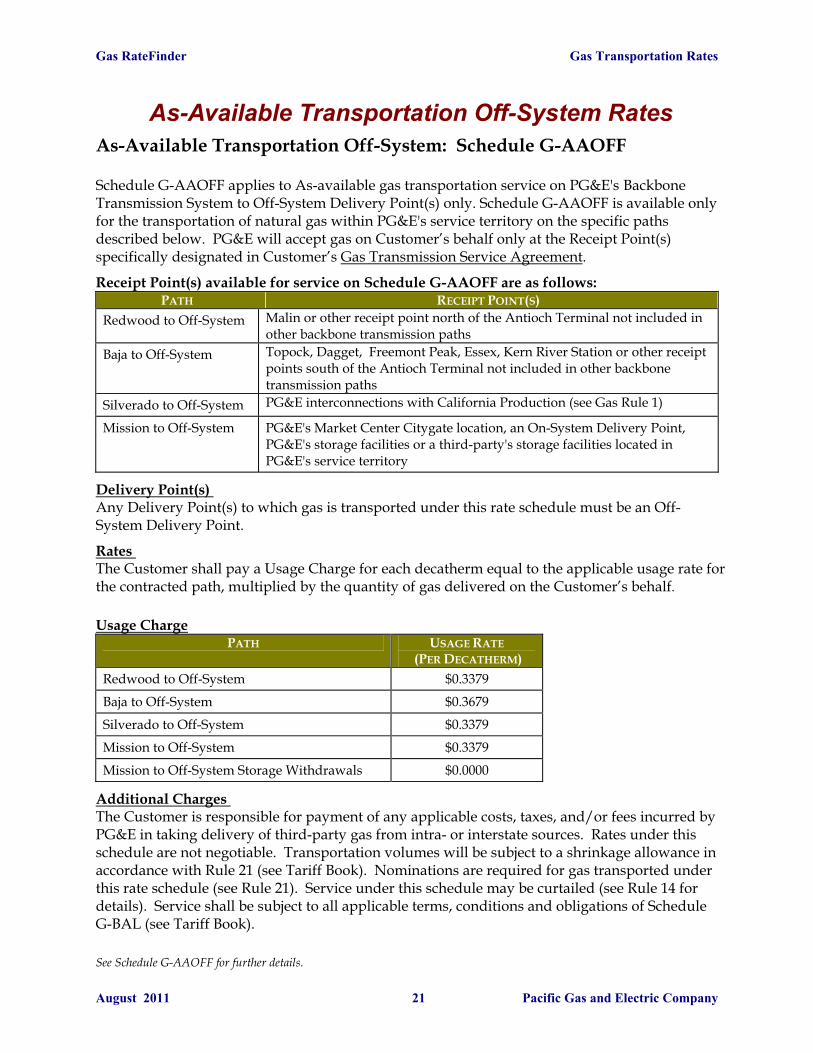
Gas RateFinder Gas Transportation Rates
August 2011 21 Pacific Gas and Electric Company
s-Available Transportation Off-System: Schedule G-AAOFF As-Available Transportation Off-System Rates
A Schedule G-AAOFF applies to As-available gas transportation service on PG&E's Backbone Transmission System to Off-System Delivery Point(s) only. Schedule G-AAOFF is available only for the transportation of natural gas within PG&E's service territory on the specific paths described below. PG&E will accept gas on Customer’s behalf only at the Receipt Point(s) specifically designated in Customer’s Gas Transmission Service Agreement.
Receipt Point(s) available for service on Schedule G-AAOFF are as follows: PATH RECEIPT POINT(S)
Redwood to Off-System Malin or other receipt point north of the Antioch Terminal not included in other backbone transmission paths
Baja to Off-System Topock, Dagget, Freemont Peak, Essex, Kern River Station or other receiptpoints south of the Antioch Terminal not included in oth
er backbone
transmission paths Silverado Off-System PG&E interconnections with California Produto ction (see Gas Rule 1)
Mission to Off-System PG&E's Market Center Citygate location, an On-System Delivery Point, PG&E's storage facilities or a third-party's storage facilities located in PG&E's service territory
Delivery Point(s) A o w - S
Rates
ny Delivery Point(s) tystem Delivery Point.
hich gas is transported under this rate schedule must be an Off
The Customer shall pay a Usage Charge for each dethe contracted path, multiplied by the quantity of gas delivered on the Customer’s behalf.
catherm equal to the applicable usage rate for
Usage Charge PATH USAGE RATE
(PER DECATHERM) Redwood to Off-System $0.3379
Baja to Off-System $0.3679
Silverado Oto ff-System $0.3379
Mission to Off-System $0.3379
Mission to Off-System Storage With $0.0000 drawals
Additional Charges The Customer is responsible for payment of any applicable costs, taxes, and/or fees incurred by PG&E in taking delivery of third-party gas from intra- or interstate sources. Rates under this schedule are not negotiable. Transportation volumes will be subject to a shrinkage allowance in accordance with Rule 21 (see Tariff Book). Nominations are required for gas transported under this rate schedule (see Rule 21). Service under this schedule may be curtailed (see Rule 14 for details). Service shall be subject to all applicable terms, conditions and obligations of Schedule G-BAL (see Tariff Book).
See Schedule G-AAOFF for further details.

Gas RateFinder Gas Transportation Rates
August 2011 22 Pacific Gas and Electric Company
ates
ystem do not include an
&E -PARK or G-LEND
account at te.
To arrange for the further trao tional rG-NGV4, or G-WSL. To arra stem Delivery Point, one of the fo -A NA
Service under Schedule G-N service territory on the speci PG&E will accept gas on Customer's behalf only at
ed in Customer's Gas Transmission Service Agreement
Negotiated Firm Transportation On-System R Negotiated Firm Transportation On-System: Schedule G-NFT Schedule G-NFT applies to the firm gas transportation service on PG&E's Backbone Transmission Sto On-System Delivery Point(s) only, at negotiated rates. On-System Delivery Point(s)End-Use Customer's meter. On-System Delivery Point(s) may include: a delivery point pool; a PGstorage account; a storage account with a third-party on-system storage facility; or, a G
the Cityga
nsportation and delivery of natural gas to an End-Use Customer's meter, one ate schedules must be utilized: Schedules G-CT, G-NT, G-EG, nge for further transportation and delivery of natural gas to an Off- Syllowing additional ra
f the following addi
te schedules must be utilized: Schedules G-AFTOFF, GAOFF. AOFF, G-NFTOFF or G-
FT is available only for the transportation of natural gas within PG&E'sfic paths described below.
the Receipt Point(s) specifically designat . Receipt Point(s) available for service on Schedule G-NFT are as follows:
PATH RECEIPT POINT(S) Redwood to On-System Malin or other receipt point north of the Antioch Terminal not included in
other backbone transmission paths Baja to On-System Topock, Dagget, Kern River Station or other receipt points south of the
Antioch Terminal not included in other backbone transmission paths S verado to On-System PG&E interconnections with California Production (see Gas Rule 1) il
Mission to On-System PG&E's Market Center Citygate location, an On-System Delivery Point, PG&E's storage facilities or storage facilities located in PG&E's service territory
a third-party's
Delivery Point(s) ny Delivery Point(s) tA o which gas is transported under th edule must be an On-System Delivery
P
R
is rate schoint.
ates T iable between PG&E and the Customer. Negotiated rates for transmission service shall not be less than PG&E's short-run marginal cost of providing the service.
rates under Schedule G-NFT will be capped at 120 percent of the tariffed rate
The Customer is responsible for any applicable costs, taxes, and/or fees incurred by PG&E in taking - or interstate sources.
he term, take requirement, and rate are negot
Negotiated transmissionunder Schedule G-AFT for a particular path, as follows: the negotiated rate (including all surcharges, costsand/or fees), converted to a volumetric-only rate at 100 percent load factor, shall be no greater than 120 percent of the Schedule G-AFT tariffed rate (including all surcharges, costs and/or fees), converted to a volumetric-only rate at 100 percent load factor under the Modified Fixed Variable (MFV) rate structure. At PG&E's sole option, firm On-System capacity may be available under Schedule G-NFT at less than therates under Schedule G-AFT. At PG&E's sole option, negotiated offers satisfactory to PG&E may be accepted.
delivery of third-party gas from intra

Gas RateFinder Gas Transportation Rates
August 2011 23 Pacific Gas and Electric Company
Negont’d)
edwood capacity available at the time of the requested conversion. Baja Exhibit
t to a shrinkage allowance in accordance with Rule 21 (see Tariff Book). Nominations are required for gas transported under this rate schedule (see Rule 21). Service under
s,
otiated Firm Transportation Off-System: Schedule G-NFTOFF (c
To transport storage withdrawals On-System, Customers may convert all or part of a Firm On-System Redwood or Firm On-System Baja Exhibit to a Firm On-System Mission Exhibit at any time prior to 60 minutes before the close of the Timely Nomination Cycle, as set forth in Gas Rule 21. The negotiated transmission rate for this Mission Path service shall, unless otherwise agreed to, be zero. However, the fullmonthly demand charge is still applicable. Conversions of Firm On-System Baja Exhibits are limited to theam unt of unsold Firm Roconversions may be requested on a monthly basis, no more than five days prior to the end of the month, for a maximum term of one month. Redwood Exhibit conversions have no minimum term limit. See Rate Schedule G-NFT for further details. Transportation volumes will be subjec
this schedule may be curtailed (see Rule 14 for details). Service shall be subject to all applicable termconditions and obligations of Schedule G-BAL (see Tariff Book). See Schedule G-NFT for further details.

Gas RateFinder Gas Transportation Rates
August 2011 24 Pacific Gas and Electric Company
Negotiated Firm Transportation Off-System Rates
-NFTOFF applies to firm gas transportation service on PG&E's Backbone Transmission System to the Off-System Delivery Points at negotiated rates. Service under
chedule G-NFTOFF is available only for the transportation of natural gas within PG&E's service on
Negotiated Firm Transportation Off-System: Schedule G-NFTOFF
Schedule G
Sterritory on the specific paths described below for off-system deliveries. PG&E will accept gasCustomer's behalf only at the Receipt Point(s) specifically designated in Customer's Gas Transmission Service Agreement. Receipt Point(s) available for service on Schedule G-NFTOFF are as follows:
PATH RECEIPT POINT(S) Redwood to Off-System Malin or other receipt point north of the Antioch Terminal not included in
other backbone transmission paths Baja to Off-System Topock, Dagget, Kern River Station or other receipt points south of the
Antioch Terminal not included in other backbone transmission paths Silverado to Off-System PG&E interconnections with California Production (see Gas Rule 1) Mission to Off-System PG&E's Market Center Citygate location, an On-System Delivery Point,
PG&E's storage facilities or a third-party's storage facilities located in PG&E's service territory
Firm Off-System Delivery Points Kern River Station to Southern California Gas Company
Transmission
Backhaul Off-System Points
Fremont Peak to Kern River Gas
All off-system interconnection points are available as backhaul delivery points under this schedule if the upstream pipeline accepts backhaul nominations. Backhaul service is limited to the quantities of gas being delivered from the upstream pipeline.
Alternative Delivery Points The Delivery Point to which gas is transported under this rate schedule shall be a Firm Off-System Delivery Point, unless the Customer elects both the Straight Fixed Variable (SFV) rate structure and the maximum allowable rate under G-NFTOFF. If the above conditions are met, the Customer may specify an On-System Delivery Point within the transmission path contracted by Customer as al alternative delivery point.
Rates The term, take requirement, and rate are negotiable between PG&E and the Customer. Negotiated rates for transmission service shall not be less than PG&E's short-run marginal cost of providing the service. Negotiated transmission rates under Schedule G-NFTOFF will be capped at 120 percent of the Schedule G-AFTOFF tariffed rate for a particular path, as follows: the negotiated rate (including all surcharges, costs and/or fees), converted to a volumetric-only rate at 100 percent load factor, shall be no greater than 120 percent of the Schedule G-AFTOFF tariffed rate (including all surcharges, costs and/or fees), converted to a volumetric-only rate at 100 percent load factor under the Modified Fixed Variable (MFV) rate structure.

Gas RateFinder Gas Transportation Rates
August 2011 25 Pacific Gas and Electric Company
egotiated Firm Transportation Off-System: Schedule G-NFTOFF
ss than the may
E in rom intra- or interstate sources. Transportation volumes will
Book). Nominations
s dte liG-BAL (see Tariff Book). S urth
N(cont’d) At PG&E's sole option, firm Off-System capacity may be available on G-NFTOFF at lerates in Schedule G-AFTOFF. At PG&E's sole option, negotiated offers satisfactory to PG&Ebe accepted. The Customer is responsible for any applicable costs, taxes, and/or fees incurred by PG&taking delivery of third-party gas fbe subject to a shrinkage allowance in accordance with Rule 21 (see Tariffare required for gas transported under this rate schedule (see Rule 21). Service under this chedule may be curtailerms, conditions and ob
(see Rule 14 for details). Service shall be subject to all applicable gations of Schedule
ee Schedule G-NFTOFF for f er details.

Gas RateFinder Gas Transportation Rates
August 2011 26 Pacific Gas and Electric Company
On-System Rates
A applies to As-available gas transportation service on PG&E's Backbone Transmission
a -
, one edules G-CT, G-NT, G-EG, G-NGV4, or
rther transportation and delivery of natural gas to an Off-System Delivery oint, one of the following rate schedules must be utilized: Schedules G-AFTOFF, G-AAOFF, G-NFTOFF r G-NAAOFF.
ilable only for the transportation of natural gas within PG&E's service territory on the specific paths described below. PG&E will accept gas on Customer’s behalf only at the Receipt Point(s) specifically designated in Customer’s Gas Transmission Service Agreement
Negotiated As-Available Transportation
Negotiated As-Available Transportation On-System: Schedule G-NAA Schedule G-NASystem to On-System Delivery Point(s) only, at negotiated rates. On-System Delivery Point(s) do not include an End-Use Customer's meter. On-System Delivery Point(s) may include: a delivery point pool;PG&E storage account; a storage account with a third-party on-system storage facility; or, a G-PARK or GLEND account at the Citygate.
To arrange for the further transportation and delivery of natural gas to an End-Use Customer's meterof the following rate schedules must be utilized: SchG-WSL. To arrange for the fuPo
Service under Schedule G-NAA is ava
.
Receipt Point(s) available for service on Schedule G-NAA are as follows: PATH RECEIPT POINT(S)
Redwood to On-System Malin or other receipt point north of the Antioch Terminal not included in other backbone transmission paths
Baja to On-System Topock, Dagget, Kern River Station or other receipt points south of the Antioch Terminal not included in other backbone transmission paths
Silverado to On-System PG&E interconnections with California Production (see Gas Rule 1)
Mission to On-System PG&E's Market Center Citygate location, an On-System Delivery Point, PG&E's storage facilities or a third-party's storage facilities located in PG&E's service territory
Delivery Point(s) Any Delivery Point to which gas is transported under this rate schedule must be an On-System Delivery Point.
Rates The term, take requirement, and rate are negotiable between PG&E and the Customer. Negotiated rates for transmission service shall not be less than PG&E's short-run marginal cost of providing the service. Negotiated transmission rates under Schedule G-NAA will be capped at 120 percent of the tariffed rate under Schedule G-AA for a particular path. At PG&E's sole option, As-available On-System capacity may be available under Schedule G-NAA at less than the rates under Schedule G-AA. At PG&E's sole option, negotiated offers satisfactory to PG&E may be accepted. The Customer is responsible for any applicable costs, taxes, and/or fees incurred by PG&E in taking delivery of third-party gas from intra- or interstate sources. See Schedule G-NAA for further details.

Gas RateFinder Gas Transportation Rates
August 2011 27 Pacific Gas and Electric Company
chedule G-NAAOFF
ystem deliveries. PG&E will accept gas on
Negotiated As-Available Transportation Off-System Rates
Negotiated As-Available Transportation Off-System: S Schedule G-NAAOFF applies to As-available gas transportation service on PG&E's Backbone Transmission System to Off-System Delivery Point(s), at negotiated rates. Schedule G-NAAOFF is available only for the transportation of natural gas within PG&E's service territory on the specific paths described below for off-sCustomer’s behalf only at the Receipt Point(s) specifically designated in Customer’s Gas Transmission Service Agreement.
Receipt Point(s) available for service on Schedule G-NAAOFF are as follows: PATH RECEIPT POINT(S)
Redwood to Off-System Malin or other receipt point north of the Antioch Terminal not included iother backbone transmission paths
n
Baja to Off-System Topock, Dagget, Kern River Station or other receipt points south of the Antioch Terminal not included in other backbone transmission paths
Silverado to Off-System PG&E interconnections with California Production (see Gas Rule 1)
Mission t ystem PG&E's Market Center Cityg System Delivery Point, o Off-S ate location, an On-PG&E's storage facilities or a third-party's storage facilities located in PG&E's service territory
Delivery Point(s) A h stem D
Rates
ny Delivery Point to welivery Point.
ich gas is transported under this rate schedule must be an Off-Sy
The term, take requiremenNegotiated rates for transmission service shall not be less than PG&E's short-run marginal cost of
ice. Negotiated transmission rates under G-NAAOFF will be capped at 120
, as-available off-system capacity may be available hereunder at less than the rates under le G-AAOFF.
er is
t, and rate are negotiable between PG&E and the Customer.
providing the servpercent of the tariffed rate under Schedule G-AAOFF for a particular path. At PG&E's sole optionSchedu At PG&E's sole option, negotiated offers satisfactory to PG&E may be accepted. The Customresponsible for any applicable costs, taxes, and/or fees incurred by PG&E in taking delivery of third-party gas from intra- or interstate sources. See Schedule G-NAAOFF for further details.
Exhibit D
Statement of Proposed Rate Changes

Present June 2011 Rates
Gas Pipeline Safety Rate
Total Rate Including Gas Pipeline Safety
RatePercentChange
CORE RETAIL - Bundled (2)Residential Non-CARE (4) $1.223 $.052 $1.275 4.3%Small Commercial Non-CARE (4) $.975 $.052 $1.027 5.3%Large Commercial $.766 $.052 $.818 6.8%NGV1 - (uncompressed service) $.661 $.052 $.713 7.9%NGV2 - (compressed service) $1.912 $.052 $1.965 2.7%
CORE RETAIL - Transport Only (3)Residential Non-CARE (4) $.650 $.052 $.702 8.0%Small Commercial Non-CARE (4) $.418 $.052 $.470 12.5%Large Commercial $.248 $.052 $.300 21.0%
NONCORE - Transportation Only (3)Industrial - Distribution $.171 $.025 $.196 14.6%Industrial - Transmission $.069 $.025 $.094 36.0%Industrial - Backbone $.042 $.002 $.044 5.0%Electric Generation - Transmission (G-EG-D/LT) $.029 $.025 $.054 86.0%Electric Generation - Backbone (G-EG-BB) $.007 $.002 $.010 28.6%NGV 4 - Distribution (uncompressed service) $.155 $.025 $.180 16.1%NGV 4 - Transmission (uncompressed service) $.055 $.025 $.080 45.2%
WHOLESALE CORE AND NONCORE (G-WSL) (3)Alpine Natural Gas $.026 $.025 $.051 97.1%Coalinga $.026 $.025 $.051 96.8%Island Energy $.027 $.025 $.052 90.9%Palo Alto $.025 $.025 $.050 98.6%West Coast Gas - Castle $.100 $.025 $.125 24.9%West Coast Gas - Mather Distribution $.123 $.025 $.148 20.2%West Coast Gas - Mather Transmission $.026 $.025 $.051 96.0%
Present June 2011 Rates
Gas Pipeline Safety Rate
Total Rate Including Gas Pipeline Safety
RatePercentChange
NONCORE - With Proxy Noncore Procurement Rate (5)Industrial - Distribution $.689 $.025 $.714 3.6%Industrial - Transmission $.587 $.025 $.612 4.2%Industrial - Backbone $.560 $.002 $.562 0.4%Electric Generation - Transmission (G-EG-D/LT) $.547 $.025 $.572 4.6%Electric Generation - Backbone (G-EG-BB) $.525 $.002 $.527 0.4%NGV 4 - Distribution (uncompressed service) $.673 $.025 $.698 3.7%NGV 4 - Transmission (uncompressed service) $.573 $.025 $.598 4.4%
WHOLESALE CORE AND NONCORE (With Proxy Noncore Procurment Rate) (5)Alpine Natural Gas $.544 $.025 $.569 4.6%Coalinga $.544 $.025 $.569 4.6%Island Energy $.545 $.025 $.570 4.6%Palo Alto $.543 $.025 $.568 4.6%West Coast Gas - Castle $.618 $.025 $.643 4.0%West Coast Gas - Mather Distribution $.641 $.025 $.666 3.9%West Coast Gas - Mather Transmission $.544 $.025 $.569 4.6%
Notes: See next page for notes
PACIFIC GAS AND ELECTRIC COMPANY
Rates Effective June 1, 2011 (1) (6)
($ per Therm)Illustrative Class Average End-User Rates
Implementation Plan Rate Impacts
($/th; Annual Class Averages)
ILLUSTRATIVE CLASS AVERAGE END-USER RATESWITH PROXY NONCORE PROCUREMENT RATES (EQUAL TO CORE LARGE COMMERCIAL PROCUREMENT RATE)

(1)
(2)
(3)
(4)
(5)
(6)
PG&E's bundled gas service is for core customers only. Intrastate backbone transmission costs are included in the end use rates paid by bundled core customers. Bundled service also includes a procurement cost for gas purchases, transportation on Canadian and Interstate pipelines, storage and core brokerage. An illustrative weighed average cost of gas (WACOG) of $0.429 per therm, adjusted for intrastate backbone usage charges, is assumed in all present and proposed bundled core rates. Core bundled rates also include the cost of transportation and delivery of gas from the city gate to the customer's burner tip, including local transmission, distribution, customer, public purpose and customer access charges.
PG&E's end-use transportation-only gas service is for core and noncore customers. Transportation-only service begins at PG&E's city gate and includes the applicable costs of gas transportation and delivery on PG&E's local transmission (where applicable), distribution (where applicable), CPUC fees, customer access, public purpose program (where applicable) and customer class charges. Transportation-only customers must arrange for their own gas purchases and transportation to PG&E's city gate/local transmission system.
California Alternate Rates for Energy (CARE) Customers receive a 20% discount off of the total bundled rate and are exempt from the CARE portion of PG&E's Public Purpose Program Surcharge (G-PPPS) rates.
PACIFIC GAS AND ELECTRIC COMPANYNotes Supporting Illustrative Class Average End User Rates
Rates represent class averages. Actual transportation rates will vary depending on the customer's load factor and seasonal usage. Rates are rounded to three decimal places for ease of viewing. Percentage rate changes are calculated on a 5-digit basis.
PG&E's proxy noncore procurement rate includes a procurement cost for gas purchases, transportation on Canadian and Interstate pipelines, backbone transmission, storage and core brokerage. An illustrative WACOG of $0.429 per therm, adjusted for intrastate backbone usage charges, is assumed in all present and proposed proxy noncore rates.
June 1, 2011 rates are based on PG&E's 2011 General Rate Case (GRC) rate implementation filing (Advice Letters 3206-G & 3207-G), 2010 Biennial Cost Allocation Proceeding (BCAP) Decision D.10-06-035 and the Gas Accord V D.11-04-031.

Exhibit E
Results of Operations at Proposed Rates
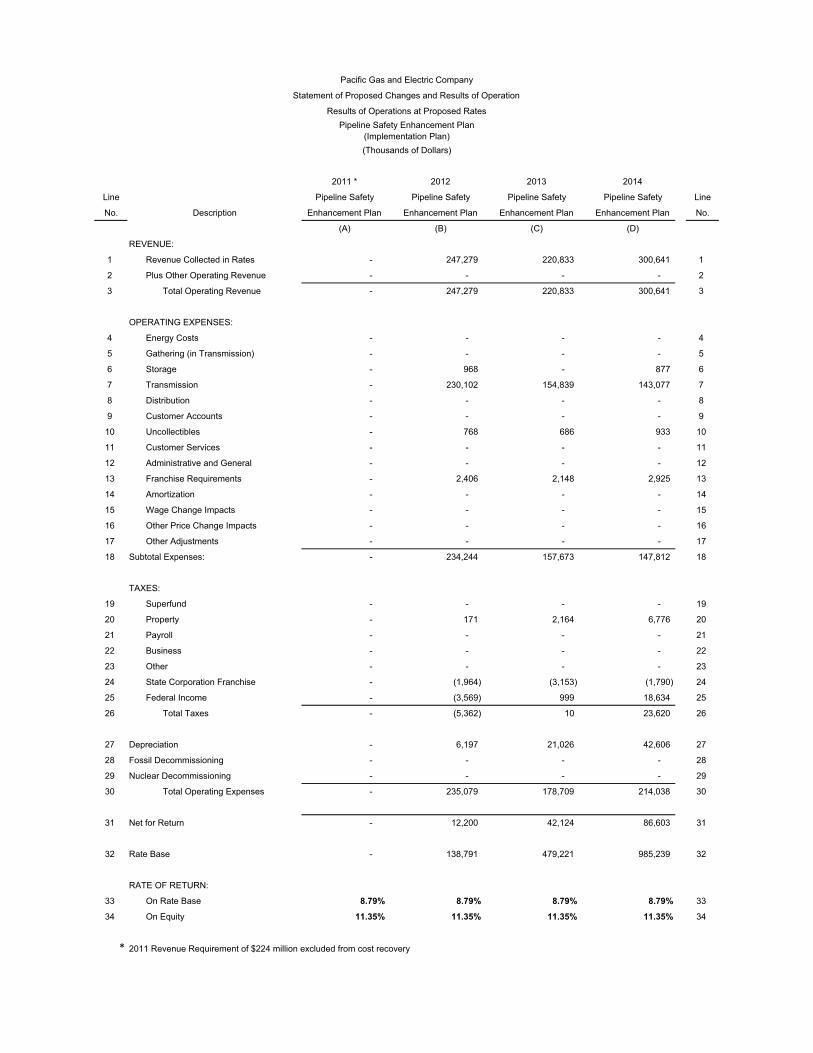
Pacific Gas and Electric Company
Statement of Proposed Changes and Results of Operation
Results of Operations at Proposed RatesPipeline Safety Enhancement Plan
(Implementation Plan)(Thousands of Dollars)
2011 * 2012 2013 2014
Line Pipeline Safety Pipeline Safety Pipeline Safety Pipeline Safety Line
No. Description Enhancement Plan Enhancement Plan Enhancement Plan Enhancement Plan No.
(A) (B) (C) (D)
REVENUE:
1 Revenue Collected in Rates - 247,279 220,833 300,641 1
2 Plus Other Operating Revenue - - - - 2
3 Total Operating Revenue - 247,279 220,833 300,641 3
OPERATING EXPENSES:
4 Energy Costs - - - - 4
5 Gathering (in Transmission) - - - - 5
6 Storage - 968 - 877 6
7 Transmission - 230,102 154,839 143,077 7
8 Distribution - - - - 8
9 Customer Accounts - - - - 9
10 Uncollectibles - 768 686 933 10
11 Customer Services - - - - 11
12 Administrative and General - - - - 12
13 Franchise Requirements - 2,406 2,148 2,925 13
14 Amortization - - - - 14
15 Wage Change Impacts - - - - 15
16 Other Price Change Impacts - - - - 16
17 Other Adjustments - - - - 17
18 Subtotal Expenses: - 234,244 157,673 147,812 18
TAXES:
19 Superfund - - - - 19
20 Property - 171 2,164 6,776 20
21 Payroll - - - - 21
22 Business - - - - 22
23 Other - - - - 23
24 State Corporation Franchise - (1,964) (3,153) (1,790) 24
25 Federal Income - (3,569) 999 18,634 25
26 Total Taxes - (5,362) 10 23,620 26
27 Depreciation - 6,197 21,026 42,606 27
28 Fossil Decommissioning - - - - 28
29 Nuclear Decommissioning - - - - 29
30 Total Operating Expenses - 235,079 178,709 214,038 30
31 Net for Return - 12,200 42,124 86,603 31
32 Rate Base - 138,791 479,221 985,239 32
RATE OF RETURN:
33 On Rate Base 8.79% 8.79% 8.79% 8.79% 33
34 On Equity 11.35% 11.35% 11.35% 11.35% 34
* 2011 Revenue Requirement of $224 million excluded from cost recovery

Exhibit F
List of cities and counties to which Notice will be sent

1
SERVICE OF NOTICE OF APPLICATION
In accordance with Rule 3.2(b), Applicant will mail a notice to the following, stating in general terms its proposed change in rates.
State of California
To the Attorney General and the Department of General Services.
State of CaliforniaOffice of Attorney General1300 I St Ste 1101Sacramento, CA 95814
and
Department of General ServicesOffice of Buildings & Grounds505 Van Ness Avenue, Room 2012San Francisco, CA 94102
Counties
To the County Counsel or District Attorney and the County Clerk in the following counties:
AlamedaAlpineAmadorButteCalaverasColusaContra CostaEl DoradoFresnoGlennHumboldtKernKingsLakeLassenMaderaMarin
MariposaMendocinoMercedModocMontereyNapaNevadaPlacerPlumasSacramentoSan BenitoSan BernardinoSan FranciscoSan JoaquinSan Luis ObispoSan Mateo
Santa BarbaraSanta ClaraSanta CruzShastaSierraSiskiyouSolanoSonomaStanislausSutterTehamaTrinityTulareTuolumneYoloYuba

2
Municipal Corporations
To the City Attorney and the City Clerk of the following municipal corporations:
AlamedaAlbanyAmador CityAmerican CanyonAndersonAngelsAntiochArcataArroyo GrandeArvinAtascaderoAthertonAtwaterAuburnAvenalBakersfieldBarstowBelmontBelvedereBeniciaBerkeleyBiggsBlue LakeBrentwoodBrisbaneBuelltonBurlingameCalistogaCampbellCapitolaCarmelCeresChicoChowchillaCitrus HeightsClaytonClearlakeCloverdaleClovisCoalingaColfaxColmaColusa
ConcordCorcoranCorningCorte MaderaCotatiCupertinoDaly CityDanvilleDavisDel Rey OakesDinubaDixonDos PalosDublinEast Palo AltoEl CerritoElk GroveEmeryvilleEscalonEurekaFairfaxFairfieldFerndaleFirebaughFolsomFort BraggFortunaFoster CityFowlerFremontFresnoGaltGilroyGonzalesGrass ValleyGreenfieldGridleyGrover BeachGuadalupeGustineHalf Moon BayHanfordHayward
HealdsburgHerculesHillsboroughHollisterHughsonHuronIoneIsletonJacksonKermanKing CityKingsburgLafayetteLakeportLarkspurLathropLemooreLincolnLive OakLivermoreLivingstonLodiLompocLoomisLos AltosLos Altos HillsLos BanosLos GatosMaderaMantecaMaricopaMarinaMartinezMarysvilleMcFarlandMendotaMenlo ParkMercedMill ValleyMillbraeMilpitasModestoMonte Sereno

3
MontereyMoragaMorgan HillMorro BayMountain ViewNapaNewarkNevada CityNewmanNovatoOakdaleOaklandOakleyOrange CoveOrindaOrlandOrovillePacific GrovePacificaPalo AltoParadiseParlierPaso RoblesPattersonPetalumaPiedmontPinolePismo BeachPittsburgPlacervillePleasant HillPleasantonPlymouthPoint ArenaPortolaPortola ValleyRancho CordovaRed BluffReddingRedwood CityReedleyRichmondRidgecrestRio DellRio VistaRiponRiverbankRocklin
Rohnert ParkRosevilleRossSacramentoSaint HelenaSalinasSan AnselmoSan BrunoSan CarlosSan FranciscoSan JoaquinSan JoseSan Juan BautistaSan LeandroSan Luis ObispoSan MateoSan PabloSan RafaelSan RamonSand CitySangerSanta ClaraSanta CruzSanta MariaSanta RosaSaratogaSausalitoScotts ValleySeasideSebastopolSelmaShafterShasta LakeSoledadSolvangSonomaSonora
South San FranciscoStocktonSuisun CitySunnyvaleSutter CreekTaftTehamaTiburonTracyTrinidadTurlockUkiahUnion CityVacavilleVallejoVictorvilleWalnut CreekWascoWaterfordWatsonvilleWest SacramentoWheatlandWilliamsWillitsWillowsWindsorWintersWoodlandWoodsideYountvilleYuba City