publications -- statistical snapshots of people with
TRANSCRIPT

Statistical snapshots of people with
asthma in Australia
2001

The Australian Institute of Health and Welfare is Australia’s national health and welfare statistics and information agency. The Institute’s mission is better health and wellbeing for
Australians through better health and welfare statistics and information.
Please note that as with all statistical reports there is the potential for minor revisions of data in Statistical snapshots of people with asthma in Australia 2001 over its life. Please refer to the online version at <www.aihw.gov.au>.

Statistical snapshots of people with
asthma in Australia
2001
2007
Australian Institute of Health and Welfare Canberra
AIHW cat. no. ACM 8

© Australian Institute of Health and Welfare 2007
This work is copyright. Apart from any use as permitted under the Copyright Act 1968, no part may be reproduced without prior written permission from the Australian Institute of Health and Welfare. Requests and enquiries concerning reproduction and rights should be directed to the Head, Business Promotion and Media Unit, Australian Institute of Health and Welfare, GPO Box 570, Canberra ACT 2601.
A complete list of the Institute’s publications is available from the Business Promotion and Media Unit, Australian Institute of Health and Welfare, GPO Box 570, Canberra ACT 2601, or via the Institute’s website <www.aihw.gov.au>.
ISBN 978 1 74024 6408
Suggested citation
Australian Institute of Health and Welfare (AIHW) 2007. Statistical snapshots of people with asthma in Australia 2001. Cat. no. ACM 8. Canberra: AIHW.
Australian Institute of Health and Welfare
Board Chair Hon. Peter Collins, AM, QC
DirectorPenny Allbon
Any enquiries about or comments on this publication should be directed to:
Dr Perri Timmins Australian Institute of Health and Welfare GPO Box 570 Canberra ACT 2601
Phone: (02) 6244 1228
Published by Australian Institute of Health and Welfare
Printed by

v
Contents
Acknowledgments.............................................................................................................................vii
Acronyms .......................................................................................................................................... viii
Summary .............................................................................................................................................. ix
Defining characteristics............................................................................................................... ix
Distinguishing characteristics .................................................................................................... ix
1 Introduction ...................................................................................................................................1
Structure of the report...................................................................................................................3
2 Method............................................................................................................................................4
2001 National Health Survey .......................................................................................................4
Asthma status .........................................................................................................................4
Dimensions .............................................................................................................................4
Age structure ..................................................................................................................................5
Statistical comparisons..................................................................................................................7
Confidence intervals ..............................................................................................................7
3 Characteristics of people with asthma......................................................................................8
Statistical snapshots.......................................................................................................................8
Demographics.........................................................................................................................8
Health actions .........................................................................................................................9
Health status and outcomes .................................................................................................9
Risk factors..............................................................................................................................9
Long-term health conditions ..............................................................................................10
Defining characteristics...............................................................................................................12
Distinguishing characteristics ....................................................................................................14
0–4 year olds .........................................................................................................................15
5–14 year olds .......................................................................................................................17
15–17 year olds .....................................................................................................................19
18–34 year olds .....................................................................................................................22
35–64 year olds .....................................................................................................................26
65 years and over .................................................................................................................30
Distinguishing characteristics across age groups............................................................33

vi
4 Discussion ....................................................................................................................................35
Defining and distinguishing characteristics ............................................................................35
Sex ..........................................................................................................................................35
Use of the health care system .............................................................................................36
Obesity...................................................................................................................................36
Allergic and inflammatory conditions..............................................................................36
Mental health ........................................................................................................................37
Other comorbidities .............................................................................................................37
Previous snapshot studies ..........................................................................................................38
Issues for consideration ..............................................................................................................38
Conclusions ..................................................................................................................................39
Appendix A: Age applicability ........................................................................................................41
Appendix B: Variables and values..................................................................................................43
Glossary................................................................................................................................................48
References............................................................................................................................................51
List of tables ........................................................................................................................................54
List of figures ......................................................................................................................................55

vii
Acknowledgments
The authors of this report are Gabrielle Hodgson and Perri Timmins with significant contributions by Kuldeep Bhatia and Vanessa Prescott.
The authors acknowledge the input and helpful comments from Susan Killion and Ilona Brockway of the AIHW and Dr Guy Marks of the Australian Centre for Asthma Monitoring.
Valuable guidance was received from the members of the Management Committee of the Australian System for Monitoring Asthma during the drafting of this report. Their input is greatly appreciated.
This publication was funded by the Australian Government through the Asthma Management Program 2005–09.
viii
Acronyms
ABS Australian Bureau of Statistics
ACAM Australian Centre for Asthma Monitoring
AIHW Australian Institute of Health and Welfare
ASGC Australian Standard Geographical Classification
BMI body mass index
BP blood pressure
COB country of birth
COPD chronic obstructive pulmonary disease
CURF confidentialised unit record file
IHD ischaemic heart disease
LTC long-term condition
NHS National Health Survey
SAHS self-assessed health status
SES socioeconomic status
ix
Summary
Asthma is a chronic inflammatory disease of the airways. Affecting approximately 2 million Australians, it is a common but complex disease. Most of the knowledge we have of asthma, and its impact on people’s lives, is derived from self-report surveys such as the National Health Survey (NHS). This report provides statistical snapshots of Australians with asthma and how they differ from those who have never had asthma, using the 2001 NHS.
This report highlights those characteristics that are present in a majority of people with asthma (defining characteristics) and those that differ significantly between people with asthma and those who have never had asthma (distinguishing characteristics). Across six age groups, a total of 60 characteristics are examined covering five dimensions—demographics, health actions, health status and outcomes, risk factors, and long-term health conditions.
Defining characteristics
More than half of people with asthma, across all age groups, live in a major city or inner regional area; were born in Australia; and have no regular smoker in the household. While the majority of adults with asthma are female, in the younger age groups the opposite is true—more than half of children with asthma are male.
People with asthma, across applicable age groups, are more likely than not to:
• feel mostly satisfied or better about their quality of life
• have health the same or better than 1 year ago
• have no days of reduced activity due to illness or injury over any fortnight
• have no days out of role (no days away from work or school/study and no other days of reduced activity) due to illness or injury over any fortnight
• have received all recommended childhood immunisations
• have received the influenza vaccination in the past year.
Other defining characteristics include rating their health as good or better, having at least the recommended usual daily intake of fruit and having a normal body mass index.
Additionally, more than half of people with asthma consult a doctor within a 3-month period, use at least one medication for asthma, experience the burden of three or more long-term health conditions (including asthma) and have an income unit grossing less than $1,000 per week.
Distinguishing characteristics
People with current asthma use the health care system more and experience a greater burden of long-term health conditions than those who have never had asthma. In particular, they are more likely to consult a doctor within a 3-month period, visit a doctor/hospital over any 2-week period and have three or more long-term health conditions.
While none of the additional long-term health conditions examined are present in the majority of people with asthma, 16 out of 22 conditions are more likely to be present among people with asthma, as a group, than among people who have never had asthma.

x
Not surprisingly, allergic and inflammatory conditions such as hay fever, unspecified allergy, chronic sinusitis and bronchitis/emphysema are consistently more common among those with asthma. Also, migraine, back pain, affective problems, such as depression, and anxiety-related conditions are more frequent among people with asthma.
Even though more than half of people with asthma rate their health as good or better, people with asthma are generally less likely than those who have never had asthma to rate their health as good or better. People with asthma are also more likely than those who have never had asthma to have psychological distress, 7 or more days out of role over 2 weeks, 7 or more days of reduced activity over 2 weeks and to be obese—even though the majority of people with asthma don’t have these aspects as defining characteristics.
Despite the differences in health-related characteristics between people with asthma and those who have never had asthma, the majority of people with asthma are generally in good health and have positive health outcomes.
1
1 Introduction
This report highlights the overall burden experienced by people with asthma, including the presence of other diseases, the use of medications and other health services, and effects on quality of life. This has implications for how the disease is measured in population-based, self-report surveys and for how asthma is managed. We also reveal areas and relationships that should be targeted for further examination.
The objectives of this report are to identify the demographic and health-related characteristics that define people with asthma and that distinguish them from those who have never had asthma. To this end, the report provides a series of statistical snapshots of people with asthma, constructed from 2001 NHS data. As the prevalence and impact of asthma in Australia vary with age (AIHW: ACAM 2005; Marks & Poulos 2005), separate snapshots are presented for six age groups.
Asthma is a chronic inflammatory disease of the airways. Much of what we know about the distribution and nature of this common but complex disease is derived from self-report surveys. In Australia and elsewhere, surveys and clinical studies have shown that, compared to those without asthma, people with asthma have more additional long-term health conditions, such as hay fever, sinusitis and chronic obstructive pulmonary disease (Adams et al. 2006; Soriano et al. 2005). Many of these comorbidities may relate to a common underlying allergic or inflammatory process or to exposure to common risk factors, such as tobacco smoke. People with asthma also report more depression and lower health-related quality of life than those without asthma (Forrest et al. 1997; Goldney et al. 2003).
Large-scale surveys, such as the NHS, usually collect information on demographic and several health-related dimensions (such as risk factors and health outcomes). Reports of the findings from such surveys are usually based on some of the available dimensions and a fraction of the available information—rarely is the information used to draw a broader profile of people with a particular disease (what we refer to as a ‘statistical snapshot’). One reason for not putting together all the available information is that much of it is not disease-specific and therefore is difficult to interpret. However, the North West Adelaide Health Study (Taylor et al. 2002) and the Western Australia Health and Wellbeing Surveillance System (Daly & Molster 2006) are examples of local and state-wide data that have been used to construct statistical snapshots of people with asthma.
A statistical snapshot constructed from as much of the available information as possible can improve our understanding of the demographic and health-related aspects of a particular disease. For example, we know that people with asthma often have other allergic diseases, such as hay fever, but these diseases are also common in the general community. It is therefore important to know not only what proportion of people with asthma have allergic and other diseases but also to what degree they are of particular concern to people with asthma.
The NHS, conducted by the Australian Bureau of Statistics (ABS) at regular intervals, is a major source of information about the prevalence of self-reported asthma and the characteristics of people with that disease. It has the advantage of national coverage and generates information on a number of dimensions related to health and wellbeing. In essence, the NHS provides a snapshot of people with (and without) asthma where all the relevant demographic and health-related aspects of the disease are linked.

2
The snapshots in this report, which cover more dimensions of health and wellbeing than are usually reported at any one time, identify the proportion of people with asthma that have particular characteristics. These proportions can be compared to those of people who have never had asthma. We refer to a characteristic as ‘defining’ when the majority (more than half) of people with asthma have the characteristic (Figure 1.1). A characteristic is referred to as ‘distinguishing’ when the proportion of people with asthma that have the characteristic is significantly greater or smaller than for those who have never had asthma. Identifying defining and distinguishing characteristics provides a better understanding of who has asthma and what it means to have asthma.
Defining characteristic
(greater than 50% of people)
Non-defining characteristic
(less than or equal to 50% of people)
Distinguishing characteristic
(significantly different)
Defining and distinguishing Distinguishing but not defining
Non-distinguishing characteristic
(not significantly different)
Defining but not distinguishing Neither defining nor distinguishing
Figure 1.1: Defining and distinguishing characteristics
This report focuses on those characteristics that both define people with asthma and distinguish them from those who have never had asthma. Characteristics that are defining but not distinguishing are also of interest as they help us draw a picture of who has asthma, even though these characteristics are more or less shared with those who have never had asthma. Characteristics that are distinguishing but not defining are also of interest as they tell us what it means to have asthma, even though for a minority of people with asthma.
This report uses the term ‘snapshot’ rather than ‘profile’, because profiles, as used in other disciplines, are usually applied to individuals. They are often used to describe a typical individual in a particular context (as in criminal profiling), or are used to show the concordance or discrepancy of an individual compared with the established norm (as in personality profiling). In this report, the statistical snapshots consider each characteristic independently of the others. Therefore, the snapshots should not be taken to represent a ‘typical’ person with asthma, as the number of variables used in the snapshots would mean that they would not include many actual cases.

3
Structure of the report
The report consists of four chapters. Chapter 2 describes the methodology for constructing the statistical snapshots of people who reported to have asthma in the 2001 NHS. This includes a description of the relevant items in the 2001 NHS, the statistical issues involved, and the techniques used for comparing snapshots. Chapter 3 contains statistical snapshots of people with asthma for six age groups and all ages combined. The chapter includes a description of the characteristics of people with asthma overall and describes the characteristics that both define people with asthma and distinguish them from those who never had asthma. Chapter 4 provides a summary of the findings and how they relate to past research. Key issues and potential steps forward are discussed.

4
2 Method
Data from the 2001 NHS were used to construct statistical snapshots of people across six age groups who reported to have current asthma, and to compare these snapshots to those people who reported to have never had asthma. This chapter describes the data source, data types, and statistical techniques used for comparisons.
2001 National Health Survey
The 2001 NHS was conducted from February to November 2001 by the ABS. The survey covered usual residents only of private dwellings; ’special’ dwellings such as hospitals, hotels, motels, hostels and prisons were not included. Approximately 26,900 people were surveyed from all states and territories and across all age groups. The survey collected information relating to health and health risk factors as well as demographic information.
Asthma status
As a National Health Priority Area, asthma is covered extensively by the NHS. The self-reported prevalence of current, long-term asthma is measured by a variable derived from items asking whether the respondent was ever told by a doctor or nurse that he or she has asthma, whether the asthma was current, and whether the asthma was long term. The response categories and population estimates for this variable are shown in Table 2.1.
Table 2.1: Self-reported asthma status of Australians, 2001
Response category Per cent Estimated total
1. Ever told has condition, still current and long term 11.6 2,197,280
2. Ever told has condition, still current but not long term 0.0 0
3. Ever told has condition, not current 8.8 1,664,963
4. Not known if ever told, but condition current and long term 0.0 0
5. Never told, not current or long term 79.6 15,053,398
Total 100.0 18,915,641
Source: ABS 2001 NHS.
For the purpose of this report, ‘people with asthma’ are respondents falling into Category 1 (ever told has condition, still current and long term). As there were no respondents in Category 2 it is assumed that if asthma is current it is also long term.
Comparisons are made in Chapter 3 with people who have never had asthma; that is, respondents falling into Category 5.
Dimensions
Statistical snapshots of people with asthma, encompassing 60 demographic and health-related characteristics, were constructed from responses to items in the 2001 NHS.
5
The items in the NHS can be grouped into various demographic and health-related clusters or dimensions. For the purpose of this report, five dimensions provide a statistical snapshot of people with asthma. These are:
• Demographics—items measuring age, sex, state, remoteness area, country of birth, labour force status, income, relative socioeconomic disadvantage and private health insurance coverage.
• Asthma-related and general health actions—items measuring possession of a written asthma action plan, medications used for asthma, visits to health professionals and immunisation.
• Health status and outcomes—items measuring quality of life, self-assessed health, activity limitation and psychological distress.
• Risk factors—items measuring alcohol risk level, consumption of fruit and vegetables, exercise level, body mass index and smoking status.
• Long-term health conditions (comorbidities)—items measuring respiratory disorders, allergic disorders, circulatory disorders, musculoskeletal disorders and psychological disorders.
Not all items apply to all survey participants, particularly for the younger age groups (see Appendix A).
The items represent variables measured with various scales. Some scales are categorical (categories such as country of birth, which follow no logical order), others are ordinal (for example low to high, less to more), while several others are dichotomous (yes/no, with/without, etc.).
Each ‘score’ comprising the snapshot is a percentage representing the estimated proportion of the population with a ‘hit’. A hit is when the respondent replies in the affirmative in the case of a dichotomy, to the category of interest in the case of categorical variables, or beyond a particular cut-off value in the case of ordinal variables.
In only a few instances, where categories of interest were selected or cut-off values applied, were the categories or cut-offs chosen arbitrarily (such as dichotomising states such as New South Wales versus the rest). Some variables had clearly defined cut-off values, such as high psychological distress and risky alcohol consumption level. In some instances (such as socioeconomic status, daily intake of fruit and vegetables) the selected category or cut-off value reflected the state of current knowledge of risk factors for asthma and/or general health. For some variables, such as the number of days out of role and smoking status, both the complete absence and a level suggesting a strong adverse influence were of interest and both extremes were investigated. For variables such as quality of life and self-assessed health, a positive, but not extreme, cut-off position was adopted.
More detailed information about the variables and values used to construct the snapshots is provided in Appendix B.
Age structure
The prevalence of asthma varies with age. To show the distinguishing characteristics of people with asthma across age, statistical snapshots are provided for six age groups (0–4 years, 5–14 years, 15–17 years, 18–34 years, 35–64 years, and 65 years and over) as well as for all ages combined. The six age groups are not uniform—some cover a span of just a few years while others cover a substantial age span. The choice of age groups was based on

6
two factors: the structure of the NHS and age groups considered important by previous research.
To describe asthma morbidity and mortality patterns, the Australian Centre for Asthma Monitoring (2005) used five age groups (0–4 years, 5–14 years, 15–34 years, 35–64 years and 65 years and over). The choice of these groups was based partly on the difficulty of diagnosing asthma and distinguishing it from similar disorders at various ages.
To coincide with the broad structure of the NHS, the 15–34 years age group was divided into 15–17 years and 18–34 years. The 15–17 years age group has the smallest age span, and is therefore the most homogenous with respect to characteristics associated with age. This might minimise the probability of finding significant differences with those aged 15–17 years who have never had asthma. On the other hand, this group has the highest proportion of people with current, long-term asthma (16.8%).
In order to make comparisons between groups and over time, age standardisation is normally used to minimise the effects of differences in age structures. These effects have been addressed to some extent in this report by dividing the sample into six age groups. However, for the 18–34 years age group, age may have a potentially confounding effect when comparing those with asthma and those who have never had asthma. To minimise this potential, the estimates for the 18–34 years and the 35–64 years age groups were standardised to the Australian population as at 30 June 2001.
Figure 2.1 shows the age distribution of people with asthma compared with that of people who have never had asthma (using 5-year groups as are usually the basis for age standardisation).
15 10 5 0 5 10 15
<1
01–04
05–09
10–14
15–19
20–24
25–29
30–34
35–39
40–44
45–49
50–54
55–59
60–64
65–69
70 +
Per cent of population
Never had asthma
Asthma
Source: ABS NHS 2001 Expanded V2 CURF.
Figure 2.1: Age distribution by asthma status, persons, 2001

7
Statistical comparisons
An important feature of the statistical snapshots in this report is the ability to compare the snapshot of an individual or group against a reference group (for example the whole population, a group with other characteristics, or a group with the same characteristics at a different point in time). For each estimated proportion, 95% confidence intervals were calculated and used to determine the statistical significance of the difference between proportions of people with asthma and those who reportedly have never had asthma.
Confidence intervals
The statistics in this report are based on a surveyed sample rather than a census of the population. Therefore, the estimates may vary from one sample to the next. The NHS data are considered representative of the Australian population but may not be as accurate in representing smaller subpopulations, such as those with a specific disease, due to the small number of people with the disease actually surveyed. Also, because of limited sample sizes, as well as the influence of natural variation, the percentages shown in this report may vary from the true population value. The standard error is a measure of the variation in the sample-based estimates. From the standard error, one can calculate a confidence interval centred on a sample estimate. The 95% confidence interval includes values within approximately two standard errors of the estimate—there is a 95% chance that the interval includes the true population value.
Confidence intervals can be used to identify significant differences (that is, differences unlikely to be due to chance) observed between pairs of estimates, such as between those with asthma and those who have never had asthma. Confidence intervals that do not overlap indicate a statistically significant difference (in the case of 95% confidence intervals, at the p < 0.05 level). That is, there is 95% confidence that the proportions in the two groups differ in the whole population of Australia other than by chance alone. On the other hand, confidence intervals that overlap indicate a non-significant difference. The overlap may be due to little actual difference in the true population values or because the numbers of observations contributing to the estimates are small, and therefore the variability or standard error is large, such that it is difficult to discern any real statistically significant difference. This means that with smaller sample sizes, significant differences are harder to detect, and therefore less likely to be identified.
To simplify the text in this report, where estimated percentages are significantly different at the 95% level of confidence (p < 0.05), they have been described simply as ‘significantly different’.

8
3 Characteristics of people with
asthma
This chapter describes the demographic and health-related characteristics of people with asthma, as revealed by the 2001 NHS. This includes highlighting those characteristics present in a majority of people with asthma (defining characteristics) and those that differ significantly between people with asthma and those who have never had asthma (distinguishing characteristics).
The first part of the chapter is a general description of people with asthma as presented in the statistical snapshots for six age groups (Table 3.1). This is followed by a description of the defining characteristics according to their demographic and health-related dimension. The third part of the chapter highlights the distinguishing characteristics, as identified in a series of figures (figures 3.1 to 3.16), by each of the age groups.
Statistical snapshots
Table 3.1 shows the proportions of people with asthma in each age group who had each characteristic. Five main dimensions are examined: demographics, health actions, health status and outcomes, risk factors and long-term health conditions (conditions lasting, or expected to last, at least 6 months). Within each age group, the proportions having each characteristic provide the snapshots of people with current long-term asthma. The proportions can also be considered in relation to those in other age groups, and to those of all ages combined, to provide a more complete picture.
Some of the estimates, especially for 0–4 year olds, are based on small sample sizes and are subject to high sampling variability. These estimates, shaded and marked by asterisks in the table, should be treated with caution. Also as some items do not apply to all ages, the estimated percentages for the ‘all ages’ group are based on the total number of people actually asked the question, rather than the whole population.
Demographics
The majority of young people with asthma were male, particularly those aged 5–14 years (Table 3.1). However, the majority of adults with asthma were female. Around one-third of those with asthma lived in New South Wales, both overall and within each age group. Similarly, close to 90% across all the age groups lived in Major city or Inner regional areas. The greatest proportion of people with asthma who were Australian-born was in the youngest age group and decreased with age but most people with asthma were born in Australia (85.4%).
Except among 0–4 year olds (48.1%), more than half of people with asthma had an income unit which grossed less than $1,000 a week, with the greatest proportion among those aged 65 years and over (97.6%). In most age groups, less than 20% lived in areas in the first quintile of socioeconomic disadvantage, that is, in areas of most disadvantage. An exception was among those aged 65 years and over (27%). Overall, around half had private health

9
insurance (41% and 42% of those aged 18–34 years and 65 years and over respectively and 56% and 60% of those aged 15–17 and 35–64 years).
Health actions
In general, children with asthma were more likely to have a written asthma action plan than adults with asthma. But, despite support for written asthma action plans, only 17% of people with asthma had a written asthma action plan in 2001. Almost 60% of people with asthma reported using medications for asthma in the 2 weeks before the survey. Medication use for asthma increased with age, with the lowest level reported among those aged 5–14 years (49.7%), increasing to 75.1% among those aged 65 years and over. Around one-third used asthma medications for both prevention and relief of asthma.
Around two-thirds of people with asthma consulted a doctor in the 3 months before the survey with the proportion ranging from 54.9% among those aged 5–14 years to as high as 93.7% among those aged 65 years and over. Also, around one-third visited a doctor and/or hospital in the 2 weeks before the survey, ranging from 25.8% among those aged 15–17 years to over half (56.3%) among those aged 65 years and over. Almost all (98.6%) of those aged 0–4 years received all recommended immunisations while close to two-thirds (64.9%) of those aged 65 years and over received an influenza vaccination in the year before the survey.
Health status and outcomes
Almost three-quarters of people aged over 14 years with asthma rated their health as good or better. This proportion decreased with age from 87.9% among those aged 15–17 years to less than half among those aged 65 years and over (48.3%). In addition, almost 70% of adults with asthma were mostly satisfied with their quality of life.
Over 80% of those aged over 14 years reported that their health was the same as or better than the previous year, decreasing with age from 92% among those aged 15–17 years to 74.2% among those aged 65 years and over. Further, the proportion of adults with asthma who had psychological distress was less than 20% and decreased with age from 21.8% among those aged 18–34 years to 15.4% among those aged 65 years and over.
The majority of people with asthma reported no days out of role (no days away from work or school/study and no other days of reduced activity due to illness or injury) and no days of reduced activity due to illness or injury (75.4% and 81.6% respectively) in the 2 weeks before the survey. However, the proportion that reported at least 7 days of reduced activity in the 2 weeks before the survey increased with age from 2.7% among those aged 5–14 years to 14.1% among those aged 65 years and over.
Risk factors
Close to three-quarters of adults with asthma drank alcohol in the month before the survey with the proportion decreasing with age. Around 11% of adults drank alcohol at risky to high-risk levels in the week before the survey. This proportion decreased with age from 13.1% of those aged 18–34 years to 7.9% of those aged 65 years and over. Similarly, the proportion of adults with asthma who were current smokers decreased with age from 36% to 9.2%.

10
Only 31% of people with asthma aged 15 years and over had 4 or more usual daily serves of vegetables and less than half had at least the recommended daily intake of fruit with the smallest proportion of both these characteristics among those aged 18–34 years.
In general, people with asthma tended not to be sedentary (30.7% sedentary); however, the likelihood of being sedentary increased with age from 17.5% of those aged 15–17 years to 50.5% of those aged 65 years and over. This is supported by a decrease with age in the proportion of people doing moderate and vigorous activity in the 2 weeks before the survey. Also, around 53% of 15–34 year olds with asthma had a normal body mass index, but this decreased to around 38% in the older age groups, with a higher proportion obese among those aged 35 years and over than among those aged 15–34 years.
Long-term health conditions
Overall, people with asthma tended to have three or more long-term health conditions (including asthma). However, the proportion increased with age from only 16.1% of those aged less than 5 years to 95.9% of those aged 65 years and over. Hay fever was the most common additional long-term condition overall (33.8%) and among 5–34 year olds. The proportion of people with asthma who had hay fever initially increased with age, reaching a maximum among those aged 18–34 years, and then declined in the older age groups. Back pain and hay fever were the most common additional long-term health conditions for 35–64 year olds. In general, the likelihood of back pain increased with age with a slight decrease in the oldest age group. For those aged 65 years and over the most common additional long-term condition was hypertension. Both high cholesterol and hypertension were uncommon in younger age groups but a higher proportion of those aged 35 years and over reported these conditions, with the oldest age group having the greatest proportion. Unspecified allergy was the most common additional long-term health condition for 0–4 year olds, although this finding should be considered with caution due to high sampling variability.
Table 3.1: Characteristics of people with asthma, by age group, 2001
Variable Value
0–4
years
5–14
years
15–17
years
18–34
years
35–64
years
65+
years All ages
Demographics
People with asthma Estimated total 104,708 422,771 131,639 642,050 697,843 198,269 2,197,280
People with asthma % with 8.2 15.8 16.8 14.0 9.5 8.8 11.6
Sex % male 54.2 59.0 52.1 42.8 38.3 39.5 45.3
State % NSW 34.3 34.3 32.7 29.1 33.3 35.3 32.5
Remoteness area of
residence
Major city/
Inner regional 86.7 89.9 87.5 89.3 85.8 88.9 88.0
Country of birth % Australia 99.1 95.5 94.4 88.3 76.3 73.5 85.4
Labour force status % full time . . . . 4.1* 53.1 44.7 2.5* 39.7
Total gross weekly cash
income % <$1000 48.1 55.1 52.9 65.9 54.3 97.6 61.5
Relative SES disadvantage % 1st quintile 19.7 16.8 17.8 17.4 16.7 27.1 18.1
Private health insurance
coverage
% with
. . . . 56.4 41.3 59.6 42.4 50.3
(continued)

11
Table 3.1 (continued): Characteristics of people with asthma, by age group, 2001
Variable Value
0–4
years
5–14
years
15–17
years
18–34
years
35–64
years
65+
years
All
ages
Health actions
Written asthma action plan % with 25.2 24.6 23.8 11.9 16.1 12.1 17.0
Medications for asthma in last 2
weeks % used 54.6 49.7 55.8 58.0 62.2 75.1 59.0
No. of medications for asthma % 2+ 23.7 30.1 25.8 24.5 34.0 51.3 31.1
Purpose for using all medications for
asthma % prevent & relieve 32.2 30.4 30.2 33.2 32.8 43.9 33.3
Time since last consulted a doctor % within 3 months 69.7 54.9 63.6 62.2 68.4 93.7 66.0
Combination (health) action taken in
last 2 weeks
% doctor &/or hospital
visit 32.9 28.0 25.8 29.0 38.4 56.3 34.3
Flu vaccination status % in last 12 months . . . . . . . . . . 64.9 . .
Reported child immunisation level % all recommended 98.6 . . . . . . . . . . . .
Health status and outcomes
Quality of life % mostly satisfied+ . . . . . . 73.8 64.8 70.4 69.3
Self-assessed health % good+ . . . . 87.9 81.5 68.0 48.3 72.4
Health vs 1 year ago % same+ . . . . 91.5 85.4 82.5 74.2 83.4
No. of days out of role in last 2
weeks % zero . . 69.3 70.0 78.2 77.1 . . 75.4
No. of days out of role in last 2
weeks % 7+ . . 5.3 4.3* 4.8 12.3 . . 8.3
No. of days with reduced activity in
last 2 weeks % zero . . 81.5 84.4 83.9 80.4 76.6 81.6
No. of days with reduced activity in
last 2 weeks 7+ . . 2.7* 2.6** 4.0 10.8 14.1 6.9
Psychological distress (Kessler
score) % high+ (score 22+) . . . . . . 21.8 19.9 15.4 19.7
Risk factors
Time since last drank alcohol % within last month . . . . . . 78.7 71.5 65.6 73.7
Alcohol consumption risk level over
last 7 days (2000 guidelines) % risky–high risk . . . . . . 13.1 9.6 7.9* 10.8
Usual daily serves of vegetables % 4+ . . . . 30.3 24.4 33.5 42.3 30.8
Usual daily serves of fruit % 2+ . . . . 57.1 38.8 51.7 64.5 48.7
Self-reported body mass index % normal (18.5–25) . . . . 53.3 52.8 38.4 38.5 45.1
Self-reported body mass index % obese (30+) . . . . 7.0* 15.9 26.0 21.9 20.2
Smoking status % never . . . . . . 49.2 48.0 43.1 46.9
Smoking status % current . . . . . . 36.0 21.3 9.2 25.3
No. regular smokers in household % none 56.7 60.0 61.4 51.5 65.0 82.0 61.0
No. regular smokers in household % 2+ 15.5* 11.5 12.6* 21.6 13.2 2.2* 14.4
(continued)
12
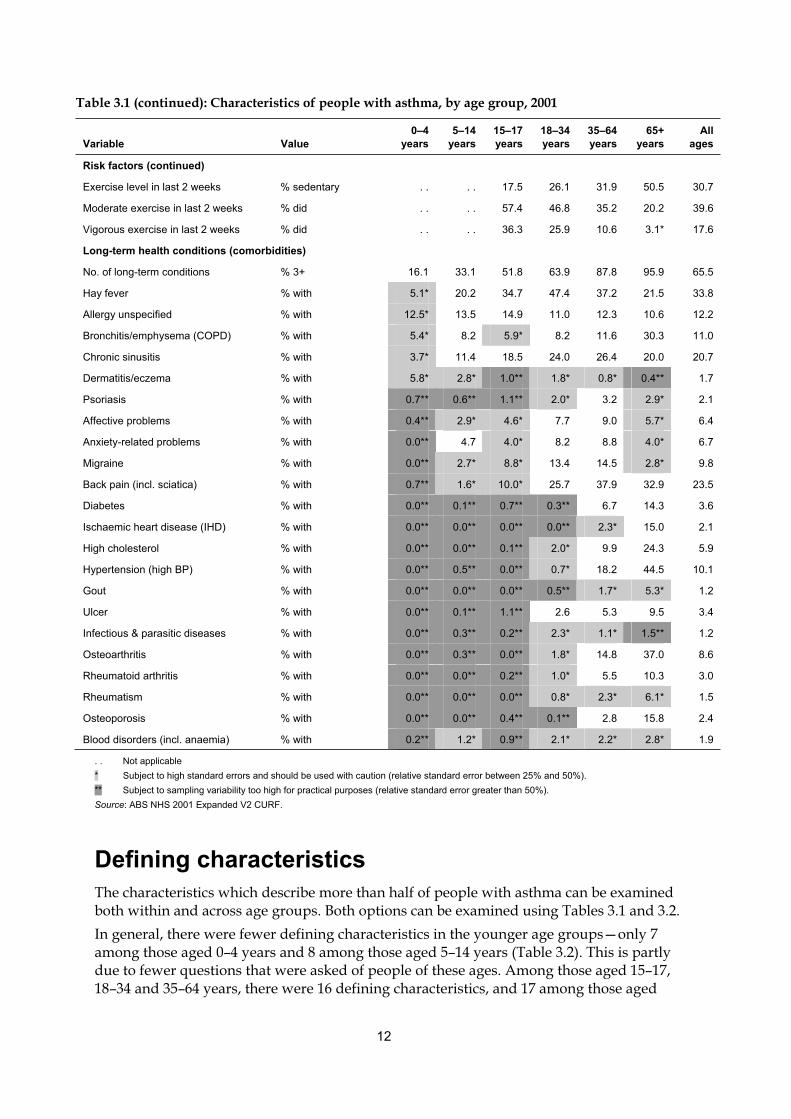
Table 3.1 (continued): Characteristics of people with asthma, by age group, 2001
Variable Value
0–4
years
5–14
years
15–17
years
18–34
years
35–64
years
65+
years
All
ages
Risk factors (continued)
Exercise level in last 2 weeks % sedentary . . . . 17.5 26.1 31.9 50.5 30.7
Moderate exercise in last 2 weeks % did . . . . 57.4 46.8 35.2 20.2 39.6
Vigorous exercise in last 2 weeks % did . . . . 36.3 25.9 10.6 3.1* 17.6
Long-term health conditions (comorbidities)
No. of long-term conditions % 3+ 16.1 33.1 51.8 63.9 87.8 95.9 65.5
Hay fever % with 5.1* 20.2 34.7 47.4 37.2 21.5 33.8
Allergy unspecified % with 12.5* 13.5 14.9 11.0 12.3 10.6 12.2
Bronchitis/emphysema (COPD) % with 5.4* 8.2 5.9* 8.2 11.6 30.3 11.0
Chronic sinusitis % with 3.7* 11.4 18.5 24.0 26.4 20.0 20.7
Dermatitis/eczema % with 5.8* 2.8* 1.0** 1.8* 0.8* 0.4** 1.7
Psoriasis % with 0.7** 0.6** 1.1** 2.0* 3.2 2.9* 2.1
Affective problems % with 0.4** 2.9* 4.6* 7.7 9.0 5.7* 6.4
Anxiety-related problems % with 0.0** 4.7 4.0* 8.2 8.8 4.0* 6.7
Migraine % with 0.0** 2.7* 8.8* 13.4 14.5 2.8* 9.8
Back pain (incl. sciatica) % with 0.7** 1.6* 10.0* 25.7 37.9 32.9 23.5
Diabetes % with 0.0** 0.1** 0.7** 0.3** 6.7 14.3 3.6
Ischaemic heart disease (IHD) % with 0.0** 0.0** 0.0** 0.0** 2.3* 15.0 2.1
High cholesterol % with 0.0** 0.0** 0.1** 2.0* 9.9 24.3 5.9
Hypertension (high BP) % with 0.0** 0.5** 0.0** 0.7* 18.2 44.5 10.1
Gout % with 0.0** 0.0** 0.0** 0.5** 1.7* 5.3* 1.2
Ulcer % with 0.0** 0.1** 1.1** 2.6 5.3 9.5 3.4
Infectious & parasitic diseases % with 0.0** 0.3** 0.2** 2.3* 1.1* 1.5** 1.2
Osteoarthritis % with 0.0** 0.3** 0.0** 1.8* 14.8 37.0 8.6
Rheumatoid arthritis % with 0.0** 0.0** 0.2** 1.0* 5.5 10.3 3.0
Rheumatism % with 0.0** 0.0** 0.0** 0.8* 2.3* 6.1* 1.5
Osteoporosis % with 0.0** 0.0** 0.4** 0.1** 2.8 15.8 2.4
Blood disorders (incl. anaemia) % with 0.2** 1.2* 0.9** 2.1* 2.2* 2.8* 1.9
. . Not applicable
* Subject to high standard errors and should be used with caution (relative standard error between 25% and 50%).
** Subject to sampling variability too high for practical purposes (relative standard error greater than 50%).
Source: ABS NHS 2001 Expanded V2 CURF.
Defining characteristics
The characteristics which describe more than half of people with asthma can be examined both within and across age groups. Both options can be examined using Tables 3.1 and 3.2.
In general, there were fewer defining characteristics in the younger age groups—only 7 among those aged 0–4 years and 8 among those aged 5–14 years (Table 3.2). This is partly due to fewer questions that were asked of people of these ages. Among those aged 15–17, 18–34 and 35–64 years, there were 16 defining characteristics, and 17 among those aged

13
65 years and over, if being female is also considered a defining characteristic. The majority of these defining characteristics were common between two or three of these age groups, as discussed below.
There were four characteristics which each described more than half of people with asthma in all age groups (Table 3.2). These were: area of residence—a major city or inner regional area; country of birth—Australia; consulted a doctor in the 3 months before the survey; and no regular smoker in the household.
More than half of those aged 0–17 years were male, while of those aged 18 years or greater, more than half were female. The majority of those aged 15–17 and 35–64 years had private health insurance. Only the 18–34 years age group were more likely to be in full-time employment than not, and from 5 years of age people with asthma tended to have an income unit grossing less than $1,000 per week.
People with asthma were more likely than not to have used medications for asthma in the 2 weeks before the survey, except among 5–14 year olds. More than half of people with asthma aged 15 years and over experienced the burden of three or more long-term conditions (including asthma). Further, those aged 65 years and over were also more likely to have used two or more medications for asthma; visited a doctor and/or hospital; and had a sedentary exercise level. Only those aged 15–17 years were more likely to have done moderate exercise, and more than half of adults drank alcohol in the month before the survey.
On the positive side, more than half of those with asthma, across all applicable age groups, had the following characteristics: mostly satisfied or better with their quality of life; health same or better compared with 1 year before the survey; no days out of role in the past2 weeks; no days of reduced activity; had received all recommended childhood immunisations; and received influenza vaccination in the year before the survey. More than half of those aged 15–64 years rated their health as good or better. Also, among those aged 15–17 and 35 years and over, more than half had at least the recommended usual daily fruit intake and the majority of those aged 15–34 years had a normal body mass index.

14
Table 3.2: Defining characteristics of people with asthma, by age group, 2001
Variable Value
0–4
years
5–14
years
15–17
years
18–34
years
35–64
years
65+
years
Demographics
Sex % male + + +
Remoteness area of residence Major city/inner regional + + + + + +
Country of birth % Australia + + + + + +
Labour force status % full time . . . . +
Total gross weekly cash income % <$1000 + + + + +
Private health insurance coverage % with . . . . + +
Health actions
Medications for asthma in last 2 weeks % used + + + + +
No. of medications for asthma % 2+ +
Time since last consulted a doctor % within 3 months + + + + + +
Combination (health) action taken in last 2
weeks
% doctor &/or hospital
visit +
Flu vaccination status % in last 12 months . . . . . . . . . . +
Reported child immunisation level % all recommended + . . . . . . . . . .
Health status and outcomes
Quality of life % mostly satisfied+ . . . . . . + + +
Self-assessed health % good+ . . . . + + +
Health vs 1 year ago % same+ . . . . + + + +
No. of days out of role in last 2 weeks % zero . . + + + + . .
No. of days with reduced activity in last 2 weeks % zero . . + + + + +
Risk factors
Time since last drank alcohol % within last month . . . . . . + + +
Usual daily serves of fruit % 2+ . . . . + + +
Self-reported body mass index % normal (18.5–25) . . . . + +
No. regular smokers in household % none + + + + + +
Exercise level in last 2 weeks % sedentary . . . . +
Moderate exercise in last 2 weeks % did . . . . +
Long-term conditions (comorbidities)
No. of long-term conditions % 3+ + + + +
. . Not applicable
+ More than 50% of people with asthma have this characteristic.
Source: ABS NHS 2001 Expanded V2 CURF.
Distinguishing characteristics
Identifying the characteristics of people with asthma is only half of the story, as many of these characteristics are shared, more or less, with the population as a whole or with other important reference groups. Therefore, an important question to ask is ‘what characteristics distinguish people with asthma from those without asthma or, more specifically, those who

15
have never had asthma?’ This question is addressed for each age group by a series of comparisons between snapshots of people with asthma and those who have never had asthma (figures 3.1 to 3.16).
The horizontal bars in the figures represent 95% confidence intervals around the proportions of people estimated to have each characteristic (the wider the bar the more uncertainty or sampling error associated with the estimate). When the confidence intervals do not overlap, the difference between the compared estimates is statistically significant at the p < 0.05 level, and people with asthma are statistically more (or less) likely to have the characteristic than those who has never had asthma. Each comparison was made independently of the others. Therefore, when it is said that group A was significantly more likely than group B to have characteristic X and characteristic Y, it does not necessarily mean that an individual with characteristic X also had characteristic Y.
0–4 year olds
Children with asthma aged 0–4 years had just two distinguishing characteristics (Table 3.3).
Demographics, health actions and risk factors: There were no significant differences among any of the six demographics, three health actions, or two risk factors applicable to this age group (Figure 3.1).
Long-term health conditions: Compared with 0–4 year olds who have never had asthma, children aged 0–4 years with asthma were more likely to have three or more long-term health conditions (Figure 3.2). They were also more likely to have an unspecified allergy.
There were no characteristics that both defined and distinguished 0–4 year olds with asthma (Table 3.3).
Table 3.3: Defining and distinguishing characteristics among people with asthma, 0–4 years, 2001
Defining (>50%) Not defining ( 50%)
Distinguishing (significant) Long-term conditions (3 or more)
Allergy unspecified (had)
Not distinguishing (not significant) Sex (male)
Remoteness (major city/inner regional)
Country of birth (Australia)
Asthma medications (used)
Consulted a doctor (within 3 months)
Immunisation level (all recommended)
Regular smokers in household (none)
(a)
(a) Contains the remainder of the characteristics listed in Table 3.1.

16
Note: Confidence intervals without an upper end stroke extend beyond 100%.
Source: ABS NHS 2001 Expanded V2 CURF.
Figure 3.1: Demographics, actions and risk factors, by asthma status, persons aged 0–4 years, 2001
Source: ABS NHS 2001 Expanded V2 CURF.
Figure 3.2: Long-term conditions, by asthma status, persons aged 0–4 years, 2001
0 10 20 30 40 50 60 70 80 90 100
Male
NSW
Major city/Inner regional
Australia COB
Income <$1000
1st quintile SES disadvantage
Doctor <3 months
Dr &/or hospital
Full immunisation
0 reg. smokers in household
2+ reg. smokers in household
Per cent
Never had asthma
Asthma
0 5 10 15 20 25
3+ LTC
Hay fever
Allergy unspecified
Bronchitis/emphysema
Chronic sinusitis
Dermatitis/eczema
Psoriasis
Affective problems
Anxiety rel. problems
Migraine
Back pain
Diabetes
Ischaemic heart disease
High cholesterol
Hypertension
Gout
Ulcer
Infectious & parasitic dis.
Rheumatoid arthritis
Osteoarthritis
Osteoporosis
Rheumatism
Blood diseases
Per cent
Never had asthma
Asthma

17
5–14 year olds
There were 11 characteristics that distinguished children with asthma aged 5–14 years from those aged 5–14 years who have never had asthma (figures 3.3 and 3.4).
Demographics: Compared with those aged 5–14 years who have never had asthma, children aged 5–14 years with asthma were more likely to be male.
Health actions: Significant differences were found for both of the health actions applicable to this age group. That is, those aged 5–14 years with asthma were more likely to have consulted a doctor in the 3 months before the survey and to have visited a doctor and/or hospital in the 2 weeks before the survey.
Health status and outcomes: Among this age group, children with asthma were more likely to have had 7 or more days out of role, but less likely to have had no days out of role, in the 2 weeks before the survey.
Risk factors: There were no significant differences among the two risk factors applicable to this age group.
Long-term health conditions: Children with asthma aged 0–4 years were more likely to have three or more long-term health conditions. Among these conditions, they were more likely to have hay fever, unspecified allergy, bronchitis/emphysema, chronic sinusitis, and affective problems.
Three characteristics both defined and distinguished those aged 5–14 years with asthma (Table 3.4):
• no days out of role in the 2 weeks before the survey (less likely)
• male (more likely)
• consulted a doctor within the 3 months before the survey (more likely).
Table 3.4: Defining and distinguishing characteristics among people with asthma, 5–14 years, 2001
Defining (>50%) Not defining ( 50%)
Distinguishing (significant) Sex (male)
Consulted a doctor (within 3 months)
Days out of role (none)
Health action (doctor and/or hospital)
Days out of role (7 or more)
Long-term conditions (3 or more)
Hay fever (had)
Allergy unspecified (had)
Bronchitis/emphysema (had)
Chronic sinusitis (had)
Affective problems (had)
Not distinguishing (not significant) Remoteness (major city/inner regional)
Country of birth (Australia)
Gross weekly income (<$1000)
Days of reduced activity (none)
Regular smokers in household (none)
(a)
(a) Contains the remainder of the characteristics listed in Table 3.1.

18
Note: Confidence intervals without an upper end stroke extend beyond 100%.
Source: ABS NHS 2001 Expanded V2 CURF.
Figure 3.3: Demographics, actions, risk factors and outcomes, by asthma status, persons aged 5–14 years, 2001
0 10 20 30 40 50 60 70 80 90 100
Male
NSW
Major city/Inner regional
Australia COB
Income <$1000
1st quintile SES disadvantage
Doctor <3 months
Dr &/or hospital
0 reg. smokers in household
2+ reg. smokers in household
0 days out of role
7+ days out of role
0 days reduced activity
7+ days reduced activity
Per cent
Never had asthma
Asthma
19
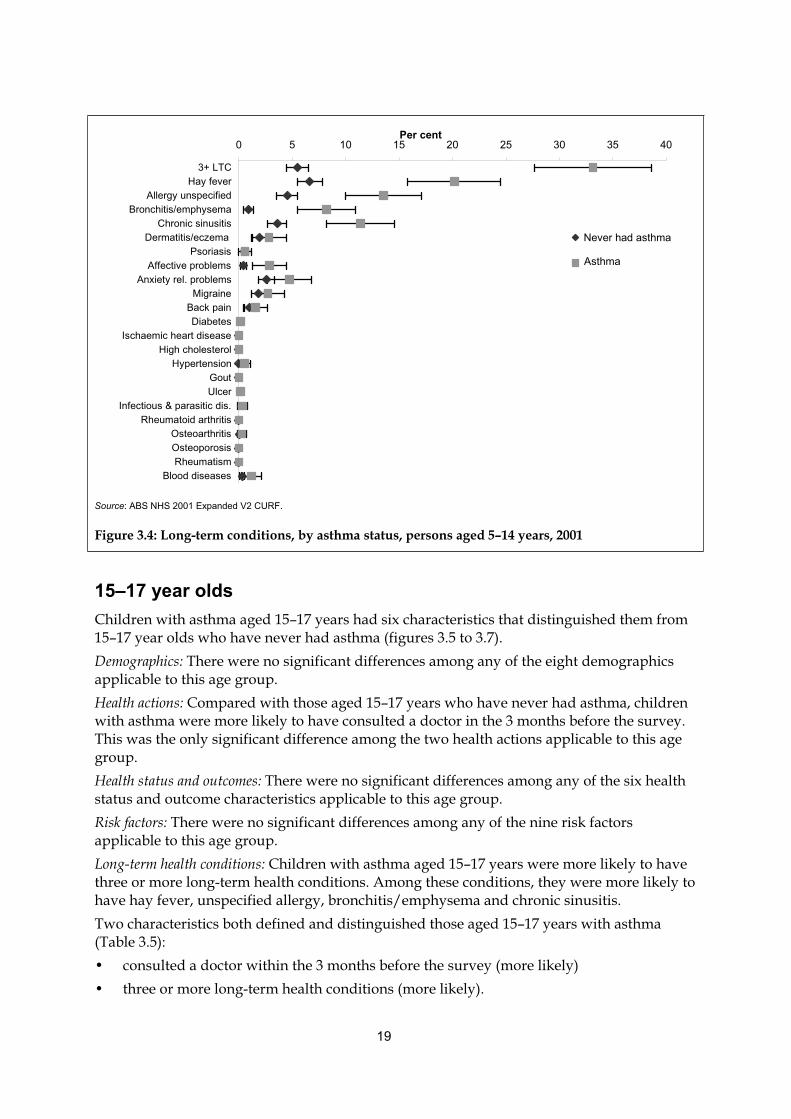
Source: ABS NHS 2001 Expanded V2 CURF.
Figure 3.4: Long-term conditions, by asthma status, persons aged 5–14 years, 2001
15–17 year olds
Children with asthma aged 15–17 years had six characteristics that distinguished them from 15–17 year olds who have never had asthma (figures 3.5 to 3.7).
Demographics: There were no significant differences among any of the eight demographics applicable to this age group.
Health actions: Compared with those aged 15–17 years who have never had asthma, children with asthma were more likely to have consulted a doctor in the 3 months before the survey. This was the only significant difference among the two health actions applicable to this age group.
Health status and outcomes: There were no significant differences among any of the six health status and outcome characteristics applicable to this age group.
Risk factors: There were no significant differences among any of the nine risk factors applicable to this age group.
Long-term health conditions: Children with asthma aged 15–17 years were more likely to have three or more long-term health conditions. Among these conditions, they were more likely to have hay fever, unspecified allergy, bronchitis/emphysema and chronic sinusitis.
Two characteristics both defined and distinguished those aged 15–17 years with asthma (Table 3.5):
• consulted a doctor within the 3 months before the survey (more likely)
• three or more long-term health conditions (more likely).
0 5 10 15 20 25 30 35 40
3+ LTC
Hay fever
Allergy unspecified
Bronchitis/emphysema
Chronic sinusitis
Dermatitis/eczema
Psoriasis
Affective problems
Anxiety rel. problems
Migraine
Back pain
Diabetes
Ischaemic heart disease
High cholesterol
Hypertension
Gout
Ulcer
Infectious & parasitic dis.
Rheumatoid arthritis
Osteoarthritis
Osteoporosis
Rheumatism
Blood diseases
Per cent
Never had asthma
Asthma

20
Table 3.5: Defining and distinguishing characteristics among people with asthma, 15–17 years, 2001
Defining (>50%) Not defining ( 50%)
Distinguishing (significant) Consulted a doctor (within 3 months)
Long-term conditions (3 or more)
Hay fever (had)
Allergy unspecified (had)
Bronchitis/emphysema (had)
Chronic sinusitis (had)
Not distinguishing (not significant) Sex (male)
Remoteness (major city/inner regional)
Country of birth (Australia)
Gross weekly income (<$1000)
Private health insurance (had)
Asthma medications (used)
Self-assessed health (good+)
Health vs. 1 year ago (same+)
Days out of role (none)
Days of reduced activity (none)
Daily serves of fruit (2+)
Body mass index (normal)
Regular smokers in household (none)
Moderate exercise (did)
(a)
(a) Contains the remainder of the characteristics listed in Table 3.1.
Note: Confidence intervals without an upper end stroke extend beyond 100%.
Source: ABS NHS 2001 Expanded V2 CURF.
Figure 3.5: Demographics and actions, by asthma status, persons aged 15–17 years, 2001
0 10 20 30 40 50 60 70 80 90 100
Male
NSW
Major city/Inner regional
Australia COB
Full-time employment
Income <$1000
1st quintile SES disadvantage
Private health insurance
Doctor <3 months
Dr &/or hospital
Per cent
Never had asthma
Asthma

21
Note: Confidence intervals without an upper end stroke extend beyond 100%.
Source: ABS NHS 2001 Expanded V2 CURF.
Figure 3.6: Risk factors and outcomes, by asthma status, persons aged 15–17 years, 2001
Source: ABS NHS 2001 Expanded V2 CURF.
Figure 3.7: Long-term conditions, by asthma status, persons aged 15–17 years, 2001
0 10 20 30 40 50 60 70 80 90 100
0 reg. smokers in household
2+ reg. smokers in household
Normal BMI
Obese (30+)
2+ fruit serves
4+ vegetable serves
Sedentary
Moderate exercise
Vigorous exercise
SAHS Good+
Same+ health vs 1 year ago
0 days out of role
7+ days out of role
0 days reduced activity
7+ days reduced activity
Per cent
Never had asthma
Asthma
0 10 20 30 40 50 60 70
3+ LTC
Hay fever
Allergy unspecified
Bronchitis/emphysema
Chronic sinusitis
Dermatitis/eczema
Psoriasis
Affective problems
Anxiety rel. problems
Migraine
Back pain
Diabetes
Ischaemic heart disease
High cholesterol
Hypertension
Gout
Ulcer
Infectious & parasitic dis.
Rheumatoid arthritis
Osteoarthritis
Osteoporosis
Rheumatism
Blood diseases
Per cent
Never had asthma
Asthma

22
18–34 year olds
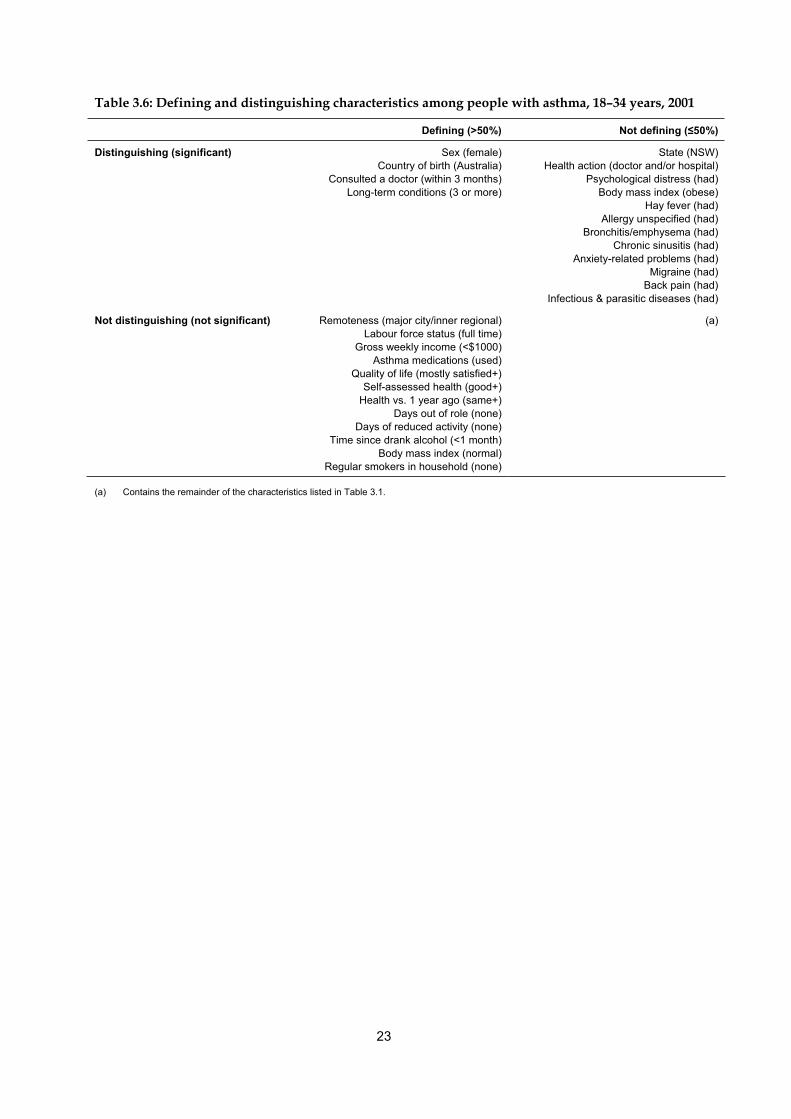
Adults with asthma aged 18–34 years had 16 characteristics that distinguished them from those aged 18–34 years who have never had asthma (figures 3.8 to 3.10).
Demographics: Compared with those aged 18–34 years who have never had asthma, adults with asthma aged 18–34 years were more likely to be female and born in Australia, but less likely to live in New South Wales.
Health actions: Significant differences were found for both of the health actions applicable to this age group. That is, those aged 18–34 years with asthma were more likely to have consulted a doctor in the 3 months before the survey and to have visited a doctor and/or hospital in the 2 weeks before the survey.
Health status and outcomes: Adults with asthma aged 18–34 years were more likely to have a high level of psychological distress.
Risk factors: There was one significant difference among the 13 risk factors applicable to this age group. That is, those aged 18–34 years with asthma were more likely to be obese.
Long-term health conditions: Compared with those aged 18–34 years who have never had asthma, adults with asthma aged 18–34 years were more likely to have three or more long-term health conditions. Among these conditions, they were more likely to have hay fever, unspecified allergy, bronchitis/emphysema, chronic sinusitis, anxiety-related problems, migraine, back pain, and infectious and parasitic diseases.
Four characteristics both defined and distinguished those aged 18–34 years with asthma (Table 3.6):
• female (more likely)
• born in Australia (more likely)
• consulted a doctor in the 3 months before the survey (more likely)
• three or more long-term health conditions (more likely).
23
Table 3.6: Defining and distinguishing characteristics among people with asthma, 18–34 years, 2001
Defining (>50%) Not defining ( 50%)
Distinguishing (significant) Sex (female)
Country of birth (Australia)
Consulted a doctor (within 3 months)
Long-term conditions (3 or more)
State (NSW)
Health action (doctor and/or hospital)
Psychological distress (had)
Body mass index (obese)
Hay fever (had)
Allergy unspecified (had)
Bronchitis/emphysema (had)
Chronic sinusitis (had)
Anxiety-related problems (had)
Migraine (had)
Back pain (had)
Infectious & parasitic diseases (had)
Not distinguishing (not significant) Remoteness (major city/inner regional)
Labour force status (full time)
Gross weekly income (<$1000)
Asthma medications (used)
Quality of life (mostly satisfied+)
Self-assessed health (good+)
Health vs. 1 year ago (same+)
Days out of role (none)
Days of reduced activity (none)
Time since drank alcohol (<1 month)
Body mass index (normal)
Regular smokers in household (none)
(a)
(a) Contains the remainder of the characteristics listed in Table 3.1.

24
Notes
1. Comparisons were made using age-standardised proportions due to the differences in the age distribution between those with current
asthma and those who have never had asthma for this age group. Estimates may differ slightly from those presented in Table 3.1.
2. Age standardised to the Australian population as at 30 June 2001.
Source: ABS NHS 2001 Expanded V2 CURF.
Figure 3.8: Demographics and outcomes, by asthma status, persons aged 18–34 years, 2001
0 10 20 30 40 50 60 70 80 90 100
Male
NSW
Major city/Inner regional
Australia COB
Full-time employment
Income <$1000
1st quintile SES disadvantage
Private health insurance
Quality of Life Satisfied+
SAHS Good+
Same+ health vs 1 year ago
0 days out of role
7+ days out of role
0 days reduced activity
7+ days reduced activity
High Kessler score
Per cent
Never had asthma
Asthma

25
Notes
1. Comparisons were made using age-standardised proportions due to the differences in the age distribution between those with current
asthma and those who have never had asthma for this age group. Estimates may differ slightly from those presented in Table 3.1.
2. Age standardised to the Australian population as at 30 June 2001.
Source: ABS NHS 2001 Expanded V2 CURF.
Figure 3.9: Actions and risk factors, by asthma status, persons aged 18–34 years, 2001
0 10 20 30 40 50 60 70 80 90 100
Doctor <3 months
Dr &/or hospital
Never smoked
Current smoker
0 reg. smokers in household
2+ reg. smokers in household
Alcohol <1 month ago
Risky–high-risk alcohol cons.
Normal BMI
Obese (30+)
2+ fruit serves
4+ vegetable serves
Sedentary
Moderate exercise
Vigorous exercise
Per cent
Never had asthma
Asthma

26
Notes
1. Comparisons were made using age-standardised proportions due to the differences in the age distribution between those with current
asthma and those who have never had asthma for this age group. Estimates may differ slightly from those presented in Table 3.1.
2. Age standardised to the Australian population as at 30 June 2001.
Source: ABS NHS 2001 Expanded V2 CURF.
Figure 3.10: Long-term conditions, by asthma status, persons aged 18–34 years, 2001
35–64 year olds
There were 25 characteristics that distinguished adults with asthma aged 35–64 years from 35–64 year olds who have never had asthma (figures 3.11 to 3.13).
Demographics: Adults with asthma aged 35–64 years were more likely to be female and born in Australia, but less likely to be employed full-time.
Health actions: Compared with those aged 35–64 years who have never had asthma, adults with asthma aged 35–64 years were more likely to have consulted a doctor in the 3 months before the survey and to have visited a doctor and/or hospital in the 2 weeks before the survey.
Health status and outcomes: Among this age group, adults with asthma were more likely to have seven or more days out of role in the 2 weeks before the survey, 7 or more days with reduced activity in the 2 weeks before the survey and a high level of psychological distress. But they were less likely to feel mostly satisfied or better about life overall, rate their health as good or better and to have no days with reduced activity in the 2 weeks before the survey.
Risk factors: Compared with those aged 35–64 years who have never had asthma, adults with asthma aged 35–64 years were more likely to be obese.
0 10 20 30 40 50 60 70 80
3+ LTC
Hay fever
Allergy unspecified
Bronchitis/emphysema
Chronic sinusitis
Dermatitis/eczema
Psoriasis
Affective problems
Anxiety rel. problems
Migraine
Back pain
Diabetes
Ischaemic heart disease
High cholesterol
Hypertension
Gout
Ulcer
Infectious & parasitic dis.
Rheumatoid arthritis
Osteoarthritis
Osteoporosis
Rheumatism
Blood diseases
Per cent
Never had asthma
Asthma

27
Long-term health conditions: Adults with asthma aged 35–64 years were more likely to have three or more long-term health conditions. Of the long-term health conditions examined, they were more likely to have hay fever, unspecified allergy, bronchitis/emphysema, chronic sinusitis, affective problems, anxiety-related problems, migraine, back pain, diabetes, hypertension, rheumatoid arthritis, and osteoarthritis.
Seven characteristics both defined and distinguished 35–64 year olds with asthma (Table 3.7):
• felt mostly satisfied or better about life overall (less likely)
• health rated as good or better (less likely)
• no days with reduced activity in the two weeks before the survey (less likely)
• female (more likely)
• born in Australia (more likely)
• consulted a doctor within the 3 months before the survey (more likely)
• three or more long-term health conditions (more likely).
Table 3.7: Defining and distinguishing characteristics among people with asthma, 35–64 years, 2001
Defining (>50%) Not defining ( 50%)
Distinguishing (significant) Sex (female)
Country of birth (Australia)
Consulted a doctor (within 3 months)
Quality of life (mostly satisfied+)
Self-assessed health (good+)
Days of reduced activity (none)
Long-term conditions (3 or more)
Labour force status (full-time)
Health action (doctor and/or hospital)
Days out of role (7 or more)
Days of reduced activity (7 or more)
Psychological distress (had)
Body mass index (obese)
Hay fever (had)
Allergy unspecified (had)
Bronchitis/emphysema (had)
Chronic sinusitis (had)
Affective problems (had
Anxiety-related problems (had)
Migraine (had)
Back pain (had)
Diabetes (had)
Hypertension (had)
Rheumatoid arthritis (had)
Osteoarthritis (had)
Not distinguishing (not significant) Remoteness (major city/inner regional)
Gross weekly income (<$1000)
Private health insurance (had)
Asthma medications (used)
Health vs. 1 year ago (same+)
Days out of role (none)
Time since drank alcohol (<1 month)
Daily serves of fruit (2+)
Regular smokers in household (none)
(a)
(a) Contains the remainder of the characteristics listed in Table 3.1.

28
Notes
1. Comparisons were made using age-standardised proportions due to the differences in the age distribution between those with current
asthma and those who have never had asthma for this age group. Estimates may differ slightly from those presented in Table 3.1.
2. Age standardised to the Australian population as at 30 June 2001.
Source: ABS NHS 2001 Expanded V2 CURF.
Figure 3.11: Demographics and outcomes, by asthma status, persons aged 35–64 years, 2001
0 10 20 30 40 50 60 70 80 90 100
Male
NSW
Major city/Inner regional
Australia COB
Full-time employment
Income <$1000
1st quintile SES disadvantage
Private health insurance
Quality of Life Satisfied+
SAHS Good+
Same+ health vs 1 yr ago
0 days out of role
7+ days out of role
0 days reduced activity
7+ days reduced activity
High Kessler score
Per cent
Never had asthma
Asthma

29
Notes
1. Comparisons were made using age-standardised proportions due to the differences in the age distribution between those with current
asthma and those who have never had asthma for this age group. Estimates may differ slightly from those presented in Table 3.1.
2. Age standardised to the Australian population as at 30 June 2001.
Source: ABS NHS 2001 Expanded V2 CURF.
Figure 3.12: Actions and risk factors, by asthma status, persons aged 35–64 years, 2001
0 10 20 30 40 50 60 70 80 90 100
Doctor <3 months
Dr &/or hospital
Never smoked
Current smoker
0 reg. smokers in household
2+ reg. smokers in household
Alcohol <1 month ago
Risky–high-risk alcohol cons.
Normal BMI
Obese (30+)
2+ fruit serves
4+ vegetable serves
Sedentary
Moderate exercise
Vigorous exercise
Per cent
Never had asthma
Asthma

30
Notes
1. Comparisons were made using age-standardised proportions due to the differences in the age distribution between those with current
asthma and those who have never had asthma for this age group. Estimates may differ slightly from those presented in Table 3.1.
2. Age standardised to the Australian population as at 30 June 2001.
Source: ABS NHS 2001 Expanded V2 CURF.
Figure 3.13: Long-term conditions, by asthma status, persons aged 35–64 years, 2001
65 years and over
Adults with asthma aged 65 years and over had eight demographic and health-related characteristics that distinguished them from adults aged 65 years and over who have never had asthma (figures 3.14 to 3.16).
Demographics: There were no significant differences among any of the eight demographics applicable to this age group.
Health actions: Among the three health actions applicable to this age group, adults with asthma aged 65 years and over were more likely to have visited a doctor and/or hospital in the 2 weeks before the survey and to have received an influenza vaccination in the year before the survey.
Health status and outcomes: Compared with people aged 65 years and over who have never had asthma, adults with asthma aged 65 years and over were less likely to rate their health as good or better.
Risk factors: There were no significant differences among the 13 risk factors applicable to this age group.
0 10 20 30 40 50 60 70 80 90 100
3+ LTC
Hay fever
Allergy unspecified
Bronchitis/emphysema
Chronic sinusitis
Dermatitis/eczema
Psoriasis
Affective problems
Anxiety rel. problems
Migraine
Back pain
Diabetes
Ischaemic heart disease
High cholesterol
Hypertension
Gout
Ulcer
Infectious & parasitic dis.
Rheumatoid arthritis
Osteoarthritis
Osteoporosis
Rheumatism
Blood diseases
Per cent
Never had asthma
Asthma

31
Long-term health conditions: At these ages, having three or more long-term health conditions (although very common at almost 96%) did not distinguish people with asthma from those who have never had asthma. However, those with asthma were more likely to have hay fever, unspecified allergy, bronchitis/emphysema, chronic sinusitis and osteoporosis.
Two characteristics both defined and distinguished adults aged 65 years and over with asthma (Table 3.8):
• visited a doctor and/or hospital in the 2 weeks before the survey (more likely)
• received an influenza vaccination in the year before the survey (more likely).
Table 3.8: Defining and distinguishing characteristics among people with asthma, 65 years and over, 2001
Defining (>50%) Not defining ( 50%)
Distinguishing (significant) Health action (doctor and/or hospital)
Flu vaccination (<12 months ago)
Self-assessed health (good+)
Hay fever (had)
Allergy unspecified (had)
Bronchitis/emphysema (had)
Chronic sinusitis (had)
Osteoporosis (had)
Not distinguishing (not significant) Sex (female)
Remoteness (major city/inner regional)
Country of birth (Australia)
Gross weekly income (<$1000)
Asthma medications (used)
Number of asthma medications (2+)
Consulted a doctor (within 3 months)
Quality of life (mostly satisfied+)
Health vs. 1 year ago (same+)
Days of reduced activity (none)
Time since drank alcohol (<1 month)
Daily serves of fruit (2+)
Regular smokers in household (none)
Exercise level (sedentary)
Long-term conditions (3 or more)
(a)
(a) Contains the remainder of the characteristics listed in Table 3.1.

32
Note: Confidence intervals without an upper end stroke extend beyond 100%.
Source: ABS NHS 2001 Expanded V2 CURF.
Figure 3.14: Demographics and actions, by asthma status, persons aged 65 years and over, 2001
Source: ABS NHS 2001 Expanded V2 CURF.
Figure 3.15: Risk factors and outcomes, by asthma status, persons aged 65 years and over, 2001
0 10 20 30 40 50 60 70 80 90 100
Male
NSW
Major city/Inner regional
Australia COB
Full-time employment
Income <$1000
1st quintile SES disadvantage
Private health insurance
Doctor <3 months
Dr &/or hospital
Flu vacc <12 mths ago
Per cent
Never had asthma
Asthma
0 10 20 30 40 50 60 70 80 90 100
Never smoked
Current smoker
0 reg. smokers in household
2+ reg. smokers in household
Alcohol <1 month ago
Risky–high-risk alcohol cons.
Normal BMI
Obese (30+)
2+ fruit serves
4+ vegetable serves
Sedentary
Moderate exercise
Vigorous exercise
Quality of Life Satisfied+
SAHS Good+
Same+ health vs 1 yr ago
0 days of reduced activity
7+ days of reduced activity
High Kessler score
Per cent
Never had asthma
Asthma

33
Note: Confidence intervals without an upper end stroke extend beyond 100%.
Source: ABS NHS 2001 Expanded V2 CURF.
Figure 3.16: Long-term conditions, by asthma status, persons aged 65 years and over, 2001
Distinguishing characteristics across age groups
The comparisons in Figures 3.1 to 3.16 reveal those characteristics that distinguish people with current asthma from those who have never had asthma. Of further interest are those distinguishing characteristics that occur in adjacent age groups or recur in later age groups, that is, that persist across age groups (Table 3.9).
Before 65 years of age, a higher proportion of people with asthma than people who have never had asthma had three or more long-term health conditions. Although a higher proportion of people with asthma than those who have never had asthma had certain long-term health conditions, there were no diseases reported by more than 50% of any age group. That is, there were no comorbidities that were both defining and distinguishing characteristics.
Hay fever, unspecified allergy, chronic sinusitis and bronchitis/emphysema were the four long-term health conditions that were consistently more prevalent in people with asthma than in those who have never had asthma. Unspecified allergy was a distinguishing characteristic at all stages of life, while the other three conditions became distinguishing characteristics from 5 years of age.
For those aged 18–34 years and 35–64 years, migraine, back pain, obesity, and anxiety-related problems were other long-term health conditions that distinguished people with asthma from those who have never had asthma.
0 10 20 30 40 50 60 70 80 90 100
3+ LTC
Hay fever
Allergy unspecified
Bronchitis/emphysema
Chronic sinusitis
Dermatitis/eczema
Psoriasis
Affective problems
Anxiety rel. problems
Migraine
Back pain
Diabetes
Ischaemic heart disease
High cholesterol
Hypertension
Gout
Ulcer
Infectious & parasitic dis.
Rheumatoid arthritis
Osteoarthritis
Osteoporosis
Rheumatism
Blood diseases
Per cent
Never had asthma
Asthma
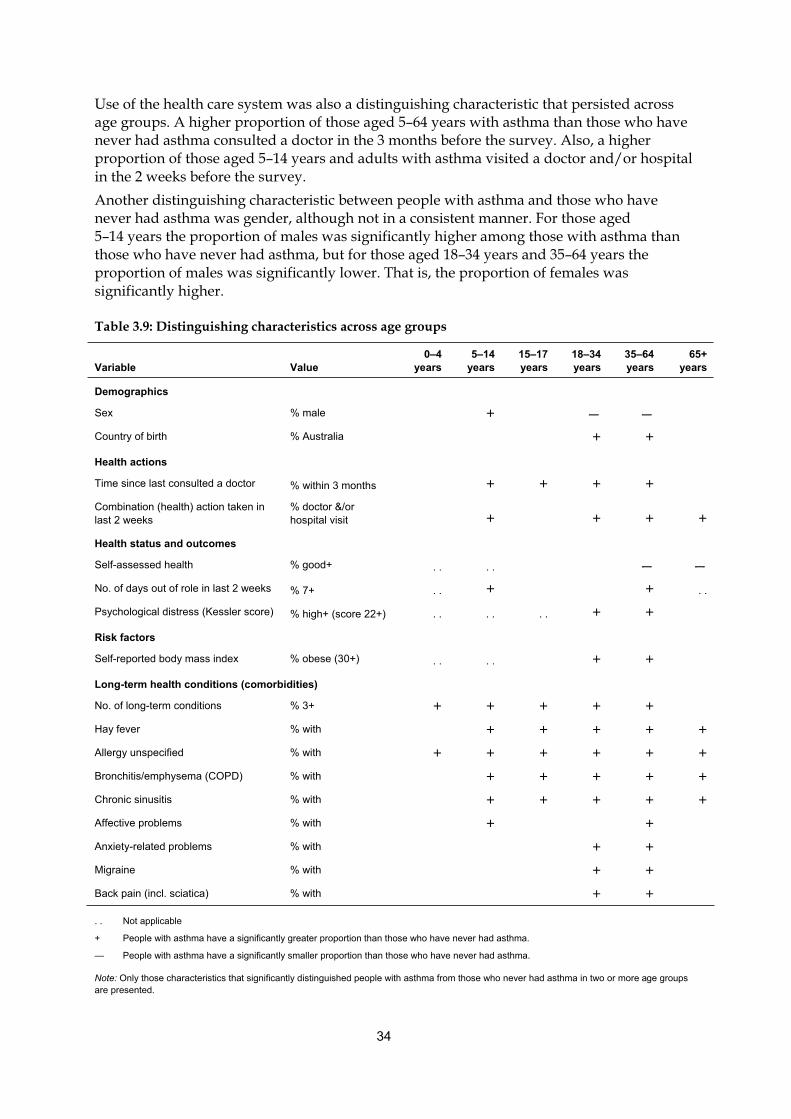
34
Use of the health care system was also a distinguishing characteristic that persisted across age groups. A higher proportion of those aged 5–64 years with asthma than those who have never had asthma consulted a doctor in the 3 months before the survey. Also, a higher proportion of those aged 5–14 years and adults with asthma visited a doctor and/or hospital in the 2 weeks before the survey.
Another distinguishing characteristic between people with asthma and those who have never had asthma was gender, although not in a consistent manner. For those aged 5–14 years the proportion of males was significantly higher among those with asthma than those who have never had asthma, but for those aged 18–34 years and 35–64 years the proportion of males was significantly lower. That is, the proportion of females was significantly higher.
Table 3.9: Distinguishing characteristics across age groups
Variable Value
0–4
years
5–14
years
15–17
years
18–34
years
35–64
years
65+
years
Demographics
Sex % male + — —
Country of birth % Australia + +
Health actions
Time since last consulted a doctor % within 3 months + + + +
Combination (health) action taken in
last 2 weeks
% doctor &/or
hospital visit + + + +
Health status and outcomes
Self-assessed health % good+ . . . . — —
No. of days out of role in last 2 weeks % 7+ . . + + . .
Psychological distress (Kessler score) % high+ (score 22+) . . . . . . + +
Risk factors
Self-reported body mass index % obese (30+) . . . . + +
Long-term health conditions (comorbidities)
No. of long-term conditions % 3+ + + + + +
Hay fever % with + + + + +
Allergy unspecified % with + + + + + +
Bronchitis/emphysema (COPD) % with + + + + +
Chronic sinusitis % with + + + + +
Affective problems % with + +
Anxiety-related problems % with + +
Migraine % with + +
Back pain (incl. sciatica) % with + +
. . Not applicable
+ People with asthma have a significantly greater proportion than those who have never had asthma.
— People with asthma have a significantly smaller proportion than those who have never had asthma.
Note: Only those characteristics that significantly distinguished people with asthma from those who never had asthma in two or more age groups
are presented.

35
4 Discussion
The aims of this report were to identify the demographic and health-related characteristics that define people with current, long-term asthma, and distinguish them from those who have never had asthma. This was achieved by constructing statistical snapshots of people with asthma at different stages of life using 2001 NHS data and comparing them to snapshots of people who have never had asthma.
Defining and distinguishing characteristics
The statistical snapshots show several characteristics unique to people with asthma, such as having a written asthma action plan and using medications for asthma in the two weeks before the survey. Other characteristics, such as country of birth being Australia, were reported by a majority of people with asthma. We refer to these as defining characteristics, although many of them are shared with the rest of the population, including those who have never had asthma. When there was a significant difference between the proportion among people with asthma and those who have never had asthma, we refer to the characteristic as distinguishing. Labelling characteristics as defining and/or distinguishing is useful for revealing each characteristic’s prominence and role.
Children with asthma aged 0–4 years are only distinguishable from those who have never had asthma by being more likely to have three or more long-term health conditions (including asthma) and by being more likely to have an unspecified allergy. From the age of five years, however, there are several distinguishing characteristics, many occurring in more than one age group.
In more than one age group, the following defining and distinguishing characteristics of people with asthma were the most important: their sex; the use of the health care system (especially consulting a doctor in the 3 months before the survey); and the number of long-term health conditions (conditions lasting, or expected to last, at least 6 months).
Obesity was the only risk factor that was a distinguishing characteristic for more than one age group, although it was not a defining characteristic. Further, although there were several distinguishing comorbidities, none of them were also defining characteristics.
Each of the aforementioned characteristics has been identified in previous Australian and overseas research.
Sex
Asthma is more common in boys before adolescence and in females after adolescence. The reason for this switch in sex predominance is not fully understood (Lee et al. 2006) but the pattern has been demonstrated in Australia and overseas (AIHW: ACAM 2005; Lee et al. 2006). The switch is also reflected in patterns of hospitalisation for asthma (AIHW: ACAM 2005; Schatz et al. 2006). However, even when controlling for underlying differences in prevalence and tobacco smoking, adults females are more likely than males to be hospitalised for asthma (Prescott et al. 1997).

36
Use of the health care system
As a long-term health condition, asthma has a considerable impact on people’s health and wellbeing and on their use of the health care system. For those aged 5–64 years, consulting a doctor in the three months before the survey was a defining and distinguishing characteristic. Visiting a doctor and/or hospital in the 2 weeks before the survey was a defining and distinguishing characteristic for those aged 65 years and over and a distinguishing characteristic for those aged 5–14 years and 18–64 years. About 10% of people with asthma (18.7% of those aged 0–4 years) reported visiting a doctor or hospital specifically for asthma in the 2 weeks before the survey.
Many of these asthma-specific visits may be associated with recurrent exacerbations resulting from exposure to tobacco smoke, ongoing exposure to allergens (such as house dust mites) as well as non-compliance with recommended management and medication (ten Brinke et al. 2005). The greater likelihood of having multiple comorbidities, especially sinusitis and psychological distress (ten Brinke et al. 2005), may account for the greater tendency of people with asthma to have recently visited a doctor or hospital for any reason.
Obesity
People with asthma aged 18 to 64 years are more likely to be obese than those who have never had asthma. The association between asthma and excessive weight or obesity has been demonstrated by several recent studies (Chinn & Rona 2001; Gilliland et al. 2003; Saint-Pierre et al. 2006; Varraso et al. 2005). However, Chinn and Rona (2001) suggest that an increase in asthma incidence cannot be explained simply by a preceding increase in the incidence of obesity as the relationship appears to be a recent phenomenon. Although there is some evidence from longitudinal studies that being overweight or obese raises the risk of the onset of asthma in children, especially among boys (Gilliland et al. 2003), it is not clear whether the link between obesity and asthma is physiological or due to subsequent changes in lifestyle. For example, it may be argued that asthma leads to obesity due to an associated reduction in physical activity (Gilliland et al. 2003), or that it affects the quality of asthma management, thereby aggravating the condition (Saint-Pierre et al. 2006). The recent discovery of a protein central to both fatty-acid metabolism and airway inflammation suggests a possible genetic link (Shum et al. 2006).
Allergic and inflammatory conditions
Until the age of 65 years, people with asthma are more likely to have three or more long-term health conditions, particularly those related to allergy and inflammation.
At all ages, unspecified allergy is a distinguishing long-term health condition for people with asthma. From the age of 5 years, hay fever, sinusitis and bronchitis/emphysema are also distinguishing comorbidities. It is not surprising that people with asthma are more likely to have one or more allergy-related long-term health conditions, as up to 80% of people with asthma are allergic to at least one allergen (Court et al. 2002; Faniran et al. 1999; Kemp & Kemp 2001). The relationship between asthma and allergic (atopic) diseases, especially hay fever, has been well established by longitudinal and cross-sectional studies (Huovinen et al. 2006; Plaschke et al. 2000; Porsbjerg et al. 2006; Strachan et al. 1996; Wolfe et al. 2000; Xuan et al. 2002).

37
The finding that a higher proportion of people with asthma also have bronchitis and/or emphysema may partly reflect the difficulty in distinguishing between the conditions at diagnosis, especially at older ages (Mannino et al. 2000). Tobacco smoking is well-recognised as the major cause of chronic obstructive lung disease (of which emphysema and chronic bronchitis are the major forms). And, although the evidence for a causal link remains mixed, researchers have found that smoking increases the risk of wheeze and asthma, especially in non-atopics (Genuneit et al. 2006; Plaschke et al. 2000), and that tobacco smoke is known to worsen asthma symptoms in those with established disease (Siroux et al. 2000; Strachan et al. 1996). Therefore, a high proportion of current and ex-smokers are likely to report chronic obstructive lung disease and asthma concurrently.
Mental health conditions
People with asthma aged 18–64 years are more likely than those who have never had asthma to have psychological distress and anxiety-related disorders. Those aged 35–64 years, as well as those aged 5–14 years, are also more likely to have affective problems (such as depression). Hurwitz and Morgenstern (1999) also found a relationship between asthma and depression. They suggested that pro-inflammatory cells released during an allergic asthma episode leads to hyper-reactive responses to subsequent psycho-social stress. This relationship is also supported Wright et al. (2005), but there are several alternative explanations.
It is reasonable to suggest that having asthma, particularly if it is poorly managed or associated with one or more other chronic health conditions, would increase the likelihood of having a mental health disorder, such as anxiety or depression (Annesi-Maesano et al. 2006; Bender 2006; Goldney et al. 2003). Secondly, underlying anxiety may lead to risky behaviour, such as tobacco smoking, and exacerbated asthma symptoms (Annesi-Maesano et al. 2006). Depression may also lead to non-compliance with asthma management and medication, particularly among adolescents, which could then worsen asthma symptoms and lead to further depression (Bender 2006; DiMatteo et al. 2000). However, the cause–effect relationship is not clear, as non-compliance may result from other behavioural traits. Further, results from a 21-year longitudinal study of a birth cohort in New Zealand suggests a non-causal relationship between asthma and either depression or anxiety (Goodwin et al. 2004). Rather, Goodwin and colleagues (2004) suggest that the relationship may be confounded by other genetic, social or individual factors associated with both outcomes.
Other comorbidities
As with mental health conditions, other comorbidities that distinguish people with asthma, from those who have never had asthma, form more complex and less understood relationships than with allergic and inflammatory conditions. For example, migraine and back pain have been associated with asthma. In this study, these comorbidities distinguished those aged 18–64 years with asthma from those who have never had asthma.
An association between asthma and migraine has been found in a number of cohort studies (Strachan et al. 1996) and case-control studies (Davey et al. 2002). As yet, no causal link or common mechanism, including an underlying allergic mechanism, has been identified (Davey et al. 2002; Ozge et al 2005).
38
Hurwitz and Morgenstern (1999) found a relationship between asthma and back pain. They suggested that it was based on a mechanism involving hyper-reactivity to mechanical stress after an allergic asthma attack (as suggested with subsequent psychosocial stress and depression).
Previous snapshot studies
The findings from this study are similar to those of other Australian studies using different data sources. To determine the demographic and risk factor characteristics that best describe people with current asthma (as well as chronic obstructive pulmonary disease and diabetes), Taylor and colleagues (2002) constructed profiles with data from the North West Adelaide Health Study. They found that people with asthma are significantly more likely than people without asthma to have an allergy (especially to rye grass pollen, cats, house dust mites and mould) and to access health care services such as general practitioners and hospitals.
Daly and Molster (2006) used data from the Western Australia Health and Wellbeing Surveillance System to produce profiles of people with asthma in 2004. They investigated the prevalence of asthma among people with certain characteristics, such as health status outcomes, selected risk factors and measures of socioeconomic disadvantage. Daly and Molster’s associations were analysed differently to this study and cannot be generalised to conclude that people with current asthma were more likely to report these characteristics than those without asthma. But, in general, they found associations in the same areas as in the present project. For example, people who reported their health as being worse than a year before the survey were more likely to have asthma than those whose health was reported as the same or better. Also, adults who had a mental health problem, were obese, did not have enough money to get by each week, lived in an area that was classified as the most disadvantaged socially and economically, or who were currently smoking, were more likely to report asthma (Daly & Molster 2006).
Issues for consideration
Unlike Taylor and colleagues (2002) and Daly and Molster (2006), this report uses the term ‘snapshot’ rather than ‘profile’ to describe the collection of characteristics of people with asthma. This is because profiles, as used in other various disciplines, are usually applied to individuals. That is, they are often used to describe a typical individual in a particular context (as in criminal profiling), or are used to show the concordance or discrepancy of an individual with the established norm (as in personality profiling). In this report each characteristic comprising the statistical snapshots was considered independently of the others. Therefore, the snapshots should not be taken to represent a ‘typical’ person with asthma. A snapshot or profile of a typical person with asthma that was based on as many variables as used to construct the snapshots in this project would not include many actual cases. For such a profile to be more inclusive it would have to be based on only a few key variables. However, our findings may help to identify the key variables required to construct profiles of a typical person with asthma, if such an exercise were considered worthwhile.
An important consideration is the potential influence of sample size (and population estimates) on the findings. The 35–64 years age group had by far the greatest number of significant differences between people with asthma and those who have never had asthma. However, this age group was the largest numerically and would therefore tend to have

39
estimates with smaller confidence intervals, thereby increasing the opportunity to detect significant differences. On the other hand, the age groups with smaller numbers, such as the 0–4 years age group, would have estimates with larger confidence intervals, and therefore reduced opportunities to detect significant differences.
The snapshots show that a person’s sex is an important characteristic when viewed in relation to age. Under 18 years, males predominate (59% of those aged 5–14 years with asthma are male), whereas from the age of 18 years, females predominate (62% of those aged 35–64 years with asthma are female). However, it was beyond the scope of this report to construct snapshots of people with asthma by both age and sex and to compare these to corresponding snapshots of those who have never had asthma. The size of the sample contributing to the snapshots with the smaller age groups would limit the ability to detect uncommon occurrences, particularly some comorbidities, and significant differences.
Diagnostic confusion, which can occur with a self-report survey, may account for some of the comorbidities reported by people with asthma. However, people with current asthma, as a group, are more likely than people who have never had asthma to have 16 of the 22 comorbid long-term health conditions examined. The presence of so many comorbidities has implications for how asthma is managed—some comorbidities can be closely tied pathologically to asthma. Adams and colleagues (2006) suggest that at younger ages, when there are fewer comorbidities, an asthma-targeted approach is required, while in older people, with many comorbidities, an integrated chronic disease approach may be necessary.
We have referred to characteristics that are defining and/or distinguishing across ages. This implies that the manifestation of such characteristics is dependent on age, such as having few comorbidities at younger ages but many at older ages. However, it is important to recognise that a single cross-sectional survey does not allow the separation of age effects and so-called ‘cohort’ effects. Although we can demonstrate a difference between 4 year olds and 14 year olds, for example, it is impossible to say that in 10 years time today’s 4 year olds will resemble today’s 14 year olds as they are distinct cohorts. Further investigation of these effects requires longitudinal studies in addition to regular and compatible cross-sectional studies (Marks & Poulos 2005).
Many of the differences between those with and without asthma might be amplified if we were to look at people with recent symptoms of asthma, such as wheezing (Forrest et al. 1997). Forrest and colleagues found that teenagers with asthma, with or without recent wheeze, had more comorbidities than teenagers without asthma, but those with recent wheeze had the most acute and recurrent comorbidities and the greatest effects on health and wellbeing. This type of analysis was not conducted in this study but may be a consideration for future work. Unfortunately, the presence of recent wheeze was not included in the 2004–05 NHS.
Conclusions
By providing statistical snapshots using 2001 NHS data, this report reveals the demographic and health-related characteristics that define and distinguish people with asthma. These characteristics improve our understanding of the nature and consequences of the disease. It may be argued that the NHS does not provide an entirely reliable indicator of the prevalence of asthma, due to the self-reporting nature of the survey. However, most of the key defining and distinguishing characteristics have been identified by other studies, both in Australia and overseas. To this extent, the NHS is a valid source of information on the prevalence of

40
asthma as well as the characteristics of the people who have the disease and the burden of disease they experience. The survey also has the advantages of national coverage and of including items on a large number of demographic and health-related dimensions.
The 2004–05 NHS provides an opportunity to repeat the project with updated data and an existing template of what to expect at different age groups.
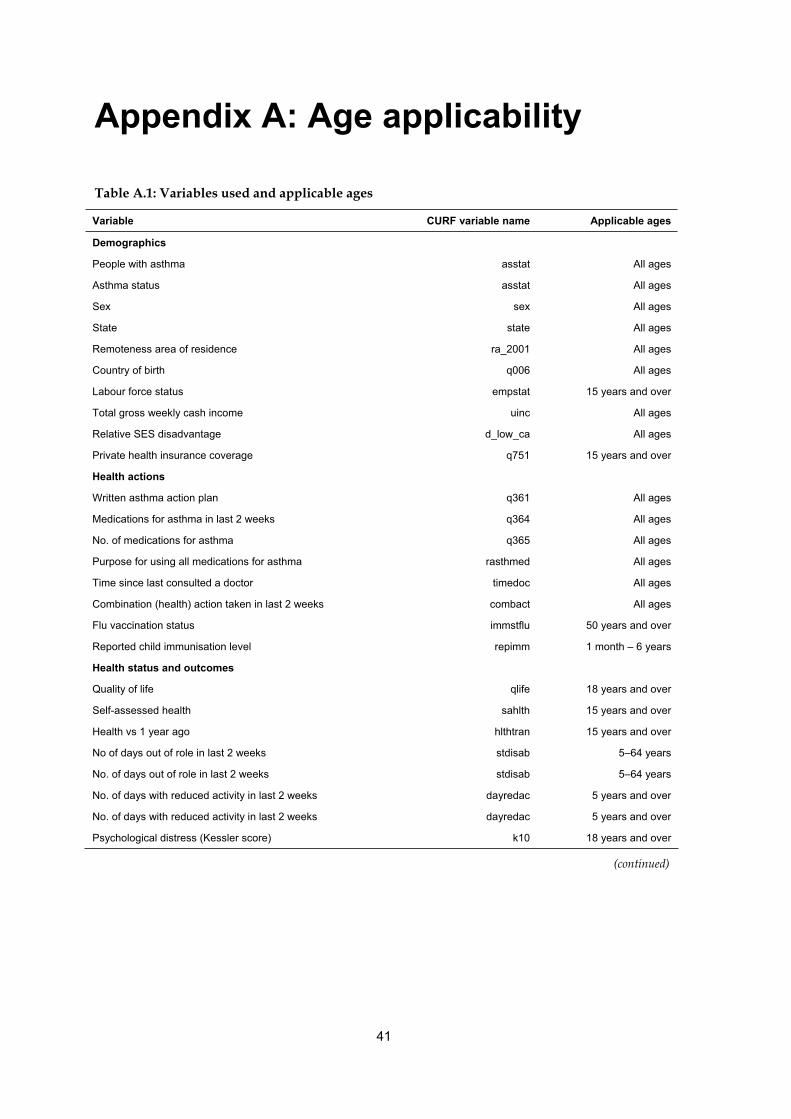
41
Appendix A: Age applicability
Table A.1: Variables used and applicable ages
Variable CURF variable name Applicable ages
Demographics
People with asthma asstat All ages
Asthma status asstat All ages
Sex sex All ages
State state All ages
Remoteness area of residence ra_2001 All ages
Country of birth q006 All ages
Labour force status empstat 15 years and over
Total gross weekly cash income uinc All ages
Relative SES disadvantage d_low_ca All ages
Private health insurance coverage q751 15 years and over
Health actions
Written asthma action plan q361 All ages
Medications for asthma in last 2 weeks q364 All ages
No. of medications for asthma q365 All ages
Purpose for using all medications for asthma rasthmed All ages
Time since last consulted a doctor timedoc All ages
Combination (health) action taken in last 2 weeks combact All ages
Flu vaccination status immstflu 50 years and over
Reported child immunisation level repimm 1 month – 6 years
Health status and outcomes
Quality of life qlife 18 years and over
Self-assessed health sahlth 15 years and over
Health vs 1 year ago hlthtran 15 years and over
No of days out of role in last 2 weeks stdisab 5–64 years
No. of days out of role in last 2 weeks stdisab 5–64 years
No. of days with reduced activity in last 2 weeks dayredac 5 years and over
No. of days with reduced activity in last 2 weeks dayredac 5 years and over
Psychological distress (Kessler score) k10 18 years and over
(continued)

42
Table A.1 (continued): Variables used and applicable ages
Variable CURF variable name Applicable ages
Risk factors
Time since last drank alcohol q311 18 years and over
Alcohol consumption risk level over last 7 days (2000
guidelines) alcr00wk 18 years and over
Usual daily serves of vegetables q302 12 years and over
Usual daily serves of fruit q303 12 years and over
Self-reported body mass index (BMI) bminew 15 years and over
Self-reported body mass index bminew 15 years and over
Smoking status smokstat 18 years and over
Smoking status smokstat 18 years and over
No. regular smokers in household numsmoke All ages
No. regular smokers in household numsmoke All ages
Exercise level in last 2 weeks exlevelnew 15 years and over
Moderate exercise in last 2 weeks q210 15 years and over
Vigorous exercise in last 2 weeks q213 15 years and over
Long-term health conditions (comorbidities)
No. of long-term conditions numltc All ages
Hay fever ICD10a–ICD10s All ages
Allergy unspecified ICD10a–ICD10s All ages
Bronchitis/emphysema (COPD) ICD10a–ICD10s All ages
Chronic sinusitis ICD10a–ICD10s All ages
Dermatitis/eczema ICD10a–ICD10s All ages
Psoriasis ICD10a–ICD10s All ages
Affective problems ICD10a–ICD10s All ages
Anxiety-related problems ICD10a–ICD10s All ages
Migraine ICD10a–ICD10s All ages
Back pain (incl. sciatica) ICD10a–ICD10s All ages
Diabetes ICD10a–ICD10s All ages
Ischaemic heart disease (IHD) ICD10a–ICD10s All ages
High cholesterol ICD10a–ICD10s All ages
Hypertension (high BP) ICD10a–ICD10s All ages
Gout ICD10a–ICD10s All ages
Ulcer ICD10a–ICD10s All ages
Infectious & parasitic diseases ICD10a–ICD10s All ages
Osteoarthritis ICD10a–ICD10s All ages
Rheumatoid arthritis ICD10a–ICD10s All ages
Rheumatism ICD10a–ICD10s All ages
Osteoporosis ICD10a–ICD10s All ages
Blood disorders (incl. anaemia) ICD10a–ICD10s All ages

43
Appendix B: Variables and values
Table B.1: Groupings used and values excluded from proportions
Variable Groupings used Values in groups Values excluded
Demographics
People with asthma With asthma
Other
1 Ever told has condition, still current and long term
3 Ever told has condition, not current; 5 Never told, not
current or long term
n.a.
Asthma status Current LT asthma
Never had asthma
1 Ever told has condition, still current and long term
5 Never told, not current or long term
3 Never told, not
current or long
term
Sex Male
Female
1 Males
2 Females
n.a.
State NSW
Not in NSW
1 New South Wales
2–8 (Vic, Qld, SA, WA, Tas, NT, ACT)
n.a.
Remoteness area of
residence
Major city/inner regional
Other
0 Major cities of Australia; 1 Inner regional Australia
2 Other areas
n.a.
Country of birth COB Australia
COB other
01 Australia
02 New Zealand; 03 Other Oceania; 04 UK and Ireland; 05
Other North/West Europe; 06 Southern & Eastern Europe;
07 North Africa; 08 Middle East; 09 Other Africa; 10
Southeast Asia; 11 Other Asia; 12 Americas; 99 Other
n.a.
Labour force status Full time
Not full time
1 Employed, full time
2 Employed, part time; 3 Unemployed, looking for full-time
work; 4 Unemployed, looking for part-time work; 5 Not in
labour force
0 Not applicable
Total gross weekly
cash income
<$1000
$1000
01 Not income; 02–12 (<$120–$999)
13–38 ($1,000–$3,500 or more)
99 Not known
Relative SES
disadvantage
1st quintile
2nd–5th quintile
01 First decile; 02 Second decile
03 Third decile; 04 Fourth decile; 05 Fifth decile; 06 Sixth
decile; 07 Seventh decile; 08 Eighth decile; 09 Ninth
decile; 10 Tenth decile
n.a.
Private health
insurance coverage
Private health insurance
No private health insurance
1 With private health insurance
2 Without private health insurance
0 Not applicable;
9 Not known
Health actions
Written asthma
action plan
Has asthma action plan
No or unknown asthma
action plan
1 Has written asthma action plan
2 Does not have a written asthma action plan; 3 Never
heard of a written asthma action plan; 9 Not known if has a
written asthma action plan
0 Not applicable
Medications for
asthma in last 2
weeks
Used drugs for asthma
Didn’t use drugs for asthma
1 Used pharmaceutical medications for asthma
2 Not used pharmaceutical medications for asthma; 9 Not
known if used pharmaceutical medications for asthma
0 Not applicable
No. of medications
for asthma
Used 2+ drugs for asthma
Used <2 drugs for asthma
2 Two; 3 Three; 4 Four or more
1 One; 0 Not applicable (+ current LT asthma)
n.a.
(continued)

44
Table B.1 (continued): Groupings used and values excluded from proportions
Variable Groupings used Values in groups Values excluded
Health actions (continued)
Purpose for using all
medications for
asthma
Used drugs for prevention &
relief
Not used drugs for both
prevention & relief
3 Prevention and relief
1 Prevention only; 2 Relief only; 3 Neither prevention
or relief; 9 Not known; 0 Not applicable (+ current LT
asthma)
n.a.
Time since last
consulted a doctor
Consulted a doctor <3 months
ago
Didn’t consult a doctor <3
months ago
1 2 weeks or less; 2 More than 2 weeks to less than 3
months
3 3 months to less than 6 months; 4 6 months to less
than 12 months; 5 12 months or more; 6 Never; 9 Not
known
n.a.
Combination (health)
action taken in last 2
weeks
Seen a doctor and/or hospital
Not seen a doctor and/or
hospital
01–12
13–98
00 Not applicable
Flu vaccination
status
Had flu vaccination in year
Didn’t have flu vaccination in
year
3 had influenza vaccination in last 12 months
1 Never had influenza vaccination; 2 Had influenza
vaccination but not in last 12 months; 4 Had influenza
vaccination but not known if in last 12 months; 9 Not
known if ever had influenza vaccination
0 Not applicable
Reported child
immunisation level
All recommended vaccinations
Not all recommended
vaccinations
1Received all vaccinations recommended for age
2 Received some recommended vaccinations; 3 Not
received any vaccinations; 4 Not known if received all
recommended vaccinations; 9 Not known if received
any recommended vaccinations
0 Not applicable
Health status and outcomes
Quality of life Mostly satisfied or better
Less than mostly satisfied
1 Delighted; 2 Pleased; 3 Mostly satisfied
4 Mixed; 5 Mostly dissatisfied; 6 Unhappy; 7 Terrible
0 Not applicable
Self-assessed health Good or better
Not good or better
1 Excellent; 2 Very good; 3 Good
4 Fair; 5 Poor; 8 Not stated
0 Not applicable
Health vs 1 year ago Same or better
Not the same or better
1 Much better; 2 Somewhat better; 3 About the same
4 Somewhat worse; 5 Much worse
0 Not applicable
No. of days out of
role in last 2 weeks
No days out of role
1+ days out of role
00
01–14
n.a.
No. of days out of
role in last 2 weeks
7 or more days out of role
<7 days out of role
07–14
00–06
n.a.
No. of days with
reduced activity in
last 2 weeks
No days of reduced activity
1+ days of reduced activity
00
01–14
n.a.
No. of days with
reduced activity in
last 2 weeks
7 or more days of reduced
activity
<7 days of reduced activity
07–14
00–06
n.a.
Psychological
distress (Kessler
score)
High psychological distress
Not high psychological distress
22–50
0–21
n.a.
(continued)

45
Table B.1 (continued): Groupings used and values excluded from proportions
Variable Groupings used Values in groups Values excluded
Risk factors
Time since last
drank alcohol
Drank alcohol in last month
Didn’t drink alcohol in last month
1 1 week or less; 2 More than 1 week to less than 2
weeks; 3 2 weeks to less than 1 month
4 1 month to less than 3 months; 5 3 months to less
than 12 months; 6 12 months or more; 7 Never; 9 Not
known
0 Not applicable
Alcohol consumption
risk level over last 7
days (2000
guidelines)
Risky-high risk alcohol cons.
Not risky or high risk alcohol
cons.
2 Risky; 3 High risk
1 Low risk; 4 Last consumed alcohol 1 week to less
than 12 months ago; 5 Last consumed alcohol 12
months or more ago; 6 Never consumed alcohol of
time since last consumed not known
0 Not applicable
Usual daily serves of
vegetables
4+ daily serves of vegetables
<4 daily serves of vegetables
3 4–5 serves; 4 6 serves or more
1 1 serve or less; 2 2–3 serves; 5 Doesn’t eat
vegetables
0 Not applicable
Usual daily serves of
fruit
2+ usual daily serves of fruit
<2 usual daily serves of fruit
2 2–3 serves; 3 4–5 serves; 4 6 serves or more
1 1 serve or less; 5 Doesn’t eat vegetables
0 Not applicable
Self-reported body
mass index (BMI)
Normal self-reported BMI
Not normal self-reported BMI
4 Normal (BMI 18.50–19.99); 5 Normal (20.00–24.99)
1 Grade 3 thinness (BMI less than 16.00); 2 Grade 2
thinness (BMI 16.00–16.99); 3 Grade 1 thinness (BMI
17.00–18.49); 6 Grade 1 overweight (BMI 25.00–
29.99); 7 Grade 2 overweight (BMI 30.00–39.99); 8
Grade 3 overweight (BMI greater than or equal to
40.00)
0 Not applicable
98 Not known
Self-reported body
mass index
Obese self-reported BMI
Not obese self-reported BMI
7 Grade 2 overweight (BMI 30.00–39.99); 8 Grade 3
overweight (BMI greater than or equal to 40.00)
1 Grade 3 thinness (BMI less than 16.00); 2 Grade 2
thinness (BMI 16.00–16.99); 3 Grade 1 thinness (BMI
17.00–18.49); 4 Normal (BMI 18.50–19.99); 5 Normal
(20.00–24.99); 6 Grade 1 overweight (BMI 25.00–
29.99)
0 Not applicable
98 Not known
Smoking status Never smoked
Ever smoked
4 Never smoked regularly
1 Current regular smoker – daily; 2 Other current
smoker; 3 Ex-regular smoker
0 Not applicable
Smoking status Current smoker
Not current smoker
1 Current regular smoker – daily; 2 Other current
smoker
3 Ex-regular smoker; 4 Never smoked regularly
0 Not applicable
No. regular smokers
in household
No regular smokers in
household
1+ regular smoker in household
1 None
2 One; 3 Two; 4 Three or more
0 Not applicable
9 Not known
No. regular smokers
in household
2+ regular smokers in household
<2 regular smokers in household
3 Two; 4 Three or more
1None; 2 One
0 Not applicable
9 Not known
Exercise level in last
2 weeks
Sedentary exercise level
Not sedentary exercise level
4 Sedentary (very low); 5 Sedentary (no exercise)
1High ; 2 Moderate; 3 Low
0 Not applicable
Moderate exercise in
last 2 weeks
Did moderate exercise
Didn’t do moderate exercise
1 Did moderate exercise
2 Did not do moderate exercise
0 Not applicable
Vigorous exercise in
last 2 weeks
Did vigorous exercise
No vigorous exercise
1 Did vigorous exercise
2 Did not do vigorous exercise
0 Not applicable
(continued)

46
Table B.1 (continued): Groupings used and values excluded from proportions
Variable Groupings used Values in groups Values excluded
Long-term health conditions (comorbidities)
Number of long-term
conditions
3 or more long-term conditions
Less than 3 long-term conditions
3 Three; 4 Four; 5 Five or more
0 None; 1 One; 2 Two
n.a.
Hay fever With hay fever
Without hay fever
55
None of the variables had this value
n.a.
Allergy unspecified With unspecified allergy
Without unspecified allergy
91
None of the variables had this value
n.a.
Bronchitis/emphysema
(COPD)
With bronchitis or emphysema
Without bronchitis or emphysema
52; 53
None of the variables had these values
n.a.
Chronic sinusitis With chronic sinusitis
Without chronic sinusitis
56
None of the variables had this value
n.a.
Dermatitis/eczema With dermatitis or eczema
Without dermatitis or eczema
67
None of the variables had this value
n.a.
Psoriasis With psoriasis
Without psoriasis
68
None of the variables had this value
n.a.
Affective problems With affective problems
Without affective problems
13; 14
None of the variables had these values
n.a.
Anxiety-related
problems
With anxiety-related problems
Without anxiety-related problems
15
None of the variables had this value
n.a.
Migraine With migraine
Without migraine
21
None of the variables had this value
n.a.
Back pain (incl.
sciatica)
With back pain
Without back pain
78; 79
None of the variables had these values
n.a.
Diabetes With diabetes
Without diabetes
07; 08; 09
None of the variables had these values
n.a.
Ischaemic heart
disease (IHD)
With IHD
Without IHD
110; 111
None of the variables had these values
n.a.
High cholesterol With high cholesterol
Without high cholesterol
10
None of the variables had this value
n.a.
Hypertension (high
BP)
With hypertension
Without hypertension
39
None of the variables had this value
n.a.
Gout With gout
Without gout
71
None of the variables had this value
n.a.
Ulcer With ulcer
Without ulcer
60
None of the variables had this value
n.a.
Infectious & parasitic
diseases
With infectious & parasitic dis’s
Without infectious & parasitic dis’s
01
None of the variables had this value
n.a.
(continued)

47
Table B.1 (continued): Groupings used and values excluded from proportions
Variable Groupings used Values in groups Values excluded
Long-term health conditions (comorbidities) (continued)
Osteoarthritis With osteoarthritis
Without osteoarthritis
73
None of the variables had this value
n.a.
Rheumatoid arthritis With rheumatoid arthritis
Without rheumatoid arthritis
72
None of the variables had this value
n.a.
Rheumatism With rheumatism
Without rheumatism
76
None of the variables had this value
n.a.
Osteoporosis With osteoporosis
Without osteoporosis
80
None of the variables had this value
n.a.
Blood disorders (incl.
anaemia)
With blood disorders
Without blood disorders
05; 06
None of the variables had these values
n.a.

48
Glossary
age standardisation: A method of removing the influence of age when comparing populations with different age structures either across all ages or across a broad age group. In this report, the standard population used is Australia as at 30 June 2001.
age-standardised proportion: The age standardised rate per 100 persons. It is the rate which would have occurred in the standard population if it experienced the same rate as that of the population of interest—either people with current asthma or people who have never had asthma in this report.
alcohol risk level: The level or risk associated with estimated average daily consumption using the NHMRC risk levels for harm in the long term (ABS 2003).
atopy: A genetic predisposition for allergic reactions.
body mass index (BMI): Weight in kilograms divided by the square of height in centimetres. In this report, BMI is calculated using self-reported weight and self-reported height and so refers to self-reported BMI.
comorbities: health conditions present at the same time as other health conditions.
confidence interval: A measure of confidence in the estimate. This report uses 95% confidence intervals. If many samples were taken from the same population, 95% of the confidence intervals from these repeated samples would include the true population value.
current asthma: Includes people who had been told by a doctor or nurse that they had asthma and whose asthma is still current.
current smokers: Includes both current regular (daily) smokers and current not regular smokers.
days out of role: Days away from work or school/study for at least half the day plus other days of reduced activity due to own illness or injury (ABS 2003).
defining characteristics: Characteristics present in a majority (more than half) of people. In this report, defining characteristics refer to characteristics present in more than half of people with current asthma.
distinguishing characteristics: Characteristics that differ significantly between two groups of people. In this report distinguishing characteristics refer to characteristics that differ significantly between people with current asthma and people who have never had asthma.
exercise level: A grouping of the exercise score derived from frequency, intensity and duration of exercise.
hypertension: high blood pressure.
income unit: Consists of either a single person or a group of related persons, within a household, whose income is shared (or is assumed to be shared). In the definition of income unit, the relationships are restricted to those of marriage (either registered or de facto) and of parent/dependent child. Income units can therefore include the partner (for couples), all children aged less than 15 years, and unmarried children who are full-time students aged 15–24 years who don’t have children of their own (ABS 2003).
Kessler score: See Psychological distress.

49
long-term health condition: A health condition that has lasted, or is expected to last, at least six months. Conditions which were assumed to be long-term include asthma, cancer, diabetes insipidus, diabetes mellitus types 1 and 2, rheumatic heart disease, heart attack and stroke (ABS 2003).
never had asthma: Includes people who were never told by a doctor or nurse that they had asthma and had no current asthma.
normal body mass index (BMI): Values of BMI from 18.5 to less than 25, in accordance with World Health Organization standards.
obese: BMI values 30 or higher, in accordance with World Health Organization standards.
other days of reduced activity: Days on which a person had cut down on their usual activities for at least half the day due to own illness or injury not including days away from work or from school/study (ABS 2003).
p: Significance level or probability that a significant result is due to chance alone.
pharmaceuticals for asthma: Any medication used for asthma other than medications identified by respondents as vitamins or minerals, or natural or herbal medication (ABS 2003).
psychological distress: Levels of psychological distress, described by a score value, are derived from the Kessler Psychological Distress Scale–10 items (K–10). This is a scale of non-specific psychological distress based on 10 questions about negative emotional states. The levels are grouped into low (10–15), moderate (16–21), high (22–29) and very high (30–50) (ABS 2003).
relative SES disadvantage: Based on the index of relative socioeconomic disadvantage. This index uses attributes such as low income, low educational attainment, high unemployment and jobs in relatively unskilled occupations (ABS 2003). It does not refer to the socioeconomic situation of a particular individual but instead refers to the area in which a person lives. In this report, the index of relative socioeconomic disadvantage is analysed using quintiles (that is, five groups) which are based on the level of the index.
remoteness area of residence: Location of place of usual residence using the ASGC Remoteness classification based on the updated Accessibility and Remoteness Index for Australia (ABS 2003).
reported child immunisation level: The degree to which the recommended course of vaccinations for a particular disease has been received, defined using the National Health and Medical Research Council Standard Childhood Vaccination Schedules (ABS 2003).
risky – high-risk alcohol consumption: In males this refers to an average daily consumption of more than 50 ml of alcohol while in females it refers to more than 25 ml (ABS 2003).
sedentary exercise level: An exercise score of less than 100, including no exercise (ABS 2003).
self-reported body mass index (BMI): Self-reported weight in kilograms divided by the square of self-reported height in centimetres.
standard error: A measure of the variation in sample-based estimates.
total gross weekly cash income of income unit: The sum of the respondent’s gross cash income and the gross cash income of their spouse/partner (where applicable). The income of any children within the unit is not included (ABS 2003).
usual daily serves of fruit: The usual number of serves of fruit consumed each day where a serve of fruit is around 150 g of fresh fruit (1 medium piece or 2 small pieces of fruit or a cup of diced fruit) or 50 g of dried fruit.

50
usual daily serves of vegetables: The usual number of serves of vegetables consumed each day where a serve of vegetables is around 75 g of vegetables (½ cup of cooked vegetables or 1 cup of salad vegetables).

51
References
Australian Bureau of Statistics 2003. National Health Survey: users’ guide, 2001. Cat. no. 4363.0.55.001. Canberra: ABS
Adams RJ, Wilson DH, Taylor AW, Daly A, d’Espaignet ET, Dal Grande E et al. 2006. Coexistent chronic conditions and asthma quality of life: a population-based study. Chest 129:285–91.
AIHW: Australian Centre for Asthma Monitoring 2005. Asthma in Australia 2005. Asthma series no. 2. Cat. no. ACM 6. Canberra: AIHW.
Annesi-Maesano I, Beyer A, Marmouz F, Mathelier-Fusade P, Vervloet D & Bauchau V 2006. Do patients with skin allergies have higher levels of anxiety than patients with allergic respiratory diseases? Results of a large-scale cross-sectional study in a French population. British Journal of Dermatology 154:1128–36.
Bender BG 2006. Risk taking, depression, adherence, and symptom control in adolescents and young adults with asthma. American Journal of Respiratory and Critical Care Medicine 173(9):953–7.
Chinn S & Rona RJ 2001. Can the increase in body mass index explain the rising trend in asthma in children? Thorax 56:845–50.
Court CS, Cook DG & Strachan DP 2002. Comparative epidemiology of atopic and non-atopic wheeze and diagnosed asthma in a national sample of English adults. Thorax 57:951–7.
Daly A & Molster C 2006. WA Health and Wellbeing Surveillance System: monitoring national health priority areas in WA. Asthma bulletin no. 1. Perth: Epidemiology Branch, Department of Health WA.
Davey G, Sedgwick P, Maier W, Visick G, Strachan DP & Anderson HR 2002. Association between migraine and asthma: matched case-control study. British Journal of General Practice 52:723–7.
DiMatteo MR, Lepper HS & Croghan TW 2000. Depression is a risk factor for noncompliance with medical treatment: meta-analysis of the effects of anxiety and depression on patient adherence. Archives of Internal Medicine 160(14):2101–7.
Faniran AO, Peat JK & Woolcock AJ 1999. Prevalence of atopy, asthma symptoms and diagnosis, and the management of asthma: comparison of an affluent and a non-affluent country. Thorax 54:606-10.
Forrest CB, Starfield B, Riley AW & Kang M 1997. The impact of asthma on the health status of adolescents. Pediatrics 99:e1–e7.
Genuneit J, Weinmayr G, Radon K, Dressel H, Windstetter D, Rzehak P et al. 2006. Smoking and the incidence of asthma during adolescence: results of a large cohort study in Germany. Thorax 61(7):572–8.
Gilliland FD, Berhane K, Islam T, McConnell R, Gauderman WJ, Gilliland SS et al. 2003. Obesity and the risk of newly diagnosed asthma in school-age children. American Journal of Epidemiology 158(5):406–15.

52
Goldney RD, Ruffin R, Fisher LJ & DH Wilson 2003. Asthma symptoms associated with depression and lower quality of life: a population survey. Medical Journal of Australia 178:437–44.
Goodwin RD, Fergusson DM & Horwood LJ 2004. Asthma and depressive and anxiety disorders among young persons in the community. Psychological Medicine 34:1465–74.
Huovinen E, Kaprio J, Laitinen LA & Koskenvuo M 1999. Incidence and prevalence of asthma among adult Finnish men and women of the Finnish Twin Cohort from 1975 to 1990, and their relation to hay fever and chronic bronchitis. Chest 115(4):928–36.
Hurwitz EL & Morgenstern H 1999. Cross-sectional associations of asthma, hay fever, and other allergies with major depression and low-back pain among adults aged 20–39 years in the United States. American Journal of Epidemiology 150:1107–16.
Kemp JP & Kemp JA 2001. Management of asthma in children. American Family Physician 63(7):1341–8.
Lee JH, Haselkorn T, Chipps BE, Miller DP, & Wenzel SE 2006. Gender differences in IgE-mediated allergic asthma in the epidemiology and natural history of asthma: outcomes and treatment regimens (TENOR) study. Journal of Asthma 43:179–84.
Mannino DM, Homa DM, Akinbami LJ et al. 2002. Chronic obstructive pulmonary disease surveillance: United States, 1971–2000. Morbidity and Mortality Weekly Report 51(SS–6):1–16.
Marks GB & Poulos LM 2005. A nationwide perspective on asthma in older Australians. Medical Journal of Australia 183(1):S14–6.
Ozge A, Ozge C, Ozturk C, Kaleagasi H, Ozcan M, Yalcinkaya DE et al. 2005. The relationship between migraine and atopic disorders—the contribution of pulmonary function tests and immunological screening. Cephalalgia 26:172–9.
Plaschke PP, Janson C, Norrman E, Björnsson E, Ellbjär S & Järvholm B 2000. Onset and remission of allergic rhinitis and asthma and the relationship with atopic sensitization and smoking. American Journal of Respiratory and Critical Care Medicine 162(3):920–4.
Porsbjerg C, von Linstow ML, Ulrik CS, Nepper-Christensen S, & Backer V 2006. Risk factors for onset of asthma: a 12-year prospective follow-up study. Chest 129(2):309–16.
Prescott E, Lange P & Vestbo J 1997. Effect of gender on hospital admissions for asthma and prevalence of self-reported asthma: a prospective study based on a sample of the general population. Copenhagen City Heart Study Group. Thorax 52:287–9.
Saint-Pierre P, Bourdin A, Chanez P, Daures JP & Godard P 2006. Are overweight asthmatics more difficult to control? Allergy 61:79–84.
Schatz M, Clark S & Camargo CA 2006. Sex differences in the presentation and course of asthma hospitalizations. Chest 129: 50–5.
Shum BOV, Mackay CR, Gorgun CZ, Frost MJ, Kumar RK, Hotamisligil GS et al. 2006. The adipocyte fatty acid-binding protein aP2 is required in allergic airway inflammation. Journal of Clinical Investigation. Viewed 19 July 2006, <www.the-jci.org/article.php?id=24767>.
Siroux V, Pin I, Oryszczyn MP et al. 2000. Relationships of active smoking to asthma and asthma severity in the EGEA study: epidemiological study on the genetics and environment of asthma. European Respiratory Journal 15(3):470–7.
Soriano JB, Visick GT, Muellerova H, Payvandi N & Hansell AL 2005. Patterns of comorbidities in newly diagnosed COPD and asthma in primary care. Chest 128:2099–107.
53
Strachan DP, Butland BK & Anderson HR 1996. Incidence and prognosis of asthma and wheezing illness from early childhood to age 33 in a national British cohort. British Medical Journal 312:1195–9.
Taylor A, Dal Grande E, Chittleborough C et al. 2002. The North West Adelaide Health Study: key biomedical findings, policy implications and research recommendations. Adelaide: South Australia Department of Human Services.
ten Brinke A, Sterk PJ, Masclee AA, Spinhoven P, Schmidt JT, Zwinderman AH et al. 2005. Risk factors of frequent exacerbations in difficult-to-treat asthma. European Respiratory Journal 26:812–8.
Varraso R, Siroux V, Maccario J, Pin I & Kauffmann F 2005. Asthma severity is associated with body mass index and early menarche in women. American Journal of Respiratory and Critical Care Medicine 171(4):334–9.
Wolfe R, Carlin JB, Oswald H, Olinsky A, Phelan PD, & Robertson F 2000. Association between allergy and asthma from childhood to middle adulthood in an Australian cohort study. American Journal of Respiratory and Critical Care Medicine 162(6):2177–81.
Wright RJ, Cohen RT & Cohen S 2005. The impact of stress on the development and expression of atopy. Current Opinion in Allergy and Clinical Immunology 5(1):23–9.
Xuan W, Marks GB, Toelle BG, Belousova E, Peat JK, Berry G et al. 2002. Risk factors for onset and remission of atopy, wheeze, and airway hyperresponsiveness. Thorax 57(2):104–9.

54
List of tables
Table 2.1: Self-reported asthma status of Australians, 2001 .........................................................4
Table 3.1: Characteristics of people with asthma, by age group, 2001......................................10
Table 3.2: Defining characteristics of people with asthma, by age group, 2001 ......................14
Table 3.3: Defining and distinguishing characteristics among people with asthma, 0–4 years, 2001 .................................................................................................................15
Table 3.4: Defining and distinguishing characteristics among people with asthma, 5–14 years, 2001 ...............................................................................................................17
Table 3.5: Defining and distinguishing characteristics among people with asthma, 15–17 years, 2001 .............................................................................................................20
Table 3.6: Defining and distinguishing characteristics among people with asthma, 18–34 years, 2001 .............................................................................................................23
Table 3.7: Defining and distinguishing characteristics among people with asthma, 35–64 years, 2001 .............................................................................................................27
Table 3.8: Defining and distinguishing characteristics among people with asthma, 65 years and over, 2001 ..................................................................................................31
Table 3.9: Distinguishing characteristics across age groups.......................................................34
Table A.1: Variables used and applicable ages..............................................................................41
Table B.1: Groupings used and values excluded from proportions ..........................................43

55
List of figures
Figure 1.1: Defining and distinguishing characteristics ...............................................................2
Figure 2.1: Age distribution by asthma status, persons, 2001 .....................................................6
Figure 3.1: Demographics, actions and risk factors, by asthma status, persons aged 0–4 years, 2001 ..............................................................................................................16
Figure 3.2: Long-term conditions, by asthma status, persons aged 0–4 years, 2001 ..............16
Figure 3.3: Demographics, actions, risk factors and outcomes, by asthma status, persons aged 5–14 years, 2001...................................................................................................18
Figure 3.4: Long-term conditions, by asthma status, persons aged 5–14 years, 2001 ............19
Figure 3.5: Demographics and actions, by asthma status, persons aged 15–17 years, 2001 ................................................................................................................................20
Figure 3.6: Risk factors and outcomes, by asthma status, persons aged 15–17 years, 2001 ................................................................................................................................21
Figure 3.7: Long-term conditions, by asthma status, persons aged 15–17 years, 2001 ..........21
Figure 3.8: Demographics and outcomes, by asthma status, persons aged 18–34 years, 2001.................................................................................................................................24
Figure 3.9: Actions and risk factors, by asthma status, persons aged 18–34 years, 2001.......25
Figure 3.10: Long-term conditions, by asthma status, persons aged 18–34 years, 2001 ..........26
Figure 3.11: Demographics and outcomes, by asthma status, persons aged 35–64 years, 2001.................................................................................................................................28
Figure 3.12: Actions and risk factors, by asthma status, persons aged 35–64 years, 2001.......29
Figure 3.13: Long-term conditions, by asthma status, persons aged 35–64 years, 2001 ..........30
Figure 3.14: Demographics and actions, by asthma status, persons aged 65 years and over, 2001.......................................................................................................................32
Figure 3.15: Risk factors and outcomes, by asthma status, persons aged 65 years and over, 2001.......................................................................................................................32
Figure 3.16: Long-term conditions, by asthma status, persons aged 65 years and over, 2001 ................................................................................................................................33