public/private partnerships: stimulating …jtscott/papers/00-10.pdfpublic/private partnerships:...
TRANSCRIPT

Public/Private Partnerships:
Stimulating Competition in a Dynamic Market
Albert N. Link Department of Economics
University of North Carolina at Greensboro Greensboro, NC 27412 Phone: (336) 334-5146 Fax: (336) 334-4089
John T. Scott Department of Economics
Dartmouth College Hanover, NH 03755
Phone: (603) 646-2941 Fax: (603) 646-2122
We thank William L. Baldwin for helpful suggestions and comments, and we are also grateful for the extensive and thoughtful comments of an anonymous referee.
Forthcoming International Journal of Industrial Organization, 2001

1
Abstract
This paper sets forth a public/private partnership competition policy that mitigates the
appropriability problems associated with innovation that occur in a dynamic market when competitive
pressures are present. We illustrate the applicability of our policy proposal using the results from an
analysis of research projects jointly funded by the Advanced Technology Program (ATP) and the
private partners. Our analysis illustrates that in the absence of ATP funding these projects would not
have been undertaken by private-sector firms, and that the social rate of return from the projects is
substantial. We also posit a mechanism whereby ATP, or any public agency, can partner with industry
to ensure that its public funds are being efficiently allocated.

2
Public/Private Partnerships:
Stimulating Competition in a Dynamic Market
I. Introduction
An effective competition policy in a dynamic market encourages innovative behavior, given the
knowledge that innovation encourages technological advance and technological advance stimulates
economic growth and the competitiveness of firms. However, technology-based competition erodes
appropriability and increases risk. Both of these factors can work against the social goals of an effective
competition policy because large firms in concentrated markets may be the outcome of a market’s
adjustments to a regime of rapid innovation. For example, if numerous firms compete through
investments in research and development (R&D), each may anticipate many competing innovations in a
post-innovation market or each may anticipate a low probability that it will itself innovate. In either
case, anticipated appropriable profits from the R&D investments may be too small, and the risk that the
post-innovation market profits for the firm would fall below its required rate of return may be too large,
to allow socially optimal innovative investments in such competitive markets. Schumpeter (1950)
reasoned that the large firms that dominate industrial markets—markets with resources concentrated in
the control of a few leading firms—would be able to use the profits from their market power in pre-
innovation markets to provide internal finance and insurance funds to cover the risks of innovative
investments.
The tradeoff between multiple independent firms competing and the benefits of coordination to
reduce risk and appropriability problems is not new to the arena of competition policy, and there are at
least two policy responses. One policy approach to deal with the tradeoff was the passage of the
National Cooperative Research Act (NCRA) of 1984 (PL-98-462). This Act culminated a five-year
effort to ease the antitrust treatment of collaborative research by creating a registration process, later
expanded by the National Cooperative Research and Production Act (NCRPA) of 1993 (PL-103-42),
under which research joint ventures (RJVs) can disclose the names of their members and their research
3
intentions to the U.S. Department of Justice. RJVs gain two significant benefits from such voluntary
filing: if subjected to antitrust action, they are evaluated under a rule of reason that considers a venture’s
effects on social welfare; and if found to fail a rule-of-reason analysis, they are subject to actual rather
than treble damages.1 However, in certain circumstances cooperative R&D may result in the loss of
socially desirable competitive pressures (Scott 1993). Competitive pressures may be desirable because
they would provide socially useful parallel paths for research or desirable diversity, but if such pressures
are incompatible with sufficient appropriability of returns, then a second policy might prove useful to
allow desirable innovative investment at the same time that competitive pressure exists.
A second policy approach to deal with the tradeoff is the one posited and evaluated in this
paper. This policy mechanism involves partial public funding of privately-performed research. The
objective of such “public/private partnership competition policy” is to mitigate the appropriability and
risk problems that would inevitably occur in a dynamic market when substantial competitive pressures
are present. Such a policy would not only complement the existing RJV-related policies, but it would
also specifically benefit small and medium-sized enterprises (SMEs). A large body of literature suggests
that SMEs face significant finance constraints.2 In particular, SMEs are most likely to face imperfect
financial markets where transaction costs preclude access to impacted information. Thus, given the
market structures now encouraged by antitrust and competition policy, SMEs may require public
funding to achieve socially desirable research.
There is a tradeoff between SMEs, that bring many independent sources of innovative ideas,
and large, dominant firms with market power. Large firms with market power may be able to realize
advantages of firm size, and their market power may stimulate R&D investment as well. In fact,
Schumpeter (1950, p. 87) emphasized that market power might be necessary to provide internal funds
for R&D investments:
We must … recognize the … fact that restrictive practices [monopoly restriction of output to raise price] … acquire a new significance in the perennial gale of creative destruction, a significance which they would not have in a stationary state or in a state of
1 Filing with the Department of Justice is distinct from the decision of whether to form an RJV or not. For a review of analyses of the formation decision see Hagedoorn, Link, and Vornortas (forthcoming). 2 See Lerner (1996), Hall (1992), Hao and Jaffe (1993), Himmelberg and Petersen (1994), and Hubbard (1998).
4
slow and balanced growth. In either of these cases restrictive strategy would produce no result other than an increase in profits at the expense of buyers except that, in the case of balanced advance, it might still prove to be the easiest and most effective way of collecting the means by which to finance additional investment. But in the process of creative destruction, restrictive practices may do much to steady the ship and to alleviate temporary difficulties.
There are typically different ways of creating innovative solutions to problems. Given the assumption
that numerous firms, perhaps to avoid rent-destroying competition in post-innovation markets,
independently pursue different solutions (Cohen and Klepper 1992, Scott 1991), society would like
competition and independent sources of initiative to survive in the market. Under such conditions,
however, it may be difficult to finance R&D. In fact, because of difficulties appropriating sufficient
returns, it may be difficult to even justify investing in R&D. The policy we set forth overcomes the
appropriability hurdle; it allows for more competitive market structures and independent sources of
innovative initiative (with associated appropriability problems as numerous competitors can benefit from
the innovative investments of any particular firm), while still generating sufficient R&D investments.
In Section II, we discuss market failure and the concomitant problem of underinvestment in
R&D. In Section III, we describe the illustrative case analysis for this paper, namely a set of privately-
performed projects that received partial public funding from the Advanced Technology Program (ATP)
at the National Institute of Standards and Technology (NIST). In Section IV, we set forth a conceptual
model for estimating the expected private rate of return and the expected social rate of return associated
with these research projects, and we implement our model using these ATP project data. Our analysis
in this section quantifies the size of the gap between the social and private rate of return. Section V
concludes the paper with a recapitulation of our quantitative estimates, and then draws on the
implications of those estimates to generalize about how policy makers might proceed to formulate a
public/private partnership competition policy to effectively stimulate innovative behavior in the private
sector. We observe that one implication of the gap between the social and private rate of return
(private rate of return with and without public support) is that “financial engineering” could be used to

5
leverage the public funds that stimulate innovative investment.3 We posit that if a bidding mechanism
were implemented, following Scott (1998), there would be net social cost savings.
II. Market Failure and Underinvestments in R&D
The purpose of this section is threefold: to provide an overview of the economic concept of
market failure, to provide interview information to demonstrate that the projects analyzed in Section III
would not have been undertaken in the absence of public ATP support, and to describe the elements of
market failure that would have brought about such an underinvestment in R&D.
A. Underinvestments in R&D
Many point to President Bush’s 1990 U.S. Technology Policy as the Nation’s first formal
domestic technology policy statement. Albeit an important initial policy effort, it however failed to
articulate a foundation for government’s role in technology. Rather, it implicitly assumed that
government had a role, and then set forth the general statement (1990, p. 2):
The goal of U.S. technology policy is to make the best use of technology in achieving the national goals of improved quality of life for all Americans, continued economic growth, and national security.
President Clinton took a major step forward from the 1990 policy statement in his 1994
Economic Report of the President by articulating first principles about why government should be
involved in the technological process (1994, p. 191):
The goal of technology policy is not to substitute the government’s judgment for that of private industry in deciding which potential ‘winners’ to back. Rather, the point is to
4
3 According to Scott (1998), financial engineering, a primarily European term, refers to the optimal amount and design of public funding of privately performed investments in technology and innovation carried out by public/private partnerships. 4 The conceptual importance of identifying market failure for policy is also emphasized, although without any operational guidance, in Office of Management and Budget (1996).

6
Subsequent Executive Office policy statements have echoed this theme; Science in the National
Interest (1994) and Science and Technology: Shaping the Twenty-First Century (1998) are the
most recent such examples.
Market failure, as we address it in this paper and of the type which could specifically be termed
“technological or innovation market failure,” refers to a condition under which the market, including both
the R&D-investing producers of a technology and the users of the technology, underinvests from
society’s standpoint in a particular technology. Such underinvestment occurs because conditions exist
that prevent organizations from fully realizing or appropriating the benefits created by their investments.
In our explanation of market failure and the reasons for market failure, we essentially reiterate and apply
the seminal work of Arrow (1962) in which he identified three sources of market failure related to
knowledge-based innovative activity—uncertainty, non-exclusivity, and public goods.
To explain, consider a marketable technology to be produced through an R&D process where
conditions prevent full appropriation of benefits. Other firms will realize some of the profits from the
innovation, and of course consumers will typically place a higher value on a product than the price paid
for it. A firm will then calculate, because of such conditions, that the marginal benefits it can receive
from a unit investment in such R&D will be less than could be earned in the absence of the conditions
reducing the appropriated benefits of R&D below their potential, namely the full social benefits. Then,
the firm may underinvest in R&D relative to what it would have chosen as its investment in the absence
of the conditions. Stated alternatively, the firm may determine that its private rate of return is less than
its private hurdle rate and therefore will not undertake socially valuable R&D.
B. Barriers to Technology
Risk and difficulties appropriating returns create barriers to technology, and as a result, there
may be an underinvestment in or underutilization of a technology. The premise that markets may fail to
undertake socially optimal amounts of R&D has long been accepted by economists and is now being

7
invoked by policy makers, as the quoted passage from President Clinton above makes clear.5 Much of
the technological market failure literature focuses on underinvestments in the creation or production of
technology through R&D. However, the arguments set forth below are generalizable to the purchase
and utilization of the technology that results from R&D.
As a starting point to discuss barriers to technology, the concept of risk must be defined. In its
most general form, risk measures the probability that actual outcomes will deviate from the expected
outcome. So defined, risk can be characterized in terms of the variance of the distribution of possible
outcomes centered around the expected outcome.
Our definition of risk, for the purpose of this paper and for the purpose of proffering a
public/private partnership competition policy, follows from the following general statement. We use a
definition of risk that is focused on the operational concern with the downside outcomes for an
investment. The shortfall of the private expected outcomes from society’s expected returns reflects
appropriability problems. As Arrow (1962) explained, investments in knowledge entail uncertainty of
two types—technical and market. The technical and market results from technology may be very poor,
or perhaps considerably better than the expected outcome. Thus, a firm is justifiably concerned about
the risk that its R&D investment will fail, technically or for any other reason. Or, if technically
successful, the R&D investment output may not pass the market test for profitability. Further, the firm’s
private expected return typically falls short of the expected social return as previously discussed. We
elaborate on this concept of downside risk in Section IV below.
There are several related technological and market factors that will cause private firms to
appropriate less return and to face greater risk than society does. These factors underlie what Arrow
(1962) identifies as the non-exclusivity and public good characteristics of investments in the creation of
knowledge. The private firms’ incomplete appropriation of social returns in the context of technical and
market risk can make risk in its operational sense unacceptably large for the private firm considering an
investment. Operationally, Tassey (1997), for example, defines risk as the probability that a project’s
rate of return falls below a required, private rate of return or private hurdle rate (as opposed to simply
5 There is an excellent theoretical and empirical literature that concludes that the private sector will underinvest in R&D because of market failures. A survey of that literature is beyond the scope of this
8
deviating from an expected return). As we illustrate below (both in concept and in terms of the specific
ATP-funded projects), for many socially desirable investments, the private firm faces an unacceptably
large probability of a rate of return that falls short of its private hurdle rate. Yet, from society’s
perspective, the probability of a rate of return that is less than the social hurdle rate is sufficiently small
that the project is still worthwhile.
There are a number of factors that can explain why a firm will perceive that its expected private
rate of return will fall below its hurdle rate. Individuals will differ not only about a listing of such factors
because they are not generally mutually exclusive, but also they will differ about the relative importance
of one factor compared to another in whatever taxonomy is agreed upon.
First, high technical risk (that is, outcomes may not be technically sufficient to meet needs) may
cause market failure given that when the firm is successful, the private returns fall short of the social
returns. The risk of the activity being undertaken is greater than the firm can accept, although if
successful there would be very large benefits to society as a whole. Society would like the investment
to be made, but from the perspective of the firm, the present value of expected returns is less than the
investment cost and is thus less than the amount yielding its acceptable return on investment.
Second, high risk can relate to high commercial or market risk (although technically sufficient,
the market may not accept the innovation—reasons can include factors listed subsequently such as
imitation or competing substitutes or interoperability issues) as well as to technical risk when the
requisite R&D is highly capital intensive. The project may require too much capital for any one firm to
feel comfortable with the outlay. The minimum cost of conducting research is thus viewed as excessive
relative to the firm’s overall R&D budget, which considers the costs of outside financing and the risks of
bankruptcy. In this case, the firm will not make the investment, although society would be better off if it
had, because the project does not appear to be profitable from the firm’s private perspective.
Third, many R&D projects are characterized by a lengthy time interval until a commercial
product reaches the market. The time expected to complete the R&D and the time until
commercialization of the R&D results are long, and the realization of a cash flow from the R&D
investment is in the distant future. If a private firm faces greater risk than society does, and as a result
report, but one recent review is in Martin and Scott (1998, 2000).

9
requires a greater rate of return and hence applies a higher discount rate than society does, it will value
future returns less than does society. Because the private discount rate exceeds the social discount rate,
there may be underinvestment, and the underinvestment increases as the time to market increases
because the difference in the rate is compounded and has a bigger effect on returns further into the
future.
Fourth, it is not uncommon for the scope of potential markets to be broader than the scope of
the individual firm’s market strategies so the firm will not perceive or project economic benefits from all
potential market applications of the technology. As such, the firm will consider in its investment
decisions only those returns that it can appropriate within the boundaries of its market strategies. While
the firm may recognize that there are spillover benefits to other markets, and while it could possibly
appropriate them, such benefits are ignored or discounted heavily relative to the discount weight that
would apply to society. A similar situation arises when the requirements for conducting R&D demand
multidisciplinary research teams; unique research facilities not generally available with individual
companies; or “fusing” technologies from heretofore separate, non-interacting parties. The possibility
for opportunistic behavior in such thin markets may make it impossible, at reasonable cost, for a single
firm to share capital assets even if there were not R&D information sharing difficulties to compound the
problem. If society, perhaps through a technology-based public institution, could act as an honest
broker to coordinate a cooperative multifirm effort, then the social costs of the multidisciplinary research
might be less than the market costs.6
Fifth, the evolving nature of markets requires investments in combinations of technologies that, if
they existed, would reside in different industries that are not integrated. Because such conditions often
transcend the R&D strategy of firms, such investments are not likely to be pursued. That is not only
because of the lack of recognition of possible benefit areas or the perceived inability to appropriate
whatever results, but also because coordinating multiple players in a timely and efficient manner is
cumbersome and costly. Again, as with the multidisciplinary research teams, society may be able to use
a technology-based public institution to act as an honest broker and reduce costs below those that the
market would face.

10
Sixth, a situation can exist when the nature of the technology is such that it is difficult to assign
intellectual property rights. Knowledge and ideas developed by a firm that invests in technology may
spill over to other firms during the R&D phase or after the new technology is introduced into the market.
If the information creates value for the firms that benefit from the spillovers, then other things being
equal, the innovating firms may underinvest in the technology. Relatedly, when competition in the
development of new technology is very intense, each firm, knowing that the probability of being the
successful innovator is low, may not anticipate sufficient returns to cover costs. Further, even if the firm
innovates, intense competition in application can result because of competing substitute goods, whether
patented or not. Especially when the cost of imitation is low, an individual firm will anticipate such
competition and may therefore not anticipate returns sufficient to cover the R&D investment costs. Of
course, difficulties appropriating returns need not always inhibit R&D investment (Baldwin and Scott
1987). First-mover advantages associated with customer acceptance and demand as well as increasing
returns as markets are penetrated and production expanded can imply that an innovator wins most of
the rewards even if it does not “take all.”
Seventh, industry structure may raise the cost of market entry for applications of the technology.
The broader market environment in which a new technology will be sold can significantly reduce
incentives to invest in its development and commercialization because of what some scholars have called
technological lock-in and path dependency.7 Many technology-based products are part of larger
systems of products. Under such industry structures, if a firm is contemplating investing in the
development of a new product but perceives a risk that the product, even if technically successful, will
not interface with other products in the system, the additional cost of attaining compatibility or
interoperability may reduce the expected rate of return to the point that the project is not undertaken.
Similarly, multiple sub-markets may evolve, each with its own interface requirements, thereby preventing
economies of scale or network externalities from being realized. Again, society, perhaps through a
technology-based public institution, may be able to help the market’s participants coordinate successful
compatibility and interoperability.
6 See Leyden and Link (1999) on the role of a federal laboratory as an honest broker.
11
Eighth, situations exist where the complexity of a technology makes agreement with respect to
product performance between buyer and seller costly. Sharing of the information needed for the
exchange and development of technology can render the needed transactions between independent
firms in the market prohibitively costly if the incentives for opportunistic behavior are to be reduced to a
reasonable level with what Teece (1980) calls obligational contracts. Teece emphasizes that the
successful transfer of technology from one firm to another often requires careful teamwork with
purposeful interactions between the seller and the buyer of the technology. In such circumstances, both
the seller of the technology and the buyer of the technology are exposed to hazards of opportunism.
Sellers, for example, may fear that buyers will capture the know-how too cheaply or use it in
unexpected ways. Buyers may worry that the sellers will fail to provide the necessary support to make
the technology work in the new environment; or they may worry that after learning about the buyer’s
operations in sufficient detail to transfer the technology successfully, the seller would back away from
the transfer and instead enter the buyer’s industry as a technologically sophisticated competitor. Once
again, if society can use a technology-based public institution to act as an honest broker, the social costs
of sharing technology may be less than market costs.
These eight factors that create, individually or in combination, barriers to technology and thus
lead to a private underinvestment in R&D are listed in Table 1. While we have discussed these factors
individually above, and have listed them in the table as if they are discrete phenomena, they are
interrelated and overlapping, although in principle any one factor could be sufficient to cause a private
firm to underinvest in R&D.
III. Overcoming Market Failure through Public/Private Partnerships
A. The Advanced Technology Program
The Advanced Technology Program (ATP) was established within the National Institute of
Standards and Technology (NIST) through the Omnibus Trade and Competitiveness Act of 1988, and
7 See David (1987) for detailed development of the ideas of path dependency in the context of business strategies and public policy toward innovation and diffusion of new technologies.
12
modified by the American Technology Preeminence Act of 1991. The goals of the ATP, as stated in its
enabling legislation, are to assist U.S. businesses in creating and applying the generic technology and
results necessary to “[c]ommercialize significant new scientific discoveries and technologies rapidly, and
refine manufacturing technologies.”8 More specifically:9
The goal of the ATP is to benefit the U.S. economy by cost-sharing research with industry to foster new, innovative technologies. The ATP invests in risky, challenging technologies that have the potential for a big pay-off for the nation’s economy. These technologies create opportunities for new, world-class products, services and industrial processes, benefiting not just the ATP participants, but other companies and industries and ultimately consumers and taxpayers as well. By reducing the early-stage R&D risks for individual companies, the ATP enables industry to pursue promising technologies which otherwise would be ignored or developed too slowly to compete in rapidly changing world markets.
ATP received its first appropriation from Congress in FY 1990, and held its first general
competition in that same year. Since 1994, ATP has sponsored a number of focused program
competitions in addition to its general competitions. According to ATP:10
[Focused programs are] multi-year efforts aimed at specific, well-defined technology and business goals. These programs, which involve the parallel development of a suite of interlocking R&D projects, tackle major technology problems with high payoff potential which cannot be solved by an occasional project coming through the general competition.
One such focused program is the Technologies for the Integration of Manufacturing Applications
(TIMA) Program. There was a TIMA competition in 1995 from which four research projects were
selected to receive ATP support, and in 1997 there was a second TIMA competition from which six
research projects were funded.
8 The term “generic technology” does not have a generally accepted definition. It is not a National Science Foundation reporting category of R&D spending (Link 1996). Tassey (1992, pp. 98-99) offers the following definition: “generic technology research is a major step in the sequential evolution of a typical industrial technology. It is the organization of scientific principles into a functional technical concept.” 9 http://www.atp.nist.gov/atp/imp_fact.htm 10 http://www.atp.nist.gov/atp/focusprg.htm

13
B. The TIMA Focused Research Program
The overall goal of the TIMA focused program is to develop and demonstrate the technologies
needed to create affordable, integrable manufacturing systems. Many manufacturing companies need to
respond more rapidly to changing markets and evolving opportunities if they are to remain competitive in
global markets. Although this need is widely recognized, manufacturers find it difficult to implement the
technologies needed for them to become more agile producers. Even highly automated plants and
factories struggle to adapt successfully and efficiently and reconfigure production processes to
accommodate design changes and new product lines. Customized systems integration efforts are often
needed to achieve such changes, but they are not undertaken primarily because of idiosyncrasies in
manufacturing software and incompatibilities among software applications.
Typically, factory-floor information systems focus on the operation of production equipment and
the control of processes. The systems communicate neither directly nor regularly with administrative
information systems, or with design and engineering systems. As a result, upstream information systems
are unaware of important manufacturing details. Middle-level information systems, known as
manufacturing execution systems (MES), bridge this critical information gap.
MES solutions, complex and burdensome as they may be, can be solved by contracting with a
large systems provider or integrator. However, once a manufacturer has incurred such a substantial
investment it is likely to become dependent on that single vendor and thereby become unaware of, or if
aware likely ignore, other vendors that may have more economical or innovative solutions. Because the
initial solution involves a re-engineering of the manufacturer’s business processes to be compatible with
requirements, even large manufacturers that can afford the up-front investment cost will by-
pass the use of MES technology.
TIMA technologies are expected to benefit a range of companies: companies that employ MES
by providing them with a wider range of powerful, integrable applications that will dramatically improve
the manufacturer’s ability to reconfigure, scale, and adapt their processes; small- and medium-sized
manufacturers by making MES more affordable and by providing a direct path toward greater
automation through incremental addition of compatible applications; and vendors of MES products by

14
expanding the market, lowering barriers to entry, stimulating innovation, and technical specialization.
Consumers may benefit from the adoption of these technologies in at least two ways, a higher quality
product and a lower priced product to the extent that greater automation increases competition.
ATP identified a contact person for each of the ten ATP-funded TIMA projects.11 We
interviewed seven individuals corresponding to eight of the ten funded projects.12 Each of these
individuals was asked: In the absence of ATP funding, would this research have been undertaken?
Three of the eight projects are single participant projects and five are joint ventures. All five of the
research joint-venture respondents answered that no, in the absence of ATP funding, the joint venture
would not have been formed and that in the absence of the joint venture their companies would not have
undertaken the research. For the three single participant projects, one respondent reported that the
research would not have been undertaken without ATP funding. One reported that maybe the research
would have been undertaken but it would have been at a reduced level. One reported that maybe the
research would have been undertaken but it would have been at a slower pace.
Respondents were asked to describe their understanding of the characteristics of technical risk
(the project being technically successful) and market risk (the project being commercially successful)
associated with the research project, and how that risk affected the fact that their company could not
have undertaken the research at all or at the same level, scope, and speed in the absence of ATP
funding. Of course, risks inherent in the project are viewed in the context of the respondent’s firm, and
we cannot be certain to what degree the perceived risk reflects risk inherent in the project and to what
11 Detailed project descriptions are available from the authors upon request. The ten projects, along with the sponsoring companies, are: Model-Driven Application & Integration Components for MES, sponsored by Vitria Technology, Inc.; An Agent-Based Framework for Integrated Intelligent Planning – Execution, sponsored by IBM Manufacturing Solutions Unit; Advanced Process Control Framework Initiative, sponsored by Honeywell Technology Center; Solutions for MES-Adaptable Replicable Technology (SMART), sponsored by National Industrial Information Infrastructure Protocols Consortium; Virtual Reality Telecollaborative Integrated Manufacturing Environment (VRTIME), sponsored by Searle; Process Integration Using Model-Driven Engines, sponsored by Vitria Technology, Inc.; Agent-Enhanced Manufacturing System Initiative, sponsored by Advanced Micro Devices; EECOMS: Extended Enterprise Coalition for Integrated Collaborative Manufacturing Systems, sponsored by IBM Corporation, CIIMPLEX; Distributed Factory System Framework; sponsored by Consilium, Inc.; ANTS Scheduling and Execution System, sponsored by Denab Robotics, Inc. 12 One respondent was the contact person for two projects. Vitria Technology, Inc. chose not to participate in this study without explanation. Vitria Technology is involved in two research projects.

15
degree it reflects the capabilities of the firm. Table 1 is used as a summary device for generalizing from
the responses given during the interviews and tallying the responses indicating the various barriers.
Again, these barriers to technology are listed as if they are discrete phenomenon, when in reality they
are interrelated. More than eight responses are recorded in Table 1; there were numerous occasions
where we inferred from the respondent’s discussion that there was more than one barrier to technology,
that is, more than one reason for their underinvestment in R&D.
The tally in Table 1 captures our interpretation of the discussions with the project leaders of the
TIMA projects. As such, the tally may underestimate the magnitude of the importance of some of the
barriers to technology that can lead to market failure. Given this caveat, at least two interesting patterns
emerge from Table 1. One, the TIMA research projects are characterized by both technical and
market risk. Technical risk is explicitly cited only twice, although it may be evident in the cases where
there are concerns about the large capital cost needed to undertake the research and in the cases of
concern about interoperability with other technologies. Market risk is primarily evident in the need for
the resulting technology (generic technology to be applied to software development) to interface with
users’ information technology. The respondents discussed with us each aspect of risk, and they
emphasized the interfacing issues and interoperability issues. We concluded those issues were the major
sources of risk contributing to market failure.
IV. Toward a Public/Private Partnership Competition Policy
A. The Conceptual Model
Jaffe (1998, p. 18) argues that for ATP to be effective in achieving its statutory objectives, it
“must try to determine which projects proposed to it will generate large spillovers …”13 His arguments
that lead to this conclusion assume that ATP should only select those projects that would not be funded
by the private sector in the absence of ATP funding, or if funded would be funded at a considerably
lower level so that only partial results would have been realized and these results would have taken

16
longer to occur. Jaffe points to a number of ATP-sponsored studies and an independent study by the
General Accounting Office. These studies conclude that ATP grantees are of the opinion that their
research would not have taken place in the absence of ATP funding or would have been funded at a
considerably lower level and hence would have taken place only partially and would have taken
considerably longer to complete. However, Jaffe’s argument also sets general parameters for a broader
public/private partnership competition policy, as we discuss in the concluding section of this paper.
Figure 1 illustrates Jaffe’s conclusion.14 The social rate of return is measured on the vertical axis
along with society’s hurdle rate on investments in R&D; the private rate of return is measured on the
horizontal axis along with the private hurdle rate on R&D. A 45-degree line (dashed) is imposed on the
figure under the assumption that the social rate of return from an R&D investment will at least equal the
private rate of return from that same investment. Two separate research projects are labeled Project A
and Project B. Each, for our purposes, is shown with the same expected social rate of return.
For project A, the private rate of return is less than the private hurdle rate because of barriers to
technology. As such, the private firm will not choose to invest in project A, although the social benefits
from undertaking the project would be great. The vertical distance marked by project A is, in the Jaffe
sense, the spillover gap; it results from the additional value society would receive above what the private
firm would receive if project A were undertaken. Project A is precisely the type of project in which the
public should invest, namely one in which the private sector would not invest because of market failure
and one from which society would greatly benefit. In contrast, project B yields the same social rate of
return as project A, but most of that return is capturable by the innovator, and the private rate of return
is greater than the private hurdle rate. Hence, project B is one in which the private sector has an
incentive to invest on its own or, alternatively stated, there is no economic justification for public funds
being allocated to support project B.
13 Jaffe does not quantify what a “large” spillover is. Neither he nor we can define such a concept in the absence of a benchmark. Rather, we present below an estimate of the size of the spillover gap that characterizes the TIMA projects. 14 See Link (1998, 1999) for a more detailed discussion of public/private partnerships and related public policy relative to this diagram.
17
Referring back to the interview information suggesting that the research projects would not have
been undertaken or would have been undertaken at a reduced level or pace, we conclude that the
TIMA research projects have similar characteristics to those of Project A in Figure 1 in that each of the
respondents views the expected private rate of return absent ATP funds to be less than his company’s
private hurdle rate. Hence, these TIMA projects are valid candidates for ATP support in the Jaffe
sense, and in the broad sense these are the types of projects that a public/private partnership
competition policy could affect.
Figure 1 is the conceptual basis for understanding the result that public funding has on projects
subject to market failure, as discussed above. And, Figure 1 is useful for motivating the formulation of
the competition policy that we set forth in Section V below. However, for completeness, it is also
important as groundwork to illustrate what happens to the entire distribution of the rate of return as ATP
(or any public agency) adds funds to a project like Project A in Figure 1. This illustration emphasizes
the concept of risk that underlies the above discussion of market failure.
ATP support of a private research project, whether it be a project with a single participant or a
joint venture, reduces the risk that characterizes the project. In terms of Figure 1, ATP’s support shifts
project A to the right so that the firm’s private rate of return is then greater than its private hurdle rate.
In Figure 2, we alternatively illustrate that reduction in risk in terms of a rightward shift in the
distribution of the rate of return for the private firms. We illustrate the rate of return in Figure 2 in order
to illustrate our previous conceptualization of operational risk. The rightward shift of the distribution,
and the concept of reducing the probability of returns lower than acceptable to the private investors,
applies equally well to the absolute level of net return (absolute return minus private investment)
expected from the project.
For each distribution in Figure 2—without ATP funding (left distribution) and with ATP funding
(right distribution)—the expected rate of return is shown.15 As drawn, with ATP funding the expected
15 Note that the expected rate of return does not necessarily correspond to the greatest frequency or probability density because the distribution of rates of return need not be symmetric.
18
private rate of return and the variance in the private rate of return from the research project will
increase. One can generalize that this will always be the case.16
Consider the left distribution—the distribution of the rate of return for the private firm without
ATP funding. As drawn, the private hurdle rate is to the right of the expected rate of return without
ATP funding, meaning that the private firm will not undertake this research because the firm will not
receive its required rate of return. The risk of the project equals the area under this without-ATP
distribution that is to the left of the private hurdle rate. For those used to thinking of the variance of the
distribution as the measure of risk, the downside risk—which is the probability of a rate of return less
than the hurdle rate—may seem unusual. Variance measures the possibility that outcomes can differ
from the expected outcome, while the downside risk measures the probability of an outcome departing
to the downside of the hurdle rate. Note that the technical risk and the market risk for the project are
reflected in the variance of the distribution—the technical goals may exceed or fall short of expectations
and market acceptance of the project’s technical outcomes may do the same. The downside risk refers
to the outcomes that fall short of the hurdle rate.
Consider the right distribution—the distribution of the rate of return for the private firm with
ATP funding. With ATP funding, the private firm will expect a return greater than its hurdle rate—the
expected private rate of return with ATP funding is drawn to the right of the private hurdle rate.17 While
ATP funding will not increase the probability that the research will be successful, assuming hypothetically
that it were undertaken absent ATP funding, it will reduce private risk by increasing the expected private
16 The expected private rate of return with ATP support is: r =[return - (total project cost - ATP funding)] / [total project cost - ATP funding]. Let Z = (total project cost - ATP funding). Then, r = (return - Z)/Z = [(return/Z) - 1]. The variance of r is: [(1/Z)2Var(return)], and it is a general proposition that as ATP funding increases (and hence Z decreases) the variance in the private rate of return increases (since (1/Z) gets larger). It is also a general proposition that the expected private rate of return = E[(return)/Z) - 1] must increase for the same reason. Further, neither the expected social rate of return nor the variance in the social rate of return change at all. The social cost is the same and the social return is the same. 17 ATP funding need not affect the firm’s private hurdle rate; that rate is set by corporate policy in most cases. Conceivably, because the operational measure of risk falls, the hurdle rate might fall as well in the presence of ATP funding, and the simulative effect of ATP funding would hold a fortiori.

19
rate of return because the expected rate of return will be based on a smaller private outlay.18 Hence,
ATP funding leverages the private firm's investment as illustrated by a greater expected return and a
greater variance in the distribution as explained above.
The shaded area in Figure 2 is what we call the downside risk of the project—that is, it is the
probability that the project will yield a rate of return less than the private hurdle rate even with ATP
funding. Hence, the amount of downside risk with ATP funding is visually less than the downside risk
associated with the research project in the without-ATP funding case.
Although we will conclude that ATP funding reduces risk, as defined operationally in terms of
reducing the probability of a rate of return below the private hurdle rate, we emphasize that our analysis
below is in no way wed to any particular measure of risk or any particular model of capital asset pricing
with associated systematic and non-systematic risk. Instead, our treatment encompasses any and all
such models because the relevant risk, however it is perceived by private firms, is captured in the
private hurdle rate, and the distributions of returns are otherwise represented by their expected values.
In describing the effect of ATP funding on the distribution of private rates of return, we are describing an
underlying reality that would be reflected in the private hurdle rate—as determined by some model—
and in the expected value of the returns. Thus, Figure 3 re-specifies Figure 1 and shows specifically the
implications of ATP funding reducing downside risk.
B. Quantifying the Conceptual Model
Based on our extensive interviews with contact individuals in the TIMA projects, we collected
quantitative information on the variables noted in the first two columns of Table 2.
We relied on these project-specific data to calculate the critical values shown above in Figure 1.
In particular, we calculate the expected social rate of return associated with the TIMA projects, isocial;
the private rate of return without ATP funding, iprivate; and the private rate of return with ATP funding,
i*private. Given our understanding developed in the interviews along with the derived estimates for these
critical values we conclude:
18 To capture the idea of limited liability for investors, we bound that return below by zero. Thus, the rate of return can be quite negative when the return falls below the amount invested, but because the return is

20
• The private rate of return to TIMA projects is less than the private hurdle rate, hence these projects
would not have been pursued absent ATP support, as initially inferred from interviews.
• There are spillover benefits to society associated with these TIMA projects as evidenced by the size
of the spillover gap, (isocial - iprivate).
For our calculation of the expected social rate of return from TIMA research projects, we
calculate a lower bound for the expected social rate of return in two different ways. One, we calculate
the expected social rate of return for each of the eight TIMA projects studied, and then we average
across the rates; and two, we first average the eight project-specific data for each relevant variable, and
then second estimate one expected social rate of return based on average data for each variable. We
will use the latter calculation in our exposition, but the results of both methods are presented. Neither of
these methods precisely characterizes the expected social rate of return to the TIMA research program,
but each approximates what might be called an expected social rate of return for an average TIMA
research project.
The calculation of the expected social rates of return using each of our two methods relies on
information collected during the telephone interviews and information published by ATP about each
project. Interview respondents were assured that their individual responses would remain confidential;
hence only the average values of interview data and derived metrics are reported herein. The mean
values and standard deviations for all of these variables are in the last two columns of Table 2.
Data related to project duration, d, total project cost, C, and the level of ATP funding, A, are
reported in ATP’s Project Brief for each project provided to us by ATP. Data on the next six
variables—r, z, F, T, m, and k—were obtained through the interview process
Respondents were asked the following question about their private hurdle rate, r: For projects
like this one, what is your company’s hurdle rate or minimum expected rate of return over the
life of the project?
Regarding the duration of the extra period of development, z, and the additional research cost
for the extra period of development, F, respondents were asked: Approximately, how soon after the
project’s completion will the technology be commercialized? And, Approximately, what is the
bounded below at zero, the rate of return is bounded below by (-100%).

21
level of the additional investment expenditures expected to be made by your company during this
period?
Once commercialized, the life of the technology, T, was determined from responses to the
question: Approximately, what is the projected life of the technology being developed?
The variable v represents the proportion of producer surplus appropriated by the project team;
larger (smaller) values of v are interpreted to mean that less (more) spillover of technical knowledge is
anticipated and thus appropriability problems are less (more) critical. From an analytical perspective,
this is a critical value for our analysis. We calculated v as the product of two information data collected
from the interviews. It equals the product of the proportion (m) of total profits anticipated from the
development and commercialization of the specific software being developed, and the proportion (k) of
all possible applications of the generic technology addressed by the specific software being researched
in the ATP project.19 Thus v, the product of these two interview elements, is the total proportion of the
value of the technology appropriable by the researching firms. Loosely speaking, and focusing on the
mean values in Table 2, the funded firms expect to appropriate about 70 percent (m) of the market
value of the software they are developing in the 20 percent (k) (by value) of the applications areas they
are focusing on. Roughly, the funded firms expect to capture about 14 percent of the profit potential of
the generic technology being developed, and 86 percent of the profit potential associated with the
generic technology being developed will spill over to imitators.
The variables L and U are discussed just below.
Given the published data in the Project Briefs and interview data on each of the variables noted
in Table 2, the first step in the calculation of the expected social rate of return is to calculate the variable
L, the lower bound for the annual expected private return from a TIMA research project. L is a
derived variable. It was derived for each of the eight projects using project-specific data as reported in
Table 2. It was also calculated separately using the averaged values of each relevant variable, as
discussed in our exposition below of the “average” TIMA project.
19 Seven of the eight participants offered an estimate of m and k. For the eighth project we imputed a value of m and k equal to the average of the reporting seven. Thus, eight observations are used for the calculation of each mean in Table 2.

22
Equation (1) consists of three general terms. Each term represents the present value for a
particular flow that is realized over a particular time period. The first term in the equation represents the
present value of the negative cash flows that result to the firm from the cost of conducting the project,
C-A, from its start to its expected completion, t=0 to d. The second term is the present value of the
future negative cash flows from the additional cost, F, of taking the generic technology from the ATP
project, at t=d, and commercializing it, at t=d+z. Finally, the third term is the present value of the
expected net cash flows from the project, L, after it has been commercialized, at t=d+z, over its
estimated life, to t=d+z+T. Note that the discount rate in equation (1) is the firm’s hurdle rate, r.
Therefore, the value for L that solves equation (1) is the value for which the private firm just earns its
hurdle rate of return on the portion of the total investment that it must finance. The firm would not invest
in the ATP project unless it expected at least L for the average annual private return so that its hurdle
rate would exactly be met. Thus, L is a lower bound estimate.
(1) ( )
( )
−−
−
+ =
⇒ −−
−
−
−
+
−
=
⇒−
− +
− −+
−
+
+ +
− −+
−
+
+ +
−
∫ ∫ ∫C A
de dt
Fz
e dt Le dt
C Ad r
eFz r
e Lr
e
C Adr
eFzr
rtd
rt
d
d zrt
d z
d z T
rtd
rt
d
d zrt
d z
d z T
rd
0
0
0
1 1 10
1
| | |
( ) ( ) − −
− =− + − − + + − +e e
Lr
e er d z rd r d z T r d z( ) ( ) ( ) 0
Given specific values for the variables d, C, A, r, z, F, and T, equation (1) is solved for the
unknown variable, L. To illustrate using the mean values for these seven variables from Table 2,
equation (1) solves for L equal to $3,883,680. Again, this derived value of L is the lower bound for the
estimate of the expected annual private return using the mean values of the relevant variables in Table 2.
Since we will illustrate the solution of the three equations that follow also using the mean values of the
relevant variables in Table 2, we will refer for ease of exposition to the solutions as those for the
“average” TIMA project.

23
The second step in the calculation of the estimated social rate of return is to calculate the
variable U, the upper bound for the expected annual private return for each TIMA project. U was
derived for each of the eight projects, by solving equation (2) using values for the variables in Table 2.
Note that the first term in equation (2) is the total negative cash flow from the cost of conducting the
research project, C. Thus, U is an upper bound for the annual private return because a return greater
than U would imply that the firm would earn a rate of return in excess of its hurdle rate in the absence of
ATP funding, and therefore ATP funding would not be required for the project. Note that all reference
to ATP is purposively absent in equation (2) because we are calculating the expected annual private
return that would result in the private firm just meeting its hurdle rate in the absence of ATP involvement.
(2)
− C
d
e
−rt dt0
d
∫ − F
z
e
− rt dtd
d+ z
∫ + Ue −rt dtd + z
d + z+T
∫ = 0
⇒ −C
d
−1
r
e
− rt
0
d
| −F
z
−1
r
e
− rt
d
d +z
| + U( ) −1
r
e
− rt
d + z
d + z +T
| = 0
⇒C
dr
e− rd −1( )+
F
zr
e −r ( d + z ) − e − rd( )−
U
r
e − r ( d + z+T ) − e − r ( d + z )( )= 0
To illustrate the solution of equation (2), values for the variables d, C, r, z, F, and T are given.
Thus, equation (2) solves for U. To illustrate using the mean values for these given variables in Table 2,
the derived value of U is $7,267,910. This value represents the upper bound of the annual private
return for the “average” TIMA project.
Using the mean values (other than L and U) in Table 2, an estimate of the average expected
annual private return to the firm is calculated as [(L+U)/2], the mean of the upper and lower bounds on
24
the average expected annual private return for the “average” TIMA project.20 The average expected
annual private return to the participating firm or firms equals v times the average expected annual return
that will be captured by all producers using the technology (producer surplus). Knowing the average
expected annual private return is [(L+U)/2)] and knowing the portion of producer surplus that is
appropriable, v, then total producer surplus equals [(L+U)/2v] and hence this value is a lower bound for
the average expected annual social return. It is a lower bound because consumer surplus has not been
measured.
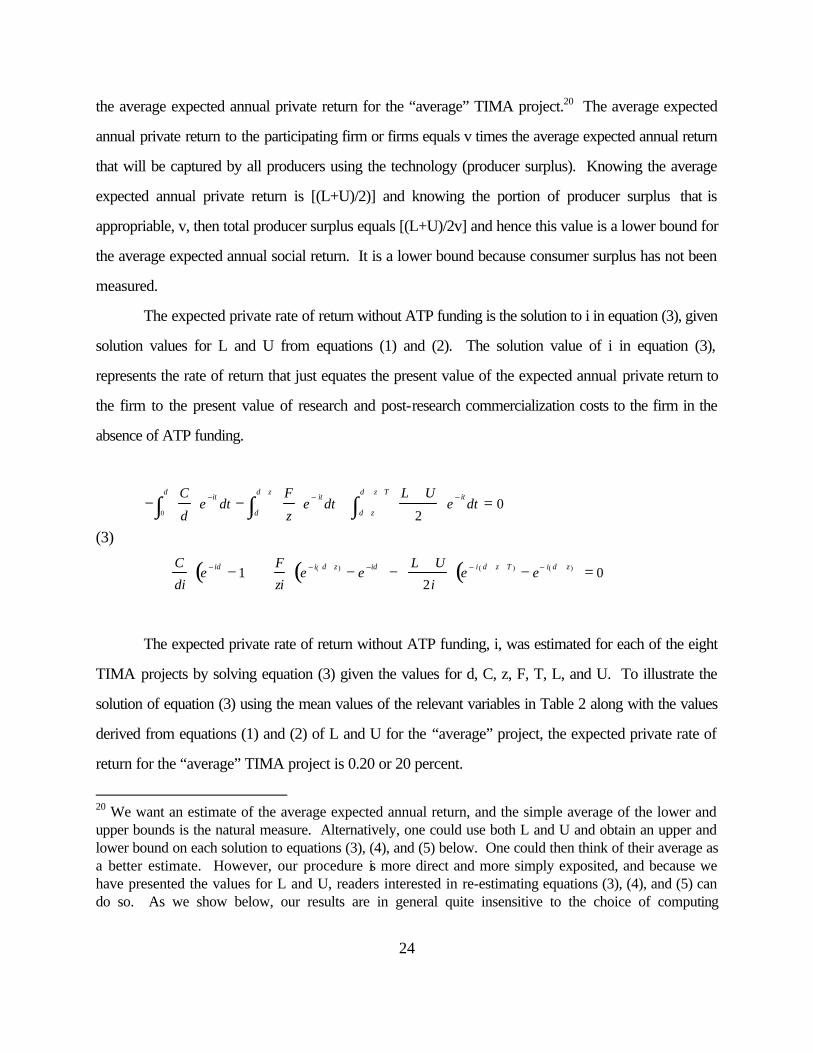
The expected private rate of return without ATP funding is the solution to i in equation (3), given
solution values for L and U from equations (1) and (2). The solution value of i in equation (3),
represents the rate of return that just equates the present value of the expected annual private return to
the firm to the present value of research and post-research commercialization costs to the firm in the
absence of ATP funding.
(3)
−C
d
e
−itdt
0
d
∫ −F
z
e
− itdt
d
d +z
∫ +L +U
2
e
− itdt
d+ z
d + z+ T
∫ = 0
⇒ C
di
e − id − 1( )+ F
zi
e − i( d+ z ) − e −id( )− L + U
2i
e − i ( d + z+ T ) − e− i( d + z )( )= 0
The expected private rate of return without ATP funding, i, was estimated for each of the eight
TIMA projects by solving equation (3) given the values for d, C, z, F, T, L, and U. To illustrate the
solution of equation (3) using the mean values of the relevant variables in Table 2 along with the values
derived from equations (1) and (2) of L and U for the “average” project, the expected private rate of
return for the “average” TIMA project is 0.20 or 20 percent.
20 We want an estimate of the average expected annual return, and the simple average of the lower and upper bounds is the natural measure. Alternatively, one could use both L and U and obtain an upper and lower bound on each solution to equations (3), (4), and (5) below. One could then think of their average as a better estimate. However, our procedure is more direct and more simply exposited, and because we have presented the values for L and U, readers interested in re-estimating equations (3), (4), and (5) can do so. As we show below, our results are in general quite insensitive to the choice of computing

25
Finally, the lower bound on the social rate of return is found by solving equation (4) for i, given
values for the other variables. Note that equation (4) is identical to equation (3) with the exception that
the average expected annual private return, [(L+U)/2], is replaced with the lower bound for the average
expected annual social return, [(L+U)/2v].
(4)
−C
d
e
−it dt0
d
∫ −F
z
e
− it dtd
d +z
∫ +L +U
2 v
e
− it dtd+ z
d + z+ T
∫ = 0
⇒ C
di
e − id − 1( )+ F
zi
e − i( d+ z ) − e −id( )− L + U
2iv
e − i ( d + z+ T ) − e− i( d + z )( )= 0
As with each of equations (1) through (3), equation (4) was estimated for each of the eight
TIMA projects. Again, to illustrate the solution of equation (4) using the average values of d, C, z, F, T,
and v from Table 2 with the derived values of L and U for the “average” project, the expected social
rate of return for the “average” TIMA project is derived to be at least 0.63 or 63 percent.
To summarize, we have extracted an expected social rate of return from our model. We first
designed a set of questions that allowed us to gather the additional information, to supplement the
information in the Project Briefs, needed to derive an estimate of the private benefit stream anticipated
by the participants. Second, we gathered information revealing the benefits created by the project that
would be captured by producers that are not participants in the project. We then had an estimate of the
total producers’ benefits from the project to compare with the project’s costs. Thus, we use the private
participant’s expected benefits and the project’s costs to compute the private expected rate of return.
We use the total expected benefits, to all producers whether they are participants or not, to compare to
the total costs for the project to compute the lower bound on the social rate of return. It is a lower
bound, because we have not measured the consumer surplus created by the project for the ultimate
consumers of the final goods that are made using the project's technology.
disaggregated metrics and then aggregating across individual results, versus aggregating variables and computing a single aggregated metric.

26
We can summarize the findings from our analysis for the “average” TIMA research project,
based on the mean values in Table 2 (excepting those for L and U) and the derived values from
equations (1) through (4). There are two important points to be made. First, the average expected
private rate of return in the absence of ATP funding is 20 percent, clearly less than the average private
hurdle rate of 25 percent since the estimate of the upper bound for the average cash flows would just
allow the hurdle rate to be reached. Thus, in the absence of ATP funding the TIMA firms would not
have undertaken this research, and in fact they expressed this fact explicitly as noted earlier. Second,
the expected social rate of return associated with ATP’s funding of the TIMA projects is at least 63
percent, and hence the projects are expected to be socially valuable.
As discussed above, we estimated equations (1) through (4) for each of the eight projects.
Doing so, we derived eight values for L and eight values for U (the averages for these values are shown
in Table 2 and are somewhat higher than the single values derived for the “average” project and
reported in the text), and eight lower bound estimates of the expected social rate of return—one set of
rates for each TIMA project. For each of the eight projects, just as for the “average” project, the
private rate of return without ATP funding of course falls short of the private hurdle rate, yet because of
the spillovers the projects are all socially valuable. The average of the eight expected private rates of
return absent ATP funding is 19 percent (0.19 with a standard deviation of 0.06); the average expected
social rate of return is 72 percent (0.72 with a standard deviation of 0.22). These derived rates of
return are observably close to our “average” project’s private and social rates of return of 20 percent
and 63 percent respectively. Thus, we are comfortable using these figures to characterize the “average”
TIMA project.
Our broad-brush approach to estimating the various rates of return does not try to build in more
detail for the model than the data can support. For example, instead of trying to develop the details of
an unknown diffusion pattern for the generic technology, we estimated the average expected annual
return over the lifetime of the technology. Our methodology gives a reasonable fix on the average
expected annual private returns to the ATP project participants because we can solve for what they
must be expecting as lower and upper bounds, and then we average the two expectations. What we do
not know with certainty is the multiplier to apply to the participants’ average annual expected returns to

27
estimate returns to all producers. Our multiplier is based on the interview responses that estimate the
variables m and k, and hence v. We do not have a good estimate of the lag from d+z, when the ATP
project’s technology is commercialized, until the technology is imitated not only by producers copying
the particular application of the generic technology but also by producers developing new applications
of the generic technology. Thus, because there will be some lag before imitation and because there will
be some development costs for producers using the generic technology, the net average expected
annual earnings to all producers using the generic technology will be somewhat less than [(L+U)/2v]
unless diffusion is instantaneous and costless. For the particular information technology that we are
studying, the diffusion may well be relatively quick and additional development costs may well be
minimal; however, the possibility that it is not the case can be modeled by lowering our multiplier (1/v)
to reflect the fact that if diffusion is not rapid, then the ATP participants’ average annual returns are
actually a larger proportion of the average social returns than the proportion v. To estimate the
sensitivity of our results to the speed of the diffusion of the technology, we varied v in the following
experiment. If v is increased by 10 percent, the estimated social rate of return for the “average” TIMA
project falls from 63 percent to 61 percent; if v is increased by 50 percent, the estimated social rate of
return falls to 54 percent; and if v is increased by 100 percent, the estimated social rate of return falls to
47 percent. Thus, our conclusion that ATP’s TIMA projects are socially valuable is robust with respect
to the parameter v when it is increased to capture slower diffusion rates (and any development costs to
be netted out) for the applications of the generic technology.21
It is important to re-emphasize that the profit potential of the generic technology being
developed that is appropriated by the TIMA firms represents producer surplus. Our analysis does not,
as we have previously stated, attempt to capture consumer surplus, and of course consumer surplus
would not be appropriated by the researching firms. Thus, when we refer to a lower bound estimate of
the expected social rate of return we are explicitly acknowledging that there are social benefits to the
consumer surplus generated from the TIMA research-based software, but we are just not capturing
them. Thus, our social rate of return estimate for the “average” TIMA project is clearly a lower-bound
estimate.
21 We thank Jeanne Powell of the ATP for raising this interesting issue.
28
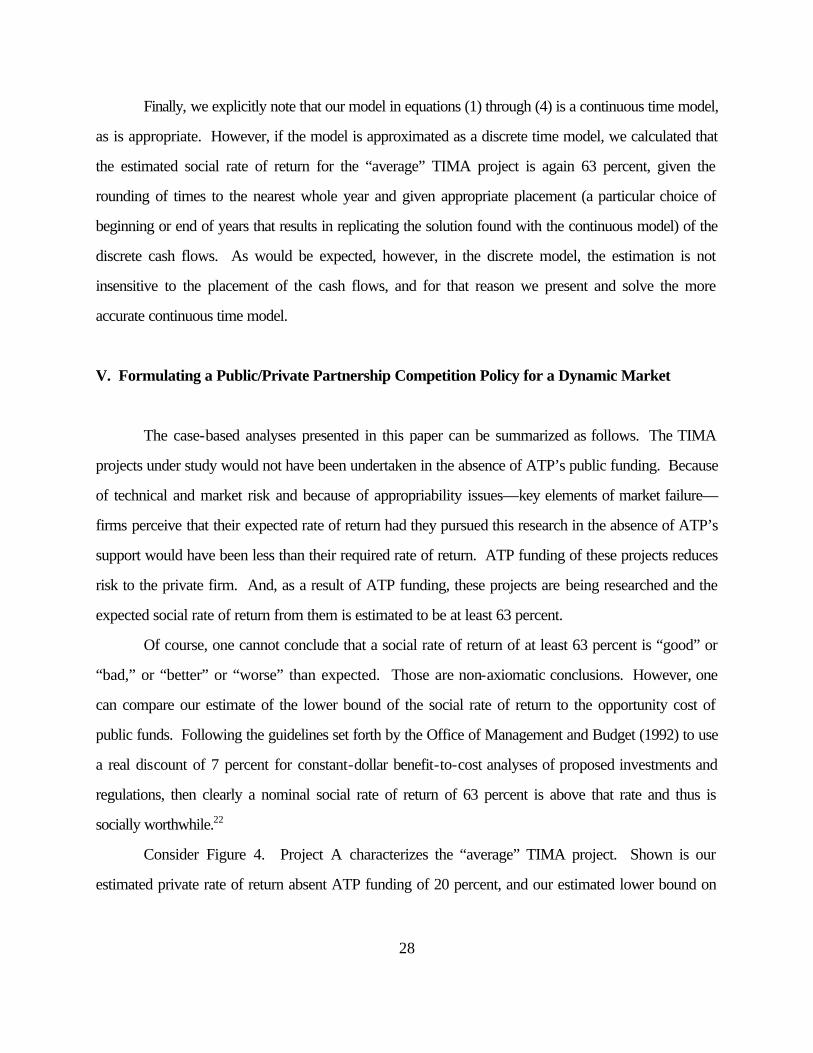
Finally, we explicitly note that our model in equations (1) through (4) is a continuous time model,
as is appropriate. However, if the model is approximated as a discrete time model, we calculated that
the estimated social rate of return for the “average” TIMA project is again 63 percent, given the
rounding of times to the nearest whole year and given appropriate placement (a particular choice of
beginning or end of years that results in replicating the solution found with the continuous model) of the
discrete cash flows. As would be expected, however, in the discrete model, the estimation is not
insensitive to the placement of the cash flows, and for that reason we present and solve the more
accurate continuous time model.
V. Formulating a Public/Private Partnership Competition Policy for a Dynamic Market
The case-based analyses presented in this paper can be summarized as follows. The TIMA
projects under study would not have been undertaken in the absence of ATP’s public funding. Because
of technical and market risk and because of appropriability issues—key elements of market failure—
firms perceive that their expected rate of return had they pursued this research in the absence of ATP’s
support would have been less than their required rate of return. ATP funding of these projects reduces
risk to the private firm. And, as a result of ATP funding, these projects are being researched and the
expected social rate of return from them is estimated to be at least 63 percent.
Of course, one cannot conclude that a social rate of return of at least 63 percent is “good” or
“bad,” or “better” or “worse” than expected. Those are non-axiomatic conclusions. However, one
can compare our estimate of the lower bound of the social rate of return to the opportunity cost of
public funds. Following the guidelines set forth by the Office of Management and Budget (1992) to use
a real discount of 7 percent for constant-dollar benefit-to-cost analyses of proposed investments and
regulations, then clearly a nominal social rate of return of 63 percent is above that rate and thus is
socially worthwhile.22
Consider Figure 4. Project A characterizes the “average” TIMA project. Shown is our
estimated private rate of return absent ATP funding of 20 percent, and our estimated lower bound on

29
the social rate of return of 63 percent. Hence the spillover gap associated with the average TIMA
project is at least 43 percent.
In comparison to these estimates, we calculated the private rate of return with ATP funding to
be 33 percent. This rate comes from the solution to equation (5) for i, given the mean values of d, C, A,
z, F, and T from Table 2 and the derived values of L and U from equations (1) and (2).
(5)
−C − A
d
e
− itdt
0
d
∫ −F
z
e
−itdt
d
d+ z
∫ +L + U
2
e
− itdt
d + z
d + z +T
∫ = 0
⇒ C − A
di
e − id − 1( )+ F
zi
e − i ( d+ z ) − e− id( )− L + U
2i
e− i ( d + z+ T ) − e − i( d + z )( )= 0
The estimated rate of return with ATP funding of 33 percent is perhaps reasonably close to the
private hurdle rate of 25 percent.23,24 Had ATP funding been greater (less), the estimated rate of return
with ATP funding would have been greater (less). However, there is no way for ATP to have
calculated the optimal level of funding for these TIMA projects unless, as part of the focused program
22 Link and Scott (1998) discuss the use of this guideline for NIST economic impact assessments. 23 Our estimation procedure has not forced the closeness of these rates. Although greater ATP funding (an increase in A) has no effect on our estimate of U, it does of course require that our estimate of L and hence of [(L+U)/2] be lower. However, the initial private investment (C-A) falls as ATP funding increases, and that effect dominates causing our estimate of the private rate of return to increase as ATP funding increases. For example, if ATP funding for the average TIMA project were increased by 50 percent, our estimate of the private rate of return with ATP funding would have risen from 33 percent to 42 percent. 24 The expected private rate of return with ATP funding was calculated for each of the eight projects. The mean of these eight rates is 0.35 or 35 percent, with a standard deviation of 0.094.
30
proposal, all relevant data, including hurdle rates, could have been assessed.25 In the absence of such
information, which in practice would be difficult to obtain because of, if nothing else, self-serving
reporting by proposers, the funding scheme that ATP has implemented appears to be close to optimal.26
In principle, a bidding mechanism could be used by ATP to ensure that the private participants
in TIMA research projects earn just a normal rate of return. Such a bidding mechanism is what Scott
(1998) refers to as a hurdle-lowering auction.
Motivated by the case analysis of the ATP-funded TIMA projects, a broad public/private
partnership competition policy should address three broad questions:
(1) How can the public get the best private partner for each partnership?
25 The reader will note that it is mathematically possible to solve equation (5) for the level of ATP funding, A*, that would equate the estimated private rate of return with ATP funding to the hurdle rate of 25 percent. Such an exercise may lack policy relevance in the sense that the calculation has the benefit of hindsight and information collected after ATP funding was allocated and furthermore we do not know the true weights for our estimated upper and lower bounds. We assume the equal weights of 0.5 for each, but although our basic conclusions about the relation between the social and private rates of return are not sensitive to that assumption, the calculation of A* is dependent on whether the actual expected annual returns are closer to the upper or the lower bound. We believe it is safer for the ATP funding to be on the “high side” in any case. In a separate study (Hall, Link, and Scott 1998), we have found that greater ATP funding dramatically reduced the probability of termination of ATP information technology projects. The theoretical reason is clear; having more ATP funds shifts the distribution of the project to the right and lowers the probability that the private participants in the project, who are constantly monitoring the progress of the project, would want to terminate the project because the probability of an unacceptably low rate of return was too high. 26 The above findings should be interpreted in light of three particular limitations of this paper. First, the conclusions presented here are based in part on interview data collected from a key participant in each TIMA project. As such, there is obviously some uncertainty built into the expressed estimates, although they are the best point estimates available. Perhaps more important, this interview information may be time dependent, meaning that it was collected at this particular early point in the progress of the research project. As such, the estimates presented herein are not definitive estimates to be expected at the completion of each project, but rather characterizations of the expected social benefits at this point in time. Second, we have referred to our lower bound estimate of 63 percent—although this caveat refers to any of the calculated social rates of return—as a metric to characterize the “average” TIMA project. And third, our analyses have not specified any diffusion paths. We refrained from going beyond the limits of our data and did not attempt to model much less quantify when in time rivals will imitate the participants’ applications of the generic technology, or when in time others will commercialize other aspects of the generic technology. Still, with these limitations in mind, it appears at this point in the progress of the TIMA projects that they are socially worthwhile.

31
(2) How can society determine the optimal level of public funding for the partnership, not too much yet
enough to overcome the underinvestment resulting from market failure?
(3) How can society avoid the potential for opportunistic behavior to which both the government and
the private sector’s partners are exposed?
Below we list several premises that we argue should motivate the formulation of a public/private
competition policy, along with the implementation implications of those premises.
Premise 1: The private sector knows more than the government about the investment
characteristics of the technology projects—or at least has the resources to make the best estimate of the
streams of returns and the risk.
Implication 1: A competition policy should include a mechanism for setting up a public/private
partnership that provides the incentive for private parties to determine who is best suited to be the
private partner in a public/private partnership.
Premise 2: The government desires to overcome the project’s underinvestment resulting from
market failure and to do so at the least cost to the public.
Implication 2: A competition policy should include a mechanism that gives the selected private
partner for the public/private partnership an incentive to undertake the desired level of investment while
providing a proportion of the project’s funding that is consistent with a normal expected private rate of
return given the appropriability and risk characteristics of the project.
Premise 3: All parties related to the public/private partnership want to overcome the potential
for opportunistic behavior by the other party.
Implication 3: Policy should include a mechanism that provides both the public- and the
private-sector partners an incentive to participate in the project in a way that maximizes the total value
of the project’s expected outcome rather than the value to the individual partner that could of course use
opportunistic behavior to benefit at the expense of the overall project’s results.
General characteristics of the mechanism design: What are the general characteristics of
the optimal mechanism design for public/private partnerships that will achieve the desired incentives for
the private sector to choose the best private partner, for the private partner(s) to carry out the desired

32
amount of investment at the least cost to the public, and for avoiding opportunistic behavior by either the
public or the private partner?
Consideration of the questions suggests that the optimal mechanism design for what we
advocate and call a public/private competition policy would have the private parties use a contingent
valuation method to bid for the right to be the private partner. In particular, the bidding could be a
hybrid bidding mechanism that combines an up-front bid, a periodic payment bid, and finally a royalty
bid: private firms would bid for the right to be the private partner in the public/private partnership
project that the government would fund.27 Alternatively, instead of bids being accepted directly from
the companies that will be performing the R&D, private venture capital companies that would manage
the public investments might bid for the rights to manage the projects.
As a simple example of how a bidding process would deliver the public funding to a
public/private partnership such as any of the TIMA projects discussed in this paper, consider the
following. Suppose that from society's perspective, an R&D investment project would cost $100 now
and generate the expectation of $130 in one year and nothing thereafter. Suppose further that the
threshold rate of return justifying public funding—society’s hurdle rate—is 10 percent. Thus, the R&D
project yields a social rate of return of 30 percent, which exceeds society’s hurdle rate of 10 percent,
and of course the net present value of [(130/(1.1))-100] is greater than zero. Suppose that from a
private perspective the project costs $100 and, because of incomplete appropriation of returns, yields
the expectation of just $105 in one year. Suppose further that given the private risk the private hurdle
rate is 15 percent. Thus, the private sector would not undertake the project which has an internal rate
of return of 5 percent, which is less than the hurdle rate of 15 percent; and, of course, net present value
is then negative.
In the context of the foregoing example, which conceptually describes each of the TIMA
projects, the bidding process would work as follows. The government announces that it will “buy” the
27 There is a large literature describing bidding mechanisms in great detail. McAfee and McMillan (1987) provide an excellent review, and they set out the general hybrid mechanism with the up-front bid as well as the royalty bid. Hansen (1985) and Samuelson (1986) provide analyses of the royalty bidding and bidding for the up-front fee and the royalty rate simultaneously.

33
R&D project, paying the $100 investment cost.28 The government then opens the bidding for the right
to be the private partner in the public/private partnership. Private firms will bid the amount $X such that
$X(1.15) = $105, implying that $X = $91.30. The cost to the public of the project would then be
$8.70. With great uncertainty about the future returns, the use of royalty bidding rather than the up-
front bidding can yield more to the government. Also, private firms with better capabilities for doing the
project would be expected to bid higher than those firms that are less well suited to the project.
Suppose the ATP, or the government in general, wanted to use a public/private partnership to
develop a project. It would announce that it would provide an up-front payment of $F to support the
R&D investment project to be conducted by the winning bidder in an auction to determine the private
partner(s) for the public/private partnership (and when there are several partners as in an RJV we are
viewing the RJV as the partner). Further, the government pledges to provide a periodic flow of funds
$C throughout the project’s life to support the flow costs of the R&D project. The fixed cost $F, and
the flow cost $C, correspond to the typical abstraction of the structure of costs for R&D investment
projects.29 Bidders vie for the right to be the private partner in the project by submitting a three-part
bid—first a bid for how much the private firm will pay the government up-front, and second a bid on the
periodic flow payment during the life of the R&D project, and third a bid on the royalty rate that it
would pay the government on the innovation produced by the public/private partnership and licensed
(perhaps exclusively) to the private partner.
As McAfee and McMillan (1987) make clear, in the context of the appropriate combinations of
assumptions about the characteristics of the asset being auctioned and the participants in the auction and
their beliefs about the value of the asset, there are nontrivial choices to be made about the exact nature
of the auction. Apart from the usual choices for auctions in general, there would be choices specific to
the new institutional use of auctions to determine the private partner for the public/private partnership.
For example, institutional arrangements must be designed to ensure that the government’s payments of
$F and $C go solely for the purchase of R&D investments; the private partner’s profits from the R&D
28Martin and Scott (forthcoming) provide detailed discussion of the circumstances in which market failure and underinvestment would be expected to occur; the discussion is needed to inform the identification of projects that would be funded. 29 See Lee and Wilde (1980).

34
investment project will come after the innovation is introduced. However, for this paper, full details of
the ideal auction in different circumstances will not be developed. Instead, the paper presents the basic
idea and observes that the three-part bidding mechanism proposed has the potential for leveraging
public funding optimally. Should the Advanced Technology Program have undertaken such a hurdle-
lowering auction ex ante, in terms of Figure 4, the expected rate of return to the TIMA projects with
ATP funding (actually estimated to be 33 percent in our model) would not have exceeded the project
participant’s private hurdle rate (25 percent). Hence, society would have been better off in terms of a
more optimal allocation of R&D resources.
Finally, two things must be emphasized. First, the high social rates of return estimated and
reported for the TIMA projects are very conservative, lower-bound estimates because they do not
include consumer surplus in the benefit stream. The profits that will be generated by the technology are
obviously a small proper subset of the social benefits that the technology will generate, but the estimation
method measures only the return in the form of profits to the innovator and to other producers of the
technology. Second, one might be skeptical about the TIMA respondents’ earnest belief that the
projects would not have been undertaken, or at least would not have been undertaken to the same
extent or at the same speed, without ATP funding. If the research would have occurred without public
funding, the estimated upper bound and hence the average of the upper and lower bounds for expected
private returns would be too low, and the actual lower bounds for the social rates of return would be
even higher than we have estimated. Further, the gap between the social and private rates of return
would remain, although that would not in itself justify the public funding of the projects.

35
Table 1: Factors Creating Barriers to Technology in the TIMA Projects
1. High technical risk associated with the underlying R&D 2 2. High capital costs to undertake the underlying R&D 6 3. Long-time to complete the R&D and commercialize the resulting technology 1 4. Underlying R&D spills over to multiple markets and is not appropriable 7 5. Market success of the technology depends on technologies in different industries 2 6. Property rights cannot be assigned to the underlying R&D 5 7. Resulting technology must be compatible and interoperable with other technologies 7 8. High risk of opportunistic behavior when sharing information about the technology 0

36
Figure 1: Spillover Gap Between Social and Private Rates of Return to R&D
Social Rate of Return Private Hurdle Rate 450 A B Social Hurdle Rate Private Rate of Return

37
Figure 2: Private Risk Reduction Resulting from ATP Funding
without ATP funding
with ATP funding
rate of return
expected rate of return without ATP funding
expected rate of return with ATP funding
hurdle rate
0
shaded area: RISK with ATP funding — the probability that private participants will fail to receive their required (hurdle) rate of return

38
Figure 3: Spillover Gap Between Social and Private Rates of Return to ATP-Funded TIMA Research
Social Rate of Return Private Hurdle Rate isocial 450 A without ATP A with ATP iprivate Social Hurdle Rate iprivate r i*private Private Rate of Return

39
Table 2 : Descriptive Statistics on Values Used in the Estimation of the Social Rate of Return (n=8)
Variable Definition Mean Standard Deviation
d duration of the ATP project 2.51 years 0.578 C total cost of the ATP project $12,749,125 1.16e+07 A ATP funding $6,421,875 5.48e+06 r private hurdle rate 0.25 0.063 z duration of the extra period of development 1.03 years 0.619 F additional cost for the extra period of development
$1,644,784 1.35e+06
T life of the commercialized technology 7.69 years 3.96 m proportion of producer surplus appropriated by the
participants in their particular application of the generic technology
0.675
0.152
k proportion of total applications of the generic technology developed by the project addressed by the participants’ applications
0.216
0.118
v proportion of producer surplus appropriated 0.135 0.071 L lower bound for expected annual private return to
investing firm $5,250,439
5.59e+06
U upper bound for expected annual private return to the investing firm
$9,885,615
1.05e+07
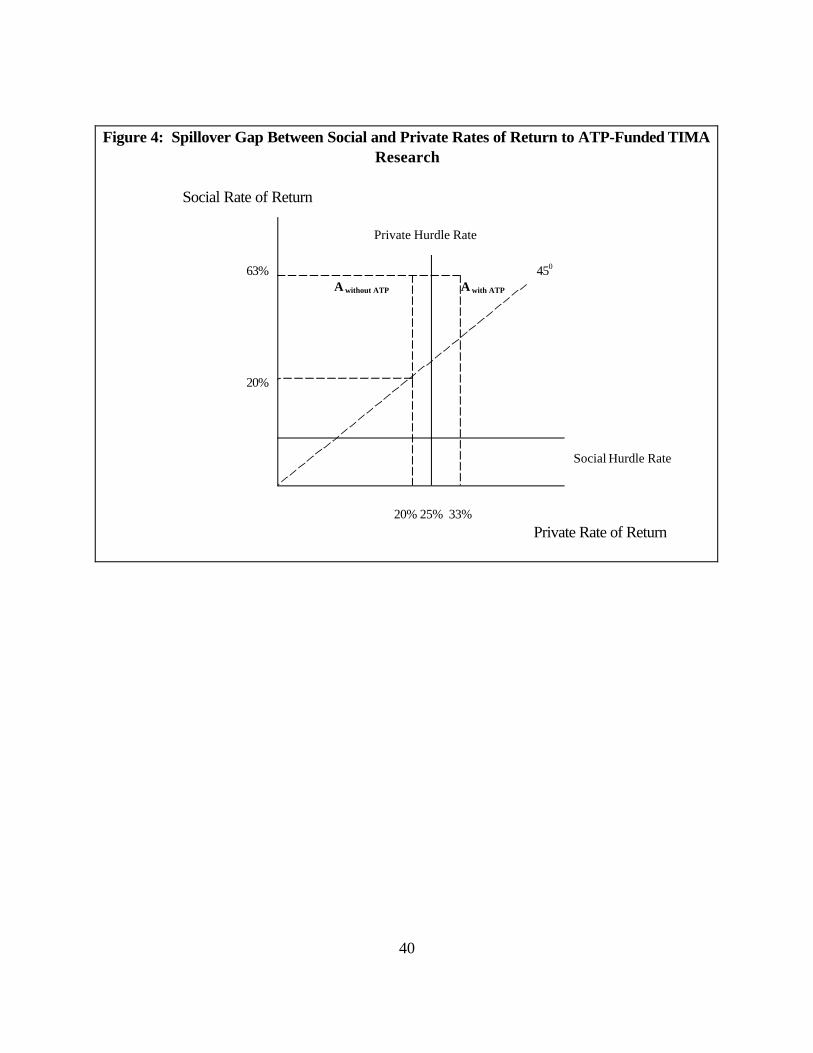
40
Figure 4: Spillover Gap Between Social and Private Rates of Return to ATP-Funded TIMA Research
Social Rate of Return Private Hurdle Rate 63% 450 A without ATP A with ATP 20% Social Hurdle Rate 20% 25% 33% Private Rate of Return

41
References
Arrow, K.J., 1962. Economic welfare and the allocation of resources for invention. In Universities-National Bureau Committee for Economic Research, The Rate and Direction of Inventive Activity. Princeton University Press, Princeton, pp. 609-625. Baldwin, W.L., Scott, J.T., 1987. Market structure and technological change. Harwood Academic Publishers, London. Cohen, W.M., Klepper, S., 1992. The tradeoff between firm size and diversity in the pursuit of technological progress. Small Business Economics 4, 1-14. David, P.A., 1987. Some new standards for the economics of standardization in the information age. In Dasgupta, P., Stoneman, P. (Eds.), Economic Policy and Technological Performance, Cambridge University Press, Cambridge, England, pp. 206-239. Economic Report of the President, 1994. Government Printing Office, Washington, DC. Executive Office of the President, 1990. U.S. technology policy. Office of Science and Technology Policy, Washington, DC. Hagedoorn, J., Link, A.N., Vonortas, N., forthcoming. Research partnerships. Research Policy. Hall, B.H., 1992. Investment and research and development: Does the source of financing matter? University of California at Berkeley Working Paper No. 92-194. Hall, B.H., Link, A.N., Scott, J.T., 1998. Universities as partners in ATP-funded research projects. Preliminary final report submitted to the Advanced Technology Program. Hansen, R.G., 1985. Auctions with contingent payments. American Economic Review 74, 862-865. Hao, K.Y., Jaffe, A.B., 1993. Effect of liquidity on firms’ R&D spending. Economics of Innovation and New Technology 2, 275-282. Himmelberg, C.P., Petersen, B.C., 1994. R&D and internal finance: A panel study of small firms in high-tech industries. Review of Economics and Statistics 76, 38-51. Hubbard, R.G., 1998. Capital-market imperfections and investment. Journal of Economic Literature 36, 193-225.

42
Jaffe, A.B., 1998. The importance of ‘spillovers’ in the policy mission of the Advanced Technology Program. Journal of Technology Transfer 23, 11-19. Lee, T., Wilde, L.L., 1980. Market Structure and Innovation: A reformulation. Quarterly Journal of Economics 94, 429-436. Lerner, J., 1996. The government as venture capitalist: The long-run impact of the SBIR program. NBER Working Paper 5753. Leyden, D.P., Link, A.N., 1999. Federal laboratories as research partners. International Journal of Industrial Organization 17, 572-592. Link, A.N., 1996. On the classification of R&D. Research Policy 25, 379-401. Link, A.N., 1998. Public/private partnerships as a tool to support industrial R&D: Experiences in the United States. Final report prepared for the working group on technology and innovation policy, division of science and technology at OECD. Link, A.N., 1999. Public/private partnerships in the United States. Industry and Innovation 6, 191-216. Link, A.N., Scott, J.T., 1998. Public accountability: Evaluating technology-based institutions, Kluwer Academic Publishers, Norwell, Massachusetts. McAfee, R.P., McMillan, J., 1987. Auctions and bidding. Journal of Economic Literature 25, 699-738. Martin, S., Scott, J.T., 1998. Financing and leveraging public/private partnerships. Final report prepared for the working group on technology and innovation policy, division of science and technology at OECD. Martin, S., Scott, J.T., 2000. The nature of innovation market failure and the design of public support for private innovation. Research Policy 29, 437-447. Office of Management and Budget, 1992. Circular No. A-94: Guidelines and discount rates for benefit-cost analysis of federal programs. Washington, DC. Office of Management and Budget, 1996. Economic analysis of federal regulations under Executive Order 12866. Washington, DC. Office of Science and Technology Policy, 1994. Science in the national interest. Executive Office of the President, Washington, DC.

43
Office of Science and Technology Policy, 1998. Science and technology: Shaping the twenty-first century. Executive Office of the President, Washington, DC. Samuelson, W.F., 1986. Bidding for contracts. Management Science 32, 1533-1550. Schumpeter, J.A., 1950. Capitalism, Socialism and Democracy, Harper & Row, New York. Scott, J.T., 1991. Research diversity induced by rivalry. In Acs, Z.J., Audretsch, D. (Eds.), Innovation and Technological Change, Harvester-Wheatsheaf, London, pp. 132-151. Scott, J.T., 1993. Purposive diversification and economic performance. Cambridge University Press, Cambridge, England. Scott, J.T., 1998. Financing and leveraging public/private partnerships: The hurdle-lowering auction. STI Review 23, 67-84. Tassey, G., 1992. Technology infrastructure and competitive position, Kluwer Academic Publishers, Norwell, Massachusetts. Tassey, G., 1997. The economics of R&D policy. Quorum Books, Westport, Connecticut. Teece, D.J., 1980. Economies of scope and the scope of the enterprise. Journal of Economic Behavior and Organization, September 1, 223-247.