published by: the herpetologists' league source
TRANSCRIPT

BioOne sees sustainable scholarly publishing as an inherently collaborative enterprise connecting authors, nonprofitpublishers, academic institutions, research libraries, and research funders in the common goal of maximizing access tocritical research.
Changes in Plasma Chemistry and Reproductive Output ofNesting LeatherbacksAuthor(s): Shaya Honarvar , Micah C. Brodsky , Daniel B. Fitzgerald , Karen L.Rosenthal , and Gail W. HearnSource: Herpetologica, 67(3):222-235. 2011.Published By: The Herpetologists' LeagueDOI: http://dx.doi.org/10.1655/HERPETOLOGICA-D-10-00061.1URL: http://www.bioone.org/doi/full/10.1655/HERPETOLOGICA-D-10-00061.1
BioOne (www.bioone.org) is a nonprofit, online aggregation of core research in thebiological, ecological, and environmental sciences. BioOne provides a sustainable onlineplatform for over 170 journals and books published by nonprofit societies, associations,museums, institutions, and presses.
Your use of this PDF, the BioOne Web site, and all posted and associated contentindicates your acceptance of BioOne’s Terms of Use, available at www.bioone.org/page/terms_of_use.
Usage of BioOne content is strictly limited to personal, educational, and non-commercialuse. Commercial inquiries or rights and permissions requests should be directed to theindividual publisher as copyright holder.

CHANGES IN PLASMA CHEMISTRY AND REPRODUCTIVE OUTPUTOF NESTING LEATHERBACKS
SHAYA HONARVAR1,4, MICAH C. BRODSKY
2, DANIEL B. FITZGERALD1, KAREN L. ROSENTHAL
3,AND GAIL W. HEARN
1
1Drexel University, Department of Biology, 3141 Chestnut Street, Philadelphia, PA 19104, USA2Dolphins Plus, 31 Corinne Place, Key Largo, FL 33037, USA
3University of Pennsylvania, School of Veterinary Medicine, Department of Clinical Studies, 3900 Delancey Street,Philadelphia, PA 19104, USA
ABSTRACT: Africa’s Gulf of Guinea, a major nesting ground for the critically endangered Leatherback SeaTurtle (Dermochelys coriacea), is experiencing rapid economic development. This study reports on theplasma biochemistry and packed cell volume (PCV) of turtles (55 samples collected from 23 individuals)nesting on Playa Moaba, Bioko Island, Equatorial Guinea. Because energy reserves and other resources in anindividual are finite and turtles may not feed between nesting episodes, decreasing trends are expected incertain plasma biochemical concentrations and PCV values, as well as maternal investment in reproductiveoutput (clutch size and egg mass). Calcium, potassium, sodium, phosphorous, plasma total protein, albumin,and globulin concentrations changed significantly with increasing number of nesting events, but remainedwithin reported intervals in reptiles. Packed cell volume decreased significantly as the number of nestingevents per individual increased. Although clutch size did not change, egg mass decreased significantly withincreasing number of nesting events. The observed trends may be due to depletion of energy reserves andother resources during reproduction in a possible fasting state, and to the associated physiological stress.
Key words: Bioko Island; Dermochelys coriacea; Egg mass; Packed cell volume; Plasma biochemistry;Reproductive output
BECAUSE INTERNAL ENERGY RESERVES arelimited in an organism, the life histories ofoviparous species often reflect tradeoffs in theuse of resources for current and futurereproduction (Congdon, 1989; Congdon andGibbons, 1987). Reproductive investment ofmost oviparous ectothermic vertebrates, inwhich there is rarely any posthatching parentalcare, is limited to resource allocation to thenumber and size of eggs and clutch frequency(Congdon, 1989). Leatherback Sea Turtles(Dermochelys coriacea) are known to havethe highest reproductive output in reptiles,with each egg weighing on average 80 g, andwith individuals laying an average of 80 eggsper clutch and 7–9 clutches per nesting season(Miller, 1997; Wallace et al., 2007). Individualanimals may continue this reproductive invest-ment every 2–4 yr for more than 20 yr (Miller,1997; Spotila et al., 1996). This reproductivebiology, combined with the possibility thatleatherbacks may be fasting during the nestingseason (Owens, 1980; Wallace et al., 2006a),can be expected to influence plasma biochem-istry parameters and hematological values.
Blood health indices have been studiedpreviously in members of the family Chelonii-dae. Blood biochemistry parameters and hem-atological values have been reported in adultand juvenile Green Sea Turtles (Cheloniamydas; Aguirre and Balazs, 2000; Bolten andBjorndal, 1992; Hasbun et al., 1998), adultforaging Green Sea Turtles (Whiting et al.,2007), adult and subadult Loggerhead SeaTurtles (Caretta caretta) in the wild andcaptivity (Day et al., 2007; Kakizoe et al.,2007; Lutz and Dunbar-Cooper, 1987), andin Kemp’s Ridley Sea Turtles (Lepidochelyskempii) in the wild and captivity (Carminatiet al., 1994; Stabenau et al., 1991; Turnbull etal., 2000). Even though there are numerousstudies on blood indices in cheloniid turtles,there are few published studies (Deem et al.,2006; Innis et al., 2010) on blood indices of theLeatherback Sea Turtle, which is the solesurviving species in the family Dermochelyi-dae. In general, to obtain reference intervalsfor blood indices it is ideal to collect bloodsamples from a large number of healthyanimals of both sexes at different life stages.Due to the challenges associated with captur-ing and handling Leatherback Sea Turtles, the4CORRESPONDENCE: e-mail, [email protected]
Herpetologica, 67(3), 2011, 222–235
E 2011 by The Herpetologists’ League, Inc.
222

most cost-effective approach to obtain andmonitor these parameters is to collect bloodsamples from nesting females on the beach.Such approaches must acknowledge the po-tential effects of reproduction on blood bio-chemistry parameters and hematological values.To our knowledge, no studies have trackedbiochemical and hematological values withinindividual sea turtles during the nesting season.
Annual and seasonal variation in clutch size(number of eggs) has been analyzed in anumber of sea turtle species (Bjorndal andCarr, 1989; Frazer and Richardson, 1985;Mortimer and Carr, 1987). Loggerhead SeaTurtle and Green Sea Turtle clutches laidduring the end of the reproductive seasonwere significantly smaller than earlier clutches(Frazer and Richardson, 1985; Mortimer andCarr, 1987). Conversely, Green Sea Turtles inTortugero, Costa Rica, laid smaller clutchesearly in the reproductive season and largerclutches later in the nesting season (Bjorndaland Carr, 1989). However, the increasingtrend in clutch size at the population level inGreen Sea Turtles nesting at Tortugero wasexplained by the proportion of recruits (first-time nesters) vs. remigrants, where remigrantsproduced larger clutches than the recruits(Bjorndal, 1980). In a Leatherback Sea Turtlepopulation on Isla de Culebra, Puerto Rico,clutch size decreased at the population levelover 3 yr but did not change at the individuallevel within a reproductive season (Tuckerand Frazier, 1994). Although clutch-size var-iation within a reproductive season exists forsome sea turtle populations (Bjorndal, 1980;Bjorndal and Carr, 1989; Frazer and Richard-son, 1985; Mortimer and Carr, 1987; Tuckerand Frazier, 1994) and geographically within ataxon (Bjorndal, 1980; Bjorndal and Carr,1989; Mortimer and Carr, 1987), the potentialseasonal variations in egg mass at the popu-lation and the individual levels remain poorlyunderstood for sea turtles.
The Gulf of Guinea contains one of theworld’s largest nesting populations of thecritically endangered Leatherback Sea Turtle(Sounguet et al., 2004; Witt et al., 2009). Thisregion has seen rapid economic expansion asthe result of more than a decade of offshorepetroleum exploration and development(Witherington et al., 2009). Due to the
importance of this region for the future survivalof leatherbacks, and the potential threat of anenvironmental disaster from increasing oilproduction, it is important to obtain adequatebaseline data on these populations as well as tounderstand how biochemical concentrationschange throughout an individual’s life history.Proper management of Leatherback Sea Tur-tles requires health data specific to this speciesdue to their unique physiology. These data canbe used in future conservation and manage-ment practices, such as comparative studies ofclinically normal and diseased turtles (Aguirreand Balazs, 2000; Bolten and Bjorndal 1992;Norton et al., 1990), or as indicators ofexposure to contaminants (Lutcavage et al.,1995).
The objectives of this study were threefold:(1) to determine the plasma biochemical andpacked cell volume (PCV) reference intervalsfor Leatherback Sea Turtles nesting on BiokoIsland; (2) to assess the variation in plasmabiochemical parameters and PCV withinindividuals during consecutive nesting eventsthroughout the reproductive season; and (3) toassess variation in egg mass and clutch sizewithin individuals during consecutive nestingevents throughout the reproductive season.
MATERIALS AND METHODS
Study Site
This study was conducted from November toDecember 2008, at Playa Moaba, Bioko Island,Equatorial Guinea (3u14900.480N, 8u37951.000E;datum 5 WGS84). Playa Moaba is a 2.2-km blacksand beach located within the Gran Caldera andSouthern Highlands Scientific Reserve. Fourspecies of turtles (Leatherback Sea Turtle; GreenSea Turtle; Olive Ridley Sea Turtle [Lepidochelysolivacea]; and Hawksbill Sea Turtle [Eretmo-chelys imbricate]) nest along Bioko’s southerncoast, with leatherbacks predominantly nestingon Playa Moaba (Butynski, 1996; Rader et al.,2006). The nesting season on Bioko Islandcorresponds with the dry season, occurring fromSeptember to April and peaking in late Decem-ber (Rader et al., 2006; Tomas et al., 2010).
Physical Examination
The health status of Leatherback SeaTurtles was rated using (1) a visual body
September 2011] HERPETOLOGICA 223

examination, (2) nest-building behavior, and(3) body condition score (BCS) from 1(emaciated) to 5 (obese). For the visual bodyexamination, a description of lesions orinjuries was recorded and the longest dimen-sion was measured. This examination alsoincluded the number and location of anyepibiotic organisms. Nest-building behaviorwas described by recording the times andduration of various nesting activities, includ-ing construction of the body pit, digging of theegg chamber, oviposition, and covering ofthe nest. Standard curved carapace length(SCCL) and Standard curved carapace width(SCCW) were measured at least three timesand averaged.
Blood Collection and Analysis
Blood samples (n 5 55) were collectedfrom 23 individual turtles during differentnesting events in one reproductive season.Blood collection was initiated prior to anyother invasive procedure and immediatelyafter the onset of egg deposition. Venipunc-ture was performed at the bifurcation of theinterdigital vessels (IDV) of a posterior flipper(Deem et al., 2006; Wallace and George,2007). If that site was unavailable or unpro-ductive, then the dorsal cervical sinus (DCS)was used (Owens and Ruiz, 1980). Prior tovenipuncture, the appropriate site was pre-pared with alternating wipes of povidone–iodine surgical scrub and ethanol. Blood wascollected into a 3-mL syringe using a 20-gauge, 3.8-cm needle for the IDV or a 20-gauge, 11.4-cm spinal needle for the DCS. A3-mL lithium heparin tube (BD-Diagnostics,Pre-Analytical Systems, Franklin Lakes, NJ07417, USA) was filled directly from thesyringe (needle removed from the syringeand cap removed from the vacuum tube) with2.5 mL of whole blood for PCV and plasmabiochemistry analysis. Blood samples wereplaced on instant cold packs immediately afterphlebotomy and transported to the on-site labfor processing.
Blood was analyzed for plasma biochemis-try parameters and PCV values within 2 h ofcollection. Whole blood was placed in un-treated hematocrit tubes and centrifugedusing the Stat Spin MP Multipurpose centri-fuge (IRIS International Inc., Norwood, MA
02062, USA) to obtain PCV. The lithiumheparin tubes were centrifuged for 10 min at1100 g (Medilite centrifuge, Thermo Scien-tific, Ashville, NC 28806, USA). Plasma totalprotein (TP) was measured using a handheldrefractometer (Atago U.S.A., Inc., Bellevue,WA 98005, USA) calibrated at the site.
Plasma (100 mL) was decanted from thelithium heparin tube and analyzed in the fieldusing a VetScan VS2 chemistry analyzer(AbaxisH, Union City, CA 94587, USA). Onlysamples with no visual signs of hemolysis wereanalyzed. Comprehensive Diagnostic Profileand Avian and Reptilian Plus Profile rotorswere used to measure the following biochem-istry parameters: albumin, alkaline phospha-tase (ALP), alanine aminotransferese (ALT),amylase, aspartate aminotransferase (AST),bile acids (BA), blood urea nitrogen, calcium,creatinine, creatine kinase, globulin, glucose,potassium, sodium, phosphorous, total biliru-bin (TBIL), and uric acid. The first sample,and every fifth sample thereafter, was ana-lyzed in triplicate to monitor for the precisionof the analyzer. Due to a shortage of Compre-hensive Diagnostic Profile rotors, the precisionstudy was performed only on the Avian andReptilian Plus Profile rotors. Human-derivedserum with known values was used to test theaccuracy of the VetScan VS2 analyzer.
Reproductive Output
All individual Leatherback Sea Turtles weremarked with Passive Integrated Transpondertags (AVID Identification Systems, Inc.,Norco, CA 92860, USA) during or afteroviposition (Dutton and McDonald, 1994),but never before blood collection. Duringoviposition, the number of eggs was countedand approximately 20 of the eggs wereweighed in situ (Ohaus Scout field balance,200 6 0.01 g; Ohaus Corp., Pine Brook, NJ07058, USA). The number and weight ofshelled albumin gobs (SAGs) were not includ-ed in these measurements.
Statistical Analyses
Mean, SE, and 95% CI were calculated foreach plasma biochemistry parameter and PCVvalue to determine reference intervals for thisnesting population. Means and SEs for SCCLand SCCW were also calculated.
224 HERPETOLOGICA [Vol. 67, No. 3

To assess whether there were trends inplasma biochemistry parameters and PCVvalues, nest-building activities (duration ofegg chamber construction, oviposition, andcovering of the nest) and reproductive output(egg mass and clutch size) during the repro-ductive season, repeated-measures ANOVAswere conducted on animals for which three ormore nesting events were recorded. These datapoints were not always collected on consecu-tive nesting events due to logistical issues, butthe turtles were observed to nest at eachnesting event. Plasma biochemistry parametersand PCV values, egg chamber construction(n 5 7), oviposition (n 5 11), covering of thenest (n 5 11), egg mass (n 5 7), and clutch size(n 5 11) were treated as continuous responsevariables. The time of nesting event was a fixedindependent variable and turtle identity wastreated as a random factor. There wereinsufficient data for duration of body pitconstruction to be included in this analysis.
Temporal effects on biochemical parame-ters, nest building activity, and reproductiveoutput were tested via full vs. reduced-modelcomparisons. Five different models were usedin these analyses: (1) curvilinear changesbetween nesting events (full model) with both(a) different slopes for each turtle and (b)similar slopes for each turtle, (2) linear changesbetween nesting events (reduced model) withboth (a) different slopes for each turtle and (b)similar slopes for each turtle, and (3) no changebetween nesting events. Separate submodelcomparisons were performed to test for thesignificance of each factor, and the resultingchi-square and P-values are reported. Allstatistical analyses were performed using R2.11.1 (lme4 package for mixed models; RDevelopment Core Team, 2010).
RESULTS
Physical Examination
All nesting turtles were rated as healthy basedon physical examination as well as ability to nestsuccessfully (n 5 23). No animals received aBCS of 1, 2, or 5. Twenty individuals were givena BCS of 3, and three individuals received a BSCof 4. All turtles maintained their assigned BCSfor the duration of this study. Mean SCCL andSCCW were 150.0 6 2.75 cm and 108.18 6
2.25 cm, respectively. Visual body examinationsrevealed that 13 individuals had scars located ontheir shoulders and front flippers, with a meanscar length of 6.45 6 1.97 cm. Nine individualshad superficial acute to subacute wounds ontheir necks, heads, or shoulders, with a meanwound length of 4.88 6 1.48 cm. An additionalnine individuals had fully healed small holes intheir front and rear flippers, with a mean holelength of 2.33 6 0.95 cm. Only seven turtles hadattached barnacles, with five individuals havingfewer than five barnacles and two individualscarrying 20–25 barnacles. Epibiotic loads for allturtles occurred exclusively on the neck andshoulders. One individual’s mandibular beak wasmissing from the rostral notch to the caudo–ventral aspect of the left orbit. Another individ-ual displayed marked kyphosis of the carapace.
Leatherbacks spent 15.90 6 1.22 minconstructing a body pit and 26.68 6 2.35 mindigging the egg chamber. There was a sta-tistically significant curvilinear relationship induration between digging the egg chamberand the number of nesting events (x2 5 5.22,df 5 1, P 5 0.02). The duration of diggingincreased from the first through the fourthnesting event, and decreased during the fifthnesting event (Fig. 1). There were no signif-icant differences in duration of oviposition(11.13 6 0.47 min; x2 5 2.40, df 5 1, P 5
FIG. 1.—Changes in duration of egg chamber construc-tion by Leatherback Sea Turtles (Dermochelys coriacea)throughout the nesting season. Nesting event numberrepresents consecutive clutches laid by individual turtles.Each symbol connected with a line represents nestingevents for an individual turtle (n 5 7). P-values forsignificant variation over nesting events are given in thegraph, where duration of egg chamber construction is thefixed independent variable and individual turtles weretreated as random factors. The thick black line is the best-fit trend line among individuals.
September 2011] HERPETOLOGICA 225

0.12) or nest covering (57.74 6 3.90 min;x2 5 0.87, df 5 1, P 5 0.35) for differentnesting events.
Reference Intervals
Mean, SE, and reference intervals forplasma biochemistry parameters and PCVvalues are presented in Table 1. To excludepotential bias in reporting reference intervalsusing serial blood samples, mean and SE for
first-time nesters are also reported in Table 1.A subset of these samples (n 5 20) was alsorun on Comprehensive Diagnostic Profilerotors. Every fifth sample was analyzed intriplicate to test for precision, and human-derived serum with known values was used totest the accuracy of the VetScan VS2 analyzer.No significant differences were detected inthe accuracy of the analyzer. In the precisionstudy, the coefficient of variance (CV) wascalculated only for plasma biochemistry pa-rameters that were present on the Avian andReptilian Plus Profile rotors. The CV fordifferent plasma biochemical parameters was,5% in all cases, except for creatine kinase, inwhich the CV values ranged 0.5% to 46%(Table 2). The concentrations for BA (n 5 55)and creatinine (n 5 20), which are notreported in Table 1, were lower than thedetectable range of the blood chemistryanalyzer, and were given as ,35 and ,0.2,respectively. Plasma TP was measured in 54samples. None of the samples used in theanalysis showed visible signs of hemolysis,icterus, lipemia, or lymph contamination.However, the VetScan VS2 chemistry analyzer
TABLE 1.—Plasma biochemistry concentrations and packed cell volume (mean 6 SE) in free-ranging Leatherback SeaTurtles (Dermochelys coriacea) nesting on Bioko Island, Equatorial Guinea. Biochemical concentrations are given for allsampled turtles (55 samples taken from 23 individuals) and for first-time nesters (individual turtle’s first clutch of the
season). Reference intervals are given as 95% CIs.
Parametersa
All sampled leatherback turtles First-time nesters
n Mean 6 SE Reference interval n Mean 6 SE
Albumin (g/dL) 55 1.77 6 0.03 1.30–2.24 16 1.82 6 0.08ALP (U/L) 20 52.35 6 1.53 30.10–74.60 3 38.33 6 2.19ALT (U/L) 18 8.83 6 0.39 3.20–14.46 2 9.00Amylase (U/L) 20 345.85 6 8.99 215.13–476.57 3 291.33 6 11.70AST (U/L) 55 125.9 6 3.27 78.28–173.48 16 128.77 6 6.60BUN (mg/L) 6 2.33 6 0.07 1.32–3.34 1 2.00Calcium (mg/dL) 55 11.16 6 0.25 7.50–14.83 16 11.35 6 0.55Creatine kinase
(U/L) 52 146.87 6 21.08 NAb–453.31 16 151.43 6 34.64Globulin (g/dL) 55 2.40 6 0.04 1.8–2.99 16 2.40 6 0.09Glucose (mg/dL) 55 86.34 6 1.83 59.77–112.91 16 86.44 6 3.28Phosphorous
(mg/dL) 55 12.19 6 0.16 9.85–14.52 16 12.03 6 0.27Potassium
(mmol/L) 55 4.07 6 0.05 3.30–4.85 16 4.38 6 0.11Sodium (mmol/L) 55 140.27 6 0.37 134.83–145.70 16 140.31 6 0.54TBIL (mg/dL) 20 0.21 6 0.003 0.16–0.25 3 0.20Uric acid (mg/dL) 45 0.39 6 0.01 0.23–0.55 16 0.40 6 0.02TP (g/dL) 54 5.08 6 0.10 3.60–6.56 16 5.01 6 0.23PCV (%) 55 36.4 6 0.59 27.83–44.97 16 37.63 6 0.91
a ALP, alkaline phosphatase; ALT, alanine aminotransferase; AST, aspartate aminotransferase; BUN, blood urea nitrogen; TBIL, total bilirubin; PCV, packedcell volume; TP, total protein. Only the upper limit is presented for creatine kinase because the lower limits were negative values.
b NA 5 not applicable.
TABLE 2.—Coefficient of variance (CV) for plasma bio-chemistry parameters from nesting Leatherback Sea Turtles(Dermochelys coriacea) obtained from analyzer precisiontests. Values are given as percentages and the ranges
represent minimum and maximum CV per parameter.
Parametersa CV (%)
Albumin (g/dL) 0.00–5.00AST (U/L) 0.40–2.75Calcium (mg/dL) 0.41–3.63Creatine kinase (U/L) 0.51–45.98Globulin (g/dL) 0.00–4.56Glucose (mg/dL) 0.00–1.52Phosphorous (mg/dL) 0.40–1.87Potassium (mmol/L) 0.00–5.00Sodium (mmol/L) 0.40–2.00Uric acid (mg/dL) 0.00–5.00
a AST, aspartate aminotransferase.
226 HERPETOLOGICA [Vol. 67, No. 3

rated 27 samples as no hemolysis (score 5 0),23 samples as mild hemolysis (score 5 1), 5samples as hemolysis (score 5 2), and anumber of samples not included in theanalysis as severe hemolysis (score 5 3).Two samples taken from the DCS werediscarded due to visual lymph contamination.Concentrations of PCV, TP, and potassium
were similar for samples taken from the DCSand IDV, suggesting that significant lymphcontamination in DCS samples was not anissue (Crawshaw and Holz, 1996).
Plasma Biochemistry and PCV Trends
There were statistically significant changes inplasma biochemistry parameters and PCV values
FIG. 2.—Changes in concentrations of biochemical factors in Leatherback Sea Turtles (Dermochelys coriacea)throughout the nesting season. The values for (A) calcium, (B) sodium, (C) phosphate, (D) potassium, (E) aspartateaminotransferase, (F) glucose, (G) albumin, and (H) globulin change significantly with increasing nesting event number.Nesting event number represents consecutive clutches laid by individual turtles. Each symbol connected with a linerepresents nesting events for an individual turtle (n 5 11). P-values for significant variation over nesting events are givenin the graphs, where each biochemical concentration is the fixed independent variable and individual turtles weretreated as random factors. Thick black lines are best-fit trend lines among individuals.
September 2011] HERPETOLOGICA 227

during a reproductive season (n 5 11; Figs. 2and 3). The best-fit model for all analyzed datawas linear with a constant slope, unless statedotherwise. All measured electrolytes—calcium(x2 5 24.89; df 5 1; P , 0.0001), potassium (x2
5 16.81; df 5 1; P , 0.0001), sodium (x2 5 6.52;df 5 1; P 5 0.01), and phosphate (x2 5 8.58; df5 1; P 5 0.003)—decreased significantly withincreasing number of nesting events (Fig. 2A–D). Albumin (x2 5 24.32; df 5 1; P , 0.0001)and globulin (x2 5 26.04; df 5 1; P , 0.0001)also decreased significantly with increasingnumber of nesting events (Fig. 2G,H). Glucose(x2 5 6.79; df 5 1; P 5 0.009) and AST (x2 56.43; df 5 1; P 5 0.04) were best fit by acurvilinear model, with AST decreasing and
glucose first decreasing then later increasing(Fig. 2E,F). The PCV (x2 5 20.95; df 5 1; P ,0.0001) and TP (x2 5 10.34; df 5 1; P 5 0.001)both decreased significantly with increasingnumber of nesting events (Fig. 3A,B).
Reproductive Output
Egg mass decreased significantly within indi-viduals (n 5 7) during the reproductive season(Fig. 4). Egg mass also decreased with increasingnumber of nesting events (x2 5 12.32; df 5 1;P , 0.0005), with the mass of each eggdecreasing by 1.48 g on average per nestingevent. There was no significant difference inclutch size (78.15 6 2.98) with increasingnumber of nesting events (x2 5 0.79; df 5 1;P 5 0.38).
DISCUSSION
Physical Examination
All reasonable efforts were made to excludeturtles with signs of disease. Of the 23 turtlessampled, all received a BCS of 3 or 4 and werein good physical condition. No turtles exhibiteddermal lesions of significant size or depth, andnone had visible indications of infection. Noturtles carried heavy epibiotic loads, and allexhibited biological reproductive parameters
FIG. 3.—Changes in packed cell volume and totalprotein in Leatherback Sea Turtles (Dermochelys coria-cea) throughout the nesting season. The values for (A)packed cell volume and (B) total protein decreasedsignificantly with increasing nesting event number.Nesting event number represents consecutive clutcheslaid by individual turtles. Each symbol connected with aline represents nesting events for an individual turtle (n 511). P-values for significant variation over nesting eventsare given in the graphs, where packed cell volume andtotal protein are fixed independent variables and individ-ual turtles were treated as random factors. Thick blacklines are best-fit trend lines among individuals.
FIG. 4.—Changes in egg mass of Leatherback SeaTurtles (Dermochelys coriacea) throughout the nestingseason. Average egg mass decreased with increasingnesting event number. Nesting event number representsconsecutive clutches laid by individual turtles. Eachsymbol connected with a line represents nesting eventsfor an individual turtle (n 5 7). P-values for significantvariation over nesting events are given in the graph, whereegg mass is a fixed independent variable and individualturtles were treated as random factors. The thick blackline is the best-fit trend line among individuals.
228 HERPETOLOGICA [Vol. 67, No. 3

that were similar to those of other populations.Based on physical examination and reproduc-tive parameters, the turtles sampled in thisstudy represented a healthy component of thebreeding population (Deem et al., 2006).
The curvilinear relationship between theduration of digging the egg chamber andincreasing number of nesting events (Fig. 1)may be explained by precipitation patternsduring the study period. The initial increase induration occurred during 4 wk of periodic rainevents, whereas the slight decrease coincidedwith a 2-wk dry spell. It is possible that themoisture content of the sand during the initialperiod of rain resulted in longer egg-chamberconstruction times, although individual energyreserves may also have played a role in thesechanges.
Reference Intervals
Mean plasma biochemistry concentration forALT, amylase, AST, and calcium were mostdissimilar from published values for leather-backs (Table 1; Deem et al., 2006; Innis et al.,2010; Rostal et al., 1996). In this study, ALT washigher (8.83 6 0.39 U/L, SE, n 5 18) than innesting leatherbacks in Gabon (4.0 6 0.5 U/L,SE, n 5 9; Deem et al., 2006) and lower than inforaging leatherbacks in the northwesternAtlantic (11 6 2.36 U/L, SE, n 5 18; Inniset al., 2010). Although ALT values in leather-backs seem to be lower than the values reportedin other reptiles (interval, 10–30 U/L), they aresimilar to the values reported in Kemp’s RidleySea Turtles (3.91 6 0.53 U/L, SE, n 5 60;Carminati et al., 1994) and are likely indicativeof species-specific variation. The differencenoted between the leatherbacks in Gabon andthose in Playa Moaba could be due to adifference in testing methodology between adry-slide chemistry analyzer (Kodak 750 X R,Ortho Clinical Diagnostics, Rochester, NY14626, USA) used at the University of Miami(Deem et al., 2006) and the VetScan VS2chemistry analyzer used in the field in thisstudy. The mild amounts of hemolysis in thisstudy were unlikely to have contributed tothis difference. If hemolysis were significantenough to affect biochemical concentrations ina sample, the VetScan VS2 would havesuppressed the results.
Amylase concentrations were lower (345.856 8.99 U/L, SE, n 5 20) than those fornesting leatherbacks in Gabon (681.0 63.98 U/L, SE, n 5 10; Deem et al., 2006).Because plasma amylase concentrations in-creased during digestion, one possible expla-nation for this discrepancy would be thepotential for opportunistic feeding by theanimals in Gabon. A decrease in amylasewas noted between net-captured Kemp’sRidley Sea Turtles and cold-stunned Kemp’sRidley Sea Turtles, the latter of which wouldpresumably not be foraging (Carminati et al.,1994). In addition, the study in Gabon wasconducted later in nesting season relative tothe present study and used different testingmethodology.
Aspartate aminotransferase was lower inturtles at Playa Moaba (125.9 6 3.27 U/L, SE,n 5 55) than those in Gabon (165.0 6 2.26U/L, SE, n 5 10) and the northwesternAtlantic (286 6 63.4 U/L, SE, n 5 18), or incomparison with previously reported concen-trations in Green Sea Turtles (Bolten andBjorndal, 1992; Hasbun et al., 1998; Whitinget al., 2007), Kemp’s Ridley Sea Turtles, andLoggerhead Sea Turtles (Carminati et al.,1994; Day et al., 2007; George, 1997), but stillwithin the interval of chelonians reportedelsewhere (interval, 100–350 U/L; Campbell,1996). Although little is known about thetissue distribution of AST in sea turtles, ASTconcentrations are not considered to beorgan-specific in reptiles (Campbell, 2004;Day et al., 2007; Evans, 1996). Despite this,significant increases are clinically suggestiveof damage to liver or muscle, where thehighest AST concentrations are often found(Campbell, 1996). Aspartate aminotransferasehas been reported to be elevated in sea turtleswith fibropapillomatosis (Aguirre et al., 1995;Norton et al., 1990; Whiting et al., 2007).Significantly elevated AST concentrationswere also found in an apparently healthyGreen Sea Turtle population that consistedmostly of new recruits (Whiting et al., 2007).Potential explanations for this discrepancy, inaddition to methodological differences alreadydescribed, include interspecific variation,small sample size, and potentially undetecteddiseases in animals that are reported to behealthy.
September 2011] HERPETOLOGICA 229
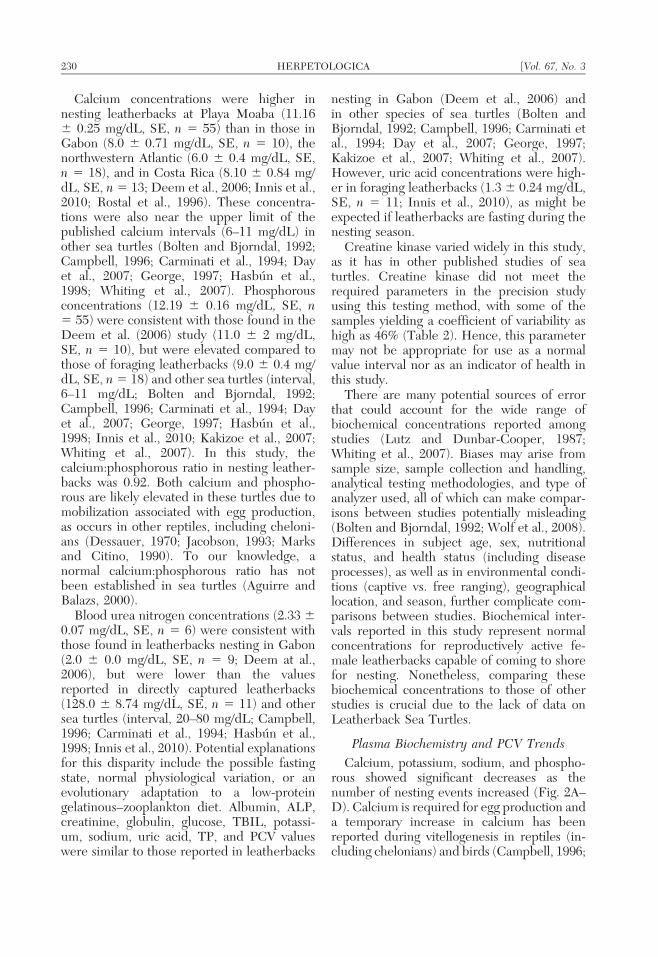
Calcium concentrations were higher innesting leatherbacks at Playa Moaba (11.166 0.25 mg/dL, SE, n 5 55) than in those inGabon (8.0 6 0.71 mg/dL, SE, n 5 10), thenorthwestern Atlantic (6.0 6 0.4 mg/dL, SE,n 5 18), and in Costa Rica (8.10 6 0.84 mg/dL, SE, n 5 13; Deem et al., 2006; Innis et al.,2010; Rostal et al., 1996). These concentra-tions were also near the upper limit of thepublished calcium intervals (6–11 mg/dL) inother sea turtles (Bolten and Bjorndal, 1992;Campbell, 1996; Carminati et al., 1994; Dayet al., 2007; George, 1997; Hasbun et al.,1998; Whiting et al., 2007). Phosphorousconcentrations (12.19 6 0.16 mg/dL, SE, n5 55) were consistent with those found in theDeem et al. (2006) study (11.0 6 2 mg/dL,SE, n 5 10), but were elevated compared tothose of foraging leatherbacks (9.0 6 0.4 mg/dL, SE, n 5 18) and other sea turtles (interval,6–11 mg/dL; Bolten and Bjorndal, 1992;Campbell, 1996; Carminati et al., 1994; Dayet al., 2007; George, 1997; Hasbun et al.,1998; Innis et al., 2010; Kakizoe et al., 2007;Whiting et al., 2007). In this study, thecalcium:phosphorous ratio in nesting leather-backs was 0.92. Both calcium and phospho-rous are likely elevated in these turtles due tomobilization associated with egg production,as occurs in other reptiles, including cheloni-ans (Dessauer, 1970; Jacobson, 1993; Marksand Citino, 1990). To our knowledge, anormal calcium:phosphorous ratio has notbeen established in sea turtles (Aguirre andBalazs, 2000).
Blood urea nitrogen concentrations (2.33 60.07 mg/dL, SE, n 5 6) were consistent withthose found in leatherbacks nesting in Gabon(2.0 6 0.0 mg/dL, SE, n 5 9; Deem at al.,2006), but were lower than the valuesreported in directly captured leatherbacks(128.0 6 8.74 mg/dL, SE, n 5 11) and othersea turtles (interval, 20–80 mg/dL; Campbell,1996; Carminati et al., 1994; Hasbun et al.,1998; Innis et al., 2010). Potential explanationsfor this disparity include the possible fastingstate, normal physiological variation, or anevolutionary adaptation to a low-proteingelatinous–zooplankton diet. Albumin, ALP,creatinine, globulin, glucose, TBIL, potassi-um, sodium, uric acid, TP, and PCV valueswere similar to those reported in leatherbacks
nesting in Gabon (Deem et al., 2006) andin other species of sea turtles (Bolten andBjorndal, 1992; Campbell, 1996; Carminati etal., 1994; Day et al., 2007; George, 1997;Kakizoe et al., 2007; Whiting et al., 2007).However, uric acid concentrations were high-er in foraging leatherbacks (1.3 6 0.24 mg/dL,SE, n 5 11; Innis et al., 2010), as might beexpected if leatherbacks are fasting during thenesting season.
Creatine kinase varied widely in this study,as it has in other published studies of seaturtles. Creatine kinase did not meet therequired parameters in the precision studyusing this testing method, with some of thesamples yielding a coefficient of variability ashigh as 46% (Table 2). Hence, this parametermay not be appropriate for use as a normalvalue interval nor as an indicator of health inthis study.
There are many potential sources of errorthat could account for the wide range ofbiochemical concentrations reported amongstudies (Lutz and Dunbar-Cooper, 1987;Whiting et al., 2007). Biases may arise fromsample size, sample collection and handling,analytical testing methodologies, and type ofanalyzer used, all of which can make compar-isons between studies potentially misleading(Bolten and Bjorndal, 1992; Wolf et al., 2008).Differences in subject age, sex, nutritionalstatus, and health status (including diseaseprocesses), as well as in environmental condi-tions (captive vs. free ranging), geographicallocation, and season, further complicate com-parisons between studies. Biochemical inter-vals reported in this study represent normalconcentrations for reproductively active fe-male leatherbacks capable of coming to shorefor nesting. Nonetheless, comparing thesebiochemical concentrations to those of otherstudies is crucial due to the lack of data onLeatherback Sea Turtles.
Plasma Biochemistry and PCV Trends
Calcium, potassium, sodium, and phospho-rous showed significant decreases as thenumber of nesting events increased (Fig. 2A–D). Calcium is required for egg production anda temporary increase in calcium has beenreported during vitellogenesis in reptiles (in-cluding chelonians) and birds (Campbell, 1996;
230 HERPETOLOGICA [Vol. 67, No. 3

Simkiss, 1961). No seasonal trend for calciumwas detected in a population of LoggerheadSea Turtles that represented a randomlysampled broad selection of age, sex, andreproductive status (Lutz and Dunbar-Cooper,1987). However, a population of nestingloggerheads showed a similar level of hyper-calcemia to that observed in this study (Kakizoeet al., 2007). The decreasing trend in calciumconcentration may represent depletion ofcalcium as the nesting season proceeds, or itmay represent an eventual return to normal(nonfolliculogenic) physiological calcium con-centrations by the end of the nesting season.Phosphorous metabolism is closely tied tocalcium metabolism in vertebrates and maybe especially important in reptiles (Simkiss,1961). Decreasing phosphorus concentrationsmay be explained by the same mechanisms thatpotentially affect calcium concentrations.
Sodium and potassium concentrations weresimilar to reported physiological ranges in seaturtles, and both decreased with increasingnumber of nesting events (Fig. 2B,D). Food isthe primary source of potassium, and adecreasing trend would support extendedperiods of anorexia during the nesting season(Stockham and Scott, 2008). Hypokalemiacauses a commensurate drop in plasma sodiumin mammals (Stockam and Scott, 2008).
Plasma total protein significantly decreasedwith increasing number of nesting events(Fig. 2E–H). Plasma total protein consistsprimarily of albumin and globulin, with asmall component of clotting factors (primarilyfibrinogen). A decrease in total protein couldbe associated with anorexia or malnutritionand explained by either decreased proteinproduction or increased catabolism, com-mensurate with nutritional stress or disease(Kumar et al., 1972; Stockham and Scott,2008). Female birds and reptiles have in-creased total protein concentrations duringfolliculogenesis (Campbell, 2004), which maybe associated with an increased demand foregg production. A potential explanation forthe observed decreasing trend is depletion ofreserves as the nesting season proceeds,compounded by little or no food intake. BothGreen Seaturtles and Olive Ridley Sea Turtlesshowed significant decreases in protein con-centrations when they stopped feeding for
more than 1 mo (Moon, 1992). It could alsorepresent an eventual return to normal (non-folliculogenic) physiological protein concen-trations by the end of the nesting season.
A small dip in glucose concentrations wasobserved in the middle of the nesting season,but these values remained within normalphysiological concentrations of glucose. Incaptive Kemp’s Ridley Sea Turtles and GreenSea Turtles that were starved for 14 d, glucoselevels decreased to 76% and 29% of initialvalues, respectively (Moon et al., 1999). Adecreasing trend over the course of the seasonwas also observed in AST concentrations.
Packed cell volume decreased with increas-ing number of nesting events (Fig. 3A).Despite the fact that there was a significantdrop in PCV values throughout the nestingseason, the recorded values were within therange reported for other nesting leatherbacks(Deem et al., 2006) as well as for other seaturtles (Bolten and Bjorndal, 1992; Campbell,1996; Carminati et al., 1994; Day et al., 2007;George, 1997; Kakizoe et al., 2007; Whitinget al., 2007). Seasonal changes in reptilianhematologic parameters may be affected byprey availability, temperature changes, andchanges in reproductive status (Christopheret al., 1999). In this study, the drop in PCV islikely attributable to seasonal changes, thephysiological rigors of folliculogenesis andnesting.
Many of the biochemical parameters andPCV values showed statistically significantdecreasing trends as the nesting season pro-gressed. With the exception of ALT, amylase,AST, and calcium, all parameters measured fellwithin previously reported intervals for chelo-nians or other reptiles. Furthermore, calciumand PCV followed previously reported changesassociated with seasonal or reproductive cyclesin chelonians (Christopher et al., 1999). Thedecreasing trends in plasma biochemical con-centrations and PCV values found in this studycan probably be attributed to the physiologicalstress of folliculogenesis and nesting, which isfurther compounded by a possible period offasting during the nesting season.
Reproductive Output
If egg production was energy-limited,maternal investment in reproduction would
September 2011] HERPETOLOGICA 231

be expected to decrease as more clutcheswere laid during the nesting season. Repro-ductive output is determined by clutch mass,seasonal clutch frequency, internesting inter-val, and the length of reproductive life (Miller,1997). Clutch mass, which is a function ofboth clutch size and egg mass, may serve asone of the measures of reproductive output.Consequently, a decrease in maternal invest-ment in reproduction could result in a de-crease in clutch size or egg mass. BecauseSAGs were not counted or weighed in thisstudy, we are unable to specifically addressclutch mass and will limit our discussion toclutch size and egg mass. However, our datafor clutch mass (excluding SAGs) suggested adecreasing trend with increasing number ofnesting events.
In this study, clutch size did not changesignificantly with increasing number of nestingevents. Because individuals (n 5 11) were onlyfollowed until the fifth nesting event, the exactnumber of clutches laid for these turtles isunknown. The facts that many individuals wenton to nest more than five times and that not allindividuals laid the same number of clutchesmay have obscured any trend that was present.Tucker and Frazer (1994) showed that leath-erback clutch size decreased after the fifthnesting event at the population level, regardlessof female clutch frequency. It is possible that asimilar trend would be seen at the individuallevel if later nests were considered. In addition,it is thought that such trends may vary within apopulation and even within individuals amongnesting seasons (Tucker and Frazer, 1994).
Clutch size in leatherbacks is probably theresult of a number of dynamic, selectivepressures (Miller, 1997; Tucker and Frazer,1994). For instance, an upper limit may bedetermined by the female’s size and the spaceavailable in the body cavity for developing eggs(Tucker and Frazer, 1994). The lower limit couldbe dictated by a minimum number of hatchlingsneeded to emerge from the nest (Carr andHirth, 1971; Tucker and Frazer, 1994). Theunpredictability of the nest environment couldencourage females to distribute their eggs acrosstime and space, limiting the number of eggsplaced into any one nest (Eckert, 1987).Energetic and physiological constraints alsolikely play a role (Tucker and Frazer, 1994).
Average egg mass decreased significantlywithin individuals as the number of nestingevents increased (Fig. 4). Wallace et al. (2006b)found that eggs consisted of 63% albumen and33% yolk, but variation in egg albumen con-tributed substantially to variation in egg mass.Hatchling mass increased 2 g for a 10-g increasein egg mass and was roughly 10–20 g greaterthan yolk mass, suggesting that up to 50% ofhatchling mass is derived from albumen and/orwater from the nest substrate. In this study, eggmass decreased 1.5 g, or roughly 2% per nestingevent. The resulting difference between eggmass of first-time nesters and fifth-time nesters(approximately 6 g or 8% of an egg’s weight)represents a significant decrease and may affecthatchling sizes.
One possible explanation for this decreasein egg mass is limited energy reservesavailable to nesting females and the cost ofreproduction. As the season progresses andmore clutches are laid, decreasing resourcesmay dictate a need for smaller eggs orclutches. A decrease in egg mass would tendto produce larger hatchlings at the beginningof the season compared to the final clutches.Further studies detailing the variation inclutch mass (including SAGs) in relation tohatchling production and size are needed tobegin addressing the mechanisms behind suchseasonal declines in egg mass.
Our results for plasma biochemical concen-trations and PCV values of free-ranging leath-erbacks correspond with many of the valuesreported in other studies of this species, as wellas with values reported for turtles in the familyCheloniidae. Deviations from previously report-ed values were found in ALT, amylase, AST, andcalcium. These differences may be due totesting methodology, sample collection andhandling, sample size, analyzers used, time ofstudy, or intraspecies variation. Although themethodologies used in this study present certainlogistical difficulties for remote nesting beachessuch as Playa Moaba, the advantages ofprocessing samples within minutes to 2 h ofcollection, not requiring export permits, andlimiting the potential effects of freezing samplesfor international shipment, outweigh the chal-lenges. Reported values for nesting leather-backs, both in this study and in the study byDeem et al. (2006), are geographically confined
232 HERPETOLOGICA [Vol. 67, No. 3

to the Gulf of Guinea region of West/CentralAfrica. Additional data are needed from geo-graphically distant populations. Further studiesincluding both sexes and various life stages, suchas the recent one by Innis et al. (2010), areneeded for this species.
This is the first study to look at trends inplasma biochemistry concentrations and PCVvalues in nesting sea turtles. The decreasingtrends we observed were probably due to thephysiological stresses of folliculogenesis andnesting, compounded by limited energy re-serves or resources and possible fasting. Adecreasing trend in egg mass further supportsthis inference. Although plasma biochemicalconcentrations and PCV values decreasedsignificantly, these changes would not beconsidered clinically significant. Individualturtles were only followed until their fifthclutch of the season. However, leatherbacksare known to nest as many as nine or moretimes per nesting season, and could showclinically significant decreases in all concen-trations if these trends continue through thenesting events. Future health assessmentsconducted on nesting turtles will need toconsider the time of sample collection relativeto the reproductive season.
Acknowledgments.—We thank S. Falck, J. Howard, K.Kranich, and M. Osipchuk for assistance in the field. Wealso thank M. Johnson for logistical support in EquatorialGuinea. Comments provided by M. O’Connor greatlyimproved this manuscript. We are grateful to K. Aron andAbaxisH for the loan of two VetScan VS2 analyzers and forproviding us with Comprehensive Diagnostic Profile rotorsand Avian and Reptilian Plus Profile rotors. The Ex-xonMobil Foundation and Drexel University providedfunding for this project. This work was conducted underappropriate permits from Universidad Nacional de GuineaEcuatorial and the Institutional Animal Care and UseCommittee at Drexel University, IACUC no. 17243.
LITERATURE CITED
AGUIRRE, A. A., AND G. H. BALAZS. 2000. Blood biochem-istry values of green turtles, Chelonia mydas, with andwithout fibropapillomatosis. Comparative HaematologyInternational 10:132–137.
AGUIRRE, A. A., G. H. BALAZS, T. R. SPRAKER, AND T. S.GROSS. 1995. Adrenal and hematological responses tostress in juvenile green turtles (Chelonia mydas) withand without fibropapillomas. Physiological Zoology68:831–854.
BJORNDAL, K. A. 1980. Demography of the breedingpopulation of the green turtle, Chelonia mydas, atTortuguero, Costa Rica. Copeia 3:525–530.
BJORNDAL, K. A., AND A. CARR. 1989. Variation in clutchsize and egg size in the green turtle nesting populationat Tortuguero, Costa Rica. Herpetologica 45:181–189.
BOLTEN, A. B., AND K. A. BJORNDAL. 1992. Blood profilesfor a wild population of green turtles (Chelonia mydas)in the southern Bahamas—Size-specific and sex-specific relationships. Journal of Wildlife Diseases28:407–413.
BUTYNSKI, T. M. 1996. Marine turtles on Bioko Island,Equatorial Guinea. Oryx 30:143–149.
CAMPBELL, T. W. 1996. Clinical pathology. Pp. 427–435.In D. R. Mader (Ed.), Reptile Medicine and Surgery.Saunders, Philadelphia, Pennsylvania, USA.
CAMPBELL, T. W. 2004. Blood biochemistry of lowervertebrates. Fifty-fifth Annual Meeting of the AmericanCollege of Veterinary Pathologists (ACVP) & 39thAnnual Meeting of the American Society of ClinicalPathology (ASVCP), ACVP and ASVCP (Eds.). Amer-ican College of Veterinary Pathologists & AmericanSociety for Veterinary Clinical Pathology, Madison,Wisconsin, USA.
CARMINATI, C., E. GERLE, L. L. KIEHN, R. P. PISCIOTTA. 1994.Blood chemistry comparison of healthy vs. hypothermicjuvenile Kemp’s Ridley sea turtles (Lepidochelys kempii)in the New York bight. Pp. 203–207. In K. A. Bjorndal,A. B. Bolten, D. A. Johnson, and P. J. Eliazar(Compilers). Proceedings of the Fourteenth AnnualSymposium on Sea Turtle Biology and Conservation.National Oceanic and Atmospheric Administration(NOAA) Technical Memorandum NMFS-SEFSC-351.National Oceanic and Atmospheric Administration, Mi-ami, Florida, USA.
CARR, A., AND H. HIRTH. 1971. Social facilitation in greenturtle siblings. Animal Behavior 9:68–70.
CHRISTOPHER, M. M., K. H. BERRY, I. R. WALLIS, K. A.NAGY, B. T. HENEN, AND C. C. PETERSON. 1999.Reference intervals and physiologic alterations inhematologic and biochemical values of free-rangingdesert tortoises in the Mojave desert. Journal ofWildlife Diseases 35:212–238.
CONGDON, J. D. 1989. Proximate and evolutionary con-straints on energy relations of reptiles. PhysiologicalZoology 62:356–373.
CONGDON, J. D., AND J. W. GIBBONS. 1987. Morphologicalconstraint on egg size: A challenge to optimal egg sizetheory? Proceedings of the National Academy ofSciences 84:4145–4147.
CRAWSHAW, G. J., AND P. HOLZ. 1996. Comparison ofplasma biochemical values in blood and blood-lymphmixtures from red-eared sliders, Trachemys scriptaelegans. Bulletin of the Association of Reptilian andAmphibian Veterinarians 6:7–9.
DAY, R. D., A. L. SEGARS, M. D. ARENDT, A. M. LEE, AND
M. M. PEDEN-ADAMS. 2007. Relationship of blood mer-cury levels to health parameters in the loggerhead seaturtle (Caretta caretta). Environmental Health Per-spectives 115:1421–1428.
DEEM, S. L., E. S. DIERENFELD, G. P. SOUNGUET, A. R.ALLEMAN, C. CRAY, R. H. POPPENG, T. M. NORTON, AND
W. B. KARESH. 2006. Blood values in free-rangingnesting leatherback sea turtles (Dermochelys coriacea)on the coast of the Republic of Gabon. Journal of Zooand Wildlife Medicine 37:464–471.
September 2011] HERPETOLOGICA 233

DESSAUER, H. C. 1970. Blood Chemistry of Reptiles:Physiological and Evolutionary Aspects. AcademicPress, New Orleans, Louisiana, USA.
DUTTON, P. H., AND D. L. MCDONALD. 1994. Use of PIT tagsto identify adult leatherbacks. Marine Turtle Newsletter67:13–14.
ECKERT, K. L. 1987. Environmental unpredictability andleatherback sea turtle (Dermochelys coriacea) nest loss.Herpetologica 43:315–323.
EVANS, G. O. 1996. Animal Clinical Chemistry, A Primerfor Toxicologists. Taylor and Francis, Bristol, Pennsyl-vania, USA.
FRAZER, N. B., AND J. I. RICHARDSON. 1985. Seasonalvariation in clutch size for loggerhead sea turtles,Caretta caretta, nesting on little Cumberland Island,Georgia, USA. Copeia 1985:1083–1085.
GEORGE, R. H. 1997. Health problems and diseases of seaturtles. Pp. 363–385. In P. L. Lutz and J. A. Musick(Eds.), The Biology of Sea Turtles. CRC Press, BocaRaton, Florida, USA.
HASBUN, C. R., A. J. LAWRENCE, J. NALDO, J. H. SAMOUR,AND S. M. AL-GHAIS. 1998. Normal blood chemistry offree-living green sea turtles, Chelonia mydas, from theUnited Arab Emirates. Comparative HaematologyInternational 8:174–177.
INNIS, C., C. MERIGO, K. DODGE, M. TLUSTY, M. DODGE,B. SHARP, A. MYERS, A. MCINTOSH, D. WUNN, C.PERKINS, T. H. HERDT, T. NORTON, AND M. LUCAVAGE.2010. Health evaluation of leatherback turtles (Dermo-chelys coriacea) in the northwestern Atlantic duringdirect capture and fisheries gear disentanglement.Chelonian Conservation and Biology 9:205–222.
JACOBSON, E. R. 1993. Blood collection techniques inreptiles: Laboratory investigations. Pp. 144–152. InM. E. Fowler (Ed.), Zoo and Wild Animal MedicineCurrent Therapy 3. W. B. Saunders Company, Phila-delphia, Pennsylvania, USA.
KAKIZOE, Y., K. SAKAOKA, F. KAKIZOE, M. YOSHII, H.NAKAMURA, Y. KANOU, AND I. UCHIDA. 2007. Successivechanges of hematologic characteristics and plasmachemistry values of juvenile loggerhead turtles (Carettacaretta). Journal of Zoo and Wildlife Medicine38:77–84.
KUMAR, V., H. P. CHASE, K. HAMMOND, AND D. O’BRIEN.1972. Alterations in blood biochemical tests in progres-sive malnutrition. Pediatrics 49:736–743.
LUTCAVAGE, M. E., P. L. LUTZ, G. D. BOSSART, AND D. M.HUDSON. 1995. Physiological and clinicopathologicaleffects of crude-oil on loggerhead sea turtles. Archivesof Environmental Contamination and Toxicology 28:417–422.
LUTZ, P. L., AND A. DUNBAR-COOPER. 1987. Variation inthe blood chemistry of the loggerhead sea turtle,Caretta caretta. Fishery Bulletin 85:37–43.
MARKS, S. K., AND S. B. CITINO. 1990. Hematology andserum chemistry of the radiated tortoise (Testudoradiata). Journal of Zoo and Wildlife Medicine 21:342–344.
MILLER, J. D. 1997. Reproduction in sea turtles. Pp. 51–82.In P. L. Lutz and J. A. Musick (Eds.), The Biology of SeaTurtles. CRC Press, Boca Raton, Florida, USA.
MOON, D. Y. 1992. The responses of sea turtles totemperature changes; behavior, metabolism and thyroid
hormones. Ph.D. Dissertation, Texas A&M University,College Station, Texas USA.
MOON, D. Y., D. W. OWENS, AND D. S. MACKENZIE. 1999.The effects of fasting and increased feeding on plasmathyroid hormones, glucose, and total protein in seaturtles. Zoological Science 16:579–586.
MORTIMER, J. A., AND A. CARR. 1987. Reproduction andMigrations of the Ascension Island Green Turtle(Chelonia mydas). Copeia 1987:103–113.
NORTON, T. M., E. R. JACOBSON, AND J. P. SUNDBERG. 1990.Cutaneous fibropapillomas and renal myxofigroma in agreen turtle, Chelonia mydas. Journal of WildlifeDiseases 26:265–270.
OWENS, D. W. 1980. The comparative reproductivephysiology of sea turtles. American Zoologist20:549–563.
OWENS, D. W., AND G. J. RUIZ. 1980. New methods ofobtaining blood and cerebrospinal fluid from marineturtles. Herpetologica 36:17–20.
R DEVELOPMENT CORE TEAM. 2010. lme4: Linear mixed-effects models using s4 classes. R Foundation forStatistical Computing, Vienna, Austria.
RADER, H., M. A. ELA MBA, W. MORRA, AND G. W. HEARN.2006. Marine turtles on the southern coast of BiokoIsland (Gulf of Guinea, Africa), 2001–2005. MarineTurtle Newsletter 111:8–10.
ROSTAL, D. C., F. V. PALADINO, R. M. PATTERSON, AND J. R.SPOTILA. 1996. Reproductive physiology of nestingleatherback turtles (Dermochelys coriacea) at LasBaulas National Park, Costa Rica. Chelonian Conser-vation and Biology 2:230–236.
SIMKISS, K. 1961. Calcium metabolism and avian repro-duction. Biological Reviews 36:321–359.
SOUNGUET, G., C. MBINA, AND A. FORMIA. 2004. Sea turtleresearch and conservation in Gabon by Aventures SansFrontieres, an organizational profile. Marine TurtleNewsletter 105:19–21.
SPOTILA, J. R., A. E. DUNHAM, A. J. LESLIE, A. C.STEYERMARK, P. T. PLOTKIN, AND F. V. PALADINO. 1996.Worldwide population decline of Dermochelys coria-cea: Are leatherback turtles going extinct? ChelonianConservation and Biology 2:209–222.
STABENAU, E. K., T. A. HEMING, AND J. F. MITCHELL. 1991.Respiratory, acid–base and ionic status of Kemp’sRidley sea turtles (Lepidochelys kempii) subjected totrawling. Journal of Comparative Biochemistry andPhysiology A 99:107–111.
STOCKHAM, S. L., AND M. A. SCOTT. 2008. Fundamentals ofVeterinary Clinical Pathology. Iowa State Press, Ames,Iowa, USA.
TOMAS, J., B. J. GODLEY, J. CASTROVIEJO, AND J. A. RAGA.2010. Bioko: Critically important nesting habitat for seaturtles of West Africa. Biodiversity and Conservation19:2699–2714.
TUCKER, A. D., AND N. B. FRAZER. 1994. Seasonal variationin clutch size of the turtle, Dermochelys coriacea.Journal of Herpetology 28:102–109.
TURNBULL, B. S., C. R. SMITH, AND M. A. STAMPER. 2000.Medical implications of hypothermia in threatenedloggerhead (Caretta caretta) and endangered Kemp’sRidley (Lepidochelys kempii) and green (Cheloniamydas) sea turtles. Pp. 31–35. In Proceedings of theAmerican Association of Zoo Veterinarians/International
234 HERPETOLOGICA [Vol. 67, No. 3

Association of Aquatic Animal Veterinarians AnnualConference. New Orleans, Louisiana, USA.
WALLACE, B. P., AND R. H. GEORGE. 2007. Alternativetechniques for obtaining blood samples from leather-back turtles. Chelonian Conservation and Biology6:147–149.
WALLACE, B. P., J. A. SEMINOFF, S. S. KILHAM, J. R.SPOTILA, AND P. H. DUTTON. 2006a. Leatherback turtlesas oceanographic indicators: Stable isotope analysesreveal a trophic dichotomy between ocean basins.Marine Biology 149:953–960.
WALLACE, B. P., P. R. SOTHERLAND, P. S. TOMILLO, S. S.BOUCHARD, R. D. REINA, J. R. SPOTILA, AND F. V.PALADINO. 2006b. Egg components, egg size, andhatchling size in leatherback turtles. ComparativeBiochemistry and Physiology Part A 145:524–532.
WALLACE, B. P., P. R. SOTHERLAND, P. S. TOMILLO, R. D.REINA, J. R. SPOTILA, AND F. V. PALADINO. 2007.Maternal investment in reproduction and its conse-quences in leatherback turtles. Oecologia 152:37–47.
WHITING, S., M. GUINEA, C. LIMPUS, AND K. FOMIATTI.2007. Blood chemistry reference values for two ecolog-ically distinct populations of foraging green turtles,
eastern Indian Ocean. Comparative Clinical Pathology16:109–118.
WITHERINGTON, B., K. PENDOLEY, G. W. HEARN, AND S.HONARVAR. 2009. Ancient mariners, ancient fuels: Howsea turtles cope with our modern fossil fuel dependen-cy. SWOT Report 4. State of the World’s Sea Turtles,Arlington, Virginia, USA.
WITT, M. J., B. BAERT, A. C. BRODERICK, A. FORMIA, J.FRETEY, A. GIBUDI, G. A. M. MOUNGUENGUI, C.MOUSSOUNDA, S. NGOUESSONO, R. J. PARNELL, D.ROUMET, G. P. SOUNGUET, B. VERHAGE, A. ZOGO, AND
B. J. GODLEY. 2009. Aerial surveying of the world’slargest leatherback turtle rookery: A more effectivemethodology for large-scale monitoring. BiologicalConservation 142:1719–1727.
WOLF, K. N., C. A. HARMS, AND J. F. BEASLEY. 2008.Evaluation of five clinical chemistry analyzers for use inhealth assessment in sea turtles. Journal of theAmerican Veterinary Medical Association 233:470–475.
.Accepted: 11 May 2011
.Associate Editor: Sarah Woodley
September 2011] HERPETOLOGICA 235