published project report ppr844
TRANSCRIPT

PUBLISHED PROJECT REPORT PPR844
Effectiveness estimates for proposed amendments to the EU's General and Pedestrian Safety Regulations
A Barrow, A Edwards, L Smith, R Khatry, A Kalaiyarasan, D Hynd

v3.0 PPR844
Report details
Report prepared for: ACEA
Project/customer reference: Ulrich Veh
Copyright: © TRL Limited
Report date: 15/11/2017
Report status/version: v3.0
Quality approval:
Courtney Newbould
(Project Manager)
David Hynd
(Technical Reviewer)
Disclaimer
This report has been produced by TRL Limited (TRL) under a contract with ACEA. Any views expressed in this report are not necessarily those of ACEA.
The information contained herein is the property of TRL Limited and does not necessarily reflect the views or policies of the customer for whom this report was prepared. Whilst every effort has been made to ensure that the matter presented in this report is relevant, accurate and up-to-date, TRL Limited cannot accept any liability for any error or omission, or reliance on part or all of the content in another context.
When purchased in hard copy, this publication is printed on paper that is FSC (Forest Stewardship Council) and TCF (Totally Chlorine Free) registered.
Contents amendment record
This report has been amended and issued as follows:
Version Date Description Editor Technical Reviewer
1.0 31/07/2017 First draft Alix Edwards David Hynd
1.1 11/08/2017 Updated draft results for VIS, ISA, FSO, SFS and HED
Adam Barrow
2.0 31/08/2017 Second draft Adam Barrow David Hynd
3.0 15/11/2017 Final report Alix Edwards David Hynd
Document last saved on: 31/05/2018 10:43
Document last saved by: Barrow, Adam

Effectiveness Estimates
v3.0 i PPR844
1 Executive Summary
There are various amendments to the General Safety Regulation (GSR) and Pedestrian Safety Regulations (PSR) under consideration by the European Commission. The first stage of the review included the evaluation of over 50 candidate measures that could be considered for implementation in the GSR or PSR. The second stage of the review focused on the 24 measures that were most likely to be cost-beneficial and potentially included in the regulation by the Commission. The review highlighted some of the measures that were not well understood with respect to their potential casualty benefit. The knowledge gaps will hinder further review and any cost-benefit review that will take place before a decision on whether to implement the measures can take place.
This report was commissioned by ACEA and considers eight of those measures in greater detail to feed in to the European Commission consultation process. The eight measures under evaluation are shown in Figure 1.
Figure 1: The eight proposed measures
The collision data underpinning the analysis in this report is the STATS19 national data for GB, in combination with Road Accident In-Depth Studies (RAIDS) data. Other European research centres are carrying out similar studies and the results of all of the work will be combined into a report by ACEA.
This study is the second Phase of work and follows Phase 1 (Research Question 1) of the project which defined the casualty Target Populations (TPs) for each measure, in terms of the killed, serious, and slightly injured casualties as well as a total. This Phase 2 (Research Question 2) work takes this a step further to define the Effectiveness Estimates (EEs). These take into account the existing safety measures that have already been regulated, other proposed measures that are under consideration, and the studied measure itself. The end result is a very complex set of calculations, but overall it means that the effect of multiple
• Improved front end design for direct and indirect driver VISion VIS
• Intelligent Speed Adaptation ISA
• Frontal impact Small Overlap crash test FSO
• Side impact Far Side occupant crash test SFS
• Front impact crash test (removal of exemptions from regulation 94) F94
• Side impact crash test (removal of exemptions from R95) S95
• Adult HEaD to windscreen area HED
• REVersing detection REV

Effectiveness Estimates
v3.0 ii PPR844
measures on the TPs is accounted for. Depending on the measure concerned, the effectiveness values are taken either from literature or from novel case-by-case analysis of the in-depth data from RAIDS. The whole calculation process generates either:
For FSO, SFS, F94, S95: a more refined target population (TP) that accounts for existing and other proposed measures (but no effectiveness estimate)
For ISA, VIS, REV, HED: a more refined target population (TP) which is then used to generate a detailed effectiveness estimate (EE)
The method applied in this report categorises the individual casualties in the target populations into sub-populations, based on the type of collision, that are relevant to one or multiple measures (Table 5). Some casualties were injured in collisions or vehicles that are relevant to multiple measures resulting in overlapping sub-populations within a target population (Figure 8). The analysis is able to consider the effect of all of the relevant measures on the target population such that double counting casualties who may be saved by multiple measures is avoided (Figure 10 and Figure 11). The result is a new refined target population which is used to provide a more accurate understanding of the residual casualty population that could be addressed by the assessed measure being analysed. If effectiveness estimates for the assessed measure are available the analysis then applies this effect to the revised target population resulting in a predicted reduction in casualties and residual casualty population that will still be injured or killed should the measure be implemented.
The summary findings of the target populations and predicted casualty benefits for each of the eight measures and the combination of other measures are shown in Table 1. The key findings include:
• Of the four VIS variants the largest predicted VRU casualty savings are with the
implementation of an AEB-PCD system 1,328 casualties.
• Fitting ISA to M1 vehicles will yield the greatest casualty benefit compared to the
other ISA vehicle categories. However, other measures (including ESC, LKA, AEB and
AEB-PCD) that could be fitted to M1 vehicles are predicted to have a greater overall
casualty benefit than ISA.
• In total, the effect of the other measures is predicted to provide a 17% reduction in
the casualty target population of FSO (2,276 of 13,238 casualties).
• The effect of the other measures on SFS is minimal, resulting in a 2% reduction in the
original target population for SFS (243 of 11,341 casualties).
• It is predicted that over ten thousand casualties will be injured in GB over a 5 year
period, with 8% being killed or seriously injured (900 of 10,830 casualties), in vehicles
that are currently out of scope for Regulation 94.
• The other measures also evaluated with S95 are predicted to reduce casualties less
than 2% of the original target population for S95 (80 of 4,311 casualties).
• The predicted effect of a PPA on the resulting target population, once the effect of
the other measures has been considered, is predicted to prevent 2% (83 of 3972
casualties) of the original target population for HED.

Effectiveness Estimates
v3.0 iii PPR844
Table 1: Summary table of predicted casualty savings and remaining casualty populations
Fatal Serious Slight Total
VIS †
Target population (RQ1) 312 810 1896 3018
Best-in-class cab savings 9 24 57 90
Remaining casualty population 303 786 1839 2928
High-visibility cab savings 84 220 512 816
Remaining casualty population 228 590 1384 2202
VRU detection savings 124 324 760 1208
Remaining casualty population 188 486 1136 1810
AEB-PCD savings 136 357 836 1329
Remaining casualty population 176 453 1060 1689
ISA M1
Target population (RQ1) 1469 7680 43916 53065
Other measure savings 529 1804 7474 9807
ISA measure savings 168 1060 6991 8219
Mitigated casualties 56 296 -352 0
Remaining casualty population 716 4520 29803 35039
ISA M2
Target population (RQ1) 0 27 109 136
Other measure savings 0 0 2 2
ISA measure savings 0 4 18 22
Mitigated casualties 0 2 -2 0
Remaining casualty population 0 21 91 112
ISA M3
Target population (RQ1) 9 18 86 113
Other measure savings 0 0 5 5
ISA measure savings 1 3 14 18
Mitigated casualties 1 1 -2 0
Remaining casualty population 7 14 69 90
ISA N1
Target population (RQ1) 18 217 1790 2025
Other measure savings 3 38 282 323
ISA measure savings 3 32 289 324
Mitigated casualties 1 10 -11 0
Remaining casualty population 11 137 1230 1378
ISA N2
Target population (RQ1) 0 18 90 108
Other measure savings 0 0 3 3
ISA measure savings 0 3 15 18
Mitigated casualties 0 1 -1 0
Remaining casualty population 0 14 73 87
ISA N3
Target population (RQ1) 54 68 321 443
Other measure savings 12 5 16 33
ISA measure savings 7 10 53 70
Mitigated casualties 3 1 -4 0
Remaining casualty population 32 52 256 340

Effectiveness Estimates
v3.0 iv PPR844
FSO ‡
Target population (RQ1) 69 793 12376 13238
Other measure savings 27 195 2054 2276
Mitigated casualties 3 34 -37 0
Remaining casualty population 39 564 10359 10962
SFS ‡
Target population (RQ1) 132 857 10352 11341
Other measure savings 24 39 180 243
Mitigated casualties 7 43 -50 0
Remaining casualty population 101 775 10222 11098
F94 ‡
Target population (RQ1) 123 1203 11963 13289
Other measure savings 51 319 2089 2459
Mitigated casualties 5 51 -56 0
Remaining casualty population 67 833 9930 10830
S95 ‡
Target population (RQ1) 26 267 4018 4311
Other measure savings 2 11 67 80
Mitigated casualties 2 14 -16 0
Remaining casualty population 22 242 3967 4231
HED Ped
Target population (RQ1) 299 3673 - 3972
Other measure savings 138 1687 - 1825
HED measure savings 30 53 - 83
Mitigated casualties 10 110 -120 0
Remaining casualty population 121 1823 120 2064
HED Cyc
Target population (RQ1) 18 534 - 552
Other measure savings 8 245 - 253
HED measure savings 0 0 - 0
Mitigated casualties 1 17 -18 0
Remaining casualty population 9 272 18 299
REV †‡
Target population (RQ1) 7 41 136 139
Other measure savings - - - -
Remaining casualty population 7 41 136 139
† No other measures were assessed.
‡ No effectiveness is available for the assessed measure so no savings are provided.
- No assessment was made.

Effectiveness Estimates
v3.0 i PPR844
Table of Contents
1 Executive Summary i
2 Introduction 2
2.1 Aims and objectives 7
2.2 Research questions 8
3 Method 10
3.1 Data Sources 10
3.2 Overview 12
3.3 Multiple measures 16
3.4 Calculating the new Target Populations and Effectiveness Estimates 19
3.5 Effectiveness estimates 24
4 Results 32
4.1 Front End Design (VIS) 33
4.2 Intelligent Speed Assistance (ISA) 53
4.3 Frontal Small Overlap (FSO) 67
4.4 Side Impact Far Side Occupant (SFS) 69
4.5 Frontal Impact Crash Test (F94) 71
4.6 Side Impact Crash Test (S95) 73
4.7 Adult Head to Windscreen Area (HED) 75
4.8 Reversing Detection (REV) 79
5 Summary/Conclusions 80
5.1 Key Findings 83
5.2 Limitations 88
5.3 Future Work 89
Appendix A Intelligent speed assist (ISA) 90
Appendix B Improved front end design (VIS) 103

Effectiveness Estimates
v3.0 2 PPR844
2 Introduction
The European Union General Safety Regulation (GSR) and Pedestrian Safety Regulation (PSR)1 govern type approval requirements specific to the safety of ‘M’, ‘N’ and ‘O’ ‘category vehicles in Europe. The Regulations mandate a number of technical aids designed to prevent and mitigate collisions, to protect occupants, pedestrians and other vulnerable road users. The European Commission has been conducting a review in order to develop proposals for amendments to the Regulations, one stage of which was completed and reported on by TRL in 20152.
This initial review evaluated over 50 candidate measures that could be considered for implementation in the GSR or PSR. The outputs were indicative cost-benefits provided in order to differentiate those measures that are very likely, moderately likely, or very unlikely to provide a benefit consistent with the cost of implementation.
A second stage of the review focused on the 24 measures that were most likely to be cost-beneficial and potentially included in the regulation by the Commission3. The review examined the measures in a higher level of detail than the previous reviews to establish potential target populations and expected effectiveness of the measures. These factors were then used in the in-depth cost-benefit model. In the process, the review revealed knowledge gaps in the literature for the following eight measures shown in Figure 2 with the short code used to refer to each measure throughout the report.
1 (EC) 661/2009 and 78/2009 respectively
2 Hynd et al. (2015). Benefit and Feasibility of a Range of New Technologies and Unregulated Measures in the
fields of Vehicle Occupant Safety and Protection of Vulnerable Road Users. doi: 10.2769/497485
3 Seidl et al. (2017). In depth cost-effectiveness analysis of the identified measures and features regarding the
way forward for EU vehicle safety. doi: 10.2873/748910

Effectiveness Estimates
v3.0 3 PPR844
Figure 2: The eight proposed measures
The implementation and requirements for the eight measures were defined by the European Commission and are detailed in the second GSR review3. For the purpose of this study ACEA has defined the specification for each measure and the approach to meet the requirements set out by the European Commission. This study uses these definitions to assess the potential casualty benefits of implementing these measures on the road casualties that occurred in Great Britain (GB) over a 5 year period from 2011-2015. The definitions of each measure as they are applied in this study are detailed in Figure 3.
• Improved front end design for direct and indirect driver VISion VIS
• Intelligent Speed Adaptation ISA
• Frontal impact Small Overlap crash test FSO
• Side impact Far Side occupant crash test SFS
• Front impact crash test (removal of exemptions from regulation 94) F94
• Side impact crash test (removal of exemptions from R95) S95
• Adult HEaD to windscreen area HED
• REVersing detection REV

Effectiveness Estimates
v3.0 4 PPR844
Figure 3: Detailed description of the eight measures considered

Effectiveness Estimates
v3.0 5 PPR844
To investigate further the real world safety benefits that could be afforded if certain measures were adopted, ACEA commissioned TRL to investigate further the ‘real-world’ safety benefits that could be anticipated in Great Britain (GB) if these measures were adopted. The review took place in two phases which are described in Figure 4.
Figure 4: The two phases of the ACEA accident analysis specification
Phase 1 / Research Question 1 (RQ1) of this work estimated the Gross Target Population (TP) likely to benefit from each of the eight measures. Phase 2 / Research Question 2 (RQ2) has developed this model in order to more accurately predict the effect of the measures in terms of casualty reduction by accounting for the effect of other measures that are being considered for implementation. ACEA pre-defined the other measures to be considered for each of the eight proposed measures in Figure 3 that are likely to have an overlapping casualty benefit. The model prevents double counting of casualties who may have been saved by multiple measures, if they were all implemented, and therefore prevents an overestimation of the casualty benefits.
The relevant TPs from Phase 1 / RQ1 are shown in Table 2, which gives estimates of the number of relevant casualties who were killed, seriously or slightly injured between 2011 and 2015. This is broken down per measure and per vehicle type (e.g. M1, N1, etc.).
Since the original publication of the Phase 1 / RQ1 report the target populations have been updated. This is either to reflect a change in the requirements for the target population in order to align the study with the other counterparts on German and French accident data or to correct errors that were revealed during the more detailed method in Phase 2 / RQ2/.
Phase 1 • Define casualty Target Populations (TP)
Phase 2 • Define Effectiveness Estimates (EE)

Effectiveness Estimates
v3.0 6 PPR844
Table 2: Casualty Target Populations (TP) for each measure identified from Phase 1 (Great Britain 2011-2015). Note that TPs in this table are taken from RQ1. In some cases these
are refined due to the work in RQ2, and these changes will be shown in the Results Section 4 [Updated RQ1 report to follow]
Measure Vehicle
type
Casualty type TP casualties who benefit from measure
Killed Seriously
injured
Slightly
injured
Total
VIS – improved front end
design for direct and indirect
driver vision
N2 Pedestrians &
pedal cyclists
36 232 825 1,093
N3
N Unk
275
1
564
14
1,016
56
1,855
71
ISA – Intelligent Speed
Assistance
M1
All vehicle users
& VRUs
1,469 7,680 43,916 53,065
M2 0 27 109 136
M3 9 18 86 113
N1 18 217 1,790 2,025
N2 0 18 90 108
N3 54 68 321 443
FSO – Frontal impact Small
Overlap crash test * M1 M1 occupants 69 793 12,376 13,238
SFS – Side impact Far Side
occupant crash test *† M1 M1 Occupants 132 857 10,352 11,341
F94 – Frontal Impact Crash
Test (removal of exemptions
from Regulation 94) *
M1 M1 & N1
occupants that
are currently
exempt
123 1203 11,963 13,289 N1
S95 – Side Impact Crash Test
(removal of exemptions from
Regulation 95) *
M1 M1 & N1
occupants that
are currently
exempt
26 267 4,018 4,311 N1
HED – Adult Head to
Windscreen Area †
M1 Pedestrians 299 3,673 - 3,972
M1 Cyclists 18 534 - 552
REV – Reversing Detection
Note: Stats19 only includes collisions
on the public highway and excludes
those occurring in car parks, service
yards and private workplace sites.
N2
Pedestrians &
pedal cyclists 7 41 136 177
N3
O3
O4
Notes:
FSO and SFS only consider injury to occupants in cars registered from 2004-2015. Therefore, they cannot be compared with the other measures because they represent a sub-sample of real world collisions.
† Target populations are expressed as a range (Minimum – Maximum) - No estimate could be made

Effectiveness Estimates
v3.0 7 PPR844
2.1 Aims and objectives
The focus of the second phase of the project was to define the anticipated effect of the measures upon the casualty target populations. Phase 2 assessed the impact of active safety technologies on the target populations identified in Phase 1 (Table 2). The assessment was made on a sample of collisions based on the scenario categories established in the previous step. Each measure was assessed using either expert case-by-case review, or by effectiveness derived from a literature review. The measures were assessed on their ability to avoid or reduce the severity of the collision. Analysis of these results will provide a more accurate estimate of effectiveness than the Target Populations described in the first Phase.
The main aim of Phase 2 is to provide a more accurate estimate of the casualty benefits from the adoption of the eight measures on the TP by analysis of real-world data taken from the GB Department for Transport’s Road Accident In-Depth Studies (RAIDS) database and the STATS19 National Accident Statistics database. The TPs defined in Phase 1, presented in Table 1, are refined further in Phase 2 by applying the predicted effectiveness rates of the measures while considering the effect of combinations of other measures that have been or may also be implemented in parallel. For example, Electronic Stability Control (ESC) and Autonomous Emergency Braking (AEB) may affect the target population for the eight measures assessed in this report. The method applied in Phase 2 aims to prevent double counting of casualties who could be saved by more than one measure, therefore, providing a more accurate assessment of the potential casualty benefits.
The eight assessed measures and the combinations of other measures to be analysed with each of the assessed measures have been predefined by ACEA. Where literature is available on the effectiveness of the measures, ACEA has specified which studies are used in the analysis. In the case of VIS, ISA and HED novel research was undertaken to create new effectiveness values based on the GB casualty population from 2011-2015.
The results presented in Table 1 represent the relevant casualty populations that the eight measures could influence. Phase 2 has in turn focused on the potential benefits to these populations and the evidence-based data produced now allows meaningful discussion that can feed in to the review of the GSR and contribute to its stated aim “to ensure a high level of road safety and environmental protection”.
Additional reports have been commissioned by ACEA from the German In-Depth Accident Study (GIDAS) and from the Centre Européen d’Etudes de Sécurité et d’Analyse des Risques (CEESAR) in France. This complementary research will contribute to a better understanding of road safety challenges and solutions that can be considered by the GSR, and therefore provide Europe-wide benefits in road safety.
Figure 5 summarises the scope of the entire project, including both reports, and other studies underway from other centres using different national data sources. It highlights the scope of this report, which is focussed on generating the Effectiveness Estimates (EE) for GB data.

Effectiveness Estimates
v3.0 8 PPR844
Figure 5: This report is concerned with the Effectiveness Estimate (EE) for GB data
2.2 Research questions
The detailed research questions were defined by ACEA as follows in Table 3. Each measure has two questions, the first question in each case being concerned with the definition of the Target Population (TP), which was calculated in the first report4. These Research Question 1 (RQ1) statements are in green to indicate their completion.
The second question for each measure is the focus of this report, namely to refine the Target Populations for each measure and derive a realistic Effectiveness Estimate (EE) that reflects the anticipated casualty savings. These Research Question 2 (RQ2) statements are in bold to indicate that they are the focus of this report.
4 Cuerden et al. (2017). Estimating the casualty benefits associated with proposed amendments to the EU's
General and Pedestrian Vehicle Safety Regulations. ISBN: RPN3851

Effectiveness Estimates
v3.0 9 PPR844
Table 3: The collision analysis Research Questions on the GSR revision (as provided by ACEA
Measure Detail Category Research questions
VIS Front End Design
Compare active safety with direct driver vision benefits
N3 1) Find the proportion and gravity of collisions due to “blind spot” in the truck driver vision and to driver distraction
2) Estimate the potential benefits of existing measure (AEB) and the proposed measures (detection systems and extending direct driver vision) considered alone and cumulatively (both)
ISA Intelligent Speed Adaptation
Benefits on M1/N1 Benefits on CV, considering the speed limiters already mandatory
M1/N1 M2/N2 M3/N3
1) Find the proportion and gravity of collisions involving vehicles in different categories with speed limit infringement
2) Estimate the potential benefits of existing measure (AEB) and the proposed measure (ISA)
FSO Small overlap
Benefit of passive vs active measures
M1 1) Find the proportion and gravity of small overlap car collisions
2) Estimate the potential benefit of passive safety solutions considering the impact of active safety proposed measures (ESC/AEB/LKA)
SFS Far side occupant protection
M1 1) Find the proportion and gravity of far side car collisions
2) Estimate the potential benefit of dedicated passive safety solutions considering the impact of active/passive safety proposed measures (AEB/Pole Impact)
F94 Frontal Crash
Benefits of extension to all M1/N1
M1/N1 now excluded
1) Find the proportion and gravity of frontal collisions involving exempt M1/N1
2) Estimate the potential benefit
S95 Lateral Crash
Benefits of extension to all M1/N1
M1/N1 now excluded
1) Find the proportion and gravity of lateral collisions involving exempt M1/N1
2) Estimate the potential benefit
HED Adult head to windscreen
M1 1) Find the proportion and gravity of pedestrian collisions with head-to-windscreen impact
2) Estimate the potential benefit of passive safety solutions considering the impact of active safety proposed measures (AEB for Pedestrian/Cyclist)
REV Reverse detection
Benefits of extension to N2/N3/O
N2/N3/O 1) Find the proportion and gravity of N2/N3/O reversing collisions
2) Estimate the potential benefit

Effectiveness Estimates
v3.0 10 PPR844
3 Method
3.1 Data Sources
The datasets used in this study are Great Britain’s national accident (STATS19) and in-depth accident (RAIDS) datasets, and the key features of these two datasets are summarised in Figure 6. Both datasets are free to use and collected on behalf of the Department for Transport.
Figure 6: Key features of the Stats19 and RAIDS data used
STATS19 is Great Britain’s database that records police reported traffic collisions that result in injury to at least one person. The database primarily records information on where the collision took place, when the collision occurred, the conditions at the time and location of the collision, details of the vehicles involved, and information about the casualties. Approximately fifty elements of information are collected for each collision (Department for Transport, 2007).
The severity of the casualties involved in each collision is assessed by the investigating police officer. Each casualty is recorded as being either slightly, seriously, or fatally injured. Fatal injury includes only casualties who died less than 30 days after the collision, not including suicides or death from natural causes. Serious injury includes casualties who were admitted to hospital as an in-patient. Slight injury includes minor cuts, bruises, and whiplash. The full definitions of these injury severities (and all other information recorded in STATS19) are given in the STATS20 document which accompanies the STATS19 form6.
The RAIDS database contains new data from the RAIDS Phase 1 and Phase 2 data collection periods, plus data from legacy studies between 1995 and 2010:
STATS19
•All GB police reported accidents involving at least one injured road user
•Database: up to 2015 •Sample for study: 2011 to 2015 •Police reported traffic accidents that result in injury to at least one person
•Approx 50 data fields per collision •NATIONAL
RAIDS
•Road Accident In Depth Studies
•Database: 2000 onwards •Investigator-attended traffic collisions and retrospective vehicle examinations
•Approx 3000 data fields per collision •Representative sampling area of the UK

Effectiveness Estimates
v3.0 11 PPR844
The On The Spot (OTS) study, which collected crash data at the scene enabling data to be collected as soon as possible after the crash occurs, before vital evidence had been removed. Data was collected for all vehicle types and accident severities (2000 to 2010).
The Co-operative Crash Injury Study (CCIS), which commenced in 1983 and finished in 2010. This study investigated car collisions, including retrospective vehicle examinations, to understand car occupant injury causation.
The Heavy Vehicle Crash Injury Study (HVCIS), collected detailed information on collisions involving heavy goods vehicles, light commercial vehicles, large passenger vehicles, minibuses, agricultural vehicles and ‘other motor vehicles’ (OMVs). The project consisted of two main elements:
o Retrospective analysis of police fatal files (HVCIS fatal files) for collisions involving vehicles of interest. The researchers used the detailed information collected by the police to determine potential countermeasures which could have avoided or reduced the severity of the collision.
o The Truck Crash Injury Study (TCIS) which collected detailed information from investigations undertaken by the Vehicle and Operator Services Agency (VOSA) for both injury and non-injury accidents in 15 areas covering England, Scotland and Wales.
The Road Accident In-Depth Studies (RAIDS) programme brings together different types of investigation from legacy studies into a single programme combining existing data with new, in a common and comprehensive database.
Currently there are two types of RAIDS investigations:
On scene: A crash scene investigation done at the time of the collision while the emergency services are still present. These investigations focus on the vehicle, the road user and the highway issues and can include all injury severities, including non-injury crashes and those with relatively minor vehicle damage. All vehicle types and road users are included.
Retrospective: An investigation that is typically performed the day after a collision, which examines vehicles that have had to be recovered from the crash site having suffered more serious damage and where an occupant has attended hospital due to their injuries. The sampling procedure for Phase 1 (2012-2015) included retrospective vehicle investigations divided into two categories:
o ‘Retrospective passenger car examinations’, and o ‘Retrospective large vehicle examinations’.
In Phase 2 (2015-2018), the retrospective investigations focus on gathering data on collisions that involve new cars or pedal cycles or motorcycles, but all other vehicles involved in the collisions are investigated too.
For all case types, follow-up activities involve the collection and coding of anonymous injury and questionnaire data. Each collision type has targets for the number of cases collected, and the distribution of injury levels within those cases, with a bias towards killed and serious injury (KSI) collisions. The approach and protocol for these case types is described further in the following sections.
The following describes sample sizes for each study in the RAIDS database:

Effectiveness Estimates
v3.0 12 PPR844
OTS cases n = 4,744 Phases 1, 2 and 3 (2000-2010)
CCIS cases n = 10,611 Phases 6, 7 and 8 (1998-2010)
TCIS cases n = 1,476 All cases (1995-2010)
HVCIS fatal cases n = 3,980 All cases (1995-2010)
RAIDS programme has collected information on 1,255 collisions (cases) in Phase 1 (2012-2015).
3.2 Overview
Figure 7 summarises the method applied to each of the eight assessed measures to determine the estimated gross target populations in Phase 1 and how Phase 2 determines the anticipated effect of each measure on those target populations.
The Phase 2 method applies to the estimated casualty target population (TP) specific to each measure derived from Phase 1. The method provides a more accurate casualty population for each measure than the findings from Phase 1 because it avoids double counting casualties who are already affected by one of the other proposed measures and would not appear in the target population of the measure being assessed. The combinations of other proposed measures that are assessed with each of the eight main measures were defined by ACEA and are described in Table 4.
The following steps refer to the steps shown in Figure 7 (red numbers) and describe how casualties who appear in more than one target population are removed from the original target population to determine the anticipated effect of the measure being assessed:
1) The casualties from the estimated gross target population derived in Phase 1 are split into two sub-populations:
a. Casualties who are in collisions only relevant to the assessed measure; and b. Casualties who are also in collisions relevant to other measures.
2) Casualties from the sub-population relevant to other proposed measures are then subject to the effectiveness estimates of those other measures which were determined from literature.
3) The casualties that are not removed from the sub-population are then reintegrated into the sub-population of casualties involved in collisions that were only relevant for the assessed measure. This becomes the new refined target population for each measure, having had the effects of existing and other proposed measures removed.
4) FSO, SFS, F94, S95 all remain as a refined TP because, as determined by ACEA, the effects are not well enough known to generate an EE.
5) The HED and REV measures have an EE generated using literature references. Note that for REV this is determined by a case-by-case analysis provided by other centres5.
5 TRL were not required to complete case-by-case for REV due to small sample sizes. Awaiting the REV
effectiveness from other centres, so in this report it remains as a refined TP only.

Effectiveness Estimates
v3.0 13 PPR844
6) In the case of ISA and VIS, the effectiveness values are determined from new case-by-case research performed by TRL (see Section 3.5.2 for a detailed description of how the ISA and VIS effectiveness estimates were derived and Section 4.1.1 and 4.2.1 for detailed results).
7) The final casualty effectiveness estimates (EE) are generated for HED, REV, VIS and ISA. Any casualties that are unaffected by the measures are the remaining casualties.
The resulting casualties provide the anticipated target population for the original measure being assessed. This approach applies the effectiveness estimates of other proposed and mandated measures to account for the overlapping target populations of the proposed measures. As a result, a more accurate estimate of the anticipated target population is gained. The process is repeated for each of the eight measures being assessed in Figure 2. At every stage the effectiveness estimates are applied to the cohorts of fatal, serious and slightly injured casualties within the sub-population to preserve the proportionality.
It is important to note here that the fitment or uptake of each safety measure in the vehicle fleet is not being modelled. It is assumed that all measures are found on 100% of the vehicles. This is regardless of the measure and its stage of development in the market. For example, ESC was first launched in 1995 and its fleet penetration is now quite high since it became mandatory. However other systems, such as AEB have not yet been mandated, and are fitted to a much smaller proportion of the fleet. This report does not consider the fleet penetration of the systems because this was not required by ACEA.
For each of the eight measures being assessed there are multiple other measures that are considered. These were predetermined by ACEA and are detailed in Table 4. The process of how the sub-populations are derived for the additional measures and how the effectiveness estimates are applied to those sub-populations are shown in more detail in the following sections.

Effectiveness Estimates
v3.0 14 PPR844
Figure 7: Overview diagram of both of phases of the accident analysis methodology applied to each of the eight assessed measures. Key steps shown in red encircled numbers
Sub-population of
casualties in collisions
relevant for other
measures
All casualties in GB 2011-15
Estimated Gross Target Populations for
each assessed measure
Casualties in relevant collisions for each
assessed measure
Sub-population of
casualties in collisions
not relevant for other
measures
Casualties not
affected by proposed
measures
Casualties avoided by
proposed measures
Effectiveness estimates from
literature:
ESC, AEB, LKA, AEB-PCD
Effectiveness estimates from
new case by case analysis:
ISA, VIS
Remaining casualty target
population for assessed
measure
1
2
3
Method in 3.5.2.
Results in 4.1, 4.2, &
Appendix A & Appendix B
Ph
ase
1 (
RQ
1)
Ph
ase
2 (
RQ
2)
Method in 3.5.1
Method in
3.4
Casualties not
affected by
studied measures
Casualties
avoided by
studied measures
FSO, SFS, F94, S95
Stay as a refined TP only
ISA, VIS, HED, REV
Effectiveness estimates
from literature:
HED, REV 4
5 6
7

Effectiveness Estimates
v3.0 15 PPR844
Table 4: Approach to generation of the effectiveness estimates; list of measures and combinations
Measures & Vehicle types
Existing measures Proposed measures Studied measures
VIS - Front End Design N3
- Extending direct driver vision (cbc) - VRU detection (cbc) - AEB VRU (cbc)
ISA - Intelligent Speed Adaptation M1/N1
- ESC (lit.) - LDW/LKA (lit.) - AEB (lit.) - AEB pedestrian / cyclist (lit.)
- ISA (cbc)
ISA - Intelligent Speed Adaptation M2/N2 M3/N3
- Speed limiter (cbc) - LDW/LKA (lit.) - AEB (lit.)
- ISA (cbc)
FSO - Small overlap M1
- ESC (lit.) - ISA (cbc) - LDW/LKA (lit.) - AEB (lit.)
- FSO passive safety test (tp)
SFS - Far side occupant protection M1
- ESC (lit.) - ISA (cbc) - AEB stationary vehicle (lit.)
- SFS passive safety test (tp)
F94 - Frontal Crash M1/N1 now excluded
- ESC (lit.) - ISA (cbc) - LDW/LKA (lit.) - AEB (lit.)
- F94 impact test (tp)
S95 - Lateral Crash M1/N1 now excluded
- ESC (lit.) - ISA (cbc) - AEB stationary vehicle (lit.)
- S95 impact test (tp)
HED - Adult head to windscreen M1
- ISA (cbc) - AEB pedestrian / cyclist (lit.)
- HED passive safety test (lit.)
REV - Reverse detection N2/N3/O
- Reverse detection (lit. from other centres)
(Method used for benefit determination: lit.= literature review, cbc=case-by-case, tp=target population only)

Effectiveness Estimates
v3.0 16 PPR844
3.3 Multiple measures
Some collisions and their casualties naturally fall into the target populations of multiple measures. For example, this means that if we are to understand the anticipated casualty benefit from ISA alone when LKA, ESC and AEB are also present, we must apply the effectiveness estimates of the other measures to the casualties who also appear in the ISA target population. Figure 8 illustrates this example for the ISA target population overlapping with the other measures. Considering the effect of other proposed measures prevents double counting casualties and provides a more accurate estimate of the casualty benefits of the assessed measures.
Figure 8: Example of overlapping target populations between measures. Anticipated target populations must consider effectiveness of the other measures for the casualties
who appear in multiple target populations
The other proposed measures to be considered have been specified by ACEA prior to the analysis and include:
ESC – Electronic Stability Control
LKA – Lane Keep Assist
AEB – Autonomous Emergency Braking
AEB (pedestrian/cyclist) – Autonomous Emergency Braking for pedestrians and cyclists
ISA – Intelligent Speed Assist
AEB
ESC LKA
ISA

Effectiveness Estimates
v3.0 17 PPR844
The anticipated casualty benefits for the eight assessed measures were determined by applying the effectiveness estimates to the Phase 1 target populations following the steps in Figure 9 which considers existing, proposed measures plus the study measures.
Figure 9: Steps in applying effectiveness estimates to define the anticipated casualty benefits
The existing measures include ESC for M1 and N1 vehicles, and LKA, AEB and Speed Limiter for M2, M3, N2, and N3 vehicles.
The other proposed measures include LKA, AEB, AEB (pedestrian/cyclist), ISA for M1 and N1 vehicles. The effectiveness estimates of these measures have already been studied so their effectiveness has been derived from the literature detailed in section 3.5.1.
The combination of other measures to be considered for each of the eight assessed measures has also been specified by ACEA prior to the analysis and is detailed in Table 4. The other measures are grouped into;
Existing measures already mandated
Proposed measures
Measures being studied in this report
RQ2.1: Existing Measures
•Sub-populations considering potential benefits of existing measures
•Expected reduction of the target populations according to potential benefits of existing measures (already mandatory, for example: ESC)
RQ2.2: Proposed Measures
•Sub-populations according to potential benefits of other proposed measures
•Expected reduction of the target populations according to potential benefits of other measures proposed in GSR revision (for example: AEB)
•Multiple sub-populations according to the different proposed measures and their combinations (see Table 2)
RQ2.3: Studied Measures
•Potential benefits of studied measures
•Expected benefits of the measure considered alone or in combinations with other proposed measures
•Multiple expected benefits according to the different proposed measures and their combinations (see below: List of measures and combinations)

Effectiveness Estimates
v3.0 18 PPR844
The resulting target populations represent the potential casualty benefit for the assessed measures. However, effectiveness estimates for some of the assessed measures are available so it is possible to more accurately determine the anticipated casualty benefits for:
ISA
VIS
HED
The remaining assessed measures without effectiveness estimates can only provide the target population, and this is the case for FSO, SFS, F94, S95 and REV.
Only the eight measures in Figure 2 are considered. If more were taken into account then the resulting TP and EE estimates would likely become smaller. The combinations and sequences of the measures have been selected by ACEA, and they roughly align with the sequence in which the technology would take an effect in the course of a collision.

Effectiveness Estimates
v3.0 19 PPR844
3.4 Calculating the new Target Populations and Effectiveness Estimates
Within the TP for ISA, there are some loss of control crashes that might be relevant to be addressed by ESC, so the ISA TP is divided into two pots of ESC relevant or not. The literature effect for ESC is only applied to the ESC relevant casualties within the ISA TP, and an example of this is illustrated in Figure 10.
Figure 10: Example of how the literature effect of ESC (an existing measure) could be applied to a Target Population (TP); generates a new TP that is taken to the next step in
the calculation sequence of other and studied measures
Figure 11 illustrates the ISA M1 example whereby first the casualties avoided by the existing measure (ESC) are removed. Next the casualties avoided by the proposed measures (LDW/LKA, AEB and Pedestrian/cyclist AEB) are removed. This reduces the TP for ISA to allow for the multiple measures. Finally the casualties saved by ISA are identified by using the effectiveness value identified in the case-by-case analysis. By subtracting the ISA casualties saved from the new ISA TP, this also reveals the remaining casualties in the ISA TP that are not being addressed by ISA and the other associated measures.
Figure 11 illustrates an example of the overall approach to how the sub-populations of the other measures are taken from the initial estimated target population from Phase 1.
The FSO, SFS, F94, and S95 measures are determined by ACEA to be not well enough defined, and so they will remain at the target population level without any effectiveness estimates found in the literature and no case-by-case analysis being conducted.
ISA TP from Phase 1,RQ1
ISA TP divided by ESCrelevant crashes
ESC casualty savingsremoved
New ISA TP goes to next step in calculation sequence…
Continues through rest of sequence of measures
ESC savings subtracted
by mulitplying
by the litrature review effect
No
n-E
SC r
elev
ant
No
n-E
SC r
elev
ant
ISA
TP
ISA
TP
aft
er E
SC r
emo
ved
ESC
re
du
ced
ESC
re
leva
nt

Effectiveness Estimates
v3.0 20 PPR844
Figure 11: ISA for M1/N1 example of approach to generation of the effectiveness estimate

Effectiveness Estimates
v3.0 21 PPR844
Each measure has calculations completed separately. Each vehicle type grouping, as defined by ACEA in Table 4, is treated separately within each measure.
The calculations are completed for each cohort of fatal, serious or slight casualties independently in order to preserve the proportionality of each severity within the sample. This step is not detailed in Figure 7 but is important in order not to skew the final anticipated casualty benefits by biasing the removal of casualties from any of the cohorts of injury severity.
The effect of the various measures is multiplied in series. For example, ISA M1 in Table 7 the measures are ordered ESC, LDW/LKA, AEB, AEB-PCD and finally ISA. However if these were in a slightly different order a given measure may appear to be more or less effective. However the final result, or the EE at the end of the chain of the multiplication, will remain the same. Therefore the casualties saved are not presented for individual measures or the individual steps in the multiplication, but only to the final EE result.
The criteria for selecting the existing and proposed measures’ sub-populations were chosen to match either the literature that determined the effectiveness estimates (shown in Table 5) or the criteria that determined the population of in-depth collisions for the case-by-case analysis of ISA and VIS. The effectiveness estimates are then applied directly to the sub-populations.
Speeding is under-reported in STATS19 in comparison to the in-depth data of RAIDS, so in addition to the above some account has to be made for this under-reporting in order to match the approach used in Phase 1 / RQ1. In the generation of the ISA TP the sample was multiplied up based on the DfT road safety research report No. 117 (Richards et al., 2010). The same approach was used in the calculation of the EE for ISA in this report.
However, where ISA is an existing or other proposed measure to the measure being studied (FSO, F94, S95, HED) it has not been possible to account for the under-reporting of speeding recorded in STATS19 in the same was as where ISA is the studied measure. The result is to under-estimate the effect of ISA.

Effectiveness Estimates
v3.0 22 PPR844
Table 5: Sub-population criteria for existing, proposed and studied measures
Measure Reference Collision criteria
ESC Hoye (2011) 6 Loss of control crashes
LKA Sternlund et al. (2017) 7 Head-on and single-vehicle crashes
Speed limit between 40 and 70 mph (70 and 120 km/h) Dry/wet surface not covered by ice or snow
AEB Fildes et al. (2015) 8 Rear-end crashes
Car to car (4 wheelers and more)
AEB pedestrian /cyclist Schneider et al. (2017)9 All killed and seriously injured pedestrians and cyclists hit by the front of M1 vehicles
HED Schneider et al. (2017) All killed and seriously injured pedestrians and cyclists hit by the front of M1 vehicles
ISA – Intelligent Speed Assistance
Stats19 populations plus case by case analysis; with criteria to match phase 1 / RQ1
CF306: Vehicle exceeding the speed limit Police attended scene Illegal behaviours excluded: CF206: Overloaded or poorly loaded vehicle or trailer CF301: Disobeyed automatic traffic signal CF302: Disobeyed Give Way or Stop sign or markings CF303: Disobeyed double white lines CF304: Disobeyed pedestrian crossing facility CF305: Illegal turn or direction of travel CF501: Impaired by alcohol CF502: Impaired by drugs (illicit or medicinal) CF504: Uncorrected, defective eyesight CF506: Not displaying lights at night or in poor visibility CF508: Driver using mobile phone CF901: Stolen vehicle CF902: Vehicle in course of crime
VIS – improved front end design for direct and indirect driver vision
Stats19 populations plus case by case analysis; with criteria to match phase 1 / RQ1
Vehicle type = N2, N3, N unk* 1st point of impact = front or side Single vehicle accident, with pedestrian Vehicle type = N2, N3, N unk 1st point of impact = front or side 2 vehicle accident, no pedestrian Other vehicle type = pedal cycle Manoeuvres excluded: Parked, reversing, U turn, Waiting to turn left or right, Unknown
FSO – Frontal impact Small Overlap crash test
Stats19 populations with criteria to match phase 1 / RQ1
Single vehicle, no pedestrians Vehicle type = M1 1st point of impact = front Object hit on carriageway = 1-4,6-7,11 OR object hit off carriageway = 1-4,6-7,9-11 vehicle manufacture 2004+ 2 vehicles, no pedestrians Vehicle type = M1 1st point of impact = front vehicle manufacture 2004+
SFS – Side impact Far Side occupant crash test
Stats19 populations with criteria to match phase 1 / RQ1
M1 front seat occupant casualties opposite side of vehicle to first point of impact Vehicle manufacture 2004+
F94 – Frontal Impact Crash Test (removal of exemptions from Regulation 94)
Stats19 populations with criteria to match phase 1 / RQ1
M1 and N1 vehicles with first point of impact = front M1 restricted to large family car, executive, 4x4 and MPV for gross vehicle weight >2500kg
S95 – Side Impact Crash Test (removal of exemptions from Regulation 95)
Stats19 populations with criteria to match phase 1 / RQ1
M1 and N1 vehicles with first point of impact = side R height >700mm (lookup table provided by ACEA)
HED – Adult Head to Windscreen Area
Stats19 populations with criteria to match phase 1 / RQ1
M1 vehicle with 1st point of impact = front Pedestrian hit by vehicle M1 vehicle with 1st point of impact = front 2 vehicle accident with other vehicle = pedal cycle
REV – Reversing Detection Stats19 populations with criteria to match phase 1 / RQ1
N2 and N3 vehicles with vehicle manoeuvre = reversing and hit a pedestrian N2 and N3 vehicles with vehicle manoeuvre = reversing and in 2 vehicle accident with pedal cycle
* N Unknown vehicles are included as they are still applicable, it is not known if they are N2 or N3.
6 Hoye (2011) The effects of Electronic Stability Control (ESC) on crashes-An update; Accident Analysis and Prevention 43(3):1148-59 - May 2011
7 Sternlund et al. (2017) The effectiveness of lane departure warning systems - A reduction in real-world passenger car injury crashes, Traffic Injury Prevention, 18:2, 225-
229
8 Fildes et al. (2015) Effectiveness of low speed autonomous emergency braking in real-world rear-end crashes, Accident Analysis and Prevention 81 (2015) 24-29
9 Analysis on behalf of ACEA by Schneider et al, 2017.

Effectiveness Estimates
v3.0 23 PPR844
(this page is intentionally blank)

Effectiveness Estimates
v3.0 24 PPR844
3.5 Effectiveness estimates
3.5.1 Effectiveness values: Literature
The review of effectiveness estimates from the literature was not performed by TRL; instead a literature review of effectiveness was provided by ACEA. These sources are also being used by the EC review work, so are relevant for use in this report which will also inform the EC review. The literature review covered the effectiveness of the following measures:
• ESC • LDW/LKA • AEB • AEB pedestrian/cyclist • HED (adult head to windscreen; pedestrian protection airbag)
These will have a literature effect applied where a population of relevant casualties is identified. Table 6 summarises the literature derived effectiveness values.
Table 6: Effectiveness values from literature for other measures and assessed measures
Measure Reference Effectiveness [95% confidence limits]
ESC Hoye (2011) Fatality reduction by 38% [15%-55%] Injury reduction by 21% [16%-27%]
LKA Sternlund et al. (2017)
Reduction by 53% [11%-75%] (all injury severities)
AEB Fildes et al. (2015)
Reduction by 38% [18%-53%] (all injury severities)
AEB pedestrian/cyclist Schneider et al. (2017)
45.9% (all injury severities)
HED Schneider et al. (2017)
19.89% (Fatal pedestrians); 2.80% (Serious pedestrians); 0.00% (All cyclists)
These effectiveness values from the literature sources apply to collisions based on the criteria, and consequently all of the casualties in that collision would be saved. However, the calculations of TP and EE in this report are regarding casualties, and not collisions. The effectiveness rates are applied to the casualties without any modification, which assumes a 1:1 relationship between collisions and casualties. The relevant effect values for casualties are not available in enough detail (for each severity level), so the only option is to use the values as they are. Overall the effectiveness rates are likely underestimated because additional casualties would be saved for each collision, so the resulting EE within this report are similarly underestimated.

Effectiveness Estimates
v3.0 25 PPR844
3.5.2 Effectiveness values: Case-by-case for ISA and VIS
The effectiveness values for ISA and VIS were derived from novel research undertaken by TRL using the in-depth collision case studies from the RAIDS database. Relevant collisions were reviewed by expert investigators who assessed whether ISA or VIS could have resulted in the collision being avoided.
The result from the ISA measure was used in FSO, SFS, F94, S95 and HED as the effect of other proposed measures. The effectiveness values from ISA and VIS were used when they are the assessed measure to determine the final casualty benefits for each.
A maximum of 100 cases were reviewed per measure due to time constraints, but in some cases the available sample size was limited to less than 100 cases. The case reviews were completed by expert accident investigators with skills in accident reconstruction.
To assess the effectiveness of ISA (Intelligent Speed Adaptation) and VIS (Front End Design), the following procedure was developed and followed.
Figure 12. Procedure for case-by-case reviews
The first step in the method was to define the sample. To select all appropriate and relevant cases from the RAIDS database for each of the measures to be assessed, a case selection criterion defining the target population was developed and this has already been presented in Table 5. In addition to this, the case-by-case analysis required some additional consideration of the sample, and this is described below in Table 7.
1) Case selection criteria
2) Development of assessment tool
3) Case by case assessments

Effectiveness Estimates
v3.0 26 PPR844
Table 7. Additional case selection criteria for the case-by-case reviews, and a description of the sampling/scaling approach
Measure Case selection criteria Sample and scaling
ISA Heavy vehicles:
Vehicle speed is reliable (i.e. based on evidence or reconstruction)
This resulted in under 100 cases so all cases were examined (the sample was not representative of STATS19) Scaling was applied by matching the proportions by injury severity, carriageway class and built-up/non-built-up area of STATS19
ISA Cars: Vehicle speed is reliable (i.e. based on evidence or reconstruction)
This resulted in more than 100 cases so a representative sample was selected to match the distribution of injury severity, carriageway class and built-up/non-built-up area of STATS19
VIS: This resulted in under 100 cases so all cases were examined (the sample was not representative of STATS19) Scaling was applied by matching the proportions by injury severity, carriageway class and built-up/non-built-up area of STATS19
The second step in the process was to develop an appropriate assessment tool for each measure. The tool was of a spreadsheet for recording the relevant parameters explaining the collision and influencing factors of vehicle, infrastructure and human in detail. The tool also contains parameters developed to evaluate the system’s potential ability to mitigate or avoid the collision. The effectiveness was further quantified based on the confidence level of the case assessors.
The third stage in the procedure was the examination of the cases individually by a team of expert investigators. A quality lead was assigned in order to ensure quality and consistency of the coding approach and to answer questions as they arose. The quality lead also reviewed the first five cases coded by each assessor, and feedback was given where needed to ensure consistency.
The selected VIS cases were assessed by considering specific contributing factors such as collision conditions, vehicle type, direct and indirect visibility, VRU type, critical events, collision configuration, vehicle speeds and trajectories, HGV driver’s perception and reaction, VRU position with respect to the HGV, injury mechanism and injury severity. The effectiveness of VIS was evaluated by application of the below sub-measures:
VIS 1 - Best in class direct visibility cab
VIS 2 - High direct visibility cab
VIS 3 - Front/side detection
VIS 4 - Front/side detection + AEB

Effectiveness Estimates
v3.0 27 PPR844
Figure 13: Summary of technical specification of the ISA and VIS measures

Effectiveness Estimates
v3.0 28 PPR844
Each ISA case was assessed based on specific contributing factors such as collision conditions, vehicle type, speed limit at the locus, vehicle trajectories, travelling speed, intentional / unintentional speeding, human factors and time to collision variables. The effectiveness was assessed based on the potential ability of ISA, warning or overriding the vehicle driver to mitigate or avoid the collision, thereby reducing the impact energy or change collision configuration or both.
The technical specification of the measures was provided by ACEA, and is summarised below in Figure 14.
The effectiveness of each sub-measure was further quantified based on the potential ability of assisting the vehicle driver to mitigate or avoid the collision. The investigators assigned a level of confidence to each avoidance and mitigation code; the confidence levels were: none, low, medium and high. The investigators were given the guidance in Table 8 as to how to apply these levels of confidence. For example, a ‘high’ confidence would be a likelihood of over two thirds and ‘definitely’ confident that the measure would have an avoidance effect.
Table 8: Guidance on confidence for expert investigators assessing the avoidance and mitigation effect of the measure
Confidence % Description
None 0 None
Low 1-33 Possibly
Medium 34-66 Probably
High 67+ Definitely
These confidence levels were then used to derive the effectiveness values for use in the overall calculations. Taking the whole sample of cases assessed for avoidance effect, a total percentage of high, medium and low confidence was found. Then three rules were used to generate the values, and these are illustrated in Figure 14 and described below:
1) High confidence = Lower effectiveness estimate
The portion of high confidence was assumed to represent the lowest level of effect, i.e. because these cases had high confidence then we might expect at least that number to be avoided.
2) High + Medium confidence = Predicted effectiveness estimate
The high and medium confidence group were added together, and this was assumed to be the predicted level of effect, i.e. we could be reasonably confident that this proportion of cases would be avoided.
3) High + Medium + Low confidence = Upper effectiveness estimate
All three groups were added together; high, medium and low confidence. This represented to the total possible effect. However by including even the low confidence predictions of effect, this group was less likely to happen in reality, and therefore represented the upper estimate of effectiveness.

Effectiveness Estimates
v3.0 29 PPR844
Lower effectiveness estimate is assumed to be represented by the % of high confidence
Predicted effectiveness estimate is assumed to be
represented by the high confidence and medium
confidence summed together
Upper effectiveness estimate is assumed to be represented by the high, medium and low confidence summed together
Figure 14: Schematic for how the effectiveness estimates are derived from the confidence levels coded in the case-by-case reviews
0%
25%
50%
75%
100%%
co
nfi
de
nce
or
% e
ffec
tive
ne
ss e
stim
ate;
n
um
ber
s in
th
is c
har
t ill
ust
rati
ve o
nly
, no
t re
al
High
confidence
High
confidence
High
confidence
Medium
confidence
Low
confidence
Medium
confidence
Lower
effectiveness
estimate
Predicted
effectiveness
estimate
Upper
effectiveness
estimate

Effectiveness Estimates
v3.0 30 PPR844
These high, predicted, and lower estimates are not the same as the 5th percentile, median, and 95th percentile boundaries quoted from the statistical studies in the literature. They are different measures and so are not comparable. The estimates used for the case-by-case analysis cannot be statistically modelled with confidence intervals due to the small sample sizes; however, the approach taken using the confidence levels recorded by the investigators is taken to provide an indication of the potential range of effect.
These effectiveness values are used in combination with the sequence of calculations to calculate the EE from the TP. Figure 15 illustrates how these values are implemented after the effect of the existing and proposed measures have already been applied to generate the new TP. The ISA effectiveness values are also used where ISA is a proposed measure for another main measure (e.g. FSO, SFS, F94, S95 and HED - see Table 4).
Further detailed analysis of the ISA and VIS measures can be found in Appendix A and Appendix B respectively.
Figure 15: Illustration of the use of the effectiveness values derived from case-by-case analysis
The first step in the sequence of calculations removes the casualties avoided by existing and proposed measures, and generates a new, more refined TP for the measure. Thereafter the effectiveness values from the case-by-case analysis of ISA and VIS are used to generate the EE. These EE have a lower, predicted, and upper estimate based on the various combinations of levels of confidence of an avoidance effect, as in Figure 14. Where there was no confidence of an effect, but the casualties did fall into the TP, then this remains as ‘in target population but not affected’. When these are added to the casualties that are not in the TP, then this represents the remaining casualties.
The analysis model then incorporates the mitigation effect of ISA which occurs when the collision was unavoidable but the case-by-case assessment revealed a likelihood that the speeding vehicle would abide by an ISA system and the reduced collision energy from a lower impact speed would have resulted in less severe injuries. In this report injury mitigation is defined as a reduction in injury severity from Fatal to Serious or Serious to
Effectiveness Estimates
v3.0 31 PPR844
Slight. Slight injuries are not considered in the mitigation model due to the difficulty in preventing minor injuries when the collision is not avoidable.
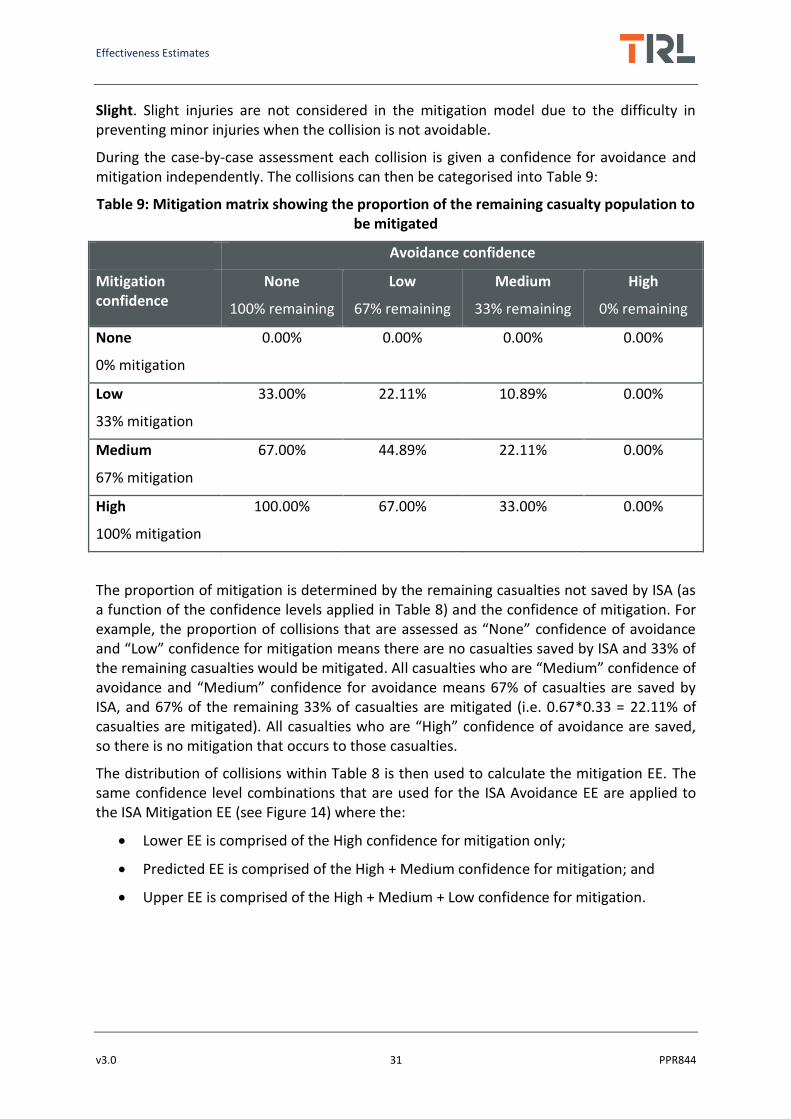
During the case-by-case assessment each collision is given a confidence for avoidance and mitigation independently. The collisions can then be categorised into Table 9:
Table 9: Mitigation matrix showing the proportion of the remaining casualty population to be mitigated
Avoidance confidence
Mitigation confidence
None
100% remaining
Low
67% remaining
Medium
33% remaining
High
0% remaining
None
0% mitigation
0.00% 0.00% 0.00% 0.00%
Low
33% mitigation
33.00% 22.11% 10.89% 0.00%
Medium
67% mitigation
67.00% 44.89% 22.11% 0.00%
High
100% mitigation
100.00% 67.00% 33.00% 0.00%
The proportion of mitigation is determined by the remaining casualties not saved by ISA (as a function of the confidence levels applied in Table 8) and the confidence of mitigation. For example, the proportion of collisions that are assessed as “None” confidence of avoidance and “Low” confidence for mitigation means there are no casualties saved by ISA and 33% of the remaining casualties would be mitigated. All casualties who are “Medium” confidence of avoidance and “Medium” confidence for avoidance means 67% of casualties are saved by ISA, and 67% of the remaining 33% of casualties are mitigated (i.e. 0.67*0.33 = 22.11% of casualties are mitigated). All casualties who are “High” confidence of avoidance are saved, so there is no mitigation that occurs to those casualties.
The distribution of collisions within Table 8 is then used to calculate the mitigation EE. The same confidence level combinations that are used for the ISA Avoidance EE are applied to the ISA Mitigation EE (see Figure 14) where the:
Lower EE is comprised of the High confidence for mitigation only;
Predicted EE is comprised of the High + Medium confidence for mitigation; and
Upper EE is comprised of the High + Medium + Low confidence for mitigation.

Effectiveness Estimates
v3.0 32 PPR844
4 Results
The following section details the:
Casualty target population determined from Phase 1 in severity cohorts
The saved casualty estimates from the existing and proposed measures
The resulting new TP after the savings from the existing and proposed measures
The saved casualty estimates for the studied measures
The resultant remaining casualty population
This is summarised in Figure 16 and is repeated for each proposed measure in line with Table 3. For each measure the results are given for each severity level (fatal, serious and slight injuries) as well as a total. In addition the lower, predicted, and upper estimates are provided to indicate the possible range within the estimated casualty savings.
Figure 16: Description of results presented
TP
Refined TP
Remaining casualties
•From Phase 1 / RQ1
•After existing and proposed measures
•After studied measures
Target Population (TP) from Phase 1 /
RQ1
Saved casualty estimates from
existing measures
Saved casualty estimates from
proposed measures
New TP after the savings from existing
and proposed measures
Saved casualty estimates EE for the
studied measure
Resultant remaining casualty population

Effectiveness Estimates
v3.0 33 PPR844
4.1 Front End Design (VIS)
4.1.1 Case-by-case analysis
The sample details of the case-by-case analysis for the VIS measure are given in Appendix B.1. The percentage of collisions which could have been avoided/ mitigated with improved vision measure (VIS) and its confidence is shown in Figure 17.
A confidence of low, medium and high was specified per investigators judgement on avoidance or mitigation of incident with improved vision measures (VIS). If the investigator had no confidence in VIS affecting the collision then it was coded as ‘None’.
Of the sample with low confidence in VIS, 22% had avoidance and 23% had confidence of mitigation. Of the sample with medium confidence, 20% had avoidance and 16% had confidence of mitigation. Of the sample with high confidence, 8% had avoidance and 16% had confidence of mitigation. Of the sample with no confidence in VIS, 49% had avoidance and 46% had mitigation.
Figure 17: VIS effectiveness for sample
In general, the overall confidence in mitigating the incidents with Improved Vision measures was found to be higher than avoiding it.
The effect of all Front End Design measures (VIS) on the sample is shown in Figure 18 with confidence in avoidance along the x-axis and confidence in mitigation along the y-axis.
Of the sample, 45% of cases represented on the lower left corner had no confidence of avoidance and no confidence of mitigation. 18% of cases represented in blue had low confidence of avoidance and low confidence of mitigation. 12% of cases represented in yellow had medium confidence of avoidance and medium confidence of mitigation. 8% of cases represented in grey had high confidence of avoidance and high confidence of
49%
22% 20%
8%
46%
23%
16% 16%
0%
10%
20%
30%
40%
50%
60%
70%
80%
90%
100%
None low medium High
Avoid
Mitigate

Effectiveness Estimates
v3.0 34 PPR844
mitigation. Overall the trend shows higher confidence in mitigation (54%) than avoidance (51%).
Figure 18: VIS confidence for sample (all four VIS measures)
Figure 19 summarises the overall effectiveness of Best in Class Direct Visibility cab countermeasure on the sample. In conclusion, 36% of the sample had confidence of avoidance and 37% had confidence of mitigation. 64% of the sample had no confidence and 63% had no confidence of mitigation in Best in Class Direct Visibility cab countermeasure. These are the findings that are used in the overall calculations of the EE.
Figure 19: Overall effectiveness of Best in Class Direct visibility cab

Effectiveness Estimates
v3.0 35 PPR844
Figure 20 summarises the overall effectiveness High Direct Visibility cab countermeasure on the sample. In conclusion, 48% of the sample had confidence of avoidance and 49% had confidence of mitigation. 52% of the sample had no confidence of avoidance and 51% had no confidence of mitigation in High Direct Visibility cab countermeasure. These are the findings that are used in the overall calculations of the EE.
Figure 20: Overall effectiveness of High Direct Visibility Cab

Effectiveness Estimates
v3.0 36 PPR844
Figure 21 summarises the overall effectiveness of Forward and Side VRU Detection countermeasure on the sample. In conclusion, 47% of the sample had confidence of avoidance and 47% had confidence of mitigation. 53% of the sample had no confidence of avoidance and 53% had no confidence of mitigation in Forward and Side VRU Detection. These are the findings that are used in the overall calculations of the EE.
Figure 21: Overall effectiveness of Front and Side VRU detection
Figure 22 summarises the overall effectiveness of Forward and Side VRU Detection with AEB countermeasure on the sample. In conclusion, 71% of the sample had confidence of avoidance and 85% had confidence of mitigation. 29% had no confidence of avoidance and 15% had no confidence of mitigation in Forward and Side VRU Detection with AEB countermeasure. These are the findings that are used in the overall calculations of the EE.
Figure 22: Overall Effectiveness of Front and Side VRU detection with AEB

Effectiveness Estimates
v3.0 37 PPR844
4.1.2 VIS 1 – Best in Class
The four variants of the VIS measure are assessed independently of each other so the casualty benefits must be viewed independently and cannot be totalled between measures.
Table 10 shows a predicted saving of 90 (3% of all relevant casualties) pedestrian or cyclist casualties (9 fatalities, 24 seriously injured and 57 slightly injured) over a 5 year period if N3 and N2 (including N Unknown) vehicles were fitted with a cab design that offers the current best-in-class levels of direct vision. The variance in the prediction ranges from a minimum saving of 29 casualties up to 1087 casualties saved over a 5 year period.
No existing or other measures were considered in the casualty saving prediction model and there is no mitigation effect for this measure.
Figure 23 graphically represents the values shown in the total predicted column, with the lower and upper estimates expressed as confidence intervals.
Table 11, Table 12 and Table 13 show the same breakdown of figures for casualties caused by N2, N3 and N Unknown vehicles respectively.

Effectiveness Estimates
v3.0 38 PPR844
Table 10: VIS 1 – Best in Class, All N vehicles; calculation of Effectiveness Estimate (EE)
Total
Fatal Serious Slight Total
Lower Est.
Predicted Est.
Upper Est.
Lower Est.
Predicted Est.
Upper Est.
Lower Est.
Predicted Est.
Upper Est.
Lower Est.
Predicted Est.
Upper Est.
RQ1 TP 312 312 312 810 810 810 1896 1896 1896 3018 3018 3018
Existing Measure Savings - - - - - - - - - - - - Other Measure Savings - - - - - - - - - - - -
Assessed Measure TP 312 312 312 810 810 810 1896 1896 1896 3018 3018 3018 Assessed Measure Savings 3 9 112 8 24 292 18 57 683 29 90 1087
Total Savings 3 9 112 8 24 292 18 57 683 29 90 1087 Remaining Casualties 309 303 200 802 786 518 1878 1839 1213 2989 2928 1931
Figure 23: VIS1 - total predicted estimate of casualties saved by measure type
0
500
1000
1500
2000
2500
3000
3500
RQ1 TP Existing
Measure
Savings
Other
Measure
Savings
Assessed
Measure
Savings
Remaining
Casualties
Interpretation Notes: • Caution should be applied if summing or comparing the results between
measures due to different methods in the generation of the TPs. Some TPs were refined to a greater level of detail than others (see RQ1 report)
• The sequence of the other and existing measures in the calculations is based on the chronology of a crash. If the sequence were altered then it would make an individual measure appear more or less effective, so the results at each step in the calculation should be treated with caution. The final result generating the Effectiveness Estimate from the Target Popultion remains the same (as long as no additional measures are added).
• The result for an existing or proposed measure is only in the context of the Target Population of the studied measure. It should not be interpreted out of context as a finding of overall effect on the whole casualty population.
• The confidence intervals should be interpreted with caution. For some literature measures the 5th and 95th percentile confidence intervals are not available, so the median has been used; this would make a result appear with narrower upper and lower estimates and appear more confident than it actually is.
• Caution should be applied when looking at the VIS and ISA upper and lower estimates, which are not the 5th and 95th percentile confidence intervals. Instead these are an interpretation of the different levels of confidence in avoidance. Lower estimate = high confidence only; predicted estimate = high + medium confidence; upper estimate = high + medium + low confidence
• The Target Population (TP) has been updated since the last version of Phase 1 / RQ1. These changes will be reflected in the RQ1 report in due course.

Effectiveness Estimates
v3.0 39 PPR844
Table 11: VIS 1 – Best in Class, N2 vehicles; calculation of Effectiveness Estimate (EE)
N2 Fatal Serious Slight Total
Lower Est.
Predicted Est.
Upper Est.
Lower Est.
Predicted Est.
Upper Est.
Lower Est.
Predicted Est.
Upper Est.
Lower Est.
Predicted Est.
Upper Est.
RQ1 TP 36 36 36 232 232 232 825 825 825 1093 1093 1093
Existing Measure Savings - - - - - - - - - - - - Other Measure Savings - - - - - - - - - - - -
Assessed Measure TP 36 36 36 232 232 232 825 825 825 1093 1093 1093 Assessed Measure Savings 0 1 13 2 7 84 8 25 297 10 33 394
Total Savings 0 1 13 2 7 84 8 25 297 10 33 394 Remaining Casualties 36 35 23 230 225 148 817 800 528 1083 1060 699
Table 12: VIS 1 – Best in Class, N3 vehicles; calculation of Effectiveness Estimate (EE)
N3
Fatal Serious Slight Total
Lower Est.
Predicted Est.
Upper Est.
Lower Est.
Predicted Est.
Upper Est.
Lower Est.
Predicted Est.
Upper Est.
Lower Est.
Predicted Est.
Upper Est.
RQ1 TP 275 275 275 564 564 564 1015 1015 1015 1854 1854 1854
Existing Measure Savings - - - - - - - - - - - - Other Measure Savings - - - - - - - - - - - -
Assessed Measure TP 275 275 275 564 564 564 1015 1015 1015 1854 1854 1854 Assessed Measure Savings 3 8 99 6 17 203 10 30 366 19 55 668
Total Savings 3 8 99 6 17 203 10 30 366 19 55 668 Remaining Casualties 272 267 176 558 547 361 1005 985 649 1835 1799 1186

Effectiveness Estimates
v3.0 40 PPR844
Table 13: VIS 1 – Best in Class, N Unknown vehicles; calculation of Effectiveness Estimate (EE)
N Unknown
Fatal Serious Slight Total
Lower Est.
Predicted Est.
Upper Est.
Lower Est.
Predicted Est.
Upper Est.
Lower Est.
Predicted Est.
Upper Est.
Lower Est.
Predicted Est.
Upper Est.
RQ1 TP 1 1 1 14 14 14 56 56 56 71 71 71
Existing Measure Savings - - - - - - - - - - - - Other Measure Savings - - - - - - - - - - - -
Assessed Measure TP 1 1 1 14 14 14 56 56 56 71 71 71 Assessed Measure Savings 0 0 0 0 0 5 0 2 20 0 2 25
Total Savings 0 0 0 0 0 5 0 2 20 0 2 25 Remaining Casualties 1 1 1 14 14 9 56 54 36 71 69 46

Effectiveness Estimates
v3.0 41 PPR844
4.1.3 VIS 2 – High direct visibility cab
Table 14 shows a predicted saving of 816 (27% of all relevant casualties) pedestrian or cyclist casualties (84 fatalities, 220 seriously injured and 512 slightly injured) over a 5 year period if N3 and N2 (including N Unknown) vehicles were fitted with a cab design that offers high levels of direct visibility. The variance in the prediction ranges from a minimum saving of 29 casualties up to 1449 casualties saved over a 5 year period.
No existing or other measures were considered in the casualty saving prediction model and there is no mitigation effect for this measure.
Figure 24 graphically represents the values shown in the total predicted column, with the lower and upper estimates expressed as confidence intervals.
Table 15, Table 16 and Table 17 show the same breakdown of figures for casualties caused by N2, N3 and N Unknown vehicles respectively.

Effectiveness Estimates
v3.0 42 PPR844
Table 14: VIS 2 – High direct visibility cab, All N vehicles; calculation of Effectiveness Estimate (EE)
VIS2 Total Fatal Serious Slight Total
Lower Est.
Predicted Est.
Upper Est.
Lower Est.
Predicted Est.
Upper Est.
Lower Est.
Predicted Est.
Upper Est.
Lower Est.
Predicted Est.
Upper Est.
RQ1 TP 312 312 312 810 810 810 1897 1897 1897 3019 3019 3019
Existing Measure Savings - - - - - - - - - - - - Other Measure Savings - - - - - - - - - - - -
Assessed Measure TP 312 312 312 810 810 810 1897 1897 1897 3019 3019 3019 Assessed Measure Savings 3 84 149 8 220 389 18 512 911 29 816 1449
Total Savings 3 84 149 8 220 389 18 512 911 29 816 1449 Remaining Casualties 309 228 163 802 590 421 1879 1385 986 2990 2203 1570
Figure 24: VIS2 - total predicted estimate of casualties saved by measure type
0
500
1000
1500
2000
2500
3000
3500
4000
RQ1 TP Existing
Measure
Savings
Other
Measure
Savings
Assessed
Measure
Savings
Remaining
Casualties
Interpretation Notes: • Caution should be applied if summing or comparing the results between
measures due to different methods in the generation of the TPs. Some TPs were refined to a greater level of detail than others (see RQ1 report)
• The sequence of the other and existing measures in the calculations is based on the chronology of a crash. If the sequence were altered then it would make an individual measure appear more or less effective, so the results at each step in the calculation should be treated with caution. The final result generating the Effectiveness Estimate from the Target Popultion remains the same (as long as no additional measures are added).
• The result for an existing or proposed measure is only in the context of the Target Population of the studied measure. It should not be interpreted out of context as a finding of overall effect on the whole casualty population.
• The confidence intervals should be interpreted with caution. For some literature measures the 5th and 95th percentile confidence intervals are not available, so the median has been used; this would make a result appear with narrower upper and lower estimates and appear more confident than it actually is.
• Caution should be applied when looking at the VIS and ISA upper and lower estimates, which are not the 5th and 95th percentile confidence intervals. Instead these are an interpretation of the different levels of confidence in avoidance. Lower estimate = high confidence only; predicted estimate = high + medium confidence; upper estimate = high + medium + low confidence
• The Target Population (TP) has been updated since the last version of Phase 1 / RQ1. These changes will be reflected in the RQ1 report in due course.

Effectiveness Estimates
v3.0 43 PPR844
Table 15: VIS 2 – High direct visibility cab, N2 vehicles; calculation of Effectiveness Estimate (EE)
VIS2 N2 Fatal Serious Slight Total
Lower Est.
Predicted Est.
Upper Est.
Lower Est.
Predicted Est.
Upper Est.
Lower Est.
Predicted Est.
Upper Est.
Lower Est.
Predicted Est.
Upper Est.
RQ1 TP 36 36 36 232 232 232 825 825 825 1093 1093 1093
Existing Measure Savings - - - - - - - - - - - - Other Measure Savings - - - - - - - - - - - -
Assessed Measure TP 36 36 36 232 232 232 825 825 825 1093 1093 1093 Assessed Measure Savings 0 10 17 2 63 111 8 223 396 10 296 524
Total Savings 0 10 17 2 63 111 8 223 396 10 296 524 Remaining Casualties 36 26 19 230 169 121 817 602 429 1083 797 569
Table 16: VIS 2 – High direct visibility cab, N3 vehicles; calculation of Effectiveness Estimate (EE)
VIS2 N3 Fatal Serious Slight Total
Lower Est.
Predicted Est.
Upper Est.
Lower Est.
Predicted Est.
Upper Est.
Lower Est.
Predicted Est.
Upper Est.
Lower Est.
Predicted Est.
Upper Est.
RQ1 TP 275 275 275 564 564 564 1016 1016 1016 1855 1855 1855
Existing Measure Savings - - - - - - - - - - - - Other Measure Savings - - - - - - - - - - - -
Assessed Measure TP 275 275 275 564 564 564 1016 1016 1016 1855 1855 1855 Assessed Measure Savings 3 74 132 6 153 271 10 274 488 19 501 891
Total Savings 3 74 132 6 153 271 10 274 488 19 501 891 Remaining Casualties 272 201 143 558 411 293 1006 742 528 1836 1354 964

Effectiveness Estimates
v3.0 44 PPR844
Table 17: VIS 2 – High direct visibility cab, N Unknown vehicles; calculation of Effectiveness Estimate (EE)
VIS2 N Unknown Fatal Serious Slight Total
Lower Est.
Predicted Est.
Upper Est.
Lower Est.
Predicted Est.
Upper Est.
Lower Est.
Predicted Est.
Upper Est.
Lower Est.
Predicted Est.
Upper Est.
RQ1 TP 1 1 1 14 14 14 56 56 56 71 71 71
Existing Measure Savings - - - - - - - - - - - - Other Measure Savings - - - - - - - - - - - -
Assessed Measure TP 0 1 1 14 14 14 56 56 56 70 71 71 Assessed Measure Savings 0 0 0 0 4 7 0 15 27 0 19 34
Total Savings 0 0 0 0 4 7 0 15 27 0 19 34 Remaining Casualties 1 1 1 14 10 7 56 41 29 71 52 37

Effectiveness Estimates
v3.0 45 PPR844
4.1.4 VIS 3 – VRU Detection
Table 18 shows a predicted saving of 1208 (40% of all relevant casualties) pedestrian or cyclist casualties (124 fatalities, 324 seriously injured and 760 slightly injured) over a 5 year period if N3 and N2 (including N Unknown) vehicles were fitted with a system capable of detecting pedestrians and cyclists to the front and side of the vehicle and warning the driver of their presence. The variance in the prediction ranges from a minimum saving of 183 casualties up to 1420 casualties saved over a 5 year period.
No existing or other measures were considered in the casualty saving prediction model and there is no mitigation effect for this measure.
Figure 25 graphically represents the values shown in the total predicted column, with the lower and upper estimates expressed as confidence intervals.
Table 19, Table 20 and Table 21 show the same breakdown of figures for casualties caused by N2, N3 and N Unknown vehicles respectively.

Effectiveness Estimates
v3.0 46 PPR844
Interpretation Notes: • Caution should be applied if summing or comparing the results between
measures due to different methods in the generation of the TPs. Some TPs were refined to a greater level of detail than others (see RQ1 report)
• The sequence of the other and existing measures in the calculations is based on the chronology of a crash. If the sequence were altered then it would make an individual measure appear more or less effective, so the results at each step in the calculation should be treated with caution. The final result generating the Effectiveness Estimate from the Target Popultion remains the same (as long as no additional measures are added).
• The result for an existing or proposed measure is only in the context of the Target Population of the studied measure. It should not be interpreted out of context as a finding of overall effect on the whole casualty population.
• The confidence intervals should be interpreted with caution. For some literature measures the 5th and 95th percentile confidence intervals are not available, so the median has been used; this would make a result appear with narrower upper and lower estimates and appear more confident than it actually is.
• Caution should be applied when looking at the VIS and ISA upper and lower estimates, which are not the 5th and 95th percentile confidence intervals. Instead these are an interpretation of the different levels of confidence in avoidance. Lower estimate = high confidence only; predicted estimate = high + medium confidence; upper estimate = high + medium + low confidence
• The Target Population (TP) has been updated since the last version of Phase 1 / RQ1. These changes will be reflected in the RQ1 report in due course.
Table 18: VIS 3 – VRU detection, All N vehicles; calculation of Effectiveness Estimate (EE)
VIS3 Total Fatal Serious Slight Total
Lower Est.
Predicted Est.
Upper Est.
Lower Est.
Predicted Est.
Upper Est.
Lower Est.
Predicted Est.
Upper Est.
Lower Est.
Predicted Est.
Upper Est.
RQ1 TP 312 312 312 810 810 810 1897 1897 1897 3019 3019 3019
Existing Measure Savings - - - - - - - - - - - - Other Measure Savings - - - - - - - - - - - -
Assessed Measure TP 312 312 312 810 810 810 1897 1897 1897 3019 3019 3019 Assessed Measure Savings 20 124 147 49 324 381 114 760 892 183 1208 1420
Total Savings 20 124 147 49 324 381 114 760 892 183 1208 1420 Remaining Casualties 292 188 165 761 486 429 1783 1137 1005 2836 1811 1599
Figure 25: VIS3 - total predicted estimate of casualties saved by measure type
0
500
1000
1500
2000
2500
3000
3500
4000
4500
RQ1 TP Existing
Measure
Savings
Other
Measure
Savings
Assessed
Measure
Savings
Remaining
Casualties

Effectiveness Estimates
v3.0 47 PPR844
Table 19: VIS 3 – VRU detection, N2 vehicles; calculation of Effectiveness Estimate (EE)
VIS3 N2 Fatal Serious Slight Total
Lower Est.
Predicted Est.
Upper Est.
Lower Est.
Predicted Est.
Upper Est.
Lower Est.
Predicted Est.
Upper Est.
Lower Est.
Predicted Est.
Upper Est.
RQ1 TP 36 36 36 232 232 232 825 825 825 1093 1093 1093
Existing Measure Savings - - - - - - - - - - - - Other Measure Savings - - - - - - - - - - - -
Assessed Measure TP 36 36 36 232 232 232 825 825 825 1093 1093 1093 Assessed Measure Savings 3 14 17 14 93 109 49 330 388 66 437 514
Total Savings 3 14 17 14 93 109 49 330 388 66 437 514 Remaining Casualties 33 22 19 218 139 123 776 495 437 1027 656 579
Table 20: VIS 3 – VRU detection, N3 vehicles; calculation of Effectiveness Estimate (EE)
VIS3 N3 Fatal Serious Slight Total
Lower Est.
Predicted Est.
Upper Est.
Lower Est.
Predicted Est.
Upper Est.
Lower Est.
Predicted Est.
Upper Est.
Lower Est.
Predicted Est.
Upper Est.
RQ1 TP 275 275 275 564 564 564 1016 1016 1016 1855 1855 1855
Existing Measure Savings - - - - - - - - - - - - Other Measure Savings - - - - - - - - - - - -
Assessed Measure TP 275 275 275 564 564 564 1016 1016 1016 1855 1855 1855 Assessed Measure Savings 17 110 130 34 226 265 61 407 477 112 743 872
Total Savings 17 110 130 34 226 265 61 407 477 112 743 872 Remaining Casualties 258 165 145 530 338 299 955 609 539 1743 1112 983

Effectiveness Estimates
v3.0 48 PPR844
Table 21: VIS 3 – VRU detection, N Unknown vehicles; calculation of Effectiveness Estimate (EE)
VIS3 N Unknown Fatal Serious Slight Total
Lower Est.
Predicted Est.
Upper Est.
Lower Est.
Predicted Est.
Upper Est.
Lower Est.
Predicted Est.
Upper Est.
Lower Est.
Predicted Est.
Upper Est.
RQ1 TP 1 1 1 14 14 14 56 56 56 71 71 71
Existing Measure Savings - - - - - - - - - - - - Other Measure Savings - - - - - - - - - - - -
Assessed Measure TP 4 1 1 14 14 14 56 56 56 74 71 71 Assessed Measure Savings 0 0 0 1 5 7 4 23 27 5 28 34
Total Savings 0 0 0 1 5 7 4 23 27 5 28 34 Remaining Casualties 1 1 1 13 9 7 52 33 29 66 43 37

Effectiveness Estimates
v3.0 49 PPR844
4.1.5 VIS 4 – VRU AEB
Table 22 shows a predicted saving of 1329 (44% of all relevant casualties) pedestrian or cyclist casualties (136 fatalities, 357 seriously injured and 836 slightly injured) over a 5 year period if N3 and N2 (including N Unknown) vehicles were fitted with a system capable of detecting pedestrians and cyclists to the front and side of the vehicle and emergency braking if required. The variance in the prediction ranges from a minimum saving of 757 casualties up to 2145 casualties saved over a 5 year period.
No existing or other measures were considered in the casualty saving prediction model and there is no mitigation effect for this measure.
Figure 26 graphically represents the values shown in the total predicted column, with the lower and upper estimates expressed as confidence intervals.
Table 23, Table 24 and Table 25 show the same breakdown of figures for casualties caused by N2, N3 and N Unknown vehicles respectively.

Effectiveness Estimates
v3.0 50 PPR844
Interpretation Notes: • Caution should be applied if summing or comparing the results between
measures due to different methods in the generation of the TPs. Some TPs were refined to a greater level of detail than others (see RQ1 report)
• The sequence of the other and existing measures in the calculations is based on the chronology of a crash. If the sequence were altered then it would make an individual measure appear more or less effective, so the results at each step in the calculation should be treated with caution. The final result generating the Effectiveness Estimate from the Target Popultion remains the same (as long as no additional measures are added).
• The result for an existing or proposed measure is only in the context of the Target Population of the studied measure. It should not be interpreted out of context as a finding of overall effect on the whole casualty population.
• The confidence intervals should be interpreted with caution. For some literature measures the 5th and 95th percentile confidence intervals are not available, so the median has been used; this would make a result appear with narrower upper and lower estimates and appear more confident than it actually is.
• Caution should be applied when looking at the VIS and ISA upper and lower estimates, which are not the 5th and 95th percentile confidence intervals. Instead these are an interpretation of the different levels of confidence in avoidance. Lower estimate = high confidence only; predicted estimate = high + medium confidence; upper estimate = high + medium + low confidence
• The Target Population (TP) has been updated since the last version of Phase 1 / RQ1. These changes will be reflected in the RQ1 report in due course.
Table 22: VIS 4 – VRU AEB, All N vehicles; calculation of Effectiveness Estimate (EE)
VIS 4 Total Fatal Serious Slight Total
Lower Est.
Predicted Est.
Upper Est.
Lower Est.
Predicted Est.
Upper Est.
Lower Est.
Predicted Est.
Upper Est.
Lower Est.
Predicted Est.
Upper Est.
RQ1 TP 312 312 312 810 810 810 1897 1897 1897 3019 3019 3019
Existing Measure Savings - - - - - - - - - - - - Other Measure Savings - - - - - - - - - - - -
Assessed Measure TP 312 312 312 810 810 810 1897 1897 1897 3019 3019 3019 Assessed Measure Savings 79 136 222 204 357 575 474 836 1348 757 1329 2145
Total Savings 79 136 222 204 357 575 474 836 1348 757 1329 2145 Remaining Casualties 233 176 90 606 453 235 1423 1061 549 2262 1690 874
Figure 26: VIS4 - total predicted estimate of casualties saved by measure type
0
500
1000
1500
2000
2500
3000
3500
4000
RQ1 TP Existing
Measure
Savings
Other
Measure
Savings
Assessed
Measure
Savings
Remaining
Casualties

Effectiveness Estimates
v3.0 51 PPR844
Table 23: VIS 4 – VRU AEB, N2 vehicles; calculation of Effectiveness Estimate (EE)
VIS 4 N2 Fatal Serious Slight Total
Lower Est.
Predicted Est.
Upper Est.
Lower Est.
Predicted Est.
Upper Est.
Lower Est.
Predicted Est.
Upper Est.
Lower Est.
Predicted Est.
Upper Est.
RQ1 TP 36 36 36 232 232 232 825 825 825 1093 1093 1093
Existing Measure Savings - - - - - - - - - - - - Other Measure Savings - - - - - - - - - - - -
Assessed Measure TP 36 36 36 232 232 232 825 825 825 1093 1093 1093 Assessed Measure Savings 10 15 26 58 102 165 206 363 586 274 480 777
Total Savings 10 15 26 58 102 165 206 363 586 274 480 777 Remaining Casualties 26 21 10 174 130 67 619 462 239 819 613 316
Table 24: VIS 4 – VRU AEB, N3 vehicles; calculation of Effectiveness Estimate (EE)
VIS 4 N3 Fatal Serious Slight Total
Lower Est.
Predicted Est.
Upper Est.
Lower Est.
Predicted Est.
Upper Est.
Lower Est.
Predicted Est.
Upper Est.
Lower Est.
Predicted Est.
Upper Est.
RQ1 TP 275 275 275 564 564 564 1016 1016 1016 1855 1855 1855
Existing Measure Savings - - - - - - - - - - - - Other Measure Savings - - - - - - - - - - - -
Assessed Measure TP 275 275 275 564 564 564 1016 1016 1016 1855 1855 1855 Assessed Measure Savings 69 121 195 142 248 400 254 448 722 465 817 1317
Total Savings 69 121 195 142 248 400 254 448 722 465 817 1317 Remaining Casualties 206 154 80 422 316 164 762 568 294 1390 1038 538

Effectiveness Estimates
v3.0 52 PPR844
Table 25: VIS 4 – VRU AEB, N Unknown vehicles; calculation of Effectiveness Estimate (EE)
VIS 4 N Unknown Fatal Serious Slight Total
Lower Est.
Predicted Est.
Upper Est.
Lower Est.
Predicted Est.
Upper Est.
Lower Est.
Predicted Est.
Upper Est.
Lower Est.
Predicted Est.
Upper Est.
RQ1 TP 1 1 1 14 14 14 56 56 56 13562 71 71
Existing Measure Savings - - - - - - - - - - - - Other Measure Savings - - - - - - - - - - - -
Assessed Measure TP 0 1 1 14 14 14 56 56 56 70 71 71 Assessed Measure Savings 0 0 1 4 7 10 14 25 40 18 32 51
Total Savings 0 0 1 4 7 10 14 25 40 18 32 51 Remaining Casualties 1 1 0 10 7 4 42 31 16 53 39 20

Effectiveness Estimates
v3.0 53 PPR844
4.2 Intelligent Speed Assistance (ISA)
4.2.1 Case-by-case analysis
The sample details of the case-by-case analysis for the ISA measure are given in Appendix A.1. A key point is that these are cases with speeding of the relevant vehicles, not cases where ISA was actually activated. The investigators were asked to estimate how the collision would have differed if the speed vehicle had been fitted with ISA.
The percentage of collisions which could have been avoided/mitigated with Intelligent Speed Assistance (ISA) and the confidence in this estimate is shown in Figure 17. A confidence of low, medium and high was specified as per investigators judgement on avoidance or mitigation of the incident with ISA. If the investigator had no confidence in ISA affecting the collision then it was coded as ‘None’.
As illustrated below in Figure 31, of the M1 and N1 sample with low confidence in ISA, 17% had avoidance and 30% had confidence of mitigation. Of the sample with medium confidence, 17% had avoidance and 10% had confidence of mitigation. Of the sample with high confidence, only 2% had avoidance and 10% had confidence of mitigation. In general, the overall confidence in mitigating the incidents with ISA was found to be higher than avoidance. For the remaining sample of M1 and N1 collisions, 63% had no confidence in ISA avoidance and 49% had no confidence in ISA mitigation. Therefore in majority of incidents involving over speeding, ISA would have no impact. The reason for this could be driver, path or environmental factors which are discussed in the later sections.

Effectiveness Estimates
v3.0 54 PPR844
Figure 27: Confidence of ISA effect on M1, N1 cases (Avoid & Mitigate)
The percentage of cases involving M2, M3, N2 and N3 category vehicles which could have been avoided/ mitigated with ISA and its confidence is shown in Figure 28. Of the sample with low confidence in ISA, 66% had confidence of mitigation and none of the cases had confidence in avoidance. Of the sample with medium confidence, 17% had avoidance and 16% had confidence of mitigation. Of the sample with high confidence, 2% had confidence of mitigation and none had confidence in avoidance. In general, the overall confidence in mitigating the incidents with ISA was found to be higher than avoidance. For the remaining sample of M1 and N1 collisions, 83% had no confidence in ISA avoidance and 16% had no confidence in ISA mitigation

Effectiveness Estimates
v3.0 55 PPR844
Figure 28: Confidence of ISA effect on M2, M3, N2, N3 cases (Avoid & Mitigate)
The effect of Intelligent Speed Adaption (ISA) on the sample is shown in Figure 29 with confidence in avoidance along the x-axis and confidence in mitigation along the y-axis. The distribution of M1 and N1 category sample is shown on the left, 40 (48%) cases represented on the lower left corner had no confidence of avoidance and no confidence of mitigation. Overall the trend shows higher confidence in mitigation (52%) than avoidance (37%), as well as a relationship where higher confidence in avoidance is reflected in higher confidence of mitigation.
There are two collisions where the confidence that ISA would avoid the collision is greater than the confidence it would mitigate the collision. Both of these collisions resulted in minor injuries so without avoiding the collision, it is very unlikely that the injuries sustained in these two specific collisions could have been mitigated and prevented.
The distribution of M2, N2, M3 and N3 category sample is shown on the right, and similarly, the overall the trend shows higher confidence in mitigation (65%) than avoidance (17%).

Effectiveness Estimates
v3.0 56 PPR844
Figure 29 Sample avoidance and mitigation distribution for M1, N1 (top) and M2, N2, M3, N3 (bottom) vehicles
Figure 30 summarises the overall effectiveness of ISA countermeasure. In conclusion, of the sample with M1 and N1 category vehicles (left), 37% had confidence of avoidance and 51% had confidence of mitigation. 63% had no confidence of avoidance and 49% had no confidence of mitigation. These are for the combinations of confidence of effect that are used to generate the lower, predicted, and upper estimates of casualty savings, see Section 3.5.2. These are the values use in the overall calculations of EE.
Of the sample with M2, N2, M3 and N3 category vehicles (right), 17% had confidence of avoidance and 84% had confidence of mitigation. 83% had no confidence of avoidance and 16% had no confidence of mitigation.

Effectiveness Estimates
v3.0 57 PPR844
Figure 30: Overall effectiveness of ISA countermeasure for M1, N1 (top) M2, N2, M3, and N3 (bottom) vehicles

Effectiveness Estimates
v3.0 58 PPR844
4.2.2 M1/N1 ISA
Table 26 shows a predicted saving of 8,219 casualties (168 fatalities, 1,060 seriously injured and 6,991 slightly injured) over a 5 year period if M1 vehicles were fitted with a mandatory ISA system that can be overridden by applying the accelerator pedal. The variance in the prediction ranges from a minimum saving of 956 casualties up to 14,888 casualties saved over a 5 year period.
ISA is also predicted to have a mitigation effect, where the collision could not have been avoided but the severity of the collision and, therefore, the severity of the casualties, is reduced. It is predicted that ISA would mitigate 352 serious casualties to only suffering slight injuries. Furthermore, it is predicted that 56 fatally injured casualties would instead survive with serious injuries. This is predicted to result in an overall reduction of 45 fatalities and 296 seriously injured casualties but the addition of 352 slightly injured casualties. ISA is not predicted to have any mitigation effect on casualties who are slightly injured due to difficulty in preventing minor injuries without avoiding the collision.
The effect of existing (ESC) and other (LKA, AEB and AEB-PCD) measures were considered and the casualties saved by these measures removed from the sample, prior to the ISA effect being considered. In total, a predicted 3,913 and 5,894 casualties would be prevented over a five year period by the existing and other measures respectively. The total savings of existing and other measures with ISA are predicted to be 18,026 over a 5 year period in collisions involving a speeding M1 vehicle.
Figure 31 graphically represents the values shown in the total predicted column, with the lower and upper estimates expressed as confidence intervals. The mitigation effect is not shown in the graph as the values show total casualties.
Table 27 shows a predicted saving of 324 casualties (3 fatalities, 32 seriously injured and 289 slightly injured) over a 5 year period if N1 vehicles were fitted with a mandatory ISA system that can be overridden by applying the accelerator pedal. Variance in the prediction ranges from a minimum saving of 37 casualties up to 592 casualties saved over a 5 year period.
ISA is also predicted to have a mitigation effect, where the collision could not have been avoided but the severity of the collision and, therefore, the severity of the casualties, is reduced. It is predicted that ISA would mitigate 11 serious casualties to only suffering slight injuries. Furthermore, it is predicted that 1 fatally injured casualty would instead survive with serious injuries. This is predicted to result in an overall reduction of 1 fatality and 10 seriously injured casualties but the addition of 11 slightly injured casualties. ISA is not predicted to have any mitigation effect on casualties who are slightly injured due to difficulty in preventing minor injuries without avoiding the collision.
The effect of existing (ESC) and other (LKA, AEB and AEB-PCD) were considered and the casualties saved by these measures removed from the sample, prior to the ISA effect being considered. In total, a predicted 98 and 225 casualties would be prevented over a five year period by the existing and other measures respectively. The total savings of existing and other measures with ISA are predicted to be 647 over a 5 year period in collisions involving a speeding N1 vehicle. Figure 32 graphically represents the values shown in the total predicted column, with the lower and upper estimates expressed as confidence intervals.

Effectiveness Estimates
v3.0 59 PPR844
Table 26: ISA – M1 vehicles; calculation of Effectiveness Estimate (EE)
ISA M1 Fatal Serious Slight Total
Lower Est. Predicted Est. Upper Est. Lower Est. Predicted Est. Upper Est. Lower Est. Predicted Est. Upper Est. Lower Est. Predicted Est. Upper Est.
RQ1 TP 1469 1469 1469 7680 7680 7680 43916 43916 43916 53065 53065 53065
Existing Measure Savings 112 283 410 520 683 878 2246 2947 3789 2878 3913 5077 Other Measure Savings 119 246 279 451 1121 1443 1799 4527 6029 2369 5894 7751
Assessed Measure Mitigation 35 56 108 153 296 632 -188 -352 -740 - - - Assessed Measure TP 1203 884 672 6556 5580 4727 40059 36794 34838 47818 43258 40237 Assessed Measure Savings 24 168 249 131 1060 1749 801 6991 12890 956 8219 14888
Total Savings 255 697 938 1102 2864 4070 4846 14465 22708 6203 18026 27716 Remaining Casualties 1179 716 423 6425 4520 2978 39258 29803 21948 46862 35039 25349
Figure 31: ISA M1 - total predicted estimate of casualties saved by measure type
0
10000
20000
30000
40000
50000
60000
70000
RQ1 TP Existing
Measure
Savings
Other
Measure
Savings
Assessed
Measure
Savings
Remaining
Casualties
Interpretation Notes: • Caution should be applied if summing or comparing the results between measures due to
different methods in the generation of the TPs. Some TPs were refined to a greater level of detail than others (see RQ1 report)
• The sequence of the other and existing measures in the calculations is based on the chronology of a crash. If the sequence were altered then it would make an individual measure appear more or less effective, so the results at each step in the calculation should be treated with caution. The final result generating the Effectiveness Estimate from the Target Popultion remains the same (as long as no additional measures are added).
• The result for an existing or proposed measure is only in the context of the Target Population of the studied measure. It should not be interpreted out of context as a finding of overall effect on the whole casualty population.
• The confidence intervals should be interpreted with caution. For some literature measures the 5th and 95th percentile confidence intervals are not available, so the median has been used; this would make a result appear with narrower upper and lower estimates and appear more confident than it actually is.
• Caution should be applied when looking at the VIS and ISA upper and lower estimates, which are not the 5th and 95th percentile confidence intervals. Instead these are an interpretation of the different levels of confidence in avoidance. Lower estimate = high confidence only; predicted estimate = high + medium confidence; upper estimate = high + medium + low confidence
• The results for each vehicle type should not be summed. There are approximately 200 vehicles that would be double-counted due to these collisions involving multiple speeding vehicles
• The Target Population (TP) has been updated since the last version of Phase 1 / RQ1. These changes will be reflected in the RQ1 report in due course.

Effectiveness Estimates
v3.0 60 PPR844
Table 27: ISA – N1 vehicles; calculation of Effectiveness Estimate (EE)
ISA N1 Fatal Serious Slight Total
Lower Est. Predicted Est. Upper Est. Lower Est. Predicted Est. Upper Est. Lower Est. Predicted Est. Upper Est. Lower Est. Predicted Est. Upper Est.
RQ1 TP 18 18 18 217 217 217 1790 1790 1790 2025 2025 2025
Existing Measure Savings 1 3 5 9 11 15 64 84 107 74 98 127 Other Measure Savings 0 0 0 19 27 31 87 198 267 106 225 298
Assessed Measure Mitigation 1 1 2 5 10 22 -6 -11 -24 - - - Assessed Measure TP 16 14 11 184 169 149 1645 1519 1440 1845 1702 1600 Assessed Measure Savings 0 3 4 4 32 55 33 289 533 37 324 592
Total Savings 1 6 9 32 70 101 184 571 907 217 647 1017 Remaining Casualties 16 11 7 180 137 94 1612 1230 907 1808 1378 1008
Figure 32: ISA N1 - total predicted estimate of casualties saved by measure type
0
500
1000
1500
2000
2500
3000
RQ1 TP Existing
Measure
Savings
Other
Measure
Savings
Assessed
Measure
Savings
Remaining
Casualties
Interpretation Notes: • Caution should be applied if summing or comparing the results between measures due to
different methods in the generation of the TPs. Some TPs were refined to a greater level of detail than others (see RQ1 report)
• The sequence of the other and existing measures in the calculations is based on the chronology of a crash. If the sequence were altered then it would make an individual measure appear more or less effective, so the results at each step in the calculation should be treated with caution. The final result generating the Effectiveness Estimate from the Target Popultion remains the same (as long as no additional measures are added).
• The result for an existing or proposed measure is only in the context of the Target Population of the studied measure. It should not be interpreted out of context as a finding of overall effect on the whole casualty population.
• The confidence intervals should be interpreted with caution. For some literature measures the 5th and 95th percentile confidence intervals are not available, so the median has been used; this would make a result appear with narrower upper and lower estimates and appear more confident than it actually is.
• Caution should be applied when looking at the VIS and ISA upper and lower estimates, which are not the 5th and 95th percentile confidence intervals. Instead these are an interpretation of the different levels of confidence in avoidance. Lower estimate = high confidence only; predicted estimate = high + medium confidence; upper estimate = high + medium + low confidence
• The results for each vehicle type should not be summed. There are approximately 200 vehicles that would be double-counted due to these collisions involving multiple speeding vehicles
• The Target Population (TP) has been updated since the last version of Phase 1 / RQ1. These changes will be reflected in the RQ1 report in due course.

Effectiveness Estimates
v3.0 61 PPR844
4.2.3 M2/N2/M3/N3 ISA
Table 28 shows a predicted saving of 22 casualties (0 fatalities, 4 seriously injured and 18 slightly injured) over a 5 year period if M2 vehicles were fitted with a mandatory ISA system that can be overridden by applying the accelerator pedal. The variance in the prediction ranges from no casualty savings up to a maximum of 23 casualties saved over a 5 year period.
ISA is also predicted to have a mitigation effect, where the collision could not have been avoided but the severity of the collision and, therefore, the severity of the casualties, is reduced. It is predicted that ISA would have mitigated 2 seriously injured causalities to slightly injured. ISA is not predicted to have any mitigation effect on casualties who are slightly injured due to difficulty in preventing minor injuries without avoiding the collision.
The effect of existing measures (speed limiter, LKA and AEB) were considered and the casualties saved by these measures removed from the sample, prior to the ISA effect being considered. In total, it is predicted 2 casualties would be prevented over a five year period by the existing measures. The total savings of existing and other measures with ISA are predicted to be 24 over a 5 year period in collisions involving a speeding M2 vehicle.
Figure 33 graphically represents the values shown in the total predicted column, with the lower and upper estimates expressed as confidence intervals. The mitigation effect is not shown in the graph as the values show total casualties.
Table 29 shows a predicted saving of 18 casualties (0 fatalities, 3 seriously injured and 15 slightly injured) over a 5 year period if N2 vehicles were fitted with a mandatory ISA system that can be overridden by applying the accelerator pedal. The variance in the prediction ranges from no casualty savings up to a maximum of 18 casualties saved over a 5 year period.
ISA is also predicted to have a mitigation effect, where the collision could not have been avoided but the severity of the collision and, therefore, the severity of the casualties, is reduced. It is predicted that ISA would have mitigated 2 seriously injured causalities to slightly injured. ISA is not predicted to have any mitigation effect on casualties who are slightly injured due to difficulty in preventing minor injuries without avoiding the collision.
The effect of existing measures (speed limiter, LKA and AEB) were considered and the casualties saved by these measures removed from the sample, prior to the ISA effect being considered. In total, it is predicted 3 casualties would be prevented over a five year period by the existing measures. The total savings of existing and other measures with ISA are predicted to be 21 over a 5 year period in collisions involving a speeding N2 vehicle.
Figure 34 graphically represents the values shown in the total predicted column, with the lower and upper estimates expressed as confidence intervals. The mitigation effect is not shown in the graph as the values show total casualties.

Effectiveness Estimates
v3.0 62 PPR844
Interpretation Notes: • Caution should be applied if summing or comparing the results between measures due to
different methods in the generation of the TPs. Some TPs were refined to a greater level of detail than others (see RQ1 report)
• The sequence of the other and existing measures in the calculations is based on the chronology of a crash. If the sequence were altered then it would make an individual measure appear more or less effective, so the results at each step in the calculation should be treated with caution. The final result generating the Effectiveness Estimate from the Target Popultion remains the same (as long as no additional measures are added).
• The result for an existing or proposed measure is only in the context of the Target Population of the studied measure. It should not be interpreted out of context as a finding of overall effect on the whole casualty population.
• The confidence intervals should be interpreted with caution. For some literature measures the 5th and 95th percentile confidence intervals are not available, so the median has been used; this would make a result appear with narrower upper and lower estimates and appear more confident than it actually is.
• Caution should be applied when looking at the VIS and ISA upper and lower estimates, which are not the 5th and 95th percentile confidence intervals. Instead these are an interpretation of the different levels of confidence in avoidance. Lower estimate = high confidence only; predicted estimate = high + medium confidence; upper estimate = high + medium + low confidence
• The results for each vehicle type should not be summed. There are approximately 200 vehicles that would be double-counted due to these collisions involving multiple speeding vehicles
• The Target Population (TP) has been updated since the last version of Phase 1 / RQ1. These changes will be reflected in the RQ1 report in due course.
•
Table 28: ISA – M2 vehicles; calculation of Effectiveness Estimate (EE)
ISA M2 Fatal Serious Slight Total
Lower Est. Predicted Est. Upper Est. Lower Est. Predicted Est. Upper Est. Lower Est. Predicted Est. Upper Est. Lower Est. Predicted Est. Upper Est.
RQ1 TP 0 0 0 27 27 27 109 109 109 136 136 136
Existing Measure Savings - - - - - - - - - - - - Other Measure Savings 0 0 0 0 0 0 1 2 2 1 2 2
Assessed Measure Mitigation 0 0 0 1 2 4 -1 -2 -4 - - - Assessed Measure TP 0 0 0 26 25 23 109 109 111 135 134 134 Assessed Measure Savings 0 0 0 0 4 4 0 18 19 0 22 23
Total Savings 0 0 0 0 4 4 1 20 21 1 24 25 Remaining Casualties 0 0 0 26 21 19 109 91 92 135 112 111
Figure 33: ISA M2 - total predicted estimate of casualties saved by measure type
0
20
40
60
80
100
120
140
160
180
RQ1 TP Existing
Measure
Savings
Other
Measure
Savings
Assessed
Measure
Savings
Remaining
Casualties

Effectiveness Estimates
v3.0 63 PPR844
Interpretation Notes: • Caution should be applied if summing or comparing the results between measures
due to different methods in the generation of the Target Populations (TPs). • The sequence of the measures in the calculations is based on the chronology of a
crash. If the sequence were altered then it would make an individual measure appear more or less effective, so the results at each step in the calculation should be treated with caution. The final result generating the Effectiveness Estimate from the Target Popultion remains the same (as long as no additional measures are added).
• The result for an existing or proposed measure is only in the context of the Target Population of the studied measure. It should not be interpreted out of context as a finding of overall effect on the whole casualty population.
• The confidence intervals should be interpreted with caution. For some literature measures the 5th and 95th percentile confidence intervals are not available, so the median has been used; this would make a result appear with narrower upper and lower estimates and appear more confident than it actually is.
• Caution should be applied when looking at the VIS and ISA upper and lower estimates, which are not the 5th and 95th percentile confidence intervals. Instead these are an interpretation of the different levels of confidence in avoidance. Lower estimate = high confidence only; predicted estimate = high + medium confidence; upper estimate = high + medium + low confidence
• The results for each vehicle type should not be summed. There are approximately 200 vehicles that would be double-counted due to these collisions involving multiple speeding vehicles
• The Target Population (TP) has been updated since the last version of Phase 1 / RQ1. These changes will be reflected in the RQ1 report in due course.
•
Table 29: ISA – N2 vehicles; calculation of Effectiveness Estimate (EE)
ISA N2 Fatal Serious Slight Total
Lower Est. Predicted Est. Upper Est. Lower Est. Predicted Est. Upper Est. Lower Est. Predicted Est. Upper Est. Lower Est. Predicted Est. Upper Est.
RQ1 TP 0 0 0 18 18 18 90 90 90 108 108 108
Existing Measure Savings - - - - - - - - - - - - Other Measure Savings 0 0 0 0 0 0 2 3 5 2 3 5
Assessed Measure Mitigation 0 0 0 1 1 3 -1 -1 -3 - - - Assessed Measure TP 0 0 0 17 17 15 89 88 88 106 105 103 Assessed Measure Savings 0 0 0 0 3 3 0 15 15 0 18 18
Total Savings 0 0 0 0 3 3 2 18 20 2 21 23 Remaining Casualties 0 0 0 17 14 12 89 73 73 106 87 85
Figure 34: ISA N2 - total predicted estimate of casualties saved by measure type
0
20
40
60
80
100
120
140
RQ1 TP Existing
Measure
Savings
Other
Measure
Savings
Assessed
Measure
Savings
Remaining
Casualties

Effectiveness Estimates
v3.0 64 PPR844
Table 30 shows a predicted saving of 18 casualties (1 fatality, 3 seriously injured and 14 slightly injured) over a 5 year period if M3 vehicles were fitted with a mandatory ISA system that can be overridden by applying the accelerator pedal. The variance in the prediction ranges from no casualty savings up to a maximum of 18 casualties saved over a 5 year period.
ISA is also predicted to have a mitigation effect, where the collision could not have been avoided but the severity of the collision and, therefore, the severity of the casualties, is reduced. It is predicted that ISA would have mitigated 1 fatality to seriously injured and 1 seriously injured causality to slight injuries. ISA is not predicted to have any mitigation effect on casualties who are slightly injured due to difficulty in preventing minor injuries without avoiding the collision.
The effect of existing measures (speed limiter, LKA and AEB) were considered and the casualties saved by these measures removed from the sample, prior to the ISA effect being considered. In total, it is predicted 5 casualties would be prevented over a five year period by the existing measures. The total savings of existing and other measures with ISA are predicted to be 24 over a 5 year period in collisions involving a speeding M3 vehicle.
Figure 35 graphically represents the values shown in the total predicted column, with the lower and upper estimates expressed as confidence intervals. The mitigation effect is not shown in the graph as the values show total casualties.
Table 31 shows a predicted saving of 70 casualties (7 fatalities, 10 seriously injured and 53 slightly injured) over a 5 year period if N3 vehicles were fitted with a mandatory ISA system that can be overridden by applying the accelerator pedal. The variance in the prediction ranges from no casualty savings up to a maximum of 70 casualties saved over a 5 year period.
ISA is also predicted to have a mitigation effect, where the collision could not have been avoided but the severity of the collision and, therefore, the severity of the casualties, is reduced. It is predicted that ISA would mitigate 1 serious casualty to only suffering slight injuries. Furthermore, it is predicted that 3 fatally injured casualties would instead survive with serious injuries. This is predicted to result in an overall reduction of 3 fatalities and 1 seriously injured casualty but the addition of 4 slightly injured casualties. ISA is not predicted to have any mitigation effect on casualties who are slightly injured due to difficulty in preventing minor injuries without avoiding the collision.
The effect of existing measures (speed limiter, LKA and AEB) were considered and the casualties saved by these measures removed from the sample, prior to the ISA effect being considered. In total, it is predicted 33 casualties would be prevented over a five year period by the existing measures. The total savings of existing and other measures with ISA are predicted to be 103 over a 5 year period in collisions involving a speeding N3 vehicle.
Figure 36 graphically represents the values shown in the total predicted column, with the lower and upper estimates expressed as confidence intervals. The mitigation effect is not shown in the graph as the values show total casualties.

Effectiveness Estimates
v3.0 65 PPR844
Interpretation Notes: • Caution should be applied if summing or comparing the results between measures due
to different methods in the generation of the Target Populations (TPs). • The sequence of the measures in the calculations is based on the chronology of a
crash. If the sequence were altered then it would make an individual measure appear more or less effective, so the results at each step in the calculation should be treated with caution. The final result generating the Effectiveness Estimate from the Target Popultion remains the same (as long as no additional measures are added).
• The result for an existing or proposed measure is only in the context of the Target Population of the studied measure. It should not be interpreted out of context as a finding of overall effect on the whole casualty population.
• The confidence intervals should be interpreted with caution. For some literature measures the 5th and 95th percentile confidence intervals are not available, so the median has been used; this would make a result appear with narrower upper and lower estimates and appear more confident than it actually is.
• Caution should be applied when looking at the VIS and ISA upper and lower estimates, which are not the 5th and 95th percentile confidence intervals. Instead these are an interpretation of the different levels of confidence in avoidance. Lower estimate = high confidence only; predicted estimate = high + medium confidence; upper estimate = high + medium + low confidence
• The results for each vehicle type should not be summed. There are approximately 200 vehicles that would be double-counted due to these collisions involving multiple speeding vehicles
• The Target Population (TP) has been updated since the last version of Phase 1 / RQ1. These changes will be reflected in the RQ1 report in due course.
•
Table 30: ISA – M3 vehicles; calculation of Effectiveness Estimate (EE)
ISA M3 Fatal Serious Slight Total
Lower Est. Predicted Est. Upper Est. Lower Est. Predicted Est. Upper Est. Lower Est. Predicted Est. Upper Est. Lower Est. Predicted Est. Upper Est.
RQ1 TP 9 9 9 18 18 18 86 86 86 113 113 113
Existing Measure Savings - - - - - - - - - - - - Other Measure Savings 0 0 0 0 0 0 2 5 7 2 5 7
Assessed Measure Mitigation 0 1 1 0 1 1 0 -2 -2 - - - Assessed Measure TP 9 8 8 18 17 17 84 83 81 111 108 106 Assessed Measure Savings 0 1 1 0 3 3 0 14 14 0 18 18
Total Savings 0 1 1 0 3 3 2 19 21 2 23 25 Remaining Casualties 9 7 7 18 14 14 84 69 67 111 90 88
Figure 35: ISA M3 - total predicted estimate of casualties saved by measure type
0
20
40
60
80
100
120
140
160
RQ1 TP Existing
Measure
Savings
Other
Measure
Savings
Assessed
Measure
Savings
Remaining
Casualties

Effectiveness Estimates
v3.0 66 PPR844
Interpretation Notes: • Caution should be applied if summing or comparing the results between measures
due to different methods in the generation of the Target Populations (TPs). • The sequence of the measures in the calculations is based on the chronology of a
crash. If the sequence were altered then it would make an individual measure appear more or less effective, so the results at each step in the calculation should be treated with caution. The final result generating the Effectiveness Estimate from the Target Popultion remains the same (as long as no additional measures are added).
• The result for an existing or proposed measure is only in the context of the Target Population of the studied measure. It should not be interpreted out of context as a finding of overall effect on the whole casualty population.
• The confidence intervals should be interpreted with caution. For some literature measures the 5th and 95th percentile confidence intervals are not available, so the median has been used; this would make a result appear with narrower upper and lower estimates and appear more confident than it actually is.
• Caution should be applied when looking at the VIS and ISA upper and lower estimates, which are not the 5th and 95th percentile confidence intervals. Instead these are an interpretation of the different levels of confidence in avoidance. Lower estimate = high confidence only; predicted estimate = high + medium confidence; upper estimate = high + medium + low confidence
• The results for each vehicle type should not be summed. There are approximately 200 vehicles that would be double-counted due to these collisions involving multiple speeding vehicles
• The Target Population (TP) has been updated since the last version of Phase 1 / RQ1. These changes will be reflected in the RQ1 report in due course.
•
Table 31: ISA – N3 vehicles; calculation of Effectiveness Estimate (EE)
ISA N3 Fatal Serious Slight Total
Lower Est. Predicted Est. Upper Est. Lower Est. Predicted Est. Upper Est. Lower Est. Predicted Est. Upper Est. Lower Est. Predicted Est. Upper Est.
RQ1 TP 54 54 54 68 68 68 321 321 321 443 443 443
Existing Measure Savings - - - - - - - - - - - - Other Measure Savings 3 12 16 3 5 8 7 16 22 13 33 46
Assessed Measure Mitigation 1 3 5 0 1 3 -1 -4 -8 - - - Assessed Measure TP 50 39 33 65 62 57 315 309 307 430 410 397 Assessed Measure Savings 0 7 7 0 10 10 0 53 53 0 70 70
Total Savings 3 19 23 3 15 18 7 69 75 13 103 116 Remaining Casualties 50 32 26 65 52 47 315 256 254 430 340 327
Figure 36: ISA N3 - total predicted estimate of casualties saved by measure type
0
100
200
300
400
500
600
RQ1 TP Existing
Measure
Savings
Other
Measure
Savings
Assessed
Measure
Savings
Remaining
Casualties

Effectiveness Estimates
v3.0 67 PPR844
4.3 Frontal Small Overlap (FSO)
The analysis for this measure refines the target population of casualties in collisions relevant to the measure only. It does not predict the casualty savings of the measure as there is currently no effectiveness values available in the literature.
Table 32 shows the original target population from RQ1 is predicted to reduce by a total of 2,276 casualties (27 fatalities, 195 seriously injured and 2,054 slightly injured) over a period of 5 years from the effect of existing (ESC) and other (ISA and AEB) measures. Specifically, a predicted 311 and 1,965 casualties would be prevented over a five year period by the existing and other measures respectively.
ISA is predicted to have a mitigation effect, where the collision could not have been avoided but the severity of the collision and, therefore, the severity of the casualties, is reduced. It is predicted that ISA would mitigate 37 serious casualties to only suffering slight injuries. Furthermore, it is predicted that 3 fatally injured casualties would instead survive with serious injuries. This is predicted to result in an overall reduction of 3 fatalities and 34 seriously injured casualties but the addition of 37 slightly injured casualties. ISA is not predicted to have any mitigation effect on casualties who are slightly injured due to difficulty in preventing minor injuries without avoiding the collision.
The variance in the predicted target population ranges from a minimum of 10,095 casualties up to 12,358 casualties in small overlap frontal collisions in M1 vehicles that could be influenced by the introduction of the measures over a 5 year period.
Figure 35 graphically represents the values shown in the total predicted column, with the lower and upper estimates expressed as confidence intervals. The mitigation effect is not shown in the graph as the values show total casualties.

Effectiveness Estimates
v3.0 68 PPR844
Interpretation Notes: • Caution should be applied if summing or comparing the results between measures due to
different methods in the generation of the TPs. Some TPs were refined to a greater level of detail than others (see RQ1 report)
• The sequence of the other and existing measures in the calculations is based on the chronology of a crash. If the sequence were altered then it would make an individual measure appear more or less effective, so the results at each step in the calculation should be treated with caution. The final result generating the Effectiveness Estimate from the Target Popultion remains the same (as long as no additional measures are added).
• The result for an existing or proposed measure is only in the context of the Target Population of the studied measure. It should not be interpreted out of context as a finding of overall effect on the whole casualty population.
• The confidence intervals should be interpreted with caution. For some literature measures the 5th and 95th percentile confidence intervals are not available, so the median has been used; this would make a result appear with narrower upper and lower estimates and appear more confident than it actually is.
• Caution should be applied when looking at the VIS and ISA upper and lower estimates, which are not the 5th and 95th percentile confidence intervals. Instead these are an interpretation of the different levels of confidence in avoidance. Lower estimate = high confidence only; predicted estimate = high + medium confidence; upper estimate = high + medium + low confidence
• It has not been possible to account for the under-reporting of speeding recorded in Stats19 in the same was as where ISA is the studied measure. The effect is to under-estimate the effect of ISA.
• The Target Population (TP) has been updated since the last version of Phase 1 / RQ1. These changes will be reflected in the RQ1 report in due course.
•
Table 32: FSO – M1 vehicles; calculation of refined Target Population (TP)
FSO M1 Fatal Serious Slight Total
Lower Est. Predicted Est. Upper Est. Lower Est. Predicted Est. Upper Est. Lower Est. Predicted Est. Upper Est. Lower Est. Predicted Est. Upper Est.
RQ1 TP 69 69 69 793 793 793 12376 12376 12376 13238 13238 13238
Existing Measure Savings 3 7 10 24 31 40 208 273 351 235 311 401 Other Measure Savings 5 20 27 41 164 227 599 1781 2488 645 1965 2742 Other Measure Mitigation 2 3 5 19 34 68 -21 -37 -73 - - -
Assessed Measure TP 59 39 27 709 564 458 11590 10359 9610 12358 10962 10095 Assessed Measure Savings TP only TP only TP only TP only TP only TP only TP only TP only TP only TP only TP only TP only
Total Savings 8 27 37 65 195 267 807 2054 2839 880 2276 3143 Remaining Casualties 59 39 27 709 564 458 11590 10359 9610 12358 10962 10095
Figure 37: FSO - total predicted estimate of casualties saved by measure type
0
2000
4000
6000
8000
10000
12000
14000
16000
RQ1 TP Existing
Measure
Savings
Other
Measure
Savings
Assessed
Measure
Savings
Remaining
Casualties

Effectiveness Estimates
v3.0 69 PPR844
4.4 Side Impact Far Side Occupant (SFS)
The analysis for this measure refines the target population of casualties in collisions relevant to the measure only. It does not predict the casualty savings of the measure as there is currently no effectiveness values available in the literature.
Table 33 shows the original target population from RQ1 is predicted to reduce by a total of 243 casualties (24 fatalities, 39 seriously injured and 180 slightly injured) over a period of 5 years from the effect of existing (ESC) and other (ISA and AEB) measures. Specifically, a predicted 223 and 20 casualties would be prevented over a five year period by the existing and other measures respectively.
ISA is predicted to have a mitigation effect, where the collision could not have been avoided but the severity of the collision and, therefore, the severity of the casualties, is reduced. It is predicted that ISA would mitigate 50 serious casualties to only suffering slight injuries. Furthermore, it is predicted that 7 fatally injured casualties would instead survive with serious injuries. This is predicted to result in an overall reduction of 7 fatalities and 43 seriously injured casualties but the addition of 50 slightly injured casualties. ISA is not predicted to have any mitigation effect on casualties who are slightly injured due to difficulty in preventing minor injuries without avoiding the collision.
The variance in the predicted target population ranges from a minimum of 11,013 casualties up to 11,177 casualties who are far side occupants of M1 vehicles in side impacts that could be influenced by the introduction of the measures over a 5 year period.
Figure 38 graphically represents the values shown in the total predicted column, with the lower and upper estimates expressed as confidence intervals. The mitigation effect is not shown in the graph as the values show total casualties.

Effectiveness Estimates
v3.0 70 PPR844
Interpretation Notes: • Caution should be applied if summing or comparing the results between measures due to
different methods in the generation of the TPs. Some TPs were refined to a greater level of detail than others (see RQ1 report)
• The sequence of the other and existing measures in the calculations is based on the chronology of a crash. If the sequence were altered then it would make an individual measure appear more or less effective, so the results at each step in the calculation should be treated with caution. The final result generating the Effectiveness Estimate from the Target Popultion remains the same (as long as no additional measures are added).
• The result for an existing or proposed measure is only in the context of the Target
Population of the studied measure. It should not be interpreted out of context as a finding
of overall effect on the whole casualty population.
• The confidence intervals should be interpreted with caution. For some literature measures
the 5th and 95th percentile confidence intervals are not available, so the median has been
used; this would make a result appear with narrower upper and lower estimates and appear
more confident than it actually is.
• Caution should be applied when looking at the VIS and ISA upper and lower estimates, which
are not the 5th and 95th percentile confidence intervals. Instead these are an interpretation
of the different levels of confidence in avoidance. Lower estimate = high confidence only;
predicted estimate = high + medium confidence; upper estimate = high + medium + low
confidence
• The Target Population (TP) has been updated since the last version of Phase 1 / RQ1. These
changes will be reflected in the RQ1 report in due course.
Table 33: SFS – M1 vehicles; calculation of refined Target Population (TP)
SFS M1 Fatal Serious Slight Total
Lower Est. Predicted Est. Upper Est. Lower Est. Predicted Est. Upper Est. Lower Est. Predicted Est. Upper Est. Lower Est. Predicted Est. Upper Est.
RQ1 TP 132 132 132 857 857 857 10352 10352 10352 11341 11341 11341
Existing Measure Savings 9 22 32 28 36 47 125 165 212 162 223 291 Other Measure Savings 0 2 3 0 3 6 2 15 28 2 20 37 Other Measure Mitigation 3 7 14 20 43 98 -23 -50 -112 - - -
Assessed Measure TP 120 101 83 809 775 706 10248 10222 10224 11177 11098 11013 Assessed Measure Savings TP only TP only TP only TP only TP only TP only TP only TP only TP only TP only TP only TP only
Total Savings 9 24 35 28 39 53 127 180 240 164 243 328 Remaining Casualties 120 101 83 809 775 706 10248 10222 10224 11177 11098 11013
Figure 38: SFS - total predicted estimate of casualties saved by measure type
0
2000
4000
6000
8000
10000
12000
14000
RQ1 TP Existing
Measure
Savings
Other
Measure
Savings
Assessed
Measure
Savings
Remaining
Casualties

Effectiveness Estimates
v3.0 71 PPR844
4.5 Frontal Impact Crash Test (F94)
The analysis for this measure refines the target population of casualties in collisions relevant to the measure only. It does not predict the casualty savings of the measure as there is currently no effectiveness values available in the literature.
Table 34 shows the original target population from RQ1 is predicted to reduce by a total of 2,459 casualties (51 fatalities, 319 seriously injured and 2,089 slightly injured) over a period of 5 years from the effect of existing (ESC) and other (ISA, LKA and AEB) measures. Specifically, a predicted 284 and 2,175 casualties would be prevented over a five year period by the existing and other measures respectively.
ISA is predicted to have a mitigation effect, where the collision could not have been avoided but the severity of the collision and, therefore, the severity of the casualties, is reduced. It is predicted that ISA would mitigate 56 serious casualties to only suffering slight injuries. Furthermore, it is predicted that 5 fatally injured casualties would instead survive with serious injuries. This is predicted to result in an overall reduction of 5 fatalities and 51 seriously injured casualties but the addition of 56 slightly injured casualties. ISA is not predicted to have any mitigation effect on casualties who are slightly injured due to difficulty in preventing minor injuries without avoiding the collision.
The variance in the predicted target population ranges from a minimum of 9,922 casualties up to 12,277 casualties in vehicles currently exempt from the Regulation F94 injured in collisions relevant to the tests in the regulation that could be influenced by the introduction of the measures over a 5 year period.
Figure 39 graphically represents the values shown in the total predicted column, with the lower and upper estimates expressed as confidence intervals. The mitigation effect is not shown in the graph as the values show total casualties.

Effectiveness Estimates
v3.0 72 PPR844
Table 34: F94 – M1/N1 vehicles that are currently excluded; calculation of refined Target Population (TP)
F94 M1 Fatal Serious Slight Total
Lower Est. Predicted Est. Upper Est. Lower Est. Predicted Est. Upper Est. Lower Est. Predicted Est. Upper Est. Lower Est. Predicted Est. Upper Est.
RQ1 TP 123 123 123 1203 1203 1203 11963 11963 11963 13289 13289 13289
Existing Measure Savings 4 11 15 32 41 53 176 232 297 212 284 365 Other Measure Savings 10 40 53 94 278 382 696 1857 2567 800 2175 3002 Other Measure Mitigation 3 5 10 28 51 103 -31 -56 -113 - - -
Assessed Measure TP 110 78 60 1081 874 718 11298 10162 9509 12489 11114 10287 Assessed Measure Savings TP only TP only TP only TP only TP only TP only TP only TP only TP only TP only TP only TP only
Total Savings 14 51 68 126 319 435 872 2089 2864 1012 2459 3367 Remaining Casualties 106 67 45 1049 833 665 11122 9930 9212 12277 10830 9922
Figure 39: F94 total predicted estimate of casualties saved by measure type
0
2000
4000
6000
8000
10000
12000
14000
16000
RQ1 TP Existing
Measure
Savings
Other
Measure
Savings
Assessed
Measure
Savings
Remaining
Casualties
Interpretation Notes: • Caution should be applied if summing or comparing the results between measures due to
different methods in the generation of the TPs. Some TPs were refined to a greater level of detail than others (see RQ1 report)
• The sequence of the other and existing measures in the calculations is based on the chronology of a crash. If the sequence were altered then it would make an individual measure appear more or less effective, so the results at each step in the calculation should be treated with caution. The final result generating the Effectiveness Estimate from the Target Popultion remains the same (as long as no additional measures are added).
• The result for an existing or proposed measure is only in the context of the Target Population of the studied measure. It should not be interpreted out of context as a finding of overall effect on the whole casualty population.
• The confidence intervals should be interpreted with caution. For some literature measures the 5th and 95th percentile confidence intervals are not available, so the median has been used; this would make a result appear with narrower upper and lower estimates and appear more confident than it actually is.
• Caution should be applied when looking at the VIS and ISA upper and lower estimates, which are not the 5th and 95th percentile confidence intervals. Instead these are an interpretation of the different levels of confidence in avoidance. Lower estimate = high confidence only; predicted estimate = high + medium confidence; upper estimate = high + medium + low confidence
• It has not been possible to account for the under-reporting of speeding recorded in Stats19 in the same was as where ISA is the studied measure. The effect is to under-estimate the effect of ISA.
• The Target Population (TP) has been updated since the last version of Phase 1 / RQ1. These changes will be reflected in the RQ1 report in due course.

Effectiveness Estimates
v3.0 73 PPR844
4.6 Side Impact Crash Test (S95)
The analysis for this measure refines the target population of casualties in collisions relevant to the measure only. It does not predict the casualty savings of the measure as there is currently no effectiveness values available in the literature.
Table 35 shows the original target population from RQ1 is predicted to reduce by a total of 80 casualties (2 fatalities, 11 seriously injured and 67 slightly injured) over a period of 5 years from the effect of existing (ESC) and other (ISA and AEB) measures. Specifically, a predicted 75 and 5 casualties would be prevented over a five year period by the existing and other measures respectively.
ISA is predicted to have a mitigation effect, where the collision could not have been avoided but the severity of the collision and, therefore, the severity of the casualties, is reduced. It is predicted that ISA would mitigate 16 serious casualties to only suffering slight injuries. Furthermore, it is predicted that 2 fatally injured casualties would instead survive with serious injuries. This is predicted to result in an overall reduction of 2 fatalities and 14 seriously injured casualties but the addition of 16 slightly injured casualties. ISA is not predicted to have any mitigation effect on casualties who are slightly injured due to difficulty in preventing minor injuries without avoiding the collision.
The variance in the predicted target population ranges from a minimum of 4,301 casualties up to 4,311 casualties in vehicles currently exempt from the Regulation S95 injured in collisions relevant to the tests in the regulation that could be influenced by the introduction of the measures over a 5 year period.
Figure 40 graphically represents the values shown in the total predicted column, with the lower and upper estimates expressed as confidence intervals. The mitigation effect is not shown in the graph as the values show total casualties.

Effectiveness Estimates
v3.0 74 PPR844
Table 35: S95 – M1/N1 vehicles that are currently excluded; calculation of refined Target Population (TP)
S95 M1 Fatal Serious Slight Total
Lower Est. Predicted Est. Upper Est. Lower Est. Predicted Est. Upper Est. Lower Est. Predicted Est. Upper Est. Lower Est. Predicted Est. Upper Est.
RQ1 TP 26 26 26 267 267 267 4018 4018 4018 4311 4311 4311
Existing Measure Savings 1 2 3 9 11 15 47 62 80 57 75 98 Other Measure Savings 0 0 0 0 0 0 0 5 10 0 5 10 Other Measure Mitigation 0 2 3 7 14 32 -7 -16 -35 - - -
Assessed Measure TP 26 24 23 260 253 235 4025 4029 4043 4311 4306 4301 Assessed Measure Savings TP only TP only TP only TP only TP only TP only TP only TP only TP only TP only TP only TP only
Total Savings 1 2 3 9 11 15 47 67 90 57 80 108 Remaining Casualties 25 22 20 251 242 220 3978 3967 3963 4254 4231 4203
Figure 40: S94 total predicted estimate of casualties saved by measure type
0
500
1000
1500
2000
2500
3000
3500
4000
4500
5000
RQ1 TP Existing
Measure
Savings
Other
Measure
Savings
Assessed
Measure
Savings
Remaining
Casualties
Interpretation Notes: • Caution should be applied if summing or comparing the results between measures due to
different methods in the generation of the TPs. Some TPs were refined to a greater level of detail than others (see RQ1 report)
• The sequence of the other and existing measures in the calculations is based on the chronology of a crash. If the sequence were altered then it would make an individual measure appear more or less effective, so the results at each step in the calculation should be treated with caution. The final result generating the Effectiveness Estimate from the Target Popultion remains the same (as long as no additional measures are added).
• The result for an existing or proposed measure is only in the context of the Target Population of the studied measure. It should not be interpreted out of context as a finding of overall effect on the whole casualty population.
• The confidence intervals should be interpreted with caution. For some literature measures the 5th and 95th percentile confidence intervals are not available, so the median has been used; this would make a result appear with narrower upper and lower estimates and appear more confident than it actually is.
• Caution should be applied when looking at the VIS and ISA upper and lower estimates, which are not the 5th and 95th percentile confidence intervals. Instead these are an interpretation of the different levels of confidence in avoidance. Lower estimate = high confidence only; predicted estimate = high + medium confidence; upper estimate = high + medium + low confidence
• It has not been possible to account for the under-reporting of speeding recorded in Stats19 in the same was as where ISA is the studied measure. The effect is to under-estimate the effect of ISA.
• The Target Population (TP) has been updated since the last version of Phase 1 / RQ1. These changes will be reflected in the RQ1 report in due course.
•

Effectiveness Estimates
v3.0 75 PPR844
4.7 Adult Head to Windscreen Area (HED)
The effectiveness estimate of the Pedestrian Protection Airbag (PPA) for this measure was calculated to be different for the pedestrian and cyclist casualty populations. Therefore, the two populations are presented separately.
Table 36 shows a predicted saving of 83 pedestrian casualties (30 fatalities and 53 seriously injured) over a 5 year period if M1 vehicles were fitted with a Pedestrian Protection Airbag. The measure does not affect slight head injuries so no prediction on slight casualty savings are made for this measure. The estimated effectiveness of the measure does not include any confidence intervals, as such there is no variance in the predicted savings other than as a result of the change in the Assessed Measure TP from the mitigation effect of ISA.
The effect of other (ISA and AEB-PCD) were considered and the casualties saved by these measures removed from the sample, prior to the HED effect being considered. In total, a predicted 1,825 casualties are predicted to be prevented over a five year period by the other measures.
ISA is predicted to have a mitigation effect, where the collision could not have been avoided but the severity of the collision and, therefore, the severity of the casualties, is reduced. It is predicted that ISA would mitigate 120 serious casualties to only suffering slight injuries. Furthermore, it is predicted that 10 fatally injured casualties would instead survive with serious injuries. This is predicted to result in an overall reduction of 10 fatalities and 110 seriously injured casualties but the addition of 120 slightly injured casualties. ISA is not predicted to have any mitigation effect on casualties who are slightly injured due to difficulty in preventing minor injuries without avoiding the collision.
Figure 41 graphically represents the values shown in the total predicted column, with the lower and upper estimates expressed as confidence intervals. The mitigation effect is not shown in the graph as the values show total casualties.
The effectiveness estimate of a PPA for cyclists was calculated to have no effect on preventing cyclist casualties. Table 37 shows that no cyclist casualties are predicted to be prevented by the PPA but a predicted 253 casualties are predicted to be prevented over a five year period by the other measures (ISA and AEB-PCD). The measure does not affect slight head injuries so no prediction on slight casualty savings are made for this measure.
The estimated effectiveness of the measure does not include any confidence intervals, as such there is no variance in the predicted savings other than as a result of the change in the Assessed Measure TP from the mitigation effect of ISA.
ISA is predicted to have a mitigation effect, where the collision could not have been avoided but the severity of the collision and, therefore, the severity of the casualties, is reduced. It is predicted that ISA would mitigate 18 serious casualties to only suffering slight injuries. Furthermore, it is predicted that 1 fatally injured casualty would instead survive with serious injuries. This is predicted to result in an overall reduction of 1 fatalities and 17 seriously injured casualties but the addition of 18 slightly injured casualties. ISA is not predicted to

Effectiveness Estimates
v3.0 76 PPR844
have any mitigation effect on casualties who are slightly injured due to difficulty in preventing minor injuries without avoiding the collision.
Figure 42 graphically represents the values shown in the total predicted column, with the lower and upper estimates expressed as confidence intervals. The mitigation effect is not shown in the graph as the values show total casualties.

Effectiveness Estimates
v3.0 77 PPR844
Interpretation Notes: • Caution should be applied if summing or comparing the results between measures due to
different methods in the generation of the TPs. Some TPs were refined to a greater level of detail than others (see RQ1 report)
• The sequence of the other and existing measures in the calculations is based on the chronology of a crash. If the sequence were altered then it would make an individual measure appear more or less effective, so the results at each step in the calculation should be treated with caution. The final result generating the Effectiveness Estimate from the Target Popultion remains the same (as long as no additional measures are added).
• The result for an existing or proposed measure is only in the context of the Target Population of the studied measure. It should not be interpreted out of context as a finding of overall effect on the whole casualty population.
• The confidence intervals should be interpreted with caution. For some literature measures the 5th and 95th percentile confidence intervals are not available, so the median has been used; this would make a result appear with narrower upper and lower estimates and appear more confident than it actually is.
• Caution should be applied when looking at the VIS and ISA upper and lower estimates, which are not the 5th and 95th percentile confidence intervals. Instead these are an interpretation of the different levels of confidence in avoidance. Lower estimate = high confidence only; predicted estimate = high + medium confidence; upper estimate = high + medium + low confidence
• It has not been possible to account for the under-reporting of speeding recorded in Stats19 in the same was as where ISA is the studied measure. The effect is to under-estimate the effect of ISA.
• The Target Population (TP) has been updated since the last version of Phase 1 / RQ1. These changes will be reflected in the RQ1 report in due course.
•
Table 36: HED Pedestrians – M1 vehicles; calculation of Effectiveness Estimate (EE)
HED Pedestrians M1 Fatal Serious Slight Total
Lower Est. Predicted Est. Upper Est. Lower Est. Predicted Est. Upper Est. Lower Est. Predicted Est. Upper Est. Lower Est. Predicted Est. Upper Est.
RQ1 TP 299 299 299 3673 3673 3673 - - - 3972 3972 3972
Existing Measure Savings - - - - - - - - - - - - Other Measure Savings 137 138 139 1685 1687 1690 - - - 1822 1825 1829 Other Measure Mitigation 5 10 22 51 110 252 -56 -120 -274 - - -
Assessed Measure TP 157 151 138 1937 1876 1731 56 120 274 2150 2147 2143 Assessed Measure Savings 31 30 27 54 53 49 - - - 85 83 76
Total Savings 168 168 166 1739 1740 1739 - - - 1907 1908 1905 Remaining Casualties 126 121 111 1883 1823 1682 56 120 274 2065 2064 2067
Figure 41: HED Pedestrians - total predicted estimate of casualties saved by measure type
0
500
1000
1500
2000
2500
3000
3500
4000
4500
RQ1 TP Existing
Measure
Savings
Other
Measure
Savings
Assessed
Measure
Savings
Remaining
Casualties

Effectiveness Estimates
v3.0 78 PPR844
Interpretation Notes: • Caution should be applied if summing or comparing the results between measures due to
different methods in the generation of the TPs. Some TPs were refined to a greater level of detail than others (see RQ1 report)
• The sequence of the other and existing measures in the calculations is based on the chronology of a crash. If the sequence were altered then it would make an individual measure appear more or less effective, so the results at each step in the calculation should be treated with caution. The final result generating the Effectiveness Estimate from the Target Popultion remains the same (as long as no additional measures are added).
• The result for an existing or proposed measure is only in the context of the Target Population of the studied measure. It should not be interpreted out of context as a finding of overall effect on the whole casualty population.
• The confidence intervals should be interpreted with caution. For some literature measures the 5th and 95th percentile confidence intervals are not available, so the median has been used; this would make a result appear with narrower upper and lower estimates and appear more confident than it actually is.
• Caution should be applied when looking at the VIS and ISA upper and lower estimates, which are not the 5th and 95th percentile confidence intervals. Instead these are an interpretation of the different levels of confidence in avoidance. Lower estimate = high confidence only; predicted estimate = high + medium confidence; upper estimate = high + medium + low confidence
• It has not been possible to account for the under-reporting of speeding recorded in Stats19 in the same was as where ISA is the studied measure. The effect is to under-estimate the effect of ISA.
• The Target Population (TP) has been updated since the last version of Phase 1 / RQ1. These changes will be reflected in the RQ1 report in due course.
•
Table 37: HED Cyclists – M1 vehicles; calculation of Effectiveness Estimate (EE)
HED Cyclists M1 Fatal Serious Slight Total
Lower Est. Predicted Est. Upper Est. Lower Est. Predicted Est. Upper Est. Lower Est. Predicted Est. Upper Est. Lower Est. Predicted Est. Upper Est.
RQ1 TP 18 18 18 534 534 534 - - - 552 552 552
Existing Measure Savings - - - - - - - - - - - - Other Measure Savings 8 8 8 245 245 246 - - - 253 253 254 Other Measure Mitigation 0 1 1 8 17 39 -8 -18 -40 - - -
Assessed Measure TP 10 9 9 281 272 249 8 18 40 299 299 298 Assessed Measure Savings 0 0 0 0 0 0 - - - 0 0 0
Total Savings 8 8 8 245 245 246 - - - 253 253 254 Remaining Casualties 10 9 9 281 272 249 8 18 40 299 299 298
Figure 42: HED - total predicted estimate of casualties saved by measure type
0
100
200
300
400
500
600
RQ1 TP Existing
Measure
Savings
Other
Measure
Savings
Assessed
Measure
Savings
Remaining
Casualties

Effectiveness Estimates
v3.0 79 PPR844
4.8 Reversing Detection (REV)
Table 38: REV – M1 vehicles; calculation of Effectiveness Estimate (EE)
REV M1 Fatal Serious Slight Total
Lower Est. Predicted Est. Upper Est. Lower Est. Predicted Est. Upper Est. Lower Est. Predicted Est. Upper Est. Lower Est. Predicted Est. Upper Est.
RQ1 TP - 7 - - 41 - - 136 - - 177 -
Existing Measure Savings - - - - - - - - - - - -
Other Measure Savings - - - - - - - - - - - -
Other Measure Mitigation - - - - - - - - - - - -
Assessed Measure TP - - - - - - - - - - - -
Assessed Measure Savings - - - - - - - - - - - -
Total Savings - - - - - - - - - - - -
Remaining Casualties - 7 - - 41 - - 136 - - 177 -
Interpretation Notes: • Caution should be applied if summing or comparing the results between measures due to
different methods in the generation of the TPs. Some TPs were refined to a greater level of detail than others (see RQ1 report)
• The sequence of the other and existing measures in the calculations is based on the chronology of a crash. If the sequence were altered then it would make an individual measure appear more or less effective, so the results at each step in the calculation should be treated with caution. The final result generating the Effectiveness Estimate from the Target Popultion remains the same (as long as no additional measures are added).
• The result for an existing or proposed measure is only in the context of the Target Population of the studied measure. It should not be interpreted out of context as a finding of overall effect on the whole casualty population.
• The confidence intervals should be interpreted with caution. For some literature measures the 5th and 95th percentile confidence intervals are not available, so the median has been used; this would make a result appear with narrower upper and lower estimates and appear more confident than it actually is.
• Caution should be applied when looking at the VIS and ISA upper and lower estimates, which are not the 5th and 95th percentile confidence intervals. Instead these are an interpretation of the different levels of confidence in avoidance. Lower estimate = high confidence only; predicted estimate = high + medium confidence; upper estimate = high + medium + low confidence
• The Target Population (TP) has been updated since the last version of Phase 1 / RQ1. These changes will be reflected in the RQ1 report in due course.
RQ1 defined the target population for this measure. No further analysis is being performed.
No existing or other measures are assessed for REV.
No effectiveness values are yet available from the literature or other research centre
The analysis only provides a predicted TP.

Effectiveness Estimates
v3.0 80 PPR844
5 Summary/Conclusions
The focus of this report was to continue to fill the knowledge gaps in the effectiveness estimates and the resulting casualty benefit and of the eight measures assessed in this study. The findings from this study will feed into the GSR casualty impact analysis and provide evidence for the discussion and decision on which of the 24 measures assessed in the General Safety Review should be implemented in the future. This report is one of three being conducted simultaneously and with the same objective. The other reports are undertaking similar analyses on the same eight measures using collision data from Germany and France. The findings from this report will be combined with those from the German and French counterparts to provide an assessment of the predicted casualty benefits across Europe of the eight assessed measures.
This study continues from previous work that established the target populations for each of the eight measures in Great Britain over a five year period (RQ1) using National Collisions (STATS19) database from 2011-2015. Where the target populations could not be defined sufficiently due to the detail captured in STATS19, Great Britain’s in-depth collision database (RAIDS) was used to further refine the national dataset to provide an accurate estimation of the casualty target population.
The method applied in this report categorises the individual casualties in the target populations into sub-populations, based on the type of collision, that are relevant to one or multiple measures (Table 5). Some casualties were injured in collisions or vehicles that are relevant to multiple measures resulting in overlapping sub-populations within a target population (Figure 8). The analysis is able to consider the effect of all of the relevant measures on the target population such that double counting casualties who may be saved by multiple measures is avoided (Figure 10 and Figure 11). The result is a new refined target population which is used to provide a more accurate understanding of the residual casualty population that could be addressed by the assessed measure being analysed. If effectiveness estimates for the assessed measure are available the analysis then applies this effect to the revised target population resulting in a predicted reduction in casualties and residual casualty population that will still be injured or killed should the measure be implemented.
The summary findings of the target populations and predicted casualty benefits for each of the eight measures and the combination of other measures are shown in Table 39. The key findings for each measure and limitations of the analysis are detailed in Section 5.1 and 5.2 respectively.

Effectiveness Estimates
v3.0 81 PPR844
Table 39: Summary table of predicted casualty savings and remaining casualty populations
Fatal Serious Slight Total
VIS †
Target population (RQ1) 312 810 1896 3018
Best-in-class cab savings 9 24 57 90
Remaining casualty population 303 786 1839 2928
High-visibility cab savings 84 220 512 816
Remaining casualty population 228 590 1384 2202
VRU detection savings 124 324 760 1208
Remaining casualty population 188 486 1136 1810
AEB-PCD savings 136 357 836 1329
Remaining casualty population 176 453 1060 1689
ISA M1
Target population (RQ1) 1469 7680 43916 53065
Other measure savings 529 1804 7474 9807
ISA measure savings 168 1060 6991 8219
Mitigated casualties 56 296 -352 0
Remaining casualty population 716 4520 29803 35039
ISA M2
Target population (RQ1) 0 27 109 136
Other measure savings 0 0 2 2
ISA measure savings 0 4 18 22
Mitigated casualties 0 2 -2 0
Remaining casualty population 0 21 91 112
ISA M3
Target population (RQ1) 9 18 86 113
Other measure savings 0 0 5 5
ISA measure savings 1 3 14 18
Mitigated casualties 1 1 -2 0
Remaining casualty population 7 14 69 90
ISA N1
Target population (RQ1) 18 217 1790 2025
Other measure savings 3 38 282 323
ISA measure savings 3 32 289 324
Mitigated casualties 1 10 -11 0
Remaining casualty population 11 137 1230 1378
ISA N2
Target population (RQ1) 0 18 90 108
Other measure savings 0 0 3 3
ISA measure savings 0 3 15 18
Mitigated casualties 0 1 -1 0
Remaining casualty population 0 14 73 87
ISA N3
Target population (RQ1) 54 68 321 443
Other measure savings 12 5 16 33
ISA measure savings 7 10 53 70
Mitigated casualties 3 1 -4 0
Remaining casualty population 32 52 256 340

Effectiveness Estimates
v3.0 82 PPR844
FSO ‡
Target population (RQ1) 69 793 12376 13238
Other measure savings 27 195 2054 2276
Mitigated casualties 3 34 -37 0
Remaining casualty population 39 564 10359 10962
SFS ‡
Target population (RQ1) 132 857 10352 11341
Other measure savings 24 39 180 243
Mitigated casualties 7 43 -50 0
Remaining casualty population 101 775 10222 11098
F94 ‡
Target population (RQ1) 123 1203 11963 13289
Other measure savings 51 319 2089 2459
Mitigated casualties 5 51 -56 0
Remaining casualty population 67 833 9930 10830
S95 ‡
Target population (RQ1) 26 267 4018 4311
Other measure savings 2 11 67 80
Mitigated casualties 2 14 -16 0
Remaining casualty population 22 242 3967 4231
HED Ped
Target population (RQ1) 299 3673 - 3972
Other measure savings 138 1687 - 1825
HED measure savings 30 53 - 83
Mitigated casualties 10 110 -120 0
Remaining casualty population 121 1823 120 2064
HED Cyc
Target population (RQ1) 18 534 - 552
Other measure savings 8 245 - 253
HED measure savings 0 0 - 0
Mitigated casualties 1 17 -18 0
Remaining casualty population 9 272 18 299
REV †‡
Target population (RQ1) 7 41 136 139
Other measure savings - - - -
Remaining casualty population 7 41 136 139
† No other measures were assessed.
‡ No effectiveness is available for the assessed measure so no savings are provided.
- No assessment was made.

Effectiveness Estimates
v3.0 83 PPR844
5.1 Key Findings
5.1.1 VIS – Improved front end design for direct and indirect driver vision
The VIS measure assessed four different variants (two direct visibility and two indirect visibility solutions) against the same target population to understand which variant yields the greatest casualty benefit. The effectiveness estimates for all four variants were established by undertaking a case-by-case analysis of relevant collisions in RAIDS and expert investigators made independent assessments on the likelihood of each VIS variant avoiding the collision.
The specification for the four variants assessed were provided by ACEA prior to the case-by-
case analysis. The four variants include:
o Best-in-Class cab - direct
o High-direct-visibility cab - direct
o VRU detection system (no braking) - indirect
o VRU detection system with braking (AEB-PCD) – indirect
• The four variants of VIS will influence the same collision types so the target
population is common, and only shown once in Table 39.
• The indirect vision measures are predicted to have a larger casualty benefit than the
direct measures.
• The largest predicted VRU casualty savings are with the implementation of an AEB-
PCD system 1,328 casualties. 120 more compared to just a VRU-detection system.
• The adoption of a High-Direct-Visibility cab is predicted to have a marked
improvement in casualty reduction compared to just changing the cab to the current
Best-in-Class for direct visibility.
• No other measures are evaluated in the assessment of the four VIS measures and
the effectiveness values for the measures do not vary with injury severity of the
collision so the proportions of predicted casualty savings are uniform across the
casualty severities.
5.1.2 ISA – Intelligent Speed Assistance
The ISA measures assessed the implementation of an ISA system onto six different vehicle types. The effectiveness estimates for all four variants were established by undertaking a case-by-case analysis of relevant collisions in RAIDS and expert investigators made independent assessments on the likelihood of the speeding drivers to abide by an ISA system if it were fitted in their vehicle and the ability for ISA to have avoided the collision. ISA was also assessed for its ability to mitigate the injury outcome of the collision, if the collision was unavoidable. This effect was built into the analysis model when ISA is the assessed measure and when it is one of the other measures. The system specification for ISA was defined by ACEA.

Effectiveness Estimates
v3.0 84 PPR844
• The results for the ISA measure are separated for the six different vehicle categories
to which the system may be applied. Each category has a separate target population
derived from RQ1. The summary results for each ISA vehicle category must be
considered alone and not collectively with the other vehicle categories as this may
result in the misinterpretation of the casualty benefits of ISA. There is a risk of
double counting casualties saved totalling the casualty benefits between vehicle
categories as the analysis only considers ISA fitted to one vehicle type in isolation.
This is because casualties in collisions that involve more than one speeding vehicle
category could appear in more than one ISA vehicle category. There are fewer than
400 casualties with more than one speeding vehicle category in total so this effect is
small.
• Fitting ISA to M1 vehicles will yield the greatest casualty benefit compared to the
other ISA vehicle categories. However, other measures (including ESC, LKA, AEB and
AEB-PCD) that could be fitted to M1 vehicles are predicted to have a greater overall
casualty benefit than ISA.
• The remaining casualty population is approximately 66% (35,039 of 53,065
casualties) of the original target population for ISA in speeding M1 vehicles.
• There are far fewer speeding N1 vehicles in the ISA Target population than M1
vehicles. Other measures are predicted to have a similar effect on casualty reduction
as ISA with an approximately 32% (647 of 2,025 casualties) reduction in casualties
from both ISA and the other measures from the original N1 ISA target population.
• By comparison the target population for ISA M2, M3, N2 and N3 are relatively small.
However, the effect of other measures on casualty benefits is less than for ISA M1.
This is likely due to the different combination of other measures that ACEA specified
should be combined with these vehicle categories compared to M1 and N1.
• The effect of injury mitigation from ISA is less than its predicted effect on preventing
casualties.
5.1.3 FSO – Frontal impact Small Overlap crash test
The implementation of a Frontal impact Small Overlap crash test is expected to provide a
secondary safety benefit to casualties. In this study, no effectiveness estimate for FSO was
available so the analysis further refines the target population from RQ1 by taking into
account the effect of other active safety measures that were pre-defined by ACEA.
• In total, the effect of the other measures is predicted to provide a 17% reduction in
the casualty target population (2,276 of 13,238 casualties).
• The proportion of casualties injured in vehicles that were speeding was relatively
small and therefore, the effect of ISA mitigation is minimal in the target population
for FSO.

Effectiveness Estimates
v3.0 85 PPR844
• The remaining target population for this measure remains above ten thousand
casualties in GB over a 5 year period with 6% being killed or seriously injured (603 of
10,962 casualties).
5.1.4 SFS – Side impact Far Side occupant crash test
Similarly, for SFS no effectiveness estimate has been applied to predict the casualty benefit
of implementing a Side impact Far Side occupant crash test into regulation. The analysis for
SFS refines the original target population from RQ1 by accounting for the other measures
specified by ACEA that may show a casualty benefit in the SFS target population.
• The effect of the other measures is minimal, resulting in a 2% reduction in the
original target population for SFS (243 of 11,341 casualties).
• ISA’s mitigation effect is also minimal, predicted to result in a total of 0.4% (50
casualties) of the casualty target population being mitigated.
• The target population for SFS is largely unaffected by the implementation of the
other measures assessed in this study.
5.1.5 F94 – Frontal Impact Crash Test (removal of exemptions from Regulation 94)
The target population for F94 is comprised of vehicles that are currently out of scope for
Regulation 94 due to their gross permitted mass being in excess of 2500kg. The casualties of
those vehicles were identified using the STATS19 enhanced data to provide vehicle Make
and Model data which was used in combination with a reference table provided by ACEA of
the relevant vehicles that are out of scope for Regulation 94. No effectiveness estimate was
available for the measure in this study so the analysis refines the RQ1 target population by
taking into account the effect of other active safety measures that were pre-defined by
ACEA.
• The other measures specified by ACEA that could influence the target population of
94 are predicted to have total effect of reducing the target population by 19% (2459
of 13289 casualties). The mitigation effect of ISA is predicted to only affect 56 killed
or seriously injured casualties over 5 years in GB.
• The refined target population shows that it is predicted that over ten thousand
casualties will be injured in GB over a 5 year period, with 8% being killed or seriously
injured (900 of 10,830 casualties), in vehicles that are currently out of scope for
Regulation 94.
• It is possible that the results in Table 39 do not include all vehicles out of scope of
Regulation 94. The reference list of relevant vehicles provided by ACEA does not
include vehicles built by manufacturers who are not part of ACEA. Those vehicles are
not accounted for in the target population.

Effectiveness Estimates
v3.0 86 PPR844
5.1.6 S95 – Side Impact Crash Test (removal of exemptions from Regulation 95)
Similarly, the target population for S95 is comprised of vehicles that are not in scope for Regulation 95 because they have an R Point height >700mm. The method of identifying those casualties also uses Make and Model data from the enhanced STAST19 dataset in combination with a reference list of vehicles provided by ACEA. No effectiveness estimate was available for the measure in this study so the analysis refines the RQ1 target population by taking into account the effect of other active safety measures that were pre-defined by ACEA.
• The effect of the other measures also evaluated with S95 are predicted to result in a
casualty reduction of less than 2% of the original target population for S95 (80 of
4,311 casualties). Similarly, the mitigation effect of ISA is predicted to be small, only
affecting 16 killed or seriously injured casualties over 5 years in GB. This analysis has
shown that the residual casualty popualtion identified in RQ1 remains largely
unchanged by the influence of potentially implementing other measures.
• The target population for S95 is also subject to the same limitation as F94, that the
reference list may not account for all vehicles that are currently our of scope of
Regulation 95.
5.1.7 HED – Adult Head to Windscreen Area
The HED measure assess the casualty benefits of the implementation of a Pedestrian Protection Airbag (PPA) on M1 vehicles impacting pedestrians and cyclists at the front. The effectiveness estimates for the implementation of a PPA were derived in a separate study commissioned by ACEA (Schneider et al. 201710) that used the GB dataset published in RQ1. As a result effectiveness estimates were provided for pedestrians and cyclists separately so the results have been presented for both vulnerable user types separately.
The study to determine the effectiveness estimates was conducted simultaneously with the RQ2 analysis of this study. In order to use the effectiveness estimates adjustment to the target population calculations performed in RQ1 to ensure a common approach was used. As a result the target population figures from RQ1 have been updated in this report from the original publication of the report.
• The effect of other measures specified by ACEA are predicted to have a substantial
effect on the target population of pedestrians and cyclists struck by the front of M1
vehicles. Nearly half (46%) of the killed or seriously injured casualties are predicted
to be avoided by the other measures.
• One of the most significant other measures is AEB-PCD. The effectiveness estimate
was calculated to be 45.9% for AEB - PCD and was derived in the same study
10 Schneider et al. 2017.

Effectiveness Estimates
v3.0 87 PPR844
(Schneider et al. 2017) as the PPA effectiveness using the GB data published from the
RQ1 report.
• The predicted effect of a PPA on the resulting target population, once the effect of
the other measures has been considered, is predicted to prevent 2% (83 of 3972
casualties) of the original target population for HED.
• The PPA was calculated to have a variable effect on pedestrians depending on if they
were fatally or seriously injured. 19.89% of fatally injured pedestrians impacted by
the front of M1 vehicles were predicted to be saved by the PPA avoided compared to
only 2.80% of seriously injured pedestrians. Fatally injured pedestrians make up 7.5%
(299 of 3972 casualties) of the pedestrian target population. The result is a
comparatively small predicted effect of the PPA on pedestrian casualties.
• Schneider et al. (2017) predicted that there would be no effect of a PPA on cyclist
casualties. Therefore, an effectiveness of 0% was applied yield no casualty benefit.
• The sensitivity of the effectiveness estimate calculations in Schneider et al. 2017 is
very high due to the small sample of applicable in-depth collisions available from the
RAIDS database.
5.1.8 REV – Reversing Detection
The assessment of REV has been limited in this study due to the datasets used. The sample of appropriate collisions relevant to REV is very small in both STATS19 and RAIDS. Both datasets collect data on road traffic collisions that occur on public highways. It is believed that a proportion of the collisions occurring that are relevant to REV occur on private land (e.g. construction sites or private driveways). Without an accurate understanding of the target population of collisions relevant to REV from STATS19 it is not possible to make an accurate prediction of the casualty benefit of implementing REV.
• The number of collisions in GB’s in-depth database (RAIDS) is too small to perform any meaningful case-by-case analysis. Therefore, no further analysis has been done on REV.

Effectiveness Estimates
v3.0 88 PPR844
5.2 Limitations
This report only evaluates eight of the measures under consideration for the General and Pedestrian Safety regulations, and there are many more being considered by the EC. If additional measures are taken into account this may change all the results. If measures were added into the calculation sequence prior to these eight measures then it would have the effect of reducing the EE presented in this report.
It is important to remember that the estimated casualty savings, or EE, for each measure cannot be summed between vehicle types, or between measures. The target populations are calculated in different ways according to the measure, therefore the estimates cannot be summed because they are not comparable with each other.
Finding relevant cases in the STATS19 estimated gross target population for the four existing (ESC, HGV LDW and HGV AEB) and proposed (AEB, AEB-PCD, LKA and ISA) measures is probably over inclusive. This is with the exception of LKA which does not identify vehicles that have changed lanes but not left the carriageway. This over inclusion results in a likely over estimate of the effect of these measures.
Speeding is known to be greatly underreported in STATS19 so all of the ISA results have had a global correction factor (Richards et al., 2010) applied to the dataset to provide a more realistic prediction of the casualty benefits. However, the scale of underreporting is substantial and, though the analysis has generated specific results, the application of the correction factor introduces uncertainty into the model. Target population for ISA M1 is large enough that this uncertainty has a negligible effect. However, for the other vehicle categories the target population is small enough that it could considerably alter the proportions of casualties saved by ISA. Therefore, these results should be interpreted cautiously.
A limitation is that the effectiveness for COLLISIONS cannot logically translate into a CASUALTY benefit proportionally/representatively. Because the demographic of casualties in these collisions can vary and the effectiveness does not account for this, it only accounts for types of collisions – not types or numbers of casualties. However, we have assumed an even distribution of casualties among all of the collisions. So the effectiveness of saving collisions translates to saving the casualties in a uniform distribution. Overall this is likely to result in an underestimate of the casualty potential of the measures.
The effectiveness values derived from the literature were not GB specific so might not be applicable to the GB casualty numbers. For example the distribution of collisions used in the literature sources specified by ACEA may differ from the GB distribution. However, the Fildes (2015) paper does incorporate GB data into its analysis and the HED PPA and AEB-PCD effectiveness values were derived from GB data (Schneider et al. 2017). It would also be possible to carry out a GB specific literature review or to carry out new analysis, to generate a more accurate set of effectiveness values for use in the calculations; but this was outside of the scope of the present study.

Effectiveness Estimates
v3.0 89 PPR844
5.3 Future Work
Case-by-case reviews were only included for ISA and VIS in this report due to restrictions on time and budget. However it would be feasible to extend the case-by-case reviews to cover a wider range of measures, for example HED, REV etc.
It would be feasible to add a fitment module to the calculations. The fitment of the measures is assumed to be 100% in this report, although in reality some measures are fitted much more widely than others. It is possible to generate fitment curves for the new vehicle fleet, and then to generate a model to represent the on-the-road fleet including used vehicles. This would help to model the effect of applying a measure within regulation sooner or later, and the consequent effect on casualty savings.
It would also be possible to develop a model that can account for the underreporting of speeding vehicles which affects the target population of ISA when it is the assessed measure and a proposed measure. The model would be able to redistribute the casualty population and increase the ISA population without altering the populations of casualties relevant to other measures. This would provide a more robust casualty benefit assessment for ISA and the measures when ISA is one of the proposed measures, resulting in more accurate results.

Effectiveness Estimates
v3.0 90 PPR844
Appendix A Intelligent speed assist (ISA)
No literature is available on the effectiveness of ISA so TRL undertook novel research to assess the expected effectiveness estimates of the measure on relevant collisions. The following analysis detail how the effectiveness estimates for ISA was determined using case-by-case analysis of in-depth collision cases.
A.1 Sample Details & Weighting
Figure 43 presents the number of cases considered for the study under each vehicle category. A total of 113 cases were considered for the ISA study. Of the sample considered, the majority (84 or 78%) of cases involved M1 category vehicles followed by N2 vehicles (19 or 18%) and a small proportion of other categories such as M2 (1%), M3 (1%) and N3 (3%) were also involved in the study. Note that in selecting the sample of M1/N1 vehicles there were zero N1 included, which was by chance because the sample was randomly selected.
Figure 43: Vehicle classification of ISA sample.
There were greater than 100 cases available for M1/N1 vehicles for the ISA measure in the RAIDS dataset, therefore the sample was selected to make it match the STATS19 distribution. Table 40 describes the distribution of the initial RAIDS sample.
Thereafter the illegal driver behaviours were removed to match the approach taken in Phase 1 / RQ1. This reduced the sample to 84, so then a weighting was used to bring the sample back to being representative of STATS19, as shown in Table 41. The injury severity, road class, and whether the area was built up or not built up were the factors used in the weighting.

Effectiveness Estimates
v3.0 91 PPR844
Table 40: Description of ISA M1/N1 case-by-case sample distribution by injury severity, road class and whether the collision was in a built up area.
Area Road Class
Fatal Serious Slight Total
Built Up (<50mph)
M 0% 0% 0% 0%
A 0% 6% 19% 25%
B 0% 3% 13% 17%
C 1% 3% 21% 26%
Non-Built up (≥50mph)
M 0% 1% 2% 3%
A 2% 4% 11% 18%
B 0% 0% 3% 3%
C 0% 2% 6% 8%
Total 3% 20% 76% 100%
Table 41: Weighting factors applied to RAIDS ISA M1/N1 case-by-case sample to make it representative of STATS19 distribution.
Area Road Class
Fatal Serious Slight
Built Up (<50mph)
M 0.00 0.00 0.00
A 0.00 0.67 1.31
B 0.00 0.53 0.71
C 0.39 1.13 1.32
Non-Built up (≥50mph)
M 0.00 0.25 1.03
A 0.33 0.63 0.98
B 0.00 0.00 0.87
C 0.00 0.44 0.71

Effectiveness Estimates
v3.0 92 PPR844
For the M2/N2/M3/N3 heavy vehicles samples there were less than 100 cases available in the RAIDS dataset, so all were coded. Then a weighting was applied to make the sample representative of the STATS19 data. The injury severity, road class, and whether the area was built up or not built up were the factors used in the weighting. Table 42 describes the distribution of the RAIDS sample of cases, and Table 43 describes the weighting factors used to make the distribution more representative of STATS19.
Table 42: Description of ISA M2/N2/M3/N3 case-by-case sample distribution by injury severity, road class and whether the collision was in a built up area.
Area Road Class
Fatal Serious Slight Total
Built Up (<50mph)
M 0% 0% 0% 0%
A 0% 17% 8% 25%
B 4% 4% 13% 21%
C 0% 4% 17% 21%
Non-Built up (≥50mph)
M 0% 4% 13% 17%
A 0% 8% 8% 17%
B 0% 0% 0% 0%
C 0% 0% 0% 0%
Total 4% 38% 58% 100%
Table 43: Weighting factors applied to RAIDS ISA MM2/N2/M3/N3 case-by-case sample to make it representative of STATS19 distribution.
Area Road Class
Fatal Serious Slight
Built Up (<50mph) M 0.00 0.00 0.00
A 0.00 0.31 2.85
B 0.14 0.27 0.14
C 0.00 0.14 0.58
Non-Built up (≥50mph)
M 0.00 0.41 0.68
A 0.00 0.75 3.53
B 0.00 0.00 0.00
C 0.00 0.00 0.00
The results were analysed separately for M1, N1 cases and M2, N2, M3, N3 cases.
A key point is that these are cases with speeding of the relevant vehicles, not cases where ISA was actually activated. The investigators were asked to compare how the collision would have differed if the speed vehicle had been fitted with ISA.

Effectiveness Estimates
v3.0 93 PPR844
A.2 ISA results from case-by-case analysis
The distribution of sample against speed limit is shown in Figure 44. Of the M1 and N1 sample (left), the majority of incidents (52%) occurred at 30 mph speed limit. 16% of incidents occurred at 60 mph and 6% occurred at 70 mph speed limit. 4% and 18% of incidents occurred at 50 mph and 40 mph speed limit respectively. Only 4% of incidents occurred in below 30 mph speed limit.
Of the M2, N2, M3 and N3 sample (right), the majority of incidents (40%) occurred at 30 mph speed limit. 15% of incidents occurred at 60 mph and 25% occurred at 70 mph speed limit. 6% and 14% of incidents occurred at 50 mph and 40 mph speed limit respectively. None of incidents occurred in below 30 mph speed limit.
The speed at the time of the collision is taken into account in the coding of confidence of effect of ISA. For example, the collisions at higher speed would be less likely to be avoided, so the confidence of effect at higher speeds would be reduced in the coding. This can be seen in Figure 45 and Figure 46. Therefore there is no need to take account of the speeds as an extra scaling on the effectiveness values generated from the confidence coding; it is already built into the coding.

Effectiveness Estimates
v3.0 94 PPR844
Figure 44: Speed distribution of sample for M1, N1 (top) and M2, N2, M3, and N3 (bottom) vehicles.
M1/N1
M2/N2/M3/N3

Effectiveness Estimates
v3.0 95 PPR844
Figure 45: Confidence of Avoidance and Mitigation at different speeds for M1, N1 vehicles

Effectiveness Estimates
v3.0 96 PPR844
Figure 46: Confidence of Avoidance and Mitigation at different speeds for M2, N2, M3, and N3 vehicles
The distribution of recognisable speed limit signs in sample is shown in Figure 47. Of the sample with M1 and N1 category vehicles (left), 57% of cases had recognisable speed limit signs, 11% of cases did not have any recognisable speed limit signs and for the remaining 32% of cases it was unknown.
Of the sample with M2, N2, M3 and N3 category vehicles (right), 36% of cases had recognisable speed limit signs, 27% of cases did not have any recognisable speed limit signs and for the remaining 36% of cases it was unknown.

Effectiveness Estimates
v3.0 97 PPR844
Figure 47: Distribution of recognisable speed limit signs in the sample of M1, N1 (top) M2, N2, M3, and N3 (bottom) vehicles.
A high percentage of no confidence in avoidance is due to the human factors such as aggressive driving, distraction, etc. as show in Figure 48. This shows that human factors are a limiting factor in the effectiveness of ISA. Of the sample with M1 and N1 category vehicles (left), 7% of the sample had distraction as a contributing factor for the accident. 17% had careless or reckless driving behaviour and 18% of the cases had inexperience as contributing factor. Failed to look contribute to 2% of the factors. The remaining 47% of the cases had other human factors.
Of the sample with M2, N2, M3 and N3 category vehicles (right), 39% of the sample had distraction as a contributing factor for the accident. 1% had careless or reckless driving behaviour and 4% of the cases had inexperience as contributing factor. Failed to look contribute to 5% of the factors. The remaining 51% of the cases had other human factors.
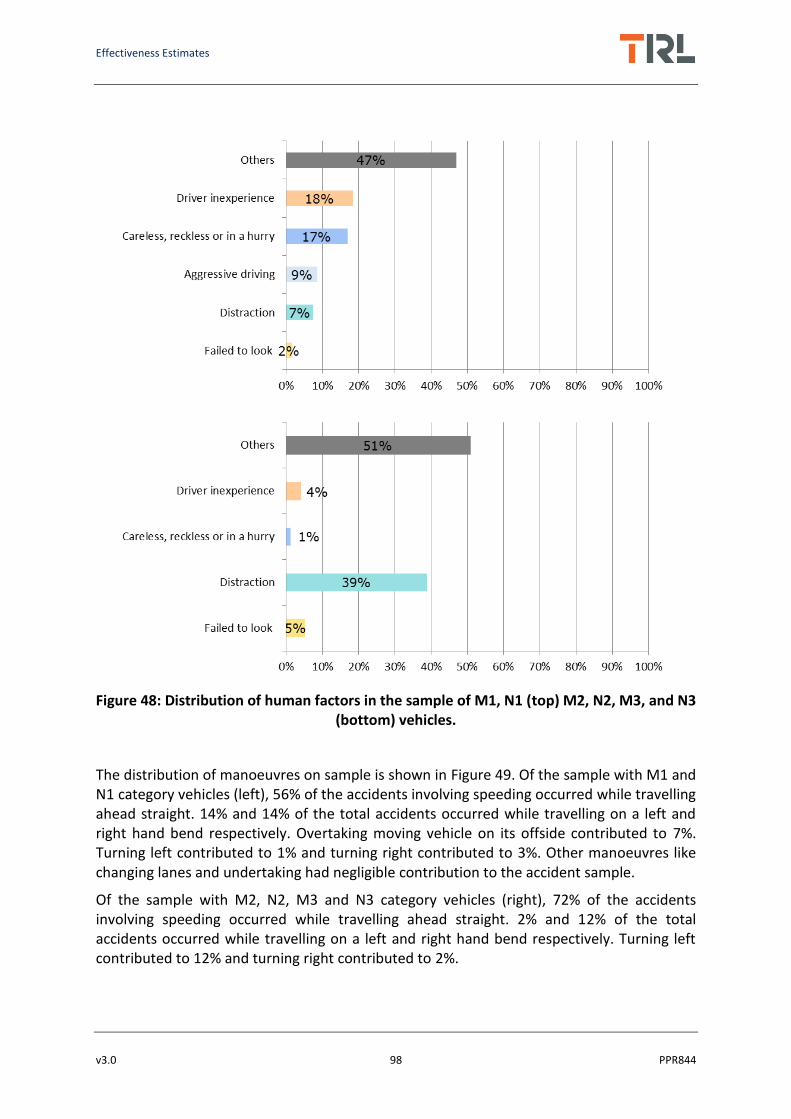
Effectiveness Estimates
v3.0 98 PPR844
Figure 48: Distribution of human factors in the sample of M1, N1 (top) M2, N2, M3, and N3 (bottom) vehicles.
The distribution of manoeuvres on sample is shown in Figure 49. Of the sample with M1 and N1 category vehicles (left), 56% of the accidents involving speeding occurred while travelling ahead straight. 14% and 14% of the total accidents occurred while travelling on a left and right hand bend respectively. Overtaking moving vehicle on its offside contributed to 7%. Turning left contributed to 1% and turning right contributed to 3%. Other manoeuvres like changing lanes and undertaking had negligible contribution to the accident sample.
Of the sample with M2, N2, M3 and N3 category vehicles (right), 72% of the accidents involving speeding occurred while travelling ahead straight. 2% and 12% of the total accidents occurred while travelling on a left and right hand bend respectively. Turning left contributed to 12% and turning right contributed to 2%.

Effectiveness Estimates
v3.0 99 PPR844
Figure 49: Distribution of manoeuvres in the sample of M1, N1 (top) M2, N2, M3, and N3 (bottom) vehicles.
The distribution of deliberate or accidental speeding on sample is shown in Figure 50, as coded by the judgement of the investigator. Of the sample with M1 and N1 category vehicles (left), The majority of incidents (34%) involved deliberate speeding with high confidence and 16% of the incidents involved deliberate speeding with low confidence. 18% and 17% of incidents had unintentional speeding with high and low confidence respectively. The intentions for the remaining 15% of the incidents were unknown.
Of the sample with M2, N2, M3 and N3 category vehicles (right), The majority of incidents (67%) involved unintentional speeding with low confidence and 5% of the incidents involved unintentional speeding with high confidence. 6% and 19% of incidents had deliberate

Effectiveness Estimates
v3.0 100 PPR844
speeding with high and low confidence respectively. The intentions for the remaining 4% of the incidents were unknown.
The investigators have taken the intentional speeding into account within the coding of confidence of the effect of ISA for avoidance/mitigation. Therefore there is no need to take intentional speeding into account by scaling back the effectiveness value; it has already been taken into account.
Figure 50: Distribution of speeding intention on sample M1, N1 (top) M2, N2, M3, and N3 (bottom)
The distribution of confidence in driver complying with ISA on the sample is shown in Figure 51. This was based on a judgement of the investigators considering that if the driver had ISA that they would have stayed at the speed limit and not manually overridden the system. Of the sample with M1 and N1 category vehicles (left), 24% of the incidents had high confidence that the driver would have complied with ISA and 28% of the incidents had low

Effectiveness Estimates
v3.0 101 PPR844
confidence that driver would have complied with ISA. 16% and 13% of the incidents had high and low confidence that the driver would have not complied ISA. Overall, the investigators showed more confidence in driver complying with ISA.
Of the sample with M2, N2, M3 and N3 category vehicles (right), 23% of the incidents had high confidence that the driver would have complied with ISA and 67% of the incidents had low confidence that driver would have complied with ISA. 4% and 4% of the incidents had high and low confidence that the driver would have not complied ISA. Overall, the investigators showed more confidence in driver complying with ISA.
The investigators have taken the confidence of driver compliance with ISA into account within the coding of confidence of the effect of ISA for avoidance/mitigation. Therefore there is no need to take driver compliance with ISA into account by scaling back the effectiveness value; it has already been taken into account.
Figure 51: Distribution of ISA compliance in the sample of M1, N1 (top) M2, N2, M3, and N3 (bottom) vehicles

Effectiveness Estimates
v3.0 102 PPR844
Figure 52 shows the distribution of collision outcome if the vehicle had ISA fitted. Of the sample with M1 and N1 category vehicles (left), ISA had no effect on majority (63%) of the sample cases. The severity of 26% of the cases could have been reduced and 11% of the cases could have been totally avoided with ISA. Of the sample with M2, N2, M3 and N3 category vehicles (right), ISA had no effect on 10% of the sample cases. The severity of 71% of the cases could have been reduced and 19% of the cases could have been totally avoided with ISA.
This collision outcome finding is taken into account within the coding of confidence of effect of ISA, so there is no need to additionally scale the effectiveness values found. For example the 11% prediction of avoided incidents for M1 vehicles
Figure 52: Distribution of collision outcome with ISA for M1, N1 (top) M2, N2, M3, and N3 (bottom) vehicles

Effectiveness Estimates
v3.0 103 PPR844
Appendix B Improved front end design (VIS)
No literature is available on the effectiveness of VIS so TRL undertook novel research to assess the expected effectiveness estimates of the measure on relevant collisions. The following analysis details how the effectiveness estimates for VIS was determined using case-by-case analysis of in-depth collision cases.
B.1 Sample Details & Weighting
Figure 53 presents the number of cases considered for vision measures (VIS) for N2 and N3 vehicle categories. Of the sample considered, 46% of cases involved in N2 category vehicles and 54% of cases involved in N3 category vehicles.
Figure 53: Vehicle classification of sample
A total of 26 cases were considered for the VIS study under various vision measures, which are also described fully in Figure 13:
Best in class direct visibility cab
High direct visibility cab
Forward and side VRU detection
Forward and side VRU detection with AEB

Effectiveness Estimates
v3.0 104 PPR844
The sample available from the in-depth cases in RAIDS was not representative of STATS19, therefore a weighting was applied to make it more representative. The injury severity, road class, and whether the area was built up or not built up were the factors used in the weighting. Table 44 describes the VIS sample, and Table 45 then describes the weighting factors used to make the sample representative of STATS19.
Table 44: Description of VIS case-by-case sample distribution by injury severity, road class and whether the collision was in a built up area.
Area Road Class
Fatal Serious Slight Total
Built Up (<50mph)
M 0% 0% 0% 0%
A 4% 23% 8% 35%
B 0% 8% 0% 8%
C 4% 12% 8% 23%
Non-Built up (≥50mph)
M 4% 4% 0% 8%
A 15% 4% 0% 19%
B 4% 4% 0% 8%
C 0% 0% 0% 0%
Total 31% 54% 15% 100%
Table 45: Weighting factors applied to RAIDS case-by-case sample to make it representative of STATS19 distribution.
Area Road Class
Fatal Serious Slight
Built Up (<50mph)
M 0.00 0.00 0.00
A 1.26 0.54 3.84
B 0.00 0.35 0.00
C 0.42 0.59 2.70
Non-Built up (≥50mph)
M 0.19 0.09 0.00
A 0.14 0.95 0.00
B 0.03 0.07 0.00
C 0.00 0.00 0.00

Effectiveness Estimates
v3.0 105 PPR844
Figure 54 shows the frequency distribution of HGV body types over the sample. Of the sample, majority (43%) of the cases had box type, 26% had curtain sided, 14% had skip carrier, 10% had flat or drop sided, 5% had container type and the remaining 3% had tipper body type.
Figure 54: VIS sample distribution by HGV body type
Figure 55 shows the distribution of sample based on HGV chassis type. Of the sample, 61% of the cases involved Rigid type HGV and 39% of the cases involved Articulated HGV.
Figure 55: VIS sample distribution by HGV type

Effectiveness Estimates
v3.0 106 PPR844
Figure 56 shows the distribution of sample based on Vulnerable Road User (VRU) types. Of the sample, majority (57%) of the cases involved Cyclists and 43% had Pedestrians.
Figure 56: VIS sample distribution by VRU type
B.2 VIS results from case-by-case analysis
Figure 57 shows the frequency distribution of various direct visibility factors on the sample.
Of the sample, majority (52%) of the cases were coded as clear direct visibility, so for these cases they would have no or low confidence of the effect of the VIS measure. 40% of the cases had obstruction due to vehicle geometry and the remaining 8% had problems due to other reasons; these are the cases that would be coded with greater confidence of effect of the VIS measure, if relevant. These factors are taken into account with the coding of the confidence of effect, so they do not need to be used to apply a further scaling to the effectiveness values. Figure 58 and Figure 59 proves that in case of clear and visible direct visibility, the confidence of avoidance and mitigation relates to none/ low in effect.

Effectiveness Estimates
v3.0 107 PPR844
Figure 57: VIS sample distribution by visibility circumstances
Figure 58: Confidence of Best in class Direct Visibility Cab counter measure on vehicle direct visibility

Effectiveness Estimates
v3.0 108 PPR844
Figure 59: Confidence of High Direct Visibility Cab counter measure on vehicle direct visibility
Figure 60 shows the distribution of collision configuration on sample. Of the sample,
majority (41%) of the cases had crossing collision configuration, 25% had Same-front
configuration, 23% had Same-nearside configuration and the remaining 11% had other
collision configurations.

Effectiveness Estimates
v3.0 109 PPR844
Figure 60: VIS sample distribution by collision configuration
Figure 61 shows the distribution of sample based on intended vehicle manoeuvre. Of the sample, majority (78%) of the cases had Going ahead other, 20% of cases had Turning left, 2% of the cases had overtaking moving vehicles on its offside and the remaining 1% had Moving off as manoeuvres. These manoeuvres match those used in Phase 1 / RQ1.
Figure 61: VIS sample distribution by manoeuvre (as in STATS19)
Figure 62 shows the distribution of sample based on the impact speed. Of the sample, 47% of the cases had very low (0-6mph or 0-9km/h) impact speed, 28% had low impact speed (7-18mph or 10-29km/h), 17% had medium impact speed (19-30mph or 30-49km/h), 3% had

Effectiveness Estimates
v3.0 110 PPR844
very high (43+mph or 70+km/h) impact speed and none of them had high impact speed (31-43mph or 50-69km/h). As previously described in Phase 1 / RQ1 we might ideally want to limit to speeds under 20mph. However since the STATS19 does not provide impact speed, only the road speed limit, there is no accurate way to limit the TP to under 20mph. Therefore the effectiveness value is kept as all speeds in order to match how the TP is defined.
Figure 62: VIS sample distribution by impact speed
Figure 63 shows the distribution of sample based on driver’s vision direction. Of the sample, 39% of the incidents had high confidence that driver was looking in correct direction and 46% of the incidents had low confidence that driver was looking in correct direction. 2% and 12% of the incidents had high and low confidence respectively that the driver was not looking in correct direction. The cases with low or no confidence of the driver looking in the correct direct would be coded as low or no confidence of effect of the direct vision measures as shown in Figure 64. The driver looking factor is taken into account with the coding of the confidence of effect, so it does not need to be used to apply a further scaling to the effectiveness values.

Effectiveness Estimates
v3.0 111 PPR844
Figure 63: VIS sample distribution by confidence of driver looking the correct direction
Figure 64: Confidence of Best in class Direct Visibility Cab counter measure on Drivers vision direction
The distribution of confidence in driver complying with all VIS countermeasures on the sample is shown in Figure 65. Of the sample, 19% of the incidents had high confidence that the driver would have complied with VIS and 68% of the incidents had low confidence that

Effectiveness Estimates
v3.0 112 PPR844
driver would have complied with VIS. 8% and 5% of the incidents had high and low confidence that the driver would have not complied VIS. Overall, the investigators showed more confidence in driver complying with VIS. The cases with low or no confidence of the driver compliance with the measure would be coded as low or no confidence of effect of the direct vision measures as shown in Figure 66. The driver compliance factor is taken into account with the coding of the confidence of effect, so it does not need to be used to apply a further scaling to the effectiveness values.
Figure 65: Distribution of VIS compliance on sample

Effectiveness Estimates
v3.0 113 PPR844
Figure 66: Confidence of Best in class Direct Visibility Cab counter measure on Drivers compliance
Figure 67 shows the distribution of sample based on injury mechanism. Of the sample, 48% of the cases had impact with ground, 20% had impact with vehicle, 12% had injury due to run over and the injury mechanism for the remaining 21% was unknown.
Figure 67: VIS sample distribution by main injury mechanism

Effectiveness estimates for proposed amendments to the EU's General and Pedestrian Safety Regulations
Other titles from this subject area
RPN3851 Estimating the casualty benefits associated with proposed amendments to the EU's General and Pedestrian Vehicle Safety Regulations. R Cuerden et al. 2017
TRL
Crowthorne House, Nine Mile Ride, Wokingham, Berkshire, RG40 3GA, United Kingdom T: +44 (0) 1344 773131 F: +44 (0) 1344 770356 E: [email protected] W: www.trl.co.uk
ISSN
ISBN 978-1-912433-06-3
PPR844