published project report ppr784 - highways …assets.highways.gov.uk/specialist-information/... ·...
TRANSCRIPT
PUBLISHED PROJECT REPORT PPR784
Surface treatment options for concrete roads Ultra-thin surfacing systems
P D Sanders and P Morgan
Published PPR784
Report details
Report prepared for: Highways England, Pavements
Project/customer reference: 317/4/45/12 - HALC
Copyright: © Transport Research Laboratory
Report date: 2016
Report status/version: Published
Quality approval:
Peter Sanders
(Project Manager)
Approved Helen Viner
(Technical Reviewer)
Approved
Disclaimer
This report has been produced by the Transport Research Laboratory under a contract with Highways England. Any views expressed in this report are not necessarily those of Highways England.
The information contained herein is the property of TRL Limited and does not necessarily reflect the views or policies of the customer for whom this report was prepared. Whilst every effort has been made to ensure that the matter presented in this report is relevant, accurate and up-to-date, TRL Limited cannot accept any liability for any error or omission, or reliance on part or all of the content in another context.
When purchased in hard copy, this publication is printed on paper that is FSC (Forest Stewardship Council) and TCF (Totally Chlorine Free) registered.
Published 1 PPR784
Table of Contents
Executive summary 3
1 Introduction and background 5
2 Review of standards for ultra-thin surfacing systems 6
2.1 The Design Manual for Roads and Bridges 6
2.1.1 Material descriptions 6
2.1.2 Material performance 7
2.1.3 Material use 9
2.2 Highway Authorities Product Approval Scheme Certificates 10
3 Service lives achieved 11
3.1 Method for calculating service life 11
3.1.1 Identification of relevant materials 11
3.1.2 Calculation of surface ages 13
3.1.3 Calculation of service life 13
3.1.4 Data validity 13
3.2 Results 15
3.3 Comparison with HD32/16 16
4 Measurements of in-service performance 17
4.1 Equipment used 17
4.1.1 Skid resistance development platform 17
4.1.2 Pavement friction tester 18
4.1.3 Highways Agency road research information system 19
4.1.4 Close proximity noise measurements 20
4.1.5 Statistical pass by noise measurement 21
4.2 Sites selected 22
4.3 Measurements made 24
4.3.1 Low speed skid resistance 24
4.3.2 High speed friction 24
4.3.3 Texture 24
4.3.4 Surface loss and cracking 25
4.3.5 Noise 26
Published 2 PPR784
4.4 Results 27
4.4.1 Low speed skid resistance 27
4.4.2 High speed friction 28
4.4.3 Texture 30
4.4.4 Visual condition 32
4.4.5 Noise 33
5 Conclusions 35
6 Bibliography 36

Published 3 PPR784
Executive summary
Approximately 3.5% of the Highways England (HE) network has a concrete surface construction; many of these roads have been in service for over 30 years. After an extended period of use, the surface laitance applied to concrete carriageways can be removed through the abrasive action of trafficking and weathering. Removal of surface laitance can lead to reductions in texture and skid resistance, a combination that has been shown to have a negative effect on road user safety.
To mitigate the risk to road users, a number of actions can be taken to improve the surface characteristics of concrete carriageways. These actions can be separated into two main categories; bituminous overlay and re-texturing. TRL were commissioned to carry out a review of the ultra-thin surface course systems available to road owners and provide information on the properties of each.
For this work an ultra-thin surface course system is defined as a bituminous material that is laid with a thickness of 20 mm or less. The key systems identified are:
Thin surface course systems (TSCS)
Cold applied ultra-thin surfacings (CAUTS)
Surface dressings
Slurry seals
In order to assess the expected service lives of ultra-thin surfacing materials, an assessment of the Highways Agency Pavement Management System (HAPMS) was carried out. For the purposes of this analysis, HAPMS was used to calculate the service life of various materials currently on the HE network.
To characterise the typical performance of materials currently used, measurements of high speed friction, low speed skid resistance, texture, noise and surface condition were made on carriageways treated with ultra-thin surface course systems.
Currently thin surface course systems are the only materials permitted for unrestricted use on the English strategic road network. A range of alternatives are possible and have been investigated as part of this work. From the work presented in this report the following conclusions can be made:
Typical service lives of surface dressing materials laid onto concrete pavements were
identified between 6 and 30 years.
Typical service lives of ultra-thin thin surface course systems laid onto concrete
pavements were identified between 3 and 8 years.
The relationship between texture depth and high speed friction for ultra-thin
surfacing materials fitted that observed in historical measurements. Surfaces with
category 3 and 4 texture depth measurements can therefore be expected to provide
undesirable high speed friction properties.
Measurements of high speed friction and texture on TSCS laid on concrete were
substantially lower than those measured on those laid on asphalt materials.
Published 4 PPR784
Noise measurements made suggest that the performance of TSCS materials laid onto
concrete is variable but have the capability of producing quiet surfaces.
The high speed friction, low speed skid resistance and texture depth performance of
concrete surfaces treated with surface dressing was on the whole within acceptable
limits.
Poor high speed friction and texture values were observed on concrete surfaces
treated with thin surfacing, but low speed skid resistance measurements on these
materials were within acceptable limits.
The noise performance of surface dressings is on the whole fairly consistent, and are
likely to produce values of approximately -0.5 RSI, allowing their use in areas where
noise emissions are not a priority.
Owing to the availability of materials on the strategic road network, conclusions
pertaining to two of the key systems, CAUTS and Slurry seals, could not be made.
The installation and monitoring of these materials as part of an on-road trial would
provide valuable information for the assessment of these options.

Published 5 PPR784
1 Introduction and background
Approximately 3.5% of the Highways England network has a concrete surface. Many of these concrete pavements have been in service for over 30 years and are suffering from a loss of surface texture which, combined with the polishing of the aggregates in the concrete, can lead to running surfaces with low friction characteristics. A popular treatment is to crack, seat and then thickly overlay with bituminous materials. This is an expensive process and where the concrete pavement is structurally sound may not represent best value for money.
The work detailed in this report continues from work carried out in 2014 reported in TRL 677 (Sanders & Brittain, 2014). That work assessed the effectiveness of a number of mechanical re-texturing techniques to restore the friction properties of concrete roads. This work focusses on the effectiveness of ultra-thin surface course systems as a means to the same end.
For the purposes of this report an ultra-thin surface course system is defined as a bituminous material that is laid with a thickness of 20 mm or less. The key systems (discussed in more detail in Chapter 2) assessed are:
Thin surface course systems (TSCS)
Cold applied ultra-thin surfacings (CAUTS)
Surface dressings
Slurry seals
The following chapters identify and assess available materials and seek to use empirical evidence to assess the applicability of these materials on concrete roads. The materials were assessed through the calculation of service lives of existing materials and through a detailed assessment of the performance of on-road sites. The calculation of service lives gave a broad view of the durability of the materials on a concrete substrate. The assessment of sites provided supporting information that gave a more detailed assessment of current material performance.
Chapter 2 summarises the current standards for ultra-thin surface course systems and the relevant standards which summarise the current material options and the standards for their use. In Chapter 3, historical records are used to assess the service lives provided by ultra-thin surface course systems used on the Highways England network. This enables the service life of the materials assessed to be determined. The service lives are then compared to those given in relevant standards.
Chapter 4 presents and discusses measurements of high speed friction, low speed skid resistance, texture, noise and surface condition made on in-service carriageways treated with ultra-thin surface course systems. The main aim of these measurements was to characterise the performance of materials currently in-service and to compare these measurements with current standards. A secondary aim was to provide an indication as to the potential failure mechanisms of ultra-thin surface course systems.
The key findings of the research are summarised in Chapter 5.

Published 6 PPR784
2 Review of standards for ultra-thin surfacing systems
2.1 The Design Manual for Roads and Bridges
The Design Manual for Roads and Bridges (DMRB) contains requirements and advice relating to works carried out on UK motorways and all purpose trunk roads. This section collates information from the following DMRB documents:
HD32/16 (Highways England, Transport Scotland, Welsh Government, The Department for Regional Development Northern Ireland, 2016) outlines the available options for the use of products and techniques for the maintenance of concrete roads.
HD36/06 (The Highways Agency, Transport Scotland, Welsh Government, The Department for Regional Development Northern Ireland, 2006) summarises the surfacing options available for road pavements.
HD37/99 (The Highways Agency, Transport Scotland, Welsh Government, The Department for Regional Development Northern Ireland, 1999) gives advice as to the suitability, specification, laying and testing of bituminous surface courses.
2.1.1 Material descriptions
Thin surfacings
Thin surfacings, or thin surface course systems (TSCS) are proprietary hot applied materials consisting of a bitumen binder and aggregate mixture. The mixture is applied to a bond or tack coat to the pavement surface using a screed paver. Surfaces of this type are applicable to concrete surfacings but in such cases care should be taken to choose a suitable bond coat. Thin surfacing materials are typically comprised of aggregate particles between 6 and 20 mm mixed into a bitumen binder at temperatures above 120 degrees Celsius.
Cold applied ultra-thin surfacing
Cold Applied Ultra-Thin Surfacing (CAUTS) systems have the same composition as thin surfacing materials but are mixed at temperatures below 100 degrees Celsius and can be laid to a minimum thickness of approximately 12 mm.
Surface dressing
Surface dressings are thinly laid comprised of a binder matrix and aggregate chippings. Many methods of construction exist for surface dressings, the basic premise is that the binder material is thinly spread onto the underlying surface and the aggregate chippings are spread and pressed into it.
Surface dressings require a period of controlled low speed trafficking to settle the surface prior to a sweeping operation that removes any loose chippings. Low speed trafficking can be particularly challenging on high speed roads where the traffic flows and speeds are such that low speed trafficking could pose a safety risk.

Published 7 PPR784
Slurry surfacing
Slurry surfacings are cold applied thin surface course systems consisting of fine graded aggregates and filler materials in a bitumen emulsion. The use of these materials are subject to the performance of the technique being verified as part of a type approval installation trial. Slurry surfacings can range in thickness from approximately 2 to 8 mm.
2.1.2 Material performance
Table 3.3 of HD32/16 presents the following information about the performance and expected issues and benefits of each of the above systems.
Table 2-1 – Bituminous surface treatment options (HD32/16)
Surface treatment
Range of expected service life (years)
Installation issues Road surface benefits and issues
Departure from standards required for treatment
Thin surfacing overlay
8-12 Usually requires raising of vehicle restraint systems.
A low noise surface produced. Tendency for fretting to occur at joints which quickly reflect through.
No
CAUTS Insufficient experience in
the UK
Limited seasonal and weather conditions for application
A lower noise surface produced.
Yes
Surface dressing 10-15 Limited seasonal and weather conditions for application
Can produce a very noisy surface. Aggregate eventually wears off to leave bituminous film on road surface
Yes
Slurry surfacing 8-12 Should not be used in very cold weather
Can plate off and can regulate surface profile
Yes
The following tables, from HD37/99, contain information regarding the benefits and limitations regarding the use of the different treatment options.
Published 8 PPR784
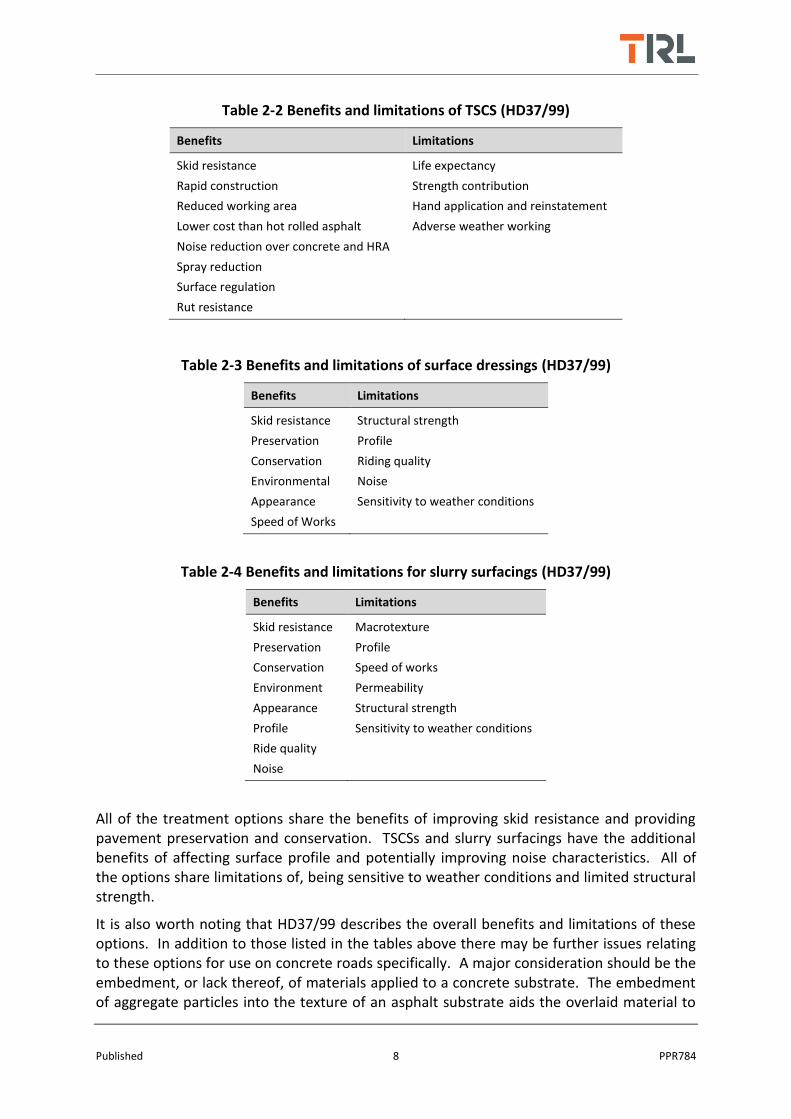
Table 2-2 Benefits and limitations of TSCS (HD37/99)
Benefits Limitations
Skid resistance
Rapid construction
Reduced working area
Lower cost than hot rolled asphalt
Noise reduction over concrete and HRA
Spray reduction
Surface regulation
Rut resistance
Life expectancy
Strength contribution
Hand application and reinstatement
Adverse weather working
Table 2-3 Benefits and limitations of surface dressings (HD37/99)
Benefits Limitations
Skid resistance
Preservation
Conservation
Environmental
Appearance
Speed of Works
Structural strength
Profile
Riding quality
Noise
Sensitivity to weather conditions
Table 2-4 Benefits and limitations for slurry surfacings (HD37/99)
Benefits Limitations
Skid resistance
Preservation
Conservation
Environment
Appearance
Profile
Ride quality
Noise
Macrotexture
Profile
Speed of works
Permeability
Structural strength
Sensitivity to weather conditions
All of the treatment options share the benefits of improving skid resistance and providing pavement preservation and conservation. TSCSs and slurry surfacings have the additional benefits of affecting surface profile and potentially improving noise characteristics. All of the options share limitations of, being sensitive to weather conditions and limited structural strength.
It is also worth noting that HD37/99 describes the overall benefits and limitations of these options. In addition to those listed in the tables above there may be further issues relating to these options for use on concrete roads specifically. A major consideration should be the embedment, or lack thereof, of materials applied to a concrete substrate. The embedment of aggregate particles into the texture of an asphalt substrate aids the overlaid material to
Published 9 PPR784
obtain adhesion to the underlying surface. The following extract is from the Road Surface Treatment Organisation guidelines for best practice on the application of surface dressing materials (RSTA, 2014).
“Although there will be no embedment of chippings when concrete roads are dressed, dressing of concrete roads should be undertaken during ideal weather conditions using a polymer modified binder. An inverted double dressing (pad-coat) should be used under these circumstances.” (RSTA, 2014)
Although specifically referencing surface dressings, the issue of particle embedment on concrete roads could also be prevalent for the other treatment options.
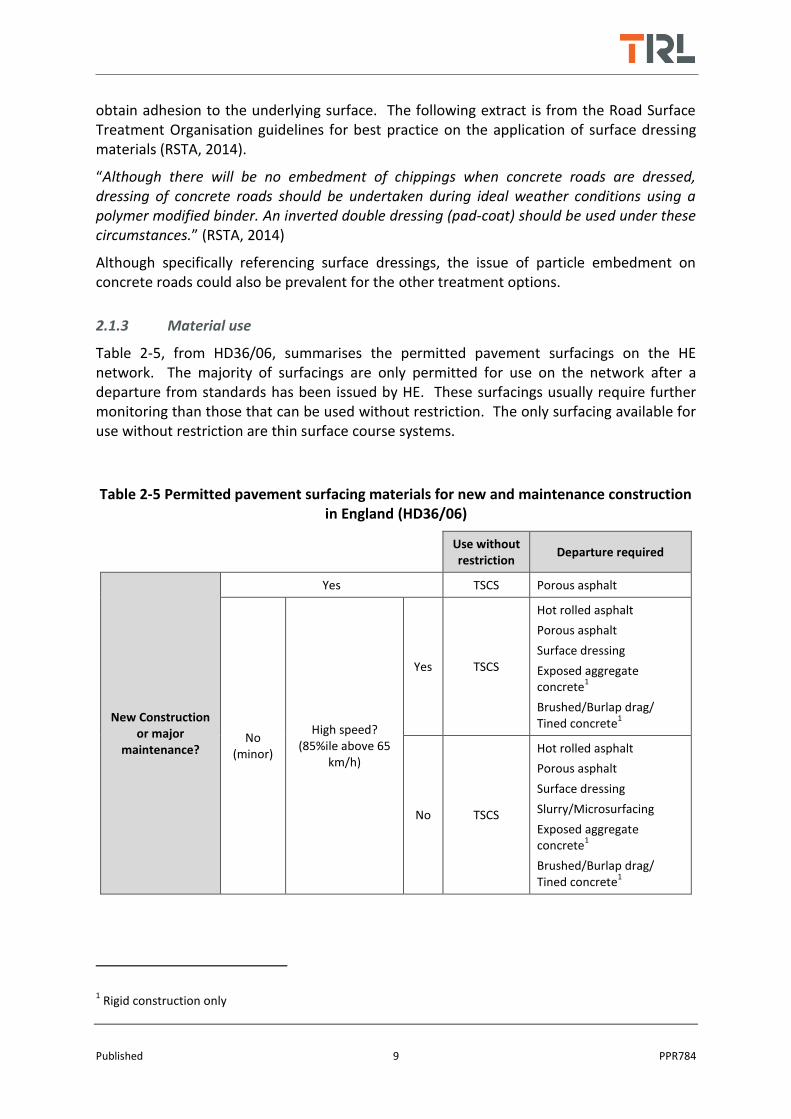
2.1.3 Material use
Table 2-5, from HD36/06, summarises the permitted pavement surfacings on the HE network. The majority of surfacings are only permitted for use on the network after a departure from standards has been issued by HE. These surfacings usually require further monitoring than those that can be used without restriction. The only surfacing available for use without restriction are thin surface course systems.
Table 2-5 Permitted pavement surfacing materials for new and maintenance construction in England (HD36/06)
Use without restriction
Departure required
New Construction or major
maintenance?
Yes TSCS Porous asphalt
No (minor)
High speed? (85%ile above 65
km/h)
Yes TSCS
Hot rolled asphalt
Porous asphalt
Surface dressing
Exposed aggregate concrete
1
Brushed/Burlap drag/ Tined concrete
1
No TSCS
Hot rolled asphalt
Porous asphalt
Surface dressing
Slurry/Microsurfacing
Exposed aggregate concrete
1
Brushed/Burlap drag/ Tined concrete
1
1 Rigid construction only

Published 10 PPR784
2.2 Highway Authorities Product Approval Scheme Certificates
The Highway Authorities Product Approval Scheme (HAPAS) is a certification scheme established to provide information on the performance of various products. HAPAS certificates are issued in cases where products have demonstrated an acceptable performance for various parameters such as noise, texture, skid resistance and durability.
For the purposes of this work, bituminous materials with HAPAS certification listed as suitable for application on concrete with a minimum thickness of 20 mm or less were identified. Table 2-6 quotes the material properties stated in the HAPAS certificates for the materials identified for use on concrete pavements.
Table 2-6 Summary of suitable materials for use on concrete
Supplier Product Surfacing type
HAPAS Cert. No.
Application thickness
(mm)
Retained macrotexture
(mm)
Suitable for use on high speed roads (>50 mph)
Aggregate Industries UK
Safedress 6 mm
TSCS 01/H048 15 - 30 >0.9 Yes
Colas Ralumac RMT
TSCS 12/H181 18 >0.9 Yes
Jean Lefebvre UK
UL-M 6 mm TSCS 01/H047 15 - 25 >0.9 Yes
Further materials were also identified as being suitable for use on asphalt roads but not certified for application to concrete. These materials are potentially useful and are listed in Table 2-7. References for all HAPAS certificates are given in the bibliography.
Table 2-7 Summary of potentially suitable materials
Supplier Product Surfacing type
HAPAS Cert. No.
Application thickness
(mm)
Retained macrotexture
(mm)
Suitable for use on high speed roads (>50 mph)
F P McCann McCannphalt 10 mm
TSCS 05/H107 18 - 40 1.4 Yes
RMS Finagrip / Finatex / Surphalt
CAUTS 09/H148 <20 mm Not stated Yes
JPCS Rejuvopatch Slurry seal 14/H221 <20 mm >0.5 Not stated
JPCS Slurry surfacing
Slurry seal 14/H222 6 - 15 >0.5 No
ASI Solutions Rinophalt Surface dressing
07/H125 Not stated Not stated Not stated
Published 11 PPR784
3 Service lives achieved
In order to assess the service lives of ultra-thin surfacing materials an assessment of the data held within the Highways Agency Pavement Management System (HAPMS) was carried out. HAPMS contains information pertaining to the pavement construction of the HE network.
Salient information in HAPMS is gathered by TRL monthly and stored as a record of the network performance for that month. These records are stored on a database called HDesktop. HDesktop is used to calculate the network pavement condition performance, a set of criteria used by HE to assess the performance of the network year on year (Peeling, 2014).
For the purposes of this study, HDesktop was used to calculate the service life of various materials currently on the HE network because historical information could be easily gathered in a format more conducive to this work than that provided by HAPMS.
3.1 Method for calculating service life
The following summarises the procedure used to calculate the service life of relevant materials:
Identify relevant materials and their associated records
Calculate the age of the materials relating to each record
Identify the point at which a record changed, indicating the time at which the surface was changed.
Identify the age of the materials corresponding to the time at which the record was changed, the service life.
This procedure is described in more detail in the following sections.
3.1.1 Identification of relevant materials
In order to identify relevant materials for analysis a query was run on the following tables from the HDesktop database:
tblConstruction – Contains information pertaining to the construction of each layer of the pavement.
tblMaterialCodes – A lookup table providing numerical material codes with a text description.
tblSurfaceCons - Contains information pertaining to the construction of the surface layer of the pavement only.
The section_label and xsp_code fields were used to join tblConstruction and tblSurfaceCons to ensure that the same sections would be returned from both tables. The tblMaterialCodes table was joined to the other tables using the “material” field.
The combination of these tables enabled the fields detailed in Table 3-1 to be used in further analysis.

Published 12 PPR784
Table 3-1 Database query fields
Field From table(s) Returned information
section_label tblSurfaceCons and tblConstruction (Joined)
The section identifier used to identify a section of road.
xsp_code tblSurfaceCons and tblConstruction (joined)
A code describing the lane of the road that the record refers to.
date_laid tblSurfaceCons The date that the surface material was laid.
hdesktop_import_date tblSurfaceCons The date that the record was entered into HDesktop.
start_chainage tblSurfaceCons and tblConstruction (joined)
The start chainage of the record, relative to the beginning of the road section.
end_chainage tblSurfaceCons and tblConstruction (joined)
The end chainage of the record, relative to the beginning of the road section.
thickness tblSurfaceCons The thickness of the surface material.
layer_sequence tblSurfaceCons The total number of material layers in the road.
tblConstruction The layer sequence number of the material relating to the record. The layer sequence number starts at the lowest layer in the road, the layer sequence number relating to the surface is therefore the total number of material layers in the road.
material tblSurfaceCons and tblMaterialCodes (joined)
tblConstruction and tblMaterialCodes (joined)
A code describing the surface material.
material_name tblMaterialCodes The name of the surface material.
Table 3-2 presents the parameters used to query the HDesktop database to identify relevant materials. These criteria were used to identify materials that fall within the definition of an ultra-thin surface course. Information between 2004 and 2015 was queried to allow a substantial amount of information to be gathered.
Table 3-2 Database query criteria
Field From table Criterion/Criteria Results returned
xsp_code tblSurfaceCons = CL1L Lane 1 only.
layer_sequence tblSurfaceCons > 1 Roads with more than one construction layer.
material tblSurfaceCons = 890 or 888 or 106 or 105 or 887 or 885 or 886 or 5166
Bituminous materials only.
thickness tblSurfaceCons ≤ 20 mm Surface material ≤ 20 mm in thickness.
layer_sequence tblConstruction = (layer_sequence from tblSurfaceCons) - 1
Material under the surface is concrete only.
material tblConstruction = 883 or 882

Published 13 PPR784
3.1.2 Calculation of surface ages
From the records returned by the criteria given in Table 3-2, Equation 3-1 was used to estimate the ages of the surfacings.
surface_age = date_laid – most recent hdesktop_import_date
Equation 3-1 Estimation of surface age
3.1.3 Calculation of service life
The age of the surfacing at the most recent record entry is not however representative of the service life as newly laid materials would be included, skewing the results.
To account for this, sections were only included in the analysis if the surface layer had been changed (i.e. the date laid of that section had been updated) within the 10 year period assessed. The age of the surface at the time that the date laid was updated represents the service life of the pavement.
Table 3-3 presents a summary of the cumulative lengths of materials identified. Stone mastic asphalt materials have been included in the analysis because, although not identified at the start of this work as a key system, these materials are similar to TSCSs and so may offer an extra alternative.
Table 3-3 Summary of identified material types
Material Cumulative length (km)
Thin Surface Course Systems 288.390
Stone Mastic Asphalt 14.235
Surface Dressing 722.826
Slurry Seal 0.214
3.1.4 Data validity
The validity of the data gathered was assessed by identifying and removing records where the date laid of the surface was obviously erroneous or incorrect. In addition the total length of each material type used in the analysis was compared to the total length of each material type.
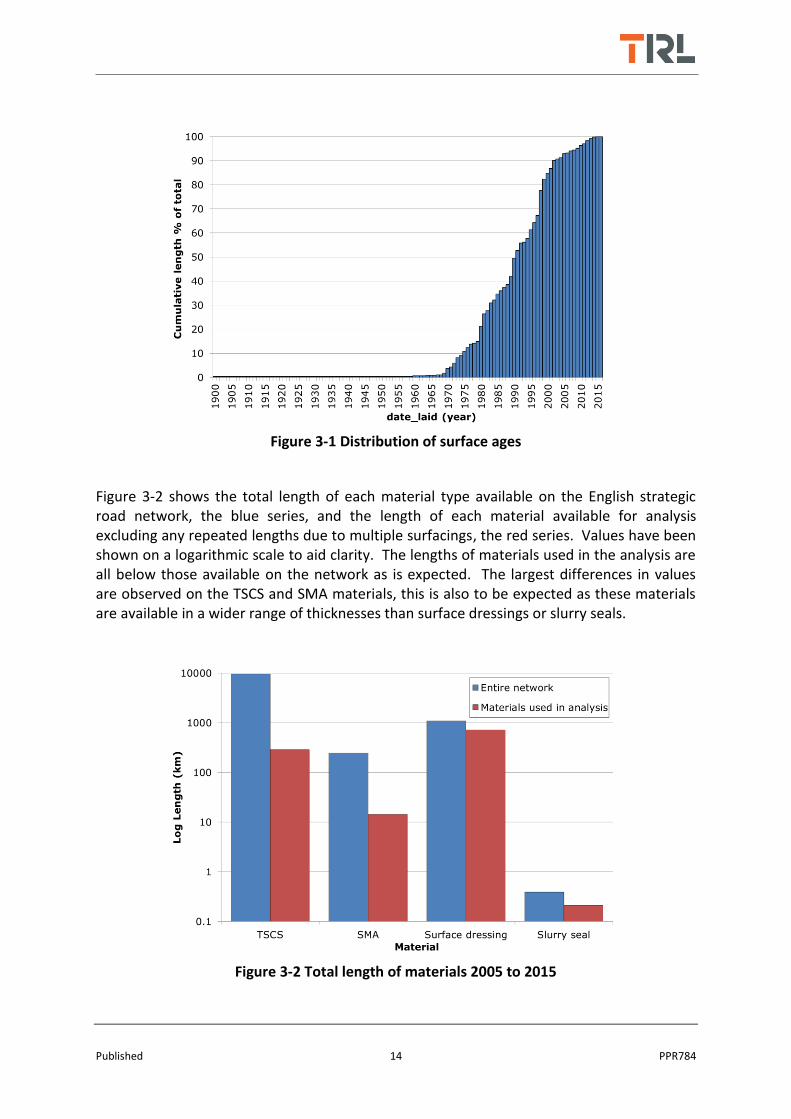
Figure 3-1 represents the first stage of the validation process and shows the total length of materials identified between 1900 and 2016. This figure shows that the majority of surfaces were laid between 1970 and 2015, no surfaces were laid in the future and a small number were recorded as being laid in or before 1900. It is extremely unlikely that the records showing surfaces being laid in 1900 are accurate, especially given that no surfaces laid between 1900 and 1960 were recorded. Surfaces recorded as being laid in 1900 were therefore removed from the analysis.
Published 14 PPR784
Figure 3-1 Distribution of surface ages
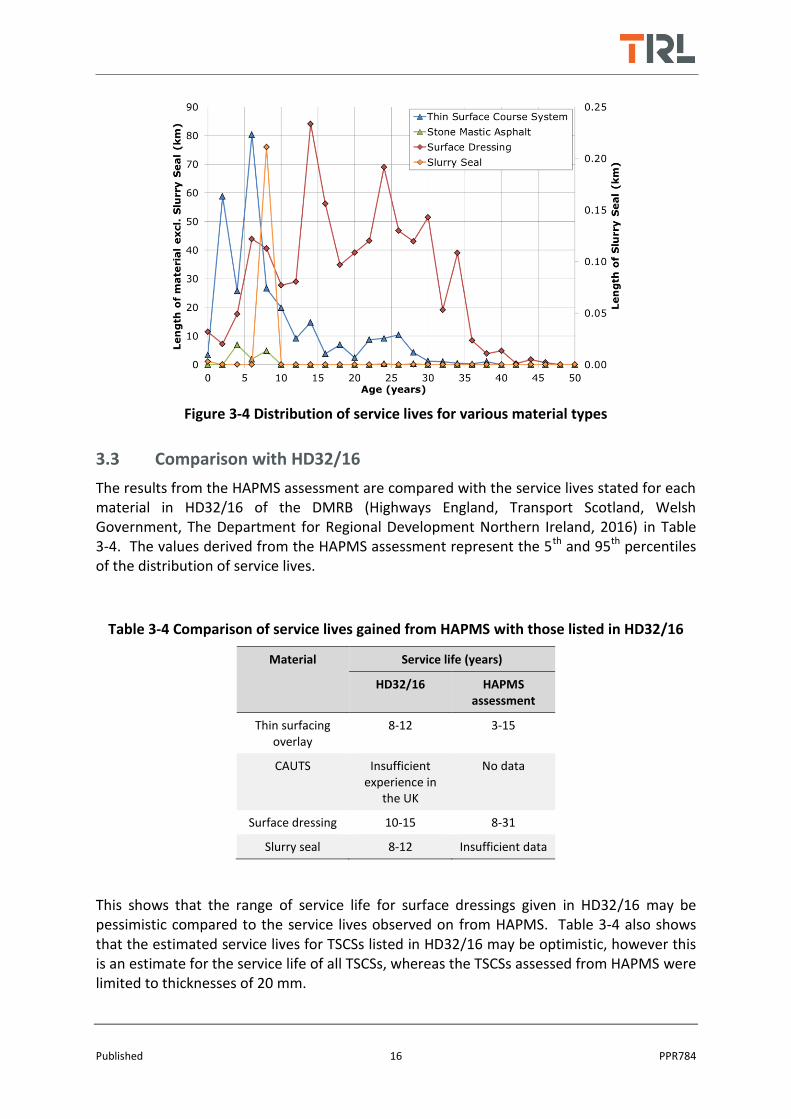
Figure 3-2 shows the total length of each material type available on the English strategic road network, the blue series, and the length of each material available for analysis excluding any repeated lengths due to multiple surfacings, the red series. Values have been shown on a logarithmic scale to aid clarity. The lengths of materials used in the analysis are all below those available on the network as is expected. The largest differences in values are observed on the TSCS and SMA materials, this is also to be expected as these materials are available in a wider range of thicknesses than surface dressings or slurry seals.
Figure 3-2 Total length of materials 2005 to 2015

Published 15 PPR784
3.2 Results
The distribution of the service lives of all materials is shown in Figure 3-3. The distribution does not follow the form of a standard bell curve and is skewed to the right. A peak in service life around 6 years can be observed but the remainder of the distribution remains relatively flat between 3 and 31 years.
Figure 3-3 Distribution of service lives for all materials
To assess the relative performance of the various surfacing types, the distribution shown in Figure 3-3 was separated into individual surface types, Figure 3-4. Here it can be seen that the performance of surface dressings differs markedly from that of the other materials. The distribution of service lives of surface dressings is flat between 8 and 31 years. In contrast the other materials show service lives that are more concentrated. The TSCSs show the majority of service lives between 3 and 15 years. Some TSCSs were observed with service lives up to 26 years, but these were very few. The Stone Mastic Asphalts (SMAs) are showing a double peak at around 4 and 8 years.
The information pertaining to slurry seals was limited to 214 m, and the majority of this was collected from a single site. The limited amount of information available could therefore be a main contributor to the large peak in service life, around 8 months shown for slurry seals. Due to the lack of information it is unlikely that this is indicative of the overall performance of this surfacing type.
Published 16 PPR784
Figure 3-4 Distribution of service lives for various material types
3.3 Comparison with HD32/16
The results from the HAPMS assessment are compared with the service lives stated for each material in HD32/16 of the DMRB (Highways England, Transport Scotland, Welsh Government, The Department for Regional Development Northern Ireland, 2016) in Table 3-4. The values derived from the HAPMS assessment represent the 5th and 95th percentiles of the distribution of service lives.
Table 3-4 Comparison of service lives gained from HAPMS with those listed in HD32/16
Material Service life (years)
HD32/16 HAPMS assessment
Thin surfacing overlay
8-12 3-15
CAUTS Insufficient experience in
the UK
No data
Surface dressing 10-15 8-31
Slurry seal 8-12 Insufficient data
This shows that the range of service life for surface dressings given in HD32/16 may be pessimistic compared to the service lives observed on from HAPMS. Table 3-4 also shows that the estimated service lives for TSCSs listed in HD32/16 may be optimistic, however this is an estimate for the service life of all TSCSs, whereas the TSCSs assessed from HAPMS were limited to thicknesses of 20 mm.
Published 17 PPR784
4 Measurements of in-service performance
To characterise the typical performance of materials currently used, measurements of low speed skid resistance, high speed friction, texture, noise and surface condition were made on carriageways treated with ultra-thin surface course systems. This chapter details the measurements made, test sites and test results.
4.1 Equipment used
4.1.1 Skid resistance development platform
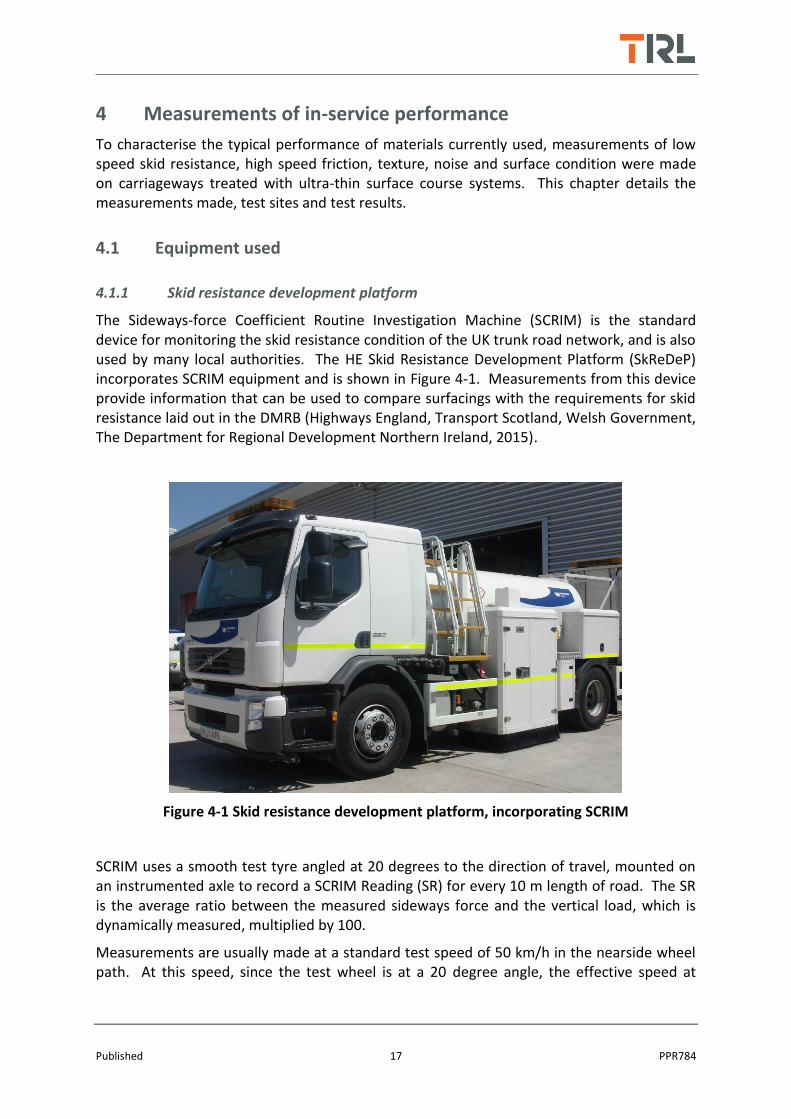
The Sideways-force Coefficient Routine Investigation Machine (SCRIM) is the standard device for monitoring the skid resistance condition of the UK trunk road network, and is also used by many local authorities. The HE Skid Resistance Development Platform (SkReDeP) incorporates SCRIM equipment and is shown in Figure 4-1. Measurements from this device provide information that can be used to compare surfacings with the requirements for skid resistance laid out in the DMRB (Highways England, Transport Scotland, Welsh Government, The Department for Regional Development Northern Ireland, 2015).
Figure 4-1 Skid resistance development platform, incorporating SCRIM
SCRIM uses a smooth test tyre angled at 20 degrees to the direction of travel, mounted on an instrumented axle to record a SCRIM Reading (SR) for every 10 m length of road. The SR is the average ratio between the measured sideways force and the vertical load, which is dynamically measured, multiplied by 100.
Measurements are usually made at a standard test speed of 50 km/h in the nearside wheel path. At this speed, since the test wheel is at a 20 degree angle, the effective speed at
Published 18 PPR784
which the tyre contact patch moves over the surface (the slip speed) is 17 km/h. For this reason, SCRIM is considered to be a low-speed test.
SCRIM readings are speed-corrected to the standard test speed if necessary and converted into SCRIM Coefficient (SC), by applying a correction factor, for reporting and comparison with the relevant standards.
4.1.2 Pavement friction tester
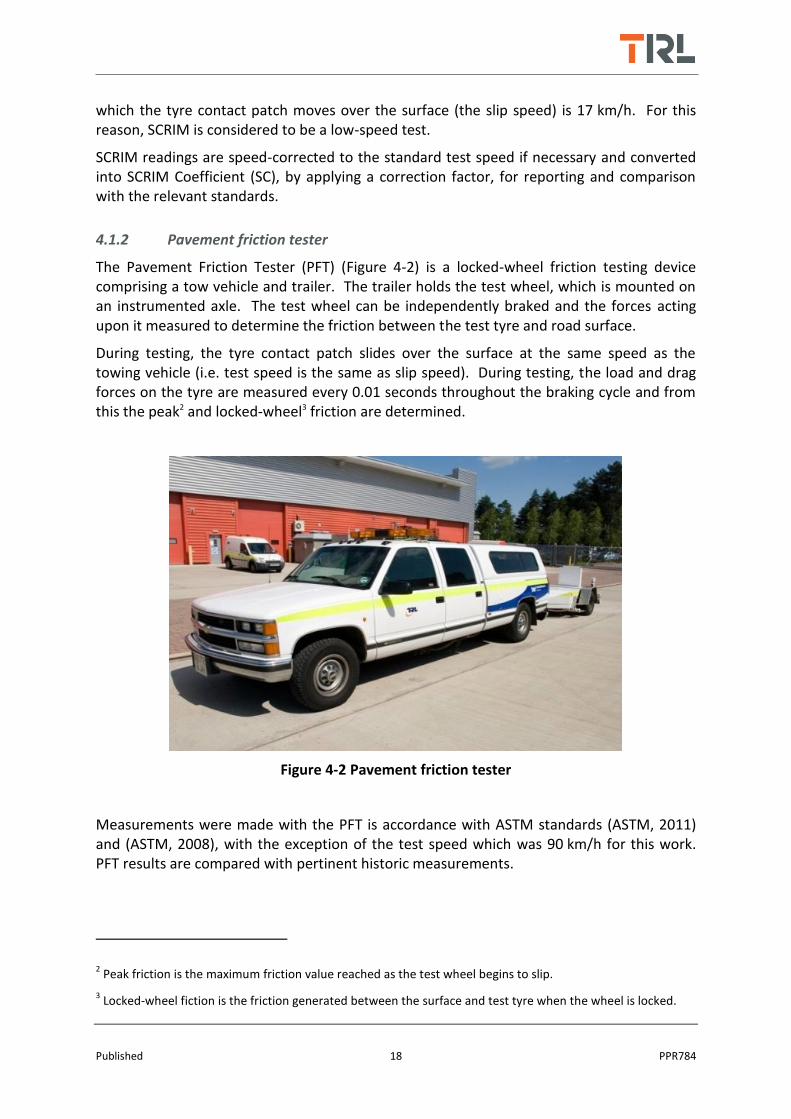
The Pavement Friction Tester (PFT) (Figure 4-2) is a locked-wheel friction testing device comprising a tow vehicle and trailer. The trailer holds the test wheel, which is mounted on an instrumented axle. The test wheel can be independently braked and the forces acting upon it measured to determine the friction between the test tyre and road surface.
During testing, the tyre contact patch slides over the surface at the same speed as the towing vehicle (i.e. test speed is the same as slip speed). During testing, the load and drag forces on the tyre are measured every 0.01 seconds throughout the braking cycle and from this the peak2 and locked-wheel3 friction are determined.
Figure 4-2 Pavement friction tester
Measurements were made with the PFT is accordance with ASTM standards (ASTM, 2011) and (ASTM, 2008), with the exception of the test speed which was 90 km/h for this work. PFT results are compared with pertinent historic measurements.
2 Peak friction is the maximum friction value reached as the test wheel begins to slip.
3 Locked-wheel fiction is the friction generated between the surface and test tyre when the wheel is locked.
Published 19 PPR784
4.1.3 Highways Agency road research information system
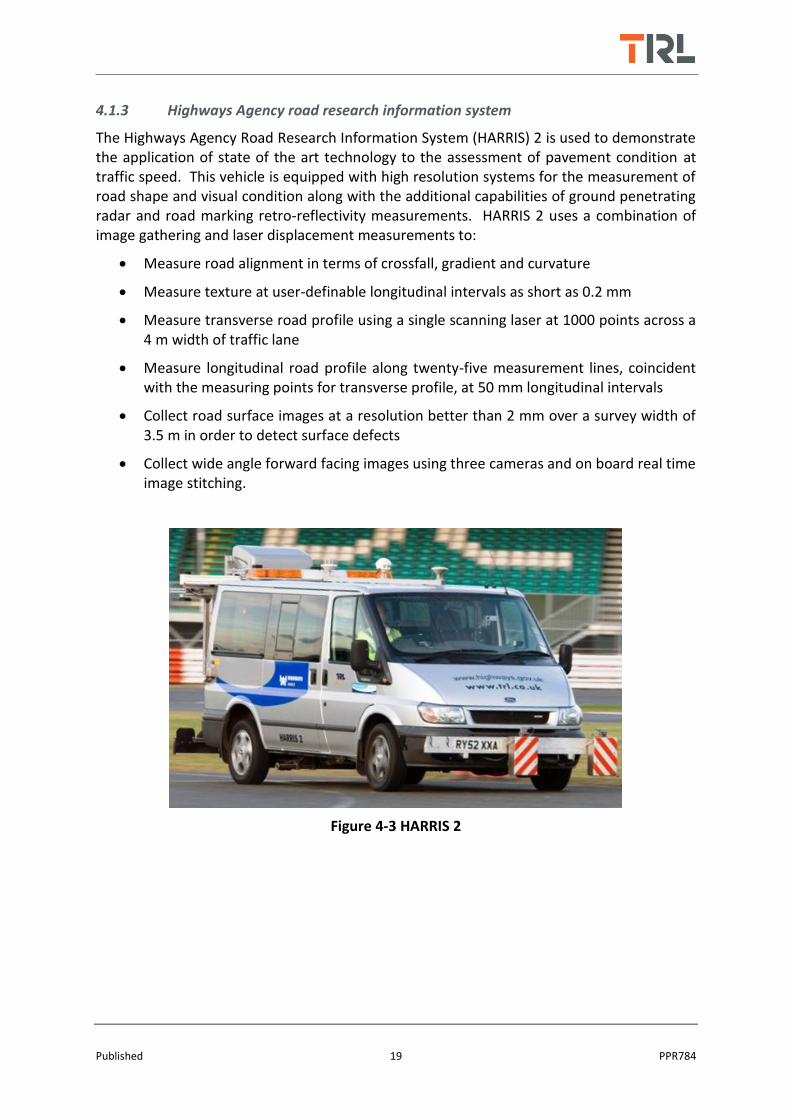
The Highways Agency Road Research Information System (HARRIS) 2 is used to demonstrate the application of state of the art technology to the assessment of pavement condition at traffic speed. This vehicle is equipped with high resolution systems for the measurement of road shape and visual condition along with the additional capabilities of ground penetrating radar and road marking retro-reflectivity measurements. HARRIS 2 uses a combination of image gathering and laser displacement measurements to:
Measure road alignment in terms of crossfall, gradient and curvature
Measure texture at user-definable longitudinal intervals as short as 0.2 mm
Measure transverse road profile using a single scanning laser at 1000 points across a 4 m width of traffic lane
Measure longitudinal road profile along twenty-five measurement lines, coincident with the measuring points for transverse profile, at 50 mm longitudinal intervals
Collect road surface images at a resolution better than 2 mm over a survey width of 3.5 m in order to detect surface defects
Collect wide angle forward facing images using three cameras and on board real time image stitching.
Figure 4-3 HARRIS 2

Published 20 PPR784
4.1.4 Close proximity noise measurements
The Close Proximity (CPX) method described in ISO/DIS 11819-2:2015 (ISO, 2015) is designed to assess the acoustic properties of road surfaces by measuring the rolling noise of a standard reference tyre at two microphone positions located close to the tyre/road contact patch. The reference tyre and microphones are surrounded by a soundproof enclosure to minimise the effects of noise from other sources. Measurements are performed at a range of specified reference speeds; on high speed roads the reference speed is commonly 80 km/h.
TRITON is TRL’s purpose built CPX tyre/road noise investigation vehicle (Figure 4-4). It is currently the only CPX system operating in the UK. The vehicle is based around a truck chassis and has a specially designed semi-anechoic enclosure which covers a dedicated test wheel running in the nearside wheel path and an array of microphones.
Figure 4-4 TRITON CPX vehicle (with enclosure in lowered position for measurements)

Published 21 PPR784
4.1.5 Statistical pass by noise measurement
The Statistical Pass-By (SPB) method is described in ISO 11819-1:2001 (ISO, 2001). This method requires the simultaneous measurement of the maximum A-weighted pass-by noise levels and speeds of individual vehicles running in the nearside lane. The noise levels are captured using a microphone located at 7.5 m from the centre of the nearside lane and 1.2 m above the road surface. Vehicles are classified into 3 acoustically similar categories:
L - Light vehicles consisting of passenger cars, car based vans, taxis etc.
H1 - Heavy vehicles with 2-axles and an unladen weight exceeding 3.5 tonnes
H2 - Heavy vehicles with more than 2-axles
These data are normalised to determine the noise level for each vehicle category at a reference speed corresponding to the road category; these values are then used in conjunction with the equations in Appendix A.8 of the HAPAS guidelines (HAPAS, 2008) to determine the Road Surface Influence (RSI) value for the road surface, this value is normalised to the performance of a typical aged HRA surface. A negative RSI is therefore quieter than a typical aged HRA and a positive RSI, vice versa as shown in Table 4-1.
Table 4-1 Noise requirements from IAN 154 (Highways Agency, 2012)
Level RSI Restrictions
3 -3.5 dB(A) Necessary in noise sensitive areas.
2 -2.5 dB(A)
1 -0.5 dB(A) Must not be used in noise sensitive areas.
0 +1.2 dB(A) Must not be used in areas with existing noise protection.
NR N/A N/A
Published 22 PPR784
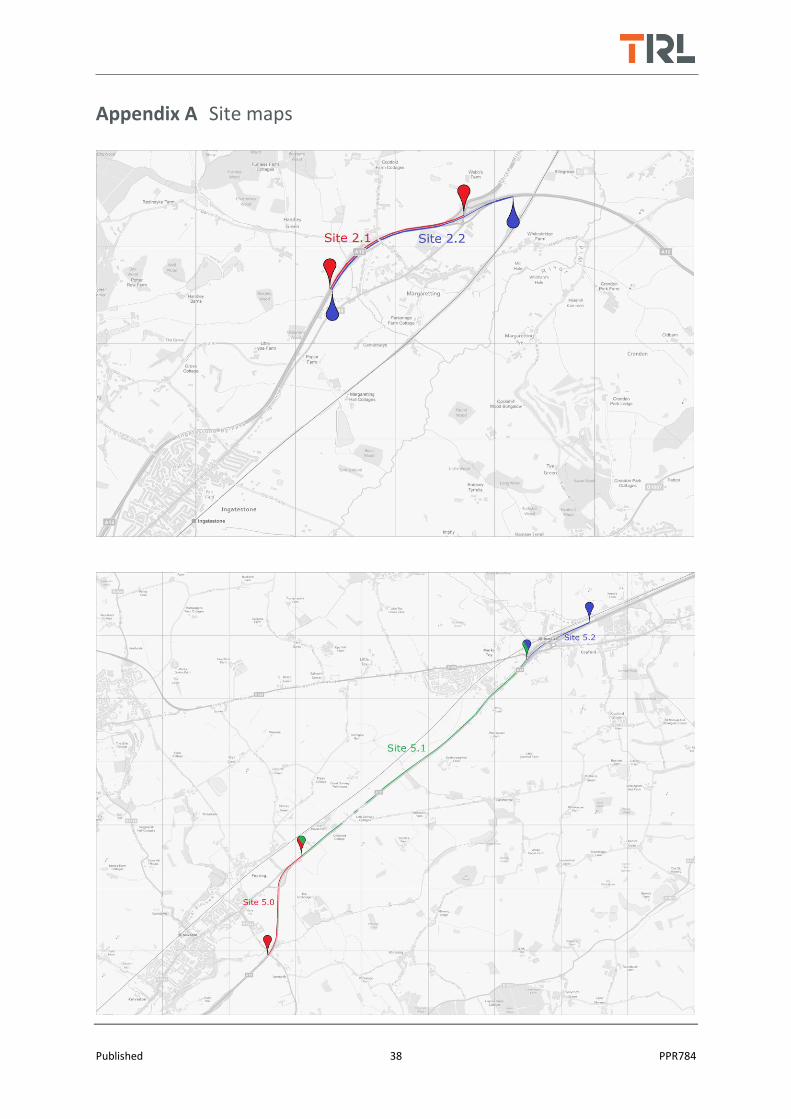
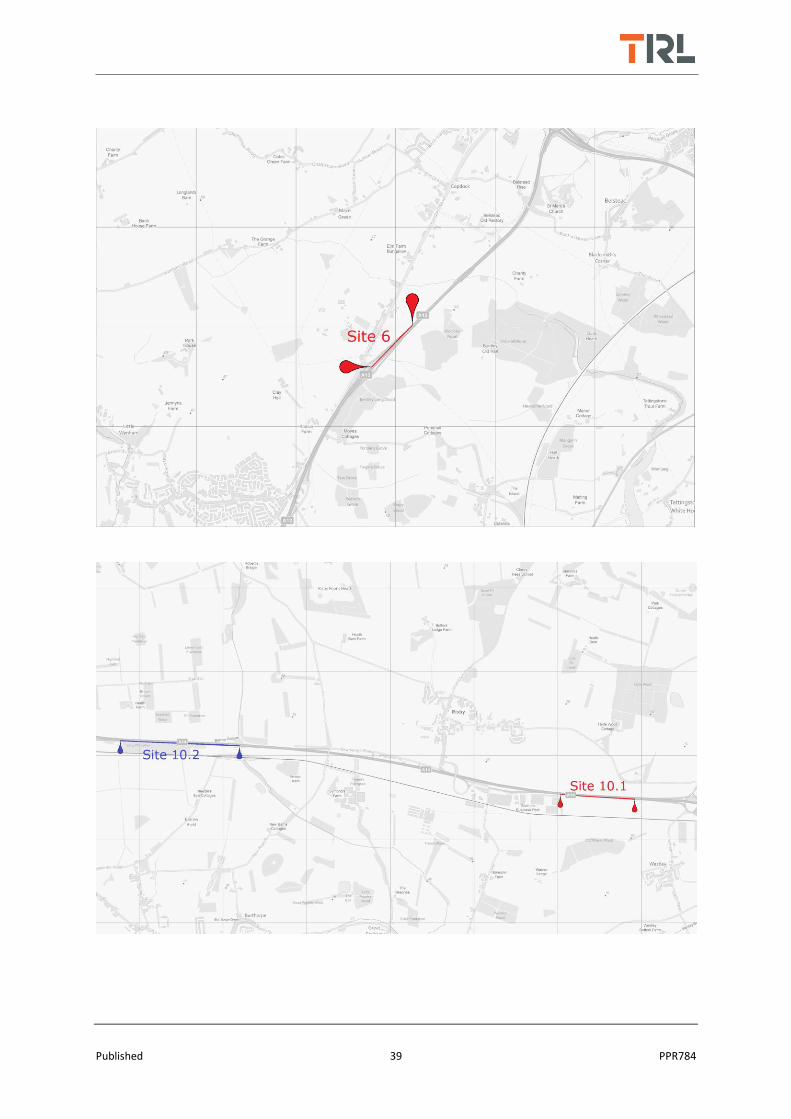
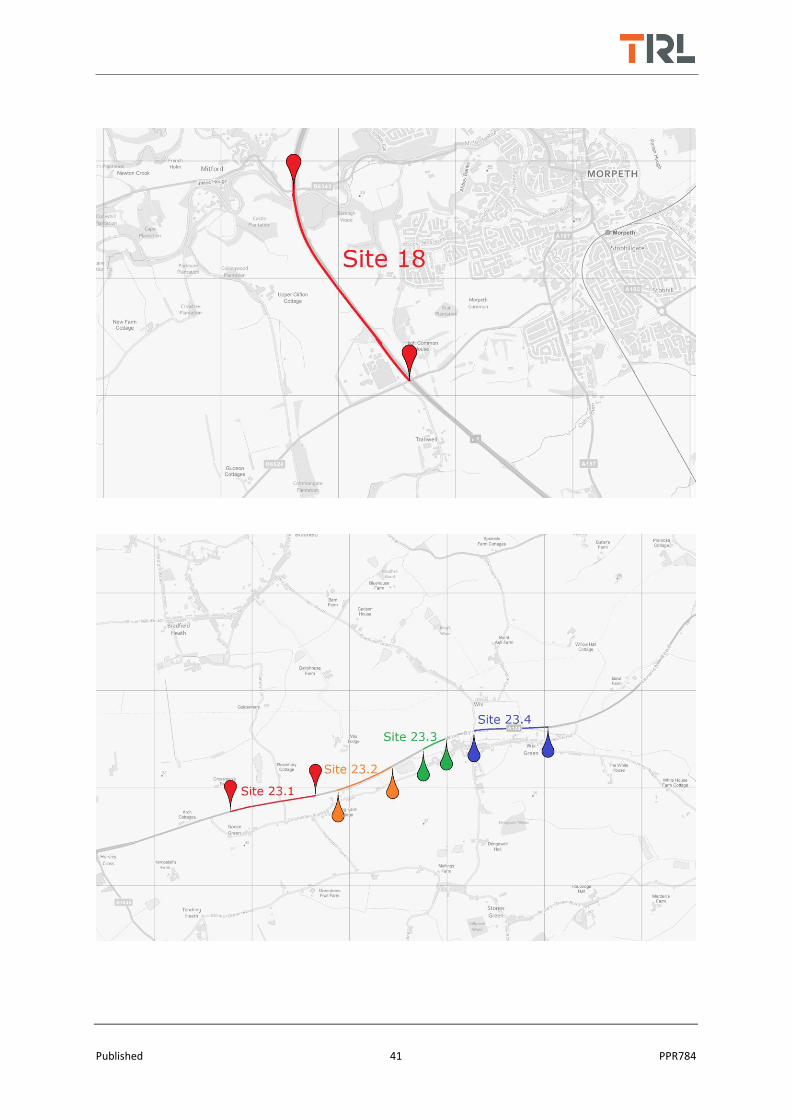
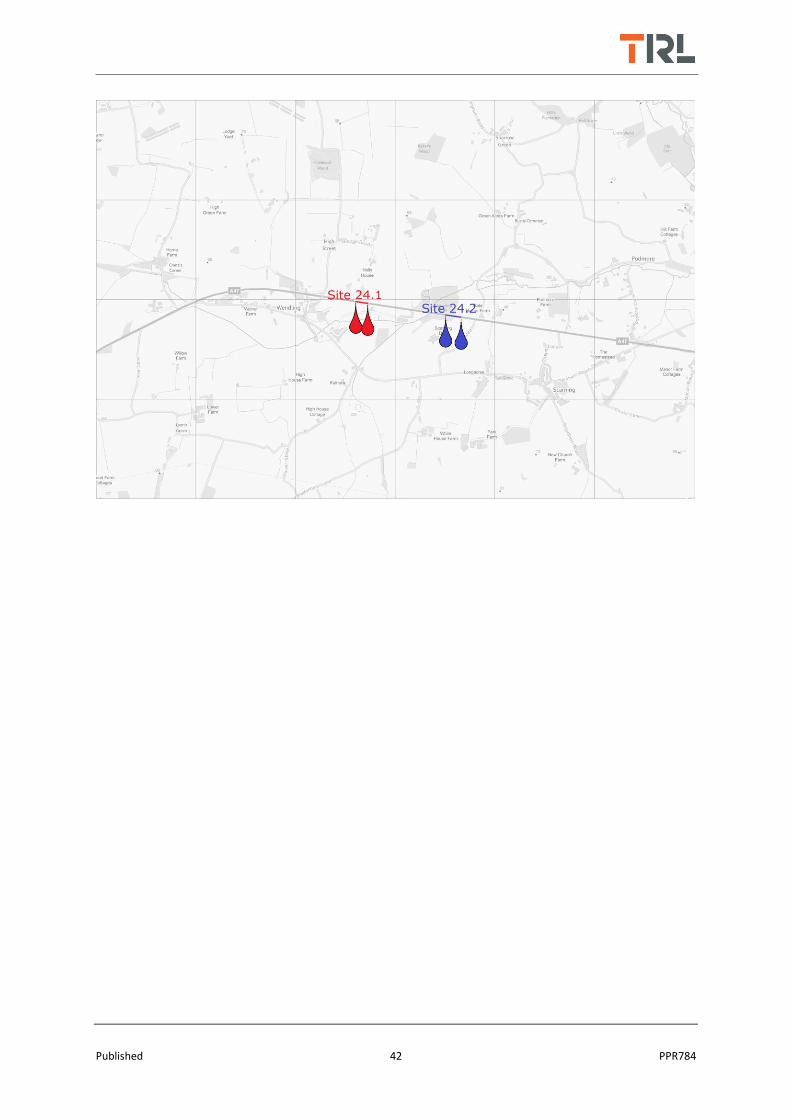
4.2 Sites selected
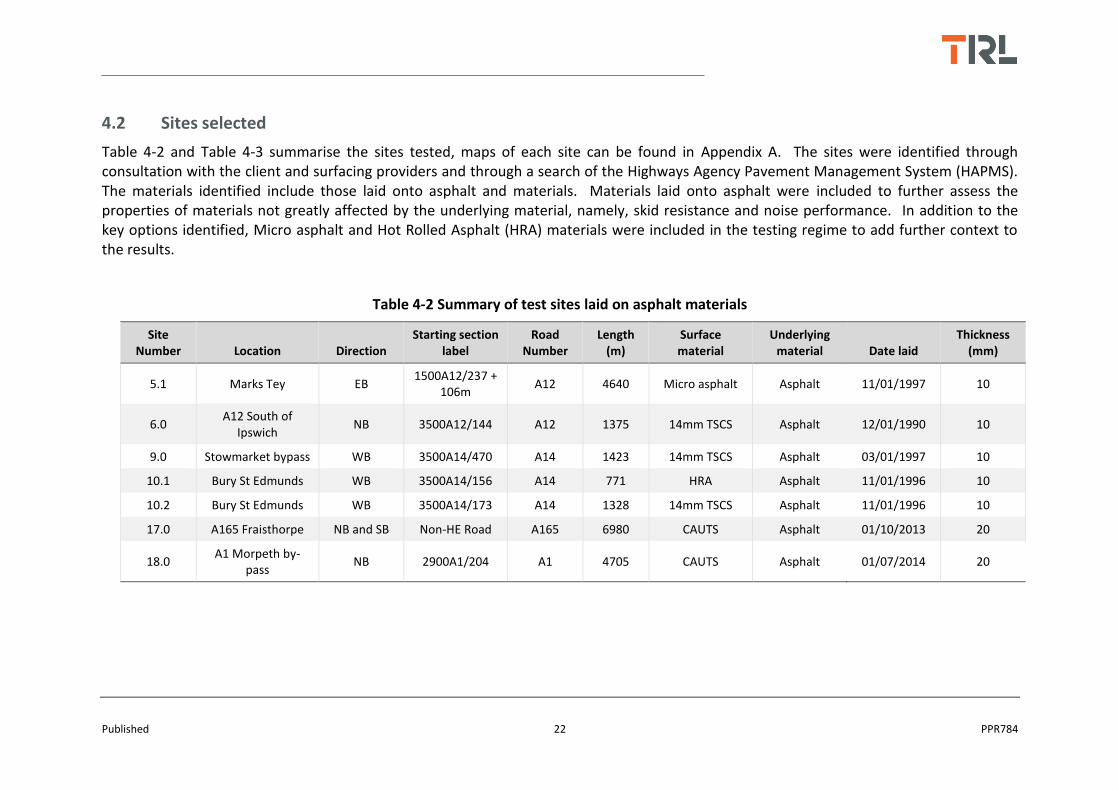
Table 4-2 and Table 4-3 summarise the sites tested, maps of each site can be found in Appendix A. The sites were identified through consultation with the client and surfacing providers and through a search of the Highways Agency Pavement Management System (HAPMS). The materials identified include those laid onto asphalt and materials. Materials laid onto asphalt were included to further assess the properties of materials not greatly affected by the underlying material, namely, skid resistance and noise performance. In addition to the key options identified, Micro asphalt and Hot Rolled Asphalt (HRA) materials were included in the testing regime to add further context to the results.
Table 4-2 Summary of test sites laid on asphalt materials
Site Number Location Direction
Starting section label
Road Number
Length (m)
Surface material
Underlying material Date laid
Thickness (mm)
5.1 Marks Tey EB 1500A12/237 +
106m A12 4640 Micro asphalt Asphalt 11/01/1997 10
6.0 A12 South of
Ipswich NB 3500A12/144 A12 1375 14mm TSCS Asphalt 12/01/1990 10
9.0 Stowmarket bypass WB 3500A14/470 A14 1423 14mm TSCS Asphalt 03/01/1997 10
10.1 Bury St Edmunds WB 3500A14/156 A14 771 HRA Asphalt 11/01/1996 10
10.2 Bury St Edmunds WB 3500A14/173 A14 1328 14mm TSCS Asphalt 11/01/1996 10
17.0 A165 Fraisthorpe NB and SB Non-HE Road A165 6980 CAUTS Asphalt 01/10/2013 20
18.0 A1 Morpeth by-
pass NB 2900A1/204 A1 4705 CAUTS Asphalt 01/07/2014 20

Published 23 PPR784
Table 4-3 Summary of test sites laid on concrete materials
Site Number Location Direction
Starting section label
Road Number
Length (m)
Surface material
Underlying material Date laid
Thickness (mm)
2.1 Chelmsford bypass EB 1500A12/143 A12 1500 Surface
Dressing Concrete 06/01/1991 14
2.2 Chelmsford bypass WB 1500A12/146 A12 544 Surface
Dressing Concrete 06/01/1991 14
5.0 Marks Tey NB 1500A12/233 +
1050m A12 361 Surface dressing Concrete 01/06/1990 10
5.2 Marks Tey NB 1500A12/250 A12 1107 TSCS Concrete 01/06/1973 10
23.1 Wix by-pass EB 1500A120/155 A120 973 Surface dressing Concrete 01/05/1991 14
23.2 Wix by-pass EB 1500A120/155
+ 1181m A120 624 Surface dressing Concrete 01/05/1991 14
23.3 Wix by-pass EB 1500A120/160
+ 605m A120 208 Surface dressing Concrete 01/05/1991 14
23.4 Wix by-pass EB 1500A120/160
+ 1160m A120 686 Surface dressing Concrete 01/05/1991 14
24.1 Wendling EB 2600A47/366 +
350m A47 150 Surface dressing Concrete 21/07/1996 6
24.2 Wendling EB 2600A47/366 +
1235m A47 140 TSCS Concrete 21/07/2008 16
Published 24 PPR784
4.3 Measurements made
4.3.1 Low speed skid resistance
Low speed skid resistance measurements were made using SkReDeP at 80 km/h. Results of average low speed skid resistance, and the 90th percentile range of measurements, are presented for each site in the following chapter with reference to the Investigatory Level (IL) for non-event motorways and dual carriageways as stated in HD28/15 (Highways England, Transport Scotland, Welsh Government, The Department for Regional Development Northern Ireland, 2015).
4.3.2 High speed friction
High speed friction measurements were made with the PFT using a smooth ASTM tyre at a test speed of 90 km/h. The average of at least five measurements of peak and locked-wheel friction, and the 90th percentile range of measurements, are presented for each site in the following chapter. High speed friction measurements do not have a standard to which they can be compared. To add context to the results, high speed friction results are presented with reference to the typical performance ranges expected for the material being tested.
The performance ranges given, represent the 90th percentile range of many thousand measurements made. They have been included to contextualise the results only and do not imply safe, nor, acceptable values. Where no typical results are given, this is due to the limited amount of historical information available for that material.
4.3.3 Texture
Measurements of road surface texture depth were made using HARRIS 2. The measurements are presented in the next chapter as average Sensor Measured Texture Depth (SMTD) values. Average SMTD values are presented for all of the sites tested and area compared to the pavement condition categories given in HD29/08, shown in Table 4-4 (The Highways Agency, Transport Scotland, Welsh Government, The Department for Regional Development Northern Ireland, 2008).

Published 25 PPR784
Table 4-4 Road condition categories from HD29/08
Category Description
1 Sound – no visible deterioration.
2 Some deterioration – lower level of concern. The deterioration is not serious and more detailed (project level) investigations are not needed unless extending over long lengths, or several parameters are at this category at isolated positions.
3 Moderate deterioration – warning level of concern. The deterioration is becoming serious and needs to be investigated. Priorities for more detailed (scheme level) investigations depend on the extent and values of the condition parameters.
4 Severe deterioration – intervention level of concern. This condition should not occur very frequently on the motorway and all purpose trunk road network as earlier maintenance must have prevented this state from being reached. At this level of deterioration more detailed (scheme level) investigations should be carried out on the deteriorated lengths at the earliest opportunity and action taken if, and as, appropriate.
4.3.4 Surface loss and cracking
In addition to the measurements of texture, HARRIS 2 was used to collect downward facing images of the road surfaces. These images the amount of surface loss and cracking present on the materials laid on top of concrete to be assessed using the following procedure:
1. Downward facing images of the road were captured using HARRIS 2.
2. The images were imported into the ChartCrack software and areas showing various defects marked as per Figure 4-5.
Figure 4-5 Example of defect marking in ChartCrack, surface loss indicated by green crosses and cracking indicated by red crosses
Published 26 PPR784
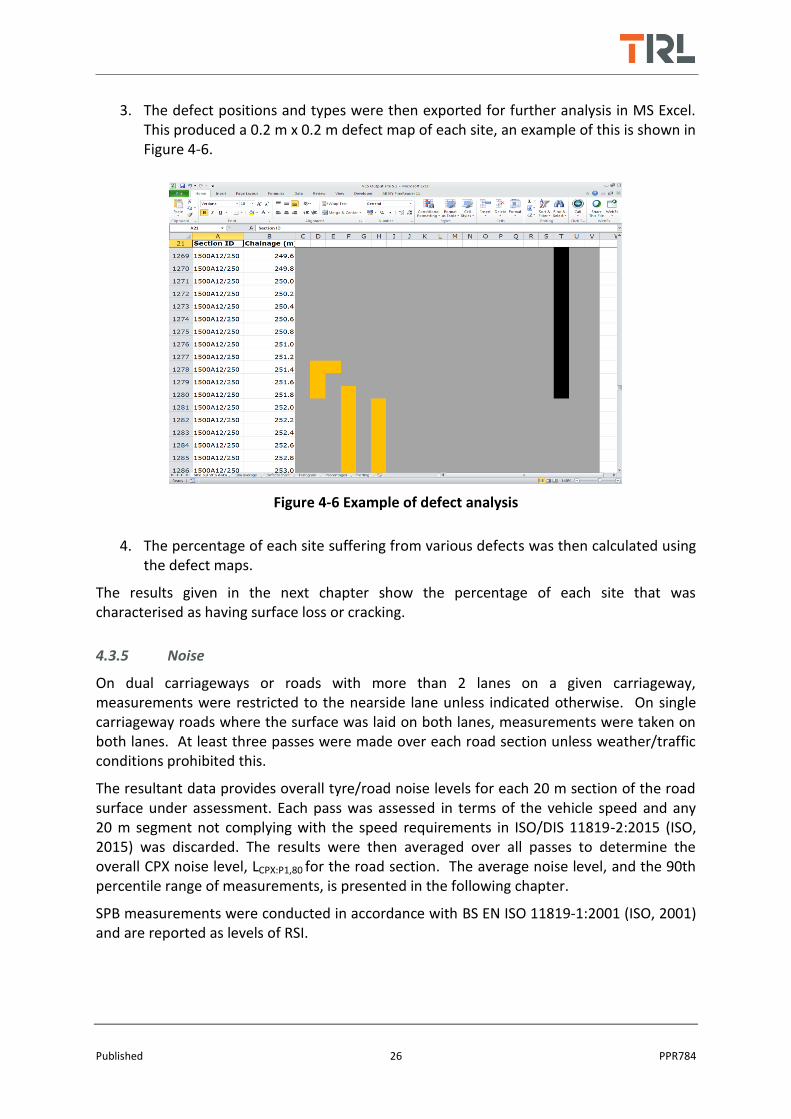
3. The defect positions and types were then exported for further analysis in MS Excel. This produced a 0.2 m x 0.2 m defect map of each site, an example of this is shown in Figure 4-6.
Figure 4-6 Example of defect analysis
4. The percentage of each site suffering from various defects was then calculated using the defect maps.
The results given in the next chapter show the percentage of each site that was characterised as having surface loss or cracking.
4.3.5 Noise
On dual carriageways or roads with more than 2 lanes on a given carriageway, measurements were restricted to the nearside lane unless indicated otherwise. On single carriageway roads where the surface was laid on both lanes, measurements were taken on both lanes. At least three passes were made over each road section unless weather/traffic conditions prohibited this.
The resultant data provides overall tyre/road noise levels for each 20 m section of the road surface under assessment. Each pass was assessed in terms of the vehicle speed and any 20 m segment not complying with the speed requirements in ISO/DIS 11819-2:2015 (ISO, 2015) was discarded. The results were then averaged over all passes to determine the overall CPX noise level, LCPX:P1,80 for the road section. The average noise level, and the 90th percentile range of measurements, is presented in the following chapter.
SPB measurements were conducted in accordance with BS EN ISO 11819-1:2001 (ISO, 2001) and are reported as levels of RSI.
Published 27 PPR784
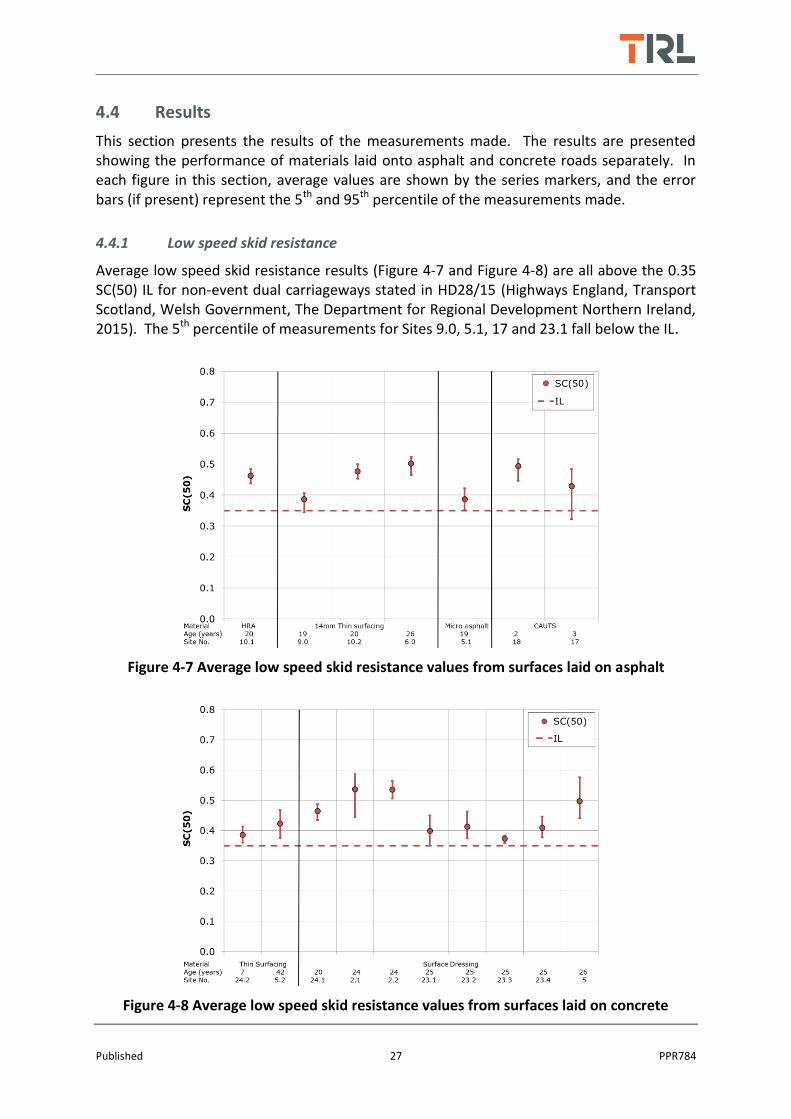
4.4 Results
This section presents the results of the measurements made. The results are presented showing the performance of materials laid onto asphalt and concrete roads separately. In each figure in this section, average values are shown by the series markers, and the error bars (if present) represent the 5th and 95th percentile of the measurements made.
4.4.1 Low speed skid resistance
Average low speed skid resistance results (Figure 4-7 and Figure 4-8) are all above the 0.35 SC(50) IL for non-event dual carriageways stated in HD28/15 (Highways England, Transport Scotland, Welsh Government, The Department for Regional Development Northern Ireland, 2015). The 5th percentile of measurements for Sites 9.0, 5.1, 17 and 23.1 fall below the IL.
Figure 4-7 Average low speed skid resistance values from surfaces laid on asphalt
Figure 4-8 Average low speed skid resistance values from surfaces laid on concrete
Published 28 PPR784
The performance of the sites with surface dressings are variable, Site 2.1 showed the highest average skid resistance value of all the sites tested and Site 23.3 the lowest. It is interesting to note that the sites closest geographically to one another shared similar performance characteristics. This suggests that a variation in performance is an indicative material property that could be consistent with local conditions such as traffic level, weathering, or the availability of aggregate sources.
4.4.2 High speed friction
Figure 4-9 presents the results of measurements made on ultra-thin surfacings laid on top of asphalt materials. The average peak and locked-wheel friction values measured on the HRA surface, Site 10.1, are towards the bottom end of the typical ranges. The 14 mm TSCSs, Sites 9.0, 10.2 and 6.0, are showing a performance within the typical ranges for TSCSs.
The micro asphalt and CAUTSs, Sites 5.1, 18 and 17, are all displaying a behaviour either towards or below the bottom end of the typical ranges for TSCSs. These surfaces show a locked-wheel friction performance of approximately 0.30 and a peak friction performance of approximately 0.55. This may be typical of the performance of surfacings of these types, but a lack of data prevents the comparison.
The performance of the materials laid on concrete are shown in Figure 4-10. These results show that the Thin Surfacing materials, Sites 24.2 and 5.2, are performing far below the typical range for these materials with a locked-wheel and peak friction performance of approximately 0.15 and 0.25 units respectively. A similar performance is displayed by Site 24.1, a surface dressing, which also falls well below the typical range that would be expected of surface dressings in general.
The remainder of the surface dressings however, are performing towards the upper end of the typical locked wheel-friction range. The peak friction measurements are more variable than the locked-wheel friction measurements but these are within the typical behaviour for surface dressings.

Published 29 PPR784
Figure 4-9 Average peak and locked-wheel friction values from surfaces laid on asphalt
Figure 4-10 Average peak and locked-wheel friction values from surfaces laid on concrete
Published 30 PPR784
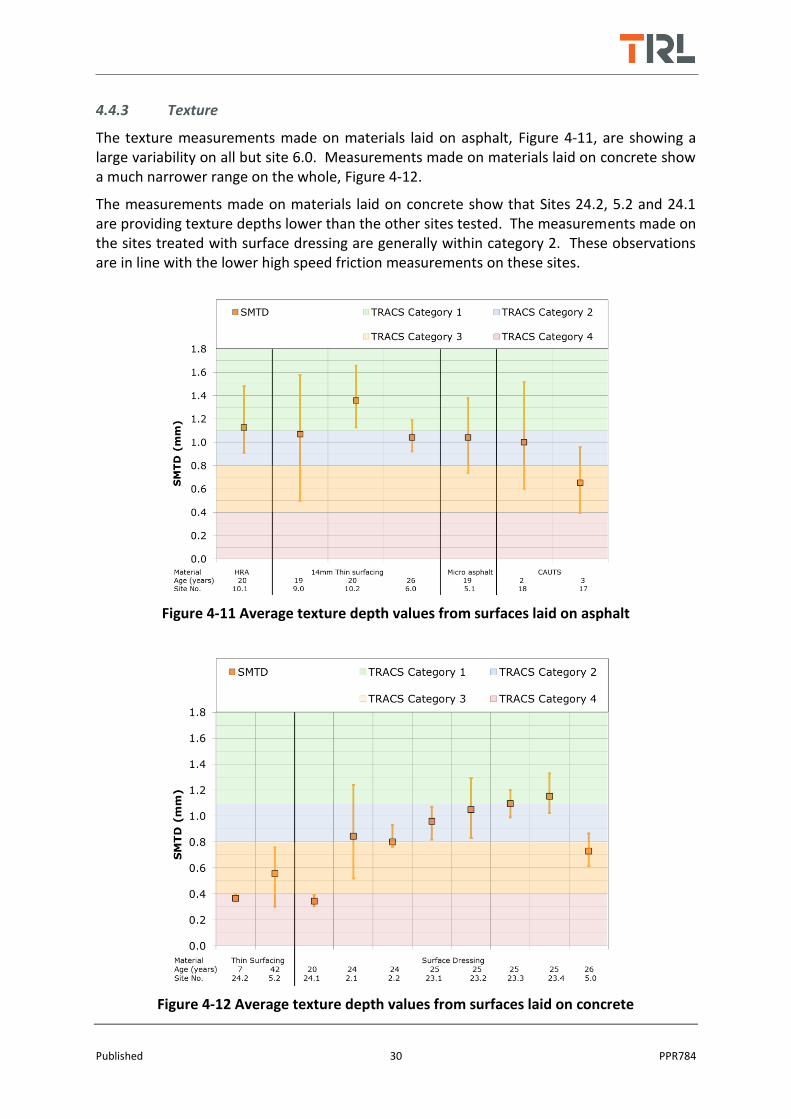
4.4.3 Texture
The texture measurements made on materials laid on asphalt, Figure 4-11, are showing a large variability on all but site 6.0. Measurements made on materials laid on concrete show a much narrower range on the whole, Figure 4-12.
The measurements made on materials laid on concrete show that Sites 24.2, 5.2 and 24.1 are providing texture depths lower than the other sites tested. The measurements made on the sites treated with surface dressing are generally within category 2. These observations are in line with the lower high speed friction measurements on these sites.
Figure 4-11 Average texture depth values from surfaces laid on asphalt
Figure 4-12 Average texture depth values from surfaces laid on concrete

Published 31 PPR784
Average results shown in Figure 4-11 are within category 1 and 2 for all but site 17, which is in category 3. This is interesting because based on the texture performance it would be expected for Sites 5.1 to display a greater high speed friction performance than site 174, but Figure 4-9 shows that these materials are performing relatively similarly.
Figure 4-13 compares the high speed friction and texture results for all of the materials tested. Presented with these results is a reference dataset which contains all the measurements of high speed friction and texture collected by TRL. Figure 4-13 shows that the materials are performing as would be expected based on the reference dataset. The performance of site 5.1 is on the lower end of the reference dataset but cannot be considered an outlier.
Figure 4-13 Texture and high speed friction comparison
4 Based on the relationships between texture depth and high speed friction derived in TRL report 367 (Roe,
Parry, & Viner, 1998).
Published 32 PPR784
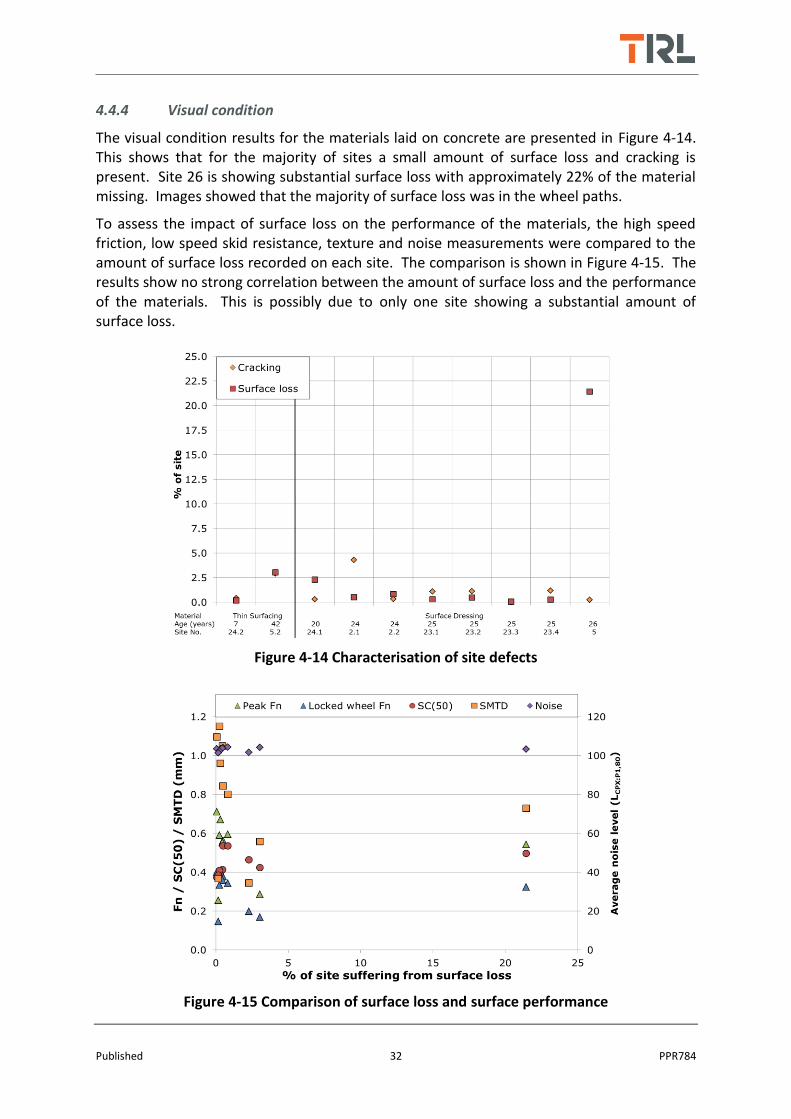
4.4.4 Visual condition
The visual condition results for the materials laid on concrete are presented in Figure 4-14. This shows that for the majority of sites a small amount of surface loss and cracking is present. Site 26 is showing substantial surface loss with approximately 22% of the material missing. Images showed that the majority of surface loss was in the wheel paths.
To assess the impact of surface loss on the performance of the materials, the high speed friction, low speed skid resistance, texture and noise measurements were compared to the amount of surface loss recorded on each site. The comparison is shown in Figure 4-15. The results show no strong correlation between the amount of surface loss and the performance of the materials. This is possibly due to only one site showing a substantial amount of surface loss.
Figure 4-14 Characterisation of site defects
Figure 4-15 Comparison of surface loss and surface performance
Published 33 PPR784
4.4.5 Noise
The collection of Statistical Pass By (SPB) noise measurements is limited by a number of factors, including but not limited to:
Road geometry
Traffic speed
Traffic population
Weather conditions
Measurement access locations
Due to these limitations it was possible to conduct SPB measurements on Site 17 only. The RSI value for Site 17 was calculated as -0.5 dB. The performance of Site 17 can therefore be expected to be 0.5dB quieter than an aged HRA surface with 20 mm chippings.
The collection of Close Proximity (CPX) measurements also has a number of limiting factors and due to these it was not possible to collect information on sites; 10.1, 10.2, 5.1 and 18. This was primarily due to the site geometry not allowing the vehicle to achieve the correct test speed.
The results for the CPX results are presented in Figure 4-16 and Figure 4-17. The CPX measurements made on Site 17 show that an average value of approximately 103 LCPX:P1,80
was recorded, and that the 90th percentile range of measurements was approximately 1 LCPX:P1,80. Given that an SPB value of -0.5 RSI was recorded on this site the CPX measurements can be used as a rough benchmark for the performance of the other materials.
Measurements made on the TSCSs laid on asphalt are showing a variation in CPX measurement of approximately 8 units. This is a substantial difference and it was not possible through this work to assess the causes of this variation.
With the exception of Site 24.1, which was also showing different high speed friction and texture characteristics, the surface dressings have a range of 2 units and the mean of this range, 101.70, is similar to the value of 103.15 measured on Site 17. This suggests that an RSI of approximately -0.5 could be expected on these surfaces.
Interim advice note 154/12 (Highways Agency, 2012) stipulates the noise parameters shown in Table 4-1 for use on the Highways England network. Based on the CPX and SPB measurements, it is likely that the majority of surface dressings would be able to meet the requirements for level 1 and 0. It is possible that some surface dressings and TSCS materials may also be able to achieve the level 2 criteria, but that this may not be indicative of the performance of these material types.

Published 34 PPR784
Figure 4-16 Average CPX measurements from surfaces laid on asphalt
Figure 4-17 Average CPX measurements from surfaces laid on concrete

Published 35 PPR784
5 Conclusions
Currently TSCSs are the only materials permitted for unrestricted use on the English strategic road network. A range of alternatives are possible and have been investigated as part of this work. From the work presented in this report the following conclusions can be made:
Typical service lives of surface dressing materials laid onto concrete pavements were
identified between 6 and 30 years.
Typical service lives of ultra-thin thin surface course systems laid onto concrete
pavements were identified between 3 and 8 years.
The relationship between texture depth and high speed friction for ultra-thin
surfacing materials fitted that observed in historical measurements. Surfaces with
category 3 and 4 texture depth measurements can therefore be expected to provide
undesirable high speed friction properties.
Measurements of high speed friction and texture on TSCS laid on concrete were
substantially lower than those measured on those laid on asphalt materials.
Noise measurements made suggest that the performance of TSCS materials laid onto
concrete is variable but have the capability of producing quiet surfaces.
The high speed friction, low speed skid resistance and texture depth performance of
concrete surfaces treated with surface dressing was on the whole within acceptable
limits.
Poor high speed friction and texture values were observed on concrete surfaces
treated with thin surfacing, but low speed skid resistance measurements on these
materials were within acceptable limits.
The noise performance of surface dressings is on the whole fairly consistent, and are
likely to produce values of approximately -0.5 RSI, allowing their use in areas where
noise emissions are not a priority.
Owing to the availability of materials on the strategic road network, conclusions
pertaining to two of the key systems, CAUTS and Slurry seals, could not be made.
The installation and monitoring of these materials as part of an on-road trial would
provide valuable information for the assessment of these options.
Published 36 PPR784
6 Bibliography
ASTM. (2008). E524-08 Standard Specification for Standard Smooth Tire for Pavement Skid-
resistance Tests. West Conshohocken: ASTM.
ASTM. (2011). E274/E274M-11 Standard Test Method for SkidResistance of Paved surfaces
Using a full-Scale Tire. West Conshohocken: ASTM.
HAPAS. (2005). HAPAS Certificate 05/H107 McCannphalt 10 mm thin surfacing system for
highways. Watford: British Board of Agremént.
HAPAS. (2008). SG3/305234 Guidelines document for the assessment and certification of
thin surfacings for highways. Garston: British Board of Agremént.
HAPAS. (2012). HAPAS Certificate 01/H408 Aggregate industries thin surfacing system for
highways - Bardon safedress 6 mm thin surfacing system. Watford: British Board of
Agremént.
HAPAS. (2012). HAPAS Certificate 12/H181 Ralumac thin surfacing system for highways -
Ralumac RMT thin surfacing system. Watford: British Board of Agremént.
HAPAS. (2013). HAPAS Certificate 01/H047 Jean lefebvre UK thin surfacing systems for
highways - UL-M 6 mm thin surfacing system. Watford: British Board of Agremént.
HAPAS. (2014). HAPAS Certificate 07/H125 ASI Solutions surface treatments for highways -
Rinophalt. Watford: British Board of Agremént.
HAPAS. (2014). HAPAS Certificate 09/H148 RMS Cold-applied ultra-thin surface course
systems for highways. Watford: British Board of Agremént.
HAPAS. (2014). HAPAS Certificate 14/H222 JPCS Slurry surfacing treatments for highways -
JPCS Surface maintenance systems. Watford: British Board of Agremént.
HAPAS. (2015). HAPAS Certificate 14/H221 JPCS Slurry surfacing treatments for highways -
Rejuvopatch slurry surfacing and patch repair. Watford: British Board of Agremént.
Highways Agency. (2012). Interim Advice Note 154/12 Revision of SHW Clause 903, Clause
921 and Clause 942. London: The Stationery Office.
Highways England, Transport Scotland, Welsh Government, The Department for Regional
Development Northern Ireland. (2015). HD 28/15 - Skid resistance. London: The
Stationery Office.
Highways England, Transport Scotland, Welsh Government, The Department for Regional
Development Northern Ireland. (2016). HD 32/16 - Maintenance of concrete roads.
London: The Stationery Office.
Published 37 PPR784
ISO. (2001). ISO 11819-1:2001. Acoustics – Measurement of the influence of road surfaces on
traffic noise - Part 1: Statistical Pass-By method. Geneva: ISO.
ISO. (2015). ISO/DIS 11819-2:2015 Acoustics - Method for measuring the influence of road
surfaces on traffic noise - Part 2: The close-proximity method. Geneva: ISO.
Peeling, D. (2014). CPR1880 Highways Agency Pavement condition performance measure -
Annual Report 2013/14. Wokingham: TRL (Available on request).
Roe, P. G., Parry, A. R., & Viner, H. E. (1998). TRL 367. High and low speed skidding
resistance: the influence of texture depth. Crowthorne: TRL Limited.
RSTA. (2014). RSTA ADEPT Code of practice for surface dressing PT.6 - When to surface dress.
Wolverhampton: RSTA.
Sanders, P. D., & Brittain, S. (2014). PPR677 Surface treatment options for concrete roads.
Wokingham: TRL.
The Highways Agency, Transport Scotland, Welsh Government, The Department for
Regional Development Northern Ireland. (1999). HD 37/99 - Bituminous surfacimg
materials and techniques. London: The Stationary Office.
The Highways Agency, Transport Scotland, Welsh Government, The Department for
Regional Development Northern Ireland. (2006). HD 36/06 - Surfacing materials for
new and maintenance construction. London: The Stationary Office.
The Highways Agency, Transport Scotland, Welsh Government, The Department for
Regional Development Northern Ireland. (2008). HD 29/08 - Data for pavement
assessment. London: The Stationery Office.
Published 38 PPR784
Appendix A Site maps
Published 39 PPR784

Published 40 PPR784
Published 41 PPR784
Published 42 PPR784

Published 43 PPR784
Surface treatment options for concrete roads
Abstract
Many of the concrete road surfacings in the UK have been in service for over 30 years and are starting to suffer from reductions in skid resistance and texture. This report explores the state of the concrete network in the UK and the use ultra-thin surface course systems as a method of restoring skid resistance and texture.
Other titles from this subject area
PPR 677 Surface treatment options for concrete roads. Sanders, P D; Brittain, S. 2014
PPR 492 Further studies of the skid resistance of asphalt surfaces in their early life. Greene, M J; Sanders, P D; Roe, P. 2010
TRL 298 Mechanical re-texturing of roads: a study of process and early life performance. Roe, P G; Hartshorne, S A. 1998
TRL 299 Mechanical re-texturing of roads: an experiment to assess durability. Roe, P G; Hartshorne, S A. 1998
TRL
Crowthorne House, Nine Mile Ride, Wokingham, Berkshire, RG40 3GA, United Kingdom T: +44 (0) 1344 773131 F: +44 (0) 1344 770356 E: [email protected] W: www.trl.co.uk
ISSN
ISBN
PPR784