puget sound energy - energize eastside eis · puget sound energy . ... 7 7.1 corridor ... single...
TRANSCRIPT

December 13, 2016
PUGET SOUND ENERGY
230 kV Eastside Line Project EMF Calculations and Report
Revision 1
PROJECT NUMBER: 132155
PROJECT CONTACT: AARON BOSTON EMAIL: [email protected] PHONE: (208) 288-6286

SAN 094-2691 (SR-06) PSE (12/13/16) JB 132155 REV. 1
EMF CALCULATIONS AND REPORT
PREPARED FOR: PUGET SOUND ENERGY
PREPARED BY:
JOHN BRINSKO – (858) 810-5317 – [email protected]
REVISION HISTORY
REV. DATE REVISED BY
0 11/22/16 JCB
1 12/13/16 JCB

SAN 094-2691 (SR-06) PSE (12/13/16) JB 132155 REV. 1 i
TABLE OF CONTENTS 1.0 EXECUTIVE SUMMARY ...................................................................................................... 1
2.0 DATA ......................................................................................................................................... 2
3.0 ASSUMPTIONS & NOTES .................................................................................................... 3
4.0 GENERAL DESCRIPTION.................................................................................................... 4
4.1 ELECTRIC FIELD ANALYSIS AND GUIDELINES ....................................................................... 4 4.2 MAGNETIC FIELD ANALYSIS AND GUIDELINES ...................................................................... 5
5.0 REDMOND SEGMENT .......................................................................................................... 5
5.1 ELECTRIC FIELD RESULTS ...................................................................................................... 5 5.2 MAGNETIC FIELD RESULTS .................................................................................................... 5
6.0 BELLEVUE NORTH SEGMENT .......................................................................................... 6
6.1 ELECTRIC FIELD RESULTS ...................................................................................................... 6 6.2 MAGNETIC FIELD RESULTS .................................................................................................... 6
7.0 BELLEVUE CENTRAL SEGMENT ..................................................................................... 7
7.1 CORRIDOR ............................................................................................................................... 7 7.1.1 Electric Field Results ...................................................................................................... 7 7.1.2 Magnetic Field Results ................................................................................................... 7
7.2 BYPASS ................................................................................................................................... 7 7.2.1 Electric Field Results ...................................................................................................... 7 7.2.2 Magnetic Field Results ................................................................................................... 8
8.0 BELLEVUE SOUTH SEGMENT .......................................................................................... 8
8.1 OAK 1 ...................................................................................................................................... 8 8.1.1 Electric Field Results ...................................................................................................... 8 8.1.2 Magnetic Field Results ................................................................................................... 9
8.2 OAK 2 ...................................................................................................................................... 9 8.2.1 Electric Field Results .................................................................................................... 10 8.2.2 Magnetic Field Results ................................................................................................. 10
8.3 WILLOW 1 ............................................................................................................................. 11 8.3.1 Electric Field Results .................................................................................................... 11 8.3.2 Magnetic Field Results ................................................................................................. 11
8.4 WILLOW 2 ............................................................................................................................. 12 8.4.1 Electric Field Results .................................................................................................... 12 8.4.2 Magnetic Field Results ................................................................................................. 12
9.0 NEWCASTLE SEGMENT .................................................................................................... 13
9.1 ELECTRIC FIELD RESULTS .................................................................................................... 13 9.2 MAGNETIC FIELD RESULTS .................................................................................................. 13
10.0 RENTON SEGMENT ............................................................................................................ 14
10.1 ELECTRIC FIELD RESULTS .................................................................................................... 14 10.2 MAGNETIC FIELD RESULTS .................................................................................................. 15

SAN 094-2691 (SR-06) PSE (12/13/16) JB 132155 REV. 1 ii
LIST OF TABLES Table 1: SUMMARY OF RESULTS ..................................................................................................... 2 Table 2: FUTURE LINE LOADING ..................................................................................................... 3 Table 3: REDMOND SEGMENT – ELECTRIC FIELD ...................................................................... 5 Table 4: REDMOND SEGMENT – MAGNETIC FIELD .................................................................... 6 Table 5: BELLEVUE NORTH SEGMENT – ELECTRIC FIELD ....................................................... 6 Table 6: BELLEVUE NORTH SEGMENT – MAGNETIC FIELD ..................................................... 6 Table 7: BELLEVUE CENTRAL CORRIDOR SEGMENT – ELECTRIC FIELD ............................. 7 Table 8: BELLEVUE CENTRAL CORRIDOR SEGMENT – MAGNETIC FIELD ........................... 7 Table 9: BELLEVUE CENTRAL BYPASS SEGMENT – ELECTRIC FIELD ................................... 8 Table 10: BELLEVUE CENTRAL BYPASS SEGMENT – MAGNETIC FIELD ............................... 8 Table 11: BELLEVUE SOUTH OAK 1 SEGMENT – ELECTRIC FIELD ......................................... 9 Table 12: BELLEVUE SOUTH OAK 1 SEGMENT – MAGNETIC FIELD ....................................... 9 Table 13: BELLEVUE SOUTH OAK 2 SEGMENT – ELECTRIC FIELD ....................................... 10 Table 14: BELLEVUE SOUTH OAK 2 SEGMENT – MAGNETIC FIELD ..................................... 10 Table 15: BELLEVUE SOUTH WILLOW 1 SEGMENT – ELECTRIC FIELD ............................... 11 Table 16: BELLEVUE SOUTH WILLOW 1 SEGMENT – MAGNETIC FIELD ............................. 11 Table 17: BELLEVUE SOUTH WILLOW 2 SEGMENT – ELECTRIC FIELD ............................... 12 Table 18: BELLEVUE SOUTH WILLOW 2 SEGMENT – MAGNETIC FIELD ............................. 12 Table 19: NEWCASTLE SEGMENT – ELECTRIC FIELD .............................................................. 13 Table 20: NEWCASTLE SEGMENT – MAGNETIC FIELD ............................................................ 14 Table 21: RENTON SEGMENT – ELECTRIC FIELD ...................................................................... 14 Table 22: RENTON SEGMENT – MAGNETIC FIELD .................................................................... 15

SAN 094-2691 (SR-06) PSE (12/13/16) JB 132155 REV. 1 1
1.0 EXECUTIVE SUMMARY Puget Sound Energy (PSE) requested that POWER Engineers, Inc. (POWER) perform an Electric and Magnetic Field (EMF) investigation for the Energize Eastside (EE) project route options.
The EE project is an upgrade of two existing 115 kV transmission lines to 230 kV and higher capacity 115 kV transmission lines for a distance of approximately 18 miles from Redmond, WA to Renton, WA. The EE project is comprised of six (6) main route segments; Redmond, Bellevue North, Bellevue Central, Bellevue South, Newcastle, and Renton. For this investigation, there are 34 locations along the six segments where EMF measurements were performed. EMF calculations were conducted at these locations. This analysis compares electric and magnetic field intensities between the existing and upgraded line configurations as a result of EE.
The State of Washington does not have EMF guidelines for electric transmission lines. There are industry guidelines for EMF. IEEE Std C95.6-2002 (IEEE Standard for Safety Levels with Respect to Human Exposure to Electromagnetic Fields, 0-3 kHz) specifies a reference limit of 5.0 kV/m for electric fields and 9,040 mG for magnetic fields. The International Commission on Non-Ionizing Radiation Protection (ICNIRP) publishes a recommended limit for the general public at the edge of Right-of-Way (ROW) of 4.16 kV/m for electric fields and 2,000 mG for magnetic fields. Percentage differences between calculated EMF values and industry guidelines are based on the IEEE guidelines for the maximum values and ICNIRP guidelines for the ROW values. Though electric and magnetic fields are both dependent upon the geometry of the transmission lines, electric fields are dependent on the voltage of a power line, whereas magnetic fields are dependent on the current through a power line.
The results of the analysis of the upgraded transmission lines of the Oak and Willow routes for the proposed EE project indicate the maximum calculated EMF levels and percentage differences as shown in Table 1. All proposed routes have calculated EMF levels well below industry guidelines.

SAN 094-2691 (SR-06) PSE (12/13/16) JB 132155 REV. 1 2
TABLE 1: SUMMARY OF RESULTS Electric Field
Proposed Route
Alternative
Maximum Edge of ROW
EMF Measurement Location*
Calculated Value (kV/m)
Difference Below Guideline (%)
EMF Measurement Location*
Calculated Value (kV/m)
Difference Below Guideline (%)
Oak 1 G2-1, G2-2 3.08 38.4 I-1, I-2, K-2, K-3, K-4 1.653 60.3 Oak 2 G2-1, G2-2 3.08 38.4 G2-1, G2-2 1.534 63.1
Willow 1 J-1 1.654 66.9 J-2, J-3 0.838 79.9 Willow 2 I-2 1.957 60.9 J-1, J-2, J-3 1.407 66.2
Magnetic Field
Proposed Route
Alternative
Maximum Edge of ROW
EMF Measurement Location*
Calculated Value (mG)
Difference Below Guideline (%)
EMF Measurement Location*
Calculated Value (mG)
Difference Below Guideline (%)
Oak 1 I-1, I-2, K-2, K-3, K-4 161.27 98.2 I-1, I-2, K-2, K-3, K-4 127.46 93.6 Oak 2 G2-1, G2-2 157.73 98.3 G2-1, G2-2 125.73 93.7
Willow 1 J-1 81.53 99.1 J-1 58.46 97.1 Willow 2 J-1, J-2, J-3 147.3 98.4 I-2 89.55 95.5
* EMF measurement locations are shown on the map in Appendix B.
2.0 DATA The data for the investigation is shown in Appendix A. Appendix B shows a map of the EE project routes (six segments as identified above) which identifies the 34 EMF measurement locations.
EMF from transmission lines are primarily dependent on conductor geometry, conductor size/bundling, line phasing, circuit configuration, current, voltage, and the altitude of the line.
There are six (6) different structure types that were analyzed for this investigation; C-1, C-10B, C-13, R-1, R-3A, and Existing Structure 05 (this is a structure developed by POWER in the original conceptual design phase and appears as R-7). The structures are shown in Appendix C. Figure 1 shows Structure C-1 (from PSE’s Custom Corridor Sheet A drawing). Figure 2 shows Structure C-10B (from PSE’s Custom Corridor Sheet C drawing). Figure 3 shows Structure C-13 (from PSE’s Custom Corridor Sheet B drawing). Figures 4 and 5 show Structures R-1 and R-3A. Structures C-7, R-7, and R-8 represent existing structures and are shown as Figures 6, 7, and 8. See Appendix A for actual structure geometry used in this analysis. The “R” type structures are generally utilized for Road ROW (Right-of-Way) locations. There are four ROW distances for the six different structure types as follows:
• Structures C-1, C-10B, and C-13: 100 foot ROW distance
• Structure R-1: 30 foot ROW distance
• Structure R-3A: 50 foot ROW distance
• Existing Structure 05 and Structure R-3A combined (Segment G2): 102 foot ROW distance. Refer to Section 3.0 for a detailed description of the ROW distance.

SAN 094-2691 (SR-06) PSE (12/13/16) JB 132155 REV. 1 3
ACSS 1590 kcmil “Falcon” conductor will be used for all 230 kV and 115 kV transmission lines except for sections of line segments that have the R-3A structure (EMF location G2-1, G2-2, I-1, I-2, and K-2). For these line segments, the existing 115 kV line phase conductors will be ACSR 795 kcmil “Tern”. The overhead shield wire is Optical Ground Wire (OPGW) for all transmission lines on single poles, with a 7#8 Alumoweld Overhead Ground Wire (OHGW) installed on segments with two transmission pole locations in the existing corridor.
PSE provided POWER with future 2017 winter and 2018 summer load currents for the transmission lines designated by direction for the 230 and 115 kV transmission line are shown in the document “2014 Max Flows in Amps Working-Final.xlsx” received on September 13, 2016. The peak and average load currents from this document are shown in Table 2.
TABLE 2: FUTURE LINE LOADING One line at 230 kV (winter 2017-18)
Line Name: Talbot Hill-Richards Creek #1
Talbot Hill-Lakeside #2
Sammamish-Richards Creek #1
Sammamish-Lakeside #2
Voltage Level: 230 kV 115 kV 230 kV 115 kV Line Rating (amps): 2616 2616 2616 2616
Average loading (amps): 740 388 365 60 Peak loading (amps): 1233 646 608 100
One line at 230 kV (summer 2018):
Line Name: Talbot Hill-Richards Creek #1
Talbot Hill-Lakeside #2
Sammamish-Richards Creek #1
Sammamish-Lakeside #2
Voltage Level: 230 kV 115 kV 230 kV 115 kV Line Rating (amps): 2460 2460 2460 2460
Average loading (amps): 95 86 311 164 Peak loading (amps): 127 114 415 218
3.0 ASSUMPTIONS & NOTES The following is a list of assumptions that POWER made throughout the duration of the project:
• Distribution lines were excluded from this analysis. This is due primarily because the phase conductors are closer together and, due to canceling effects, do not contribute significantly to EMF levels.
• For double circuit structures with conductors side by side the phase configuration is assumed to be the same on both sides (ABC-ABC). This provides the worst case scenario. EE will be configured as ABC-CBA.
• For segments that use C-1 structure type, the top and bottom arms are two feet shorter than the middle arm.
• For Structures R-1 and R-3A, the analysis profile includes 15 feet of the road and an additional 15 foot pole offset to the left of the structure. ROW is 30 and 50 feet respectively around the center of the analysis profile.
• Typical structure heights for R-1 and R-3A based on segment route maps provided by PSE.

SAN 094-2691 (SR-06) PSE (12/13/16) JB 132155 REV. 1 4
• For EMF locations G2-1 and G2-2, Existing Structure 05 is placed against the edge of the road with 10’ easement, and the R-3A structure is offset 15 feet from the road with a 42 foot easement. The road width of 50 feet is between both structures. This results in a ROW distance of 102 feet.
• The maximum operating voltages for the 115 kV and 230 kV transmission lines are 105% of the nominal voltage levels. The nominal voltage levels are the operating levels at which the transmission lines are designed to operate.
• The EMF measurements were performed based on existing transmission line configurations (that currently exist in the routes) and load conditions at the time of the measurements. Calculated EMF levels for upgraded transmission line configurations are based on future load conditions. Therefore, the EMF measurements cannot be compared directly with calculations for the upgraded transmission line route configurations.
The following is a list of notes regarding the information in the report:
• In the tables below, all locations having dashed lines are shown because either no existing 115 kV lines are in these segments through the corridor or no data was supplied.
• In Appendix D, the magnetic field plots contain four sets of data for the upgraded lines: Summer Peak, Summer Average, Winter Peak, and Winter Average. No existing configuration is plotted because these cases were initially run with different line loadings.
• The maximum EMF values shown in the tables and the plots occur within the corridor are due to the mutual contributions from each of the phases.
4.0 GENERAL DESCRIPTION 4.1 Electric Field Analysis and Guidelines The electric field strength is a measure of the force per unit charge at a given point in space relative to a charged object. It is typically measured in kilovolts per meter (kV/m). Electric field strength is calculated from the line voltage and is independent of the current through the line. Values are calculated at the minimum conductor height (mid-span) at a measurement height of one meter above the ground per IEEE Std 644-1994 (R2008), “IEEE Standard Procedures for Measurement of Power Frequency Electric and Magnetic Fields From AC Power Lines”.
The state of Washington does not currently have any guidelines on electric fields from transmission lines. There are applicable industry limits. IEEE Std C95.6-2002, “IEEE Standard for Safety Levels with Respect to Human Exposure to Electromagnetic Fields, 0-3 kHz” specifies a reference limit of 5.0 kV/m, and the International Commission on Non-Ionizing Radiation Protection (ICNIRP) publishes a recommended limit of 4.16 kV/m for the general public at the edge of ROW. These recommended values are non-binding, but serve as a point of reference for the calculated values. Calculated electric fields are well below these guidelines for all proposed routes.

SAN 094-2691 (SR-06) PSE (12/13/16) JB 132155 REV. 1 5
4.2 Magnetic Field Analysis and Guidelines The reported magnetic field values are the magnetic flux densities at a given point in space reported in units of milligauss. Calculations are performed at the minimum conductor height (mid-span) and are calculated one meter above the ground per IEEE Std 644-1994 (R2008). All values are calculated assuming balanced loading on all three phases. The magnetic fields will vary if there is unbalance on the system; however, transmission unbalance is typically fairly low. Note that the results are directly proportional to the loading of the line; therefore, 50% loading would be exactly half of the 100% loading condition.
The state of Washington does not currently have any guidelines on magnetic fields from transmission lines. There are applicable industry limits. IEEE Std C95.6-2002 specifies a reference limit of 9,040 mG, and the International Commission on Non-Ionizing Radiation Protection (ICNIRP) publishes a recommended limit of 2,000 mG for the general public at the edge of ROW. These recommended values are non-binding, but serve as a point of reference for the calculated values. Calculated magnetic fields are well below these guidelines for all proposed routes.
5.0 REDMOND SEGMENT EMF measurement locations A-1, A-2, C-1, and C-2 are comprised of Structure C-1 with a ROW width of 100 feet. The plots for the analysis along Redmond are shown in Appendix D, pages 2-5.
5.1 Electric Field Results A summary of the results of the electric field analysis for the Redmond Segment are shown in Table 3.
TABLE 3: REDMOND SEGMENT – ELECTRIC FIELD
EMF MEASUREMENT LOCATION
EXISTING UPGRADED Maximum
(kV/m) Edge of ROW
(kV/m) Maximum
(kV/m) Edge of ROW
(kV/m) A-1 1.487 1.292 1.654 0.631
A-2 1.487 1.292 1.654 0.631
C-1 1.487 1.292 1.654 0.631
C-2 1.487 1.292 1.654 0.631
5.2 Magnetic Field Results A summary of the results of the magnetic field analysis for the Redmond Segment are shown in Table 4.
SAN 094-2691 (SR-06) PSE (12/13/16) JB 132155 REV. 1 6
TABLE 4: REDMOND SEGMENT – MAGNETIC FIELD
EMF MEASUREMENT
LOCATION
EXISTING UPGRADED
Avg –Maximum (mG)
Avg –Edge of ROW (mG)
Peak –Maximum
(mG)
Peak –Edge of ROW (mG)
Summer Avg –
Maximum (mG)
Summer Avg –
Edge of ROW (mG)
Summer Peak –
Maximum (mG)
Summer Peak –Edge of ROW (mG)
Winter Avg –
Maximum (mG)
Winter Avg –
Edge of ROW (mG)
Winter Peak –
Maximum (mG)
Winter Peak –Edge of ROW (mG)
A-1 10.46 6.02 17.47 10.06 20.6 14.77 27.46 19.69 20.13 14.64 33.54 24.39
A-2 10.46 6.02 17.47 10.06 20.6 14.77 27.46 19.69 20.13 14.64 33.54 24.39
C-1 10.46 6.02 17.47 10.05 20.6 14.77 27.46 19.69 20.13 14.64 33.54 24.39
C-2 12.01 7.94 20.0 13.22 20.6 14.77 27.46 19.69 20.13 14.64 33.54 24.39
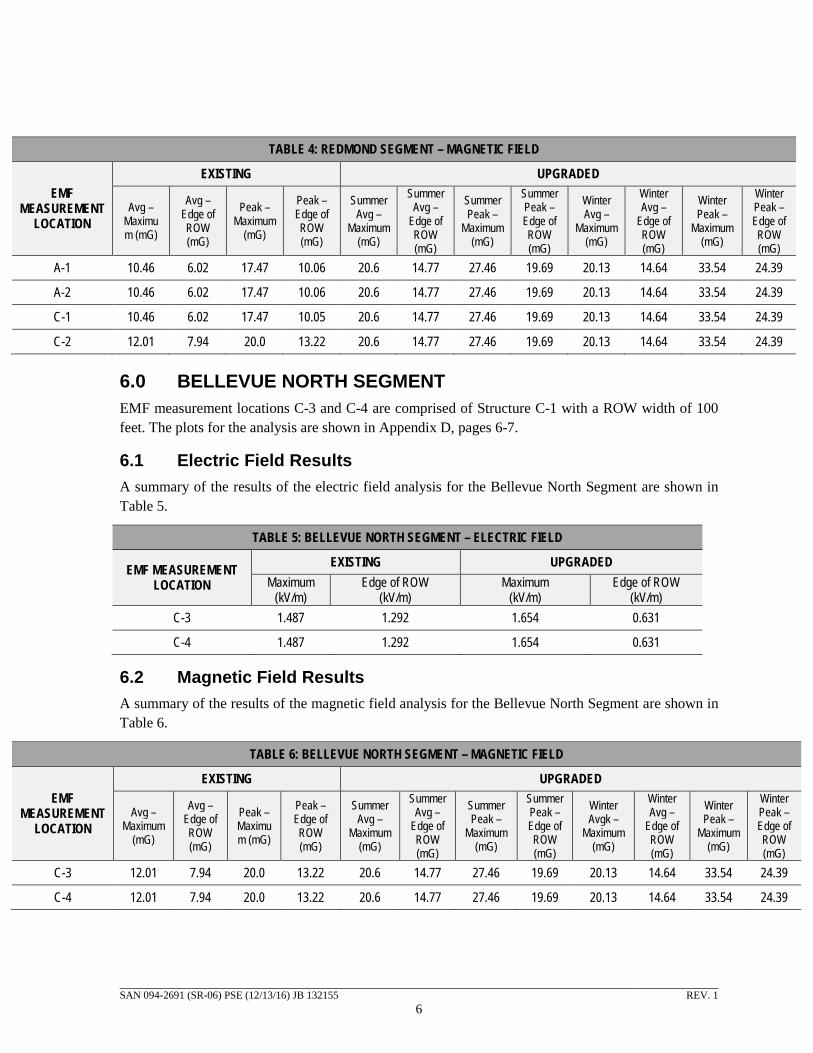
6.0 BELLEVUE NORTH SEGMENT EMF measurement locations C-3 and C-4 are comprised of Structure C-1 with a ROW width of 100 feet. The plots for the analysis are shown in Appendix D, pages 6-7.
6.1 Electric Field Results A summary of the results of the electric field analysis for the Bellevue North Segment are shown in Table 5.
TABLE 5: BELLEVUE NORTH SEGMENT – ELECTRIC FIELD
EMF MEASUREMENT LOCATION
EXISTING UPGRADED Maximum
(kV/m) Edge of ROW
(kV/m) Maximum
(kV/m) Edge of ROW
(kV/m) C-3 1.487 1.292 1.654 0.631
C-4 1.487 1.292 1.654 0.631
6.2 Magnetic Field Results A summary of the results of the magnetic field analysis for the Bellevue North Segment are shown in Table 6.
TABLE 6: BELLEVUE NORTH SEGMENT – MAGNETIC FIELD
EMF MEASUREMENT
LOCATION
EXISTING UPGRADED
Avg –Maximum
(mG)
Avg –Edge of ROW (mG)
Peak –Maximum (mG)
Peak –Edge of ROW (mG)
Summer Avg –
Maximum (mG)
Summer Avg –
Edge of ROW (mG)
Summer Peak –
Maximum (mG)
Summer Peak –Edge of ROW (mG)
Winter Avgk –
Maximum (mG)
Winter Avg –
Edge of ROW (mG)
Winter Peak –
Maximum (mG)
Winter Peak –Edge of ROW (mG)
C-3 12.01 7.94 20.0 13.22 20.6 14.77 27.46 19.69 20.13 14.64 33.54 24.39
C-4 12.01 7.94 20.0 13.22 20.6 14.77 27.46 19.69 20.13 14.64 33.54 24.39

SAN 094-2691 (SR-06) PSE (12/13/16) JB 132155 REV. 1 7
7.0 BELLEVUE CENTRAL SEGMENT 7.1 Corridor EMF measurement locations E-1, E-2, and E-3 are comprised of Structure C-1 with a ROW width of 100 feet. The plots for the analysis are shown in Appendix D, pages 8-10.
7.1.1 Electric Field Results A summary of the results of the electric field analysis for the Bellevue Central Corridor Segment are shown in Table 7.
TABLE 7: BELLEVUE CENTRAL CORRIDOR SEGMENT – ELECTRIC FIELD
EMF MEASUREMENT LOCATION
EXISTING UPGRADED Maximum
(kV/m) Edge of ROW
(kV/m) Maximum
(kV/m) Edge of ROW
(kV/m) E-1 1.487 1.292 1.654 0.631
E-2 1.487 1.292 1.654 0.631
E-3 1.487 1.292 1.654 0.631
7.1.2 Magnetic Field Results A summary of the results of the magnetic field analysis for the Bellevue Central Corridor Segment are shown in Table 8.
TABLE 8: BELLEVUE CENTRAL CORRIDOR SEGMENT – MAGNETIC FIELD
EMF MEASUREMENT
LOCATION
EXISTING UPGRADED
Avg –Maximum
(mG)
Avg –Edge of ROW (mG)
Peak –Maximum
(mG)
Peak –Edge of ROW (mG)
Summer Avg –
Maximum (mG)
Summer Avg –
Edge of ROW (mG)
Summer Peak –
Maximum (mG)
Summer Peak –Edge of ROW (mG)
Winter Avgk –
Maximum (mG)
Winter Avg –
Edge of ROW (mG)
Winter Peak –
Maximum (mG)
Winter Peak –Edge of ROW (mG)
E-1 12.01 7.94 20.0 13.22 20.6 14.77 27.46 19.69 20.13 14.64 33.54 24.39
E-2 12.01 7.94 20.0 13.22 20.6 14.77 27.46 19.69 20.13 14.64 33.54 24.39
E-3 12.01 7.94 20.0 13.22 20.6 14.77 27.46 19.69 20.13 14.64 33.54 24.39
7.2 Bypass EMF measurement locations Bypass-1, Bypass-2, F-1, Bypass-3, and Bypass-4 are comprised of Structure R-1 with a ROW width of 30 feet. The plots for the analysis are shown in Appendix D, pages 11-15.
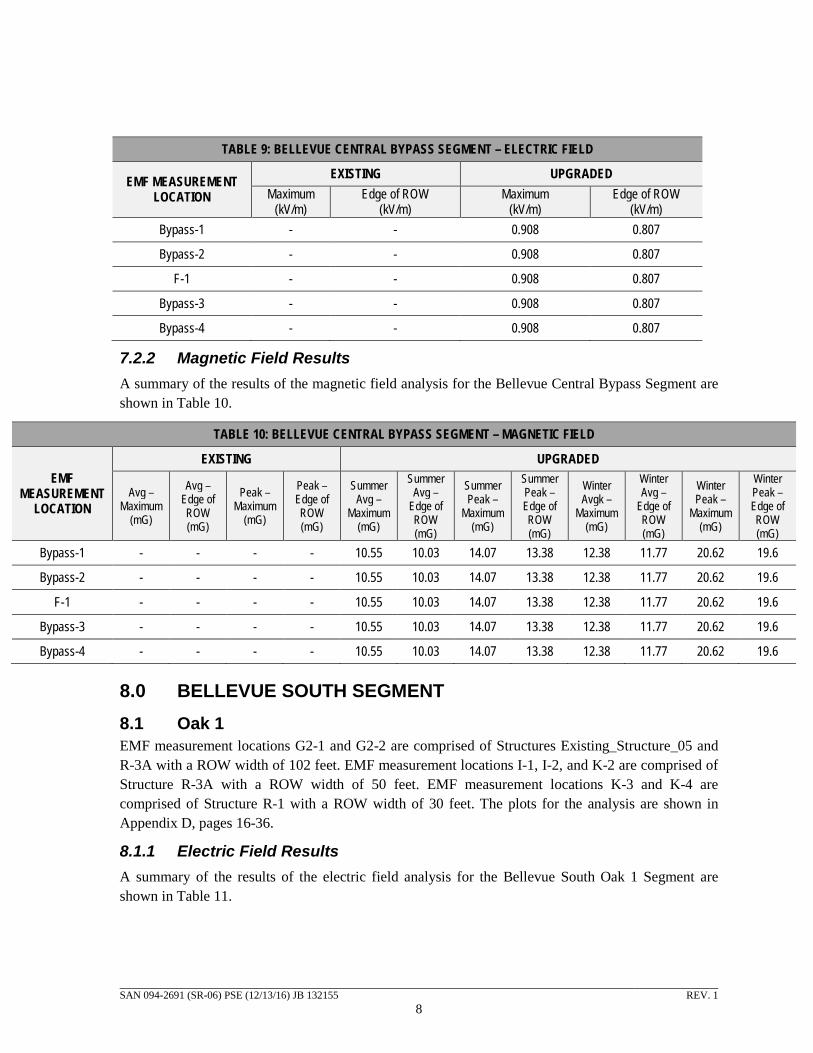
7.2.1 Electric Field Results A summary of the results of the electric field analysis for the Bellevue Central Bypass Segment are shown in Table 9.
SAN 094-2691 (SR-06) PSE (12/13/16) JB 132155 REV. 1 8
TABLE 9: BELLEVUE CENTRAL BYPASS SEGMENT – ELECTRIC FIELD
EMF MEASUREMENT LOCATION
EXISTING UPGRADED Maximum
(kV/m) Edge of ROW
(kV/m) Maximum
(kV/m) Edge of ROW
(kV/m) Bypass-1 - - 0.908 0.807
Bypass-2 - - 0.908 0.807
F-1 - - 0.908 0.807
Bypass-3 - - 0.908 0.807
Bypass-4 - - 0.908 0.807
7.2.2 Magnetic Field Results A summary of the results of the magnetic field analysis for the Bellevue Central Bypass Segment are shown in Table 10.
TABLE 10: BELLEVUE CENTRAL BYPASS SEGMENT – MAGNETIC FIELD
EMF MEASUREMENT
LOCATION
EXISTING UPGRADED
Avg –Maximum
(mG)
Avg –Edge of ROW (mG)
Peak –Maximum
(mG)
Peak –Edge of ROW (mG)
Summer Avg –
Maximum (mG)
Summer Avg –
Edge of ROW (mG)
Summer Peak –
Maximum (mG)
Summer Peak –Edge of ROW (mG)
Winter Avgk –
Maximum (mG)
Winter Avg –
Edge of ROW (mG)
Winter Peak –
Maximum (mG)
Winter Peak –Edge of ROW (mG)
Bypass-1 - - - - 10.55 10.03 14.07 13.38 12.38 11.77 20.62 19.6
Bypass-2 - - - - 10.55 10.03 14.07 13.38 12.38 11.77 20.62 19.6
F-1 - - - - 10.55 10.03 14.07 13.38 12.38 11.77 20.62 19.6
Bypass-3 - - - - 10.55 10.03 14.07 13.38 12.38 11.77 20.62 19.6
Bypass-4 - - - - 10.55 10.03 14.07 13.38 12.38 11.77 20.62 19.6
8.0 BELLEVUE SOUTH SEGMENT 8.1 Oak 1 EMF measurement locations G2-1 and G2-2 are comprised of Structures Existing_Structure_05 and R-3A with a ROW width of 102 feet. EMF measurement locations I-1, I-2, and K-2 are comprised of Structure R-3A with a ROW width of 50 feet. EMF measurement locations K-3 and K-4 are comprised of Structure R-1 with a ROW width of 30 feet. The plots for the analysis are shown in Appendix D, pages 16-36.
8.1.1 Electric Field Results A summary of the results of the electric field analysis for the Bellevue South Oak 1 Segment are shown in Table 11.

SAN 094-2691 (SR-06) PSE (12/13/16) JB 132155 REV. 1 9
TABLE 11: BELLEVUE SOUTH OAK 1 SEGMENT – ELECTRIC FIELD
EMF MEASUREMENT LOCATION
EXISTING UPGRADED Maximum
(kV/m) Edge of ROW
(kV/m) Maximum
(kV/m) Edge of ROW
(kV/m) G2-1 0.793 0.522 3.08 1.534
G2-2 0.793 0.522 3.08 1.534
I-1 0.645 0.423 3.054 1.653
I-2 0.645 0.423 3.054 1.653
K-2 0.645 0.423 3.054 1.653
K-3 - - 3.054 1.653
K-4 - - 3.054 1.653
8.1.2 Magnetic Field Results A summary of the results of the magnetic field analysis for the Bellevue South Oak 1 Segment are shown in Table 12.
TABLE 12: BELLEVUE SOUTH OAK 1 SEGMENT – MAGNETIC FIELD
EMF MEASUREMENT
LOCATION
EXISTING UPGRADED
Avg –Maximum
(mG)
Avg –Edge of ROW (mG)
Peak –Maximum
(mG)
Peak –Edge of ROW (mG)
Summer Avg –
Maximum (mG)
Summer Avg –
Edge of ROW (mG)
Summer Peak –
Maximum (mG)
Summer Peak –Edge of ROW (mG)
Winter Avgk –
Maximum (mG)
Winter Avg –
Edge of ROW (mG)
Winter Peak –
Maximum (mG)
Winter Peak –Edge of ROW (mG)
G2-1 14.78 10.65 24.59 17.71 14.76 13.17 19.65 17.52 94.69 78.08 157.73 125.73
G2-2 14.78 10.65 24.59 17.71 14.76 13.17 19.65 17.52 94.69 78.08 157.73 125.73
I-1 11.76 5.79 19.56 9.64 15.13 12.41 20.14 16.51 96.81 76.51 161.27 127.46
I-2 11.76 5.79 19.56 9.64 15.13 12.41 20.14 16.51 96.81 76.51 161.27 127.46
K-2 3.02 1.49 5.02 2.47 15.13 12.41 20.14 16.51 96.81 76.51 161.27 127.46
K-3 - - - - 15.13 12.41 20.14 16.51 96.81 76.51 161.27 127.46
K-4 - - - - 15.13 12.41 20.14 16.51 96.81 76.51 161.27 127.46
8.2 Oak 2 EMF measurement locations G2-1 and G2-2 are comprised of Structures Existing_Structure_05 and R-3A with a ROW width of 102 feet. EMF measurement location I-1 is comprised of Structure R-3A with a ROW width of 50 feet. EMF measurement locations I-2, K-2, K-3, and K-4 are comprised of Structure R-1 with a ROW width of 30 feet. EMF measurement locations J-1, J-2, and J-3 are comprised of Structure C-10B with a ROW of 100 feet. The plots for the analysis are shown in Appendix D, pages 16-36.

SAN 094-2691 (SR-06) PSE (12/13/16) JB 132155 REV. 1 10
8.2.1 Electric Field Results A summary of the results of the electric field analysis for the Bellevue South Oak 2 Segment are shown in Table 13.
TABLE 13: BELLEVUE SOUTH OAK 2 SEGMENT – ELECTRIC FIELD
EMF MEASUREMENT LOCATION
EXISTING UPGRADED Maximum
(kV/m) Edge of ROW
(kV/m) Maximum
(kV/m) Edge of ROW
(kV/m) G2-1 0.793 0.522 3.08 1.534
G2-2 0.793 0.522 3.08 1.534
I-1 0.645 0.423 1.957 1.159
I-2 0.645 0.585 0.939 0.716
J-1 1.487 1.292 1.686 1.407
J-2 1.487 1.292 1.686 1.407
J-3 1.487 1.292 1.686 1.407
K-2 0.645 0.585 0.939 0.716
K-3 - - 0.939 0.716
K-4 - - 0.939 0.716
8.2.2 Magnetic Field Results A summary of the results of the magnetic field analysis for the Bellevue South Oak 2 Segment are shown in Table 14.
TABLE 14: BELLEVUE SOUTH OAK 2 SEGMENT – MAGNETIC FIELD
EMF MEASUREMENT
LOCATION
EXISTING UPGRADED
Avg –Maximum
(mG)
Avg –Edge of ROW (mG)
Peak –Maximum
(mG)
Peak –Edge of ROW (mG)
Summer Avg –
Maximum (mG)
Summer Avg –
Edge of ROW (mG)
Summer Peak –
Maximum (mG)
Summer Peak –Edge of ROW (mG)
Winter Avgk –
Maximum (mG)
Winter Avg –
Edge of ROW (mG)
Winter Peak –
Maximum (mG)
Winter Peak –Edge of ROW (mG)
G2-1 14.78 10.65 24.59 17.71 14.76 13.17 19.65 17.52 94.69 78.08 157.73 125.73
G2-2 14.78 10.65 24.59 17.71 14.76 13.17 19.65 17.52 94.69 78.08 157.73 125.73
I-1 11.76 5.79 19.56 9.64 14.36 11.92 19.04 15.8 64.8 53.79 107.88 89.55
I-2 11.76 5.79 19.56 9.64 6.40 5.70 8.48 7.56 28.87 25.73 48.06 42.84
J-1 99.42 67.58 165.59 112.55 11.35 6.29 15.17 8.41 88.40 49.02 147.3 81.68
J-2 99.42 67.58 165.59 112.55 11.35 6.29 15.17 8.41 88.40 49.02 147.3 81.68
J-3 99.42 67.58 165.59 112.55 11.35 6.29 15.17 8.41 88.40 49.02 147.3 81.68

SAN 094-2691 (SR-06) PSE (12/13/16) JB 132155 REV. 1 11
TABLE 14: BELLEVUE SOUTH OAK 2 SEGMENT – MAGNETIC FIELD
EMF MEASUREMENT
LOCATION
EXISTING UPGRADED
Avg –Maximum
(mG)
Avg –Edge of ROW (mG)
Peak –Maximum
(mG)
Peak –Edge of ROW (mG)
Summer Avg –
Maximum (mG)
Summer Avg –
Edge of ROW (mG)
Summer Peak –
Maximum (mG)
Summer Peak –Edge of ROW (mG)
Winter Avgk –
Maximum (mG)
Winter Avg –
Edge of ROW (mG)
Winter Peak –
Maximum (mG)
Winter Peak –Edge of ROW (mG)
K-2 3.02 1.49 5.02 2.47 6.40 5.70 8.48 7.56 28.87 25.73 48.06 42.84
K-3 - - - - 6.40 5.70 8.48 7.56 28.87 25.73 48.06 42.84
K-4 - - - - 6.40 5.70 8.48 7.56 28.87 25.73 48.06 42.84
8.3 Willow 1 EMF measurement location J-1 is comprised of Structure C-1 with a ROW width of 100 feet. EMF measurement locations J-2 and J-3 are comprised of Structure C-13 with a ROW width of 100 feet. The plots for the analysis are shown in Appendix D, pages 16-36.
8.3.1 Electric Field Results A summary of the results of the electric field analysis for the Bellevue South Willow 1 Segment are shown in Table 15.
TABLE 15: BELLEVUE SOUTH WILLOW 1 SEGMENT – ELECTRIC FIELD
EMF MEASUREMENT LOCATION
EXISTING UPGRADED Maximum
(kV/m) Edge of ROW
(kV/m) Maximum
(kV/m) Edge of ROW
(kV/m) J-1 1.487 1.292 1.654 0.631
J-2 1.487 1.292 0.965 0.838
J-3 1.487 1.292 0.965 0.838
8.3.2 Magnetic Field Results A summary of the results of the magnetic field analysis for the Bellevue South Willow 1 Segment are shown in Table 16.
TABLE 16: BELLEVUE SOUTH WILLOW 1 SEGMENT – MAGNETIC FIELD
EMF MEASUREMENT
LOCATION
EXISTING UPGRADED
Avg –Maximum
(mG)
Avg –Edge of ROW (mG)
Peak –Maximum
(mG)
Peak –Edge of ROW (mG)
Summer Avg –
Maximum (mG)
Summer Avg –
Edge of ROW (mG)
Summer Peak –
Maximum (mG)
Summer Peak –Edge of ROW (mG)
Winter Avgk –
Maximum (mG)
Winter Avg –
Edge of ROW (mG)
Winter Peak –
Maximum (mG)
Winter Peak –Edge of ROW (mG)
J-1 99.42 67.58 165.59 112.55 7.62 5.26 10.14 7.02 48.94 35.09 81.53 58.46
J-2 99.42 67.58 165.59 112.55 2.76 2.66 3.68 3.56 23.38 21.54 38.97 35.89
J-3 99.42 67.58 165.59 112.55 2.76 2.66 3.68 3.56 23.38 21.54 38.97 35.89

SAN 094-2691 (SR-06) PSE (12/13/16) JB 132155 REV. 1 12
8.4 Willow 2 EMF measurement location I-2 is comprised of Structure R-3A with a ROW width of 50 feet. EMF measurement locations K-2, K-3, K-4, P-1, and P-2 are comprised of Structure R-1 with a ROW width of 30 feet. EMF measurement locations J-1, J-2, and J-3 are comprised of Structure C-10B with a ROW width of 100 feet. The plots for the analysis are shown in Appendix D, pages 16-36.
8.4.1 Electric Field Results A summary of the results of the electric field analysis for the Bellevue South Willow 2 Segment are shown in Table 17.
TABLE 17: BELLEVUE SOUTH WILLOW 2 SEGMENT – ELECTRIC FIELD
EMF MEASUREMENT LOCATION
EXISTING UPGRADED Maximum
(kV/m) Edge of ROW
(kV/m) Maximum
(kV/m) Edge of ROW
(kV/m) I-2 0.645 0.585 1.957 1.159
J-1 1.487 1.292 1.686 1.407
J-2 1.487 1.292 1.686 1.407
J-3 1.487 1.292 1.686 1.407
K-2 0.645 0.585 0.939 0.716
K-3 - - 0.939 0.716
K-4 - - 0.939 0.716
P-1 - - 0.939 0.716
P-2 - - 0.939 0.716
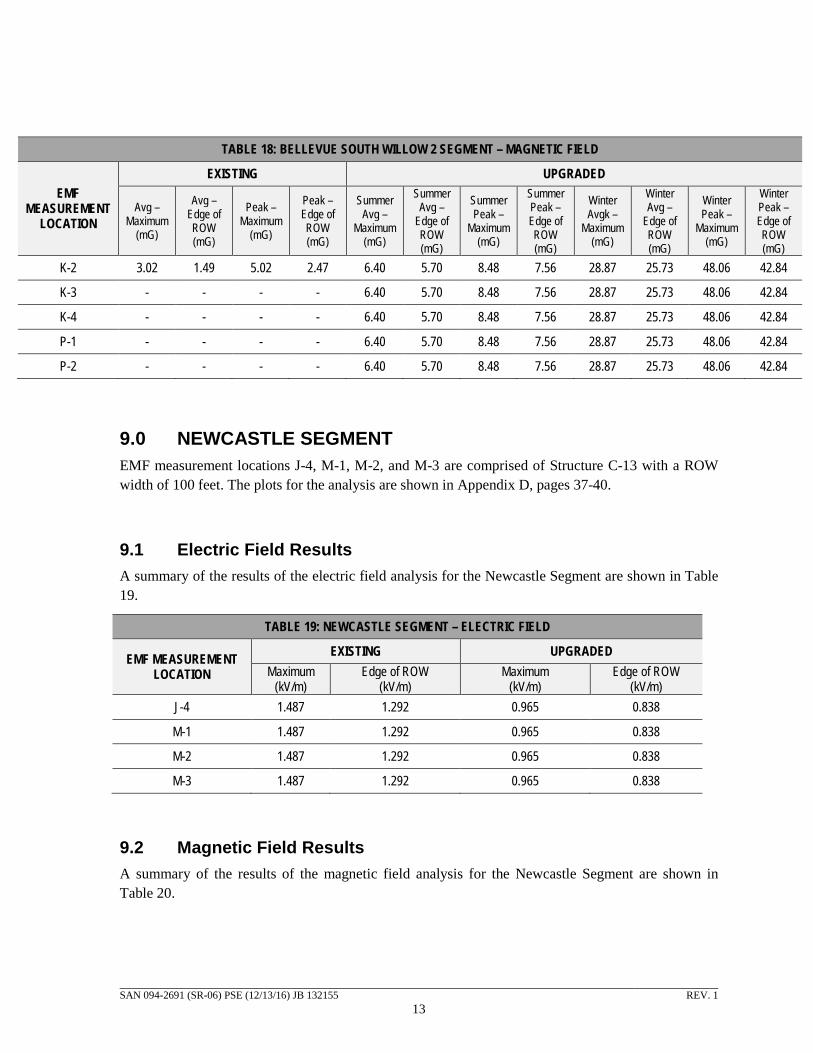
8.4.2 Magnetic Field Results A summary of the results of the magnetic field analysis for the Bellevue South Willow 2 Segment are shown in Table 18.
TABLE 18: BELLEVUE SOUTH WILLOW 2 SEGMENT – MAGNETIC FIELD
EMF MEASUREMENT
LOCATION
EXISTING UPGRADED
Avg –Maximum
(mG)
Avg –Edge of ROW (mG)
Peak –Maximum
(mG)
Peak –Edge of ROW (mG)
Summer Avg –
Maximum (mG)
Summer Avg –
Edge of ROW (mG)
Summer Peak –
Maximum (mG)
Summer Peak –Edge of ROW (mG)
Winter Avgk –
Maximum (mG)
Winter Avg –
Edge of ROW (mG)
Winter Peak –
Maximum (mG)
Winter Peak –Edge of ROW (mG)
I-2 11.76 5.79 19.56 9.64 14.36 11.92 19.04 15.8 64.80 53.79 107.88 89.55
J-1 99.42 67.58 165.59 112.55 11.35 6.29 15.17 8.41 88.40 49.02 147.3 81.68
J-2 99.42 67.58 165.59 112.55 11.35 6.29 15.17 8.41 88.40 49.02 147.3 81.68
J-3 99.42 67.58 165.59 112.55 11.35 6.29 15.17 8.41 88.40 49.02 147.3 81.68
SAN 094-2691 (SR-06) PSE (12/13/16) JB 132155 REV. 1 13
TABLE 18: BELLEVUE SOUTH WILLOW 2 SEGMENT – MAGNETIC FIELD
EMF MEASUREMENT
LOCATION
EXISTING UPGRADED
Avg –Maximum
(mG)
Avg –Edge of ROW (mG)
Peak –Maximum
(mG)
Peak –Edge of ROW (mG)
Summer Avg –
Maximum (mG)
Summer Avg –
Edge of ROW (mG)
Summer Peak –
Maximum (mG)
Summer Peak –Edge of ROW (mG)
Winter Avgk –
Maximum (mG)
Winter Avg –
Edge of ROW (mG)
Winter Peak –
Maximum (mG)
Winter Peak –Edge of ROW (mG)
K-2 3.02 1.49 5.02 2.47 6.40 5.70 8.48 7.56 28.87 25.73 48.06 42.84
K-3 - - - - 6.40 5.70 8.48 7.56 28.87 25.73 48.06 42.84
K-4 - - - - 6.40 5.70 8.48 7.56 28.87 25.73 48.06 42.84
P-1 - - - - 6.40 5.70 8.48 7.56 28.87 25.73 48.06 42.84
P-2 - - - - 6.40 5.70 8.48 7.56 28.87 25.73 48.06 42.84
9.0 NEWCASTLE SEGMENT EMF measurement locations J-4, M-1, M-2, and M-3 are comprised of Structure C-13 with a ROW width of 100 feet. The plots for the analysis are shown in Appendix D, pages 37-40.
9.1 Electric Field Results A summary of the results of the electric field analysis for the Newcastle Segment are shown in Table 19.
TABLE 19: NEWCASTLE SEGMENT – ELECTRIC FIELD
EMF MEASUREMENT LOCATION
EXISTING UPGRADED Maximum
(kV/m) Edge of ROW
(kV/m) Maximum
(kV/m) Edge of ROW
(kV/m) J-4 1.487 1.292 0.965 0.838
M-1 1.487 1.292 0.965 0.838
M-2 1.487 1.292 0.965 0.838
M-3 1.487 1.292 0.965 0.838
9.2 Magnetic Field Results A summary of the results of the magnetic field analysis for the Newcastle Segment are shown in Table 20.

SAN 094-2691 (SR-06) PSE (12/13/16) JB 132155 REV. 1 14
TABLE 20: NEWCASTLE SEGMENT – MAGNETIC FIELD
EMF MEASUREMENT
LOCATION
EXISTING UPGRADED
Avg –Maximum
(mG)
Avg –Edge of ROW (mG)
Peak –Maximum
(mG)
Peak –Edge of ROW (mG)
Summer Avg –
Maximum (mG)
Summer Avg –
Edge of ROW (mG)
Summer Peak –
Maximum (mG)
Summer Peak –Edge of ROW (mG)
Winter Avgk –
Maximum (mG)
Winter Avg –
Edge of ROW (mG)
Winter Peak –
Maximum (mG)
Winter Peak –Edge of ROW (mG)
J-4 99.42 67.58 165.59 112.55 2.76 2.66 3.68 3.56 23.38 21.54 38.97 35.89
M-1 99.42 67.58 165.59 112.55 2.76 2.66 3.68 3.56 23.38 21.54 38.97 35.89
M-2 99.42 67.58 165.59 112.55 2.76 2.66 3.68 3.56 23.38 21.54 38.97 35.89
M-3 99.42 67.58 165.59 112.55 2.76 2.66 3.68 3.56 23.38 21.54 38.97 35.89
10.0 RENTON SEGMENT EMF measurement locations M-4, M-5, N-1, and N-2 are comprised of structure C-1 with a ROW width of 100 feet. The plots for the analysis are shown in Appendix D, pages 41-44.
10.1 Electric Field Results A summary of the results of the electric field analysis for the Renton Segment are shown in Table 21.
TABLE 21: RENTON SEGMENT – ELECTRIC FIELD
EMF MEASUREMENT LOCATION
EXISTING UPGRADED Maximum
(kV/m) Edge of ROW
(kV/m) Maximum
(kV/m) Edge of ROW
(kV/m) M-4 1.487 1.292 1.654 0.631
M-5 1.487 1.292 1.654 0.631
N-1 1.85 1.465 1.654 0.631
N-2 1.771 1.457 1.654 0.631

SAN 094-2691 (SR-06) PSE (12/13/16) JB 132155 REV. 1 15
10.2 Magnetic Field Results A summary of the results of the magnetic field analysis for the Renton Segment are shown in Table 22.
TABLE 22: RENTON SEGMENT – MAGNETIC FIELD
EMF MEASUREMENT
LOCATION
EXISTING UPGRADED
Avg –Maximum
(mG)
Avg –Edge of ROW (mG)
Peak –Maximum
(mG)
Peak –Edge of ROW (mG)
Summer Avg –
Maximum (mG)
Summer Avg –
Edge of ROW (mG)
Summer Peak –
Maximum (mG)
Summer Peak –Edge of ROW (mG)
Winter Avgk –
Maximum (mG)
Winter Avg –
Edge of ROW (mG)
Winter Peak –
Maximum (mG)
Winter Peak –Edge of ROW (mG)
M-4 99.42 67.58 165.59 112.55 20.6 14.77 27.46 19.69 20.13 14.64 33.54 24.39
M-5 99.42 67.58 165.59 112.55 20.6 14.77 27.46 19.69 20.13 14.64 33.54 24.39
N-1 132.71 80.70 220.82 134.39 20.6 14.77 27.46 19.69 20.13 14.64 33.54 24.39
N-2 122.94 85.64 204.76 142.66 20.6 14.77 27.46 19.69 20.13 14.64 33.54 24.39

APPENDIX A – ANALYSIS DATA
SAN 094-2691 (SR-06) PSE (12/13/16) JB 132155 A-1 REV. 1

Case Title ExistingAvg_A-1 ExistingAvg_A-1 ExistingAvg_A-2 ExistingAvg_A-2 ExistingAvg_C-1 ExistingAvg_C-1 ExistingAvg_C-2Structure # 1 2 1 2 1 2 1
Line # 1 1 1 1 1 1 1Conductor Size ACSR 795 kcmil Tern ACSR 795 kcmil Tern ACSR 795 kcmil Tern ACSR 795 kcmil Tern ACSR 795 kcmil Tern ACSR 795 kcmil Tern ACSR 795 kcmil Tern
Line Current 5.0 49.0 5.0 49.0 5.0 49.0 60.0Structure Existing_Str_01 Existing_Str_01 Existing_Str_01 Existing_Str_01 Existing_Str_01 Existing_Str_01 Existing_Str_01
Analysis Profile Width 100 100 100 100 100 100 100Distance From Left Side of
Analysis Profile to Str Centerline 75 25 75 25 75 25 75
Nominal L-L Voltage 115 kV 115 kV 115 kV 115 kV 115 kV 115 kV 115 kVMax Votlage 105.0% 105.0% 105.0% 105.0% 105.0% 105.0% 105.0%
Case Title ExistingAvg_C-2 ExistingAvg_C-3 ExistingAvg_C-3 ExistingAvg_C-4 ExistingAvg_C-4 ExistingAvg_E-1 ExistingAvg_E-1Structure # 2 1 2 1 2 1 2
Line # 1 1 1 1 1 1 1Conductor Size ACSR 795 kcmil Tern ACSR 795 kcmil Tern ACSR 795 kcmil Tern ACSR 795 kcmil Tern ACSR 795 kcmil Tern ACSR 795 kcmil Tern ACSR 795 kcmil Tern
Line Current 49.0 60.0 49.0 60.0 49.0 60.0 49.0Structure Existing_Str_01 Existing_Str_01 Existing_Str_01 Existing_Str_01 Existing_Str_01 Existing_Str_01 Existing_Str_01
Analysis Profile Width 100 100 100 100 100 100 100Distance From Left Side of
Analysis Profile to Str Centerline 25 75 25 75 25 75 25
Nominal L-L Voltage 115 kV 115 kV 115 kV 115 kV 115 kV 115 kV 115 kVMax Votlage 105.0% 105.0% 105.0% 105.0% 105.0% 105.0% 105.0%
Case Title ExistingAvg_E-2 ExistingAvg_E-2 ExistingAvg_E-3 ExistingAvg_E-3 ExistingAvg_G2-1 ExistingAvg_G2-1 ExistingAvg_G2-2Structure # 1 2 1 2 1 2 1
Line # 1 1 1 1 1 1 1Conductor Size ACSR 795 kcmil Tern ACSR 795 kcmil Tern ACSR 795 kcmil Tern ACSR 795 kcmil Tern ACSR 795 kcmil Tern ACSR 795 kcmil Tern ACSR 795 kcmil Tern
Line Current 60.0 49.0 60.0 49.0 211.0 216.0 211.0Structure Existing_Str_01 Existing_Str_01 Existing_Str_01 Existing_Str_01 Existing_Str_05 Existing_Str_05 Existing_Str_05
Analysis Profile Width 100 100 100 100 100 100 100Distance From Left Side of
Analysis Profile to Str Centerline 75 25 75 25 75 25 75
Nominal L-L Voltage 115 kV 115 kV 115 kV 115 kV 115 kV 115 kV 115 kVMax Votlage 105.0% 105.0% 105.0% 105.0% 105% 105% 105%
Case Title ExistingAvg_G2-2 ExistingAvg_I-1 ExistingAvg_I-2 ExistingAvg_J-1 ExistingAvg_J-1 ExistingAvg_J-2 ExistingAvg_J-2Structure # 2 1 1 1 2 1 2
Line # 1 1 1 1 1 1 1Conductor Size ACSR 795 kcmil Tern ACSR 795 kcmil Tern ACSR 795 kcmil Tern ACSR 795 kcmil Tern ACSR 795 kcmil Tern ACSR 795 kcmil Tern ACSR 795 kcmil Tern
Line Current 216.0 214.0 214.0 501.0 500.0 501.0 500.0Structure Existing_Str_05 Existing_Str_06 Existing_Str_06 Existing_Str_01 Existing_Str_01 Existing_Str_01 Existing_Str_01
Analysis Profile Width 100 100 100 100 100 100 100Distance From Left Side of
Analysis Profile to Str Centerline 25 50 50 75 25 75 25
Nominal L-L Voltage 115 kV 115 kV 115 kV 115 kV 115 kV 115 kV 115 kVMax Votlage 105% 105% 105% 105% 105% 105% 105%
SAN 094-2691 (SR-06) PSE (12/13/16) JB 132155 A-2 REV. 1

Case Title ExistingAvg_J-3 ExistingAvg_J-3 ExistingAvg_J-4 ExistingAvg_J-4 ExistingAvg_K-2 ExistingAvg_M-1 ExistingAvg_M-1Structure # 1 2 1 2 1 1 2
Line # 1 1 1 1 1 1 1Conductor Size ACSR 795 kcmil Tern ACSR 795 kcmil Tern ACSR 795 kcmil Tern ACSR 795 kcmil Tern ACSR 795 kcmil Tern ACSR 795 kcmil Tern ACSR 795 kcmil Tern
Line Current 501.0 500.0 501.0 500.0 55.0 501.0 500.0Structure Existing_Str_01 Existing_Str_01 Existing_Str_01 Existing_Str_01 Existing_Str_08 Existing_Str_01 Existing_Str_01
Analysis Profile Width 100 100 100 100 100 100 100Distance From Left Side of
Analysis Profile to Str Centerline 75 25 75 25 50 75 25
Nominal L-L Voltage 115 kV 115 kV 115 kV 115 kV 115 kV 115 kV 115 kVMax Votlage 105% 105% 105% 105% 105% 105% 105%
Case Title ExistingAvg_M-2 ExistingAvg_M-2 ExistingAvg_M-3 ExistingAvg_M-3 ExistingAvg_M-4 ExistingAvg_M-4 ExistingAvg_M-5Structure # 1 2 1 2 1 2 1
Line # 1 1 1 1 1 1 1Conductor Size ACSR 795 kcmil Tern ACSR 795 kcmil Tern ACSR 795 kcmil Tern ACSR 795 kcmil Tern ACSR 795 kcmil Tern ACSR 795 kcmil Tern ACSR 795 kcmil Tern
Line Current 501.0 500.0 501.0 500.0 501.0 500.0 501.0Structure Existing_Str_01 Existing_Str_01 Existing_Str_01 Existing_Str_01 Existing_Str_01 Existing_Str_01 Existing_Str_01
Analysis Profile Width 100 100 100 100 100 100 100Distance From Left Side of
Analysis Profile to Str Centerline 75 25 75 25 75 25 75
Nominal L-L Voltage 115 kV 115 kV 115 kV 115 kV 115 kV 115 kV 115 kVMax Votlage 105% 105% 105% 105% 105% 105% 105%
Case Title ExistingAvg_M-5 ExistingAvg_N-1 ExistingAvg_N-1 ExistingAvg_N-1 ExistingAvg_N-2 ExistingAvg_N-2 ExistingAvg_N-2Structure # 2 1 2 3 1 2 3
Line # 1 1 1 1 1 1 1Conductor Size ACSR 795 kcmil Tern ACSR 795 kcmil Tern ACSR 795 kcmil Tern ACSR 795 kcmil Tern ACSR 795 kcmil Tern ACSR 795 kcmil Tern ACSR 795 kcmil Tern
Line Current 500.0 501.0 500.0 380.0 501.0 500.0 380.0Structure Existing_Str_01 Existing_Str_01 Existing_Str_01 Existing_Str_09 Existing_Str_01 Existing_Str_01 Existing_Str_01
Analysis Profile Width 100 100 100 100 100 100 100Distance From Left Side of
Analysis Profile to Str Centerline 25 75 50 25 75 50 25
Nominal L-L Voltage 115 kV 115 kV 115 kV 115 kV 115 kV 115 kV 115 kVMax Votlage 105% 105% 105% 105% 105% 105% 105%
SAN 094-2691 (SR-06) PSE (12/13/16) JB 132155 A-3 REV. 1

Case Title A1-Summer.Avg A1-Summer.Avg A1-Summer.Peak A1-Summer.Peak A1-Winter.Avg A1-Winter.Avg A1-Winter.Peak A1-Winter.PeakStructure # 1 1 1 1 1 1 1 1
Line # 1 2 1 2 1 2 1 2Conductor Size ACSS 1590 kcmil Falcon ACSS 1590 kcmil Falcon ACSS 1590 kcmil Falcon ACSS 1590 kcmil Falcon ACSS 1590 kcmil Falcon ACSS 1590 kcmil Falcon ACSS 1590 kcmil Falcon ACSS 1590 kcmil Falcon
Line Current 311 164 415 218 365 60 608 100Structure C_1_Line1 C_1_Line2 C_1_Line1 C_1_Line2 C_1_Line1 C_1_Line2 C_1_Line1 C_1_Line2
Analysis Profile Width 100 ft 100 ft 100 ft 100 ft 100 ft 100 ft 100 ft 100 ftDistance From Left Side of
Analysis Profile to Str Centerline 50 ft 50 ft 50 ft 50 ft 50 ft 50 ft 50 ft 50 ft
Nominal L-L Voltage 230 kV 115 kV 230 kV 115 kV 230 kV 115 kV 230 kV 115 kVMax Votlage 105% 105% 105% 105% 105% 105% 105% 105%
Case Title A2-Summer.Avg A2-Summer.Avg A2-Summer.Peak A2-Summer.Peak A2-Winter.Avg A2-Winter.Avg A2-Winter.Peak A2-Winter.PeakStructure # 1 1 1 1 1 1 1 1
Line # 1 2 1 2 1 2 1 2Conductor Size ACSS 1590 kcmil Falcon ACSS 1590 kcmil Falcon ACSS 1590 kcmil Falcon ACSS 1590 kcmil Falcon ACSS 1590 kcmil Falcon ACSS 1590 kcmil Falcon ACSS 1590 kcmil Falcon ACSS 1590 kcmil Falcon
Line Current 311 164 415 218 365 60 608 100Structure C_1_Line1 C_1_Line2 C_1_Line1 C_1_Line2 C_1_Line1 C_1_Line2 C_1_Line1 C_1_Line2
Analysis Profile Width 100 ft 100 ft 100 ft 100 ft 100 ft 100 ft 100 ft 100 ftDistance From Left Side of
Analysis Profile to Str Centerline 50 ft 50 ft 50 ft 50 ft 50 ft 50 ft 50 ft 50 ft
Nominal L-L Voltage 230 kV 115 kV 230 kV 115 kV 230 kV 115 kV 230 kV 115 kVMax Votlage 105% 105% 105% 105% 105% 105% 105% 105%
Case Title C1-Summer.Avg C1-Summer.Avg C1-Summer.Peak C1-Summer.Peak C1-Winter.Avg C1-Winter.Avg C1-Winter.Peak C1-Winter.PeakStructure # 1 1 1 1 1 1 1 1
Line # 1 2 1 2 1 2 1 2Conductor Size ACSS 1590 kcmil Falcon ACSS 1590 kcmil Falcon ACSS 1590 kcmil Falcon ACSS 1590 kcmil Falcon ACSS 1590 kcmil Falcon ACSS 1590 kcmil Falcon ACSS 1590 kcmil Falcon ACSS 1590 kcmil Falcon
Line Current 311 164 415 218 365 60 608 100Structure C_1_Line1 C_1_Line2 C_1_Line1 C_1_Line2 C_1_Line1 C_1_Line2 C_1_Line1 C_1_Line2
Analysis Profile Width 100 ft 100 ft 100 ft 100 ft 100 ft 100 ft 100 ft 100 ftDistance From Left Side of
Analysis Profile to Str Centerline 50 ft 50 ft 50 ft 50 ft 50 ft 50 ft 50 ft 50 ft
Nominal L-L Voltage 230 kV 115 kV 230 kV 115 kV 230 kV 115 kV 230 kV 115 kVMax Votlage 105% 105% 105% 105% 105% 105% 105% 105%
Case Title C2-Summer.Avg C2-Summer.Avg C2-Summer.Peak C2-Summer.Peak C2-Winter.Avg C2-Winter.Avg C2-Winter.Peak C2-Winter.PeakStructure # 1 1 1 1 1 1 1 1
Line # 1 2 1 2 1 2 1 2Conductor Size ACSS 1590 kcmil Falcon ACSS 1590 kcmil Falcon ACSS 1590 kcmil Falcon ACSS 1590 kcmil Falcon ACSS 1590 kcmil Falcon ACSS 1590 kcmil Falcon ACSS 1590 kcmil Falcon ACSS 1590 kcmil Falcon
Line Current 311 164 415 218 365 60 608 100Structure C_1_Line1 C_1_Line2 C_1_Line1 C_1_Line2 C_1_Line1 C_1_Line2 C_1_Line1 C_1_Line2
Analysis Profile Width 100 ft 100 ft 100 ft 100 ft 100 ft 100 ft 100 ft 100 ftDistance From Left Side of
Analysis Profile to Str Centerline 50 ft 50 ft 50 ft 50 ft 50 ft 50 ft 50 ft 50 ft
Nominal L-L Voltage 230 kV 115 kV 230 kV 115 kV 230 kV 115 kV 230 kV 115 kVMax Votlage 105% 105% 105% 105% 105% 105% 105% 105%
SAN 094-2691 (SR-06) PSE (12/13/16) JB 132155 A-4 REV. 1

Case Title C3-Summer.Avg C3-Summer.Avg C3-Summer.Peak C3-Summer.Peak C3-Winter.Avg C3-Winter.Avg C3-Winter.Peak C3-Winter.PeakStructure # 1 1 1 1 1 1 1 1
Line # 1 2 1 2 1 2 1 2Conductor Size ACSS 1590 kcmil Falcon ACSS 1590 kcmil Falcon ACSS 1590 kcmil Falcon ACSS 1590 kcmil Falcon ACSS 1590 kcmil Falcon ACSS 1590 kcmil Falcon ACSS 1590 kcmil Falcon ACSS 1590 kcmil Falcon
Line Current 311 164 415 218 365 60 608 100Structure C_1_Line1 C_1_Line2 C_1_Line1 C_1_Line2 C_1_Line1 C_1_Line2 C_1_Line1 C_1_Line2
Analysis Profile Width 100 ft 100 ft 100 ft 100 ft 100 ft 100 ft 100 ft 100 ftDistance From Left Side of
Analysis Profile to Str Centerline 50 ft 50 ft 50 ft 50 ft 50 ft 50 ft 50 ft 50 ft
Nominal L-L Voltage 230 kV 115 kV 230 kV 115 kV 230 kV 115 kV 230 kV 115 kVMax Votlage 105% 105% 105% 105% 105% 105% 105% 105%
Case Title C4-Summer.Avg C4-Summer.Avg C4-Summer.Peak C4-Summer.Peak C4-Winter.Avg C4-Winter.Avg C4-Winter.Peak C4-Winter.PeakStructure # 1 1 1 1 1 1 1 1
Line # 1 2 1 2 1 2 1 2Conductor Size ACSS 1590 kcmil Falcon ACSS 1590 kcmil Falcon ACSS 1590 kcmil Falcon ACSS 1590 kcmil Falcon ACSS 1590 kcmil Falcon ACSS 1590 kcmil Falcon ACSS 1590 kcmil Falcon ACSS 1590 kcmil Falcon
Line Current 311 164 415 218 365 60 608 100Structure C_1_Line1 C_1_Line2 C_1_Line1 C_1_Line2 C_1_Line1 C_1_Line2 C_1_Line1 C_1_Line2
Analysis Profile Width 100 ft 100 ft 100 ft 100 ft 100 ft 100 ft 100 ft 100 ftDistance From Left Side of
Analysis Profile to Str Centerline 50 ft 50 ft 50 ft 50 ft 50 ft 50 ft 50 ft 50 ft
Nominal L-L Voltage 230 kV 115 kV 230 kV 115 kV 230 kV 115 kV 230 kV 115 kVMax Votlage 105% 105% 105% 105% 105% 105% 105% 105%
Case Title Bypass1-Summer.Avg Bypass1-Summer.Peak Bypass1-Winter.Avg Bypass1-Winter.PeakStructure # 1 1 1 1
Line # 1 1 1 1Conductor Size ACSR 795 kcmil Tern ACSR 795 kcmil Tern ACSR 795 kcmil Tern ACSR 795 kcmil Tern
Line Current 311 415 365 608Structure R_1_100ft R_1_100ft R_1_100ft R_1_100ft
Analysis Profile Width 45 ft 45 ft 45 ft 45 ftDistance From Left Side of
Analysis Profile to Str Centerline 32.5 ft 32.5 ft 32.5 ft 32.5 ft
Nominal L-L Voltage 230 kV 230 kV 230 kV 230 kVMax Votlage 105% 105% 105% 105%
Case Title Bypass2-Summer.Avg Bypass2-Summer.Peak Bypass2-Winter.Avg Bypass2-Winter.PeakStructure # 1 1 1 1
Line # 1 1 1 1Conductor Size ACSR 795 kcmil Tern ACSR 795 kcmil Tern ACSR 795 kcmil Tern ACSR 795 kcmil Tern
Line Current 311 415 365 608Structure R_1_100ft R_1_100ft R_1_100ft R_1_100ft
Analysis Profile Width 45 ft 45 ft 45 ft 45 ftDistance From Left Side of
Analysis Profile to Str Centerline 32.5 ft 32.5 ft 32.5 ft 32.5 ft
Nominal L-L Voltage 230 kV 230 kV 230 kV 230 kVMax Votlage 105% 105% 105% 105%
SAN 094-2691 (SR-06) PSE (12/13/16) JB 132155 A-5 REV. 1

Case Title E1-Summer.Avg E1-Summer.Avg E1-Summer.Peak E1-Summer.Peak E1-Winter.Avg E1-Winter.Avg E1-Winter.Peak E1-Winter.PeakStructure # 1 1 1 1 1 1 1 1
Line # 1 2 1 2 1 2 1 2Conductor Size ACSS 1590 kcmil Falcon ACSS 1590 kcmil Falcon ACSS 1590 kcmil Falcon ACSS 1590 kcmil Falcon ACSS 1590 kcmil Falcon ACSS 1590 kcmil Falcon ACSS 1590 kcmil Falcon ACSS 1590 kcmil Falcon
Line Current 311 164 415 218 365 60 608 100Structure C_1_Line1 C_1_Line2 C_1_Line1 C_1_Line2 C_1_Line1 C_1_Line2 C_1_Line1 C_1_Line2
Analysis Profile Width 100 ft 100 ft 100 ft 100 ft 100 ft 100 ft 100 ft 100 ftDistance From Left Side of
Analysis Profile to Str Centerline 50 ft 50 ft 50 ft 50 ft 50 ft 50 ft 50 ft 50 ft
Nominal L-L Voltage 230 kV 115 kV 230 kV 115 kV 230 kV 115 kV 230 kV 115 kVMax Votlage 105% 105% 105% 105% 105% 105% 105% 105%
Case Title E2-Summer.Avg E2-Summer.Avg E2-Summer.Peak E2-Summer.Peak E2-Winter.Avg E2-Winter.Avg E2-Winter.Peak E2-Winter.PeakStructure # 1 1 1 1 1 1 1 1
Line # 1 2 1 2 1 2 1 2Conductor Size ACSS 1590 kcmil Falcon ACSS 1590 kcmil Falcon ACSS 1590 kcmil Falcon ACSS 1590 kcmil Falcon ACSS 1590 kcmil Falcon ACSS 1590 kcmil Falcon ACSS 1590 kcmil Falcon ACSS 1590 kcmil Falcon
Line Current 311 164 415 218 365 60 608 100Structure C_1_Line1 C_1_Line2 C_1_Line1 C_1_Line2 C_1_Line1 C_1_Line2 C_1_Line1 C_1_Line2
Analysis Profile Width 100 ft 100 ft 100 ft 100 ft 100 ft 100 ft 100 ft 100 ftDistance From Left Side of
Analysis Profile to Str Centerline 50 ft 50 ft 50 ft 50 ft 50 ft 50 ft 50 ft 50 ft
Nominal L-L Voltage 230 kV 115 kV 230 kV 115 kV 230 kV 115 kV 230 kV 115 kVMax Votlage 105% 105% 105% 105% 105% 105% 105% 105%
Case Title E3-Summer.Avg E3-Summer.Avg E3-Summer.Peak E3-Summer.Peak E3-Winter.Avg E3-Winter.Avg E3-Winter.Peak E3-Winter.PeakStructure # 1 1 1 1 1 1 1 1
Line # 1 2 1 2 1 2 1 2Conductor Size ACSS 1590 kcmil Falcon ACSS 1590 kcmil Falcon ACSS 1590 kcmil Falcon ACSS 1590 kcmil Falcon ACSS 1590 kcmil Falcon ACSS 1590 kcmil Falcon ACSS 1590 kcmil Falcon ACSS 1590 kcmil Falcon
Line Current 311 164 415 218 365 60 608 100Structure C_1_Line1 C_1_Line2 C_1_Line1 C_1_Line2 C_1_Line1 C_1_Line2 C_1_Line1 C_1_Line2
Analysis Profile Width 100 ft 100 ft 100 ft 100 ft 100 ft 100 ft 100 ft 100 ftDistance From Left Side of
Analysis Profile to Str Centerline 50 ft 50 ft 50 ft 50 ft 50 ft 50 ft 50 ft 50 ft
Nominal L-L Voltage 230 kV 115 kV 230 kV 115 kV 230 kV 115 kV 230 kV 115 kVMax Votlage 105% 105% 105% 105% 105% 105% 105% 105%
Case Title F1-Summer.Avg F1-Summer.Peak F1-Winter.Avg F1-Winter.PeakStructure # 1 1 1 1
Line # 1 1 1 1Conductor Size ACSR 795 kcmil Tern ACSR 795 kcmil Tern ACSR 795 kcmil Tern ACSR 795 kcmil Tern
Line Current 311 415 365 608Structure R_1_100ft R_1_100ft R_1_100ft R_1_100ft
Analysis Profile Width 45 ft 45 ft 45 ft 45 ftDistance From Left Side of
Analysis Profile to Str Centerline 32.5 ft 32.5 ft 32.5 ft 32.5 ft
Nominal L-L Voltage 230 kV 230 kV 230 kV 230 kVMax Votlage 105% 105% 105% 105%
SAN 094-2691 (SR-06) PSE (12/13/16) JB 132155 A-6 REV. 1

Case Title Bypass3-Summer.Avg Bypass3-Summer.Peak Bypass3-Winter.Avg Bypass3-Winter.PeakStructure # 1 1 1 1
Line # 1 1 1 1Conductor Size ACSR 795 kcmil Tern ACSR 795 kcmil Tern ACSR 795 kcmil Tern ACSR 795 kcmil Tern
Line Current 311 415 365 608Structure R_1_100ft R_1_100ft R_1_100ft R_1_100ft
Analysis Profile Width 45 ft 45 ft 45 ft 45 ftDistance From Left Side of
Analysis Profile to Str Centerline 32.5 ft 32.5 ft 32.5 ft 32.5 ft
Nominal L-L Voltage 230 kV 230 kV 230 kV 230 kVMax Votlage 105% 105% 105% 105%
Case Title Bypass4-Summer.Avg Bypass4-Summer.Peak Bypass4-Winter.Avg Bypass4-Winter.PeakStructure # 1 1 1 1
Line # 1 1 1 1Conductor Size ACSR 795 kcmil Tern ACSR 795 kcmil Tern ACSR 795 kcmil Tern ACSR 795 kcmil Tern
Line Current 311 415 365 608Structure R_1_100ft R_1_100ft R_1_100ft R_1_100ft
Analysis Profile Width 45 ft 45 ft 45 ft 45 ftDistance From Left Side of
Analysis Profile to Str Centerline 32.5 ft 32.5 ft 32.5 ft 32.5 ft
Nominal L-L Voltage 230 kV 230 kV 230 kV 230 kVMax Votlage 105% 105% 105% 105%
Case Title G2-1-Summer.Avg G2-1-Summer.Avg G2-1-Summer.Avg G2-1-Summer.Peak G2-1-Summer.Peak G2-1-Summer.PeakStructure # 1 1 2 1 1 2
Line # 1 2 1 1 2 1Conductor Size ACSS 1590 kcmil Falcon ACSR 795 kcmil Tern ACSS 1590 kcmil Falcon ACSS 1590 kcmil Falcon ACSR 795 kcmil Tern ACSS 1590 kcmil Falcon
Line Current 95 86 86 127 114 114Structure R_3A_Line1 R_3A_Line2 Existing_Str_05_G2 R_3A_Line1 R_3A_Line2 Existing_Str_05_G2
Analysis Profile Width 112 ft 112 ft 112 ft 112 ft 112 ft 112 ftDistance From Left Side of
Analysis Profile to Str Centerline 87.5 ft 87.5 ft 18.5 ft 87.5 ft 87.5 ft 18.5 ft
Nominal L-L Voltage 230 kV 115 kV 115 kV 230 kV 115 kV 115 kVMax Votlage 105% 105% 105% 105% 105% 105%Case Title G2-1-Winter.Avg G2-1-Winter.Avg G2-1-Winter.Avg G2-1-Winter.Peak G2-1-Winter.Peak G2-1-Winter.PeakStructure # 1 1 2 1 1 2
Line # 1 2 1 1 2 1Conductor Size ACSS 1590 kcmil Falcon ACSR 795 kcmil Tern ACSS 1590 kcmil Falcon ACSS 1590 kcmil Falcon ACSR 795 kcmil Tern ACSS 1590 kcmil Falcon
Line Current 740 388 388 1233 646 646Structure R_3A_Line1 R_3A_Line2 Existing_Str_05_G2 R_3A_Line1 R_3A_Line2 Existing_Str_05_G2
Analysis Profile Width 112 ft 112 ft 112 ft 112 ft 112 ft 112 ftDistance From Left Side of
Analysis Profile to Str Centerline 87.5 ft 87.5 ft 18.5 ft 87.5 ft 87.5 ft 18.5 ft
Nominal L-L Voltage 230 kV 115 kV 115 kV 230 kV 115 kV 115 kVMax Votlage 105% 105% 105% 105% 105% 105%
SAN 094-2691 (SR-06) PSE (12/13/16) JB 132155 A-7 REV. 1

Case Title G2-2-Summer.Avg G2-2-Summer.Avg G2-2-Summer.Avg G2-2-Summer.Peak G2-2-Summer.Peak G2-2-Summer.PeakStructure # 1 1 2 1 1 2
Line # 1 2 1 1 2 1Conductor Size ACSS 1590 kcmil Falcon ACSR 795 kcmil Tern ACSS 1590 kcmil Falcon ACSS 1590 kcmil Falcon ACSR 795 kcmil Tern ACSS 1590 kcmil Falcon
Line Current 95 86 86 127 114 114Structure R_3A_Line1 R_3A_Line2 Existing_Str_05_G2 R_3A_Line1 R_3A_Line2 Existing_Str_05_G2
Analysis Profile Width 112 ft 112 ft 112 ft 112 ft 112 ft 112 ftDistance From Left Side of
Analysis Profile to Str Centerline 87.5 ft 87.5 ft 18.5 ft 87.5 ft 87.5 ft 18.5 ft
Nominal L-L Voltage 230 kV 115 kV 115 kV 230 kV 115 kV 115 kVMax Votlage 105% 105% 105% 105% 105% 105%Case Title G2-2-Winter.Avg G2-2-Winter.Avg G2-2-Winter.Avg G2-2-Winter.Peak G2-2-Winter.Peak G2-2-Winter.PeakStructure # 1 1 2 1 1 2
Line # 1 2 1 1 2 1Conductor Size ACSS 1590 kcmil Falcon ACSR 795 kcmil Tern ACSS 1590 kcmil Falcon ACSS 1590 kcmil Falcon ACSR 795 kcmil Tern ACSS 1590 kcmil Falcon
Line Current 740 388 388 1233 646 646Structure R_3A_Line1 R_3A_Line2 Existing_Str_05_G2 R_3A_Line1 R_3A_Line2 Existing_Str_05_G2
Analysis Profile Width 112 ft 112 ft 112 ft 112 ft 112 ft 112 ftDistance From Left Side of
Analysis Profile to Str Centerline 87.5 ft 87.5 ft 18.5 ft 87.5 ft 87.5 ft 18.5 ft
Nominal L-L Voltage 230 kV 115 kV 115 kV 230 kV 115 kV 115 kVMax Votlage 105% 105% 105% 105% 105% 105%
Case Title I1-Summer.Avg I1-Summer.Avg I1-Summer.Peak I1-Summer.Peak I1-Winter.Avg I1-Winter.Avg I1-Winter.Peak I1-Winter.PeakStructure # 1 1 1 1 1 1 1 1
Line # 1 2 1 2 1 2 1 2Conductor Size ACSS 1590 kcmil Falcon ACSR 795 kcmil Tern ACSS 1590 kcmil Falcon ACSR 795 kcmil Tern ACSS 1590 kcmil Falcon ACSR 795 kcmil Tern ACSS 1590 kcmil Falcon ACSR 795 kcmil Tern
Line Current 86 86 114 114 388 388 646 646Structure R_3A_Line1 R_3A_Line2 R_3A_Line1 R_3A_Line2 R_3A_Line1 R_3A_Line2 R_3A_Line1 R_3A_Line2
Analysis Profile Width 57 ft 57 ft 57 ft 57 ft 57 ft 57 ft 57 ft 57 ftDistance From Left Side of
Analysis Profile to Str Centerline 32.5 ft 32.5 ft 32.5 ft 32.5 ft 32.5 ft 32.5 ft 32.5 ft 32.5 ft
Nominal L-L Voltage 115 kV 115 kV 115 kV 115 kV 115 kV 115 kV 115 kV 115 kVMax Votlage 105% 105% 105% 105% 105% 105% 105% 105%
Case Title I2-Summer.Avg.Oak1only I2-Summer.Avg.Oak1only I2-Summer.Peak.Oak1only I2-Summer.Peak.Oak1only I2-Winter.Avg.Oak1only I2-Winter.Avg.Oak1only I2-Winter.Peak.Oak1only I2-Winter.Peak.Oak1onlyStructure # 1 1 1 1 1 1 1 1
Line # 1 2 1 2 1 2 1 2Conductor Size ACSS 1590 kcmil Falcon ACSR 795 kcmil Tern ACSS 1590 kcmil Falcon ACSR 795 kcmil Tern ACSS 1590 kcmil Falcon ACSR 795 kcmil Tern ACSS 1590 kcmil Falcon ACSR 795 kcmil Tern
Line Current 95 86 127 114 740 388 1233 646Structure R_3A_Line1 R_3A_Line2 R_3A_Line1 R_3A_Line2 R_3A_Line1 R_3A_Line2 R_3A_Line1 R_3A_Line2
Analysis Profile Width 57 ft 57 ft 57 ft 57 ft 57 ft 57 ft 57 ft 57 ftDistance From Left Side of
Analysis Profile to Str Centerline 32.5 ft 32.5 ft 32.5 ft 32.5 ft 32.5 ft 32.5 ft 32.5 ft 32.5 ft
Nominal L-L Voltage 230 kV 115 kV 230 kV 115 kV 230 kV 115 kV 230 kV 115 kVMax Votlage 105% 105% 105% 105% 105% 105% 105% 105%
SAN 094-2691 (SR-06) PSE (12/13/16) JB 132155 A-8 REV. 1

Case Title I2-Summer.Avg.Willow2 I2-Summer.Avg.Willow2 I2-Summer.Peak.Willow2 I2-Summer.Peak.Willow2 I2-Winter.Avg.Willow2 I2-Winter.Avg.Willow2 I2-Winter.Peak.Willow2 I2-Winter.Peak.Willow2Structure # 1 1 1 1 1 1 1 1
Line # 1 2 1 2 1 2 1 2Conductor Size ACSS 1590 kcmil Falcon ACSR 795 kcmil Tern ACSS 1590 kcmil Falcon ACSR 795 kcmil Tern ACSS 1590 kcmil Falcon ACSR 795 kcmil Tern ACSS 1590 kcmil Falcon ACSR 795 kcmil Tern
Line Current 86 86 114 114 388 388 646 646Structure R_3A_Line1 R_3A_Line2 R_3A_Line1 R_3A_Line2 R_3A_Line1 R_3A_Line2 R_3A_Line1 R_3A_Line2
Analysis Profile Width 57 ft 57 ft 57 ft 57 ft 57 ft 57 ft 57 ft 57 ftDistance From Left Side of
Analysis Profile to Str Centerline 32.5 ft 32.5 ft 32.5 ft 32.5 ft 32.5 ft 32.5 ft 32.5 ft 32.5 ft
Nominal L-L Voltage 115 kV 115 kV 115 kV 115 kV 115 kV 115 kV 115 kV 115 kVMax Votlage 105% 105% 105% 105% 105% 105% 105% 105%
Case Title I2-Summer.Avg.Oak2only I2-Summer.Peak.Oak2only I2-Winter.Avg.Oak2only I2-Winter.Peak.Oak2onlyStructure # 1 1 1 1
Line # 1 1 1 1Conductor Size ACSS 1590 kcmil Falcon ACSS 1590 kcmil Falcon ACSS 1590 kcmil Falcon ACSS 1590 kcmil Falcon
Line Current 86 114 388 646Structure R_1_80ft R_1_80ft R_1_80ft R_1_80ft
Analysis Profile Width 45 ft 45 ft 45 ft 45 ftDistance From Left Side of
Analysis Profile to Str Centerline 32.5 ft 32.5 ft 32.5 ft 32.5 ft
Nominal L-L Voltage 115 kV 115 kV 115 kV 115 kVMax Votlage 105% 105% 105% 105%
Case Title P1-Summer.Avg P1-Summer.Peak P1-Winter.Avg P1-Winter.PeakStructure # 1 1 1 1
Line # 1 1 1 1Conductor Size ACSS 1590 kcmil Falcon ACSS 1590 kcmil Falcon ACSS 1590 kcmil Falcon ACSS 1590 kcmil Falcon
Line Current 86 114 388 646Structure R_1_80ft R_1_80ft R_1_80ft R_1_80ft
Analysis Profile Width 45 ft 45 ft 45 ft 45 ftDistance From Left Side of
Analysis Profile to Str Centerline 32.5 ft 32.5 ft 32.5 ft 32.5 ft
Nominal L-L Voltage 115 kV 115 kV 115 kV 115 kVMax Votlage 105% 105% 105% 105%
Case Title P2-Summer.Avg P2-Summer.Peak P2-Winter.Avg P2-Winter.PeakStructure # 1 1 1 1
Line # 1 1 1 1Conductor Size ACSS 1590 kcmil Falcon ACSS 1590 kcmil Falcon ACSS 1590 kcmil Falcon ACSS 1590 kcmil Falcon
Line Current 86 114 388 646Structure R_1_80ft R_1_80ft R_1_80ft R_1_80ft
Analysis Profile Width 45 ft 45 ft 45 ft 45 ftDistance From Left Side of
Analysis Profile to Str Centerline 32.5 ft 32.5 ft 32.5 ft 32.5 ft
Nominal L-L Voltage 115 kV 115 kV 115 kV 115 kVMax Votlage 105% 105% 105% 105%
SAN 094-2691 (SR-06) PSE (12/13/16) JB 132155 A-9 REV. 1

Case Title K3-Summer.Avg K3-Summer.Peak K3-Winter.Avg K3-Winter.PeakStructure # 1 1 1 1
Line # 1 1 1 1Conductor Size ACSS 1590 kcmil Falcon ACSS 1590 kcmil Falcon ACSS 1590 kcmil Falcon ACSS 1590 kcmil Falcon
Line Current 86 114 388 646Structure R_1_80ft R_1_80ft R_1_80ft R_1_80ft
Analysis Profile Width 45 ft 45 ft 45 ft 45 ftDistance From Left Side of
Analysis Profile to Str Centerline 32.5 ft 32.5 ft 32.5 ft 32.5 ft
Nominal L-L Voltage 115 kV 115 kV 115 kV 115 kVMax Votlage 105% 105% 105% 105%
Case Title K3-Summer.Avg.Oak1only K3-Summer.Avg.Oak1only K3-Summer.Peak.Oak1only K3-Summer.Peak.Oak1only K3-Winter.Avg.Oak1only K3-Winter.Avg.Oak1only K3-Winter.Peak.Oak1only K3-Winter.Peak.Oak1onlyStructure # 1 1 1 1 1 1 1 1
Line # 1 2 1 2 1 2 1 2Conductor Size ACSS 1590 kcmil Falcon ACSR 795 kcmil Tern ACSS 1590 kcmil Falcon ACSR 795 kcmil Tern ACSS 1590 kcmil Falcon ACSR 795 kcmil Tern ACSS 1590 kcmil Falcon ACSR 795 kcmil Tern
Line Current 95 86 127 114 740 388 1233 646Structure R_3A_Line1 R_3A_Line2 R_3A_Line1 R_3A_Line2 R_3A_Line1 R_3A_Line2 R_3A_Line1 R_3A_Line2
Analysis Profile Width 57 ft 57 ft 57 ft 57 ft 57 ft 57 ft 57 ft 57 ftDistance From Left Side of
Analysis Profile to Str Centerline 32.5 ft 32.5 ft 32.5 ft 32.5 ft 32.5 ft 32.5 ft 32.5 ft 32.5 ft
Nominal L-L Voltage 230 kV 115 kV 230 kV 115 kV 230 kV 115 kV 230 kV 115 kVMax Votlage 105% 105% 105% 105% 105% 105% 105% 105%
Case Title K4-Summer.Avg K4-Summer.Peak K4-Winter.Avg K4-Winter.PeakStructure # 1 1 1 1
Line # 1 1 1 1Conductor Size ACSS 1590 kcmil Falcon ACSS 1590 kcmil Falcon ACSS 1590 kcmil Falcon ACSS 1590 kcmil Falcon
Line Current 86 114 388 646Structure R_1_80ft R_1_80ft R_1_80ft R_1_80ft
Analysis Profile Width 45 ft 45 ft 45 ft 45 ftDistance From Left Side of
Analysis Profile to Str Centerline 32.5 ft 32.5 ft 32.5 ft 32.5 ft
Nominal L-L Voltage 115 kV 115 kV 115 kV 115 kVMax Votlage 105% 105% 105% 105%
Case Title K4-Summer.Avg.Oak1only K4-Summer.Avg.Oak1only K4-Summer.Peak.Oak1only K4-Summer.Peak.Oak1only K4-Winter.Avg.Oak1only K4-Winter.Avg.Oak1only K4-Winter.Peak.Oak1only K4-Winter.Peak.Oak1onlyStructure # 1 1 1 1 1 1 1 1
Line # 1 2 1 2 1 2 1 2Conductor Size ACSS 1590 kcmil Falcon ACSR 795 kcmil Tern ACSS 1590 kcmil Falcon ACSR 795 kcmil Tern ACSS 1590 kcmil Falcon ACSR 795 kcmil Tern ACSS 1590 kcmil Falcon ACSR 795 kcmil Tern
Line Current 95 86 127 114 740 388 1233 646Structure R_3A_Line1 R_3A_Line2 R_3A_Line1 R_3A_Line2 R_3A_Line1 R_3A_Line2 R_3A_Line1 R_3A_Line2
Analysis Profile Width 57 ft 57 ft 57 ft 57 ft 57 ft 57 ft 57 ft 57 ftDistance From Left Side of
Analysis Profile to Str Centerline 32.5 ft 32.5 ft 32.5 ft 32.5 ft 32.5 ft 32.5 ft 32.5 ft 32.5 ft
Nominal L-L Voltage 230 kV 115 kV 230 kV 115 kV 230 kV 115 kV 230 kV 115 kVMax Votlage 105% 105% 105% 105% 105% 105% 105% 105%
SAN 094-2691 (SR-06) PSE (12/13/16) JB 132155 A-10 REV. 1

Case Title J1-Summer.Avg J1-Summer.Peak J1-Winter.Avg J1-Winter.PeakStructure # 1 1 1 1
Line # 1 1 1 1Conductor Size ACSS 1590 kcmil Falcon ACSS 1590 kcmil Falcon ACSS 1590 kcmil Falcon ACSS 1590 kcmil Falcon
Line Current 95 127 740 1233Structure C_10B C_10B C_10B C_10B
Analysis Profile Width 100 ft 100 ft 100 ft 100 ftDistance From Left Side of
Analysis Profile to Str Centerline 50 ft 50 ft 50 ft 50 ft
Nominal L-L Voltage 230 kV 230 kV 230 kV 230 kVMax Votlage 105% 105% 105% 105%
Case Title J1-Summer.Avg.Willow1 J1-Summer.Avg.Willow1 J1-Summer.Peak.Willow1 J1-Summer.Peak.Willow1 J1-Winter.Avg.Willow1 J1-Winter.Avg.Willow1 J1-Winter.Peak.Willow1 J1-Winter.Peak.Willow1Structure # 1 1 1 1 1 1 1 1
Line # 1 2 1 2 1 2 1 2Conductor Size ACSS 1590 kcmil Falcon ACSS 1590 kcmil Falcon ACSS 1590 kcmil Falcon ACSS 1590 kcmil Falcon ACSS 1590 kcmil Falcon ACSS 1590 kcmil Falcon ACSS 1590 kcmil Falcon ACSS 1590 kcmil Falcon
Line Current 95 86 127 114 740 388 1233 646Structure C_1_Line1 C_1_Line2 C_1_Line1 C_1_Line2 C_1_Line1 C_1_Line2 C_1_Line1 C_1_Line2
Analysis Profile Width 100 ft 100 ft 100 ft 100 ft 100 ft 100 ft 100 ft 100 ftDistance From Left Side of
Analysis Profile to Str Centerline 50 ft 50 ft 50 ft 50 ft 50 ft 50 ft 50 ft 50 ft
Nominal L-L Voltage 230 kV 115 kV 230 kV 115 kV 230 kV 115 kV 230 kV 115 kVMax Votlage 105% 105% 105% 105% 105% 105% 105% 105%
Case Title J2-Summer.Avg J2-Summer.Peak J2-Winter.Avg J2-Winter.PeakStructure # 1 1 1 1
Line # 1 1 1 1Conductor Size ACSS 1590 kcmil Falcon ACSS 1590 kcmil Falcon ACSS 1590 kcmil Falcon ACSS 1590 kcmil Falcon
Line Current 95 127 740 1233Structure C_10B C_10B C_10B C_10B
Analysis Profile Width 100 ft 100 ft 100 ft 100 ftDistance From Left Side of
Analysis Profile to Str Centerline 50 ft 50 ft 50 ft 50 ft
Nominal L-L Voltage 230 kV 230 kV 230 kV 230 kVMax Votlage 105% 105% 105% 105%
Case Title J2-Summer.Avg.Willow1 J2-Summer.Avg.Willow1 J2-Summer.Peak.Willow1 J2-Summer.Peak.Willow1 J2-Winter.Avg.Willow1 J2-Winter.Avg.Willow1 J2-Winter.Peak.Willow1 J2-Winter.Peak.Willow1Structure # 1 1 1 1 1 1 1 1
Line # 1 2 1 2 1 2 1 2Conductor Size ACSS 1590 kcmil Falcon ACSS 1590 kcmil Falcon ACSS 1590 kcmil Falcon ACSS 1590 kcmil Falcon ACSS 1590 kcmil Falcon ACSS 1590 kcmil Falcon ACSS 1590 kcmil Falcon ACSS 1590 kcmil Falcon
Line Current 95 86 127 114 740 388 1233 646Structure C_13_Pole1 C_13_Pole2 C_13_Pole1 C_13_Pole2 C_13_Pole1 C_13_Pole2 C_13_Pole1 C_13_Pole2
Analysis Profile Width 100 ft 100 ft 100 ft 100 ft 100 ft 100 ft 100 ft 100 ftDistance From Left Side of
Analysis Profile to Str Centerline 30 ft 70 ft 30 ft 70 ft 30 ft 70 ft 30 ft 70 ft
Nominal L-L Voltage 230 kV 115 kV 230 kV 115 kV 230 kV 115 kV 230 kV 115 kVMax Votlage 105% 105% 105% 105% 105% 105% 105% 105%
SAN 094-2691 (SR-06) PSE (12/13/16) JB 132155 A-11 REV. 1

Case Title J3-Summer.Avg J3-Summer.Peak J3-Winter.Avg J3-Winter.PeakStructure # 1 1 1 1
Line # 1 1 1 1Conductor Size ACSS 1590 kcmil Falcon ACSS 1590 kcmil Falcon ACSS 1590 kcmil Falcon ACSS 1590 kcmil Falcon
Line Current 95 127 740 1233Structure C_10B C_10B C_10B C_10B
Analysis Profile Width 100 ft 100 ft 100 ft 100 ftDistance From Left Side of
Analysis Profile to Str Centerline 50 ft 50 ft 50 ft 50 ft
Nominal L-L Voltage 230 kV 230 kV 230 kV 230 kVMax Votlage 105% 105% 105% 105%
Case Title J3-Summer.Avg.Willow1 J3-Summer.Avg.Willow1 J3-Summer.Peak.Willow1 J3-Summer.Peak.Willow1 J3-Winter.Avg.Willow1 J3-Winter.Avg.Willow1 J3-Winter.Peak.Willow1 J3-Winter.Peak.Willow1Structure # 1 1 1 1 1 1 1 1
Line # 1 2 1 2 1 2 1 2Conductor Size ACSS 1590 kcmil Falcon ACSS 1590 kcmil Falcon ACSS 1590 kcmil Falcon ACSS 1590 kcmil Falcon ACSS 1590 kcmil Falcon ACSS 1590 kcmil Falcon ACSS 1590 kcmil Falcon ACSS 1590 kcmil Falcon
Line Current 95 86 127 114 740 388 1233 646Structure C_13_Pole1 C_13_Pole2 C_13_Pole1 C_13_Pole2 C_13_Pole1 C_13_Pole2 C_13_Pole1 C_13_Pole2
Analysis Profile Width 100 ft 100 ft 100 ft 100 ft 100 ft 100 ft 100 ft 100 ftDistance From Left Side of
Analysis Profile to Str Centerline 30 ft 70 ft 30 ft 70 ft 30 ft 70 ft 30 ft 70 ft
Nominal L-L Voltage 230 kV 115 kV 230 kV 115 kV 230 kV 115 kV 230 kV 115 kVMax Votlage 105% 105% 105% 105% 105% 105% 105% 105%
Case Title J4-Summer.Avg J4-Summer.Avg J4-Summer.Peak J4-Summer.Peak J4-Winter.Avg J4-Winter.Avg J4-Winter.Peak J4-Winter.PeakStructure # 1 1 1 1 1 1 1 1
Line # 1 2 1 2 1 2 1 2Conductor Size ACSS 1590 kcmil Falcon ACSS 1590 kcmil Falcon ACSS 1590 kcmil Falcon ACSS 1590 kcmil Falcon ACSS 1590 kcmil Falcon ACSS 1590 kcmil Falcon ACSS 1590 kcmil Falcon ACSS 1590 kcmil Falcon
Line Current 95 86 127 114 740 388 1233 646Structure C_13_Pole1 C_13_Pole2 C_13_Pole1 C_13_Pole2 C_13_Pole1 C_13_Pole2 C_13_Pole1 C_13_Pole2
Analysis Profile Width 100 ft 100 ft 100 ft 100 ft 100 ft 100 ft 100 ft 100 ftDistance From Left Side of
Analysis Profile to Str Centerline 30 ft 70 ft 30 ft 70 ft 30 ft 70 ft 30 ft 70 ft
Nominal L-L Voltage 230 kV 115 kV 230 kV 115 kV 230 kV 115 kV 230 kV 115 kVMax Votlage 105% 105% 105% 105% 105% 105% 105% 105%
Case Title K2-Summer.Avg K2-Summer.Peak K2-Winter.Avg K2-Winter.PeakStructure # 1 1 1 1
Line # 1 1 1 1Conductor Size ACSS 1590 kcmil Falcon ACSS 1590 kcmil Falcon ACSS 1590 kcmil Falcon ACSS 1590 kcmil Falcon
Line Current 86 114 388 646Structure R_1_80ft R_1_80ft R_1_80ft R_1_80ft
Analysis Profile Width 45 ft 45 ft 45 ft 45 ftDistance From Left Side of
Analysis Profile to Str Centerline 32.5 ft 32.5 ft 32.5 ft 32.5 ft
Nominal L-L Voltage 115 kV 115 kV 115 kV 115 kVMax Votlage 105% 105% 105% 105%
SAN 094-2691 (SR-06) PSE (12/13/16) JB 132155 A-12 REV. 1

Case Title K2-Summer.Avg.Oak1only K2-Summer.Avg.Oak1only K2-Summer.Peak.Oak1only K2-Summer.Peak.Oak1only K2-Winter.Avg.Oak1only K2-Winter.Avg.Oak1only K2-Winter.Peak.Oak1only K2-Winter.Peak.Oak1onlyStructure # 1 1 1 1 1 1 1 1
Line # 1 2 1 2 1 2 1 2Conductor Size ACSS 1590 kcmil Falcon ACSR 795 kcmil Tern ACSS 1590 kcmil Falcon ACSR 795 kcmil Tern ACSS 1590 kcmil Falcon ACSR 795 kcmil Tern ACSS 1590 kcmil Falcon ACSR 795 kcmil Tern
Line Current 95 86 127 114 740 388 1233 646Structure R_3A_Line1 R_3A_Line2 R_3A_Line1 R_3A_Line2 R_3A_Line1 R_3A_Line2 R_3A_Line1 R_3A_Line2
Analysis Profile Width 57 ft 57 ft 57 ft 57 ft 57 ft 57 ft 57 ft 57 ftDistance From Left Side of
Analysis Profile to Str Centerline 32.5 ft 32.5 ft 32.5 ft 32.5 ft 32.5 ft 32.5 ft 32.5 ft 32.5 ft
Nominal L-L Voltage 230 kV 115 kV 230 kV 115 kV 230 kV 115 kV 230 kV 115 kVMax Votlage 105% 105% 105% 105% 105% 105% 105% 105%
Case Title M1-Summer.Avg M1-Summer.Avg M1-Summer.Peak M1-Summer.Peak M1-Winter.Avg M1-Winter.Avg M1-Winter.Peak M1-Winter.PeakStructure # 1 1 1 1 1 1 1 1
Line # 1 2 1 2 1 2 1 2Conductor Size ACSS 1590 kcmil Falcon ACSS 1590 kcmil Falcon ACSS 1590 kcmil Falcon ACSS 1590 kcmil Falcon ACSS 1590 kcmil Falcon ACSS 1590 kcmil Falcon ACSS 1590 kcmil Falcon ACSS 1590 kcmil Falcon
Line Current 95 86 127 114 740 388 1233 646Structure C_13_Pole1 C_13_Pole2 C_13_Pole1 C_13_Pole2 C_13_Pole1 C_13_Pole2 C_13_Pole1 C_13_Pole2
Analysis Profile Width 100 ft 100 ft 100 ft 100 ft 100 ft 100 ft 100 ft 100 ftDistance From Left Side of
Analysis Profile to Str Centerline 30 ft 70 ft 30 ft 70 ft 30 ft 70 ft 30 ft 70 ft
Nominal L-L Voltage 230 kV 115 kV 230 kV 115 kV 230 kV 115 kV 230 kV 115 kVMax Votlage 105% 105% 105% 105% 105% 105% 105% 105%
Case Title M2-Summer.Avg M2-Summer.Avg M2-Summer.Peak M2-Summer.Peak M2-Winter.Avg M2-Winter.Avg M2-Winter.Peak M2-Winter.PeakStructure # 1 1 1 1 1 1 1 1
Line # 1 2 1 2 1 2 1 2Conductor Size ACSS 1590 kcmil Falcon ACSS 1590 kcmil Falcon ACSS 1590 kcmil Falcon ACSS 1590 kcmil Falcon ACSS 1590 kcmil Falcon ACSS 1590 kcmil Falcon ACSS 1590 kcmil Falcon ACSS 1590 kcmil Falcon
Line Current 95 86 127 114 740 388 1233 646Structure C_13_Pole1 C_13_Pole2 C_13_Pole1 C_13_Pole2 C_13_Pole1 C_13_Pole2 C_13_Pole1 C_13_Pole2
Analysis Profile Width 100 ft 100 ft 100 ft 100 ft 100 ft 100 ft 100 ft 100 ftDistance From Left Side of
Analysis Profile to Str Centerline 30 ft 70 ft 30 ft 70 ft 30 ft 70 ft 30 ft 70 ft
Nominal L-L Voltage 230 kV 115 kV 230 kV 115 kV 230 kV 115 kV 230 kV 115 kVMax Votlage 105% 105% 105% 105% 105% 105% 105% 105%
Case Title M3-Summer.Avg M3-Summer.Avg M3-Summer.Peak M3-Summer.Peak M3-Winter.Avg M3-Winter.Avg M3-Winter.Peak M3-Winter.PeakStructure # 1 1 1 1 1 1 1 1
Line # 1 2 1 2 1 2 1 2Conductor Size ACSS 1590 kcmil Falcon ACSS 1590 kcmil Falcon ACSS 1590 kcmil Falcon ACSS 1590 kcmil Falcon ACSS 1590 kcmil Falcon ACSS 1590 kcmil Falcon ACSS 1590 kcmil Falcon ACSS 1590 kcmil Falcon
Line Current 95 86 127 114 740 388 1233 646Structure C_13_Pole1 C_13_Pole2 C_13_Pole1 C_13_Pole2 C_13_Pole1 C_13_Pole2 C_13_Pole1 C_13_Pole2
Analysis Profile Width 100 ft 100 ft 100 ft 100 ft 100 ft 100 ft 100 ft 100 ftDistance From Left Side of
Analysis Profile to Str Centerline 30 ft 70 ft 30 ft 70 ft 30 ft 70 ft 30 ft 70 ft
Nominal L-L Voltage 230 kV 115 kV 230 kV 115 kV 230 kV 115 kV 230 kV 115 kVMax Votlage 105% 105% 105% 105% 105% 105% 105% 105%
SAN 094-2691 (SR-06) PSE (12/13/16) JB 132155 A-13 REV. 1

Case Title M4-Summer.Avg M4-Summer.Avg M4-Summer.Peak M4-Summer.Peak M4-Winter.Avg M4-Winter.Avg M4-Winter.Peak M4-Winter.PeakStructure # 1 1 1 1 1 1 1 1
Line # 1 2 1 2 1 2 1 2Conductor Size ACSS 1590 kcmil Falcon ACSS 1590 kcmil Falcon ACSS 1590 kcmil Falcon ACSS 1590 kcmil Falcon ACSS 1590 kcmil Falcon ACSS 1590 kcmil Falcon ACSS 1590 kcmil Falcon ACSS 1590 kcmil Falcon
Line Current 95 86 127 114 740 388 1233 646Structure C_1_Line1 C_1_Line2 C_1_Line1 C_1_Line2 C_1_Line1 C_1_Line2 C_1_Line1 C_1_Line2
Analysis Profile Width 100 ft 100 ft 100 ft 100 ft 100 ft 100 ft 100 ft 100 ftDistance From Left Side of
Analysis Profile to Str Centerline 50 ft 50 ft 50 ft 50 ft 50 ft 50 ft 50 ft 50 ft
Nominal L-L Voltage 230 kV 115 kV 230 kV 115 kV 230 kV 115 kV 230 kV 115 kVMax Votlage 105% 105% 105% 105% 105% 105% 105% 105%
Case Title M5-Summer.Avg M5-Summer.Avg M5-Summer.Peak M5-Summer.Peak M5-Winter.Avg M5-Winter.Avg M5-Winter.Peak M5-Winter.PeakStructure # 1 1 1 1 1 1 1 1
Line # 1 2 1 2 1 2 1 2Conductor Size ACSS 1590 kcmil Falcon ACSS 1590 kcmil Falcon ACSS 1590 kcmil Falcon ACSS 1590 kcmil Falcon ACSS 1590 kcmil Falcon ACSS 1590 kcmil Falcon ACSS 1590 kcmil Falcon ACSS 1590 kcmil Falcon
Line Current 95 86 127 114 740 388 1233 646Structure C_1_Line1 C_1_Line2 C_1_Line1 C_1_Line2 C_1_Line1 C_1_Line2 C_1_Line1 C_1_Line2
Analysis Profile Width 100 ft 100 ft 100 ft 100 ft 100 ft 100 ft 100 ft 100 ftDistance From Left Side of
Analysis Profile to Str Centerline 50 ft 50 ft 50 ft 50 ft 50 ft 50 ft 50 ft 50 ft
Nominal L-L Voltage 230 kV 115 kV 230 kV 115 kV 230 kV 115 kV 230 kV 115 kVMax Votlage 105% 105% 105% 105% 105% 105% 105% 105%
Case Title N1-Summer.Avg N1-Summer.Avg N1-Summer.Peak N1-Summer.Peak N1-Winter.Avg N1-Winter.Avg N1-Winter.Peak N1-Winter.PeakStructure # 1 1 1 1 1 1 1 1
Line # 1 2 1 2 1 2 1 2Conductor Size ACSS 1590 kcmil Falcon ACSS 1590 kcmil Falcon ACSS 1590 kcmil Falcon ACSS 1590 kcmil Falcon ACSS 1590 kcmil Falcon ACSS 1590 kcmil Falcon ACSS 1590 kcmil Falcon ACSS 1590 kcmil Falcon
Line Current 95 86 127 114 740 388 1233 646Structure C_1_Line1 C_1_Line2 C_1_Line1 C_1_Line2 C_1_Line1 C_1_Line2 C_1_Line1 C_1_Line2
Analysis Profile Width 100 ft 100 ft 100 ft 100 ft 100 ft 100 ft 100 ft 100 ftDistance From Left Side of
Analysis Profile to Str Centerline 50 ft 50 ft 50 ft 50 ft 50 ft 50 ft 50 ft 50 ft
Nominal L-L Voltage 230 kV 115 kV 230 kV 115 kV 230 kV 115 kV 230 kV 115 kVMax Votlage 105% 105% 105% 105% 105% 105% 105% 105%
Case Title N2-Summer.Avg N2-Summer.Avg N2-Summer.Peak N2-Summer.Peak N2-Winter.Avg N2-Winter.Avg N2-Winter.Peak N2-Winter.PeakStructure # 1 1 1 1 1 1 1 1
Line # 1 2 1 2 1 2 1 2Conductor Size ACSS 1590 kcmil Falcon ACSS 1590 kcmil Falcon ACSS 1590 kcmil Falcon ACSS 1590 kcmil Falcon ACSS 1590 kcmil Falcon ACSS 1590 kcmil Falcon ACSS 1590 kcmil Falcon ACSS 1590 kcmil Falcon
Line Current 95 86 127 114 740 388 1233 646Structure C_1_Line1 C_1_Line2 C_1_Line1 C_1_Line2 C_1_Line1 C_1_Line2 C_1_Line1 C_1_Line2
Analysis Profile Width 100 ft 100 ft 100 ft 100 ft 100 ft 100 ft 100 ft 100 ftDistance From Left Side of
Analysis Profile to Str Centerline 50 ft 50 ft 50 ft 50 ft 50 ft 50 ft 50 ft 50 ft
Nominal L-L Voltage 230 kV 115 kV 230 kV 115 kV 230 kV 115 kV 230 kV 115 kVMax Votlage 105% 105% 105% 105% 105% 105% 105% 105%
SAN 094-2691 (SR-06) PSE (12/13/16) JB 132155 A-14 REV. 1

Structure Type:
Offset from Structure CL
Conductor Attachment
Height Conductor SagConductor Diameter
Minimum Conductor Height
Average Conductor Height Phase Angle
X [ft] Y [ft] [ft] [in] [ft] [ft] [°]A -14.5 90 10 1.544 80.0 83.3 0B -16.5 75 10 1.544 65.0 68.3 240C -14.5 59 10 1.544 49.0 52.3 120
Shield 1 NAShield 2 NA
Structure Type:
Offset from Structure CL
Conductor Attachment
Height Conductor SagConductor Diameter
Minimum Conductor Height
Average Conductor Height Phase Angle
X [ft] Y [ft] [ft] [in] [ft] [ft] [°]A 14.5 90 10 1.544 80.0 83.3 0B 16.5 75 10 1.544 65.0 68.3 240C 14.5 59 10 1.544 49.0 52.3 120
Shield 1 0 100 8.5 0.656 91.5 94.3 NAShield 2 NA
Structure Type:
Offset from Structure CL
Conductor Attachment
Height Conductor SagConductor Diameter
Minimum Conductor Height
Average Conductor Height Phase Angle
X [ft] Y [ft] [ft] [in] [ft] [ft] [°]A -23 54 10 1.544 44.0 47.3 0B 0 54 10 1.544 44.0 47.3 240C 23 54 10 1.544 44.0 47.3 120
Shield 1 15 65 8.5 0.656 56.5 59.3 NAShield 2 NA
Structure Type:
Offset from Structure CL
Conductor Attachment
Height Conductor SagConductor Diameter
Minimum Conductor Height
Average Conductor Height Phase Angle
X [ft] Y [ft] [ft] [in] [ft] [ft] [°]A 9.5 75 10 1.544 65.0 68.3 0B -9.5 75 10 1.544 65.0 68.3 240C 9.5 61 10 1.544 51.0 54.3 120
Shield 1 NAShield 2 NA
Structure Type:
Offset from Structure CL
Conductor Attachment
Height Conductor SagConductor Diameter
Minimum Conductor Height
Average Conductor Height Phase Angle
X [ft] Y [ft] [ft] [in] [ft] [ft] [°]A -9.5 75 10 1.544 65.0 68.3 0B 9.5 75 10 1.544 65.0 68.3 240C -9.5 61 10 1.544 51.0 54.3 120
Shield 1 0 85 8.5 0.656 76.5 79.3 NAShield 2 NA
C_1_Line1
C_1_Line2
C_10B
C_13_Pole1
C_13_Pole2
SAN 094-2691 (SR-06) PSE (12/13/16) JB 132155 A-15 REV. 1

Structure Type:
Offset from Structure CL
Conductor Attachment
Height Conductor SagConductor Diameter
Minimum Conductor Height
Average Conductor Height Phase Angle
X [ft] Y [ft] [ft] [in] [ft] [ft] [°]A -10.5 90 10 1.544 80.0 83.3 0B -12.5 78 10 1.544 68.0 71.3 240C -10.5 66 10 1.544 56.0 59.3 120
Shield 1 0 100 8.5 0.385 91.5 94.3 NAShield 2 NA
Structure Type:
Offset from Structure CL
Conductor Attachment
Height Conductor SagConductor Diameter
Minimum Conductor Height
Average Conductor Height Phase Angle
X [ft] Y [ft] [ft] [in] [ft] [ft] [°]A -10.5 70 10 1.544 60.0 63.3 0B -12.5 58 10 1.544 48.0 51.3 240C -10.5 46 10 1.544 36.0 39.3 120
Shield 1 0 80 8.5 0.385 71.5 74.3 NAShield 2 NA
Structure Type:
Offset from Structure CL
Conductor Attachment
Height Conductor SagConductor Diameter
Minimum Conductor Height
Average Conductor Height Phase Angle
X [ft] Y [ft] [ft] [in] [ft] [ft] [°]A -10.5 70 10 1.544 60.0 63.3 0B -10.5 56 10 1.544 46.0 49.3 240C -10.5 42 10 1.544 32.0 35.3 120
Shield 1 NAShield 2 NA
Structure Type:
Offset from Structure CL
Conductor Attachment
Height Conductor SagConductor Diameter
Minimum Conductor Height
Average Conductor Height Phase Angle
X [ft] Y [ft] [ft] [in] [ft] [ft] [°]A 7.5 70 10 1.063 60.0 63.3 0B 7.5 56 10 1.063 46.0 49.3 240C 7.5 42 10 1.063 32.0 35.3 120
Shield 1 0 80 8.5 0.385 71.5 74.3 NAShield 2 NA
Structure Type:
Offset from Structure CL
Conductor Attachment
Height Conductor SagConductor Diameter
Minimum Conductor Height
Average Conductor Height Phase Angle
X [ft] Y [ft] [ft] [in] [ft] [ft] [°]A 5 50 10 1.544 40.0 43.3 0B -5 45 10 1.544 35.0 38.3 240C 5 40 10 1.544 30.0 33.3 120
Shield 1 NAShield 2 NA
R_3A_Line1
R_3A_Line2
Existing_Str_05_G2
R_1_80ft
R_1_100ft
SAN 094-2691 (SR-06) PSE (12/13/16) JB 132155 A-16 REV. 1

Structure Type:
Offset from Structure CL
Conductor Attachment
Height Conductor SagConductor Diameter
Minimum Conductor Height
Average Conductor Height Phase Angle
X [ft] Y [ft] [ft] [in] [ft] [ft] [°]A 11.5 35 10 1.063 25.0 28.3 0B 0 35 10 1.063 25.0 28.3 240C -11.5 35 10 1.063 25.0 28.3 120
Shield 1 NAShield 2 NA
Structure Type:
Offset from Structure CL
Conductor Attachment
Height Conductor SagConductor Diameter
Minimum Conductor Height
Average Conductor Height Phase Angle
X [ft] Y [ft] [ft] [in] [ft] [ft] [°]A -5 70 10 1.063 60.0 63.3 0B -5 60 10 1.063 50.0 53.3 240C -5 50 10 1.063 40.0 43.3 120
Shield 1 NAShield 2 NA
Structure Type:
Offset from Structure CL
Conductor Attachment
Height Conductor SagConductor Diameter
Minimum Conductor Height
Average Conductor Height Phase Angle
X [ft] Y [ft] [ft] [in] [ft] [ft] [°]A 5 60 10 1.063 50.0 53.3 0B -5 55 10 1.063 45.0 48.3 240C 5 50 10 1.063 40.0 43.3 120
Shield 1 NAShield 2 NA
Structure Type:
Offset from Structure CL
Conductor Attachment
Height Conductor SagConductor Diameter
Minimum Conductor Height
Average Conductor Height Phase Angle
X [ft] Y [ft] [ft] [in] [ft] [ft] [°]A 5 95 10 1.063 85.0 88.3 0B 5 85 10 1.063 75.0 78.3 240C 5 75 10 1.063 65.0 68.3 120
Shield 1 NAShield 2 NA
Structure Type:
Offset from Structure CL
Conductor Attachment
Height Conductor SagConductor Diameter
Minimum Conductor Height
Average Conductor Height Phase Angle
X [ft] Y [ft] [ft] [in] [ft] [ft] [°]A 5 60 10 1.063 50.0 53.3 0B 5 50 10 1.063 40.0 43.3 240C 5 40 10 1.063 30.0 33.3 120
Shield 1 NAShield 2 NA
Existing_Str_01
Existing_Str_02
Existing_Str_03
Existing_Str_04_line_1
Existing_Str_04_Line_2
SAN 094-2691 (SR-06) PSE (12/13/16) JB 132155 A-17 REV. 1
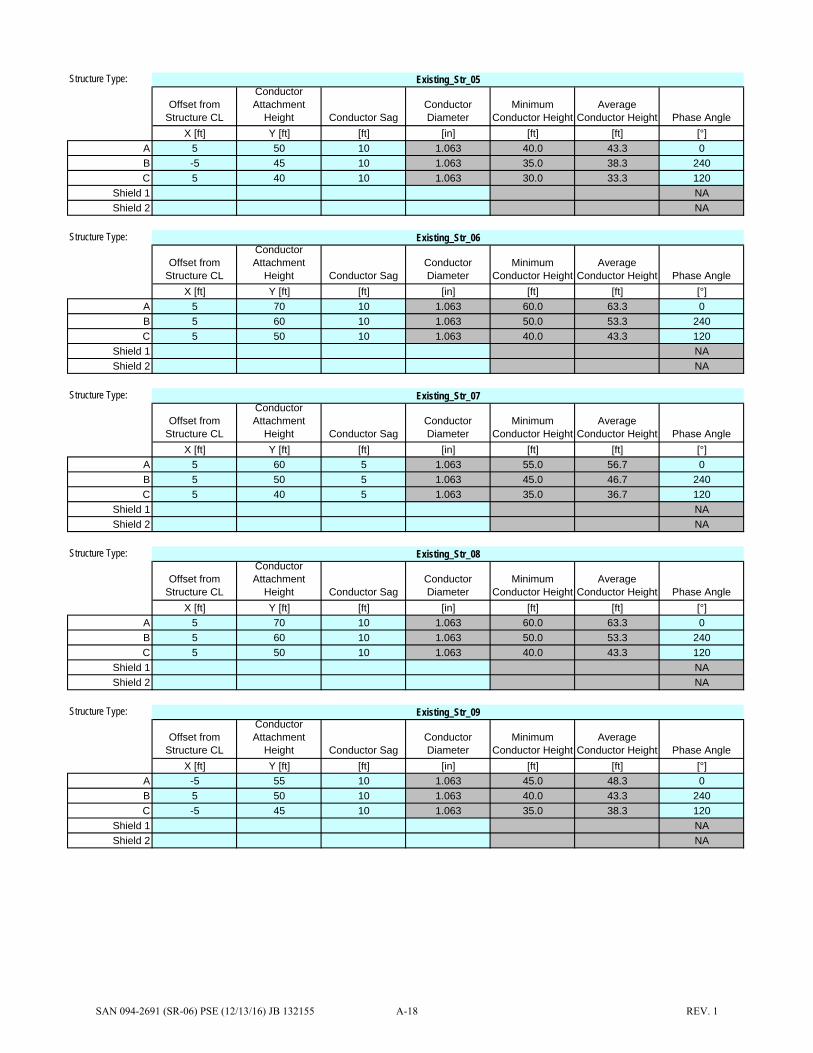
Structure Type:
Offset from Structure CL
Conductor Attachment
Height Conductor SagConductor Diameter
Minimum Conductor Height
Average Conductor Height Phase Angle
X [ft] Y [ft] [ft] [in] [ft] [ft] [°]A 5 50 10 1.063 40.0 43.3 0B -5 45 10 1.063 35.0 38.3 240C 5 40 10 1.063 30.0 33.3 120
Shield 1 NAShield 2 NA
Structure Type:
Offset from Structure CL
Conductor Attachment
Height Conductor SagConductor Diameter
Minimum Conductor Height
Average Conductor Height Phase Angle
X [ft] Y [ft] [ft] [in] [ft] [ft] [°]A 5 70 10 1.063 60.0 63.3 0B 5 60 10 1.063 50.0 53.3 240C 5 50 10 1.063 40.0 43.3 120
Shield 1 NAShield 2 NA
Structure Type:
Offset from Structure CL
Conductor Attachment
Height Conductor SagConductor Diameter
Minimum Conductor Height
Average Conductor Height Phase Angle
X [ft] Y [ft] [ft] [in] [ft] [ft] [°]A 5 60 5 1.063 55.0 56.7 0B 5 50 5 1.063 45.0 46.7 240C 5 40 5 1.063 35.0 36.7 120
Shield 1 NAShield 2 NA
Structure Type:
Offset from Structure CL
Conductor Attachment
Height Conductor SagConductor Diameter
Minimum Conductor Height
Average Conductor Height Phase Angle
X [ft] Y [ft] [ft] [in] [ft] [ft] [°]A 5 70 10 1.063 60.0 63.3 0B 5 60 10 1.063 50.0 53.3 240C 5 50 10 1.063 40.0 43.3 120
Shield 1 NAShield 2 NA
Structure Type:
Offset from Structure CL
Conductor Attachment
Height Conductor SagConductor Diameter
Minimum Conductor Height
Average Conductor Height Phase Angle
X [ft] Y [ft] [ft] [in] [ft] [ft] [°]A -5 55 10 1.063 45.0 48.3 0B 5 50 10 1.063 40.0 43.3 240C -5 45 10 1.063 35.0 38.3 120
Shield 1 NAShield 2 NA
Existing_Str_05
Existing_Str_06
Existing_Str_07
Existing_Str_08
Existing_Str_09
SAN 094-2691 (SR-06) PSE (12/13/16) JB 132155 A-18 REV. 1

APPENDIX B – POTENTIAL ROUTE SEGMENTS MAP
SAN 094-2691 (SR-06) PSE (12/13/16) JB 132155 B-1 REV. 1

#*
#*
#*
"")"")
"")
"")
"")
"")
"")
"")
"")
"")
"")"")
"")
"")
"")
"")
"")
"")
"")
"")
"")
"")
"")
"")
"")
"")
"")
"")
"")
"")
"")"")
"")"")
BeauxArts
Bellevue
Burien
ClydeHill
HuntsPoint
Issaquah
Kirkland
Medina
MercerIsland
Newcastle
Redmond
Redmond
Redmond
Renton
Renton
Seattle
Sammamish
SeaTac
Tukwila
YarrowPoint
LakesideSubstation
SammamishSubstation
Talbot HillSubstation
NE Union Hill Rd
98th
Ave N
E
196th
Ave N
E
SE May Valley Rd
Northup Way
N 30th St
Linco
ln Av
e NE
148th
Ave S
E
Hous
er Wa
y N
NE 85th St154th Ave NE
SE 128th Way
Log a
n Av
e N
SR 900
162nd Ave NE
Monro
e Av
e NE
12th Ave
Priva
te Rd
77t h
A ve S
E
NE Novelty Hill Rd
NE 3rd St
SR 900
Overl
ake
Dr E
NE 85th StNE 90th St
S 132nd St
Lakemont
Blvd SE
SE May Valley Rd
5th Pl
2 08 th
Ave N
E
Jeric
ho Av
e SE
78th
Ave S
E
S 130th St
164th
Ave S
E
1 32 n
d Av
e SE
108th
Ave N
E
Patrio
t Way
SE
N 10th St
9th Ave S
SR 90 0
W Mercer Way
Newport
Way NW
NW Sammamish Rd
7th Ave
NE 95th St
SR 900
180th
Ave N
E
NE Union Hill Rd
180t h
Ave N
E
1 2th
Ave N
W
148 th
Ave N
E
SE 128th St
216 th
A ve N
E
204th
Pl NE
SE 8th St
Marke
t St
SE Newport Way
170th
Ave N
E
NE 100th St
Lake Hills Blvd
SR 202
Union
Ave N
E
175 th
Ave S
E
104th
Ave S
E
101s
t Ave
SEB e
llevu
e Wa
y NE
Forbes
Creek Dr
148t h
A ve S
E
Kirkland Way
NE 60th St
154th Pl NE
S 112th St
195th Ave NE
212th
Ave S
E
156th
Ave S
ESE 24th St
3rd St
122n
d A v
e NE
6th St W
NE 4th St
116th
Ave S
E
Village Park Dr SE
8th S t S
SR 900
215th Pl NE
156th
Ave N
E
SE 22nd
Pl
Sahalee
Way NE
Nile
A ve N
E
SE 26th St
SR 900
Northup Way
Central Way
State
St S
NE Inglewood Hill Rd
148 th
A ve N
E
NE 70th St
164th
Ave N
E
18th Ave
NE 60th St
123rd
Ave S
E
78th
A ve S
B urn e
tt Av e
N
East
Lake
Samm
amish
Pkwy
SE
148th
Ave N
E
Lake
view
Dr NE
NE 100th St
NE Union Hill Rd
212th
Way SE
112th
Ave S
E
8 4th
A ve S
NE Bellevue
Redmond Rd8 7
th A v
e S
SE May
Valley Rd
Louis Thompson
Rd NE
Edm o
nds
Ave N
E
Main St
NE 52nd St
Jeric
ho Av
e NE
NE 51st St
NE 40th St
108th
Ave N
E
8 4th
Ave S
E
SR 900
Coal
Cree
k Pk
wy SE
West Lake
Sammamish Pkwy NE
Abe rd
een
Ave N
E
N 40th St
Everg
re en P
o int R
d
East Lake
Sammamish Pkwy NE
Hol ly Ln
116 th
Ave N
E
1 34t h
Ave N
E1 3
2 nd
Ave N
E
113th
Ave S
E
NE 8th StNE 4th St
Rain ier Ave N
NE 38th Pl
SE 20th St
Wildwood Blvd SW
Rainier Ave S
124th
Ave N
ENE 8th St
Lake
St S
SE 60th St
Uni on
Ave N
E
W Me
rcer W
ay
NE Redmond Way
Island C rest Way
NE 27th St
N 6th St
SE 34th St
140th
Ave N
E
148 th
Ave N
E
Duva
ll Ave
N E
108 th
Ave N
E
Island Crest Way
NE Novelty Hill Rd
SE 43rd Way
173rd Av e NE
7th Ave
164t h
A ve S
E
NE 80th St
Richards Rd
178th Pl NE
Will ia
ms Av
e S
208th
A ve N
E
SR 20
2
NE 60th St
E Merc
er
Way
Northup Way
140th
Ave N
E
2nd Ave S
148t h
Ave S
E
Coal Creek
Pkwy SE
W Sunset Way
Bellevue Way SE
NE 8th St
NE 104th St
Avonda
le Rd NE
NE 24th St
A-1A-2
C-1
C-2
C-3
E-1
E-2
E-3
F-1
G2-1G2-2
I-1I-2
J-1
J-2
J-3J-4
K-2
M-1M-2
M-3
M-4
M-5
N-1
N-2
Bypass-2
K-4K-3
P-1
Bypass-3
C-4
P-2
Bypass-4
Bypass-1VU520
§̈¦405
VU520
§̈¦90
§̈¦90
§̈¦405
VU167§̈¦405
§̈¦5
§̈¦5
")4
")3
")5
")6
")2
")1
LakeSammamish
LakeWashington
Redmond WatershedPreserve
Soos CreekPark and
Trail
Cougar MountainRegional
Wildland Park
MarymoorPark
Bridle TrailsStatePark
SquakMountainState Park
Cougar/SquakCorridor
LakeSammamishState Park
November 2016NOTE: Map is for illustrative purposes only. Preliminary route, pole types, andpole heights are subject to change pending design, engineering, and environmental review.
0 1 2Miles
1 inch = 6,500 feet1:78,000
Page Size: 11" x 17"
Segment 1 - RedmondSegment 2 - Bellevue NorthSegment 3 - Bellevue Central
Segment 4 - Bellevue SouthSegment 5 - NewcastleSegment 6 - Renton
"") EMF Reading Location
¯
Potential Route Segments EMF Readings
SAN 094-2691 (SR-06) PSE (12/13/16) JB 132155 B-2 REV. 1

APPENDIX C – STRUCTURE DRAWINGS
SAN 094-2691 (SR-06) PSE (12/13/16) JB 132155 C-1 REV. 1

Figure 1
SAN 094-2691 (SR-06) PSE (12/13/16) JB 132155 C-2 REV. 1

Figure 2
SAN 094-2691 (SR-06) PSE (12/13/16) JB 132155 C-3 REV. 1

Figure 3
SAN 094-2691 (SR-06) PSE (12/13/16) JB 132155 C-4 REV. 1
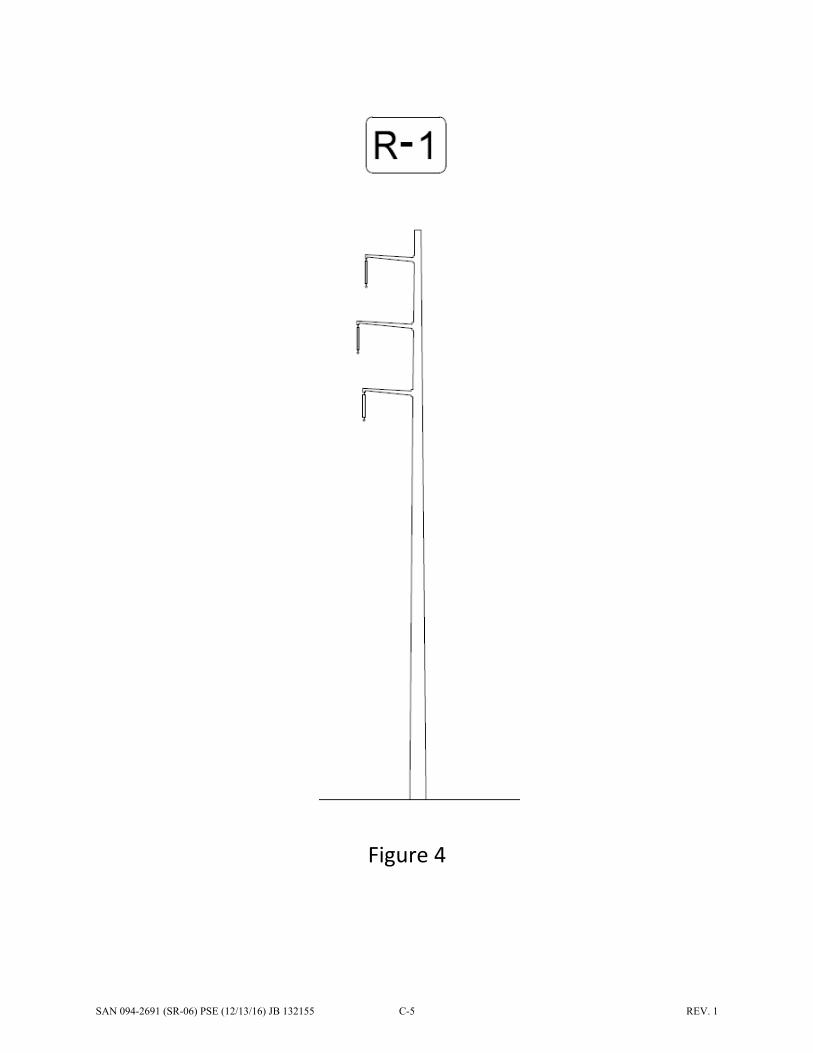
Figure 4
SAN 094-2691 (SR-06) PSE (12/13/16) JB 132155 C-5 REV. 1

Figure 5
SAN 094-2691 (SR-06) PSE (12/13/16) JB 132155 C-6 REV. 1

Figure 6
SAN 094-2691 (SR-06) PSE (12/13/16) JB 132155 C-7 REV. 1

Figure 7
SAN 094-2691 (SR-06) PSE (12/13/16) JB 132155 C-8 REV. 1

Figure 8
SAN 094-2691 (SR-06) PSE (12/13/16) JB 132155 C-9 REV. 1

APPENDIX D – EMF PLOTS
SAN 094-2691 (SR-06) PSE (12/13/16) JB 132155 D-1 REV. 1

Section A-1: Electric Field
Section A-1: Magnetic Field
Case
Max
Edge of
ROW
(kV/m) (kV/m)
Existing Configuration
1.487
1.292
Upgraded Configuration
1.654
0.631
Case
Max
Edge of
ROW
(mG) (mG)
Existing Configuration (Average)
10.46
6.02
Upgraded Configuration (Winter Peak)
33.54
24.39
Limit of 4.16 kV/m at edge of ROW
Limit of 2,000 mG at edge of ROW
Upgraded Configuration
SAN 094-2691 (SR-06) PSE (12/13/16) JB 132155 D-2 REV. 1

Section A-2: Electric Field
Section A-2: Magnetic Field
Case
Max
Edge of
ROW
(kV/m) (kV/m)
Existing Configuration
1.487
1.292
Upgraded Configuration
1.654
0.631
Case
Max
Edge of
ROW
(mG) (mG)
Existing Configuration (Average)
10.46
6.02
Upgraded Configuration (Winter Peak)
33.54
24.39
Limit of 4.16 kV/m at edge of ROW
Limit of 2,000 mG at edge of ROW
Upgraded Configuration
SAN 094-2691 (SR-06) PSE (12/13/16) JB 132155 D-3 REV. 1

Section C-1: Electric Field
Section C-1: Magnetic Field
Case
Max
Edge of
ROW
(kV/m) (kV/m)
Existing Configuration
1.487
1.292
Upgraded Configuration
1.654
0.631
Case
Max
Edge of
ROW
(mG) (mG)
Existing Configuration (Average)
10.46
6.02
Upgraded Configuration (Winter Peak)
33.54
24.39
Limit of 4.16 kV/m at edge of ROW
Limit of 2,000 mG at edge of ROW
Upgraded Configuration
SAN 094-2691 (SR-06) PSE (12/13/16) JB 132155 D-4 REV. 1

Section C-2: Electric Field
Section C-2: Magnetic Field
Case
Max
Edge of
ROW
(kV/m) (kV/m)
Existing Configuration
1.487
1.292
Upgraded Configuration
1.654
0.631
Case
Max
Edge of
ROW
(mG) (mG)
Existing Configuration (Average)
12.01
7.94
Upgraded Configuration (Winter Peak)
33.54
24.39
Limit of 4.16 kV/m at edge of ROW
Limit of 2,000 mG at edge of ROW
Upgraded Configuration
SAN 094-2691 (SR-06) PSE (12/13/16) JB 132155 D-5 REV. 1

Section C-3: Electric Field
Section C-3: Magnetic Field
Case
Max
Edge of
ROW
(kV/m) (kV/m)
Existing Configuration
1.487
1.292
Upgraded Configuration
1.654
0.631
Case
Max
Edge of
ROW
(mG) (mG)
Existing Configuration (Average)
12.01
7.94
Upgraded Configuration (Winter Peak)
33.54
24.39
Limit of 4.16 kV/m at edge of ROW
Limit of 2,000 mG at edge of ROW
Upgraded Configuration
SAN 094-2691 (SR-06) PSE (12/13/16) JB 132155 D-6 REV. 1

Section C-4: Electric Field
Section C-4: Magnetic Field
Case
Max
Edge of
ROW
(kV/m) (kV/m)
Existing Configuration
1.487
1.292
Upgraded Configuration
1.654
0.631
Case
Max
Edge of
ROW
(mG) (mG)
Existing Configuration (Average)
12.01
7.94
Upgraded Configuration (Winter Peak)
33.54
24.39
Limit of 4.16 kV/m at edge of ROW
Limit of 2,000 mG at edge of ROW
Upgraded Configuration
SAN 094-2691 (SR-06) PSE (12/13/16) JB 132155 D-7 REV. 1

Section E-1: Electric Field
Section E-1: Magnetic Field
Case
Max
Edge of
ROW
(kV/m) (kV/m)
Existing Configuration
1.487
1.292
Upgraded Configuration
1.654
0.631
Case
Max
Edge of
ROW
(mG) (mG)
Existing Configuration (Average)
10.46
6.02
Upgraded Configuration (Winter Peak)
33.54
24.39
Limit of 4.16 kV/m at edge of ROW
Limit of 2,000 mG at edge of ROW
Upgraded Configuration
SAN 094-2691 (SR-06) PSE (12/13/16) JB 132155 D-8 REV. 1

Section E-2: Electric Field
Section E-2: Magnetic Field
Case
Max
Edge of
ROW
(kV/m) (kV/m)
Existing Configuration
1.487
1.292
Upgraded Configuration
1.654
0.631
Case
Max
Edge of
ROW
(mG) (mG)
Existing Configuration (Average)
12.01
7.94
Upgraded Configuration (Winter Peak)
33.54
24.39
Limit of 4.16 kV/m at edge of ROW
Limit of 2,000 mG at edge of ROW
Upgraded Configuration
SAN 094-2691 (SR-06) PSE (12/13/16) JB 132155 D-9 REV. 1
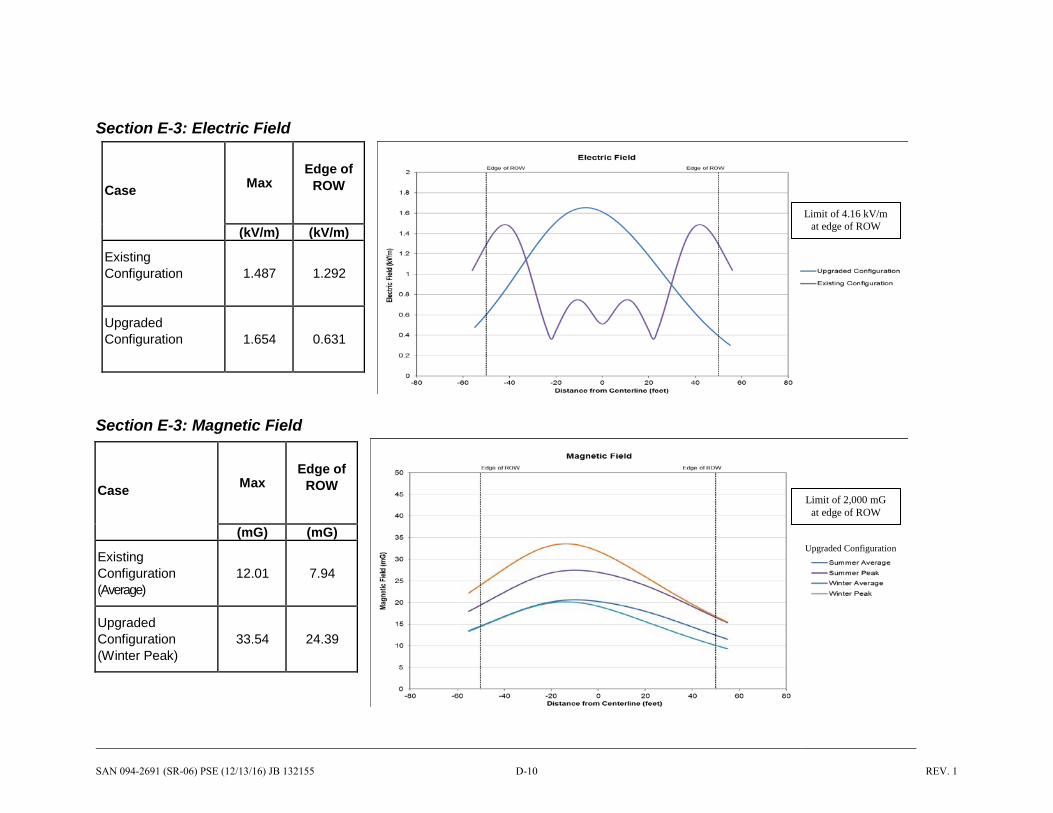
Section E-3: Electric Field
Section E-3: Magnetic Field
Case
Max
Edge of
ROW
(kV/m) (kV/m)
Existing Configuration
1.487
1.292
Upgraded Configuration
1.654
0.631
Case
Max
Edge of
ROW
(mG) (mG)
Existing Configuration (Average)
12.01
7.94
Upgraded Configuration (Winter Peak)
33.54
24.39
Limit of 4.16 kV/m at edge of ROW
Limit of 2,000 mG at edge of ROW
Upgraded Configuration
SAN 094-2691 (SR-06) PSE (12/13/16) JB 132155 D-10 REV. 1

Section Bypass1: Electric Field
Section Bypass1: Magnetic Field
Case
Max
Edge of
ROW
(kV/m) (kV/m)
Upgraded Configuration
0.908
0.807
Case
Max
Edge of
ROW
(mG) (mG)
Upgraded Configuration (Winter Peak)
20.62
19.6
Limit of 4.16 kV/m at edge of ROW
Limit of 2,000 mG at edge of ROW
Upgraded Configuration
SAN 094-2691 (SR-06) PSE (12/13/16) JB 132155 D-11 REV. 1

Section Bypass2: Electric Field
Section Bypass2: Magnetic Field
Case
Max
Edge of
ROW
(kV/m) (kV/m)
Upgraded Configuration
0.908
0.807
Case
Max
Edge of
ROW
(mG) (mG)
Upgraded Configuration (Winter Peak)
20.62
19.6
Limit of 4.16 kV/m at edge of ROW
Limit of 2,000 mG at edge of ROW
Upgraded Configuration
SAN 094-2691 (SR-06) PSE (12/13/16) JB 132155 D-12 REV. 1

Section F-1: Electric Field
Section F-1: Magnetic Field
Case
Max
Edge of
ROW
(kV/m) (kV/m)
Upgraded Configuration
0.908
0.807
Case
Max
Edge of
ROW
(mG) (mG)
Upgraded Configuration (Winter Peak)
20.62
19.6
Limit of 4.16 kV/m at edge of ROW
Limit of 2,000 mG at edge of ROW
Upgraded Configuration
SAN 094-2691 (SR-06) PSE (12/13/16) JB 132155 D-13 REV. 1

Section Bypass3: Electric Field
Section Bypass3: Magnetic Field
Case
Max
Edge of
ROW
(kV/m) (kV/m)
Upgraded Configuration
0.908
0.807
Case
Max
Edge of
ROW
(mG) (mG)
Upgraded Configuration (Winter Peak)
20.62
19.6
Limit of 4.16 kV/m at edge of ROW
Limit of 2,000 mG at edge of ROW
Upgraded Configuration
SAN 094-2691 (SR-06) PSE (12/13/16) JB 132155 D-14 REV. 1

Section Bypass4: Electric Field
Section Bypass4: Magnetic Field
Case
Max
Edge of
ROW
(kV/m) (kV/m)
Upgraded Configuration
0.908
0.807
Case
Max
Edge of
ROW
(mG) (mG)
Upgraded Configuration (Winter Peak)
20.62
19.6
Limit of 4.16 kV/m at edge of ROW
Limit of 2,000 mG at edge of ROW
Upgraded Configuration
SAN 094-2691 (SR-06) PSE (12/13/16) JB 132155 D-15 REV. 1

Section G2-1: Electric Field
Section G2-1: Magnetic Field
Case
Max
Edge of
ROW
(kV/m) (kV/m)
Existing Configuration
0.793
0.522
Upgraded Configuration
3.08
1.534
Case
Max
Edge of
ROW
(mG) (mG)
Existing Configuration (Average)
14.78
10.65
Upgraded Configuration (Winter Peak)
157.73
125.73
Limit of 4.16 kV/m at edge of ROW
Limit of 2,000 mG at edge of ROW
Upgraded Configuration
SAN 094-2691 (SR-06) PSE (12/13/16) JB 132155 D-16 REV. 1

Section G2-2: Electric Field
Section G2-2: Magnetic Field
Case
Max
Edge of
ROW
(kV/m) (kV/m)
Existing Configuration
0.793
0.522
Upgraded Configuration
3.08
1.534
Case
Max
Edge of
ROW
(mG) (mG)
Existing Configuration (Average)
14.78
10.65
Upgraded Configuration (Winter Peak)
157.73
125.73
Limit of 4.16 kV/m at edge of ROW
Limit of 2,000 mG at edge of ROW
Upgraded Configuration
SAN 094-2691 (SR-06) PSE (12/13/16) JB 132155 D-17 REV. 1

Section I-1 Oak1: Electric Field
Section I-1 Oak1: Magnetic Field
Case
Max
Edge of
ROW
(kV/m) (kV/m)
Existing Configuration
0.645
0.423
Upgraded Configuration
3.054
1.653
Case
Max
Edge of
ROW
(mG) (mG)
Existing Configuration (Average)
11.76
5.79
Upgraded Configuration (Winter Peak)
161.27
127.46
Limit of 4.16 kV/m at edge of ROW
Limit of 2,000 mG at edge of ROW
Upgraded Configuration
SAN 094-2691 (SR-06) PSE (12/13/16) JB 132155 D-18 REV. 1

Section I-1: Electric Field
Section I-1: Magnetic Field
Case
Max
Edge of
ROW
(kV/m) (kV/m)
Existing Configuration
0.645
0.423
Upgraded Configuration
1.957
1.159
Case
Max
Edge of ROW e
(mG) (mG)
Existing Configuration (Average)
11.76
5.79
Upgraded Configuration (Winter Peak)
107.88
89.55
Limit of 4.16 kV/m at edge of ROW
Limit of 2,000 mG at edge of ROW
Upgraded Configuration
SAN 094-2691 (SR-06) PSE (12/13/16) JB 132155 D-19 REV. 1

Section I-2 Oak1: Electric Field
Section I-2 Oak1: Magnetic Field
Case
Max
Edge of
ROW
(kV/m) (kV/m)
Existing Configuration
0.645
0.423
Upgraded Configuration
3.054
1.653
Case
Max
Edge of
ROW
(mG) (mG)
Existing Configuration (Average)
11.76
5.79
Upgraded Configuration (Winter Peak)
161.27
127.46
Limit of 4.16 kV/m at edge of ROW
Limit of 2,000 mG at edge of ROW
Upgraded Configuration
SAN 094-2691 (SR-06) PSE (12/13/16) JB 132155 D-20 REV. 1

Section I-2 Oak2: Electric Field
Section I-2 Oak2: Magnetic Field
Case
Max
Edge of
ROW
(kV/m) (kV/m)
Existing Configuration
0.645
0.585
Upgraded Configuration
0.939
0.716
Case
Max
Edge of
ROW
(mG) (mG)
Existing Configuration (Average)
11.76
5.79
Upgraded Configuration (Winter Peak)
48.06
42.84
Limit of 4.16 kV/m at edge of ROW
Limit of 2,000 mG at edge of ROW
Upgraded Configuration
SAN 094-2691 (SR-06) PSE (12/13/16) JB 132155 D-21 REV. 1

Section I-2 Willow2: Electric Field
Section I-2 Willow2: Magnetic Field
Case
Max
Edge of
ROW
(kV/m) (kV/m)
Existing Configuration
0.645
0.585
Upgraded Configuration
1.957
1.159
Case
Max
Edge of
ROW
(mG) (mG)
Existing Configuration (Average)
11.76
5.79
Upgraded Configuration (Winter Peak)
107.88
89.55
Limit of 4.16 kV/m at edge of ROW
Limit of 2,000 mG at edge of ROW
Upgraded Configuration
SAN 094-2691 (SR-06) PSE (12/13/16) JB 132155 D-22 REV. 1

Section P-1: Electric Field
Section P-1: Magnetic Field
Case
Max
Edge of
ROW
(kV/m) (kV/m)
Upgraded Configuration
0.939
0.716
Case
Max
Edge of
ROW
(mG) (mG)
Upgraded Configuration (Winter Peak)
48.06
42.84
Limit of 4.16 kV/m at edge of ROW
Limit of 2,000 mG at edge of ROW
Upgraded Configuration
SAN 094-2691 (SR-06) PSE (12/13/16) JB 132155 D-23 REV. 1

Section P-2: Electric Field
Section P-2: Magnetic Field
Case
Max
Edge of
ROW
(kV/m) (kV/m)
Upgraded Configuration
0.939
0.716
Case
Max
Edge of
ROW
(mG) (mG)
Upgraded Configuration (Winter Peak)
48.06
42.84
Limit of 4.16 kV/m at edge of ROW
Limit of 2,000 mG at edge of ROW
Upgraded Configuration
SAN 094-2691 (SR-06) PSE (12/13/16) JB 132155 D-24 REV. 1

Section K-3 for Oak1: Electric Field
Section K-3 for Oak1: Magnetic Field
Case
Max
Edge of
ROW
(kV/m) (kV/m)
Upgraded Configuration
3.054
1.653
Case
Max
Edge of
ROW
(mG) (mG)
Upgraded Configuration (Winter Peak)
161.27
127.46
Limit of 4.16 kV/m at edge of ROW
Limit of 2,000 mG at edge of ROW
Upgraded Configuration
SAN 094-2691 (SR-06) PSE (12/13/16) JB 132155 D-25 REV. 1

Section K-3: Electric Field
Section K-3: Magnetic Field
Case
Max
Edge of
ROW
(kV/m) (kV/m)
Upgraded Configuration
0.939
0.716
Case
Max
Edge of
ROW
(mG) (mG)
Upgraded Configuration (Winter Peak)
48.06
42.84
Limit of 4.16 kV/m at edge of ROW
Limit of 2,000 mG at edge of ROW
Upgraded Configuration
SAN 094-2691 (SR-06) PSE (12/13/16) JB 132155 D-26 REV. 1

Section K-4 for Oak1: Electric Field
Section K-4 for Oak1: Magnetic Field
Case
Max
Edge of
ROW
(kV/m) (kV/m)
Upgraded Configuration
3.054
1.653
Case
Max
Edge of
ROW
(mG) (mG)
Upgraded Configuration (Winter Peak)
161.27
127.46
Limit of 4.16 kV/m at edge of ROW
Limit of 2,000 mG at edge of ROW
Upgraded Configuration
SAN 094-2691 (SR-06) PSE (12/13/16) JB 132155 D-27 REV. 1

Section K-4: Electric Field
Section K-4: Magnetic Field
Case
Max
Edge of
ROW
(kV/m) (kV/m)
Upgraded Configuration
0.939
0.716
Case
Max
Edge of
ROW
(mG) (mG)
Upgraded Configuration (Winter Peak)
48.06
42.84
Limit of 4.16 kV/m at edge of ROW
Limit of 2,000 mG at edge of ROW
Upgraded Configuration
SAN 094-2691 (SR-06) PSE (12/13/16) JB 132155 D-28 REV. 1

Section J-1 for Willow1: Electric Field
Section J-1 for Willow1: Magnetic Field
Case
Max
Edge of
ROW
(kV/m) (kV/m)
Existing Configuration
1.487
1.292
Upgraded Configuration
1.654
0.631
Case
Max
Edge of
ROW
(mG) (mG)
Existing Configuration (Average)
99.42
67.58
Upgraded Configuration (Winter Peak)
81.53
58.46
Limit of 4.16 kV/m at edge of ROW
Limit of 2,000 mG at edge of ROW
Upgraded Configuration
SAN 094-2691 (SR-06) PSE (12/13/16) JB 132155 D-29 REV. 1

Section J-1: Electric Field
Section J-1: Magnetic Field
Case
Max
Edge of
ROW
(kV/m) (kV/m)
Existing Configuration
1.487
1.292
Upgraded Configuration
1.686
1.407
Case
Max
Edge of
ROW
(mG) (mG)
Existing Configuration (Average)
99.42
67.58
Upgraded Configuration (Winter Peak)
147.3
81.68
Limit of 4.16 kV/m at edge of ROW
Limit of 2,000 mG at edge of ROW
Upgraded Configuration
SAN 094-2691 (SR-06) PSE (12/13/16) JB 132155 D-30 REV. 1

Section J-2 for Willow1: Electric Field
Section J-2 for Willow1: Magnetic Field
Case
Max
Edge of
ROW
(kV/m) (kV/m)
Existing Configuration
1.487
1.292
Upgraded Configuration
0.965
0.838
Case
Max
Edge of
ROW
(mG) (mG)
Existing Configuration (Average)
99.42
67.58
Upgraded Configuration (Winter Peak)
38.97
35.89
Limit of 4.16 kV/m at edge of ROW
Limit of 2,000 mG at edge of ROW
Upgraded Configuration
SAN 094-2691 (SR-06) PSE (12/13/16) JB 132155 D-31 REV. 1

Section J-2: Electric Field
Section J-2: Magnetic Field
Case
Max
Edge of
ROW
(kV/m) (kV/m)
Existing Configuration
1.487
1.292
Upgraded Configuration
1.686
1.407
Case
Max
Edge of
ROW
(mG) (mG)
Existing Configuration (Average)
99.42
67.58
Upgraded Configuration (Winter Peak)
147.3
81.68
Limit of 4.16 kV/m at edge of ROW
Limit of 2,000 mG at edge of ROW
Upgraded Configuration
SAN 094-2691 (SR-06) PSE (12/13/16) JB 132155 D-32 REV. 1

Section J-3 for Willow1: Electric Field
Section J-3 for Willow1: Magnetic Field
Case
Max
Edge of
ROW
(kV/m) (kV/m)
Existing Configuration
1.487
1.292
Upgraded Configuration
0.965
0.838
Case
Max
Edge of
ROW
(mG) (mG)
Existing Configuration (Average)
99.42
67.58
Upgraded Configuration (Winter Peak)
38.97
35.89
Limit of 4.16 kV/m at edge of ROW
Limit of 2,000 mG at edge of ROW
Upgraded Configuration
SAN 094-2691 (SR-06) PSE (12/13/16) JB 132155 D-33 REV. 1

Section J-3: Electric Field
Section J-3: Magnetic Field
Case
Max
Edge of
ROW
(kV/m) (kV/m)
Existing Configuration
1.487
1.292
Upgraded Configuration
1.686
1.407
Case
Max
Edge of
ROW
(mG) (mG)
Existing Configuration (Average)
99.42
67.58
Upgraded Configuration (Winter Peak)
147.3
81.68
Limit of 4.16 kV/m at edge of ROW
Limit of 2,000 mG at edge of ROW
Upgraded Configuration
SAN 094-2691 (SR-06) PSE (12/13/16) JB 132155 D-34 REV. 1

Section K-2 for Oak1: Electric Field
Section K-2 for Oak1: Magnetic Field
Case
Max
Edge of
ROW
(kV/m) (kV/m)
Existing Configuration
0.645
0.423
Upgraded Configuration
3.054
1.653
Case
Max
Edge of
ROW
(mG) (mG)
Existing Configuration (Average)
3.02
1.49
Upgraded Configuration (Winter Peak)
161.27
127.46
Limit of 4.16 kV/m at edge of ROW
Limit of 2,000 mG at edge of ROW
Upgraded Configuration
SAN 094-2691 (SR-06) PSE (12/13/16) JB 132155 D-35 REV. 1

Section K-2: Electric Field
Section K-2: Magnetic Field
Case
Max
Edge of
ROW
(kV/m) (kV/m)
Existing Configuration
0.645
0.585
Upgraded Configuration
0.939
0.716
Case
Max
Edge of
ROW
(mG) (mG)
Existing Configuration (Average)
3.02
1.49
Upgraded Configuration (Winter Peak)
48.06
42.84
Limit of 4.16 kV/m at edge of ROW
Limit of 2,000 mG at edge of ROW
Upgraded Configuration
SAN 094-2691 (SR-06) PSE (12/13/16) JB 132155 D-36 REV. 1

Section J-4: Electric Field
Section J-4: Magnetic Field
Case
Max
Edge of
ROW
(kV/m) (kV/m)
Existing Configuration
1.487
1.292
Upgraded Configuration
0.965
0.838
Case
Max
Edge of
ROW
(mG) (mG)
Existing Configuration (Average)
99.42
67.58
Upgraded Configuration (Winter Peak)
38.97
35.89
Limit of 4.16 kV/m at edge of ROW
Limit of 2,000 mG at edge of ROW
Upgraded Configuration
SAN 094-2691 (SR-06) PSE (12/13/16) JB 132155 D-37 REV. 1

Section M-1: Electric Field
Section M-1: Magnetic Field
Case
Max
Edge of
ROW
(kV/m) (kV/m)
Existing Configuration
1.487
1.292
Upgraded Configuration
0.965
0.838
Case
Max
Edge of
ROW
(mG) (mG)
Existing Configuration (Average)
99.42
67.58
Upgraded Configuration (Winter Peak)
38.97
35.89
Limit of 4.16 kV/m at edge of ROW
Limit of 2,000 mG at edge of ROW
Upgraded Configuration
SAN 094-2691 (SR-06) PSE (12/13/16) JB 132155 D-38 REV. 1

Section M-2: Electric Field
Section M-2: Magnetic Field
Case
Max
Edge of
ROW
(kV/m) (kV/m)
Existing Configuration
1.487
1.292
Upgraded Configuration
0.965
0.838
Case
Max
Edge of
ROW
(mG) (mG)
Existing Configuration (Average)
99.42
67.58
Upgraded Configuration (Winter Peak)
38.97
35.89
Limit of 4.16 kV/m at edge of ROW
Limit of 2,000 mG at edge of ROW
Upgraded Configuration
SAN 094-2691 (SR-06) PSE (12/13/16) JB 132155 D-39 REV. 1

Section M-3: Electric Field
Section M-3: Magnetic Field
Case
Max
Edge of
ROW
(kV/m) (kV/m)
Existing Configuration
1.487
1.292
Upgraded Configuration
0.965
0.838
Case
Max
Edge of
ROW
(mG) (mG)
Existing Configuration (Average)
99.42
67.58
Upgraded Configuration (Winter Peak)
38.97
35.89
Limit of 4.16 kV/m at edge of ROW
Limit of 2,000 mG at edge of ROW
Upgraded Configuration
SAN 094-2691 (SR-06) PSE (12/13/16) JB 132155 D-40 REV. 1

Section M-4: Electric Field
Section M-4: Magnetic Field
Case
Max
Edge of
ROW
(kV/m) (kV/m)
Existing Configuration
1.487
1.292
Upgraded Configuration
1.654
0.631
Case
Max
Edge of
ROW
(mG) (mG)
Existing Configuration (Average)
99.42
67.58
Upgraded Configuration (Winter Peak)
33.54
24.39
Limit of 4.16 kV/m at edge of ROW
Limit of 2,000 mG at edge of ROW
Upgraded Configuration
SAN 094-2691 (SR-06) PSE (12/13/16) JB 132155 D-41 REV. 1

Section M-5: Electric Field
Section M-5: Magnetic Field
Case
Max
Edge of
ROW
(kV/m) (kV/m)
Existing Configuration
1.487
1.292
Upgraded Configuration
1.654
0.631
Case
Max
Edge of
ROW
(mG) (mG)
Existing Configuration (Average)
99.42
67.58
Upgraded Configuration (Winter Peak)
33.54
24.39
Limit of 4.16 kV/m at edge of ROW
Limit of 2,000 mG at edge of ROW
Upgraded Configuration
SAN 094-2691 (SR-06) PSE (12/13/16) JB 132155 D-42 REV. 1

Section N-1: Electric Field
Section N-1: Magnetic Field
Case
Max
Edge of
ROW
(kV/m) (kV/m)
Existing Configuration
1.487
1.292
Upgraded Configuration
1.654
0.631
Case
Max
Edge of
ROW
(mG) (mG)
Existing Configuration (Average)
132.71
80.70
Upgraded Configuration (Winter Peak)
33.54
24.39
Limit of 4.16 kV/m at edge of ROW
Limit of 2,000 mG at edge of ROW
Upgraded Configuration
SAN 094-2691 (SR-06) PSE (12/13/16) JB 132155 D-43 REV. 1

Section N-2: Electric Field
Section N-2: Magnetic Field
Case
Max
Edge of
ROW
(kV/m) (kV/m)
Existing Configuration
1.487
1.292
Upgraded Configuration
1.654
0.631
Case
Max
Edge of
ROW
(mG) (mG)
Existing Configuration (Average)
122.94
85.64
Upgraded Configuration (Winter Peak)
33.54
24.39
Limit of 4.16 kV/m at edge of ROW
Limit of 2,000 mG at edge of ROW
Upgraded Configuration
SAN 094-2691 (SR-06) PSE (12/13/16) JB 132155 D-44 REV. 1