pulpwood production ; , ' in the north.central en , on, 1990 … · pulpwood production in the...
TRANSCRIPT

H AgricultureU:i¢:dStatte:f Pulpwood Production;_,_'_ In The North.Central_o_Centra,Regi 990ForestExperiment_tation on, 1ResourceBulletin NC-140
Ronald L. Hackett
.... ..=,

North Central Forest Experiment StationForest Service - U.S. Department of Agriculture
1992 Folwell AvenueSt. Paul, Minnesota 55108
Manuscript approved for publication April 6, 19921992
0
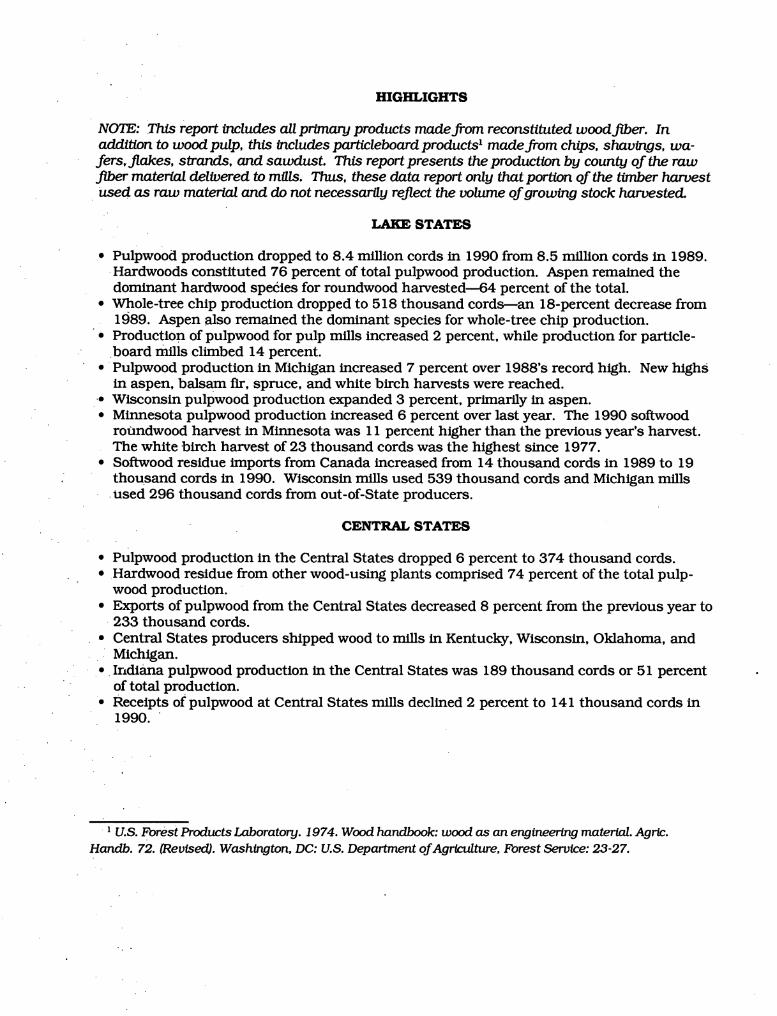
HIGHLIGHTS
NOTE: This report includes all primary products made from reconstituted wood fiber. Inaddition to wood pulp, this includes particleboard products _made from chips, shavings, wa-
fers, flakes, strands, and sawdust. This report presents the production by county of the rawfiber material delivered to mills. Thus, these data report only that portion of the timber harvestused as raw material and do not necessarily reflect the volume of growing stock harvested.
LAKE STATES
• Pulpwood production dropped to 8.4 million cords in 1990 from 8.5 million cords in 1989.•Hardwoods constituted 76 percent of total pulpwood production. Aspen remained thedominant hardwood species for roundwood harvested--64 percent of the total.
• Whole-tree chip production dropped to 518 thousand cords--an 18-percent decrease from1989. Aspen also remained the dominant species for whole-tree chip production.
• Production of pulpwood for pulp mills increased 2 percent, while production for particle-board mills climbed 14 percent.
• Pulpwood production in Michigan increased 7 percent over 1988's record high. New highsin aspen, balsam fir, spruce, and white birch harvests were reached.
-* Wisconsin pulpwood production expanded 3 percent, primarily in aspen.• Minnesota pulpwood production increased 6 percent over last year. The 1990 softwood
roundwood harvest in Minnesota was 11 percent higher than the previous year's harvest.The white birch harvest of 23 thousand cords was the highest since 1977.
• Softwood residue imports from Canada increased from 14 thousand cords in 1989 to 19. thousand cords in 1990. Wisconsin mills used 539 thousand cords and Michigan mills
used 296 thousand cords from out-of-State producers.
CENTRAL STATES
• Pulpwood production in the Central States dropped 6 percent to 374 thousand cords.* Hardwood residue from other wood-using plants comprised 74 percent of the total pulp-
wood production.• Exports of pulpwood from the Central States decreased 8 percent from the previous year to
233 thousand cords.
° Central States producers shipped wood to mills in Kentucky, Wisconsin, Oklahoma, andMichigan.
• Indiana pulpwood production in the Central States was 189 thousand cords or 51 percentof total production.
° Receipts of pulpwood at Central States mills declined 2 percent to 141 thousand cords in• 1990.
i U.S. Forest Products Laboratory. 1974. Wood handbook: wood as an engineering material. Agric.Handb. 72. (Revised). Washington, DC: U.S. Department of AgHctdture, Forest Service: 23-27.

CONTENTS
PageLake States ........................................................................................ 2
Production ...................................................................................... 2-.
Receipts ......................................................................................... 14Industry Trends and Analysis ......................................................... 15
Central States ................................................................................... 18, -Production ..................................................................................... 18
Receipts ......................................................................................... 20Industry Trends and Analysis ......................................................... 20
Appendix .......................................................................................... 20
ii
i,
!
I
i
o
i
i
i
I
li
II
II
I

Pulpwood Production In The North-CentralRegion, 1990
Ronald L. Hackett-.
Pulpwood constitutes more than half the indus- origin. This report presents the results of thetrial timber products harvested annually in the survey, analyzes the data, compares resultsLake States (Michigan, Minnesota, and Wiscon- with those of 1989 or earlier years, and dis-sin) and is an important product in the Central cusses trends in pulpwood production and use.States (IUinois, Indiana, Iowa, and Missouri).
The Lake States and Central States are dis-
Current detailed informatiOn about pulpwood cussed separately because the timber types inproduction 2 is necessary for intelligent planning each area are different, the flow of wood be-and decisionmaking in wood procurement, tween the areas is nominal, and more detailedforest resource management, forest industry de- data on pulpwood production and receipts invelopment, and scientific studies, the Central States would reveal the operations
of individual mills. This is the 32nd annual
Since i979, we have included logs, bolts, and report of the pulpwood harvest in Lake StatesWood residue used in manufacturing hardboard, counties and the 31st annual report of theflakeboard, waferboard, oriented strand board, Central States harvest.and medium density fiberboard in this annualreport. Together, these products are called Several mills purchase their pulpwood based onparticleboards, and all mills manufacturing weight rather than volume. Conversion factorsthese boards will be called particleboard mills in used in the Lake States to convert green tons ofthis paper. Wood used at particleboard mills is pulpwood to standard cord equivalents areidentical or nearly identical to wood used at shown in the Appendix. Conversion factorspulp mills; therefore, including this wood in our used in the Central States are shown in footnotestudy provides a more accurate estimate of 1 of table 4.
demand for pulpwood-like material. Pulpwood production in Minnesota is completely
Particleboard mills were in their infancy before and accurately shown. However, to prevent1979 and used primarily aspen and wood resi- disclosure of confidential information aboutdue. Therefore, data for these mills do not pulpwood use by individual companies, the totaldistort roundwood use trends for other species quantity of pulpwood imports and exports be-norpreclUde comparing 1990 survey results tween Minnesota and Canada is not reported.with those of 1978 and previous years. Thus, some Minnesota softwood shipped to• Canada is shown as remaining and used in
Pulp and particleboard mills using North Cen- Minnesota, and receipts of Canadian softwoodtral States timber in 1990 reported their pulp- in Minnesota may be understated.wood receipts 3 by species group and county of
2Pulpwoodproduction, determlnedfrom mill receipts,is the annual volume of pulpwood cut, plus the annualRonald L, Hackett, Research Forester, receivedwood residue volume produced by sawmills, veneer
a B.S. degree in forest resources from the Uni- mills, etc., used for ptdp, partlcleboard, waferboard,versity of MinnesOta. He joined the Forest oriented strand board, or medium density fiberboard.Service in December 1974, and has been work- z Pulpwood recefpts are the volume of wood receiveding With the North Central Station's Forest In- by mills in a specific State or region, regardless of theventory and Analysis Unit since, geographic source.

I
I
I
LAKE STATES Hardwoods constituted 76 percent of the totalpulpwood production In 1990. Pulpwood from
Production hardwood residue declined 47 thousand cords' (10 percent) from 1989's 464 thousand cords.
Pulpwood production as a whole dropped by 1 Aspen remained the dominant roundwood' percent from 8.5 million cords in 1989 to 8.4 harvested--46 percent of the total. Jack pine, million cords 4 in 1990 (table I). Of each cord (647 thousand cords), hard maple (530 thou-
produced, 93 percent came from roundwood sand cords), soft maple (443 thousand cords),, (including chips from roundwood) and 7 percent and balsam poplar (116 thousand cords) were at. came from residue 5 from wood-using plants (fig. record production levels in 1990.
1).' Softwood roundwood production in 1990' ' reached a new high of 1.83 million cords. Pulp-' wood production from softwood residue declined
to 159 thousand cords, a decrease of 5 percent, from last year. Increases in jack pine (647, thousand cords), red pine (368 thousand cords),
hemlock (94 thousand cords), and tamarack (21l thousand cords) offset losses in cedar, balsam' fir, and spruce (fig. 2).
i|OTHER
i SOFTWOODS2% _ 700
: "° 1,-!' o= I= ,,,°IOi D
z 4o0<ffl
O 300Zk-
z-- 200
Figure 1._Lake States pulpwood production by. species group, 1990. _oo
o
P l-incipal species harvested were aspen (3.9 Cedar 8aslam Hemlock Jack Red White Spruce TamarackR,_dues
million cOrds) Jack pine (647 thousand cords) nr pine pi_ pine• , Species
, hard maple (530 thousand cords), and whitebirch (494 thousand cords). Other major
I species furnishing more than 300 thousand Figure 2._Softwood pulpwood production in the, cords were balsam fir, red pine, and soft maple. Lake States, 1989-1990.
I
, 4Ail references to cords are in standard cords. Astandard cord is 128 cubic feet of wood, bark, and air
= space."s Res_tue is the byproduct from sawmills, veneerI.
mills, cooperage mills, and other wood-using mills that[ is usedforpulplng andparticleboard. Residue! includes slabs, edglngs, veneer cores, sawdust,
woodJlo_, and chlps manufactured from slabs,edgings, and veneer cores.
2
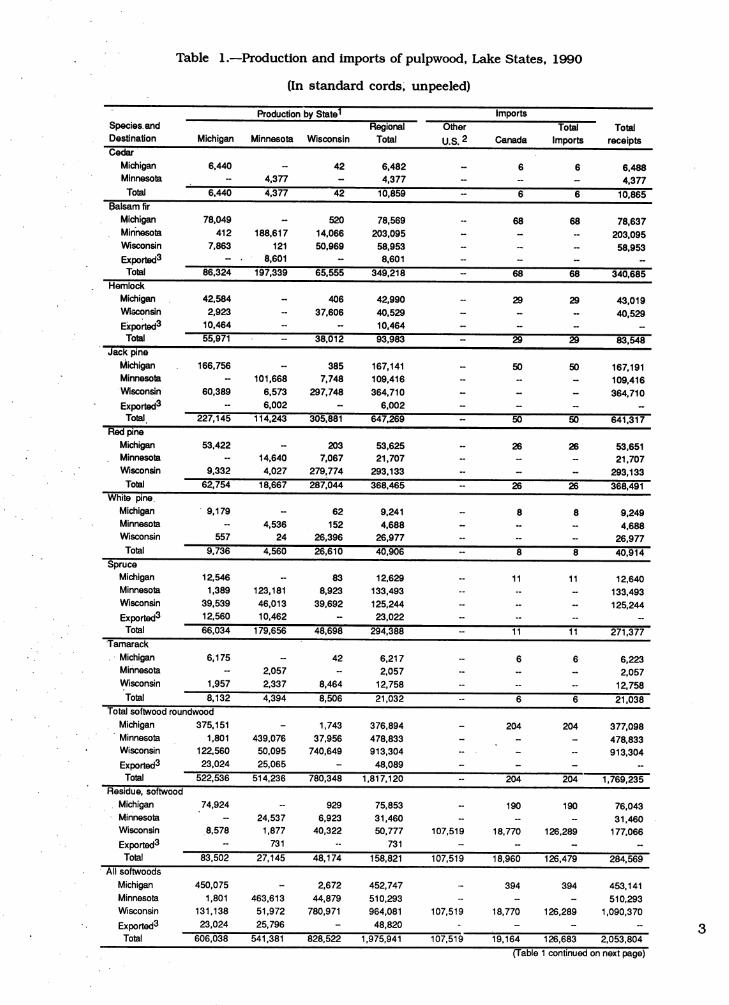
. Table 1.reProduction and imports of pulpwood, Lake States, 1990
(In standard cords, unpeeled)
ProductionbyStateI ImportsSpeciesand Regional Other Total Total
Destination Michigan Minnesota Wisconsin Total U.S. 2 Canada Imports receiptsCedar
Michigan 6,440 - 42 6,482 - 6 6 6,488-.
Minnesota - 4,377 - 4,377 - - - 4,377
Total 6,440 4,377 42 10,859 - 6 6 10,865Balsamfir
Michigan 78,049 - 520 78,569 -- 68 68 78,637Mir_nesota 412 188,617 14,066 203,095 - - - 203,095Wisconsin 7,863 121 50,969 58,953 .... 58,953Exported3 - • 8,601 - 8,601 ....
Total 86,324 197,339 65,555 349,218 - 68 68 340,685. Hemlock
Michigan 42,584 - 406 42,990 -- 29 29 43,019Wi..;consin 2,923 - 37,606 40,529 ..... 40,529E_xpoffed3 10,464 -- - 10,464 .....
." Total 55,971 -- 38,012 93,983 -- 29 29 83,548Ja_ckpine
Michigan 166,756 -- 385 167,141 -- 50 50 167,191Minnesota -- 101,668 7,748 109,416 ..... 109,416Wisconsin 60,389 6,573 297,748 364,710 - - - 364,710
• Exported3 - 6,002 - 6,002 .....Total 227,145 114,243 305,881 647,269 - 50 50 641,317
RedpineMichigan 53,422 - 203 53,625 - 26 26 53,651
. Minnesota - 14,640 7,067 21,707 .... 21,707Wisconsin 9,332 4,027 279,774 293,133 .... 293,133
Total 62,754 18,667 287,044 368,465 - 26 26 368,491White pine
Michigan 9,179 - 62 9,241 - 8 8 9,249Minnesota -- 4,536 152 4,688 - - - 4,688Wisconsin 557 24 26,396 26,977 ..... 26,977
Total 9,736 4,560 26,610 40,906 -- 8 8 40,914Spruce
Michigan 12,546 - 83 12,629 -- 11 11 12,640Minnesota 1,389 123,181 8,923 133,493 ..... 133,493Wisconsin 39,539 46,013 39,692 125,244 ..... 125,244Exported3 12,560 10,462 - 23,022 ........
Total 66,034 179,656 48,698 294,388 -- 11 11 271,377=Tamarack
. Michigan 6,175 -- 42 6,217 -- 6 6 6,223Minnesota -- 2,057 -- 2,057 ..... 2,057Wisconsin 1,957 2,337 8,464 12,758 ...... 12,758
Total 8,132 4,394 8,506 21,032 -- 6 6 21,038Total softwoodroundwood
Michigan 375,151 - 1,743 376,894 - 204 204 377,098Minnesota 1,801 439,076 37,956 478,833 - - - 478,833
. Wisconsin 122,560 50,095 740,649 913,304 ..... 913,304Exported3 23,024 25,065 - 48,089 .....Total 522,536 514,236 780,348 1,817,120 -- 204 204 1,769,235
Residue,softwood
Michigan 74,924 -- 929 75,853 -- 190 190 76,043Minnesota -- 24,537 6,923 31,460 ..... 31,460Wisconsin 8,578 1,877 40,322 50,777 107,519 18,770 126,289 177,066Exported3 -- 731 -- 731 ........
Total 83,502 27,145 48,174 158,821 107,519 18,960 126,479 284,569All.softwoods
Michigan 450,075 - 2,672 452,747 -- 394 394 453,141Minnesota 1,801 463,613 44,879 510,293 - - - 510,293Wisconsin 131,138 51,972 780,971 964,081 107,519 18,770 126,289 1,090,370
Exported3 23,024 25,796 - 48,820 ...... 3' Total 606,038 541,381 828,522 1,975,941 107,519 _19,164 126,683 2,053,804
(Table 1 continuedon nextpage)

I
i (TableI continued)
ProductionbyStateI ImportsSpeciesand Regional Other Total Total
, Destination Michigan Minnesota Wisconsin Total U.S. 2 Canada Imports receiptsAsh
Michigan 23,830 - 2,675 26,505 - 5 5 26,510Minnesota -- 105 - 105 - - 105Wisconsin 3,980 - 68,092 72,072 ..... 72,072
Total 27,810 105 70,767 98,682 -- 5 5 98,687
AspenMichigan 1,010,565 -- 57,290 1,067,855 - 496 496 1,068,351Minnesota -- 1,610,704 26,271 1,636,975 -- 2,240 2,240 1,639,215
i Wisconsin 104,488 40,495 1,012,744 1,157,727 ..... 1,157,727, Exported3 -- 6,901 -- 6,901 ........ Total 1,115,053 1,658,100 1,096,305 3,869,458 -- 2,736 2,736 3,865,293
BalsampoplarMichigan 60,486 - 238 60,724 -- 107 107 60,831Minnesota -- 52,966 2,524 55,490 .... 55,490
Total 60,486 52,966 2,762 116,214 -- 107 107 116,321Basswood
Michigan 43,274 -- 6,519 49,793 - 15 15 49,808, Wisconsin 1,091 116 24,893 26,100 ..... 26,100
Total 44,365 116 31,412 75,893 -- 15 15 75,908' . Beech
Michigan 28,527 -- 417 28,944 -- 44 44 28,988' Wisconsin 2,964 -- 3,127 6,091 ...... 6,091
i Total 31,491 - 3,544 35,035 -- 44 44 35,079Whitebirch
Michigan 169,434 1,061 73,703 244,198 -- 68 68 244,266Minnesota -- 575 -- 575 ..... 575
, Wisconsin 3,464 21,105 224,747 249,336 ..... 249,336Total 172,918 22,741 298,450 494,109 - 68 68 494,177
Yellowbirch
Michigan 49,469 - 10,475 59,944 - 27 27 59,971Wsconsin 5,819 - 22,035 27,854 ..... 27,854
Total 55,288 - 32,510 87,798 - 27 27 87,825Cottonwood
Michigan 104 -- - 104 .... 104Total 104 - - 104 .... 104
Elm
Michigan 18,883 - 2,065 20,948 .... 20,948Wsco nsin 62 -- 23,126 23,188 .... 23,188
Total 18,945 - 25,191 44,136 .... 44,136Hickory
, W'sconsin -- - 4 4 ..... 4Total -- - 4 4 ..... 4
HardmapleMichigan 236,129 - 42,133 278,262 -. 116 116 278,378i
Wisconsin 30,012 - 222,201 252,213 ..... 252,213
, Total 266,141 - 264,334 530,475 - 116 116 530,591Softmaple
Michigan 221,247 -- 21,064 242,311 -- 87 87 242,398Minnesota -- 15,672 4,968 20,640 ..... 20,640WLsconsin 12,425 3,976 164,061 180,462 .... 180,462Total 233,672 19,648 190,093 443,413 - 87 87 443,500
' Redoak
, Michigan. 96,871 - 5,836 102,707 -- 2 2 102,709Wtsconsin 2,356 - 39,591 41,947 .... 41,947
_
Total 99,227 -- 45,427 144,654 - 2 2 144,656Whiteoak
' Michigan 43,287 - -- 43,287 .... 43,287Wsconsin 389 - 13,541 13,930 .... 13,930
] Total 43,676 -- 13,541 57,217 .... 57,217
J Other hardwoodsMichigan 21,100 -- 3,245 24,345 -- 31 31 24,376
-,
! ' 4 WLsconsin 4,040 -- 7,952 11,992 .... 11,992
J Total 25,140 -- 11,197 36,337 -- 31 31 36,368. (TableI continuedonnextpage)
I

(Table'1 continued)
- ProducUonby State1 ImportsSpeciesand Regional Other Total Total
Destination Michigan Minnesota Wisconsin Total U.S.2 Canada Imports receiptsTotalhardwoodroundwood
•Michigan 2,023,206 1,061 225,660 2,249,927 -- 998 998 2,250,925Minnesota - 1,680,022 33,763 1,713,785 -- 2,240 2,240 1,716,025
-Wisconsin 171,110 74,692 1,826,114 2,071,916 ...... 2,071,916Exported3 - 6,901 -- 6,901 ........
Total 2,194,316 1,762,676 2,085,537 6,042,529 - 3,238 3,238 6,038,866Residue,hardwoods
Michigan 171,355 - 14,555 185,910 20,946 2,029 22,975 208,885Minnesota -- 56,068 4,091 60,159 ..... 60,159Wisconsin 10,699 - 160,643 171,342 - - - 171,342
Total 182,054 56,068 179,289 417,411 20,946 2,029 22,975 440,386Allhardwoods
Michigan 2,194,561 ° 1,061 240,215 2,435,837 20,946 3,027 23,973 2,459,810Minnesota - 1,736,090 37,854 1,773,944 -- 2,240 2,240 1,776,184Wisconsin 181,809 74,692 1,986,757 2,243,258 ..... 2,243,258Exported3 -- 6,901 - 6,901 ........Total . 2,376,370 1,818,744 2,264,826 6,459,940 20,946 5,267 26,213 6,479,252
,,
All wood material
• M!chigan 2,644,636 1,061 242,887 2,888,584 20,946 3,421 24,367 2,912,951Minnesota 1,801 2,199,703 82,733 2,284,237 - 2,240 2,240 2,286,477Wisconsin 312,947 126,664 2,767,728 3,207,339 107,519 18,770 126,289 3,333,628Exported3 23,024 32,697 -- 55,721 • • -....Total 2,982,408 2,360,125 3,161,119 8,435,881 128,465 24,431 152,896 8,533,056
1 Verticalcolumnsof figuresunderthe boxheading"ProductionbyStates"presentlheamountof pulpwoodcut ineach State.2 MostlyWesternStates.
3 Pulpwoodshippedtomillsoutsideof region.
Whole-tree chip 6 (WTC) production in the Lake Michigan was the major producer of whole-treeStates dropped 18 percent to 518 thousand chips in the Lake States in 1990 with 414 thou-cords, about 6 percent of total production. As- sand cords (80 percent). Loggers in the northernpen WTC production declined by 123 thousand Lower Peninsula of Michigan harvested 278cords or 35 percent between 1989 and 1990 (fig. thousand cords (54 percent) of WTC production3). Other hardwoods (soft maple, hard maple, that year (fig. 4).red oak, white oak, white birch, and basswood)
increased in WTC production by 11 percent to 5oo-•234 thousand cords.
= 400 ",, So"wood,' ' II_ [] Other hardwoods I
(n 600 Orr [] Aspen II,¢_', rJ
• _ t-_ 300O 500 zo ,=¢
• i_ ¢/)z 4.00 _ 200< O¢0 :¢:
0 300 z= -" 100I-
•__. 2oo
100 C " MINNESOTA WISCONSIN MICHIGAN
oas s7 ee s9 90 Figure 4.--WTC production by State in the Lake
YEAR States, 1990.
Figure 3._Whole-tree chip production in the Lake ',States; 1986-1990.1
I!
6Pulpwood produced from chipping entire trees (allportions of the trees above ground, except the stumps).. 5 !
ii
',
!I
I
Ii|
l Jack pine was the predominant softwood spe- _.000. cies harvested for WTC in 1990 with 93 percent
of the softwood WTC production and I0 percent _ 800 a _h°,°of_ood.' of the total WTC production, aCC Other hardwoods
0 : Spruce-fir0Q
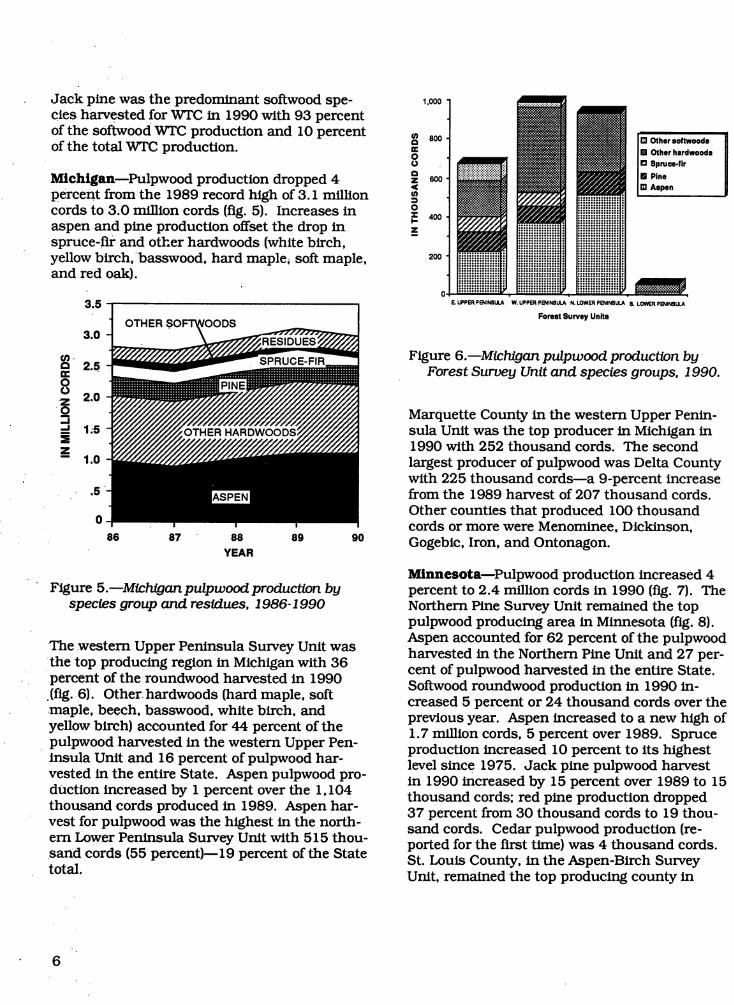
Michlgan--Pulpwood production dropped 4 <z 6o0 mmP_,*Aspenpercent from the 1989 record high of 3.1 million• .
cords to 3.0 million cords (fig. 5) Increases in o• := 400i-aspen and pine production offset the drop in z
, spruce-fir and otker hardwoods (white birch,yellow birch, basswood, hard maple_ soft maple, 200l.
and red oak).i
c
I 3,5 F-UPPERPB_ULA W.UPPERPENINS_A _t_WF.RPENINSULA & LOW_PB_tNSU_
Forest Survey UnksI
3.0
m. Figure 6._M/ch/gan pulpwood production bya 2.5_: Forest Survey Unit and species groups, 1990.ooz 2.o_o Marquette County in the western Upper Penin-_J
I __ 1.5 sula Unit was the top producer in Michigan in' z 1990 with 252 thousand cords. The second. - 1.o largest producer of pulpwood was Delta County
with 225 thousand cords--a 9-percent increase.5 from the 1989 harvest of 207 thousand cords.
Other counties that produced 100 thousand, o cords or more were Menominee, Dickinson,
86 87 e8 e9 90 Gogebic, Iron, and Ontonagon.YEAR
Minnesota---Pulpwood production increased 4Figure 5.--Michigan pulpwood production by percent to 2.4 million cords in 1990 (fig. 7). The
, species group and residues, 1986-1990 Northern Pine Survey Unit remained the toppulpwood producing area in Minnesota (fig. 8).i
Aspen accounted for 62 percent of the pulpwoodThe western Upper Peninsula Survey Unit was harvested in the Northem Pine Unit and 27 per-the top producing region in Michigan with 36 cent of pulpwood harvested in the entire State.
' percent of the roundwood harvested in 1990 Softwood roundwood production in 1990 in-, .(flg. 6). Other hardwoods (hard maple, soft creased 5 percent or 24 thousand cords over the, . maple, beech, basswood, white birch, and
previous year. Aspen increased to a new high of. yellow birch) accounted for 44 percent of the 1.7 million cords, 5 percent over 1989 Spruce
pulpwood harvested in the western Upper Pen-production increased 10 percent to its highest
r insula Unit and 16 percent of pulpwood har- level since 1975. Jack pine pulpwood harvestI vested in the entire State. Aspen pulpwood pro- in 1990 increased by 15 percent over 1989 to 15
duction increased by 1 percent over the 1,104 thousand cords; red pine production droppedthousand cords produced in 1989. Aspen har- 37 percent from 30 thousand cords to 19 thou-
' vest for pulpwood was the highest in the north- sand cords. Cedar pulpwood production (re-i em Lower Peninsula Survey Unit with 515 thou- ported for the first time) was 4 thousand cords.,. sand cords (55 percent)--19 percent of the State St. Louis County, in the Aspen-Birch Survey
total. Unit, remained the top producing county in
6
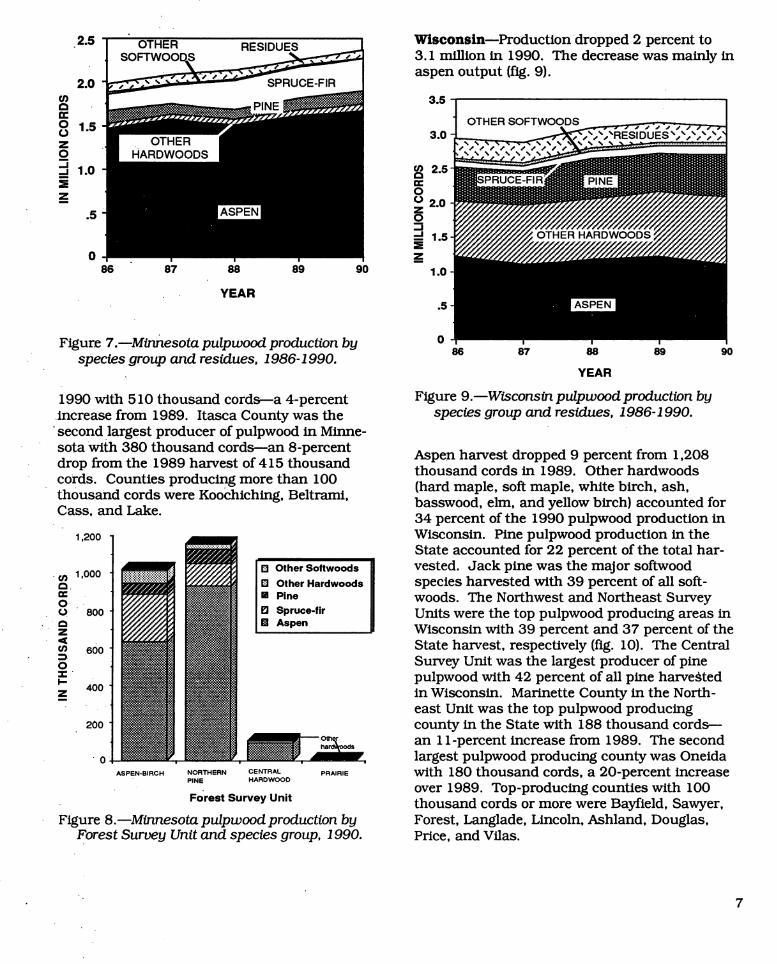
2.5 " Wisconsin--Productiondropped 2 percent to3.1 minion in 1990. The decrease was mainly inaspen output (fig. 9).
2.0(n 3.5n-O 1.5 OTHER SOFTWOODSO 3.0ZO._1_J 1.0 ¢n 2.5-.. a
OZ O 2.0z
.5 O-I----.1.5=E
0 zm86 87 88 89 90 1.0
YEAR.5
Figure 7.--Minnesota pulpwood production by 0species group and residues, 1986-1990. 86 87 88 89 90
YEAR
1990 with 510 thousand cords--a 4-percent Figure 9._Wisconsin pulpwood production byincrease from 1989. Itasca County was the species group and residues, 1986-1990.'second largest producer of pulpwood in Minne-
sota with 380 thousand cords--an 8-percent Aspen harvest dropped 9 percent from 1,208drop from the 1989 harvest of 415 thousand thousand cords in 1989. Other hardwoods
cords. Counties producing more than 100 (hard maple, soft maple, white birch, ash.thousand cords were Koochiching. Beltrami. basswood, elm. and yellow birch) accounted forCass. and Lake. 34 percent of the 1990 pulpwood production in
_.2oo Wisconsin. Pine pulpwood production in thestate accounted for 22 percent of the total har-
_.ooo [] OtherSo.woods vested. Jack pine was the major softwoode_ [] Other Hardwoods species harvested with 39 percent of all soft-¢ [] Pine woods. The Northwest and Northeast SurveyOo 8oo [] Spruce-fir Units were the top pulpwood producing areas in
[] Aspenz Wisconsin with 39 percent and 37 percent of the¢¢
600 State harvest, respectively (fig. i0). The Central• = Survey Unit was the largest producer of pine0
= pulpwood with 42 percent of all pine harvestedI- 400_z in Wisconsin. Marinette County in the North-
: east Unit was the top pulpwood producing200 county in the State with 188 thousand cords--
an 11-percent increase from 1989. The secondo largest pulpwood producing county was Oneida
.sP_.....c. .o.b.E.. c_.T... _.....E with 180 thousand cords, a 20-percent increasePINE HARDWOOD
over 1989. Top-producing counties with 100Forest Survey Unit thousand cords or more were Bayfield, Sawyer,
Figure 8.--Minnesota pulpwood production by Forest, Langlade, Lincoln, Ashland, Douglas,Forest Survey Unit and species group, 1990. Price, and Vilas.
• 7

1,200 In this report, we show the distribution of the
B o_,so_ooos harvest in two ways: first, the amount of pulp-1,000 B] sP,uc_, wood cut relative to the growing-stock volume in¢/)
B _E each of five major pulpwood species (fig. 11) and' If_ Q OTHER HARDWOODS
oo 800 B ,sP_ second, the amount of pulpwood relative to, a commercial timberland area (fig. 12) PulpwoodZ
< harvesting (80,000 cords or more) was mostI ¢/)_ 600o intensive in the following areas by species:
' z 400mii
i
, 200
0NORTHEAST ' NORTHWEST CENTI:_ SOUTHWEST SOUTHEAST
', Forest Survey Units
,. Figure lO.--Wisconsin pulpwood production by, Forest Survey Unit and species group, 1990.I
...:.:.:.i:iii:i:i::::.:.:.:...-o..-..,.,.o-.°..•
, ASPEN-B|RCH ".'.'.'.'.'.'.'.'.'.'.'.'.'.'.'.'.'.'.•• .%*.,.,.,.,.,.,.,.-...,.,...,.,.o...,.,.,.,...,.,,,..•..o...,...-.*.,...o.*.....:.:.:.:.:.:.:.:.:.:.:.:.:.:.:.:.:.:.:.:.:.:.:.:.:.:.:.:.:.:.:.:.:.:.:.:.:.:.:.:.:NORTHERN 17 ............................ .'.'.'.'.'.'.'.'.'.'.'.'.'.'.'.'.'.'.'.'.'."..
PINE .... ::".:.".'.".'. ""'"'"""'"'""i"'"'"'!'!'i:!'i'!'i'i:i'!'i:i'"i'!'i'i'i'i'i":"•:::::::::::::::::::::::::::::::::::::::::::::::::::::::::::::::::::::::::::::
15 "":!:i:i:i:!'!:i:i""'"""'""'"""'"""'""'iiii_iii:'.WESTERN U.P. . ....... Ii:ii!:!::
49 "":::::::!.....CENTRAL NORTHWEST ...:.:!...
......
HARDWOOD 36 .....::.....:..::..... ".':':':'.'."8 60 ....................... " "':':':'i::....
..... i.::!:i.,,°,o
, .,..-.,,-.
:,.:.:.:.:;PRAIRIE CENTRAL NORTHERNL.P. :'::':':"
0 48 21 ...... "':::", .':':':
' SOUTH- ::::i' ' Minnesota EAST :':':':':':':::':'::: ""
37 :.::i'.i'.i.i.i.i.i'.i:i.i.iSOUTHERNL.P.• .,.,.,.....,.,.,.,,,..
I:o'.;,:,;,'.',.'o'.:.:.;.: . . .._?
Wisconsin .'-':':':':':':':':':'. 0JACK PINE ::::i .:.:.:.:,.:.:...i
... • •..,..........,..***.,.,.,.,.,
' Michigan
Figure I l.--Cords of roundwood pulpwood (including chips from roundwood) harvested per I, 000 cordsI of growing-stock volume for each of five principal pulpwood species by Forest Survey Unit, 1989.Ii . Growing-stock volume was determined during the last forest inventory in each State.Ii 8

!
t (Figure 11 continued)I
|
I
J ,,,,,,,_i;_._,......"....:.... .... :.:.:.:.:.:.:.:.:
..:.:.:.:.:.:.:.:.:.
ASPEN-BIRCH .....'.'.'.'.'.'.'.'.......,.,....,,,.....,,..,.,,,,,,,,,,.,.,,
NORTHERN 5 ...................:;:.:.......:;:;:.......:;:.:_:::::::;:;:::::::;:;:.:::::;:;:::_:::...........:,:ooo ° o°00°oo o0°°• .
PINE " ' "'"'"'"'""'"'"'"'"'""'"'"'""'""'"'""'"""'"""...... . ...-.....-_:_:...-.:;...;:....•._:.......•,:.-_:;:;..:.:_:...:;:_:_:;:.:;:;:
....... °.•,°...,.,.°.,.,...,•,.,.o.o.•.°.....,.,.,,,....•..o.,•..,.°.o.,.•..,.........,..•........,.....,.,.,.•.,.,.•.,•,.,.,...o.°.,.o.oo,,,, ,'.','•
WESTERN U.P. ""::':"'"'¢i:i:i:i20 U.F ::::,.
i;....
CENTRAL NORTHWEST ':':oooO°•o-..
p:.:.:.:.:.:.:.:.:..........
HARDWOOD 22 NORTHEAST, V.'.V."0°oO.0o..
;:;:';::::::'" "":i':':15 21 .:.:.:.• • .%00°•o0.
:,::::i.:::::::::::o-.O0O..0-°
PRAIRIE CENTRAL NORTHERNL.P. :':':':':':".00°,.
3 45 4 :V;.'::;:
::;:;:;• o0°_
%%
Minnesota SOUTH- SOUTH- :':'::.•.°.•.o,°.°o.,O•°o°• ,_0
EAST :':':':':':':':':':':':':':' ":::.:.::.:.:.:.::.::.:::31 :::::::::::::::::::::::::::::SOUTHERNL.P..:.:.:.:.:.:.:.:.:.:.:.:.:.:.
:.:.:.:.:.:.:.:.:.:.:.:.:.:. ..::;:
Wisconsin 0RED PINE ..iii:.....
.::::::,_:_.:::i:i:i:_:i:i:i.
Michigan
. 9

, . _ .._.______I
i
!
I (Figure 11 contlnued)i
|
.......:::i::::;:.:....,.......:.:.... .... :.:.:.:.:.:.:.:
• ..:.:.:.:.:.:.:.:.:.
ASPEN-BIRCH ..'.'.'.'.'.'.'.'.'.'.'.'............ •i.i.i:i:i:i.i.i.i.i:i.i.i.!.!:i:i:i:i:i:i:i:i:i:!:i:i:!:i:i:i:i:i:i:i:!
NORTHERN 19 .............................. ""::i:i:i:i:i:i:!:i:i:i:i:i:i:i:i:i:!:i:i:i....:::.........n , ,'.'o',',',*,','.'.%','.'.','.',',',',%'.',',%','.*,'.*.','.',*,'..
PINE• ' "'"'"'"':':':'"":':':':':':':':'i'!'!'i'i'i'!'i'!'!':'!'!'i'!':'!'!'!'"
22 ................................ ..:.:.:..WESTERNU.P. "'"'""'"....:':::':'-
, :.:.:.:.:.
8 RN ::::::::::
CENTRAL NORTHWEST ""i:!"• o...°.o. I
i
, .':',.:.';.':", HARDWOOD 8 .....:::.:::::::::.:::.:.:. ;5 17 ""'"'"'"'""'""" :':':':::0.,.,-,
, • • :':';';':".....
' i::::::::::::
PRA'R'E CE.TRAL .ORTHER.,.P. ii::::ii::::::::::i.0 20 2 "'""".:.:.
, .....
°:,
Minnesota SOUTH- SOUTH- :':• ...o.,.,.%....o.°.., • ,'o
EAST :':':, I.:-:;:::;:;:;:::.:::.:;::..:::::::::::::::::::::::::::::
0 I.:.:.:.:.:.:.:.:.:.:.:.:,SOUTHERNL.P....°,..%..o.....°.•.°...
:.i:!.!.i:i:i:i:i.i.i• :::::Wisconsin ........... 0 .:.
SPRUCE ..::::-.......:,.:.:.:::.:,:,,:
. °•.°.•o..,,o.,.,
Michigan
I
I|
10J
/

, (Figure 11 cont_ued)I
I rI
I..
.......:"!'.':'.'.'........• ........ •_.........-....-.......
..... •:.:.
ASPEN-BIRCH ."":'":':':...._..._..:___:.:_:___:___:_:_._____:.__:___.__.__._:_:_:.:__.:_:.:_:.:__.:_:_:._.:_:_:
NORTHERN 16 ........................................_...................................................:...........................................,........:.:.:: ..: ;,;..
PINE ....... ......................-...-.........-...-...-.....-...-.'.'...-.'...'.'.-..... :.:.:.:.:.:.:.:.;.:.:.:.:.;.:.;.:.:.:.;.:.:.:.:.:.:.;.:.;.:.:...;..
19 ....... '""'"'"'"'"":':':':':':':':':':'!'i'i'i'i'i'i'!'i'i'i'i':"
WESTERN U.P. •....... "':':::':'-. :::;:.:::"
6 ERN U ":':':':
CENTRAL NORTHWEST i.ii:!..• ,-.,,.,-,.,,,.,,
HARDWOOD 7 NORTHEAST .......
1 12 ........... ".':':..:.:.:.•..o.,...,.,
• ,,,,,
:!:!:!:!:!:PRAIRIE CENTRAL NORTHERN L.P. !'i'i'i'_'i
O "'''*" ,o
• 6 1 :.:.:.;:1:::.
.:.:..,;,
Minnesota SOUTH- SOUTH- .!!iEAST :::::::::::::::::::::::::::
1 :::::::::::::::::::::::::::::SOUTHERN L.P. ":'::.:.:.:.:.:.:.:.:.:.:.:.:• ...::.;.;.;.;.;.;.;...;.;.;.;.;. . ....
Wisconsin 0 "BALSAM FIR ..iii:.....
...:;:.:.:.:.:, :,:,,..,,...o.,.,
Michigan
11

!|
ii
i|i
(Figure 11 continued)|
| ..
.,.....:::i::::::.:,......., ,......--i(:i:!:i:i:i:i:i:!:i..........
.°°,,,,.,°°,
, _ ASPEN-BIRCH ...................................i,i,l.i.i.i:_.i:i:i,l.i.i.!.i................... oOo..O,...o%%......%.....,....%%...o.........o.....o%...o%.o...
NORTHERN 36 .............. ::':':':'::':':................................................... :.:......... .'.'.'.'o'.'.'.'.'.'.'.'o'.'.'.%'.'.'.'.'.'.'.%'.'.%'.'.'2.%'.'..
PINE ............,.. .... .,,.,....,....,..,,.....,.,.,.%o....
; 45 "":i'i?!'i?!:'""'"""'"""'"'""'""!iii!i!i!2".!
U.P. """'"""'""':'""
• 39 ,RN !:i:!iii::i:.o.
, CENTRAL ._:i:i:i'"..°,..
.,.o,
HARDWOOD 36 ,:,.:.:iiiiiiiiiiiiiiiii.!.i: i'i'.i.i._.i.' 26 43 .....-.
:i.i$i :.:.:.:.:.:.:
• :.:.:.:.:.
. PRAIRIE CENTRAL NORTHERN L.P. !'i':::i'i'.
• 3 ,,, 3, ::ii i• ,:..! ".%
o:' Minnesota SOUTH- SOUTH- :.
EAST :':':
3 ,iiii!iiiiiii!iiiiiii!',ili............. SOUTHER,'.P. ....:•. •.. • • .o • ,, . ..'.'-.
............ASPEN Wisconsin ........... .%.
::::::::.......:.:.i'.i.i:i.:':':
.%%...........
Michigan
.
|.
|
I!
|
Iri . ".
f
. 12i

o
r.
t
Figure 12.reCords of pulpwood cut per 1,000 acres of timberland in principal pulpwood-producing counties, 1989.Acres of timberland (stocking of trees greater than 16.7 percent) were determined during the last inventory in
. .each State. Locations of active pulp and particleboard mills are shown. 13

i
i
Species State Survey Unit The Lake States provide many woodpulp millswith raw material. In 1990, Wisconsin supplied
Jackpine Wisconsin Northwest,Central wood to 26 mills, Michigan supplied 26 mills,Michigan NorthernLowerPeninsula and Minnesota supplied 25 mills. Pulpwood
Redpine Wisconsin Central mills outside the Lake States also received rawSpruce Minnesota Aspen-Birch material from this region. Some 56 thousand
. Balsamfir Minnesota Aspen-Birch,NorthernPine cords were exported, mainly to Canada; Mtnne-Aspen Minnesota Aspen-Birch,NorthernPineCentral Hardwood sota exported 33 thousand cords, and Michigan
Wisconsin Northeast,Northwest,Central exported 23 thousand cords.' Michigan E. UpperPeninsula,W. Upper
peninsula,N.LowerPeninsula Softwood residue imported from Canada rose 36. percent in 1990 to 19 thousand cords. Soft-i
Cutting of certain species may exceed net wood residue shipped from other States (outside' growth in several Survey Units of the Lake the region) increased 19 percent to 107 thou-
States. This disparity is probably due to disease sand cords. The main suppliers of the softwood;. and mortality occurring in these species. Har- residue from outside the Lake States were Men-
vesting of overmature stands of timber may be tana, South Dakota, and Wyoming.another reason. Future field surveys shouldhelp clarify these points. Michlgan_Eleven Michigan mills consumed 2.9
million cords or 7 percent less than in 1989. AnReceipts •estimated 268 thousand cords were supplied by
out-of-State sources--down 10 percent from. Thirty-six woodpulp and twelve particleboard 1989. Wisconsin provided more than 90 per-
mills acquired 8.5 million cords of pulpwood in cent of the imported wood. White birch, hard1990, down 1 percent from 1989. The number maple, aspen, red oak, and soft maple were theof mills using aspen stayed constant at 40 (83 primary species imported.percent). There was increased use of birch,pine, soRwood residues, and hardwood residues Wisconsln--The 22 mills in Wisconsin con-
, at some mills (fig. 13). sumed 3.3 million cords as in 1989. Of that, total, 566 thousand cords were supplied by out-i of-State sources--an increase of 5 percent fromI last year. Michigan supplied 313 thousandf ,o cords, Minnesota supplied 127 thousand cords,
and Western States supplied 108 thousand,o cords. Principal imports were aspen, spruce,
' " _ jack pine, and hard maplel I--Z 30 *
a.
• _ _o Minnesota---The 15 mills in Minnesota reportedd an estimated 2.3 million cords; Minnesota; =¢
i ,o pulpwood receipts are not fully reported (seeI earlier explanation). Wisconsin fumished 83I 0
' ....................... thousand cords,Michigansupplied2 thousand, FIR _ WOO0 WOO0
..... ppli, sptc,Es cords,and Canada su ed 2 thousand cords., • Principalimportswere aspen,balsam f_r., Figure 13._Numbers of industrial plants in the spruce, and jack pine.: Lake States using a particular species or
residue for pulping and particleboard, 1989-1990.
14

Industry Trends and Analysis 81Woodpulp M///s - 7 OTHERIS
6 RESIDUES
In this section woodpulp mills will include those ¢===mills that produce wood fiber products such as o sopaper, paperboard, hardboard, insulation z 4board, and medium-density fiber board. All of _o
• _jthese products are manufactured from wood _-_3that has been reduced to individual fibers, small z
Z 2fiber bundles_ or fiber parts that are then
formed into a mat. i
Of the 8.4 million cords of pulpwood harvestedin 1990, 6.2 million cords (74 percent) were e6 87 88 89 90used for wood fiber products (woodpulp). Of YEAR
each cord used to produce woodpulp, 93 per- Figure 14._Pulpwood production in the Lakecent was roundwood and 7 percent was resi- States for woodpulp by species group anddues. residues, 1986-1990.
Principal species harvested for woodpulp wereaspen.(2.0 million cords), Jack pine (534 thou-
Lake States pulpwood production for pulp millssand cords), hard maple (522 thousand cords),• in 1988-1990 was:and white birch (477 thousand cords). Other
I
. major species furnishing more than 200 thou- Species Productionsand cot'dswere balsam fir, red pine, spruce,and soft maple. Hardwood and softwood resi- 1988 1989 1990due accounted for 450 thousand cords for pulp (Thousandcords)
in 1990. Roundwood
Harvesting of aspen for woodpu]p has fallen off_ Aspen 2,077 2,008 2,029gradually while harvesting of other hardwood Softwoods 1,632 1,662 1,677species has increased. Softwood harvests have Otherspecies 1,888 2.090 2.070grown steadily since 1988 (fig. 14). Residues for Residue 519 470 " 450the same period have been steady at 450 to 500 Total 6,116 6,230 6,226
thousand cords. Michigan--Pulpwood production for woodpulpwas 2.1 million cords in 1990. Aspen wag the
Average daffy woodpulp production was 11.5 major pulpwood species harvested in MichiganthOusand tons in 1990 (table 3). Kraft mills with 577 thousand cords. Other species that
• accounted for one-third of the total woodpulp contributed large amounts of wood were whiteproduction, and groundwood and oth,er me- birch (157 thousand cords) and jack pine (132chanical process mills accounted for another thousand cords). Hardwood residue was a
' one-third. The remaining one-third was split major contributor to the pulp industry with 149behveen sulfite and semi-chemical process thousand cords; softwood residue was 19 thou-migs. sand cords.I
15

| ....
!
|
I
!
Michigan's primary woodpulp industry manu- cords to other States and Canada. Predominantfactures paper, corrugating medium, hardboard, species exported were balsam fir (9 thousandand market pulp (pulp sold to other paper cords), jack pine (6 thousand cords), spruce (11manufacturers). An estimated 5,000 tons of thousand cords), and aspen (7 thousand cords).
|
woodpulp products are generated daffy fromseven primary woodpulp miUs. One mill uses Wisconsln--Pulpwood harvested for woodpulpgroundwood processing, two mills use kraft products was 2.7 million cords. Aspen was the
. processing, three use semi-chemical process, main species harvested with 1.9 million cords inand one mill uses both groundw0od and kraft 1990. Other species that provided more thanprocessing (table 3). . 100 thousand cords were; jack pine (306 thou-
sand cords), white birch (298 thousand cords),Michigan mills imported 211 thousand cords for red pine (287 thousand cords), hard maple (264
I woodpulp production in 1990. Minnesota fur- thousand cords), and soft maple (I 90 thousandnished i thousand cords, Wisconsin provided cords). Softwood residue for woodpulp ac-188 thousand cords, Westem States provided counted for 48 thousand cords, and hardwood
. 21 thousand cords, and Canada shipped 1 residue accounted for 179 thousand cords.thousand cords. Michigan exported 23 thou-sand cords to other States outside the region for A less than 1 percent decrease in pulpwood
' woodpulp. Spruce (13 thousand cords) and production for woodpulp mills in the Lakehemlock (10 thousand cords) were the two States during 1990 compares favorably with thespecies exported. 2.4-percent rise in U.S. paper and paperboard
• production. Total output of the U.S. paper and• Minnesota--Pulpwood harvested for woodpulp paperboard industry for 1990 was 78.6 million• products totaled 1.4 million cords in 1990. tons (39.4 million tons of paper and 39.2 million
Aspen was the predominant species harvested tons of paperboard).in Minnesota With 684 thousand cords. Balsam
' fir (197 thousand cords) and spruce (180 thou- Partlcleboard millssand cords) were second and third, respectively.Jack pine was the only other species harvested Particleboard is a generic term for a panelfor woodpulp with more than I00 thousand manufactured from lignocellulosic materials-"cords. Hardwood and softwood residues for commonly wood--in the form of particles (aswoodpulp amounted to 56 thousand cords and distinct from fibers). These materials are25 thousand cords, respectively, bonded together with synthetic resin or other
suitable binder, under heat and pressure, byThe primary woodpulp products industries in process in which the interparticle bonds are c_
: . Minnesota are paper, hardboard, roofing felt, ated wholly by the added binder. Most partic]and insulation board. An estimated 4,500 tons board in the U.S. is made from residues (shay
I of woodpulp products are produced daffy in the ings, sawdust, or chips), but some types sucl_
I 10 primary woodpulp mills. The process used as wafer board require that the particles be c'in these mills to breakdown the wood into fiber from solid wood (saw logs or pulpwood).
i are groundwood (eight mills) and kraft (two, mills) (table 3). Loggers in the Lake States harvested 2.2
cords in 1990 for particleboard products. Fc' Of the 87 thousand cords Minnesota mills every 100 cords used to produce particleboa: received for woodpulp products, Michigan pro- products, 94 percent came from roundwood' vided 2 thousand cords, Wisconsin furnished 83 6 percent was residues from wood-using ple: thousand cords, and Canada provided 2 thou- (sawmills, veneer mills, etc.).!
I sand cords. Minnesota exported 33 thousandi
o

Principal species harvested for particleboard Lake States pulpwood production for particle-products were aspen (1.8 million cords), jack board mills in 1988-1990 was:pine (113 thousand cords), and soft maple (40thousandcords). Other major species used Species Productionwere red pine and white birch. Residues used 1988 1989 1990in particleboard production totaled 126 thou- (Thousand cords)sand Cords (fig. 15).
Roundwood
2,500 Aspen 1,605 1,914 1,840I Softwoods 135 144 140
REs,ou_s Otherspecies 148 89 103¢n 2,00o Residue 131 161 126¢ Total 2,019 2,308 2,209OO
¢= 1,5oo Ml©higanmPu]pwood hawested for particle-Z '< board products was 842 thousand cords. As-
pen logged in the State for particleboard totaledo 1,o00 • 538 thousand cords in 1990. Other majorz_- species cut were jack pine (95 thousand cords)z_ and soft maple (39 thousand cords). Hardwood
500 and softwood residues used for particleboardtotaled 97 thousand cords.
0
1986 1987 1988 1989 1990 Michigan's particleboard industry produces' YEAR oriented-strand board and oriented waferboard.
An estimated 613 million square feet at three-Figure 15.--Pulpwood production for part_le- fourths of an inch thickness was produced by
board in the Lake States, 1986-1990. the four mills in Michigan in 1990. Three millsused roundwood for raw material, and one mill
Annual production capacity of the Lake States used chips from the field and residues.particleboard plants:
The particleboard mills in Michigan importedProduction hardwood and softwood residues from Canada
Company Location capacity amounting to 2 thousand cords. Michigan mills(Millionsquarefeet also received 6 thousand cords of aspen from
3/4-inchbasis) Wisconsin. Exports of raw materials for parti-' cleboard production amounted to 20 thousand
• Georgia-Pacific Gaylord,MI 241 cords; half was aspen and half was residues.Louisiana-Pacific Newberry,MI 50
• Louisiana-Pacific Sagola, MI 140 Minnesota--Pulpwood logged for particleboardWeyerhaeuserCo. Grayling,MI 170 products totaled 997 thousand cords. TheLouisiana-Pacific Two Harbors,MN 75 predominant species cut was aspen (947 thou-
_: BlandinWood sand cords)--98 percent of the total. The re-Products Co.* Grand Rapids, MN 165 maining 2 percent was jack pine (12 thousand
Northwood cords), balsam poplar (9 thousand cords), and• PanelboardCo. Bemidji,MN 150 softwood residues (2 thousand cords).
PotlatchCorp. Bemidji,MN 112PotlatchCorp. Cook, MN 112Louisiana-Pacific Hayward,WI 130R0dman Industries Marinette,WI 22WeyerhaeuserCo. Marshfie!d,WI 135
Allcompanies 1,502•Soldto PotlatchCorp.6/90
• 17

I
|
°
I
Minnesota's particleboard industry produces New Mills and Expansions in 1990oriented-strand board and oriented waferboard.Particleboard output from the mills in the State New mills"
was an estimated 582 million square feet at MacMfllion Boedel Corp. of America, Deer-three-fourths of an inch thickness for 1990. wood, Minnesota (completed 1990).Roundwood was the predominant form of raw Canadian Pacific Forest Products LTD.,material used for particleboard products in Thunder Bay, Ontario (completed 1991).Minnesota.
' Major pulpmfll expansions:
The particleboard mills in Minnesota did not• Champion International Corp., Quinnesec,
import any raw materials for production. In Michigan (completed 1990)1990, raw materials exported from the State for
, particleboard manufacturing totaled 30 thou- Boise Cascade Corp., International Fails,sand cords; 27 thousand cords of aspen and 3 Minnesota (completed 199 I).
thousand cords of softwood residues were CENTRAL STATES. shipped to Wisconsin.
Wisconsin--Wisconsin produced 371 thousand Production
cords of wood for particleboard manufacturing. Pulpwood production in the Central StatesThe main species harvested was aspen (328thousand cords)---88 percent of the total. Other (Illinois, Indiana, Iowa, and Missouri) dropped 6
• percent from the 1989 production of 396 thou-major species cut were jack pine (7 thousand sand cords to current production of 374 thou-cords), red pine (4 thousand cords), and balsam sand cords. Hardwood residue from primary
. fir and white pine with 2 thousand cords each.The remaining raw material used was softwood wood-using mills comprised 74 percent of total
production. Softwood roundwood dropped fromresidue (10 thousand cords) and hardwood 10 thousand cords in 1989 to 9 thousand cords
residue (18 thousand cords), in 1990 (fig. 16).
The particleboard industry in Wisconsin pro- 4soduces oriented strand board. Wisconsin's
particleboard output totaled an estimated 267 400
million square feet at three-fourths of an inch _ zsothickness in 1990. The mills used roundwood _ 3ooand residues equally for raw material in manu- oe_
z 250. facturing particleboard products.
200• 0
The mills in Wisconsin imported 23 thousand _ 15o, cords of wood for particleboard manufacturing. -
Canada provided 3 thousand cords of soilwood lOOI residues, and Michigan provided I0 thousand soj
cords of aspen and 10 thousand cords of resi- odues. Wisconsin exported 55 thousand cords of 8 6 a ? 8 8 8 9
, aspen to Michigan mills in 1990. YEAR
' Nationallyhousing starts dropped 14 percent in Figure 16._Pulpwood production in the Cent1990 to 1.2 million units, accounting for a 4- States, 1986-1990.percent decrease in Lakes States pulpwoodproduction used in the manufacture of particle-
i board products.
io
18|

Soft hardwood 7 roundwood production de- Illinois--Illinois produced 76 thousand cords ofcreased 46 percent, and hard hardwood 8de- pulpwood in 1990--20 percent of the total pro-Creased 2 percent in 1990. Exports from the duction in the Central States (fig. 17). HardCentral States (mainly hardwood residue) de- hardwood roundwood was the largest speciescreased 8 percent to 233 thousand cords, group harvested with 26 percent of the StateCentral States producers shipped wood to total. Both softwoods and soft hardwoods wereKentucky, Wisconsin, Oklahoma, and Michigan harvested at 12 percent each for the total
-.
mills, pulpwood production in Illinois. Hardwoodresidues accounted for the other half of the
The primary woodpulp industries in the Central pulpwood production in Illinois.States are roofing insulation and corrugating-
I medium. An estimated 720 tons of woodpulp Illinois does not have any woodpulp mills. Allproducts were manufactured, daffy from three pulpwood harvested is shipped to plants in themills. The process used in these mills to break three other Central States or to mills outside thedown the wood into fiber is semi-chemical and area. Of the wood harvested for pulp about 43mechanical, percent was shipped to mills in the Central
States---mainly in Indiana and Iowa. Statesoutside the North-Central Region received the
2oo -• remaining 57 percent.
[] So,woods Indlana---Indiana produced more than 50 per-BB Soft Hardwoods
¢X:_¢_ 150 I_ HardHardwoods cent of the total pulpwood harvested in theO m Residueso • Central States Region in 1990--- 189 thousande-_z cords. Roundwood pulpwood production in
_oo Indiana was 38 thousand cords or 20 percent of' Othe State total. The hard hardwood species
_ group had the highest production of roundwoodso with 68 percent. Soft hardwoods accounted for
the remaining 32 percent of the roundwood har-l
vested. Hardwood residues accounted for 80
o _ percent of the pulpwood produced in Indiana.ILLINOIS INDIANA IOWA MISSOURI
Pulpwood shipped to mills outside the regionFigure 17.---Central States pulpwood production totaled 114 thousand cords--60 percent of the
by species group, 1990. State's total pulpwood production. The remain-ing 40 percent was used by mills in the Centraland Lakes States regions.
Iowa--The total pulpwood production in 1990was 14 thousand cords--4 percent of the
Hardwood species with an average specific region's total. The hard hardwood speciesgravity of O.50 or less (cottonwood, basswood, black group was the 0nly roundwood harvested forgum, etc.), woodpulp at 4 thousand cords or 29 percent of
s Hardwood species with an average specific the State's total pulpwood production. Hard-_ gravity greater than 0.50 (alloaks, sugar maple, black wood residue was the main source of pulpwood
locust,,green ash, etc.), in Iowa at 10 thousand cords.
. 19

'I....... ...___._
I
I
Missourl--Missouri is the second largest pro- Hardwood residue from sawmiUs continue to beducer of pulpwood material in the Central the dominant form of pulpwood procured fromStates region at 95 thousand cords or 25 per- primary wood-using mills in the Central States.cent of the region's total. Soft hardwood round-
r wood accounted for 11 percent of the State's Central States roundwood production for pulp-total pulpwood production--largest roundwood wood was 96 thousand cords in 1990, down 23
: species group harvested in the State for pulp. percent from the 1989 total of 125 thousandHard hardwood roundwood species had the cords.
! .remaining 6 thousand cords or 6 percent of thetotal pulpwood harvested in Missouri. Hard-
: wood residues at 80 percent of the total pulp- APPENDIX!
wood production in the State was the main
I source of wood fiber. Conversion Factors Used In The, Lake States
Missouri exported 76 thousand cords or 80J percent of the pulpwood it produced to mills
outside the region. Standard cords of gree roundwood per greenton: (cords/ton)
Loggers harvested pulpwood in 18 counties of|
j Illinois; 14 counties in western and central Species Factor. Indiana; 4 counties in eastern Iowa; and 12
counties in northeast, central, and southeast Cedar 0.6329
i Missouri (fig. 18). Balsam fir .4688i
[ Hemlock .4150= Receipts Jack pine .4688
Red pine .4688. Pulp mills in three Central States received 141 White pine .4777
thousand cords in 1990, down 1 percent from Spruce .50141989. Total roundwood receipts dropped 17 Tamarack .4291percent in 1990 from 53 thousand cords in Ash .4330 •1989. Soft hardwood roundwood accounted for Aspen .4291an 11-percent decline in receipts. However, a Balsam poplar .4083
J 60-percent increase in hard hardwood round- Basswood .5167|
wood offset a major decline in pulpwood produc- Beech .3956tion. Hardwood residue increased 7 percent White birch .4018
I from 91 thousand cords in 1989 to 97 thousand Yellow birch .3723J cords in 1990. No softwoods were used for the Cottonwood .4291
seventh consecutive year in the Central States. Elm .4018Hickory .3701
J ' Industry Trends and Analysis Hard maple .3617Soft maple .4083
Average daffy woodpulp production increased 9 Red oak .3444I percent to 510 tons in 1989 (table 5). White oak .3723I Other species .4688
Mills in adjacent States are expected to remainI the dominant markets for Central States pulp-
wood, and imports will continue at about 140thousand cords.
i
2O

CO
IJJ
j ._ .., ,_ ._ •, j..
Znil
n
1
P
!
| " ,u|
no
IunI
!!
lr: Figure 18.--Production of pulpwood from roundwood (including chips from roundwood) in the Central States by
counties., in standard cords, 1989. Locat_ns of Central States and nearby pulp mills using Central States
: pu_wood are shown. 21o
l

I I
Table 2.--Numbers of industrial plants in the Lake States using a particular speciesor residue for pulping and particleboard in 1990
•Species Totaland kind Lake State
of material States Michigan Minnesota WisconsinAspen . 40 11 14 15Balsamfir 1 2 2 4 6Birch 18 7 3 8Hemlock 6 2 - 4•Pine 18 5 7 6Spruce 11 2 5 4
•Tamarack 6 1 2 3
Maple 20 9 1 10Oak 15 8 - 7Otherhardwoods 16 7 1 8Softwoodresidue 12 2 3 7Hardwoodresidue 22 7 5 10
TotalplantsI 48 11 15 221 Some plantsuse morethanone species,so numbersincolumnare not additive.
22,

Table 3.mAverage daily production of active woodpulp mills in the Lake States by mill,- location, and type of pulp produced, 1990 1
(In tons per 24 hours)
ii
Pulping process
Groundwood
All and other Semi-
Company Location types Sulfite Kraft mechanical chemicalMichigan
Abitibi-Price, Inc. Alpena 400 .... 400 --
Champion International Quinnesec 825 -- 825 -- . --
Stone Container Ontonagon 575 ...... 575
Mead Co.rp. Escanaba 800 -- 600 200 --
Menasha Corp. Otsego 310 ...... 310
Packaging Corp.of America FilerCity 600 ...... 600
Warren Co., S.D. Muskegon 250 -- 250 ....
Total 7 mills 3,760 -- 1,675 600 1,485i
• Minnesota
Blandin Paper Co. Grand Rapids 300 .... 300 --
Lake Superior Paper Industry Duluth 440 .... 440 --
Hennepin Paper Co. Little Falls 75 .... 75 --
International Bildrite Inc. International Falls 110 .... 110 --
Boise Cascade Corp: International Falls 400 -- 400 ....
Potlatch Corp. Cloquet 520 -- 520 -- "--
. Superwood Corp. Bemidji i00 .... 100 --
Champion International Sartell 385 .... 385 --
Superwood Corp. Duluth 350 .... 350 --
Certain-Teed Corp. Shakopee 80 .... 80 --•
Total 10 mills 2,760 -- 920 1,840 --Wisconsin
-JamesRiver Corp. Green Bay 160 160 ......Weyerhaeuser Co. Rothschild 200 200 ......
Badger Paper Mills Peshtigo 120 120 ......Appleton Papers, Inc. Combined Locks 200 .... 200 --
Consolidated Papers, Inc. Stevens Point 272 .... 272 --
•Consolidated Papers, Inc. Wisconsin Rapids 553 -- 553 --
, Green Bay Packaging, Inc. Green Bay 220 ...... 220Flambeau Paper Co. Park Falls 120 120 ......
• . MidtecPaper Corp. Kimberly 180 .... 180 --
Pentair, Inc. Niagara 210 .... 210 --
Mosinee Paper Mills Co. Mosinee 220 -- 220 ....
Nekoosa Papers, Inc. Nekoosa 335 -- 335 .....
Neko0sa'Papers, Inc. Port Edwards 235 235 ......
Nekoosa Packaging, Inc. Tomahawk 1,000 ...... 1,000Globe Industries Cornell 100 .... 100 --
Superior Fiber Products Corp.. Superior 140 .... 140 --Thilmany Pulpand Paper Co. Kaukauna 420 -- 420 ....
Wausau Paper MillsCo, Brokaw 210 210 ......
Superwood Corp. Philips 100 .... 100 --
Total - 19 mills 4,995 1,045 975 1,755 1,220
All States 36 mills 11,51 5 1,045 3,570 4,195 2,705
1 Lockwood's Directoryof the Paper and Allied Industriesm1990.
23

Table 4.--Production and imports of pulpwood, Central States, 1990
(In standard cords, unpeeled)1
Production by States 2 ImportsSpecies and Regional Lake Other Total Totaldestination Illinois Indiana Iowa Missouri total States U.S. imports receipts
Softwoods
Exported 3 8,894 .... 21 8,915 ........Total 8,894 .... 21 8,915 ........
Soft hardwoods 4Central States 5 2,237 11,594 -- 6,078 19,909 ...... 19,909
Exported 3 7,062 .... 3,921 10,983 ........Total 9,299 11,594 -- 9,999 30,892 ...... 19,909
Hard hardwoods 6Central States 5 5,840 11,392 4,023 2,596 23,851 ...... 23,851
Exported3 13,936 14,940 -- 3,412 32,288 ........Total 19,776 26,332 4,023 6,008 56,139 ...... 23,851
Total roundwood
Central States 5 8,077 22,986 4,023 8,674 43,760 ...... 43,760
Exported 3 29,892 14,940 -- 7,354 52,186 ........Total 37,969 37,926 4,023 16,028 95,946 ...... 43,760
Residue, softwoods
Exported 3 -- 266 -- 3,163 3,429 ........Total -- 266 -- 3,163 3,429 ........
Residue, hardwoodsCentral States 5 24,954 51,988 10,044 10,413 97,399 ...... 97,399
Exported 3 12,834 99,120 -- 65,374 177,328 -- 2,943 2,943 --Total 37,788 151,108 10,044 75,787 274,727 -- 2,943 2,943 97,399
All wood material
Central States 5 33,031 74,974 14,067 19,087 141,159 ...... 141,159
Exported 3 42,726 114,326 -- 75,891 232,943 -- 2,943 2,943 --Total 75,757 189,300 17,067 94,978 374,102 -- 2,943 2,943 141,159
1 Factors used in converting to standard green cords (128 cu. ft. including bark and air space) were:4,266 pounds of softwood roundwood;4,795 pounds of soft hardwood roundwood;5,394 pounds of hard hardwood roundwood;
4,100 pounds of softwood chips (green mill residue);4,400 pounds of hardwood chips (green mill residue);2,500 pounds of chips (all species, dry mill residue).
2 Vertical columns of figures under box heading "Production by States" present the amount of pulpwood cut in each State.3 Pulpwood shipped to mills outside the region.4 Hardwood species with an average specific gravity of 0.50 or less.5 Combined to prevent disclosure of individual mill receipts.6 Hardwood species with an average specific gravity greater than 0.50.
24

Table 5.--Average daffy production of active woodpulp mills in the Central States by mill,location, and type of pulp produced, 1990
(In tons per 24 hours) 1
i
Pulping process
l GroundwoodState and All and other Semi-
" Compariy Location types Sulfite Kraft mechanical chemicalIllinois
dl "
(Nocurrentoperations). Total 0 mill ........Indiana '
WestonPaperand Mfg.Co. Terre Haute 300 ..... 300Total 1 mill 300 .... 300
Iowa
ConsolidatedPackagingCorp Fort Madison 150 .... 150n
Total 1 mill 150 .... 150
Missouri
Huebert'Fibreboard,Inc. BoonevUle 60 -- - 60 --Total 1 mill 60 -- - 60 --
AllStates 3 mills 510 -- - 60 450
Lockwood'sDirectoryof the Paperand AlliedIndustries--1990
I
II
t
I
IIII
i
25I
II
i

|
qi
iTable 6.---Lake States pulpwood production by State of origin and
[ destination, 1986-1990
I
(In thousand standard cords, unpeeled)1
i .. MICHIGAN
I Total Destinationof pulpwood
I Year production Minnesota Wisconsin Michigan Other1986 2,808 - - 369 2,429 10
I 1987 2,747 - - 313 2,420 14
j 1988 2,920 (2) 311 2,597 121989 3,112 (2) 319 2,777 16
! _ 1990 2,982 1 313 2,645 23
I 5-year average 2,914 (2) 325 2,574 15
I
MINNESOTA, .
Total Destinationof pulpwood
I Year production Minnesota Wisconsin Michigan Other
1986 1,979 1,872 69 (2) 381987 2,079 1,967 61 - - 51
i 1988 2,131 2,002 79 2 481989 2,263 2,110 116 2 341990 2,361 2,200 127 1 33
5-year average 2,163 2,030 90 1 41
WISCONSIN
Total Destinationof pulpwood
i Year production Minnesota Wisconsin Michigan Other
1986 2,926 56 2,693 177 - -1987 2,869 62 2,644 161 2
,I . 1988 3,084 80 2,771 233 (2)i 1989 3,161 89 2,799 272 1|
n ' 1990 3,094 83 2,768 243 --;I 5-year average 3,027 74 2,735 217 (2)
j Includesmillresiduesusedfor pulp.1
i ' 2 Lessthan 500 cords.II
tI;
'.i
I,
I!I
Ij . 26|
I
J
lIi
J
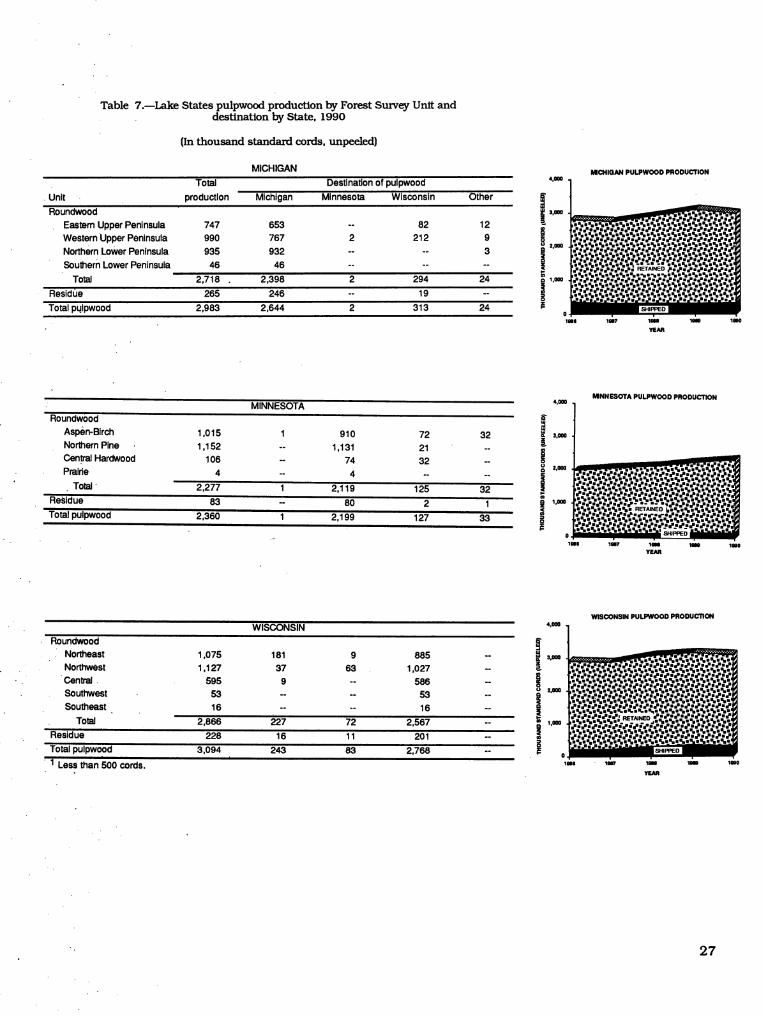
Table 7.--Lake States pulpwood production by Forest Survey Unit anddestination by State, 1990
i (In thousand standard cords, unpeeled}
MICHIGAN MCHIQANPULPWOODPRODUCTION' Total Destinationof pulpwood 4'_
•Unit . production Michigan Minnesota Wisconsin Other _"
Roundwood _ =,oooEasternUpperPeninsula 747 653 -- 82 12 to
WesternUpper Peninsula 990 767 2 212 9NorthernLowerPeninsula 935 932 .... 3 _ =.oooSouthernLowerPeninsula 46 46 ...... l
=Total 2,718 . 2,398 2 294 24 _ 1.ooo
Residue 265 246 -- 19 --Totalpulpwood 2,983 2,644 2 313 24 is
1al 1917 lm _ 1too
YF.Nt
MINNESOTA PULPWOOD PRODUCTION
MINNESOTA 4,mRoundw0od ¢
Aspen-Birch 1,015 1 910 72 32 ! =.ooo|NorthernPine . 1,152 -- 1,131 21 -- to
CentralHardwood 106 - 74 32 -2,000Prairie 4 - 4 ....
• !Total' 2,2/1 1 2,119 125 32
Residue 83 -- 80 2 1 it 1,_=-
Total pulpwood 2,360 1 2,199 127 33i-
•_ 0oR 1917 19M 191o 19oo
I ve,m
IWISCONSIN PULPWOOD PRODUCTION
' WISCONSIN 4,000
, Roundwood _"Northeast 1,075 181 9 885 -- 3,0O0
Z
• Northwest 1,127 37 63 1,027 --Central. 595 9 -- 586 --• .
2,000Southwest 53 .... 53 "" itSoutheast 16 .... 16 --• ,
Total 2,866 227 72 2,567 "" _o '.==Residue ' 228 16 11 201 .. =i
Totalpulpwood 3,094 243 83 2,768 --I T ORe _ 1000 1000 1900ILess than 500 cords.
. YEAR
} ,
27.


--r-I
Table 9.--Michigan pulpwood production from roundwood by county and species group, 1990
" (In standard cords, unpeeled)
Species groupAll Balsam Jack Red White Balsam
Unit and county 1 species Cedar fir Hemlock pine pine pine Spruce Tamarack Ash Aspen poplarE. UPPER PENINSULA
I
Alger 84,764 344 4,308 4,354 6,991 1,679 506 1,1 97 837 712 16,569 4,878
Chippewa 88,301 428 4,988 4,632 14,281 1,916 585 2,697 374 279 32,792 5,124Delta 224,797 1,256 16,077 7,805 23,224 6,840 1,847 11,029 1,344 1,078 66,598 11,473Luce 34,014 293 3,659 2,502 7,548 1,427 431 1,293 300 113 6,603 1,881
Mackinac 85,201 343 3,967 2,377 3,653 1,462 465 3,207 295 393 31,271 6,381Menominee 130,099 566 8,587 4,414 7,440 3,158 846 6,255 1,1 03 698 44,875 4,494
Schoolcraft 99,710 780 9,732 4,615 9,689 3,840 1,147 2,982 799 640 21,400 5,302
¢ Total 746,886 4,010 51,31 8 30,699 72,826 20,322 5,827 28,660 5,052 3,913 220,108 39,533W. -UPPER. PENINSULA
Baraga 63,295 114 1,422 1,874 2,855 617 168 410 117 1,209 19,742 682Dickinson 168,828 1,025 13,706 6,990 14,149 7,386 1,508 7,135 1,200 530 80,591 4,144
t, Gogebic 106,290 • 7 2,082 371 3,611 1,879 59 4,730 101 1,723 35,821 125• Houghton 80,30 118 1,556 1,208 1,558 1,118 173 1,358 150 1,785 16,852 1,201
Iron 162,788 140 4,767 4,595 6,926 3,870 546 17,172 508 2,107 56,540 877Keweenaw 5,654 ...... 14 - 121 1,440 -
Marquette ' 252,247 734 9,258 8,439 33,495 3,638 1,221 4,741 1,004 1,522 83,007 7,616Ontonagon 150,092 - 205 155 2,205 434 14 340 - 5,639 74,800 2,156
Total " 989,524 2,138 32,996 23,632 64,799 18,942 3,689 35,900 3,080 14,636 368,793 16,801N. LOWER PENINSULA
Alcona 50,857 - - - 5,450 90 - - - 395 35,502 1,287Alpena • 22,433 - - - 177 94 - - - 179 18,622 591
Antdm 13,026 - - - 90 324 - - - 135 4,292 -Arenac 7,689 - - - 61 36 - - - 10 7,020 86
Bay 168 ......... 168 -Benzle 21,980 - - - 26 123 - - - 417 9,443 -Charlevoix 1,699 .... 23 - - - 28 1,063 -
Cheboygan 63,698 185 1,273 376 3,754 762 139 488 - 287 35,913 163Clare 44,407 - - - 171 18 - - - 374 29,063 -Crawford 59,567 9 64 2 26,439 3,155 7 15 - 60 18,362 -
. Emmet 6,857 - - - 609 774 - - - 14 4,167 -
Gladwin 11,073 - - - 74 58 - - - 129 9,271 -Grand Traverse 18,089 - - - 2,961 1,351 - - - 209 7,950 -Iosco 11,604 - - 14 137 51 - 8 - 207 7,081 159
Isabella 18,208 .... 15 - - - 130 17,191 -Kalkaska 33,689 1 10 - 480 5,290 1 3 - 185 15,974 -
Lake 69,247 - - - 6,184 318 - - - 752 28,059 -Manistee 16,704 - - - 528 231 - - - 403 6,998 -
Mason 34,418 - - - 177 .... 221 20,787 -Mecosta 25,642 .... 206 - - - 391 21,287 -Midland 14,821 ........ 493 9,675 104
Missaukee 48,618 - - - 713 1,563 - - - 1,009 27,933 -
Montmorency 40,252 - - - 5,898 133 - - - 337 24,106 440Newaygo 30,361 ........ 261 13,789 -Oceana 15,051 ........ 97 7,238 -
Ogemaw 24,558 - - - 5,110 189 .... 121 14,387 121
Osceola 41,820 .... 621 169 - - - 928 26,899 -• Oscoda 46,657 - - - 11,31 7 2,212 - - - 137 19,426 411
•., Otsego 32,797 18 120 106 5,542 1,590 13 160 - 135 12,797 -Presque Isle 40,270 79 543 1,1 42 2,698 323 60 800 - 611 22,516 750Roscommon 31,881 - - - 9,196 534 - - - 29 18,390 40
• Wexford 36,367 - - - 1,1 07 3,749 - - - 289 19,155 -
Total 934,508 292 2,010 1,640 89,520 23,381 220 1,474 - 8,973 514,522 4,152
S. LOWER PENINSULA
i, . Allegan. 7,563 ........ 8 858 -
, Barry 1,375 ........ 6 705 -Branch 535 ..... ......Calhoun 40 ......... 40 -
, C,ass 2,041 ...........Gratiot 130 ......... 130 -
Kalamazoo 205 ...........
Kent - 1,508' ........ 13 1.029 -Montcalm 7,481 .... 46 - - - 59 3,387 -
Muskegon 18,417 .... 63 - - - 174 3,963 -Ottawa 3,191 ........ 28 1,51 8 -
St. Joseph 1,491 ...........Van Buren 1,957 ...........
Total 45,934 .... 109 - - - 288 11,630 -
State total 2,716,852 6,440 86,324 55,971 227,145 62,754 9,736 66,034 8,132 27,810 1,115,053 60,486
1 Includesonlythosecountiesthatsuppliedpulpwoodin1990. (Table9 continuedonnextpage)
31

(Table 9 continued) MICHIGAN
Species groupWi- te Yellow Cotton- Hard Soft Red White Other
Unit and _o.:nty 1 Basswood Beech birch birch wood Elm Hickory maple maple oak oak hardwoodsE. UPPER PENINSULA
Alger 2,164 2,074 5,128 3,925 - 1,652 - 15,581 9,369 1,584 - 912
Chippewa 888 952 3,698 1,1 49 - 602 - 5,555 6,668 467 - 226Delta 3,008 4,739 20,298 5,416 - 3,271 - 22,248 14,616 1,673 29 928Luce 345 585 1,483 618 - 50 - 2,536 1,680 176 - 491
Mackinac 1,229 1,580 8,706 1,857 - 1,046 - 8,252 7,787 592 - 338Menominee 1,636 1,886 17,882 2,962 - 1,404 - 12,306 7,659 1,238 62 628
Schoolcraft 1,885 2,223 5,506 3,411 - 1,640 - 13.671 8.473 1,255 - 720
Total 11,1 55 14.039 62,701 19,338 - 9,6_5 - 8C.149 5f3..".52 6,985 91 4,243W. UPPER PENINSULA
Baraga 1,535 954 5,510 3,086 - 541 - 13,755 5,977 1,354 - 1,373Dickinson 1,506 1,740 3,765 2,737 - 1,292 - 10,987 6,836 1,017 4 580
Gogebic 3,486 667 4,069 5,803 - 917 - 23,948 11,608 3,065 6 2,212
Houghton 2,313 1,428 7,620 4,936 - 926 - 21,728 9,938 2,258 38 2,068Iron 2,184 1,129 16,635 5,125 - 885 - 22,421 11,396 2,698 239 2,028
Keweenaw 91 140 545 411 - 30 - 1,743 730 158 - 231Marquette 4,361 3,357 23,028 8,029 - 2,906 - 31,800 18,525 3490 7 2,069
Ontonagon 7,289 186 7,264 4,379 - 1,783 - 30,051 9,239 3,171 4 778ToTal 22,765 9,601 68,436 34,506 - 9,280 - 156,433 74,249 17,211 298 11,339
N. LOWER PENINSULA
Alcona 76 56 2,995 .... 146 2,101 2,495 264 -
Alpena 32 25 1,338 .... 62 914 360 39 -Antrim 378 226 1,800 .... 1,273 4,404 104 - -Arenac 2 - 213 .... 7 254 - - -
Bay ............
Benzie 1,042 890 454 199 - - - 2,971 4,600 1,161 420 234Charlevoix 104 19 187 13 - - - 11 6 142 6 - -
Cheboygan 712 200 6,094 4 - - - 2,494 10,421 427 3 3Clare 416 700 874 104 - - - 2,459 5,198 3,418 909 703
Crawford 192 90 1,300 .... 814 3,898 4,590 448 122Emmet 50 13 326 .... 176 728 - - -G ladwin - - 317 3 .... 814 249 11 9 39
Grand Traverse 208 209 156 105 - - - 487 2,816 1,109 320 208Iosco 48 14 2,032 4 - - - 47 1,069 493 91 149Isabella - 11 88 .... 16 354 241 139 23
Kalkaska 600 280 872 177 - - - 1,774 4,827 1,513 1,181 521
Lake 1,458 1,076 1,083 336 - - - 3,433 8,924 8,397 6,231 2,996Manlstee 938 697 302 1 - - - 1,385 1,205 1,944 1,720 352Mason 527 531 976 10 - - - 1,202 3,329 3,276 2,755 627
Mecosta - 8 409 34 - - - 31 6 1,1 57 745 1,013 76Midland - 108 653 14 104 - - 322 2,270 675 393 10Missaukee 907 566 1,427 19 - - - 2,366 5,804 4,353 1,709 249
Montmorency 111 63 3,253 .... 306 2,702 2,682 221 -Newaygo - 112 226 49 - - - 250 1,703 6,752 6,078 1,141
Oceana 123 38 33 22 - - - 179 2,227 2,466 2,410 21 8Ogemaw 23 1 5 1,331 3 - - - 234 1,260 1,397 357 10Osceola 469 743 1,427 184 - - - 2,434 3,593 2,707 1,334 31 2
Oscoda 211 58 2,695 .... 636 3,1 57 5,970 427 -Otsego 463 129 3,213 3 - - - 1,727 6,764 14 1 2
Presque Isle 207 117 4,431 .... 628 4,561 726 78 -Roscom mon 2 1 307 1 - - - 8 846 1,433 988 106Wexford 1,146 638 936 139 - - - 1,195 4,256 2.445 861 451
Total 10,445 7,633 41,748 1,424 104 - - 29,463 96,298 62.148 30,509 8,552S. LOWER PENINSULA
Allegan - 2 ..... 1 1,905 2,299 2,485 5Barry - 3 - 1 - - - 17 20 304 307 12Branch ........ 194 164 177 -Calhoun .............
Cass ........ 741 625 675 -Gratio[ .............
Kalamazoo ......... 205 - -Kent - 2 ..... 17 46 234 129 38
Montcalm - 11 16 .... 9 1,414 1,225 1,294 20
Muskegon - 157 17 13 - - - 32 1,181 6,069 5,838 910Ottawa - 43 -- 6 - - - 20 120 703 732 21
St. Joseph ........ 542 456 493 -Van Buren ........ 710 599 648 -
Total - 218 33 20 - - - 96 6,873 12.883 12,778 1.006
,_:ate ;o:a, 44,365 31,491 172,918 55.288 104 18,945 - 266,141 233,672 99.227 43,676 25.140
1 Includes only those counties that supplied pulpwood In 1990.
32

o
.
' 33
I ']

i
iI
u)
.1= I I I I I I I I I I I I I I I I I I I I I I I I I I I I I I I
• _• ,1_
!
0
_'_ I I I I I I I I I I I I I I I I I I I I I I I I I I I I I I I
_i_ I I I I I I I I I I I I I I I I I I I I I I I I I li I I I I I'
i "-i
' I[INN'""' ,,,,,,,,,,,,, ,,,,,,, ,,,, ,i g
i •I
E I I I I I I I I I I I I I I I I I I I I I I I I I I I I I I I IU.I
0 0 I I I I I I I I I I I I I I I I I I I I I I I I I I I I I I I I
__ _ I I I I I I I I I I I I I I I I I I I I I I I I I I I I I I I I
(Dr- ¢_1 I _" (D (D _-•-- i-- 1- Ill _" _'- _1" r-
_ .._ "_o0
I q) I I I I I I I I I I I I I I I I I I I I I I I I I I I I I I I I "0
m ___
a.
, -_ I/)u •
._ I I I I I I I I I I I I I I I I I I I I I (D I I (D I I I I I _ _'W*--'
0o P,
0 rr 0= -_= E o .c:--= '-0 < ""

Table 1 l.--Wisconsin pulpwood production from roundwood by county and species group, 1990• .
. (In standard cords, unpeeled)..
Sl_ecies groupAll Balsam Jack Red White Balsam
Unit and county1- species Cedar fir Hemlock pine pine pine Spruce Tamarack Ash Aspen poplarNORTHEAST
Florence 76,229 28 4,762 2,554 4,865 3,054 350 2,075 160 1,075 34,981 62Forest 121,653 - 6,264 1,604 5,505 5,799 217 5,580 694 5,278 36,986 -Langlade 125,758 - 2,531 864 4,290 5,059 67 994 168 4,326 59,248 -Lincoln 92,660 - 3,127 540 2,721 2,643 380 1,334 582 3,067 46,700 -
Madnette 187,565 13 5,561 926 24,287 13,093 643 3,390 1,172 2,082 67,246 64Menominee 52,964 1 293 21,499 1,007 3,697 2,718 34 - 990 11,835 5oco nto 60,021 - 622 146 6,132 8,569 347 26 14 457 25,264 -
t Oneida 179,917 - 8,592 2,622 14,866 14,703 1,288 5,760 934 5,388 66,690 -
Shawano 31,654 - 19 843 648 6,171 223 49 - 834 6,412 -Vilas 146,328 - 5,450 914 10,069 7,411 1,443 12,512 101 2,920 53,765 -
Total 1,074,749 42 37,221 32,512 74,390 70,199 7,676 31,754 3,825 26,417 409,127 131• NORTHWEST
,,, Ashland 87,132 - . 3,779 325 8,181 3,198 116 4,766 668 3,761 21,111 -' Barron 28,988 - - - 348 811 20 315 22 259 23,013 -
Bayfleld 170,629 - 2,606 - 16,338 9,652 596 133 - 2,425 96,745 1,431Bumett 67,670 - - - 21,463 6,923 51 - - 231 34,579 -Douglas 132,103 - 8,852 - 35,588 8,577 272 1,014 41 330 52,338 1,122J
Iron 88,401 - 779 221 181 255 64 358 - 1480 54,444 78
Polk 9,796 - - - 136 277 79 - - 98 8,641 -Price 134,487 - 4,996 996 2,837 4,548 228 3,636 860 5,483 52,274 -
. Rusk 59,566 - 139 89 1,490 1,970 28 500 485 2,218 28,986 -Sawyer . 164,336 - 2,235 615 3,767 5,145 770 2,037 1,023 6,652 72,963 -Taylor 94,466 - 3,487 1,588 3,809 2,827 71 2,609 822 4,473 30,654 -
Washburn 89,152 - 209 - 14,713 6,379 347 156 14 1,443 43,798 -
Total 1,126,726 - 27,082 3,834 108,851 50,562 2,642 15,524 3,935 28,853 519,546 2,631CENTRAL
Adams 71,554 - 408 - 22,809 26,382 1,558 21 112 604 11,987 -
Chippewa • 44,746 - 138 137 2,339 2,407 14 193 264 1,730 21,018 -Clark 71,972 - - - 3,336 4,680 351 26 - 3,397 29,648 -EaUClaire 23,349 - - - 1,425 2,940 136 - 22 550 6,609 -
. Jackson 76,149 - - - 30,665 10,684 866 141 26 859 16,319 -JuneatJ 43,562 - - - 23,065 10,434 565 - - 524 1,066 -Marathon 76,084 - 557 1,223 2,471 5,291 492 326 15 2,909 31,555 -Marquette, 20,404 - 24 - 3,802 10,791 1;059 40 36 473 271 -
Monroe 23,225 - - - 7,997 7,501 745 197 11 541 1,744 -Portage 37,037 - 58 180 4,656 9,603 1,336 43 64 1,257 7,975 -Waupaca 20,060 - 26 60 1,643 8,465 1,112 - 11 280 4,246 -WaiJshara 37,460 - - - 3,950 24,762 3,730 27 131 192 1,261 -Wood 49,601 - - 13 6,708 9,443 1,243 221 54 1,374 17,061 -
Total 595,203 - 1,211 1,613 114,866 133,383 13,207 1,235 746 14,690 150,760 -S()UTHWEST
Buffalo 716 - - - 10 631 38 - - 1 26 -
Crawfo_l 9,192 - - - 31 21 - - - 255 6,586 -Dunn 13,875 - - 11 3,336 4,929 120 - - 115 4,294 -Grant 556 - - - 14 542 ......
Iowa 2,174 - - - 27 1,866 257 - - 1 - -La Crosse 2,024 - - - 494 1,216 70 39 - 15 41 -La Fayette 6 - - 6 ........
• Pepin 676 - - - 336 234 - - - 5 48 -• ' Pierce 879 - 10 - 318 262 10 133 - 5 95 -, Richland 1,003 - - - 380 623 ......
St. Croix 8,884 - - - 285 4,980 97 - - 41 3,348 -• ' Sauk 7,226 - 13 14 935 5,498 601 - - 1 115 -
Trempealeau 6,206 - - - 398 4,426 720 - - 69 - -
Total 53,417 - 23 31 6,564 25,228 1,913 172 - 508 14,553 -SOUTHEAST
Brown 459 .... 294 .... 75 -Calumet 232 .... 15 - - - 22 - -Columbia 6,301 - - - 1,097 4,322 373 13 - 31 - -
• Door 108 - - 11 53 ..... 44 -Fqnd Du Lac 446 .... 226 - - - 8 - -Green 216 .... 216 ......
Green Lake 478 - - - 36 399 - - - 36 - -Jefferson 64 ' - - - - 13 - - - 2 - -Kewaunee 14 .... 14 ......
Manitowoc 813 - 18 11 - 91 92 - - 60 - -Milwaukee 25 - - - 10 15 ......
Outagamle 4,040 .... 274 92 - - 133 2,200 -Qzaukee 36 - - - 14 22 ......
• Racine 11 - - - 11 ......
Sheboygan 761 .... 761 ......Waukesha 1,601 .... 986 615 .....
Winnebago 185 .... 13 - - - 7 - -,,
.Total 15,790 - 18 22 1,210 7,672 1,172 13 - 360 2,319 - 35' State total 2,865,885 42 65,555 38,012 305,881 287,044 26,610 48,698 8,506 66,225 1,096,305 2,762
1 Includes onlythose counties that supplied pulpwoodin 1990. (Table 11 continued on next page.)

(Table 11 continued) WISCONSIN
Species groupWhite Yellow Cotton- Hard Soft Red White Other
Unit and county 1 Basswood Beech birch birch wood Elm Hickory maple maple oak oak hardwoodsNORTHEAST
Florence 814 200 9,621 899 - 159 - 5.579 3.726 770 249 246Forest 1,370 252 12,774 2,082 - 3,003 - 17,452 12,913 2,247 1,236 397Langlade 1,871 144 12,586 1,858 - 1,018 - 16,605 10,141 2,411 771 806Lincoln 2,529 51 7,409 1,068 - 1,297 - 10,562 6,443 1,468 290 449Madnette 2,073 946 1g,837 5,177 - 684 - 23,224 11,960 2,737 234 2,216Menominee 82 124 1,300 409 - 511 - 4,124 3,763 399 115 58Oconto 763 73 6,549 1,207 - 205 - 5,375 3,119 714 42 397Oneida 3,992 43 19,961 1.560 - 680 - 17,589 11,005 2,714 1,057 473
Shawano 388 164 3,757 1,076 - 170 - 5,928 3,794 676 100 402Vilas 2,462 80 25,907 1.410 - 642 - 11,490 7,023 1,721 573 435
Total 16,344 2,077 119,701 16,746 - 8,369 - 117,928 73,887 15,857 4,667 5,879NORTHWEST
Ashland 929 82 12,697 1,680 - 1,128 - 13,289 8,447 1,708 899 368Barron 8 - 2,507 81 - 4 - 938 480 123 23 36
Bayfield 990 33 21,024 860 - 287 - 8.720 7,301 979 310 199Bu rnett 18 - 2,502 62 - 4 - 816 835 134 22 30Douglas 254 4 14,309 165 - 20 - 1,420 7,467 229 32 69Iron 1,894 71 8,515 1,641 - 397 - 9,487 6,580 1,351 35 570Polk - 3 126 14 - 84 - 200 136 2 - -
Price 3,730 110 18,426 1,679 - 917 - 18,324 11,203 2,751 888 601
RUSK 1,249 2 7,354 651 - 50 2 8,097 4,443 1,292 206 315Sawyer 1,836 12 25,781 1,879 - 747 2 21,248 12,684 3,313 1,027 600
Taylor 1,430 161 10,780 1,548 - 5,020 - 12,654 10,258 1,456 656 163Washburn 176 - 14,160 300 - 91 - 4,008 2,491 604 77 186
Total 12,514 478 138,181 10,560 - 8,749 4 99,201 72,325 13,942 4,175 3,137CENTRAL
Adams 181 5 1,228 165 - 13 - 2,106 1,523 2,085 289 78Chippewa 505 10 4,717 447 - 159 - 6,102 3,245 875 289 157Clark 442 99 8,503 834 - 1,042 - 8,123 8,801 1.504 836 350
Eau Claire 68 22 6,873 164 - 356 - 1,793 1,930 240 56 165Jackson 116 13 3,583 242 - 189 - 2,654 5,308 3,375 832 277Juneau 57 1 1,423 115 - 96 - 1,370 1,348 2,924 484 90Marathon 716 242 5,269 1,469 - 3,843 - 9,733 8,374 921 339 339Marquette 54 - 1,138 109 - 25 - 1,271 863 268 172 8Monroe 36 6 1,312 84 - 69 - 1,018 1,118 603 179 64Portage 163 84 2,061 494 - 1.226 - 3,654 3,128 604 250 201
Waupaca 20 124 181 260 - 7 - 1,975 1,282 159 35 174Waushara 14 82 299 179 - 6 - 1,130 646 635 304 112
Wood 163 57 3,115 386 - 247 - 3,946 3,949 978 553 90Total 2,535 745 39,702 4,948 - 7,278 - 44,875 41,515 15,171 4,618 2, _.05
SOUTHWESTBuffalo - - - 1 - 3 - 3 3 - - -
Crawford - 26 - 128 - 766 - 664 690 25 - -Dunn 4 1 393 27 - 5 - 364 195 56 10 15Grant - - 5 .........Iowa - 1 - 3 - - - 12 4 1 - 2La Crosse 1 3 30 8 - 1 - 59 33 6 4 4
La Fayette ............Pepin 1 - 13 1 - - - 14 20 2 2 -Pierce 1 - 14 1 - - - 16 10 2 2 -Richland ............
St. Croix - - 26 .... 73 34 - - -Sauk - 1 - 2 - - - 24 20 1 - 1
Trempealeau 8 - 176 18 - 4 - 196 135 32 23 1Total 15 32 652 189 - 779 - 1,425 1,144 125 41 23
SOUTHEASTBrown ........ 90 - - -Calumet - 58 ..... 54 83 - - -Columbia 4 1 155 9 - 2 - 203 63 15 10 3Door ............
Fond Du Lac - 2 59 5 - 14 - 32 78 8 3 11Green ............
Green Lake ....... 3 4 - - -Jefferson - 3 - 6 - - - 25 9 2 - 4Kewaunee ............Man_towoc - 123 ..... 61 117 240 - -Milwaukee ............
Outagamie - 15 - 28 .... 441 747 62 27 21Ozaukee ............Racine ............
Sheboygan ............Waukesha ............
Winnebago - 10 - 19 - - - 86 31 5 - 14Total 4 212 214 67 - 16 - 905 1.222 332 40 53
State total 31,412 3,544 298,450 32,510 - 25,191 4 264,334 190,093 45,427 13,541 11,197
1 Includes only those counties that supplied pulpwood in 1990.36

v
I
i!
I "
i
I
4,-, CO 0'_ "_" O00_0 _ _ _ C_ C_ ,,-- ,,-
. O00'_ 0 CO "- 0 0m- I-, I,-, ,11,,,-
r[
o _ I I I I
,e- CeJ CO I.t) ,_'.
I
C "" 0'_ C'_I CO
- CO°0_1 0_ _ m r,.. r.,. r'.,. c0'9" 'I"-- "1" '9" T"
O_ c::
°,*-' 0 I,_ (:0 C_I CO_ , _ Cej CO CO Ce) CO
•. _'t
• ._
• ,,_ ,,,,-' 0') 'e- 0,,I C_I (O
i
I. ,.'37
III

_U.S.GOVERNMENT PRINTING OFFICE: 199Z - 6.q6-540/,I

Hackett, Ronald L.
1992. Pulpwood production in the North-Central Region, 1990.Resour. Bull. NC-140. St. Paul, MN: U.S. Department of Agricul-ture, Forest Service, North Central Forest Experiment Station.38 p.
Lake States pulpwood production dropped to 8.4 million cordsin 1990. Central States pulpwood production dropped by 6 per-cent--from 396 thousand cords in 1989 to 374 thousand cords in
1990. Pulpwood production is shown by county and species groupfor Michigan, Minnesota, Wisconsin, Iowa, Missouri, Illinois, andIndiana.
KEY WORDS: Roundwood, whole-tree chips, residue, Minnesota,Michigan, Wisconsin, Illinois, Iowa, Indiana, Missouri.
1

Our job at the North Central Forest Experiment Station is discovering andcreating new knowledge and technology in the field of natural resources andconveying this information to the people who can use it. As a new generationof forests emerges in our region, managers are confronted with two uniquechallenges: (1) Dealing with the great diversity in composition, quality, andownership of the forests, and (2) Reconciling the conflicting demands of thepeople who use them. Helping the forest manager meet these challengeswhile protecting the environment is what research at North Central is allabout.
EHPEFIIIII_HTSTATION
i
iIII ,