rate of weight loss in piled pulpwood
TRANSCRIPT
Rate of Weight Loss in Piled Pulpwood
Terry Droessler Jim L. Bowyer Tom Burk Eugene Jamrock Richard Antilla
574-Station Bulletin ~D-SB-3036 Agricultural Experiment Station U Diversity of Minnesota 1986


RATE OF WEIGHT LOSS IN PILED PULPWOOD
by
Terry Droessler Jim L. Bowyer
Tom Burk Eugene Jamrock
Richard Antilla
AD-SB-3036 Agricultural Experiment Station
University of Minnesota 1986
Authors are, respectively, Research Assistant, Professor, and Assistant Professor of the University of Minnesota, College of Forestry and State Scaling Specialist, State Scaling Supervisor, Minnesota Department of Natural Resources.

Abstract
monitored in piles of 100-inch and tree-length aspen and that was harvested during the spring and summer of 1984 in The rate of weight loss was found to be largely constant, environmental factors. Equations were developed which under varying conditions of rainfall, temperature, and
Weight loss was balsam fir pulpwood northern Minnesota. though influenced by describe weight loss humidity.

RATE OF WEIGHT LOSS IN PILED PULPWOOD
Conversion factors used in calculating the value of weight scaled pulpwood are virtually all based on the green or freshly harvested weight of wood. However, when there are delays between the harvest and weight scaling operations, natural drying of wood reduces the weight of each unit of wood and invalidates the established conversion factors. When a set conversion factor based on green weight is used, the effect of any weight loss in a given quantity of wood is an underestimate of the amount of wood fiber measured. This study was conducted to assess the rate of weight loss in piled pulpwood and to determine the influence of factors such as temperature, humidity and rainfall, upon the rate of drying.
Procedure
Quantities of freshly harvested pulpwood were weighed upon delivery at selected wood concentration yards. Material was then piled. Some piles were located in shaded locations at the boundaries of the concentration yards, while others were placed on sites that were fully exposed to the elements. Periodic reweighing of piles was accomplished using a portable scale rigged in conjunction with a boom hoist. Weight loss was monitored in eighteen separate pulpwood piles. Both aspen and balsam fir, and 100-inch and tree length pulpwood were included in the study. At each site, detailed daily environmental records were maintained; factors measured included precipitation, humidity, and maximum and minimum temperatures.
All of the pulpwood involved in this study was harvested in the northern one-third of Minnesota between the months of April and September 1984.
Data was collected by Department of Natural Resources personnel working under the supervision of Gene Jamrock of the DNR office in Grand Rapids. Data was analyzed by a team of specialists from the Departments of Forest Products and Forest Resources in the University of Minnesota, College of Foresty in St. Paul. Industrial cooperators were Northwood Panel Products of Bemidji, Cole Forest Products and Blandin Paper Company of Grand Rapids, Rajala Timber Company of Deer River, Champion International Corporation of Two Harbors and Mizpah, and Superior Fiber Corporation of Superior, Wisconsin. The numbers of piles of each species monitored at each location is presented in Table 1.
Observations
A summary of observations for each of the pulpwood piles is presented in Table 2. Note that weight loss over a period of several weeks or months is substantial, though instances of weight gain are not uncommon.
·Analysis
Exploratory Work The data was evaluated through various statistical techniques, with the objective of developing a model that accurately describes the rate of weight Joss per cubic foot of wood. The Box-Cox transformation technique (Weisberg 1985) and the ACE algorithm (Breiman and Friedman 1985) were considered during exploratory work. The Box-Cox method could not be used because of zeros in weight loss/cubic foot measurements. The ACE algorithm showed
-1-
transformation of the independent variables, average high temperature, average high humidity, total weekly rainfall, and weight at the end of the previous week, to be unnecessary.
Modeling
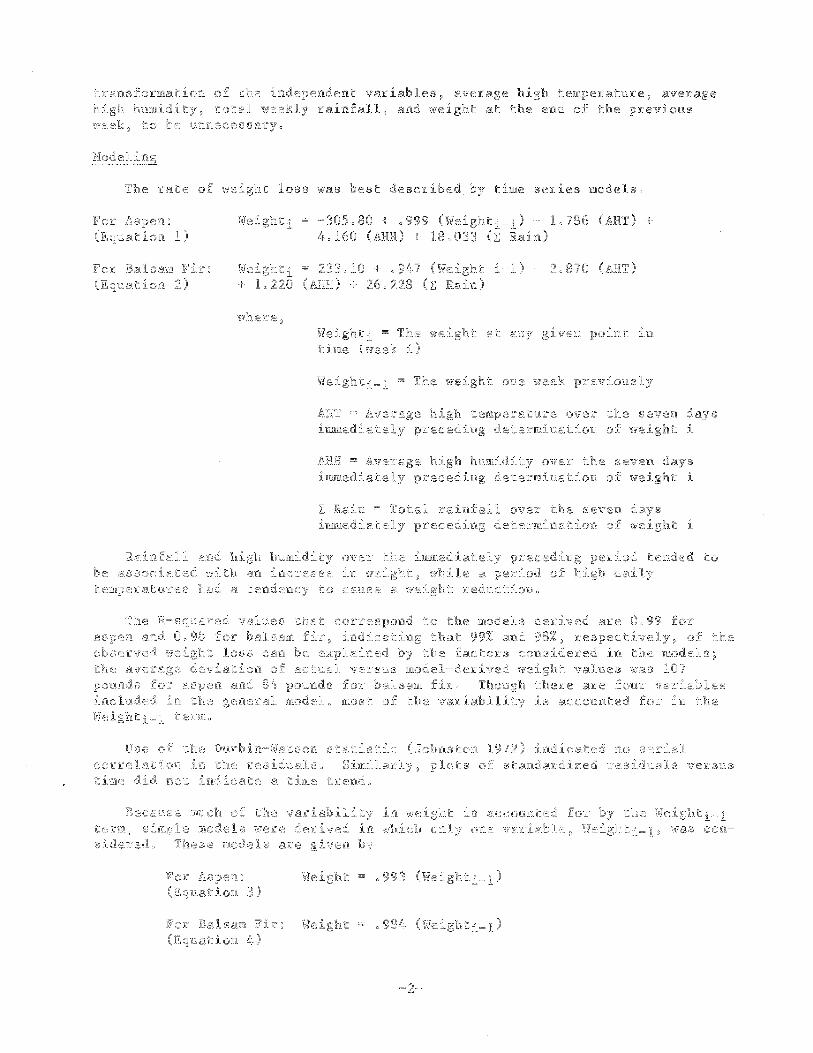
The rate of weight loss was best described_ by time series models.
For Aspen: (Equation 1)
For Balsam Fir: (Equation 2)
Weighti = -305.80 + .999 (Weighti-1)- 1.786 (ART)+ 4.160 (ARH) + 18.033 (L Rain)
Weighti = 233.10 + .947 (Weight i-1) - 2.870 (ART) + 1.220 (ARH) + 26.228 (L Rain)
where, Weighti = The weight at any given point in time (week i)
Weighti-1 = The weight one week previously
ART = Average high temperature over the seven days immediately preceding determination of weight i
ARH = Average high humidity over the seven days immediately preceding determination of weight i
E Rain = Total rainfall over the seven days immediately preceding determination of weight i
Rainfall and high humidity over the immediately preceding period tended to be associated with an increase in weight, while a period of high daily temperatures had a tendency to cause a weight reduction.
The R-squared values that correspond to the models derived are 0.99 for aspen and 0.98 for balsam fir, indicating that 99% and 98%, respectively, of the observed weight loss can be explained by the factors considered in the models; the average deviation of actual versus model-derived weight values was 107 pounds for aspen and 84 pounds for balsam fir. Though there are four variables included in the general model, most of the variability is accounted for in the Weighti-1 term.
Use of the Durbin-Watson statistic (Johnston 1972) indicated no serial correlation in the residuals. Similarly, plots of standardized residuals versus time did not indicate a time trend.
Because much of the variability in weight is accounted for by the Weighti-1 term, simple models were derived in which only one variable, Weighti-1• was considered. These models are given by
For Aspen: (Equation 3)
Weight= .993 (Weighti-1)
For Balsam Fir: Weight= .984 (Weighti-1) (Equation 4)

Given the range of conditions over which data in this study were collected, the weight of aspen in each succeeding week can be predicted as 99.3 percent of the weight in the preceding week. The aspen model, in other words, assumes a weekly weight loss rate of 0.7 percent. Similarly, the balsam fir model assumes a weekly weight loss rate of 1.6 percent.
Again, use of the Durbin-Watson statistic showed that errors were uncorrelated. As before, no time trend was indicated by a plot of residuals.
This simplified model yields an average deviation of actual versus modelderived weight values of 162 pounds for aspen and 117 pounds for balsam fir. Note that these average deviations are 51 and 39 percent higher than those associated with the more complex model.
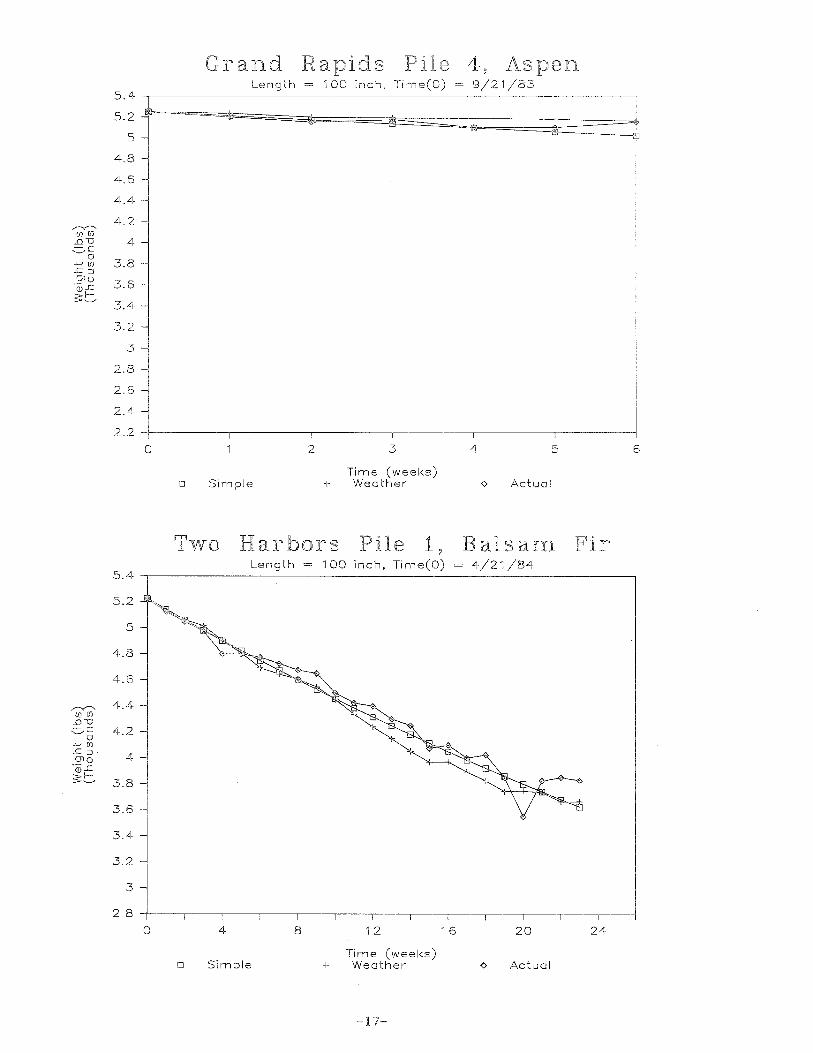
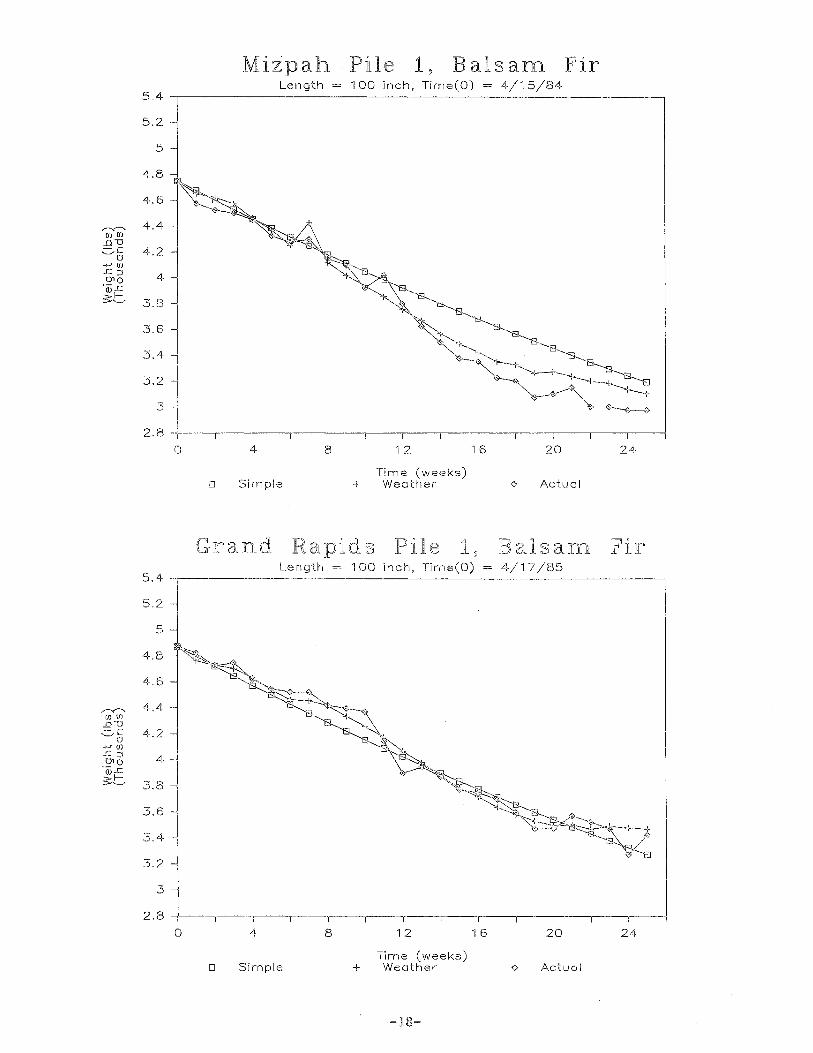
Figures 1 - 15 are plots of observed and model-derived weight values for pulpwood piles monitored for more than two weeks.
Surprisingly, both models perform equally well in tracking weight loss in 100-inch and tree-length pulpwood. It was anticipated that the tree length material would lose weight more slowly, but this expectation was not supported by field observations.
Summary
The rate of weight loss in fresh-cut, piled pulpwood is largely constant, but is influenced by environmental conditions such as average daily high temperature, average high humidity, and total rainfall in the days immediately preceding measurement. Models were developed from a number of observations of Minnesota pulpwood species using these factors in predicting pulpwood weight after a period of drying. Given the conditions that existed when data were gathered, the models explain 98 percent or more of the variation in drying rate.
A less accurate but simpler method of estimating weight loss in aspen and balsam fir pulpwood assumes a weight loss rate of about 0.7 percent and 1.6 percent per week respectively. This rate of loss will understate the weight loss that occurs in hot, dry periods and will overstate the rate of weight loss in humid, rainy periods. This method, however, is reasonably accurate over the range of conditions observed in this study.
LITERATURE CITED
Breiman, L. and J.H. Friedman. 1985. Estimating Optimal Transformations for Multiple Regression and Correlation. Jour. Amer. Stat. Assoc. 80:580-598.
Johnston, J. 1972. Econometric Methods. 2nd Ed. New York: McGraw-Hill Book Company.
Weisberg, S. 1985. Applied Linear Regression. 2nd Ed. New York: John Wiley & Sons.
-3-

Table 1
Pulpwood Monitored For Weight Loss -Quantity, Species, and Location
Species Location
Aspen Balsam Fir
Values are numbers of piles and (approximate numbers of cords)
Cole Forest Products, 5 Grand Rap;i.ds
Northwood Panel Products, 5 Bemidji
Rajala Timber Company, 5 Deer River
Blandin Paper Company, 1 Grand Rapids
Louisiana Pacific Corp., 1 Two Harbors
1 Mizpah
-4-

Table 2
Summary of Weight Loss and Accompanying Meteorological Data
~-
Weight of Pile at Beginning of Week Total Average Average
(lbs) Rainfall High High Location Species Week During Humidity Temperature
Week During During Pile Number (in.) Week (%) Week (°F)
1 2 3 4 5
Northwood Aspen 1 4725 1.12 90 81 Bemidji
2 4825 1.87 100 77
3 4625 3575 0.00 76 89
4 4400 3275 1. 74 100 82 --5 4300 3200 0.00 100 85
6 4475 3400 0.41 98 85
7 4375 3300 0.43 93 89
_? 4325 3275 4875 1. 59 83 81
9 4450 3400 4975 1.61 100 70
10 4275 3150 4875 1. 20 96 91
r--- 11 4225 3150 4800 0.34 96 78
12 4300 3250 4925 4450 1.86 96 67
13 4150 3150 4725 4350 0.28 92 57
14 4175 3250 4675 4350 0.08 92 70
15 4275 3225 4750 4400 1. 36 82 56
16 4250 3175 4725 4375 0.99 92 51
17 4225 3150 4725 4350 3850 0.11 90 47
18 4200 312~oo 1 4375 1 3825 1 0.12 I 83 I 53 _j
-5-

Table 2. (cont'd) Summary of Weight Loss and Accompanying Meteorological Data
Weight of Pile at Beginning of Week Total Average Average
(lbs) Rainfall High High Location Species Week During Humidity Temperature
Week During During Pile Number (in.) Week (%) Week (°F)
1 2 3 4 5
Cole Forest Aspen 1 4605 3.19 96 76 Products Grand Rapids 2 4475 0.27 95 73
3 4325 1.06 91 82
4 4375 3. 77 96 74
5 4250 0.00 91 85 ~
6 4150 4050 0.38 92 87
7 4150 4000 0.00 93 84
8 4165 3975 5.00 93 82
9 4085 3900 1. 78 91 75
10 3950 3800 4875 0.26 92 80
11 3950 3675 4800 0.00 93 79
12 4000 3700 4725 1.66 92 84
13 3925 3650 4675 0.47 92 80
14 3900 3675 4675 1. 70 92 71
15 3875 3625 4675 5200 0.91 92 57
16 3900 3625 4600 5150 0.07 93 63
17 3900 3725 4750 5175 1.67 92 60
18 3875 3625 4625 5100 1.06 93 54
19 3875 3625 4675 5100 4400 0.26 92 47
20 3875 3575 467515150 14400 I 0.09 I 92 I 52 I
-6-
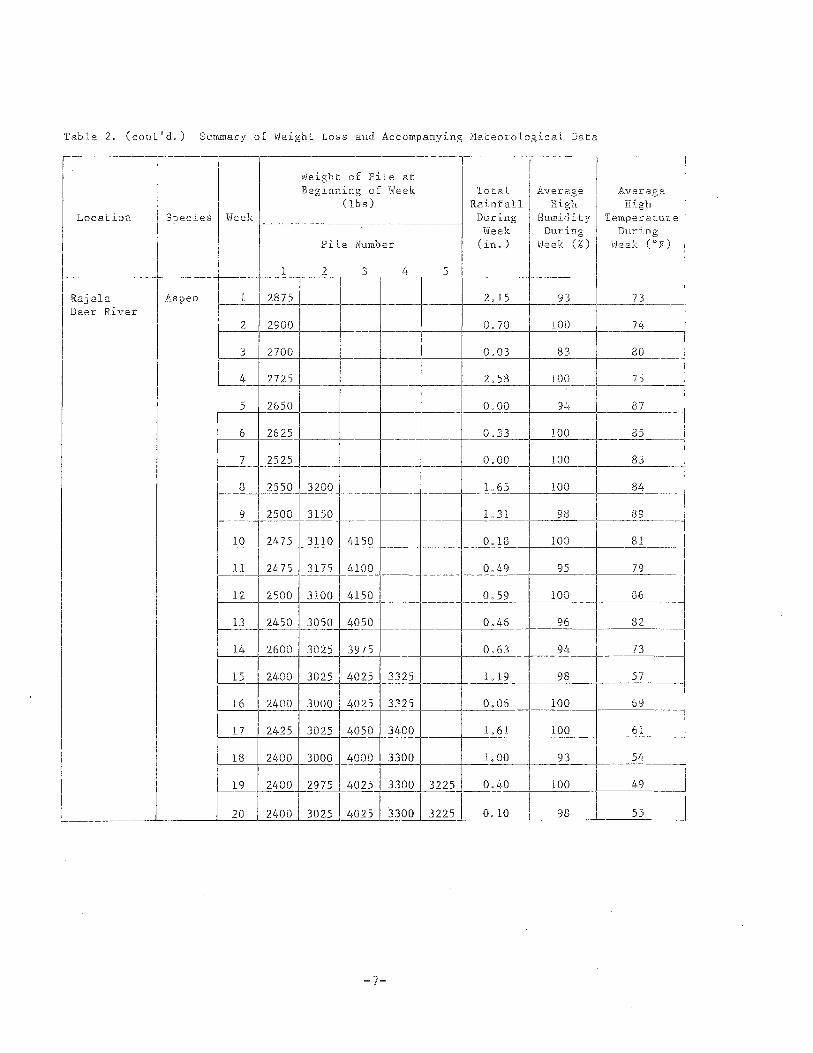
Table 2. (cont'd.) Summary of Weight Loss and Accompanying Meteorological Data
Weight of Pile at Beginning of Week Total Average Average
(lbs) Rainfall High High Location Species Week -- -- During Humidity Temperature
Week During During Pile Number (in.) Week (%) Week (°F)
1 2 3 4 5
Rajala Aspen 1 2875 2.15 93 73 Deer River
2 2900 0.70 100 74
3 2700 0.03 83 80
4 272.5 2.58 100 75
5 2650 0.00 94 87
6 2625 r--- 0.33 100 85
7 2525 0.00 100 83
8 2550 3200 1.65 100 84
9 2500 3150 1. 31 98 89
10 2475 3110 4150 0.18 100 81
11 2475 3175 4100 0.49 95 79 --
12 2500 3100 4150 0.59 100 86
13 2450 3050 4050 0.46 96 82
14 2600 3025 3975 0.63 94 73
15 2400 3025 4025 3325 1.19 98 57
16 2400 3000 4025 3325 0.06 100 69
17 2425 3025 4050 3400 1. 61 100 61
18 2400 3000 4000 3300 1.00 93 54
19 2400 2975 4025 3300 3225 0.40 100 49
20 2400 3025 4025 3300 3225 0.10 98 55 J
-7-
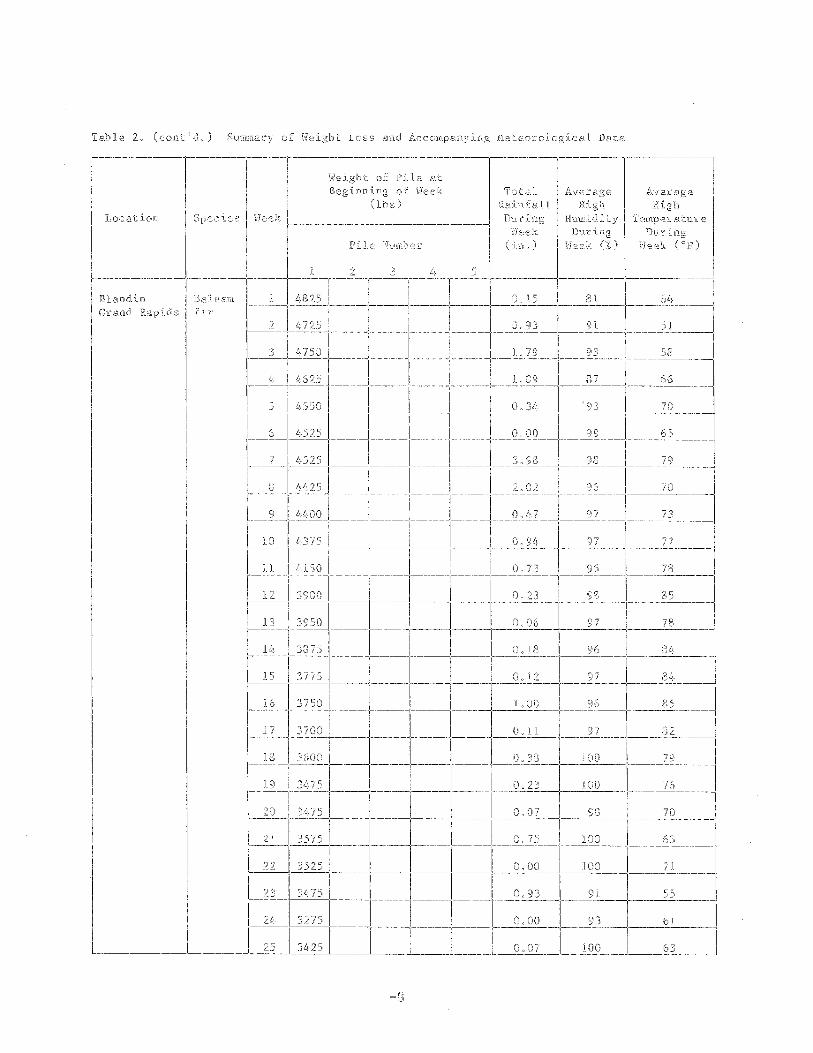
Table 2. (cont'd.) Summary of Weight Loss and Accompanying Meteorological Data
r--
Weight of Pile at Beginning of Week Total Average Average
(lbs) Rainfall High High Location Species Week During Humidity Temperature
Week During During Pile Number (in.) Week (%) Week (°F)
1 2 3 4 5
Blandin Balsam 1 4825 0.15 81 64 Grand Rapids fir
2 4725 0.93 91 51
3 4750 1. 79 93 58
4 4625 1.09 87 66
5 4550 0.34 '93 --r- 70
6 4525 0.00 99 65 --f-- --- 1-----1-
7 4525 I---?. 98 98 79 ---- -
1-8 4425 -----1-----1---- 1--
2.02 96 70
9 4400 1--- 0.47 97 73 --
10 4375 0.94 97 77
11 4150 0.73 96 78 --
12 3900 0.23 98 85 --
13 3950 0.06 97 78
14 3875 0.18 96 84 -- 1------
15 3775 0.12 97 84 ----16 3750 1.00 96 85 --
17 3700 0.11 97 82
-~8 3600 0.38 100 79 __
19 3475 0.23 100 76 --
20 3475 0.07 98 70 --21 3575 0.75 100 63
22 3525 0.00 100 71
23 3475 0.93 91 55
24- 3275 0.00 93 61
L-- 25 3425 0.07 100 63
-8-
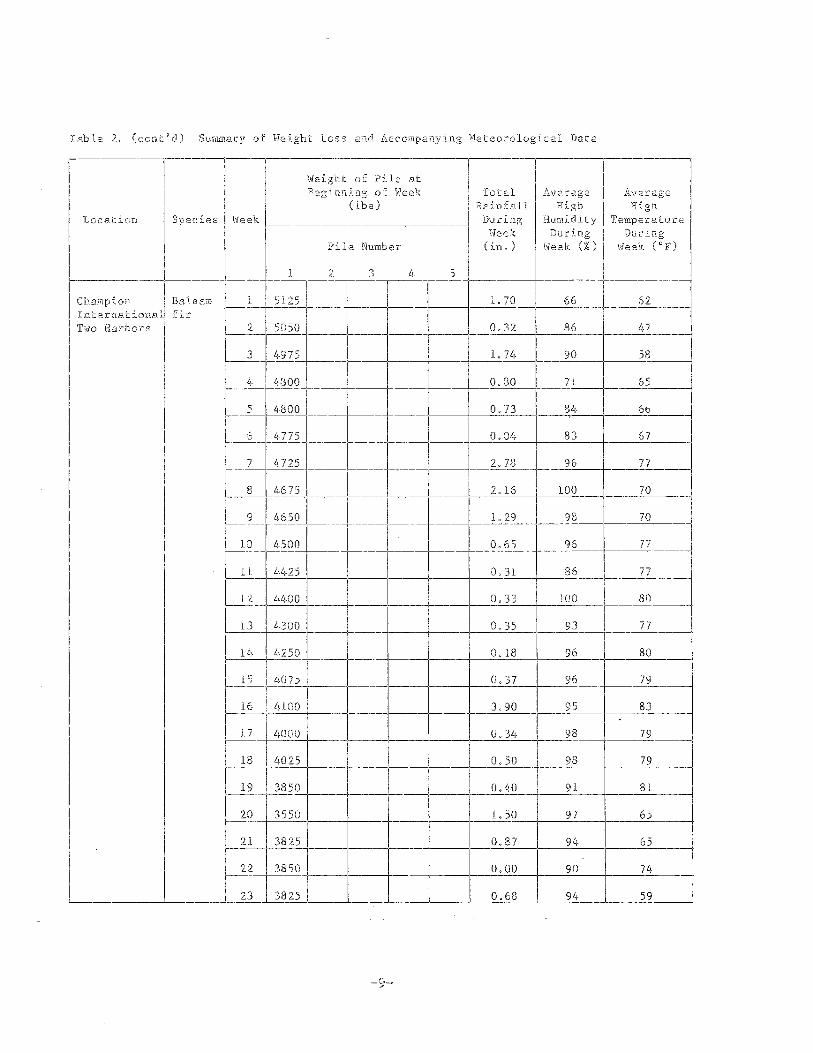
Table 2. (cont'd) Summary of Weight Loss and Accompanying Meteorological Data
-Weight of Pile at Beginning of Week Total Average Average
(lbs) Rainfall High High Location Species Week During Humidity Temperature
Week During During Pile Number (in.) Week (%) Week (°F)
1 2 3 4 5
Champion Balsam 1 5125 1. 70 66 62 International fir Two Harbors 2 5050 0.32 86 47
3 4975 1. 74 90 58
4 4800 0.80 71 65 -5 4800 0.73 84 66
6 4775 0.04 83 67
7 4725 2.78 96 77
8 4675 2.16 100 70
9 4650 1. 29 98 70
10 4500 0.65 96 77
11 4425 0.31 86 77
r---B- 4400 0.33 100 80
13 4300 0.35 93 77
14 4250 0.18 96 80 -
15 4075 0.37 96 79
16 4100 3.90 95 83 . 17 4000 0.34 98 79
18 4025 0.50 98 79
19 3850 0.40 91 81
20 3550 1.50 97 65
21 3825 0.87 94 65 -
22 3850 0.00 90 74
23 3825 0.68 94 59
-9-

Table 2. (cont'd) Summary of Weight Loss and Accompanying Meteorological Data
Weight of Pile at Beginning of Week Total Average Average
(lbs) Rainfall High High Location Species Week During Humidity Temperature
Week During During Pile Number (in.) Week (%) Week (°F)
1 2 3 4 5 --Champion Balsam 1 4575 0.00 79 61 -Internationa fir Mizpah 2 4525 0.79 99 53
3 4500 0.76 91 59
4 4450 0.53 63 66
5 4325 0.32 88 71
6 4275 0.00 67 69
7 4300 3.29 81 76
8 4150 0.41 64 69
9 4100 0.41 68 74 --10 3925 1.03 65 73
11 4025 1.12 72 78 --12 3800 0.71 81 86
13 3625 0.57 75 78
14 3500 0.02 77 80
15 3375 0.45 81 81
16 3350 1.14 78 82
17 3225 0.00 87 81
18 3200 1.37 77 73
19 3075 0.17 70 73
20 3100 0.07 77 69
21 3150 0.48 100 62
22 3000 0.00 86 70
23 3000 1. 36 51 62
24 2975 0.00 60 64
25 2975 0.26 67 66
-10-

~ men _Q"O .:::;,c
0 +'00 .!:::J 0'10
"Q).!:
~t:,
FIGURES
Figures 1-15 present weight versus time data. Measured (or actual) weight is plotted (0), as are weights predicted using equation 1 or 2 (+), and weights predicted using the simpler models described by equations 3 or 4 (0).
Bemidji Pile 1, Aspen Length = 1 00 inch, Time(O) = 7/1/83
5.4
5.2
5
4.8
4.6
4.4
4.2
4
3.8
3.6
3.4
3.2
3
2.8
2.6
2.4
2.2
0 2 3 4 5 6 7 8 9 10 11 12 13 14 15 16 17 18
Time (weeks) 0 Simple + Weather Actual
-11-
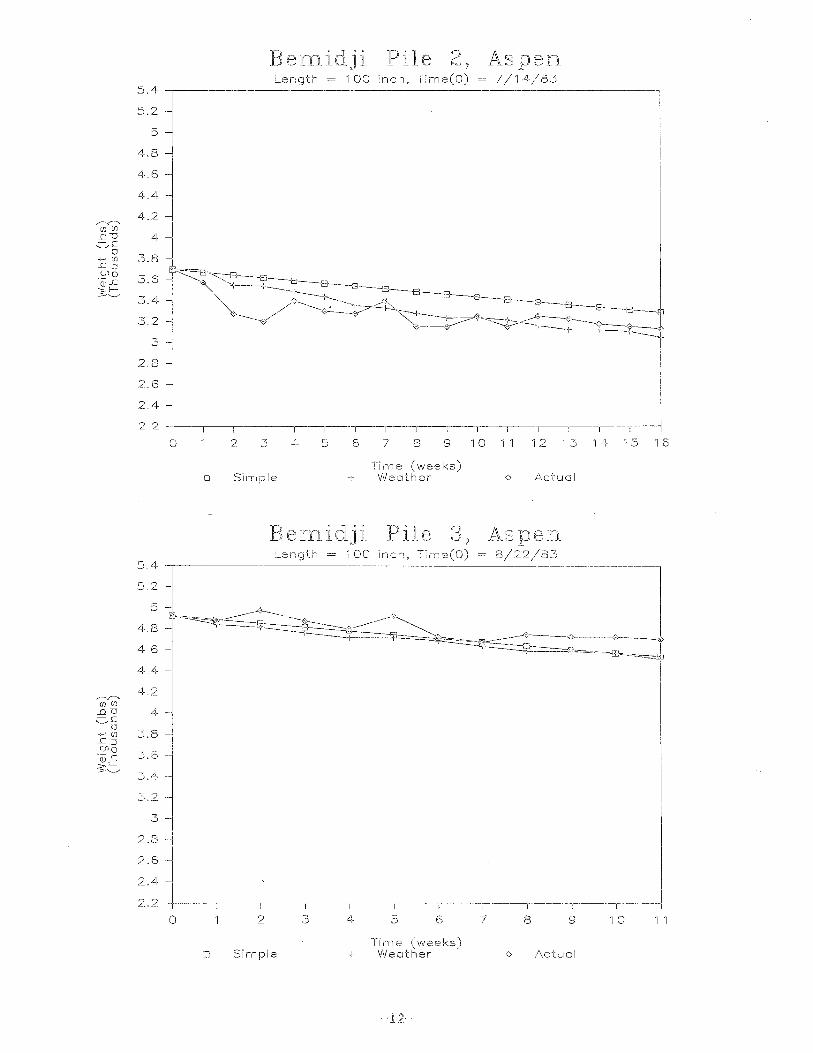
Bemidji Pile 2, Aspen 5.4
Length = 100 inch, Time(O) = 7/14/83
5.2
5
4.8
4.6
4.4
~ 4.2
oooo .au .::::.-c 4
0 3.8 -+-'00
..C::J OlQ
3.6 "Q) ..c ~c
3.4
3.2
3
2.8
2.6
2.4
2.2
0 2 3 4 5 6 7 8 9 10 11 12 13 14 15 16
Time (weeks) 0 Simple + Weather <> Actual
Bemidji Pile 3, Aspen 5.4
Length = 100 inch, Time(O) = 8/22/83
5.2 -
5 -
4.8 -
4.6 -
4.4-
4.2 -~ oooo .au .::::.-c 4-
0 3.8 --+-'00
..C::J OlQ
3.6 -"Q) ..c ~c
3.4-
3.2 -
3 -
2.8 -
2.6 -
2.4-
2.2 I I I I I I I I I I
0 1 2 3 4 5 6 7 8 9 10 1 1
Time (weeks) o Simple + Weather <> Actual
-12-
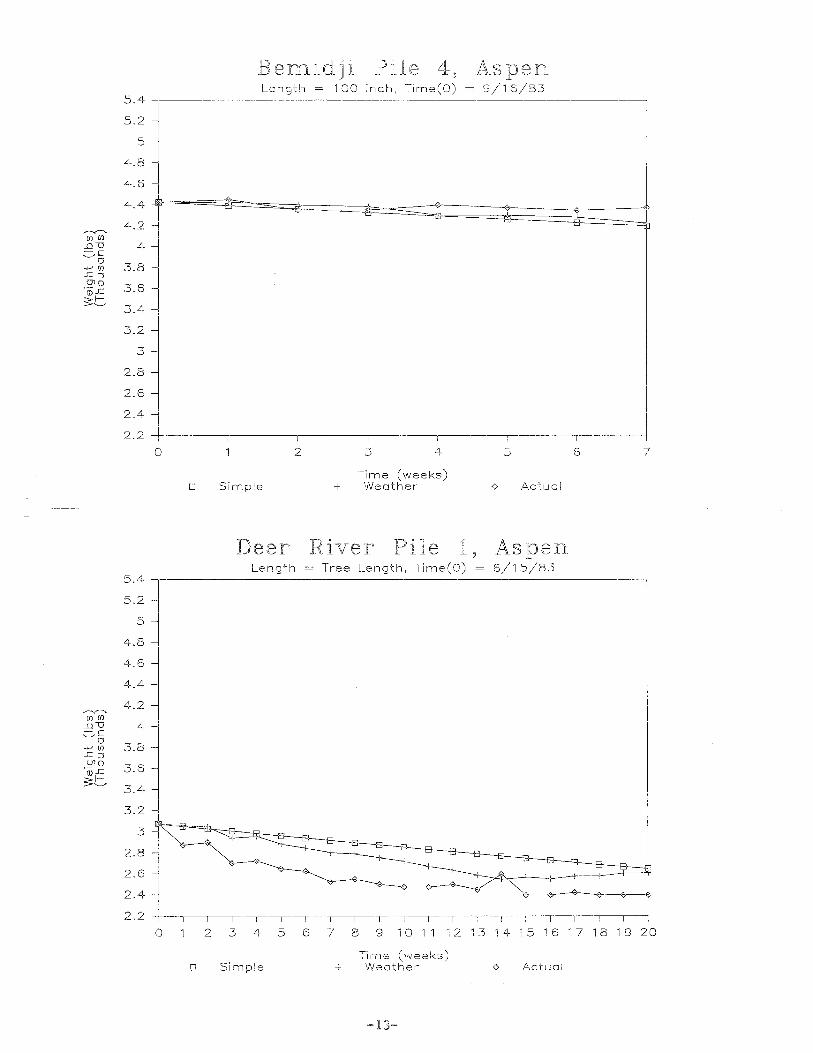
Bemidji Pile 4, Aspen Length = 100 inch, Time(O) = 9/16/83
5.4
5.2 -
5-
4.8 -
4.6-
4.4
4.2 -~
en en ..Cl""O c;_C
4-0
3.8 -....,en .C::J O>Q
3.6 -·v.c :s:c 3.4-
3.2 -
3 -
2.8 -
2.6 -
2.4 -
2.2 I I I I I I
0 2 3 4 5 6 7
Time (weeks) D Simple + Weather <> Actual
Deer River Pile 1, Aspen 5.4
Length = Tree Length, Time(O) = 6/15/83
5.2
5
4.8
4.6
4.4
4.2 ~
en en ..Cl""O 4 c;_c
0 3.8 ....,en
.C::J O>Q
3.6 ·- .c (j)f-:;;:.__., 3.4
3.2
3
2.8
2.6
2.4
2.2
0 2 3 4 5 6 7 8 9 1 0 1 1 1 2 1 3 1 4 1 5 1 6 1 7 1 8 1 9 20
Time (weeks) D Simple + Weather <> Actual
-13-
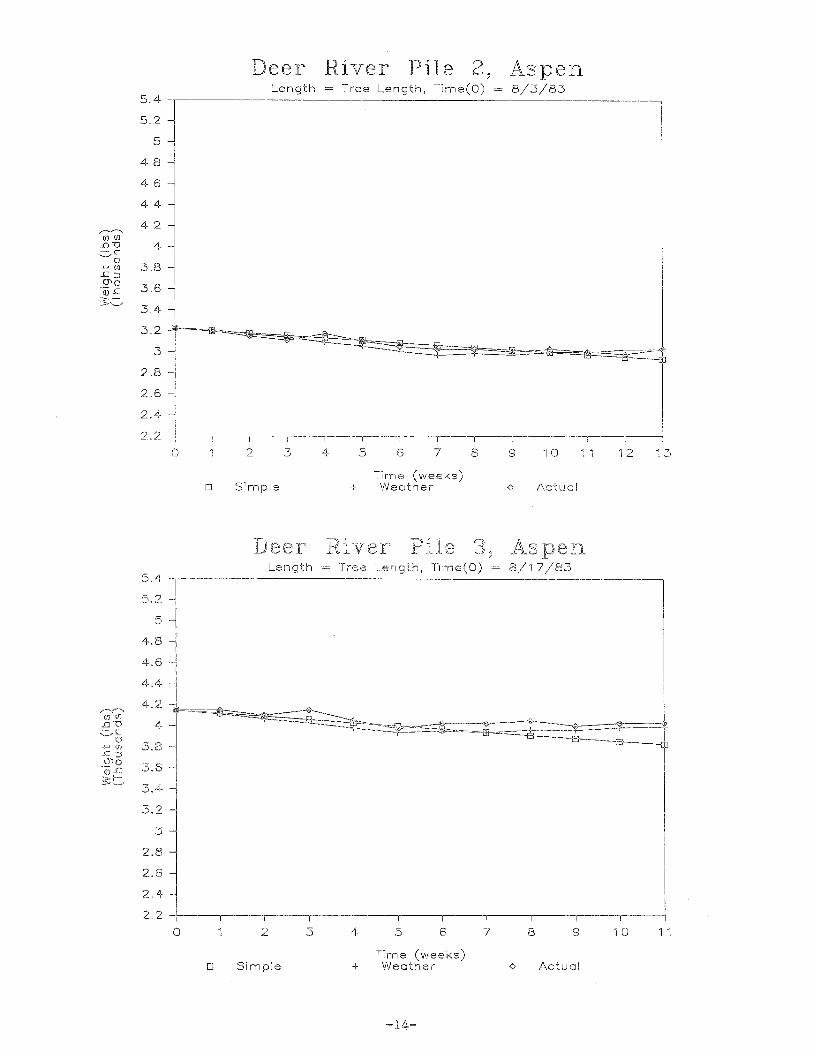
Deer River Pile 2, Aspen 5.4
Length = Tree Length, Time(O) = 8/3/83
5.2 -
5 -
4.8 -
4.6 -
4.4-
~ 4.2 -
CJlC/l .QlJ .::::.-c 4-
0 3.8 --+'C/l
.C::J O'IQ
3.6 -·- .c Q)f-$:-....,.,
3.4 -
3.2
3 -
2.8 -
2.6 -
2.4 -
2.2 I
0 2 3 4 5 6 7 8 9 1 0 11 12 13
o Simple Time (weeks)
+ Weather o Actual
Deer River Pile 3, Aspen 5.4
Length = Tree Length, Time(O) = 8/17/83
5.2 -
5 -
4.8 -
4.6 -
4.4 -
~ 4.2 -;
CJlC/l .QlJ 4-.::::.-c
0 3.8 --+'C/l
.C::J O'IQ
3.6 -"ii).c s:c
3.4 -
3.2 -
3 -
2.8 -
2.6 -
2.4-
2.2 I
0 2 3 4 5 6 7 8 9 10 1 1
Time (weeks) o Simple + Weather o Actual
-14-

Deer River Pile 4, Aspen Length = Tree Length, Time(O) = 9/21/83
5.4
5.2 -
5-
4.8-
4.6-
4.4-
,..-..r--.. 4.2 -
(I)C/l ..c-o .:::;,c
4-0
3.8 -+'C/l ..C::J O'lQ
3.6 -"Q)..c ~t:,
3.4- -3.2
3-
2.8 -
2.6 -
2.4-
2.2 I I
0 2 3 4 5 6
Time (weeks) D Simple + Weather <> Actual
Grand Rapids Pile 1, Aspen 5.4
Length = 100 inch, Time(O) = 6/15/83
5.2
5
4.8
4.6
4.4
,..-..r--.. 4.2
(I)Cil ..c-o .:::;,c
4 0
3.8 +'Cil ..C::J O'lQ
3.6 "Q)..c ~t:,
3.4
3.2
3
2.8
2.6
2.4
2.2
0 2 3 4 5 6 7 8 9 1 0 1 1 1 2 1 3 1 4 1 5 1 6 1 7 1 8 1 9 20
D Simple Time (weeks)
+ Weather <> Actual
-15-

Grand Rapi s -----------~L:e~n~~=-~~~~~--~~--------,----~·· 100 inch, Tim ~
::= . 5 - I
4.8l
4.6 ~
:·: ~::::::;'::cc_-=1'-c::::~';::-- -&-A----i3----a---n-s---s----e-_1 4- ~~ ~---~~--~--1--1
3.2
3 I 2.8 -1
I 2.6 -
o Simple
I
2 3 4
0 Simple
+ <> Actual
a ids en = 1 00 inch,
---r 5 6 7
+ 0 :<\ctuol
Grand Rapids Pile 4, Aspen Length = 100 inch, Time(O) = 9/21/83
5.4
5.2 -=
5-
4.8 -
4.6 -
4.4-
~ 4.2-
oooo .0"0 4-.;::,c
0 3.8 -+'00
..C::J O'>Q 3.6 -·w ..c :s:c
3.4-
3.2 -
3 -
2.8 -
2.6 -
2.4 -
2.2 I
0 2 3 4 5 6
Time (weeks) 0 Simple + Weather <> Actual
Two Harbors Pile 1, Balsam Fir Length = 100 inch, Time(O) = 4/21/84
5.4
5.2
5
4.8
4.6
~ 4.4 oooo .0"0 .;::,c 4.2
0 +'00 ..c ::J.
4 O'>Q ·Q)..c :s:c 3.8
3.6
3.4
3.2
3
2.8
0 4 8 12 1 6 20 24
0 Simple + Time (weeks) Weather <> Actual
-17-
~ rJJ(I')
_Q\J c-c
0 ..... (JJ
..C::; cno
"iii ..c s:G
5.2 -
0
0
Mizpah Pile 1, B al s arn Fir 100 inch, Time(O) =
4 8 12 1 6 20 24
Time (vveeks) o Sim + Weather Actual
Gra11d Ra · ds Pile 1 '
B als an1. Fir = 100 inch,
4 8 1 2 1 6 20 24
Time (weeks) o Simple + 1Neather Actual


The University of Minnesota, including the Agricultural Experiment Station, is committed to the policy that all persons shall have equal access to its programs, facilities, and employment without regard to race, religion, color, sex, national origin, handicap, age, veteran status, or sexual orientation.