pupils educated other than at school, 2018/19 · 2019-07-31 · 5 in 2018/19, 2,286 pupils were...
TRANSCRIPT

Statistician: Stephen Hughes ~ 0300 025 5060 ~ [email protected] This report is also available in Welsh
Enquiries from the press: 0300 025 8099 Public enquiries : 0300 025 5050 Twitter: @statisticswales
Pupils educated other than at school, 2018/19
1 August 2019
SFR 58/2019
This annual Statistical First Release reports on the number of pupils receiving
education outside of school funded by Welsh local authorities and the number
of pupils receiving elective home education in Wales. The information relates
to the number of pupils receiving these forms of education during a census
week in January for the academic years 2013/14 to 2018/19. During the
2018/19 academic year the census week was 14th to 18th January 2019.
Chart 1: Rate per 1,000 pupils who are Educated Other Than At School (EOTAS), 2013/14 – 2018/19
The rate of EOTAS pupils receiving their main education other than at
school increased in 2018/19 over the year to 3.8 per 1,000 pupils. This
is the highest rate since 2009/10.
EOTAS pupils are pupils who receive
education outside of school funded by Welsh
local authorities.
2,286 the number of EOTAS pupils.
1,784 the number of EOTAS pupils
receiving their main education other than
at school (Table 1).
3.8 out of 1,000 pupils in Wales received
their main education other than at school
(Table 2).
Pupil referral
units were the most
used type of EOTAS
education (Table 7).
7 out of 10 pupils
whose main education
is other than at school
were boys (Table 3).
About this release
This release covers data
on individual pupils
receiving education
outside of school,
including Pupil Referral
Units, and includes data
by age, gender and the
type of provision.
Data are shown for
Wales and at local
authority/consortium
level.
In this release
EOTAS pupils by:
Local authority 4-6
Pupils whose main
education is other than
at school by:
Age and gender 7
Special educational need
(SEN) Provision 8
Free school meal (FSM) 8
Ethnic background 9
EOTAS pupils:
EOTAS educational
provision types 10-11
Pupil referral units 12-13
Electively home-
educated pupils 14
2.63.0
3.23.0
3.43.8
0.0
0.5
1.0
1.5
2.0
2.5
3.0
3.5
4.0
2014 2015 2016 2017 2018 2019
Rate
pe
r 1,0
00 p
up
ils

2
Contents
Page
Chart 1 Rate per 1,000 pupils who are Educated Other Than At School (EOTAS), 2013/14 –
2018/19
1
Local authority analysis of EOTAS pupils
Table 1 Number of pupils educated other than at school, by local authority, 2018/19 4
Table 2 Pupils whose main education is other than at school, by local authority, 2013/14-
2018/19
6
EOTAS pupils whose main education is other than at school, by pupil characteristics
Table 3 Pupils whose main education is other than at school, by age and gender, 2013/14-
2018/19
7
Table 4 Pupils whose main education is other than at school, by special educational need
(SEN) provision, 2013/14-2018/19
8
Table 5 Pupils whose main education is other than at school, by free school meal (FSM)
entitlement, 2013/14-2018/19
8
Table 6 Pupils whose main education is other than at school, by ethnic background, 2013/14-
2018/19
9
Educational provisions given to EOTAS pupils
Table 7 Pupils whose main education is other than at school, by educational provision,
2018/19
10
Chart 2 Number of pupil enrolments, by educational provision, 2018/19 11
Chart 3 Percentage of pupil enrolments, by educational provision, 2013/14-2018/19 11
Number of pupils attending pupil referral units
Table 8 Number of pupils attending Pupil Referral Units in Wales, by age, 2018/19 12
Table 9 Number of pupils attending Pupil Referral Units in Wales, by local authority, 2018/19 13
Pupils electively educated at home
Table 10 Number of pupils of compulsory school age electively educated at home, by local
authority, 2013/14-2018/19
14
Additional information
Notes 15
3
Introduction
The EOTAS Census covers pupils who are placed by Local Authorities (LAs) in Pupil Referral
Units (PRUs) or other forms of alternative provision referred to as ‘Educated Other Than At School
(EOTAS)’. It is equivalent of the Pupil Level Annual School Census (PLASC) for children educated
other than at school.
The overriding criterion for inclusion in the EOTAS census is that it is for pupils for whom a Welsh
LA has a financial responsibility and if not included in this census collection would not be picked up
via PLASC. However, some pupils may legitimately be included in the EOTAS census and also on
a school PLASC (for maintained primary, secondary and special schools).
The collection focuses on children receiving education funded by the LA other than at school as
defined in Section 19(1) of the Education Act 1996 i.e. those children of compulsory school age
who, by reason of illness, exclusion or otherwise may not for any period receive suitable education.
Pupil Referral Units (PRUs)
Section 19 (1) of the Education Act 1996 requires LAs to make arrangements for the provision of
suitable education at schools or otherwise for children of compulsory school age who, for whatever
reason of illness, exclusion from school or otherwise, may not for any period receive suitable
education unless suitable arrangements are made for them. Section 19 (2) states that any school
established to provide education for such children and which is not a county [community] or special
school, shall be known as a “Pupil Referral Unit”.
Category of provision
The pupil will either be placed in a PRU or another form of EOTAS provision. The categories are:
Pupil Referral Unit
Further education college
Maintained primary, middle, secondary or special school
Non-maintained special school
Individual tuition and tuition at pupils’ homes or at hospital
Youth Gateway
Work related education
Training providers
Voluntary organisations
Brought in private sector provision
Independent schools
Pupil attending provision not maintained by the authority, or outside of the authority, for
which the authority pays fees
Awaiting provision or not currently in provision
Other

4
Table 1: Number of pupils educated other than at school, by local authority, 2018/19 EOTAS pupils w hose main education is outside of school and w ho EOTAS pupils w ho
have subsidiary have main or current All pupils
are not on roll at a enrolment status at enrolment status at receiving EOTAS
Local Authority maintained school a maintained school Total a maintained school provision
Isle of Anglesey 13 0 13 0 13
Gw ynedd 40 0 40 0 40
Conw y 72 0 72 0 72
Denbighshire 87 0 87 58 145
Flintshire 80 41 121 6 127
Wrexham 17 45 62 * *
Pow ys 53 6 59 * *
Ceredigion * * 13 12 25
Pembrokeshire 14 109 123 13 136
Carmarthenshire 6 66 72 25 97
Sw ansea 59 93 152 22 174
Neath Port Talbot * * 45 * *
Bridgend 0 69 69 10 79
The Vale of Glamorgan 37 77 114 23 137
Rhondda Cynon Taf 71 122 193 14 207
Merthyr Tydfil 8 65 73 25 98
Caerphilly 83 30 113 128 241
Blaenau Gw ent * 0 * 0 *
Torfaen * 0 * 19 *
Monmouthshire * * 14 7 21
New port 88 16 104 49 153
Cardiff 215 10 225 86 311
Wales:
2018/19 1,027 757 1,784 502 2,286
2017/18 1,008 601 1,609 579 2,188
2016/17 892 510 1,402 570 1,972
2015/16 909 603 1,512 602 2,114
2014/15 909 478 1,387 770 2,157
2013/14 958 267 1,225 1,142 2,367
Sources: EOTAS Pupil Census, Welsh Government
Pupil Level Annual School Census, Welsh Government
Key points for 2018/19
2,286 the number of EOTAS pupils, down 3% since 2013/14.
1,784 the number of EOTAS pupils receiving their main education other than at school, up 46%
since 2013/14.
78% the percentage of EOTAS pupils receiving their main education other than at school, up
from 52% in 2013/14.

5
In 2018/19, 2,286 pupils were reported to be receiving education other than at school
funded by their local authority during the census week (14th to 18th January 2019). In this
statistical release such pupils will be referred to as ‘EOTAS pupils’.
Not all EOTAS pupils receive their education solely outside of the maintained school
environment. In fact, many of them are still on roll at maintained schools. Of the 2,286
EOTAS pupils:
1,027 EOTAS pupils were not on roll at a maintained school in the January 2019
Pupil-Level Annual School Census (PLASC), so they only received education ‘other
than at school’;
757 EOTAS pupils had ‘subsidiary’ enrolment status in maintained schools in the
January 2019 PLASC, meaning that their main education was ‘other than at school’;
and;
502 EOTAS pupils had ‘main’ or ‘current’ enrolment status in maintained schools in
the January 2019 PLASC, which means that their main education was in a
maintained school.
This breakdown can be seen in the following diagram. The circle on the left represents the
EOTAS pupils who were on roll at a maintained school, while the circle on the right shows
the EOTAS pupils whose main education was other than at school. The section where the
circles overlap shows the number of EOTAS pupils whose main education was other than
at school and had ‘subsidiary’ enrolment status in a maintained school.
Since pupils with ‘main’ or ‘current’ enrolment status in the January 2019 PLASC are
included in the Schools’ Census publication, the main focus of this statistical release will be
on the EOTAS pupils whose main education is other than at school – the 1,784 pupils
represented by the circle on the right.

6
Table 2: Pupils whose main education is other than at school, by local authority, 2013/14-2018/19 (a)
Number Rate (a)
2013/14 2014/15 2015/162016/17 2017/18 2018/19 2013/14 2014/15 2015/16 2016/17 2017/18 2018/19
Isle of Anglesey 23 23 20 40 29 13 2.4 2.4 2.1 4.1 3.0 1.3
Gw ynedd 31 29 69 38 33 40 1.8 1.7 4.0 2.2 1.9 2.4
Conw y 75 70 55 63 64 72 4.7 4.4 3.4 4.0 4.0 4.5
Denbighshire 66 45 62 75 98 87 4.2 2.8 3.9 4.8 6.2 5.5
Flintshire 137 145 119 95 111 121 5.7 6.1 5.0 4.0 4.7 5.2
Wrexham 59 47 41 36 56 62 3.0 2.4 2.1 1.8 2.9 3.2
Pow ys 59 58 59 52 62 59 3.2 3.2 3.3 2.9 3.6 3.4
Ceredigion 16 15 31 15 * * 1.7 1.6 3.2 1.6 * *
Pembrokeshire 8 10 18 30 33 123 0.4 0.6 1.0 1.7 1.9 7.1
Carmarthenshire 30 50 72 59 68 72 1.1 1.8 2.6 2.2 2.5 2.6
Sw ansea 128 178 168 140 169 152 3.6 5.0 4.7 3.9 4.7 4.2
Neath Port Talbot 92 80 76 56 42 45 4.4 3.9 3.6 2.7 2.0 2.1
Bridgend 29 39 45 30 51 69 1.3 1.7 2.0 1.3 2.2 3.0
The Vale of Glamorgan 96 80 108 103 116 114 4.4 3.6 4.8 4.6 5.1 5.0
Rhondda Cynon Taf 87 102 160 149 176 193 2.2 2.6 4.1 3.8 4.5 5.0
Merthyr Tydfil 0 3 40 29 48 73 0.0 0.3 4.6 3.3 5.4 8.0
Caerphilly 16 142 70 30 59 113 0.6 4.9 2.4 1.1 2.1 4.0
Blaenau Gw ent 43 33 43 57 * * 4.5 3.5 4.6 6.1 * *
Torfaen 20 26 24 14 40 17 1.3 1.7 1.6 0.9 2.7 1.1
Monmouthshire 6 5 * 12 22 14 0.5 0.4 * 1.0 1.9 1.2
New port 67 68 87 96 88 104 2.7 2.7 3.4 3.8 3.4 3.9
Cardiff 137 139 133 183 227 225 2.6 2.6 2.5 3.4 4.1 4.1
Wales 1,225 1,387 1,512 1,402 1,609 1,784 2.6 3.0 3.2 3.0 3.4 3.8
Sources: EOTAS Pupil Census, Welsh Government
School Census, Welsh Government
(a) Rate per 1,000 pupils. Full- and part-time pupils in maintained nursery, primary, secondary and special schools and pupils w hose
(a) main education is other than at school as in the January School Census and EOTAS Pupil Census.
Key points in 2018/19
3.8 out of every 1,000 pupils received their main education other than at school.
The rate of pupils whose main education is other than at school increased during 2018/19.
Merthyr Tydfil had the highest rate of pupils whose main education is other than at school.
In 2018/19, 3.8 out of every 1,000 pupils in Wales received their main education other than
at school, which is up from 3.4 out of every 1,000 in 2017/18 and 2.6 out of every 1,000 in
2013/14.
Cardiff, Rhondda Cynon Taf and Swansea had the highest numbers of EOTAS pupils in
2018/19, but Merthyr Tydfil had the highest rate of EOTAS pupils in 2018/19 at 8.0 per
1,000 pupils.
Pembrokeshire had a rate of 7.1 per 1,000 pupils, up from 1.9 in 2017/18. This is due to
an increase in the number of pupils being recorded as subsidiary enrolment at a maintained
school, as opposed to being recorded as main or current enrolment status.

7
Table 3: Pupils whose main education is other than at school, by age and gender, 2013/14 - 2018/19 (a)
Number Rate (a)
2013/14 2014/15 2015/16 2016/17 2017/18 2018/19 2013/14 2014/15 2015/16 2016/17 2017/18 2018/19
Gender
Boys 858 990 1,060 979 1,139 1,253 3.6 4.2 4.4 4.1 4.8 5.2
Girls 367 397 452 423 470 531 1.6 1.7 2.0 1.8 2.0 2.3
Pupils 1,225 1,387 1,512 1,402 1,609 1,784 2.6 3.0 3.2 3.0 3.4 3.8
Age (b)
19 or over 0 * 0 0 * * 0.0 * 0.0 0.0 * *
18 23 25 18 22 27 13 14.9 17.6 12.2 19.9 24.1 13.3
17 36 47 49 56 28 48 2.9 3.7 4.1 4.9 2.6 4.7
16 65 75 80 59 73 56 4.1 4.9 5.5 4.4 5.8 4.8
15 546 609 718 596 705 815 15.8 18.2 22.2 18.9 23.0 25.9
14 213 262 243 211 266 281 6.4 8.1 7.6 6.8 8.4 8.8
13 120 132 150 148 151 177 3.7 4.1 4.9 4.7 4.7 5.4
12 68 83 90 69 103 111 2.1 2.7 2.8 2.1 3.1 3.3
11 40 48 42 52 51 72 1.3 1.5 1.3 1.6 1.5 2.1
10 32 19 35 47 50 67 1.0 0.6 1.1 1.4 1.5 1.9
9 18 29 21 44 47 44 0.6 0.9 0.6 1.3 1.3 1.3
8 22 17 15 36 34 20 0.7 0.5 0.4 1.0 1.0 0.6
7 9 10 19 15 17 29 0.3 0.3 0.5 0.4 0.5 0.8
6 7 10 7 18 22 21 0.2 0.3 0.2 0.5 0.6 0.6
5 9 * 7 9 * * 0.3 * 0.2 0.2 * *
Under 5 17 14 18 20 17 20 0.2 0.2 0.2 0.3 0.2 0.3
Total 1,225 1,387 1,512 1,402 1,609 1,784 2.6 3.0 3.2 3.0 3.4 3.8
Sources: EOTAS Pupil Census, Welsh Government
School Census, Welsh Government
(a) Rate per 1,000 pupils. Full- and part-time pupils in maintained nursery, primary, secondary and special schools and pupils w hose main
(a) education is other than at school as in the January School Census and EOTAS Pupil Census.
(b) Age as on 31 August at the start of the academic year.
Key points in 2018/19
For pupils whose main education is other than at school:
7 in every 10 pupils were boys.
6 in every 10 were aged 14 or 15.
Pupils aged 15 had the highest rate of EOTAS pupils of all pupils of compulsory school age.
Since 2013/14 there have been more boys whose main education is other than at school
than girls and this continues to be the case in 2018/19. Around 7 in every 10 pupils whose
main education is other than at school were boys.
The rate of boys whose main education is other than school has increased from 4.8 out of
1,000 in 2017/18 to 5.2 in 2018/19. The rate of girls has increased from 2.0 out of 1,000 in
2017/18 to 2.3 in 2018/19.
15 year olds had the highest rate of pupils receiving their main education other than at
school overall in 2018/19, with almost 26 in every 1,000 pupils of this age educated other
than at school.
The rate of pupils aged 11-15 whose main education is other than at school increases as
the pupils’ ages increase. In 2018/19, 2.1 out of every 1,000 pupils aged 11 received their
main education other than at school and as pupils’ ages increase, this rate also increases,
to 25.9 out of every 1,000 pupils at age 15.

8
Table 4: Pupils whose main education is other than at school, by special educational need (SEN) provision, 2013/14 - 2018/19 (a)
Number of pupils Percentage of pupils (a)
SEN provision 2013/14 2014/15 2015/16 2016/17 2017/18 2018/19 2013/14 2014/15 2015/16 2016/17 2017/18 2018/19
Statement of SEN 424 463 472 468 545 583 34.6 33.4 31.2 33.4 33.9 32.7
School Action Plus 594 645 705 694 729 862 48.5 46.5 46.6 49.5 45.3 48.3
School Action 41 87 123 79 122 126 3.3 6.3 8.1 5.6 7.6 7.1
No SEN 166 192 212 161 213 213 13.6 13.8 14.0 11.5 13.2 11.9
Total 1,225 1,387 1,512 1,402 1,609 1,784 100.0 100.0 100.0 100.0 100.0 100.0
Sources: EOTAS Pupil Census, Welsh Government
(a) Percentage of pupils w hose main education is other than at school.
88.1% of pupils whose main education is other than at school in 2018/19 have special
educational needs.
In 2018/19 the percentage of pupils whose main education is other than at school with
special educational needs increased compared to 2017/18.
Since 2013/14, School Action Plus has been the most common SEN provision for pupils
whose main education is other than at school.
Table 5: Pupils whose main education is other than at school, by free school meal (FSM) entitlement, 2013/14-2018/19 (a)
Number of pupils Percentage of pupils (a)
Free school meal entitlement 2013/14 2014/15 2015/16 2016/17 2017/18 2018/19 2013/14 2014/15 2015/16 2016/17 2017/18 2018/19
Entitled to FSM 407 484 629 462 632 649 33.2 34.9 41.6 33.0 39.3 36.4
Not entitled to FSM 818 903 883 940 977 1,135 66.8 65.1 58.4 67.0 60.7 63.6
Total 1,225 1,387 1,512 1,402 1,609 1,784 100.0 100.0 100.0 100.0 100.0 100.0
Sources: EOTAS Pupil Census, Welsh Government
(a) Percentage of pupils w hose main education is other than at school.
Key points
Of pupils whose main education is other than at school;
Around 7 out of 20 pupils were entitled to free school meals.
36.4 per cent of pupils whose main education is other than at school were entitled to free
school meals in 2018/19.
The percentage of pupils whose main education is other than at school who were entitled to
free school meals decreased in 2018/19, but remained higher than the 33 per cent seen in
2016/17.
9
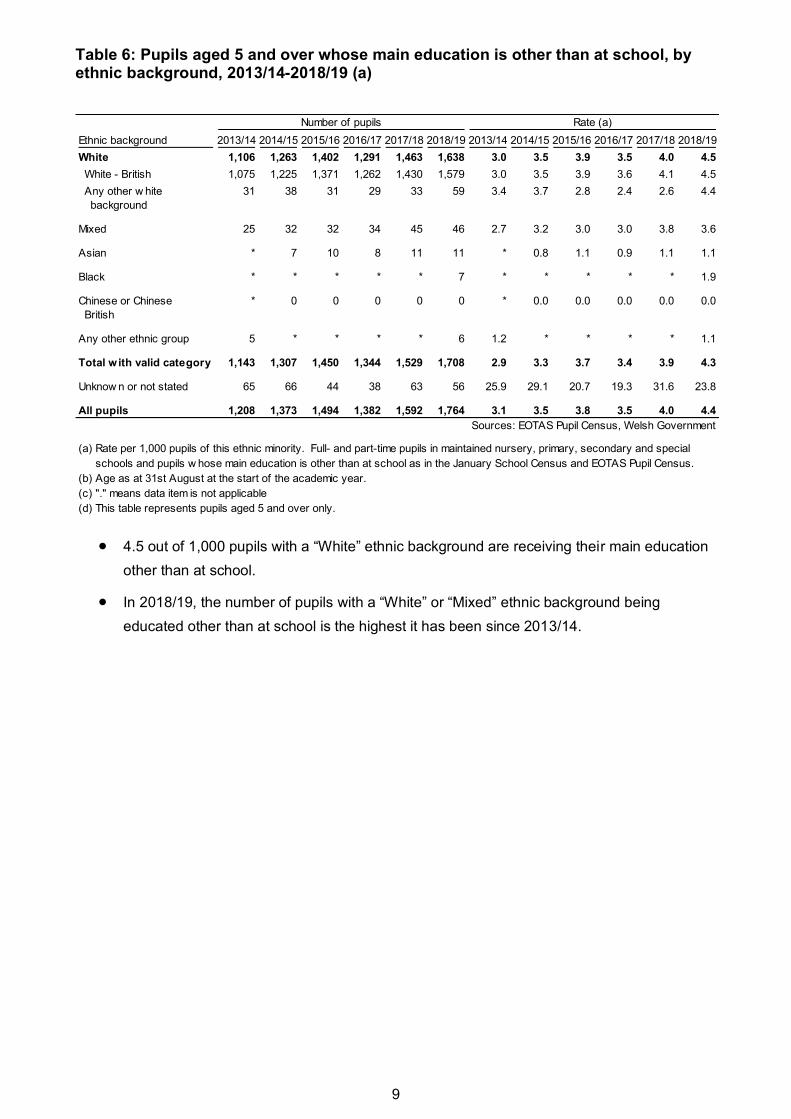
Table 6: Pupils aged 5 and over whose main education is other than at school, by ethnic background, 2013/14-2018/19 (a)
Number of pupils Rate (a)
Ethnic background 2013/14 2014/15 2015/16 2016/17 2017/18 2018/19 2013/14 2014/15 2015/16 2016/17 2017/18 2018/19
White 1,106 1,263 1,402 1,291 1,463 1,638 3.0 3.5 3.9 3.5 4.0 4.5
White - British 1,075 1,225 1,371 1,262 1,430 1,579 3.0 3.5 3.9 3.6 4.1 4.5
Any other w hite 31 38 31 29 33 59 3.4 3.7 2.8 2.4 2.6 4.4
background
Mixed 25 32 32 34 45 46 2.7 3.2 3.0 3.0 3.8 3.6
Asian * 7 10 8 11 11 * 0.8 1.1 0.9 1.1 1.1
Black * * * * * 7 * * * * * 1.9
Chinese or Chinese * 0 0 0 0 0 * 0.0 0.0 0.0 0.0 0.0
British
Any other ethnic group 5 * * * * 6 1.2 * * * * 1.1
Total w ith valid category 1,143 1,307 1,450 1,344 1,529 1,708 2.9 3.3 3.7 3.4 3.9 4.3
Unknow n or not stated 65 66 44 38 63 56 25.9 29.1 20.7 19.3 31.6 23.8
All pupils 1,208 1,373 1,494 1,382 1,592 1,764 3.1 3.5 3.8 3.5 4.0 4.4
Sources: EOTAS Pupil Census, Welsh Government
(a) Rate per 1,000 pupils of this ethnic minority. Full- and part-time pupils in maintained nursery, primary, secondary and special
(a) schools and pupils w hose main education is other than at school as in the January School Census and EOTAS Pupil Census.
(b) Age as at 31st August at the start of the academic year.
(c) "." means data item is not applicable
(d) This table represents pupils aged 5 and over only.
4.5 out of 1,000 pupils with a “White” ethnic background are receiving their main education
other than at school.
In 2018/19, the number of pupils with a “White” or “Mixed” ethnic background being
educated other than at school is the highest it has been since 2013/14.

10
Table 7: Pupils whose main education is other than at school, by educational provision, 2018/19
Since pupils may attend more than one educational provision in a week, some pupils may be
counted against more than one provision. That is why the number of enrolments is higher than the
number of pupils whose main education is other than at school (1,784 pupils) in Table 1.
Average number of
hours a pupil is scheduled
Educational provision Number of enrolments Percentage of enrolments to attend in a w eek
Pupil referral unit (a) 820 43.5 23.3
Further education college 209 11.1 24.7
Maintained school 92 4.9 10.6
Non-maintained special school 68 3.6 25.2
Individual tuition 265 14.0 11.8
Youth Gatew ay 0 0.0 .
Work-related education 15 0.8 15.7
Training provider 38 2.0 22.0
Voluntary organisation 0 0.0 .
Bought in private sector provision 18 1.0 20.8
Independent school 270 14.3 25.0
Provision not maintained by, or is outside of, authority 17 0.9 22.6
Aw aiting provision or not currently in provision 28 1.5 .
Other 47 2.5 20.8
Total 1,887 100.0 21.0
Sources: EOTAS Pupil Census, Welsh Government
(a) The pupils w ho are enrolled at a PRU but have zero hours of provision recorded are excluded from this table.
"." data item is not applicable.
Key points
Pupils whose main education is other than at school:
43.5% - Percentage of pupil enrolments were at pupil referral units.
28 - Number of pupils not receiving educational provision during the census week.
In 2018/19 there were 820 enrolments at pupil referral units, which accounted for 43.5 per
cent of all EOTAS educational enrolments. Pupil referral units were used much more
frequently to educate EOTAS pupils than other provisions.
Independent Schools were the next most frequent educational provision, accounting for
14.3 per cent of EOTAS educational enrolments. Individual tuition accounted for 14 per
cent while further education made up 11.1 per cent of EOTAS provision
Although the EOTAS data collection refers to pupils educated other than at school, in some
circumstances EOTAS pupils are placed into a maintained school as part of their provision.
92 pupils received EOTAS education in a maintained school.
The average number of hours of education provided to pupils whose main education is
outside of school was 21.0 hours during the census week. Pupils enrolled at non-
maintained special schools received the highest average number of hours of provision
during the census week, with an average of 25.2 hours provided per pupil.

11
Chart 2: Number of pupil enrolments, by educational provision, 2018/19
15
17
18
28
38
47
68
92
209
265
270
820
0 200 400 600 800 1000
Work-related education
Provision not maintained by, or is outside of, authority
Bought in private sector provision
Awaiting provision or not currently in provision
Training provider
Other
Non-maintained special school
Maintained school
Further education college
Individual tuition
Independent school
Pupil referral unit
Number of pupil enrolments
Chart 3: Percentage of pupil enrolments, by educational provision, 2013/14 - 2018/19
Chart 3 shows how the percentages of pupil enrolments in EOTAS provision have changed since
2013/14.
Pupil referral units have been the most frequently-used EOTAS provision since 2013/14.
Their usage peaked in 2015/16. Pupil referral unit usage decreased slightly during 2018/19.
In 2018/19 the use of both individual tuition and independent schools as EOTAS provision
increased. Independent Schools were the second most used provision for EOTAS pupils
during 2018/19.
In 2018/19, the use of further education colleges increased whilst remaining the fourth most
used EOTAS provision. Training providers were the fifth most frequent provision, but the
number of enrolments at training providers dropped by 60 per cent from 2017/18.
0
5
10
15
20
25
30
35
40
45
50
2013/14 2014/15 2015/16 2016/17 2017/18 2018/19
Pe
rce
nta
ge
of
pu
pil
en
rolm
en
ts a
t E
OT
AS
p
rovis
ion
s
Pupil referral unit
Individual tuition
Independent school
Further education college
Training provider
12
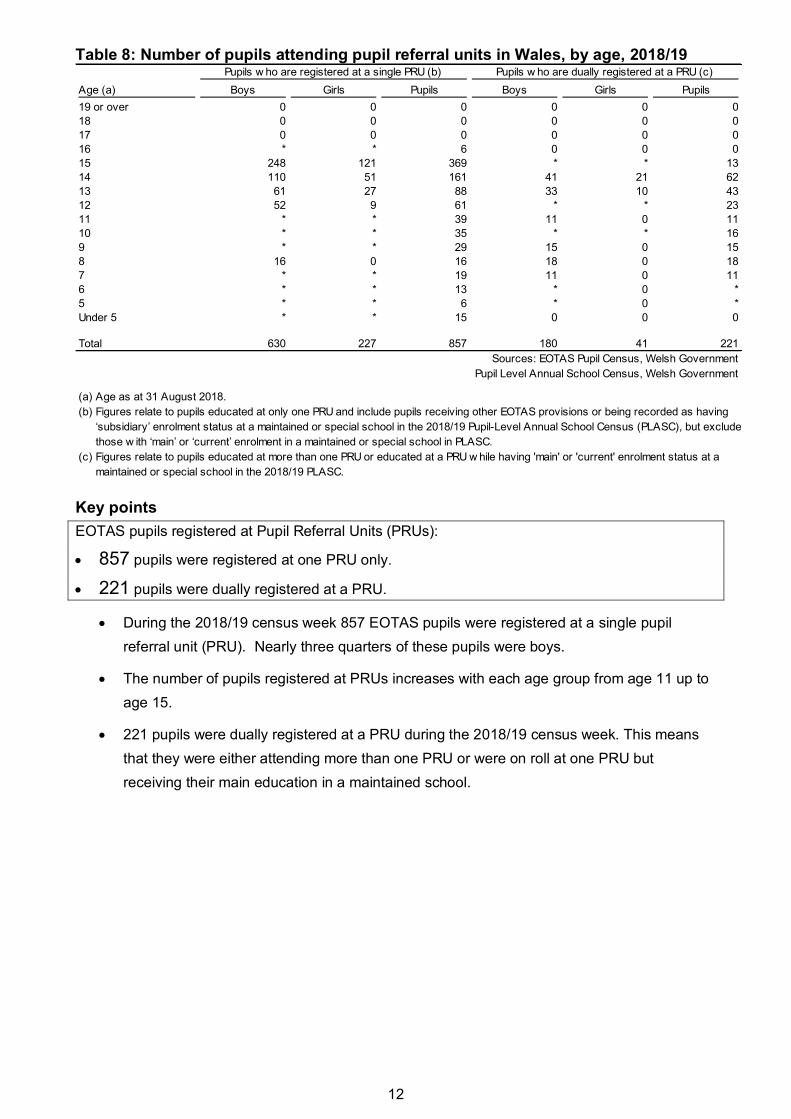
Table 8: Number of pupils attending pupil referral units in Wales, by age, 2018/19 Pupils w ho are registered at a single PRU (b) Pupils w ho are dually registered at a PRU (c)
Age (a) Boys Girls Pupils Boys Girls Pupils
19 or over 0 0 0 0 0 0
18 0 0 0 0 0 0
17 0 0 0 0 0 0
16 * * 6 0 0 0
15 248 121 369 * * 13
14 110 51 161 41 21 62
13 61 27 88 33 10 43
12 52 9 61 * * 23
11 * * 39 11 0 11
10 * * 35 * * 16
9 * * 29 15 0 15
8 16 0 16 18 0 18
7 * * 19 11 0 11
6 * * 13 * 0 *
5 * * 6 * 0 *
Under 5 * * 15 0 0 0
Total 630 227 857 180 41 221
Sources: EOTAS Pupil Census, Welsh Government
Pupil Level Annual School Census, Welsh Government
(a) Age as at 31 August 2018.
(b) Figures relate to pupils educated at only one PRU and include pupils receiving other EOTAS provisions or being recorded as having
(b) ‘subsidiary’ enrolment status at a maintained or special school in the 2018/19 Pupil-Level Annual School Census (PLASC), but exclude
(b) those w ith ‘main’ or ‘current’ enrolment in a maintained or special school in PLASC.
(c) Figures relate to pupils educated at more than one PRU or educated at a PRU w hile having 'main' or 'current' enrolment status at a
(c) maintained or special school in the 2018/19 PLASC.
Key points
EOTAS pupils registered at Pupil Referral Units (PRUs):
857 pupils were registered at one PRU only.
221 pupils were dually registered at a PRU.
During the 2018/19 census week 857 EOTAS pupils were registered at a single pupil
referral unit (PRU). Nearly three quarters of these pupils were boys.
The number of pupils registered at PRUs increases with each age group from age 11 up to
age 15.
221 pupils were dually registered at a PRU during the 2018/19 census week. This means
that they were either attending more than one PRU or were on roll at one PRU but
receiving their main education in a maintained school.

13
Table 9: Number of pupils attending pupil referral units in Wales, by local authority, 2018/19
Pupils w ho are registered at a single PRU (b) Pupils w ho are dually registered at a PRU (c)
Local Authority (a) Boys Girls Pupils Boys Girls Pupils
Isle of Anglesey * 0 * 0 0 0
Gw ynedd 0 0 0 0 0 0
Conw y 35 20 55 0 0 0
Denbighshire * * 11 50 6 56
Flintshire 76 27 103 5 0 5
Wrexham 36 22 58 * 0 *
Pow ys 17 5 22 * 0 *
Ceredigion * * 8 * * 12
Pembrokeshire 79 24 103 * * 8
Carmarthenshire 40 26 66 * * 6
Sw ansea 89 22 111 * * 12
Neath Port Talbot 0 0 0 0 0 0
Bridgend 7 17 24 * * 10
The Vale of Glamorgan 57 12 69 0 * *
Rhondda Cynon Taf 82 16 98 * * 10
Merthyr Tydfil * * 17 10 0 10
Caerphilly * * 13 * * 12
Blaenau Gw ent 0 0 0 0 0 0
Torfaen * 0 * * * 10
Monmouthshire 5 6 11 * * *
New port 43 10 53 38 9 47
Cardiff 21 11 32 8 8 16
Wales 630 227 857 180 41 221
Sources: EOTAS Pupil Census, Welsh Government
Pupil Level Annual School Census, Welsh Government
(a) Refers to the local authority in w hich pupils attended PRUs, not the local authority funding the provision.
(b) Figures relate to pupils educated at only one PRU and include pupils receiving other EOTAS provisions or being recorded as having
(b) ‘subsidiary’ enrolment status at a maintained or special school in the 2018/19 Pupil-Level Annual School Census (PLASC), but exclude
(b) those w ith ‘main’ or ‘current’ enrolment in a maintained or special school in PLASC.
(c) Figures relate to pupils educated at more than one PRU or educated at a PRU w hile having 'main' or 'current' enrolment status at a
(c) maintained or special school in the 2018/19 PLASC.
Swansea had the most pupils registered at only one pupil referral unit (111 pupils).
Gwynedd, Neath Port Talbot and Blaenau Gwent had no pupils on roll at a pupil referral
unit during the 2018/19 census week.
Denbighshire had the most dually registered pupils at a pupil referral unit (56 pupils).

14
Table 10: Number of pupils of compulsory school age educated at home, by local authority, 2013/14-2018/19 (a)
Number Rate (b)
2013/14 2014/15 2015/16 2016/17 2017/18 2018/19 2013/14 2014/15 2015/16 2016/17 2017/18 2018/19
Isle of Anglesey 23 21 23 36 37 12 3.1 2.8 3.0 4.7 4.7 1.5
Gw ynedd 69 55 64 53 45 65 5.0 4.0 4.6 3.8 3.2 4.6
Conw y 40 62 108 76 101 116 3.2 5.0 8.6 6.1 8.0 9.1
Denbighshire 58 55 47 51 65 80 4.7 4.4 3.8 4.0 5.1 6.2
Flintshire 39 46 59 71 63 94 2.1 2.5 3.1 3.8 3.3 4.9
Wrexham 20 30 47 72 68 85 1.3 1.9 3.0 4.5 4.2 5.2
Pow ys 120 112 122 133 131 156 8.0 7.6 8.4 9.1 9.0 10.7
Ceredigion 112 111 113 139 151 171 14.7 14.9 15.0 18.4 19.6 21.9
Pembrokeshire 92 106 123 132 195 182 6.5 7.6 8.9 9.5 13.8 12.8
Carmarthenshire 122 160 209 .. .. 284 5.7 7.4 9.6 .. .. 12.7
Sw ansea 81 104 128 153 157 137 2.9 3.7 4.5 5.4 5.4 4.7
Neath Port Talbot 34 58 91 117 147 177 2.0 3.5 5.4 6.9 8.5 10.1
Bridgend 43 67 74 88 103 128 2.5 3.9 4.2 4.9 5.8 7.0
The Vale of Glamorgan 30 35 32 33 45 68 1.8 2.1 1.9 1.9 2.6 3.8
Rhondda Cynon Taf 55 63 83 118 119 146 1.9 2.1 2.8 3.9 3.9 4.7
Merthyr Tydfil 13 17 20 31 42 43 1.8 2.4 2.8 4.3 5.8 5.8
Caerphilly 31 29 42 61 78 62 1.4 1.3 1.9 2.7 3.4 2.7
Blaenau Gw ent 19 14 15 30 51 71 2.4 1.8 2.0 4.0 6.7 9.2
Torfaen 32 36 50 51 67 70 2.7 3.0 4.2 4.2 5.5 5.7
Monmouthshire 24 27 31 49 52 60 2.6 2.9 3.3 5.2 5.5 6.4
New port 26 33 36 42 59 92 1.4 1.7 1.8 2.1 2.9 4.4
Cardiff 142 158 165 188 188 218 3.5 3.9 4.0 4.4 4.3 5.0
Wales 1,225 1,399 1,682 1,724 1,964 2,517 3.4 3.8 4.6 4.9 5.5 6.6
Sources: EOTAS Pupil Census, Welsh Government
(a) Data relate to pupils aged 5 to 15 on 31 August before the start of the academic year. Where local authorities do not know a pupil's
(a)age they w ere asked to provide an estimate.
(b) Rate per 1,000 pupils aged 5-15 on 31 August before the start of the academic year. The denominator includes pupils w hose main
(b) education is other than at school, pupils w ho had 'main' or 'current' enrolment status in the January PLASC and pupils w ho are
(b) know n to be electively home educated.
".." means that the data item is not available.
Key points
The number of children (pupils) whose parents have elected to educate them at home has been rising for the past 6 years.
2,517 pupils were electively home educated in 2018/19.
Ceredigion had the highest rate of elective home educated pupils in 2018/19.
In the 2018/19 academic year 2,517 children were known to be electively home educated in
Wales. This means that the parents of these pupils decided to educate their children at
home instead of sending them to school.
The rate of elective home educated pupils increased in 2018/19 to 6.6 out of 1,000, from
5.5 out of 1,000 in 2017/18. The rate increased in all local authorities with the exceptions of
Isle of Anglesey, Pembrokeshire, Swansea and Caerphilly.
In 2013/14, 3.4 out of 1,000 pupils were electively home educated. The rate has increased
each year since then.
Isle of Anglesey had the lowest rate of electively home educated children (1.5 per 1,000
pupils) while Ceredigion had the highest rate (21.9 per 1,000 pupils). Ceredigion has
consistently reported the highest rate of electively home educated children since 2013/14.

15
As parents notify their local authority that they are home educating their children on a
voluntary basis (unless they have withdrawn their child from school), these data may not
include all electively home educated children.
Notes
Context
Policy/operational
Local authorities are required to provide suitable education at school or otherwise than at school
for those children of compulsory school age who, by reason of illness, exclusion from school or
otherwise, may not for any period receive suitable education unless such arrangements are made
for them.
In practice, local authorities respond to that duty in widely varying ways, relating to their individual
circumstances, such as their geography, socio-economic situation and educational policies. In
September 2015 the Welsh Government established an Educated Other Than At School (EOTAS)
Task and Finish Group, chaired by former Estyn Chief Inspector Ann Keane. The EOTAS Task and
Finish Group developed the framework, with engagement from the sector, as a response to reports
by Estyn, the Children’s Commissioner for Wales and the University of Edinburgh.
The “Education otherwise than at school (EOTAS) Framework for Action” was last updated on 3
January 2018.
Key quality information
This section provides information about the quality of the statistics in this release in five areas:
Relevance, accuracy, timeliness and punctuality, accessibility and clarity, and comparability and
coherence.
National Statistics status
The United Kingdom Statistics Authority has designated these statistics as National Statistics, in
accordance with the Statistics and Registration Service Act 2007 and signifying compliance with
the Code of Practice for Statistics.
National Statistics status means that official statistics meet the highest standards of
trustworthiness, quality and public value.
All official statistics should comply with all aspects of the Code of Practice for Statistics. They are
awarded National Statistics status following an assessment by the UK Statistics Authority’s
regulatory arm. The Authority considers whether the statistics meet the highest standards of Code
compliance, including the value they add to public decisions and debate.
It is Welsh Government’s responsibility to maintain compliance with the standards expected of
National Statistics. If we become concerned about whether these statistics are still meeting the
appropriate standards, we will discuss any concerns with the Authority promptly. National Statistics

16
status can be removed at any point when the highest standards are not maintained, and reinstated
when standards are restored.
The continued designation of these statistics as National Statistics was confirmed in 2010 following
a compliance check by the Office for Statistics Regulation. These statistics last underwent a full
assessment against the Code of Practice in 2010.
Data source and coverage
The EOTAS Pupil Census is carried out annually and collects data on pupils educated other than
at school from local authorities electronically via a secure website. The collection is carried out by
the school statistics team in Knowledge and Analytical Services within the Welsh Government.
The information in this Statistical First Release relates to pupils receiving local authority-funded
education outside of the mainstream school environment during a census week each January and
the number of pupils of compulsory school age (aged 5 to 15 on 31 August before the start of the
academic year) known by local authorities to be electively home educated. For the 2018/19
academic year the census week was 14 to 18 January 2019.
In 2018/19, data were received on 2,286 pupils receiving education other than at school from all 22
local authorities in Wales. Of the 2,286 pupils receiving EOTAS provision, 502 were recorded in
the January 2019 Pupil-Level Annual School Census as having ‘main’ or ‘current’ enrolment status
in maintained primary, secondary or special schools and were therefore considered to be receiving
their main education in a maintained school. The remaining 1,784 pupils were considered to be
receiving their main education other than at school. The focus of this Statistical First Release is on
pupils mainly educated other than at school, but to give a complete picture it was necessary to
include all pupils receiving EOTAS provision in Table 1, Table 8 and Table 9.
Local authorities reported that in 2018/19, 2,626 pupils were known to be electively home
educated. Of these pupils, 109 were known to not be of compulsory school age so they were
excluded from the figures contained in this release, leaving a total of 2,517 pupils.
Data on electively home educated pupils is not mandatory for the local authority to provide. In
some years, there is not full coverage from all local authorities for this data (presented in table 10).
Known under-coverage includes:
In 2012/13 Caerphilly did not submit data for home educated pupils.
In 2016/17 and 2017/18 Carmarthenshire did not submit data for home educated pupils.
Users and uses
The statistics are used both within and outside the Welsh Government to monitor educational
trends and as a baseline for further analysis of the underlying data. Some of the key users are:
ministers and the Members Research Service in the National Assembly for Wales
other government departments
local authorities and schools
Estyn, Her Majesty’s Inspectorate of Education and Training in Wales
The Department for Education and Skills in the Welsh Government

17
other areas of the Welsh Government
the research community
students, academics and universities
individual citizens, private companies and the media.
These statistics are used in a variety of ways. Some examples of these are:
to advise Ministers
to inform the education policy decision-making process in Wales
to inform Estyn during inspections
to assist in research in educational attainment.
Accuracy
The Welsh Government works closely with local authorities in order to ensure all data are validated
before tables are published. Data are collated into an electronic return and submitted to the Welsh
Government through DEWi, a secure online data transfer system developed by the Welsh
Government. Various stages of automated validation and sense-checking are built into the
process to ensure a high quality of data.
Starting in 2011/12, following the collection of the data an additional validation period was carried
out in which local authorities were sent summary tables of their data and asked to check that they
were correct. While most of the data were confirmed to be correct, these checking periods
highlighted problems with several local authorities’ data which were resolved, further improving the
accuracy of the data.
Timeliness and punctuality
This release is published each year around the end of July. The local authorities are provided with
a period to upload data and respond to validation queries prior to the publication of results.
Accessibility and clarity
This Statistical First Release is pre-announced and then published on the Statistics section of the
Welsh Government’s website. It is accompanied by more detailed tables on StatsWales, a free-to-
use service that allows visitors to view, manipulate and download data.
Comparability and coherence
Tables and charts in this statistical first release contain data about different groups of EOTAS
pupils as defined in the ‘Definitions’ section below. Whether the tables and charts are referring to
EOTAS pupils whose main education is other than at school, whose main education is at a
maintained school or all EOTAS pupils is clearly indicated, so before comparing two tables or
charts please check that they are referring to the same group of EOTAS pupils.
Pupils by age (Table 3) and by SEN (Table 4) can be set in context by comparing to the general
school population. The relevant data can be found in the publication of final school census results
here: Schools’ census results
From 2017/18, StatsWales tables are published to accompany this statistical first release.

18
England publishes the number of pupils on roll at Pupil Referral Units and Alternative Provision in
the statistical release entitled ‘Schools, pupils and their characteristics: January 2019’. The latest
available statistics can be found here: School, pupils and their characteristics: January 2019
Related statistics for Northern Ireland can be found here: Education Outside of School
Definitions
Definitions of pupils educated other than at school
In the context of this statistical release:
a pupil being educated other than at school (EOTAS) was recorded as receiving or awaiting
education provision funded by the local authority otherwise than in a maintained school
setting during the census week of the EOTAS Pupil Census. A pupil may also be included
in this category if:
they attend an independent or non-maintained special school for which the local
authority is responsible for paying all or part of the tuition fees;
they are placed in a maintained school as part of their education funded by the local
authority.
the phrase EOTAS pupil is used to refer to a pupil educated other than at school as defined
above.
an EOTAS pupil whose main education is other than at school is a pupil being educated
other than at school who is either not on roll at a maintained school or is recorded as
having a ‘subsidiary’ enrolment status at a maintained school in the January Pupil-Level
Annual School Census.
an EOTAS pupil whose main education is in a maintained school is a pupil being educated
other than at school with a ‘main’ or ‘current’ enrolment status in the January Pupil-Level
Annual School Census.
pupils being electively home educated are children whose parents have decided to educate
at home rather than at school and are not classed as EOTAS pupils in this publication.
Although by definition they are educated other than at school, education for these pupils is
not funded by the local authority and there is no legal basis under which the local authority
can collect personal data about them. Data on electively home educated pupils are
restricted to headcounts by local authority and are provided voluntarily by the local
authority. Figures related to pupils electively home educated have been reported in
separate tables to those relating to EOTAS pupils.
Free school meal (FSM) eligibility
Children whose parents receive the following support payments are eligible to receive free school
meals in maintained schools in Wales:
Income Support

19
Income Based Jobseekers Allowance Support under Part VI of the Immigration and Asylum
Act 1999
Income-related Employment and Support Allowance
Child Tax Credit, provided they are not entitled to Working Tax Credit and their annual
income does not exceed £16,190
Guarantee element of State Pension Credit
Working Tax Credit ‘run-on’- the payment someone may receive for a further four weeks
after they stop qualifying for Working Tax Credit
Universal Credit.
Children who receive income related employment and support allowance, Universal Credit, Income
Support or Income Based Job Seekers Allowance in their own right are also eligible to receive Free
School Meals.
Pupils should only be recorded as eligible if they have applied for free school meals to the local
authority and (1) the relevant authority has confirmed their eligibility, or (2) final confirmation of
eligibility is still awaited but the school has seen documents that strongly indicate eligibility.
Special educational needs (SEN)
Pupils known to have special educational needs can be in one of the following categories:
School Action: When a class or subject teacher identifies that a pupil has special
educational needs they provide interventions that are additional to, or different from, those
provided as part of the school’s usual curriculum.
School Action Plus: When the class or subject teacher and the SEN Co-ordinator are
provided with advice or support from outside specialists, so that alternative interventions
additional to, or different from, those provided for the pupil through ‘School Action’ can be
put in place.
Statement: Pupils for whom the local authority maintains a statement of special
educational needs under Part IV of the Education Act 1996. A statement may be issued by
the local authority after assessment of a child’s needs.
Rounding and symbols
In tables where figures have been rounded to the nearest final digit, there may be an apparent
discrepancy between the sum of the constituent items and the total shown.
The following symbols have been used throughout this publication:
. data item is not applicable.
.. data item is not available.
* data item is disclosive.

20
Well-being of Future Generations Act (WFG)
The Well-being of Future Generations Act 2015 is about improving the social, economic,
environmental and cultural well-being of Wales. The Act puts in place seven well-being goals for
Wales. These are for a more equal, prosperous, resilient, healthier and globally responsible Wales,
with cohesive communities and a vibrant culture and thriving Welsh language. Under section
(10)(1) of the Act, the Welsh Ministers must (a) publish indicators (“national indicators”) that must
be applied for the purpose of measuring progress towards the achievement of the Well-being
goals, and (b) lay a copy of the national indicators before the National Assembly. The 46 national
indicators were laid in March 2016.
Information on the indicators, along with narratives for each of the well-being goals and associated
technical information is available in the Well-being of Wales report.
Further information on the Well-being of Future Generations (Wales) Act 2015.
The statistics included in this release could also provide supporting narrative to the national
indicators and be used by public services boards in relation to their local well-being assessments
and local well-being plans.
Further details
The document is available at:
https://gov.wales/pupils-educated-other-school-september-2018-august-2019
Accessing the data electronically
The data behind some of the charts and tables in this release can be found on StatsWales (a free-
to-use internet service that allows visitors to view, manipulate, create and download tables and
charts).
Further data relating to these tables or attendance data for individual schools is available on
request; please email [email protected].
Next update
July 2020 (provisional)
The next update will cover the 2019/20 academic year.
We want your feedback
We welcome any feedback on any aspect of these statistics which can be provided by email to
Open Government Licence
All content is available under the Open Government Licence v3.0, except where otherwise stated.