purification and characterization of enzymes from yeast
TRANSCRIPT

Xavier University of LouisianaXULA Digital Commons
Faculty Publications
7-2013
Purification and Characterization of Enzymes fromYeast: An Extended Undergraduate LaboratorySequence for Large ClassesKelly E. JohansonXavier University of Louisiana, [email protected]
Terry J. WattXavier University of Louisiana, [email protected]
Neil R. McIntyreXavier University of Louisiana
Marleesa ThompsonXavier University of Louisiana
Follow this and additional works at: https://digitalcommons.xula.edu/fac_pub
Part of the Biochemistry Commons, Scholarship of Teaching and Learning Commons, and theScience and Mathematics Education Commons
This Article is brought to you for free and open access by XULA Digital Commons. It has been accepted for inclusion in Faculty Publications by anauthorized administrator of XULA Digital Commons. For more information, please contact [email protected].
Recommended CitationJohanson KE, Watt TJ, McIntyre NR, Thompson M. Purification and characterization of enzymes from yeast: an extendedundergraduate laboratory sequence for large classes. Biochem Mol Biol Educ. 2013 Jul-Aug;41(4):251-61. doi: 10.1002/bmb.20704.

Xavier University of LouisianaXULA Digital Commons
Faculty Publications
7-2013
Purification and Characterization of Enzymes fromYeast: An Extended Undergraduate LaboratorySequence for Large ClassesKelly E. Johanson
Terry J. Watt
Neil R. McIntyre
Marleesa Thompson
Follow this and additional works at: https://digitalcommons.xula.edu/fac_pub
Part of the Biochemistry Commons, Scholarship of Teaching and Learning Commons, and theScience and Mathematics Education Commons

Laboratory Exercise
Kelly E. Johanson*
Terry J. Watt
Neil R. McIntyre
Marleesa Thompson
From the Department of Chemistry, Xavier University of Louisiana,1 Drexel. Dr, New Orleans, Louisiana 70125
Abstract
Providing a project-based experience in an undergraduate
biochemistry laboratory class can be complex with large
class sizes and limited resources. We have designed a 6-
week curriculum during which students purify and charac-
terize the enzymes invertase and phosphatase from bakers
yeast. Purification is performed in two stages via ethanol
precipitation and anion exchange chromatography, and
students perform both direct and coupled enzyme assays.
By completion of the experimental series, students are able
to identify which enzymes they have purified and have
obtained kinetic parameters for one. This experimental se-
ries requires minimal instructor preparation time, is cost
effective, and works with multiple sections of large groups
of students. Students participating in this sequence showed
increases in conceptual understanding of biochemical con-
cepts as measured through in-class assessments and anon-
ymous surveys. VC 2013 by The International Union of
Biochemistry and Molecular Biology, 41(4):251–261, 2013
Keywords: protein purification; project-based curriculum; enzyme
kinetics; protein identification
IntroductionA junior-level biochemistry laboratory course should ex-pose students to common biochemical techniques and illus-trate how the techniques might be applied in a researchlaboratory setting. The use of a project-based curriculumfulfills both of these goals. The traditional biochemistry lab-oratory course taught at Xavier University of Louisiana(XULA) prior to 2010 was comprised of independent experi-ments, each designed to teach a specific concept ratherthan expose students to common biochemical techniques.As we began to modify our curriculum to focus on relation-ships between techniques, we searched for an existing pro-ject-based curriculum that could be adapted to our needs.Purification and characterization of a protein seemed to bethe obvious choice, and several successful versions doappear in the literature [1–8]. However, these experimentswere difficult to incorporate into our curriculum as written,
because they required at minimum 4–6 hours of class timeper week and were designed for a class size of 16 studentsor fewer. Our introductory 1-credit biochemistry laboratorycourse meets once a week, has between 18 and 24students per section, and four to five sections are taughteach semester. Many of the students at XULA live andwork off-campus; therefore, the experiments must fit withinthe allotted class time. Our laboratory courses also do nothave additional times scheduled for lecture, and the univer-sity does not supply teaching assistants; laboratory prep isgenerally the responsibility of one faculty member whoreceives a modest amount of course release.
We felt that there was a need for a project-based cur-riculum that could be used with a larger group of students,but that could be completed in 2 hour and fifty minuteblocks, including the time necessary for pre-lab lecturesand quizzes. We then set out to create our own set ofexperiments with several goals in mind. 1) The projectshould be modular in nature so that certain experimentscan be removed if necessary due to unexpected class can-cellations (e.g. severe weather events) or so that differentmodules can be swapped out in future semesters. 2) Theprotein or proteins chosen for these experiments should berobust so that they can remain active through a severalweek cycle. 3) The experiments should require minimal in-structor preparation time and be cost efficient; they shouldalso require minimal volumes of reagents per student. 4)There should be several portions of the project that are
hS Additional Supporting Information may be found in the online versionof this article.*Address for correspondence to: Department of Chemistry, XavierUniversity of Louisiana, 1 Drexel. Dr, New Orleans, Louisiana 70125.E-mail: [email protected] 11 April 2013; Accepted 15 April 2013DOI 10.1002/bmb.20704Published online in Wiley Online Library(wileyonlinelibrary.com)
Purification and Characterization of Enzymes
from Yeast: An Extended Undergraduate
Laboratory Sequence for Large ClasseshS
Biochemistry and Molecular Biology Education 251

student-driven or require students to think critically aboutthe next stage of their experiment.
We began with a modification of the invertase purifica-tion by Timerman et al., 2009 [7], and the result was a 6-week project in which the students simultaneously purifiedand characterized invertase and alkaline phosphatase fromS. cerevisiae. Purification of invertase, alkaline, or acidphosphatase has been the basis for student laboratoryexercises since the 1970s [9, 10]. However, the experimentsdescribed here are the first example of a combined purifi-cation strategy resulting in the isolation of two of theseenzymes and the first designed to work with the class sizeand schedule we have at XULA.
The original purification of invertase described as astudent experiment was a one-step procedure [9], laterexpanded to three steps to increase purity [7]. Our methodincludes only two steps and reduces the amount of startingmaterial required for each student or student group bymore than 20-fold. These modifications allow this project towork with a larger number of students and reduce the timeneeded to complete each purification step without a dra-matic decrease in the purity of the final enzymepreparation.
Alkaline phosphatase is also a common enzyme used instudent biochemistry laboratory exercises. The starting ma-terial for purification is usually E. coli grown in low phos-phate media [10] or transformed with a plasmid expressingthe protein [11], although a lyophilized mutant rich in alka-line phosphatase can be purchased and hydrated for stu-dent use [12]. Purification of alkaline phosphatase fromyeast is described in the literature [13–15]; however, noneof these experiments were written or designed for labora-tory classes. Our procedures can be most directly comparedto those starting from lyopholyzed E. coli [12], but again thepurification described here has the advantage of requiringfewer purification steps, less class time, and less overallmaterial and reagents per student.
The purification strategy is designed to specifically iso-late the extracellular form of invertase (Suc2p) and thenonvacuolar form of alkaline phosphatase (Pho13p) fromyeast. Yeast can contain up to seven sucrose fermentation(SUC) genes that code for invertase; however, all loci codefor nearly identical forms of the protein [16–18] with SUC2being the most commonly identified and therefore the moststudied of the SUC genes [17]. Suc2p is expressed as bothan intracellular and extracellular protein due to differentialtranscriptional start sites [19, 20]. The two forms can bedistinguished by differences in molecular weight and thepresence of glycosylation [20–22]. Yeast also have severalgenes that encode nonspecific acid or alkaline phosphomo-noesterases, as well as several other related genes involvedin phosphate metabolism (PHO) [14, 15, 23–26]. Two genes,PHO8 and PHO13, encode alkaline phosphatases [25, 26]that differ both in molecular weight and cellular location[14, 15, 27].
Invertase and alkaline phosphatase are both robustenzymes that can withstand repeated rounds of freeze/thaw and do not lose appreciable activity over the 6-weekperiod. The dual purification of these enzymes has severalbenefits: (i) it allows for a discussion of the differences inreactivity among enzymes from the same class (i.e. hydro-lase); (ii) it allows students to be exposed to both direct andcoupled enzyme assays; and (iii) it mimics a real-world lab-oratory experience. The difference in the optimal pH andsubstrate specificity of the two enzymes allows the activityof each enzyme to be detected independently in the samesample, which helps students track their progress as theenzymes are first separated from cellular components andthen from each other.
The project was presented to the students as an ex-ploration. They were told that they would be purifying in-vertase and phosphatase from yeast, but they would haveto determine which forms of the enzyme had been iso-lated (see Supporting Information). Any repetition of pro-cedures over multiple weeks (i.e. enzyme assays) wasdone with the expectation that students would use theirlab notebooks to write their own protocol for each subse-quent lab. At the end of the series, the students wereasked to write up their results as a manuscript followingthe guidelines for submission to Biochemistry. Here, wepresent an overview of the results obtained by 89 studentsin five sections completing this course in the fall semesterof 2012. Student data shows that this experimental serieswas successful even with a large number of students. Wealso present survey data confirming that use of this pro-ject-based curriculum increased student comprehension ofkey biochemical concepts and understanding of skillsrequired for biochemistry research.
Experimental ProceduresEquipmentYeast Extract Preparation— The initial preparation ofextract requires a temperature-controlled incubator (NewBrunswick). Centrifugation was performed at 7,500 rpm ina refrigerated table-top centrifuge (Sorvall ST-16R); ifequipment is available, the centrifugation speed can beincreased to 10,000 rpm and the time shortenedaccordingly.
Ethanol Fractionation— Any standard refrigerated micro-centrifuge is required for the ethanol precipitation,although a room temperature microcentrifuge can be usedfor the initial clarification of yeast extract.
Protein Activity Assays— All absorbance readings at 400and 540 nm were performed using Bio-Tek HT plate read-ers. A Bio-Tek H1m was used in conjunction with a Take3plate to read A280, although any low-volume spectroscopic
Biochemistry andMolecular Biology Education
252 Purification and Characterization of Enzymes from Yeast

system could substitute. A heat block capable of reaching90 �C is also required for these assays.
Equipment for SDS-PAGE— A mini vertical electrophore-sis system and the appropriate power supply is required.
Course Schedule and Experimental ProceduresWeek 1: Ethanol fractionation of S. cerevisiae. Each groupof two students is provided with S. cerevisiae cell extractprepared by the instructor using a modification of themethod of Timerman et al [7]. Briefly, 35 g of dried yeast(Sigma YSC2) is suspended in 100 mL 0.100 M sodium bi-carbonate solution. The suspension is capped and incu-bated at 35 �C overnight. The suspension is then centri-fuged at 7,500 rpm for 30 min at 4 �C. The supernatant isremoved and stored as aliquots of 1.5 mL for each group.This quantity of yeast was sufficient for 40 student groupswith some remaining for the instructors to perform theexperiment along with the students or to have additionalextract in case of student errors. The yeast extract can bestored at 4 or 0 �C short term (1–2 weeks) and 220 �C forlonger storage (up to 6 months). Each group is given a 1.5mL aliquot of extract at the start of week 1.
The yeast extract is clarified by centrifugation for 2min at 7,500 rpm. Ice-cold ethanol is added to the clarifiedyeast extract to produce a 29% solution in a volume under2 mL, the sample is mixed by inversion, placed on ice for 5min, then centrifuged at 10,000 rpm for 10 min at 4 �C.The supernatant is transferred to a new tube for the sec-ond precipitation. Ice-cold ethanol is mixed with the super-natant from the 29% solution to yield a solution that is 40%ethanol in a volume of less than 1 mL. The incubation andcentrifugation steps are repeated. Both pellets are resus-pended in 600 mL 5.0 mM Tris-Cl pH 7.4. The five samplesproduced are stored at 220 �C until the following week.
Week 2: Specific Activity I—In this lab period, studentstest their samples from ethanol fractionation for both in-vertase and phosphatase activity as well as determine pro-tein content by A280.
Invertase— Sucrose hydrolysis is measured by detectingthe amount of 3-amino-5-nitrosalicylate present in the reac-tion, which results from the reduction of 3,5-dinitrosalicylate(DNS) by free glucose [7, 9]. For each ethanol fractionationsample, 10 mL of sample is incubated with 100 mL freshlydiluted 20.0 mM sucrose for 5 min at room temperature.Next, 400 mL alkaline DNS is added to each sample, which isthen heated at 90 �C for 5 min before the addition of 400 mL50.0 mM acetate pH 4.8. An equal volume (200 mL) of solu-tion is added into three wells of a 96-well plate and the ab-sorbance read at 540 nm. A positive control of 100 mL of amixture containing 20.0 mM each glucose and fructose(“hydrolyzed sucrose”) and a negative control (sucrose andacetate buffer only) are treated in a similar manner.
Phosphatase— Enzyme activity is determined accordingto the amount of para-nitrophenol (PNP) produced from
the hydrolysis of para-nitrophenol phosphate (PNPP). Thereactions are assembled in a 96-well plate with each wellcontaining 190 mL of 1 mM PNPP in 0.010 M Tris pH 9.0.10 mL of each sample is added to a set of three wells andthe absorbance detected after 5 min at 400 nm. A positivecontrol of 0.100 mM PNP 0.010 M Tris pH 9.0 and a nega-tive control of PNPP in buffer only are also assembled onthe plate.
A280— 2 mL of each sample is placed in the Take3 plate induplicate and the A280 measured. The absorbance of 5.0mM Tris-Cl pH 7.4 is determined to correct for background.
Data Analysis— The absorbance values of the reactionproduct detected at 400 and 540 nm are converted into theamount of product produced per unit time to give a valuefor the activity of each enzyme. First, the three absorbancevalues obtained from each set of samples are averagedand the average absorbance value of the negative controlis subtracted from all to correct for background. Next, themolar absorptivities (e) of the reaction products, 3-amino-5-nitrosalicylate and PNP respectively, are calculatedusing Beers Law (A 5 ecl) with A 5 the corrected absorb-ance of the positive control sample; c 5 the final concentra-tion of either PNP or hydrolyzed sucrose in the positivecontrol sample; l 5 a standard path length (in cm) calcu-lated by students in an earlier experiment. The activity ofthe enzymes in each sample is then determined using theequation:
[Corrected Abs 3 volume of 1 well (L)]/[e (M21cm21) 3
path length(cm) 3 time (min)] 5 mol/minThe specific activity of each enzyme is determined by
first calculating the mass of protein (mg) in each reaction isby multiplying the A280 value by 0.010 mL (the volume ofsample tested in each reaction) under the assumption thata solution with A280 5 1 has a protein concentration of 1mg/mL. The activity value calculated for each sample isthen divided by the mg of protein in that sample to give aspecific activity value (mol/min/mg), which is then adjustedto mmol/min/mg or nmol/min/mg where appropriate.
Weeks 3–4. Anion exchange chromatography and Spe-cific Activity II—The next stage of purification is designedto separate invertase and phosphatase from each otherusing anion exchange chromatography. The weak anionexchange resin, DEAE cellulose (Sigma D6418), is preparedby the instructor according to the product instructions andequilibrated in 5.0 mM Tris-Cl pH 7.4/5.0 mM MgCl2. DEAESepharose (Sigma DFF100) can be used as well, althoughthe cellulose resin is significantly cheaper. Students pourtheir own columns using small, disposable plastic columns(Fisher) and 2.0 mL of DEAE-cellulose in 5.0 mM Tris-ClpH 7.4/5.0 mM MgCl2. The column is equilibrated with 4mL of 5.0 mM Tris-Cl pH 7.4/5 mM MgCl2. The proteinsample selected at the end of Week 2 is diluted to 1 mLwith 5.0 mM Tris-Cl pH 7.4/5.0 mM MgCl2 and then loadedto the column by gravity flow. The elutant is collected in
Johanson et al. 253

500 mL fractions until the buffer is 1 cm above the resin.2.5 mL of 5.0 mM Tris-Cl pH 7.4/5.0 mM MgCl2/100 mMNaCl is then applied to the column and 400 mL fractionsare collected until the buffer is again 1 cm above the resin.The process is repeated with 2.5 mL of 5.0 mM Tris-Cl pH7.4/5.0 mM MgCl2/300 mM NaCl. The resin is then resus-pended in 2.5 mL of 5.0 mM Tris-Cl pH 7.4/5.0 mM MgCl2/500 mM NaCl and transferred to a container for regenera-tion by the instructor. In most cases, the disposable plasticcolumns can be reused for several student groups, and theDEAE resin can be regenerated for use again the followingsemester. The fractions generated from chromatographyare stored at 220 �C until the next week, at which time theenzyme assays and specific activity calculations are per-formed in the same manner as week 2.
Week 5. SDS-PAGE analysis—10% SDS-PAGE gels areprepared in advance by the instructor using a 10% acryl-amide/buffer premix solution (Fisher EZ gel BP7710)poured as a continuous gel, which reduces instructor preptime without substantially increasing cost compared to tra-ditional SDS-PAGE with stacking gel. The instructor alsoprepares Broad Range Marker (Bio Rad 161–0317) mixedwith 23 Laemmli Sample Buffer and b-mercaptoethanol(prepared according to product instructions) and clarifiedyeast extract mixed 1:1 with 23 Laemmli Sample Bufferand b-mercaptoethanol. Both solutions are heated at 90 �Cfor 5 min then stored at 220 �C until needed. Students mixtheir protein samples 1:1 with prepared 23 Laemmli Sam-ple Buffer and b-mercaptoethanol in a final volume of 30–40 mL, heat at 90 �C for 5 min, then electrophorese thesamples at 110 V until the dye front runs off the gel (about1.5 h). Gels are rinsed five times with distilled water(dH2O), stained overnight in 10 mL Gelcode Blue, anddestained with dH2O for 2–4 h. Gels were photographedusing a Gel Logic 220 PRO system (Carestream) and theimages supplied to students as JPEG files.
We use the electrophoresis time for a dry lab to teachdata analysis techniques for the kinetic experiments inweek 6. Students are given a set of data similar to whatthey should obtain in week 6 and, with assistance from theinstructor, are able to practice plotting the relationshipgraphically between absorbance versus concentration. Stu-dents are able to generate a linear trend line from thisgraphical relationship with the slope of the line equal tothe velocity of the reaction (change in product absorbanceover time). Using Beer’s law and the volume of the reac-tion, the absorbance value can be converted into anamount of product (mol) product produced per time. Thepurpose for this dry lab is to familiarize students with theanalysis of large data sets generated from the kineticexperiment. Without this dry lab many students becomeoverwhelmed because they do not understand how to rear-range the data and generate the appropriate graphs.
Week 6. Kinetics of Phosphatase—Students first deter-mine the optimum pH for the activity of their purified
phosphatase using a stopped assay, which is a modificationof the assay used to determine specific activity. 10 mM buf-fers are prepared in advance by the instructor that rangein pH from 5 to 10. PNPP is diluted in each buffer to a finalconcentration of 1 mM. Each reaction is prepared in tripli-cate. As previously described in week 2, 180 mL of thePNPP/buffer mixture is added into a 96-well plate prior tothe addition of 10 mL enzyme. For each pH, a set of threereactions is also assembled without enzyme to serve as anegative control. The reaction is allowed to incubate atroom temperature for 5 min, then 10 mL 3 M NaOH isadded to both stop the reaction and raise the pH of theacidic solutions to allow for the detection of PNP. To allowfor adequate time to complete the kinetic experiments, stu-dents identify the pH optimum based on A400. Their selec-tion is later verified through calculation of the activity ateach pH. Using the pH optimum, six solutions are madewith PNPP concentrations from 0 to 1.0 mM. In order todetermine the initial velocity of the enzyme reaction, stu-dents add enzyme to the plate immediately before thedetection program is initiated. Absorbance readings aretaken immediately after the addition of enzyme (time 5 0)and then every 30 s for 3 min. Enzyme velocity is calcu-lated using the activity calculation described in week 2.The substrate concentrations and velocity are used todetermine the steady-state parameters KM and Vmax of theenzyme using either linear (double-reciprocal) or nonlinearmethods.
Results and DiscussionTable I shows the schedule of experiments. During the first2 weeks, students prepare the initial sample for purificationby using ethanol to isolate the periplasmic fraction, and thepresence of both enzymes in this fraction is then confirmedby a measurement of specific activity. In the next 3 weeks,the enzymes are further purified using anion-exchangechromatography, located by determining the specific activ-ity in each fraction and visualized through SDS-PAGE. Inthe final week, students continue to characterize their
Schedule of experiments
Week Experiment
1 Ethanol fractionation of yeast extract
2 Specific activity I
3 Anion exchange chromatography
4 Specific activity II
5 SDS-PAGE
6 Kinetics of phosphatase
TABLE I
254 Purification and Characterization of Enzymes from Yeast
Biochemistry andMolecular Biology Education

purified phosphatase. At the end of the semester, the rawdata from three representative groups were used to gener-ate the results for the specific activity, SDS-PAGE, andenzyme velocity experiments shown below.
The first week of this series is designed to be a shortexperiment to allow for time to discuss the overall projectgoals and expectations. Students are provided with a hand-out (Supporting Information) with background on the twoenzymes and an explanation of the assays that will be usedto test for activity. The experimental procedure in the firstweek is not difficult; the most common error is due to amiscalculation in the amount of ethanol required to bringthe solution from 29 to 40%. Some guidance about this cal-culation is given in the protocols provided to students (seeSupporting Information), but students are expected to workout the math without significant assistance from the in-structor. As the experiment itself is short, there is plenty oftime for students to work these calculations in class.
In the second week, students determine the specificactivity of both enzymes in the five samples from ethanolfractionation. There should be measurable activity innearly all samples, which allows for a discussion of the dif-ference between activity and specific activity. Observing theactivity alone would lead students to conclude that the orig-inal extract has the highest concentration of both enzymes.
The absorbance of the positive control is used to calcu-late the molar absorptivity for each reaction product usingBeers law. For 3-amino-5-nitrosalicylate, e values rangedbetween 1,400 and 2,000 M21cm21; for PNP, the rangewas 17,000–21,000 M21cm21, in agreement with literaturevalues [7, 28]. The path length of the 96-well plate wasdetermined by students in an experiment earlier in the se-mester and this value was used for all specific activity cal-culations. The molar absorptivity values were then used toconvert product absorbance into units of activity and theA280 values used to estimate the amount of protein in eachsample. Protein quantitation could also be done using astandard colormetric assay; A280 has the advantage ofusing very little sample (provided a spectrophotometer ca-pable of reading microliter volumes is available) andrequiring no sample preparation.
Students are expected to identify the second resuspendedpellet (sample 4) from ethanol fractionation as having thehighest specific activity for both enzymes. Figure 1 showsrepresentative specific activity data from the three studentgroups. As seen in Fig. 1a, the normalized specific activity forinvertase is clearly highest in the second resuspended pellet(sample 4). Figure 1b shows a similar result for phosphatase.Although there is variation in the value of the specific activitycalculated, normalizing each group’s values to their highestspecific activity clearly reveals the trend and students areeasily able to identify the correct sample for further purifica-tion (note that normalization is only necessary when compar-ing between groups; because individual groups see only their
own data, simply identifying the highest value is sufficient).Even with variation in the activity values, 82% of studentsidentified the correct sample (4) as having the highest specificactivity for both enzymes. The remaining 18% either identi-fied an additional sample as having a specific activity equalto that of sample 4 or identified the highest specific activity ofinvertase and phosphatase in separate samples. Groups thatdid not identify the correct sample were advised to eitherpool samples or retest their samples before proceeding withthe next stage of purification. Common errors during the
Specific activity of invertase and phosphatase in
representative student samples after ethanol frac-
tionation. Student samples were incubated with
the appropriate substrate for 5 min and the prod-
uct absorbance detected at 540 nm (invertase, A)
and 400 nm (phosophatase, B) in triplicate. Spe-
cific activity was calculated using a molar absorp-
tivity of 1435 M21cm21 for 3-amino5-
nitrosalicylate (a) and 17,000 M21cm21 for para-
nitrophenol (b) with a path length of 0.80 cm.
Values shown are the average of three independ-
ent student experiments after normalization. Val-
ues are normalized to the highest specific activity
observed by each group to more clearly illustrate
the consistency of the trend seen by each group.
Actual specific activity values varied approxi-
mately twofold between the groups with the
highest and lowest values.
FIG 1
Johanson et al. 255

enzyme assays included switching the positive and negativecontrol and using the wrong pH buffer. Errors such as theseare generally identifiable by the presence of similar absorb-ance values in all samples. Instructors monitored students asthey collected data, and several students were advised torepeat their experiments based on these errors.
After identifying the sample with the highest specificactivity for both enzymes, the purification is continued inweek 3 using anion exchange chromatography to separatethe two enzymes from each other, and then identificationof the fractions containing each enzyme using specific ac-tivity measurements in week 4. After loading their sampleon the column, invertase is eluted with the addition of 100mM NaCl and phosphatase follows with the addition of 300mM NaCl; each group is expected to collect 14–16 fractions.The small-scale nature of the column allows students to ex-perience pouring their own columns and collecting numer-ous fractions while still leaving time for a quiz at the begin-ning of the lab period and a short pre-lab lecture. Duringthe pre-lab lecture, students are advised that they will berequired to write their own protocol to measure the specific
activity of both enzymes in each fraction during the nextlab period.
It is expected that the invertase will elute in fractions3–6, and 69% of students identified a fraction in this rangeas having the highest specific activity for invertase as seenin the sample student data collected from the three groups(Fig. 2a). A small number of students (15%) identified in-vertase as eluting before the addition of NaCl and the re-mainder (16%) detected a high specific activity for invertasein one of the later fractions after the addition of 300 mMNaCl. Those detecting invertase in the later fractions mayhave either made an error during chromatography or mis-labeled their samples while performing assays. It is alsopossible that more than one form of invertase is containedin the original sample (e.g. Fig. 2a group 1 is suggestive oftwo invertase elutions); however, there was not enough stu-dent data available to test this hypothesis.
Phosphatase is expected to elute in fractions 9–12, and80% of students identified a fraction in this range as havingthe highest specific activity for phosphatase as seen in thestudent sample data (Fig. 2b, groups 1 and 2). The
Specific activity of invertase and phosphatase in representative student samples after anion exchange chromatography.
Student samples were incubated with the appropriate substrate for 5 min and the product absorbance detected at 540
nm (invertase, A) and 400 nm (phosophatase, B) in triplicate. Specific activity was calculated using a molar absorptivity
of 1435 M21cm21 for 3-amino5-nitrosalicylate (a) and 17,000 M21cm21 for para-nitrophenol (b) with a path length of
0.80 cm. Values are normalized to the fraction with the highest specific activity for each enzyme for each group to
emphasize the trend in specific activity.
FIG 2
256 Purification and Characterization of Enzymes from Yeast
Biochemistry andMolecular Biology Education

remaining 20% identified phosphatase in one of the lasttwo fractions (Fig. 2b, group 3).
Writing the protocol for this measurement of specificactivity emphasized the importance of keeping a good lab-oratory notebook and understanding how the assays work.Although students had some initial difficulty in modifyingthe initial protocol (from week 2) for a larger number ofsamples, the majority were able to successfully completethe lab with little to no input from the instructor. Themost common error in the student protocols was failing toscale up the amount of substrate for the required numberof reactions. Students realized this error while they werepreparing reagents and it did not have a significant impacton their ability to complete the lab or on their finalresults. A few students still struggled with differentiatingbetween the positive and negative control solutions.
In week 5, the two fractions with the highest specificactivity for invertase and phosphatase respectively werefurther examined using SDS-PAGE. The instructor loaded asample of clarified yeast extract and a molecular weightmarker (Figs. 3a and 3b, lanes 1 and 2), and students wereasked to load three samples: a sample reserved prior toanion exchange chromatography and their two chromatog-raphy fractions with highest specific activity. Limiting stu-dents to three to four samples reduces the number of gelsthat must be poured and run for each section, which mini-mizes instructor prep time and requires the use of onlythree vertical electrophoresis systems per class. Determin-ing the specific activity prior to SDS-PAGE gives studentsthe experience of using their data to choose which samplesshould be further examined, although the order of the SDS-PAGE and specific activity experiments could be reversedso as to only perform activity measurements on samplessuspected of containing the correct protein.
As seen in the representative student sample gels (Figs.3a and 3b) containing samples from the student groupsdescribed above, the extracellular form of invertase isobserved at the expected molecular weight of 125 kDa [7] inthe sample before chromatography (Fig. 3a, lanes 3 and 7;Fig. 3b, lane 3) and in fraction 4 (Fig. 3a, lanes 4 and 9; Fig.3b, lane 4). 74% of student samples contained this same formof invertase visible on the SDS-PAGE gel. Of the remainingstudents, 21% observed the invertase band in the pre-chro-matography sample but not in the fraction identified as havingthe highest specific activity after purification and 4% did notobserve any bands in their SDS-PAGE samples.
Phosphatase was more difficult to observe by SDS-PAGE with only 63% of students having a visible �60 kDaband expected from the isolation of Pho13p [15] present inthe fraction collected during chromatography. As seen inFig. 3a, this band was observed in the pre-chromatographysample (lanes 3 and 7), and a very faint smudge can beseen at this same location in the phosphatase fraction(lanes 5 and 8). A faint band is observed in the pre-chro-matography sample shown in Fig. 3b (lane 3) but no visibleband is observed near 60 kDa in the phosphatase fraction(lane 5).
With these results, students are able to conclude thatthey have purified the extracellular form of Suc2p based onthe molecular weight and presence of glycosylation, whichgives the protein band a diffuse appearance [7]. However,they were not able to conclusively identify the form of phos-phatase present. Several students had inferred by this pointin the lab that the phosphatase was alkaline due to the pHof the buffer used for the phosphatase assays in weeks 2and 4. In week 6, students confirmed that the phosphatasewas alkaline by testing the activity of their purified enzymein a range of buffers (pH 5–10). They then chose the
SDS-PAGE analysis of student samples. Gels shown are from three independent student groups. Group 1 and 2 data is
shown on (a); Group 3 data on (b). All gels contain BioRad broad Range marker (STD) with the band sizes indicated on
the sides of the gels. Clarified yeast extract (CYE) was prepared and loaded by the instructor. Each group loaded a sam-
ple collected prior to chromatography (PC), the sample with the highest invertase (Groups 1 and 2, F4; Group 3, F3) and
phosphatase (Groups 1 and 2, F11; Group 3, F14) specific activity. A band representative of extracellular invertase is
indicated by the top arrows in (a) and (b). A band representative of alkaline phosphatase is indicated by the lower arrow
on (a). All samples were electrophoresed on a 10% SDS-PAGE gel for 1.5 h at 110 V, stained in Gelcode Blue, and the
image captured using the Gel Logic camera.
FIG 3
Johanson et al. 257

optimal buffer and determined the initial velocity at severalconcentrations of PNPP to calculate the KM and Vmax oftheir enzyme. Altering the pH conditions also allowed for amodification of the phosphatase assay to include the addi-tion of 3 M NaOH both to stop the reaction and raise thepH to a constant value above the pKa of PNP so the reactionproduct could be detected at 400 nm.
Figure 4a shows sample student data collected fromthe three representative groups confirming that the purifiedphosphatase is most active at a pH near 9. 81% of studentsidentified this as the optimal pH for their enzyme, 2% iden-tified a pH above 9 as optimal, and the remaining 18% hadno detectable activity in their phosphatase preparations. Itis possible that the students with no enzyme activity intheir samples identified and saved the wrong fraction inweek 4. It is also possible that some of the samples withrelatively low enzyme concentration from the beginning
may have degraded at this point as the samples were 5weeks old and had been subjected to several rounds offreeze/thaw.
After identifying the optimal pH for activity, the activityof the enzyme at various concentrations of PNP was deter-mined to characterize the steady-state kinetics of thisenzyme. Figure 4b shows the double reciprocal plotobtained from the three sets of student data. Again, whilethere is variation in the actual kinetic values obtained, stu-dents are clearly able to observe a change in the velocity oftheir enzymes over time and with increasing substrate con-centrations. All students that observed measurable enzymeactivity when determining the optimal pH were also able tocollect enough kinetic data to calculate both a KM and Vmax
for their enzymes. Student values of KM were in the rangeof 102321024 M, which is higher than the literature valueof 3.6 3 1025 M for Pho13p [15]; however, this is not
Kinetics of alkaline phosphatase. (a) Student purified Pho13p was incubated with 10.0 mM PNPP in 10.0 mM buffers: ac-
etate pH 5 4.99, citrate pH 6.16, phosphate pH 7.26, tris pH 7.95, glycine pH 8.91, and glycine pH 9.91. After 5 min, 3 M
NaOH was added to stop the reaction and the absorbance read at 400 nm in triplicate. Enzyme activity was calculated
using a molar absorptivity of 17,000 M21cm21 for para-nitrophenol with a path length of 0.80 cm. Values shown are the
average of three independent student experiments. (b) Student-purified Pho13p was incubated with PNPP (0–1 mM) in
10.0 mM glycine pH 8.91. Absorbance readings in triplicate were collected at 400 nm every 30 s for 3 min. Velocity was
calculated using a molar absorptivity of 17,000 M21cm21 for para-nitrophenol with a path length of 0.80 cm. The double
reciprocal plot was obtained by graphing 1/initial velocity versus 1/[PNPP]. Each line represents the results from an in-
dependent student group.
FIG 4
258 Purification and Characterization of Enzymes from Yeast
Biochemistry andMolecular Biology Education

unexpected given the limited sample number and the assayconditions (e.g. room temperature vs. 37 �C, variable puri-ties, and several freeze-thaw cycles).
An anonymous survey was used to collect student opin-ions about the experimental series and was completed by88% of the students. The linked series of experiments wasnot overwhelmingly popular, as 54% of students of studentsresponded “strongly agree” or “agree” to the statement “Iwould have preferred a diverse set of individual lab experi-ments that did not span multiple weeks.” 22% disagreedwith this statement and the remaining 24% were “neutral.”There are a number of reasons students might prefer a tra-ditional laboratory sequence of isolated experiments; in thiscase the low popularity of the linked series is probably dueto a perception of increased workload due to the cumulativenature of the experiments. Students must complete assign-ments in a timely fashion and be proactive about seekinghelp when an assignment or procedure is confusing, or theirperformance in subsequent labs suffers. Some studentssimultaneously express a desire for fewer assignments andappreciation for the regular feedback possible with frequentassignments, indicating that students do not have a simpleopinion on this matter. As this is the first project-based labthat many of our students have encountered, there is alearning curve as they become adjusted to the expectationsfor their performance. Moreover, the survey was conducted
Student survey results
How would you describe the gain you made in: No gain Little gain Moderate gain Good gain Great gain
General technical lab skils 3 10 19 29 17
Understanding of protein
purification methods
4 11 18 30 15
Understanding of the logical
flow of steps in purifying and
characterizing a molecule
4 14 22 27 11
Understanding of assays for
measuring enzyme activity
2 11 18 28 19
Understanding of enzyme
kinetics and inhibition
6 14 21 25 12
Understanding of how to
communicate the results of
scientific experiments
3 9 17 32 17
Numerical problem-solving skills 3 10 22 31 12
Conceptual problem-solving skills 6 9 25 30 8
Ability to develop a logical,
effective lab procedure
3 13 23 29 10
Ability to interpret experimental results 4 7 24 29 14
Ability to use a critical approach
when analyzing data and
arguments in daily life
6 15 23 30 4
Student assessment results
Question Pre-test (%) Post-test (%)
Calculation of molar
absorptivity of control
26 93
Meaningful presentation
of data in a figure
55 89
Determination of protein
amount from A280
4 85
Relationship between
specific activity and
enzyme purity
1 71
All differences significant at p<0.001 by paired t-test.
TABLE II
TABLE III
Johanson et al. 259

at the end of the series, while the students were completingtheir final manuscript, and so they may have been express-ing end-of-semester stress as much as evaluating the seriesof experiments.
Although students did not report a significant apprecia-tion for the series, the majority of students did report amoderate to great gain in their understanding of a numberof conceptual details as well as technical lab skills (TableII), indicating that the experimental series did have thedesired effect on student learning. Student comments alsosupported the value of the project: “I was able to learnmany aspects of biochemistry that I was unfamiliar withand my problem-solving skills greatly improved because ofhow challenging this lab was. This lab required you to beengaged in the experimental aspect of biochemistry whichcaused me to be more intrigued by the subject.” Anotherstudent commented, “After taking this course, I havegained a considerable amount of knowledge of biochemis-try. I have also greatly improved my problem-solving skillsand become more of a critical thinker.” Even students whowere not pleased with the course recognized the amountlearned: “It [lab] helped with problem solving and researchskills; and, with computer skills. I have no clue what myattitude [is] toward biochem. It is a love hate relationship.”
To assess progress in student understanding of relevantconcepts during the course, we make use of a pre-test/post-test system. Students are given the pre-test on the first dayof the semester, and similar questions are asked as part ofthe final exam (pre-tests are not returned to the students).Several of the questions directly relate to basic skillsrequired to work with the data obtained during this experi-mental series (Table III). Questions are open-ended, andstudents were judged as understanding the concept if theirfinal answer contained no more than one minor error unre-lated to the overall concept (e.g. math error due to mistyp-ing numbers in a calculator).
This 6-week experimental series has an advantageover many of the current undergraduate laboratory experi-ments in the literature because it is designed to work withlarge groups of students in a short time period. Very littlespecialized equipment is required, although the use of theBio-Tek plate reader does allow for students to take tripli-cate measurements of all absorbance readings and performkinetic assays. The modular nature of the project is alsoadvantageous; for example, the series could begin in week3 with instructor prepared samples or weeks 1 and 2 couldbe performed as an isolated series to demonstrate differen-ces in protein solubility and activity.
The majority of students were able to successfully com-plete the series, with less than 10% having inactive or miss-ing enzyme by the end of the series. With up to 24 studentsper section, it is impossible for the instructor to continu-ously monitor all groups and prevent mistakes in the proce-dure; the overall success of the series despite these chal-lenges demonstrates the robust nature of these
experiments. Requiring students to develop their own pro-tocols for several experiments fosters critical thinking skillsand forces students to think more about why they are per-forming a particular step rather than having them simplyfollow a set of instructions. We hope that the details of thisexperimental series will be of benefit to other universitiesthat struggle to balance the desire to offer a project-basedexperience to their students with the demands of a largestudent population and limited resources.
AcknowledgmentsThis work was supported by the Louisiana Board ofRegents [LEQSF (2011-12)ENH-UG-24]. Th authors thankXavier Chemistry department chairs, Cheryl K. Stevens andMaryam Foroozesh, for their support of this project.
References
[1] Hurst, M. O., Keenan, M. V., and Son, C. C. (1992) Purification of lyso-
zyme by linear salt gradient and SDS gel electrophoresis. J. Chem.
Educ. 69:850–851; doi:10.1021/ed069p850.
[2] Brockman, M., Ordman, A. B., and Campbell, A. M. (1996) Research in
undergraduate instruction: A biotech lab project for recombinant DNA
protein expression in bacteria. J. Chem. Educ. 73:542–543; doi:10.1021/
ed073p542.
[3] Deal, S. T., and Hurst, M. O. (1997) Utilizing isolation, purification, and
characterization of enzymes as project-oriented labs for undergraduate
biochemistry. J. Chem. Educ. 74:241–242; doi:10.1021/ed074p241.
[4] Craig, P. A. (1999) A project-oriented biochemistry laboratory course. J.
Chem. Educ. 76:1130–1135; doi:10.1021/ed076p1130.
[5] Hunnes, C. H. (2003) Isolation, purification, and characterization of bovine
heart and yeast cytochromes c: An integrated biochemistry laboratory ex-
perience. Biochem. Mol. Biol. Educ. 31:242–248; doi:10.1002/
bmb.2003.494031040248.
[6] MacDonald, G. (2008) Teaching Protein Purification and Characterization
Techniques. A Student-Initiated, Project-Oriented Biochemistry Labora-
tory Course. J. Chem. Educ. 85:1250–1252; doi:10.1021/ed085p1250.
[7] Timerman, A. P., Fenrick, A. M., and Zamis, T. M. (2009) The Isolation
of Invertase from Baker’s Yeast: A Four-Part Exercise in Protein Purifica-
tion and Characterization. J. Chem. Educ. 86:379–381; doi:10.1021/
ed086p379.
[8] Jewett, K., and Sandwick, R. K. (2011) Ribose 5-Phosphate Isomerase
Investigations for the Undergraduate Biochemistry Laboratory. J. Chem.
Educ. 88:1170–1174; doi:10.1021/ed100670a.
[9] Melius, P. (1971) Isolation of yeast invertase by Sephadex gel chroma-
tography. A biochemistry laboratory experiment. J. Chem. Educ.
48:765–766; doi:10.1021/ed048p765.
[10] Munson, L., and Fall, R. R. (1978) Purification and characterisation of
Escherichia coli alkaline phosphatase. A biochemical experiment. Bio-
chemical Education 6:53–56; doi:10.1016/0307–4412(78)90059-6.
[11] Howitt, S. M. (2007) Investigation of the properties of wild type and mu-
tant alkaline phosphatase variants: A laboratory project linking geno-
type and phenotype. Biochem. Mol. Biol. Educ. 35:350–354; doi:10.1002/
bmb.91.
[12] Ninfa, A. J., Ballou, D. P., and Benore, M. (2010) Fundamental Labora-
tory Approaches for Biochemistry and Biotechnology, John Wiley and
Sons, Hoboken, New Jersey.
[13] Schurr, A., and Yagil, E. (1971) Regulation and characterization of acid
and alkaline phosphatase in yeast. J. Gen. Microbiol. 65:291–303.
[14] Onishi, H. R., Tkacz, J. S., and Lampen, J. O. (1979) Glycoprotein nature
of yeast alkaline phosphatase. Formation of active enzyme in the pres-
ence of tunicamycin. J. Biol. Chem. 254:11943–11952.
260 Purification and Characterization of Enzymes from Yeast
Biochemistry andMolecular Biology Education

[15] Tuleva, B., Vasileva-Tonkova, E., and Galabova, D. (1998) A specific
alkaline phosphatase from Saccharomyces cerevisiae with protein
phosphatase activity. FEMS Microbiol. Lett. 161:139–144.
[16] Carlson, M., Osmond, B. C., and Botstein, D. (1981) Genetic evidence
for a silent SUC gene in yeast. Genetics 98:41–54.
[17] Carlson. M, Osmond, B. C., and Botstein, D. (1981) SUC genes of yeast:
A dispersed gene family. Cold Spring Harb. Symp. Quant. Biol. 45 Pt
2:799–803.
[18] Carlson, M. and Botstein, D. (1983) Organization of the SUC gene family
in Saccharomyces. Mol. Cell Biol. 3:351–359.
[19] Carlson, M., Taussig, R., Kustu, S., and Botstein, D. (1983) The secreted
form of invertase in Saccharomyces cerevisiae is synthesized from
mRNA encoding a signal sequence. Mol. Cell. Biol. 3:439–447.
[20] Williams, R. S., Trumbly, R. J., MacColl, R., Trimble, R. B., and Maley, F.
(1985) Comparative properties of amplified external and internal invert-
ase from the yeast SUC2 gene. J. Biol. Chem. 260:13334–13341.
[21] Tarentino, A. L., Plummer, T. H., Jr., and Maley, F. (1974) The release of
intact oligosaccharides from specific glycoproteins by endo-beta-N-ace-
tylglucosaminidase H. J. Biol. Chem. 249:818–824.
[22] Chu, F. K., Trimble, R. B., and Maley, F. (1978) The effect of carbohy-
drate depletion on the properties of yeast external invertase. J. Biol.
Chem. 253:8691–8693.
[23] Barbaric, S., Kozulic, B., Ries, B., and Mildner, P. (1984) Physicochemical
and kinetic properties of acid phosphatase from Saccharomyces cerevi-
siae. J. Biol. Chem. 259:878–883.
[24] Barbaric, S., Mrsa, V., Ries, B., and Mildner, P. (1984) Role of the carbo-
hydrate part of yeast acid phosphatase. Arch. Biochem. Biophys.
234:567–575.
[25] Kaneko, Y., Hayashi, N., Toh-e, A., Banno, I., and Oshima, Y. (1987)
Structural characteristics of the PHO8 gene encoding repressible alka-
line phosphatase in Saccharomyces cerevisiae. Gene 58:137–148.
[26] Kaneko, Y., Toh-e, A., Banno, I., and Oshima, Y. (1989) Molecular char-
acterization of a specific p-nitrophenylphosphatase gene, PHO13, and
its mapping by chromosome fragmentation in Saccharomyces cerevi-
siae. Mol. Gen. Genet. 220:133–139.
[27] Klionsky, D. J. and Emr, S. D. (1989) Membrane protein sorting: Biosyn-
thesis, transport and processing of yeast vacuolar alkaline phosphatase.
EMBO J. 8:2241–2250.
[28] Mackintosh, C. Assay and purification of (serine/threonine) phospha-
tases in Protein Phosphorylation: A Practial Approach. Hardie, D. G., Ed.
(1993), IRL Press, New York.
Johanson et al. 261

Purification and Characterization of Invertase and Phosphatase from Baker’s Yeast
Over the next six weeks, you will be performing a series of experiments designed to introduce you to common
techniques used in the purification and characterization of proteins. This handout contains background
information you may need during this process. At the end of this experimental series, you will present your
findings by writing a manuscript in the style of the journal Biochemistry.
Since more than one form of each enzyme exists, it is also necessary for you to determine which form has been
purified. Based on our starting material and reaction conditions, you can start to formulate a hypothesis as to
which form(s) of invertase and phosphatase are present in your samples. Information from the enzyme activity
assays and gel electrophoresis will provide the data necessary to accept or reject your hypothesis. At the end of
this series of labs, you should be able to decide which form(s) you have purified and use your data to support
your decision.
Enzyme background
You will be purifying the enzymes invertase and phosphatase from Baker’s yeast (S. Cerevisiae). Both invertase
and phosphatase catalyze hydrolysis reactions; therefore they fall into the Class III (Hydrolases) group of
enzymes according to the International Union of Biochemistry and Molecular Biology (IUBMB).
Hydrolase reactions usually follow the scheme:
Hydrolases are further classified according to the type of bond broken. Invertase (E3.2.1.26) is a glycosylase
while phosphatases (E3.1.3-5) are phosphoric ester hydrolases. Although they both catalyze reactions according
A-B + H2O 1 A-H + B-OH

to the general scheme shown above, their substrate specificities are very different. This difference is important
because it allows us to test the activity of each enzyme even when they are present in a mixed sample.
Invertase: Invertase primarily catalyzes the breakdown of sucrose by hydrolyzing the glycosidic bond between
glucose and fructose. The structure of sucrose is shown in Figure 1.
Yeast can contain up to seven sucrose fermentation
(SUC) genes that code for invertase; however, all
loci code for nearly identical forms of the protein [1-
3]. The distribution of these genes varies among
yeast strains, with SUC2 being the most commonly
identified and therefore the most studied of the SUC
genes [2]. Transcription of the SUC2 gene results in
two mRNAs that differ by 100 bases at their 5’ end. The longer mRNA is translated to produce a form of
invertase that is secreted from the cell into the periplasm [4] [5]. The extracellular form of invertase is also
glycosylated; it contains an average of nine oligosaccharide chains with each chain containing between 26 and
54 residues [6, 7]. Glycosylation increases the molecular mass of the enzyme from 60,000 Da to 125,000 Da
per subunit, with the active form usually found in a dimeric state [5, 7]. Translation of the smaller mRNA
results in invertase that remains in the cell and is relatively free of carbohydrates giving it a molecular mass
similar to that of the extracellular form prior to glycosylation [5, 7]. Both forms of the enzyme have similar
kinetic properties and operate in the same pH range (4-6), although the glycosylation appears to give the
extracellular form more stability and therefore more activity at low pH [7].
Phosphatase: Phosphatases are enzymes that catalyze the removal of a phosphate group from a substrate. There
are many different subtypes of phosphatases, and they are grouped according to the chemical nature of the
substrate or the type of hydrolytic reaction catalyzed. Phosphomonoesterases (EC3.1.3) are a group of
Figure 1. The strucutre of sucrose. Glucose and fructose are shown joined by an 1"2) glycosidic bond with the individual carbon atoms in each monosaccharide numbered.

phosphatases that catalyze the hydrolysis of a single phosphate ester. While some phosphomonoesterases are
highly specific, others act on a broad range of substrates. The phosphomonoesterases that can act on a broad
range of substrates are classified according to the pH at which they show optimum activity, and are named either
acid or alkaline phosphatases.
Yeast have several genes that encode nonspecific phosphomonoesterases as well as several other related genes
involved in phosphate metabolism (PHO). Three genes, PHO3, PHO5, and PHO11, encode acid phosphatases
that range from 61,500 – 73,000 Da [8]. These acid phosphatases are secreted from the cell, glycosylated, and
are found in large oligomeric complexes containing roughly 50% oligosaccharide residues and 50% protein,
giving them a molecular mass of 200,000 Da or greater [9]. They are active in a small pH range (3-5) and
denature easily at pH values outside of that range [9]. Two genes, PHO8 and PHO13, encode alkaline
phosphatases [10, 11]. Unlike the interchangeable acid phosphatases of yeast, the enzymes encoded by PHO8
and PHO13 do not have the same structure or substrate specificity. PHO8 encodes a dimeric protein of 130,000
Da containing a small amount of glycosylation, as each subunit is predicted to have a molecular mass of 63,000
without oligosaccharides [12, 13]. This phosphatase is located in the vacuole of the cell [14] and seems to have
no preference for any particular monophosphate esters [13]. By contrast, the protein encoded by PHO13 is
monomeric with a molecular mass of 60,000 Da and has a strong substrate preference for para-nitrophenol
phosphate along with a few phosphorylated proteins [13]. The cellular location of this phosphatase is
unspecified. Both alkaline phosphatases have a similar pH range (8-10) for activity [13].
Enzyme activity
As you proceed with the purification, you must monitor the activity of both invertase and phosphatase to ensure
that the purification is proceeding successfully. The activity will be tested through the use of a specific assay or
test for each enzyme. In both assays, you will be detecting the product of the enzymatic reaction. You should
be familiar with the reactions described below and be able to understand and explain the results of each assay.

Assay for invertase activity: The main difference between the substrate and
products of the invertase-catalyzed reaction is that a nonreducing sugar has
been converted to a reducing sugar. A reducing sugar cannot be
differentiated from a nonreducing sugar by the naked eye; however,
reducing sugars have the ability to reduce other compounds. This assay
proceeds in three steps: Step I: Sucrose is mixed with a protein sample. If
active invertase is present, sucrose will be hydrolyzed to yield equal amounts of glucose and fructose. Step 2:
The sample is heated to encourage the isomerization of fructose to glucose. Step 3: DNS (3,5-dinitrosalicylate,
Figure 2) is added to the mixture. Glucose reduces DNS to 3-amino-5-nitrosalicylate and in turn is oxidized to
gluconate. Steps 2 and 3 are often combined when performing this experiment in the laboratory.
Because you are not directly detecting the amount of glucose present, this is known as a coupled assay. Here the
production of glucose is coupled to the reduction of DNS. 3-amino-5-nitrosalicylate can be distinguished from
DNS by a difference in their color. This difference can be detected by reading the absorbance of the sample at
540 nm, which is the absorbance maximum for 3-amino-5-nitrosalicylate. This is a stopped assay, because the
heat in step 2 will denature the enzyme and prevent any further activity.
Assay for phosphatase activity: Since it would be impractical to use a variety of monophosphate esters as
substrates, the molecule para-nitrophenol phosphate is used as a standard substrate to detect phosphatase
activity. This is a direct assay; para-nitrophenol phosphate is mixed with a protein sample. If the sample
contains active phosphatase, para-nitrophenol is produced. Para-nitrophenol has a strong, yellow color under
basic conditions that can be detected by reading the absorbance of the solution at 400 nm. If the assay is not
performed under basic conditions, the pH of the solution must be raised prior to reading the absorbance. Unlike
the invertase assay, this is not a stopped assay and the enzyme will continue to convert substrate to product until
all substrate has been hydrolyzed.
Figure 2. Structure of DNS. Here DNS is shown in the acid form.

Schedule of activities
Below is a schedule of experiments for the next six labs.
Week Experiment1 Ethanol fractionation of yeast cells2 Specific activity I3 Anion exchange chromatography4 Specific activity II5 SDS-PAGE6 Kinetics of phosphatase
A note about naming conventions: Gene and protein names are written differently depending on the organism.
For yeast, it is standard convention to write the name of the gene in all capital letters followed by a number (if
applicable). If you wish to refer to the protein encoded by the gene, only the first letter is capitalized and a p is
added after the name to indicate protein. For example, SUC2 is a gene and Suc2p is a protein. You may also
refer to the protein by its activity. As it is unlikely that you will know exactly what form of the protein you have
purified until the end of the experimental series, it is best to refer to the enzymes by their generic names (i.e.,
invertase or phosphatase) in your writings unless you are hypothesizing about your results. In your final
analysis, you should be able to identify the specific form of invertase and phosphatase and refer to it by the
correct protein name.

Ethanol Fractionation of Baker’s Yeast
Introduction:
In today’s experiment, we will begin the process of purifying the enzymes invertase and phosphatase from yeast.
Ethanol fractionation is used here to separate the periplasm from other cellular components as the first step in
purification. If the procedure today is done correctly, you will end up with one fraction that contains a higher
concentration of enzyme than the others. However, you will not be able to determine the identity of this fraction
today, so you must save all of your samples. Next week, you will analyze the enzyme activity in each sample to
determine which has the most enzyme activity.
It is critical that you keep a good record of both your activities in lab and the content and identity of all samples.
Organization is essential to the success of these experiments. Be sure to label all tubes so that you can uniquely
identify your tubes when mixed in a box with other tubes from your class.
Hazards:
Ethanol is flammable.
Preparation of yeast extract:
This part of the experiment has been done for you. However, these details are an important part of the
experiment and should be included in your lab notebook and Materials and Methods section of your
manuscript.
28.0 g of dry yeast was suspended in 100 mL of 0.100 M sodium bicarbonate solution, loosely capped, and
placed at 35˚C overnight. The next day, the suspension was centrifuged at 7,500 rpm for 30 minutes at 4˚C.
The supernatant was transferred into a separate container and stored at -20˚C.

Ethanol Fractionation:
1. Obtain a tube of yeast extract from your instructor.
2. Centrifuge the extract for 2 minutes at 7500 rpm to clarify the extract. Transfer the supernatant to a new
tube and label it “sample 1” or “CYE”. You do not need to save the pellet produced at this stage and
can discard it in the trash.
3. Using ice-cold absolute EtOH, mix EtOH and clarified yeast extract together in a new microcentrifuge
tube to give 1.4 mL of a solution that is 29% EtOH. This is sample 2.
4. You should have some clarified yeast extract left over. Save this on ice. If you do not have any left
over, first check to see that you have completed step 3 correctly. If you believe that you have performed
that step correctly, immediately notify your instructor so that he/she may check your sample.
5. Mix sample 2 by inverting (i.e., turn the tube upside down several times). Place the tube on ice for at
least 5 minutes. It is fine if the tube remains on ice for more than 5 minutes.
6. Centrifuge at 13,000 rpm for 10 minutes at 4˚C.
7. Transfer the supernatant to a new tube. Try to transfer as much of the supernatant as possible without
disturbing the pellet. This is sample 3. Save the pellet (in sample 2) on ice.
8. Combine the supernatant and ice-cold absolute EtOH in a new tube to give 700 µL of a solution that is
40% EtOH.* This is sample 4.

*Remember that your solution is already 29% EtOH. You will need to solve C1V1 + C2V2 = C3V3.
9. Repeat steps 5-7 with sample 4. Label the new supernatant tube sample 5.
10. Resuspend the pellets in sample 2 and 4 tubes in 600 µL of 5.0 mM Tris pH 7.4. The pellets may not go
into solution easily. You may vortex to resuspend. If a small amount of pellet remains after several
attempts to resuspend, you may stop at this point.
11. You should now have five samples in clearly labeled tubes. Give these five samples to your instructor.
Be sure that you have a description in your notebook of what is in each tube and exactly how each tube
is labeled.
12. Your instructor will place these samples in the -20˚C freezer for storage.
Specific Activity I
Introduction:
Last week you used ethanol to fractionate yeast cells into different components as an initial purification
technique. If fractionation was performed correctly, one fraction should have more invertase and phosphatase
than the other fractions. It is important to identify the fraction with the highest enzyme concentration so that it
can be used as the starting material for the second stage of purification. Since there are also many other proteins
in the fractions, the only way to identify the presence of either enzyme in each fraction is by measuring their
activity.

As we have already discussed, invertase and phosphatase catalyze similar reactions, but have very different
substrate specificities. Therefore, we can perform two different enzyme activity assays on each sample to
determine the relative activity of each enzyme in that sample.
You will be expected to perform these activity assays a number of times in the coming weeks. This will be the
only time that you will be given a step-by-step protocol for each assay. Be sure to take good notes and annotate
your lab notebook so that you understand exactly how to perform these assays and feel confident that you can
repeat them without additional instruction.
The protocols for the phosphatase assay, invertase assay, and A280 measurement are described below. These are
three separate experiments and do not need to be performed in the order they are listed.
Hazards:
DNS is harmful if swallowed or absorbed through the skin.
Phosphatase activity assay:
This assay will test the ability of phosphatase to remove the phosphate group from paranitrophenol phosphate
(PNPP), producing paranitrophenol (PNP).
1. Prepare your positive control: In a microcentrifuge tube, dilute 0.500 mM PNP to 0.100 mM in a final
volume of 700 µL with 10.0 mM Tris pH 9.0. This solution should have a significant yellow color.
2. Determine the number of samples you need to test for activity. You will also need a negative control,
which will increase your number of samples by one (so a total of 6 samples for this lab).
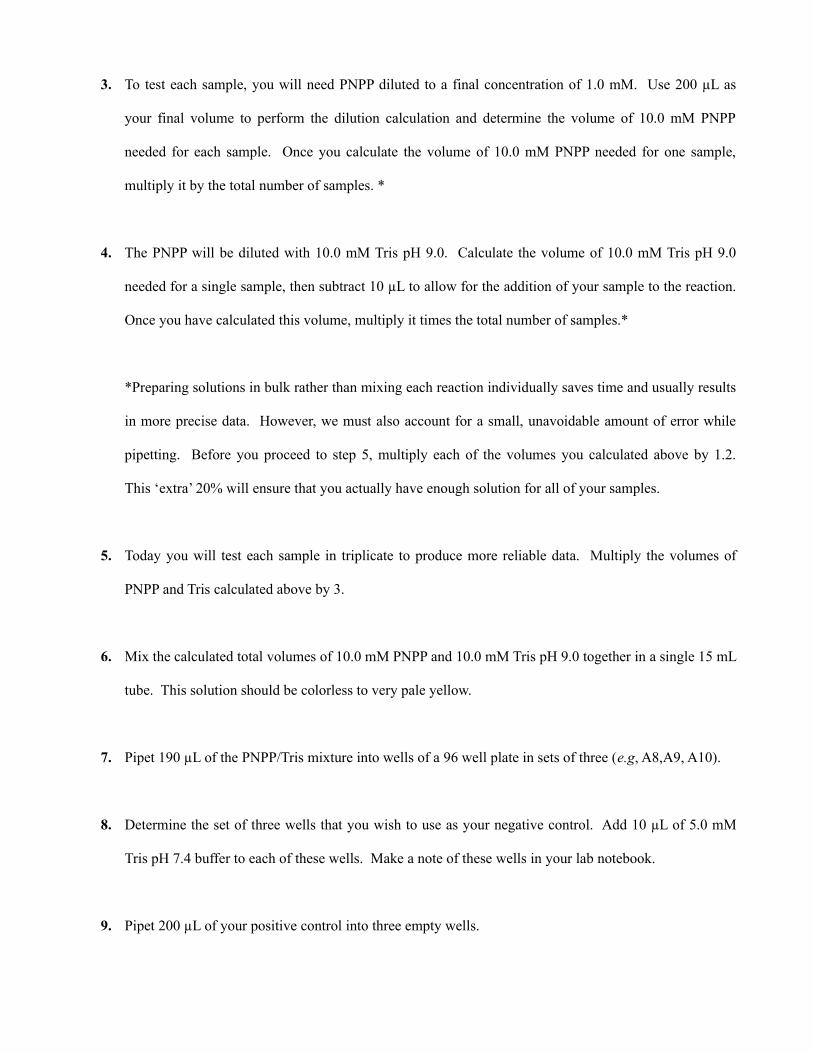
3. To test each sample, you will need PNPP diluted to a final concentration of 1.0 mM. Use 200 µL as
your final volume to perform the dilution calculation and determine the volume of 10.0 mM PNPP
needed for each sample. Once you calculate the volume of 10.0 mM PNPP needed for one sample,
multiply it by the total number of samples. *
4. The PNPP will be diluted with 10.0 mM Tris pH 9.0. Calculate the volume of 10.0 mM Tris pH 9.0
needed for a single sample, then subtract 10 µL to allow for the addition of your sample to the reaction.
Once you have calculated this volume, multiply it times the total number of samples.*
*Preparing solutions in bulk rather than mixing each reaction individually saves time and usually results
in more precise data. However, we must also account for a small, unavoidable amount of error while
pipetting. Before you proceed to step 5, multiply each of the volumes you calculated above by 1.2.
This ‘extra’ 20% will ensure that you actually have enough solution for all of your samples.
5. Today you will test each sample in triplicate to produce more reliable data. Multiply the volumes of
PNPP and Tris calculated above by 3.
6. Mix the calculated total volumes of 10.0 mM PNPP and 10.0 mM Tris pH 9.0 together in a single 15 mL
tube. This solution should be colorless to very pale yellow.
7. Pipet 190 µL of the PNPP/Tris mixture into wells of a 96 well plate in sets of three (e.g, A8,A9, A10).
8. Determine the set of three wells that you wish to use as your negative control. Add 10 µL of 5.0 mM
Tris pH 7.4 buffer to each of these wells. Make a note of these wells in your lab notebook.
9. Pipet 200 µL of your positive control into three empty wells.

10. When it is your turn at the plate reader, quickly add 10 µL of each sample to a set of three wells. The
reaction will begin immediately, so it is important to get your plate into the BioTek plate reader as
quickly as possible after adding the samples.
11. Read the absorbance of the plate at 400 nm. The program you use will read the absorbance of each
sample at zero and five minutes. You will need the five-minute absorbance reading for calculation of
phosphatase activity.
12. You should check to see if the absorbance of your sample wells has increased from zero to five minutes
(i.e., are the absorbances greater at 5 minutes than at 0 minutes). If at least some of your samples do not
show a change, then there is no enzyme activity in your sample or you waited too long between adding
your samples and reading the plate. You should also note that the absorbance of the positive control
should be much different from that of the negative control, and that the controls do not show any
difference between zero and five minutes. If you observe a lack of change in your samples or a problem
with your controls, notify your instructor so that you can plan to redo this experiment appropriately.
13. Average the triplicate absorbances for each sample and control at 5 minutes. Subtract the average
absorbance of the negative control from the average absorbance for each sample (including the positive
control). Negative values after this subtraction indicate no enzyme activity. If none of your samples
have enzyme activity (i.e., they are all negative), then an error has been made during the experiment and
you should notify your instructor so that you can redo this experiment.
Invertase activity assay:

To measure the activity of invertase, you will use its natural substrate, sucrose. However, in order to detect the
products of the reaction, the hydrolysis of sucrose will be coupled to the reduction of 3,5 dinitrosalicylate
(DNS), producing an orange-colored product, 3-amino-5-nitrosalicylate.
1. Prepare your substrate: Dilute 0.100 M sucrose to 0.020 M in a final volume of 1.00 mL using 50.0 mM
acetate pH 4.8. Sucrose is hydrolyzed readily even in the absence of enzyme, so a fresh dilution must
be prepared each time you perform this assay.
2. Prepare your positive control: 10.0 µL 5.0 mM Tris-Cl pH 7.4 + 100 µL 0.020 M hydrolyzed sucrose in
a labeled microcentrifuge tube. Be sure you are using the correct form and concentration of sucrose
here.
3. Prepare your negative control: 10.0 µL 5 mM Tris-Cl pH 7.4 + 100 µL 0.020 M sucrose (the substrate
prepared in step 1) in a labeled microcentrifuge tube.
4. For each sample to be tested, combine 10.0 µL of that sample with 100 µL 0.020 M sucrose (prepared in
step 1) in a labeled microcentrifuge tube. For this lab, you should be testing 5 samples.
5. Allow all samples and controls to sit on the bench for approximately five minutes. During this time, the
hydrolysis of sucrose will be catalyzed by any invertase present in your sample; therefore it is important
to note if this reaction proceeds for longer than 5.0 minutes so that the actual time can be used in the
activity calculation. Be sure that you record the actual time from addition of sample to the sucrose (step
4) to addition of alkaline DNS (step 6) in your lab notebook, as this is the full reaction time.
6. Add 400 µL alkaline DNS to each tube (samples and controls).

7. Heat all tubes at 90˚C for 5 minutes. Heating the samples will both denature the enzyme (stopping the
reaction) and facilitate the reduction of DNS by glucose (as described in the handout provided in Week
6). It is not critical that this value be exactly five minutes, and a little longer is fine. You will not use
this time value in any calculations.
8. Add 400 µL 50.0 mM acetate pH 4.8 to each tube.
9. Pipet into 96-well plate, 200 µL per well. Each sample or control should be placed in the plate in
triplicate.
10. Read the absorbance of the plate at 540 nm.
11. You should note that the absorbance of the positive control should be much different from that of the
negative control. If you observe a lack of difference with your controls, notify your instructor so that
you can redo the experiment with correct controls.
12. Average the triplicate absorbances for each sample and control. Subtract the average absorbance of the
negative control from the average absorbance for each sample (including the positive control). Negative
values after this subtraction indicate no enzyme activity. If none of your samples have enzyme activity
(i.e., they are all negative), then an error has been made during the experiment and you should notify
your instructor so that you can redo this experiment.
Protein quantitation:
You will load 2.00 µL of each sample into the Take 3 plate and record the A280. You will also record the A280 of
5.0 mM Tris-Cl pH 7.4 (this will serve as your blank). You should measure the A280 of each sample at least
twice to ensure that your readings are reproducible, and then average the measurements for each. The volume

you are putting on the plate is very small, and it will evaporate if you leave it too long. If you are having
difficulty loading the plate quickly enough, you may need to load just a few samples, take a reading, and repeat.
The A280 will allow you to estimate the amount of total protein in each sample. Use the guide at the end of this
protocol to complete the protein analysis.
Data analysis: calculating molar absorptivity
To calculate the molar absorptivity, subtract the average absorbance of your negative control from the average
absorbance of your positive control, and combine with the concentration of the positive control and the path
length. Use the path length you calculated previously. This is the same Beer's Law approach as you have used
several times:
(Ave. ABS positive control - Ave. ABS of negative control)
–––––––––––––––––––––––––––––––––––––––––––––––– = M-1 cm-1
Concentration of positive control (M) * path length (cm)
For PNP, use the final concentration of PNP in a single well for the calculation. Your value should ideally fall in
the range 1700 - 20000 M-1 cm-1. If it does not, please recheck your calculation. Contact your instructor if you
still obtain a number more than 2500 M-1 cm-1outside of that range.
Next find the molar absorptivity of 3-amino-5-nitrosalicylate using the same approach. Be sure you are using
the final concentration in a single well. Remember that there are several dilutions that occur between
preparation of the hydrolyzed sucrose and the actual addition of the sample to the 96 well plate, and you must
correct the concentration used based on the changes in volume. Your value should ideally fall in the range 1500
- 2000 M-1 cm-1. If it does not, please recheck your calculation. Contact your instructor if you still obtain a
number more than 200 M-1 cm-1outside of that range.

Data analysis: determining the specific activity
In general terms, the specific activity is defined as the activity of the enzyme per mg of total protein. If a
purification strategy is successful, the specific activity should increase at each stage of purification You will
need to determine the specific activity for each of your samples to determine what effect ethanol fractionation
has had on the purification of invertase and phosphatase. You will need this information to decide how to
proceed in next week’s lab.
To determine specific activity, you will first need to calculate the activity (Units, or µmol min -1) in each sample.
This is done separately for phosphatase and invertase, as each reaction product absorbs at a different wavelength
and has a different molar absorptivity. Note that it is possible that you will generate a negative number after
subtracting the absorbance of the negative control from one or more of your samples. In this case, you should
mark this sample as “no detectable activity” and should not use this negative number in the activity calculation
described below. When reporting the activity in a table, list it as “no detectable activity” or zero, not as a
negative number.
1. Calculate Units (µmol/min)
a. Phosphatase: Determine the Units (activity) for a single sample using the equation:
(Ave. ABS - Ave. ABS of negative control) * volume of 1 well (L)
–––––––––––––––––––––––––––––––––––––––––––––––––––––– = mol min-1
Molar absorptivity (M-1cm-1)* path length (cm) * time (minutes)
This number should then be converted to µmol min-1 to obtain activity (Units). This calculation should
be performed for each sample that potentially contains enzyme (i.e., has detectable activity as indicated
by an absorbance greater than the negative control). The time used in this calculation is the length of

time the reaction proceeded before making a measurement. For this week, that value is 5.0 minutes
because the plate reader took a reading at zero and five minutes.
b. Invertase: Determine the Units (activity) as described above, using the absorbances and molar
absorptivity from your invertase assay. Use the actual time your reactions proceeded between adding
enzyme and adding DNS.
At this stage, you have calculated the activity of phosphatase and/or invertase in each sample. However,
there may be different amounts of enzyme in these samples so we are not able to directly compare
activity. Next, you will use the A280 to calculate the amount of enzyme in each sample, and use this
value to calculate a specific activity that corrects for differences in amount of enzyme.
2. Calculate the total amount of protein in each sample (mg)
a. Protein mg/mL: Subtract the A280 of your blank from the average A280 of your sample, then
convert the resulting A280 to mg/mL assuming that a protein sample with an A280 = 1.0 has a
concentration of 1.0 mg/mL.
b. Determine the total volume of protein used in each sample (the amount added to each well).
For this week, that amount is 10.0 µL.
c. Sample protein mg: Multiply your mg/mL concentration from (a) by the protein volume of each
sample from (b), being sure to convert appropriately to be left with mg. This should result in a
calculation that looks like this:
(Ave. A280 - A280 of blank) * (1 mg/mL) * sample volume (mL) = mg

3. Calculate specific activity (µmol/min/mg protein):
Divide the µmol/min of each sample from (1) by the sample protein mg from (2). This number is the
specific activity of the sample and should be reported with units that produce a whole number.
Anion Exchange Chromatography
Introduction:
In today’s experiment, we will continue the process of purifying the enzymes invertase and phosphatase from
yeast extract. Using anion-exchange chromatography, we will isolate these two enzymes away from other
proteins in the sample and perhaps even separate them from each other. At the end of today’s experiment, you
will have a number of fractions, which you will test next week to determine which contain active invertase
and/or phosphatase.
In the process of preparing and running your anion exchange column, you will use several buffers that differ
only in salt concentration. Please read the labels carefully to ensure that you are using the correct buffer. You
should also be able to explain why we are using different salt concentrations on the column.
Preparing an anion-exchange column:
1. Each group will be provided with a small, plastic column. Your column will be open on one end and
contain a small plastic cap on the other. Check the column to ensure that is clean and free of any debris
before beginning. Add approximately 4 mL of dH2O to the column, remove the column cap, and allow
the dH2O to drain out over an empty beaker or the sink. If the flow is very slow (10 seconds or more
between drops), ask your instructor for a new frit for the column. Otherwise, let the column drip freely
until all dH2O has passed through. Replace the small plastic cap after all the dH2O has passed through.

2. Your instructor will have a beaker containing DEAE-Cellulose resin in 5 mM Tris-Cl pH 7.4/5 mM
MgCl2. Transfer 2 mL of the slurry to your column. Allow the column to sit undisturbed on your bench
for 5-10 minutes. You should notice that during this time the mixture is separating with the resin (white
material) settling in the bottom of the column and the buffer (colorless liquid) remaining on the top
layer. For the remainder of the lab, you should never let the buffer layer drop below the top of the resin
interface.
3. Place the column over a clean 15 mL tube and remove the column cap to being the flow of buffer.
4. When buffer level is about 1 cm (a little less than one finger width) above the top of the resin, add 5 mL
5 mM Tris-Cl pH 7.4/5 mM MgCl2 to the column and allow it to flow through. Do not allow the buffer
to drop below the level of the top of the resin.
5. When the buffer level is again 1 cm above the top of the resin, the column is ready for your sample. If
you are not ready to add your sample to the column at this point, cap the end of the column so it does
not dry out.
Preparing your sample for chromatography:
1. Centrifuge your sample for 1 minute at 12,000 rpm. Remove the supernatant to a clean, labeled
microcentrifuge tube. Do not worry if there does not seem to be a pellet at this stage; this step is simply
to remove any remaining cellular debris.
2. Add 5 mM Tris-Cl pH 7.4/5 mM MgCl2 to your sample so that the final volume is approximately 1 mL.
You may use the markings on the side of the microcentrifuge tube to estimate this volume. If your
supernatant is already at the 1 mL mark, then there is no need to add any additional buffer.

3. Remove 20 µL of your sample to a clean, labeled microcentrifuge tube. You will need this sample for
further analysis. Label this tube and give to your instructor for storage at -20 ˚C.
Anion-exchange chromatography:
1. You will now add your diluted protein sample to the column. You will need approximately 15 clean
microcentrifuge tubes to collect fractions. Depending on how you collect fractions and the exact
amount of resin in your column, you may end up with between 13-16 fractions. Notify your instructor if
you end with fewer than 10 fractions or more than 18. Work with your partner to exchange tubes and
label each as the fractions are collected.
2. Place your uncapped column over a clean microcentrifuge tube and add your protein sample to the resin.
3. Collect the eluant in 500 µL fractions until the level of buffer is again 1 cm above the resin. You may
estimate the collected volume using the markings on the microcentrifuge tube.
4. Add 2.5 mL 5.0 mM Tris-Cl pH 7.4/5.0 mM MgCl2/100 mM NaCl to your column. Be sure you are
using the correct buffer (with 100 mM NaCl) at this step.
5. Collect the eluant in 400 µL fractions until the level of buffer is again 1 cm above the resin.
6. Add 2.5 mL 5.0 mM Tris-Cl pH 7.4/5.0 mM MgCl2/300 mM NaCl to your column. Be sure you are
using the correct buffer (with 300 mM NaCl) at this step.
7. Collect the eluant in 400 µL fractions until the level of buffer is again 1 cm above the resin.

8. Cap the column.
9. After all fractions have been collected, labeled, and the labels recorded in your notebook, give your
fraction tubes to your instructor. They will be stored at -20˚C until next week.
Specific Activity II
Introduction:
Last week you collected fractions from anion exchange chromatography. Today you will assay each fraction for
invertase activity, phosphatase activity, and total protein (using A280). Use your own protocol to complete each
experiment.. At the end of lab today you should have all of the data necessary to calculate the specific activity
of both enzymes in each fraction.
Your protocol must contain the following:
1. Specific instructions for the preparation of all solutions (including volumes, times, etc). Complete all
necessary calculations as part of your protocol.
2. Detailed instructions for the collection of data and/or operation of any equipment. This level of detail
should be comparable to the protocols you have been given in prior weeks.
3. An explanation of the data analysis required to obtain specific activity values written in your own words
(i.e., not copied directly from the previous protocol).
SDS-PAGE

Introduction:
In today’s experiment, we will use SDS-PAGE to analyze samples collected throughout the purification
procedures. You will be able to use the results of the SDS-PAGE gel to determine the sizes of any proteins in
your samples and to determine the purity of your invertase and phosphatase preparations.
Hazards:
Acrylamide is a neurotoxin in its powdered from. While the polymerized form is safer to handle, you should
wear gloves if it is necessary for you to handle the gel directly. The 2X SDS loading dye contains b-
mercaptoethanol, which can be toxic if swallowed or absorbed through the skin.
Pouring an SDS PAGE gel:
A 10% SDS PAGE gel has already been prepared. Your instructor will discuss the procedure for making this
type of gel, and this procedure should be recorded in your lab notebook.
Prepare samples for SDS-PAGE:
1. As part of your pre-lab, you should have determined the specific activity for each of your samples with
detectable invertase and/or phosphatase activity. Use this information to identify the fraction that
contains the highest concentration of invertase and the fraction that contains the highest concentration of
phosphatase. If two fractions have roughly equal amounts of invertase or phosphatase, you may wish to
pool them. You will need these two samples again – please return them to the -20˚C freezer at the end
of lab today.
2. Mix 20 µL of 2X SDS loading dye with 20 µL of sample in a new microcentrifuge tube. (Do this for
both fractions identified in #1 as well as the sample you saved before loading the column.)

3. Heat the tubes at 90˚C for approximately 5 minutes. Be sure that you have added dye before heating the
samples.
Running the SDS PAGE gel:
1. Load the gels into the apparatus. The short plates need to be on the inside.
2. Fill the apparatus with 1 X SDS* running buffer to the top of the tall glass plate, inside and outside.
*SDS PAGE is a denaturing gel. The proteins must be boiled in the presence of SDS to denature them.
The 2X sample buffer contains SDS to denature the protein as well as dye to track the migration of the
sample.
3. Load your samples, any order is fine AS LONG AS YOU RECORD THE ORDER IN YOUR
NOTEBOOK. Your instructor will load the molecular weight marker (Bio Rad Broad Range Marker)
before you load any of your samples. Your instructor will also load a sample of clarified yeast extract
on the gel.
Loading the sample can be difficult. Place the pipette tip into the buffer and touch the back
plate. Slowly raise the tip until you feel the tip move forward to the tall plate. Place the tip
over the well and SLOWLY pipette out the sample without injecting any air (do not go all the
way to the second stop). The sample should sink to the bottom of the well.
4. Once all the samples and markers are loaded, your instructor will start the electrophoresis. The gel will
be run at 150V for approximately 1.5 hours.

5. Your instructor will demonstrate the proper technique for removing the gel from the apparatus and
placing it in the staining solution. As time permits, you may be asked to place your gels in the stain.
The gels will stain overnight in Gel Code Blue, and then will be placed in water for 2-4 hours. Your
instructor will post a picture of the gel on Blackboard.
Data analysis:
1. Using the information provided by your instructor, identify the size of each band in the molecular
weight marker lane.
2. Determine the Rf for each band in your molecular weight marker.
3. Graph log MW vs. Rf.
4. Determine the Rf for each band in your purified samples.
5. Use the MW graph (#3) to determine the molecular weight of each band.
6. Compare the molecular weights to the given MW of invertase and phosphatase to determine which
bands correspond to the enzymes.
Kinetics of Phosphatase
Introduction:
In today’s experiment, you will determine the effect of pH on the activity of your purified phosphatase. From
the activity data, you will be able to determine the optimal pH for the activity of your enzyme. You will then
determine the velocity of this enzyme starting from several different substrate concentrations at this optimal pH
in order to determine the KM and Vmax for your purified phosphatase. Use the information below to write your
own protocol for this experiment.

Hazards:
Goggles and gloves should be worn at all times when handling 3 M NaOH.
Determining the activity of phosphatase at different pH.
This assay will be performed in a manner similar to the phosphatase assays done previously. However, because
several of the buffers will be at a pH lower than the pKa of PNP, you will need to perform an additional step to
ensure that the absorbance of your reaction product can be detected. You should think carefully about the
positive and negative controls you will need for this experiment.
Buffer 0.010 M acetate pH 50.010 M citrate pH 60.010 M phosphate pH 70.010 M tris pH 80.010 M tris pH 90.010 M glycine pH 10
You will be provided with the six buffers in the table above. The actual pH values may be slightly different
from those shown in the table. Please record the actual pH of each buffer before you begin the lab.
Set up a reaction with each buffer using the same substrate concentration as used to determine specific activity.
Add the substrate/buffer mixture to your 96 well plate, then immediately add enzyme to the appropriate wells.
Be sure that you have enough enzyme to add to all of your samples and to also complete the second experiment
described below; you may need to reduce the amount of enzyme added to avoid running out. Allow the
reactions to proceed for approximately five minutes, then add 10.0 µL of 3.0 M NaOH to each well. Read the
absorbance of your plate as soon as possible after adding the NaOH.

Once you have collected your absorbance data, you can quickly examine it to determine which pH is optimal for
the activity of your phosphatase. This will be the pH you will use to determine the velocity of the enzyme as
described below.
Determining the velocity of an enzyme catalyzed reaction:
The velocity of an enzyme-catalyzed reaction is similar to its activity. In past weeks, we have measured activity
by calculating the amount of product formed at a single timepoint. In order to calculate velocity, you will
observe the change in product concentration over time. The reaction is assembled in the same manner as was
done previously; however, the plate reader will take several readings over a period of three minutes.
Using the buffer of optimal pH, set up reactions at several concentrations of substrate. You will need to include
a 0 mM substrate reaction as well as 5 additional substrate concentrations with the highest concentration no
greater than 1.0 mM. Once the substrate and buffer have been combined, you can proceed the assay in the same
manner as was done to determine activity.
*Do you need to add NaOH to your reaction here? What information will help you make that decision?
Once you have collected your absorbance data, you will be able to determine the velocity using a modification
of the equation for activity. You can then graph velocity vs. substrate concentration to construct a double-
reciprocal plot to calculate values for Vmax and KM.
Your protocol must contain the following:
1. Specific instructions for the preparation of all solutions (including volumes, times, etc). Complete all
necessary calculations as part of your protocol.

2. Detailed instructions for the collection of data and/or operation of any equipment. This level of detail
should be comparable to the protocols you have been given in prior weeks.
3. An explanation of the data analysis required to obtain velocity values and how to use those values to
obtain Vmax and KM written in your own words..