pursuing excellence: a study of u.s. eighth grade mathematics
TRANSCRIPT

1
PURSUING EXCELLENCE
___
A STUDY OF U.S. EIGHTH-GRADEMATHEMATICS AND SCIENCE TEACHING,
LEARNING, CURRICULUM, AND ACHIEVEMENTIN INTERNATIONAL CONTEXT
___
I N I T I A L F I N D I N G S F R O M T H E
T H I R D I N T E R N A T I O N A L M A T H E M A T I C S A N D S C I E N C E S T U D Y

2
U.S. Department of EducationU.S. Department of EducationRichard W. RileySecretary
Office of Educational Research and ImprovementOffice of Educational Research and ImprovementSharon P. RobinsonAssistant Secretary
National Center for Education StatisticsNational Center for Education StatisticsPascal D. Forgione, Jr.Commissioner of Education Statistics
National Center for Education StatisticsNational Center for Education StatisticsThe National Center for Education Statistics (NCES) is the primary federalentity for collecting, analyzing, and reporting data related to education inthe United States and other nations. It fulfills a congressional mandate tocollect, collate, analyze, and report full and complete statistics on the condi-tion of education in the United States; conduct and publish reports andspecialized analyses of the meaning and significance of such statistics; as-sist state and local education agencies in improving their statistical sys-tems; and review and report on education activities in foreign countries.
NCES activities are designed to address high priority education data needs;provide consistent, reliable, complete, and accurate indicators of educationstatus and trends; and report timely, useful, and high quality data to theU.S. Department of Education, the Congress, the states, other educationpolicymakers, practitioners, data users, and the general public.
We strive to make our products available in a variety of formats and in lan-guage that is appropriate to a variety of audiences. You, as our customer,are the best judge of our success in communicating information effectively.If you have any comments or suggestions about this or any other NCESproduct or report, we would like to hear from you. Please direct your com-ments to:
National Center for Education StatisticsOffice of Educational Research and ImprovementU.S. Department of Education555 New Jersey Avenue NWWashington, DC 20208-5574Contact: (202) 219-1395
Suggested Citation:U.S. Department of Education. National Center for Education Statistics,
Pursuing Excellence, NCES 97-198,Washington D.C.: U.S. Government Printing Office, 1996.
November 1996
Available for downloading at http://www.ed.gov/NCES/timss

3
With data on half a million students from 41 countries, the Third Interna-tional Mathematics and Science Study (TIMSS) is the largest, most compre-hensive, and most rigorous international study of schools and students ever.This report, Pursuing Excellence, is a synthesis of initial findings from TIMSSon U.S. eighth-grade mathematics and science education, providing a comparativepicture of education in the United States and the world that can be used to exam-ine our education system, scrutinize improvement plans, and evaluate proposedstandards and curricula. Subsequent TIMSS reports will examine U.S. mathemat-ics and science education for fourth and twelfth-grade students in an internationalcontext.
TIMSS is significant not only because of its scope and magnitude, but alsobecause of innovations in its design. In this international study, the NationalCenter for Education Statistics (NCES) combined multiple methodologies tocreate an information base that goes beyond simple student test score compari-sons and questionnaires to examine the fundamental elements of schooling. In-novative research techniques include analyses of textbooks and curricula, video-tapes, and ethnographic case studies. The result is a more complete andaccurate portrait of how U.S. mathematics and science education differsfrom that of other nations, with extended comparisons to Germany and Ja-pan.
The information in these reports can serve as a starting point for our efforts todefine a “world-class” education. If the U.S. is to improve the mathematics andscience education of its students, we must carefully examine not just how othercountries rank, but also how their polices and practices help student achieve.TIMSS shows us where U.S. education stands — not just in terms of test scores,but also what is included in textbooks, taught in schools, and learned bystudents. Examining these data provides a unique opportunity to shed new lighton education in the United States through the prism of other countries. Asthe same time, we should avoid the temptation to zero in on any one findingor leap to a conclusion without carefully considering the broader context.
This report is only the first of many NCES investigations into TIMSS data.Additional reports will be released throughout the coming year, includinglinkages of student achievement in U.S. states to achievement in the TIMSScountries, as well as findings on fourth and twelfth grade students. More-over, NCES plans to make TIMSS the most accessible international educa-tion study ever by releasing the data to scholars and the research commu-nity, and actively disseminating the findings to policymakers, educators,parents, and others concerned with quality education. Beginning with thisreport, NCES is releasing the information in a variety of new forms, includ-ing CD-ROM, videotape, and the World-Wide Web. Visit the NCES TIMSSwebsite at “http://www.ed.gov/NCES/timss” for further information.
CC OO MM MM II SS SS II OO NN EE RR ’ ’ SSSS TT AA TT EE MM EE NN TT

4
In all these efforts, our purpose is not just to take a snapshot of the present,but to develop a valuable resource for school improvement efforts. TIMSSclearly and accurately provides a wealth of useful data and information oncurriculum, instruction, teacher and student lives, and student achieve-ment. The investment in TIMSS can enhance the quality of our nation’smathematics and science education, and improve the performance of ourstudents to a more internationally competitive level.
Pascal D. Forgione Jr.Commissioner of Education Statistics

5
EXECUTIVE SUMMARY ................................................................................................................... 9
PREFACE ............................................................................................................................................. 12Key Points ....................................................................................... 1 2Overview ....................................................................................... 1 3Study design .................................................................................... 14The TIMSS research team ............................................................ 1 6Organization of this report ........................................................... 1 7
CHAPTER 1: ACHIEVEMENT ..................................................................................................... 18Key Points .................................................................................... 1 8How well do U.S. students do? .................................................... 1 9Some special notes on the test scores .......................................... 1 9Which countries outperform the U.S. in both subjects? .............................................................................. 2 3Which countries does the U.S. outperform in both subjects? ......................................................................... 2 4How do we compare to our major economic partners? ...................................................................................... 2 4How far behind the top countries are we? .................................. 2 5How do our best students compare with others’ best? ................................................................................. 2 5How does the U.S. mathematics and science gender gap compare to other countries’? .............................................. 2 6How do we score in the different content areas of mathematics and science? ............................................ 2 7What did prior studies show about how U.S. states compare to other countries? ............................................ 3 2Has U.S. international standing improved over time? .................................................................................... 3 2
CHAPTER 2: CURRICULUM ........................................................................................................ 34Key Points ..................................................................................... 3 4Who sets curriculum standards? .................................................. 3 5Is curriculum in the U.S. as focused as in other countries? ........................................................................... 3 6Is curriculum in the U.S. as advanced as in other countries? ...................................................................... 3 8How much time is spent in class? ................................................ 3 8
CHAPTER 3: TEACHING .............................................................................................................. 40Key Points ....................................................................................... 4 0How do mathematics teachers structure and deliver their lessons? ............................................................ 4 2Is the mathematical content of U.S. lessons as rich as that in Germany and Japan? ...................................... 4 4
TT A B L E O F C O N T E N T SA B L E O F C O N T E N T S
6
To what extent are the recommendations of the mathematics reform movement being implemented? ......................................................................... 4 6What do initial findings show about science teaching? .............................................................................. 4 7
CHAPTER 4: TEACHERS’ LIVES ....................................................................................................... 48Key Points ........................................................................................... 4 8Who teaches mathematics and science? ..................................... 4 9How do teachers spend their time? .............................................. 5 0How do teachers learn to teach? ................................................... 5 1What challenges do teachers face? ............................................... 5 3
CHAPTER 5: STUDENTS’ LIVES ..................................................................................................... 56Key Points ........................................................................................... 5 6What does the system require of students? ................................ 5 7How do students spend their time during school? ................... 6 0How much study do students do after school? .......................... 6 2What do students think about mathematics and science? ..... 6 5What do students do after school besides study? ..................... 6 6
CONCLUSIONS ................................................................................................................................. 68Key Points ........................................................................................... 6 8Where do we stand? ......................................................................... 6 9What have we learned about mathematics? ............................... 6 9What have we learned about science? ......................................... 7 0What have we learned about U.S. education as a whole? ....... 7 1Questions for further study ............................................................ 7 1TIMSS’ long-term utility to the nation ......................................... 7 2
WORKS CITED .................................................................................................................................... 73
APPENDIX 1: Additional TIMSS Reports .......................................................... 7 4
APPENDIX 2: Advisors to the U.S. TIMSS Study ........................................... 7 6
APPENDIX 3: National Average Scores and Standard Errors ..................... 7 8
APPENDIX 4: Summary of National Deviations fromInternational Study Guidelines ................................................ 7 9

7
L IL I S T S T O F F I G U R E S O F F I G U R E S
FIGURE 1: Nations’ Average Mathematics PerformanceCompared to the U.S. .................................................................... 2 0
FIGURE 2: Nations’ Average Science PerformanceCompared to the U.S. .................................................................... 2 1
FIGURE 3: Average Achievement of Nations Meeting, and NotMeeting International Guidelines ................................................ 2 2
FIGURE 4: Percent of Students from Selected Nations ScoringAmong the Top 10 Percent of Eighth-Gradersin the 41 TIMSS Countries .......................................................... 2 6
FIGURE 5: National Averages in Mathematics Content Areas .......................... 2 8
FIGURE 6: National Averages in Science Content Areas .................................... 3 0
FIGURE 7: Number of TIMSS Countries Determining Curriculumat Various Levels ............................................................................. 3 5
FIGURE 8: Hours of Mathematics and Science InstructionalTime Per Year for Eighth Graders ................................................. 3 9
FIGURE 9: Comparison of the Steps Typical of Eighth-GradeMathematics Lessons in Japan, the U.S., and Germany ............ 4 2
FIGURE 10: Average Percentage of Topics in Eighth-GradeMathematics Lessons that Are Stated or Developed .................. 4 4
FIGURE 11: Expert Judgments of the Quality of the MathematicalContent of Eighth-Grade Lessons ................................................ 4 5
FIGURE 12: Percentage of Mathematics Teachers of TIMSS StudentsReporting that Various Circumstances Limit TheirTeaching “Quite a Lot” or “A Great Deal” ............................... 5 2
FIGURE 13: Discipline Problems Eighth-Grade Principals Dealwith on a Daily Basis .................................................................. 5 4
FIGURE 14: Percent of Mathematics and Science TeachersWho Assign Homework 3-5 Times Per Week ......................... 6 2
FIGURE 15: Percent of Eighth-Graders Spending 3 orMore Hours in Various After-School Activitieson a Normal School Day ............................................................. 6 5

8

9
PREFPREFACEACE
The Third International Mathematicsand Science Study (TIMSS) is the larg-est, most comprehensive, and most rig-orous international comparison of edu-cation ever undertaken. During the1995 school year, the study tested themath and science knowledge of a half-million students from 41 nations at fivedifferent grade levels. In addition totests and questionnaires, it included acurriculum analysis, videotaped obser-vations of mathematics classrooms, andcase studies of policy issues.
■ TIMSS’ rich information allows usnot only to compare achievement,but also provides insights into howlife in U.S. schools differs from thatin other nations.
■ This report on eighth-grade studentsis one of a series of reports that willalso present findings on studentachievement at fourth grade, and atthe end of high school, as well as onvarious other topics.
ACHIEVEMENTACHIEVEMENT
One of our national goals is to be “firstin the world in mathematics and sci-ence achievement by the year 2000,”as President Bush and 50 governorsdeclared in 1989. Although we arefar from this mark, we are on a parwith other major industrialized na-tions like Canada, England, and Ger-many.
■ In mathematics, U.S. eighth grad-ers score below the international av-erage of the 41 TIMSS countries.Our students’ scores are not signifi-cantly different from those of En-gland and Germany.
■ In science, U.S. eighth gradersscore above the international av-erage of 41 TIMSS countries. Ourstudents’ scores are not signifi-cantly different from those ofCanada, England, and Germany.
■ In mathematics, our eighth-gradestudents’ standing is at about theinternational average in Algebra;Fractions; and Data Representa-tion, Analysis, and Probability. Wedo less well in Geometry; Measure-ment; and Proportionality.
■ In science, our eighth graders’standing is above the internationalaverage in Earth Science, Life Sci-ence, and Environmental Issues.Our students score about averagein Chemistry and Physics.
■ If an international talent search wereto select the top 10 percent of allstudents in the 41 TIMSS countries,in mathematics 5 percent of U.S.students would be included. In sci-ence 13 percent would be included.
CURRICULUMCURRICULUM
U.S. policy makers are concernedabout whether expectations for ourstudents are high enough, and inparticular whether they are as chal-lenging as those of our foreign eco-nomic partners. In all countries, therelationship between standards,teaching, and learning is complex.This is even more true in the U.S.,which is atypical among TIMSS coun-tries in its lack of a nationally definedcurriculum.
E X E C U T I V EE X E C U T I V ES U M M A R YS U M M A R Y

10
■ The content taught in U.S. eighth-grade mathematics classrooms isat a seventh-grade level in com-parison to other countries.
■ Topic coverage in U.S. eighth-grade mathematics classes is notas focused as in Germany andJapan.
■ In science, the degree of topic focus inthe U.S. eighth-grade curriculum maybe similar to that of other countries.
■ U.S. eighth graders spend morehours per year in math and scienceclasses than German and Japanesestudents.
TEACHINGTEACHING
In recent years, concern about the qual-ity of instruction in U.S. classroomshas led mathematics professional orga-nizations to issue calls for reform. How-ever, TIMSS data cannot tell us aboutthe success of these reform efforts forseveral reasons, including the fact thatthis assessment occurred too soon af-ter the beginning of the reform forstates and districts to have designedtheir own programs, retrained teach-ers, and nurtured a generation of stu-dents according to the new approach.Also, we do not have comparable ear-lier baseline information against whichto compare the findings from TIMSS.However, TIMSS includes the first large-scale observational study of U.S. teach-ing ever undertaken, and this can forma baseline against which future progressmay be judged.
■ U.S. mathematics classes require stu-dents to engage in less high-levelmathematical thought than classesin Germany and Japan.
■ U.S. mathematics teachers’ typi-cal goal is to teach students howto do something, while Japaneseteachers’ goal is to help them un-derstand mathematical concepts.
■ Japanese teachers widely practicewhat the U.S. mathematics reformrecommends, while U.S. teachers doso infrequently.
■ Although most U.S. math teachersreport familiarity with reform rec-ommendations, only a few apply thekey points in their classrooms.
TEACHERS’ LIVESTEACHERS’ LIVES
The training that teachers receive be-fore they enter the profession and theregular opportunities that they have foron-the-job learning and improvementof their teaching affect the quality ofthe teaching force. The collegial sup-port that teachers receive and the char-acteristics of their daily lives also af-fect the type of teaching they provide.
■ Unlike new U.S. teachers, new Japa-nese and German teachers undergolong-term structured apprentice-ships in their profession.
■ U.S. teachers have more college edu-cation than their colleagues in all buta few TIMSS countries.
■ Japanese teachers have more oppor-tunities to discuss teaching-relatedissues than do U.S. teachers.
■ Student diversity and poor disci-pline are challenges not only for U.S.teachers, but for German teachersas well.

11
STUDENTS’ LIVESSTUDENTS’ LIVES
The manner in which societies structurethe schooling process gives rise to differ-ent opportunities and expectations foryoung people. The motivators, supports,and obstacles to study in each countryare outgrowths of the choices providedby society and schools.
■ Eighth-grade students of differentabilities are typically divided into dif-ferent classrooms in the U.S., andinto different schools in Germany.In Japan, no ability grouping is prac-ticed at this grade level.
■ In mathematics, U.S. students inhigher ability-level classes study dif-ferent material than students inlower-level classes. In Germany andJapan, all students study basically thesame material, although in Germanythe depth and rigor of study dependson whether the school is for studentsof higher or lower ability levels.
■ Japanese eighth-graders are prepar-ing for a high-stakes examination toenter high school at the end of ninthgrade.
■ U.S. teachers assign more homeworkand spend more class time discuss-ing it than teachers in Germany andJapan. U.S. students report aboutthe same amount of out-of-schoolmath and science study as their Japa-nese and German counterparts.
■ Heavy TV watching is as commonamong U.S. eighth graders as it isamong their Japanese counterparts.
CONCLUSIONSCONCLUSIONS
This report presents initial findings fromTIMSS for eighth-grade mathematicsand science. A fuller understanding ofour nation’s educational health mustawait data from the fourth and twelfth-grade levels. The search for factors as-sociated with student performance iscomplicated because student achieve-ment after eight years of schooling is theproduct of many different factors. Fur-thermore, the U.S. education system islarge and decentralized with many in-terrelated parts. No single factor in iso-lation from others should be regardedas the answer to improving the perfor-mance of U.S. eighth-grade students.With these cautions in mind, this reportoffers the following insights into factorsthat may be associated with our stu-dents’ performance:
■ The content of U.S. eighth-grademathematics classes is not as chal-lenging as that of other countries,and topic coverage is not as focused.
■ Most U.S. mathematics teachers re-port familiarity with reform recom-mendations, only a few apply the keypoints in their classrooms.
■ Evidence suggests that U.S. teach-ers do not receive as much practicaltraining and daily support as theirGerman and Japanese colleagues.
TIMSS is not an answer book, but amirror through which we can see ourown education system in internationalperspective. Careful study of ournation’s reflection in the mirror of in-ternational comparisons will assisteducators, business leaders, teach-ers, and parents as they guide ournation in the pursuit of excellence.

12
P R E FP R E F A C EA C E
K E Y P O I N T S :
The Third International Mathematics and
Science Study (TIMSS) is the largest, most
comprehensive, and most rigorous international
comparison of education ever undertaken.
TIMSS’ rich information allows us not only to
compare achievement, but also to understand
how life in U.S. schools differs from that in other
nations.
This report on eighth-grade students is the first
of a series of reports that will present findings
on student achievement at the fourth grade, at
the end of high school, as well as on various
other topics.

13
OVERVIEWOVERVIEW
The Third International Mathematicsand Science Study is the largest andmost comprehensive comparative in-ternational study of education thathas ever been undertaken. A half-million students from 41 countrieswere tested in 30 different languagesat five different grade levels to com-pare their mathematics and scienceachievement. Intensive studies ofstudents, teachers, schools, curricu-lum, instruction, and policy issueswere also carried out to understandthe educational context in whichlearning takes place.
for reform in the teaching of their sub-jects. The National Council of Teachersof Mathematics published Curriculumand Evaluation Standards in 1989, andProfessional Standards for Teaching Math-ematics in 1991. In 1993 the AmericanAssociation for the Advancement of Sci-ence followed suit with Benchmarks forScience Literacy, and in 1996, the NationalAcademy of Sciences published NationalScience Education Standards.
TIMSS helps us measure progress to-ward our national goal of improving ourchildren’s academic performance inmathematics and science. But TIMSSis much more than a scorecard for themath and science events in the “edu-cational Olympics.” It is a diagnostictool to help us examine our nation’sprogress toward improvement of math-ematics and science education. It wasdesigned to look behind the scorecardto illuminate how our education poli-cies and practices compare to those ofthe world community.
TIMSS helps us answer the followingquestions about our nation’s mathemat-ics and science learning:
■ Are U.S. curricula and expectationsfor student learning as demandingas those of other nations?
■ Is the level of classroom instructionin the U.S. as high as that in othercountries?
■ Do U.S. teachers receive as muchsupport in their efforts to teach stu-dents as their colleagues in othernations?
■ Are U.S. students as focused on theirstudies as their international coun-terparts?
TIMSS is an important study for thoseinterested in U.S. education. In 1983,the National Commission on Excellencein Education pointed to our nation’s lowperformance in international studies asevidence that we were A Nation at Risk.In 1989, President Bush and the gover-nors of all 50 states adopted the Na-tional Goals for Education, one of whichwas that “by the year 2000, the U.S. willbe first in the world in mathematics andscience achievement.” Mathematics andscience experts have issued major calls
T I M S S C O U N T R I E ST I M S S C O U N T R I E S
AUSTRALIAAUSTRIABELGIUM (FLEMISH)BELGIUM (FRENCH)BULGARIACANADACOLOMBIACYPRUSCZECH REPUBLICDENMARKENGLANDFRANCEGERMANYGREECEHONG KONGHUNGARYICELANDIRAN, ISLAMIC REPUBLICIRELANDISRAELJAPAN
KOREAKUWAITLATVIALITHUANIANETHERLANDSNEW ZEALANDNORWAYPORTUGALROMANIARUSSIAN FEDERATIONSCOTLANDSINGAPORESLOVAK REPUBLICSLOVENIASOUTH AFRICASPAINSWEDENSWITZERLANDTHAILANDUNITED STATES

14
the 41 countries to make sure that theinstructions were properly followed. Theraw data from each country were scruti-nized to be sure that no anomalies ex-isted, and all analyses were doublechecked. Finally, this report has beenwritten and carefully reviewed to avoidover-generalization and inaccuracy.
STUDSTUDY DESIGNY DESIGN
TIMSS is the third comparison ofmathematics and science achievementcarried out by the International Asso-ciation for the Evaluation of Educa-tional Achievement (IEA). PreviousIEA studies of mathematics and sci-ence were conducted for each subjectseparately at various times during the1960s, 1970s, and 1980s. This is thefirst time that IEA has assessed bothmathematics and science in the samestudy. Comparative studies of othersubjects, including reading literacy(1992)11, and computers in education(1993)22 have also been published by theIEA.
TIMSS was designed to focus on stu-dents at three different stages of school-ing: midway through elementary school,midway through lower secondary school,and at the end of upper secondaryschool. Because countries around theworld set different ages at which chil-dren should begin school, decisionsabout which students should be testedneeded to take both age and grade levelinto account. The populations testedare listed below. Participation in Popu-lation 2 was required of all TIMSS na-tions, but participation in Populations1 and 3 was optional.
This report draws from the many reportsand parts of the TIMSS study to summa-rize the initial findings concerning achieve-ment and schooling in the eighth grade.It is part of the first of three waves ofTIMSS reports. It will be followed in thenext year by a series of reports focusingon the fourth grade, then by a series fo-cusing on the last year of high school.Additional reports on selected topics willbe published over the next several years.Much more will be learned as furtheranalysis of the eighth grade data is car-ried out and findings from grades four andtwelve are added.
TIMSS is a fair and accurate compari-son of mathematics and scienceachievement in the participating na-tions. It is not a comparison of “all ofour students, with other nations’ best,”a charge which some critics have lev-eled at previous international compari-sons. The students who participatedin TIMSS were randomly selected torepresent all students in their respec-tive nations. The entire assessmentprocess was scrutinized by internationaltechnical review committees to ensureits adherence to established standards.Those nations in which irregularitiesarose are clearly noted in this and otherTIMSS reports.
At each step of its development, TIMSSused careful quality control procedures.An international curriculum analysis wascarried out prior to the development ofthe assessments to ensure that the testsreflect the math and science curriculaof the variety of TIMSS countries anddo not over-emphasize what is taughtin only a few. International monitorscarefully checked the test translationsand visited many classrooms while thetests were being administered in each of

15
■ Population 1 - those students enrolledin the pair of adjacent grades thatcontained the most nine-year-olds.(Grades 3 and 4 in the U.S. and mostof the world. Grades 2 and 3 in afew nations.)
■ Population 2 - those students in thepair of adjacent grades that con-tained the most thirteen-year-oldsat the time of testing. (Grades 7 and8 in the U.S. and most of the world.Grades 6 and 7 in a few nations.)
■ Population 3 - students in their fi-nal year of secondary school, what-ever their age. (Grade 12 in the U.S.and most nations. Grades 9-13 insome nations.)
In all countries, students in both publicand private schools received the TIMSStest. In all but a few of the 41 TIMSScountries, virtually all population 1 and2 children are enrolled in school andwere therefore eligible to take the test.Testing occurred 2 to 3 months beforethe end of the 1995-96 school year. Stu-dents with special needs and disabilitieswhich would make it difficult for themto take the test were excused from theassessment. In each country, the testwas translated into the primary languageor languages of instruction. All testingin the U.S. was done in the English lan-guage.
TIMSS includes five different parts: as-sessments, questionnaires, curriculumanalyses, videotapes of classroom in-struction, and case studies of policy top-ics. The study was designed to bring avariety of different and complementaryresearch methods to bear on importantpolicy questions. The use of multiplemethodologies has three major benefits.First, it strengthens the conclusions ofthe study because researchers are ableto cross-check key findings by compar-
ing results based on different researchmethods. Second, it provides broaderinformation because more differenttypes data are gathered than can be ac-quired through a single method or in-strument. Third, the use of multiplemethodologies enriches understandingof the contextual meaning of key find-ings. Each of the five parts on its ownrepresents an important advance in itsfield. Taken together, they provide anunprecedented opportunity to under-stand U.S. mathematics and science edu-cation from a new and richer perspec-tive.
At population 2, all 41 TIMSS coun-tries participated in the following threeIEA-sponsored parts of the study:
■ Math and science assessments - Oneand a half hours in length, the as-sessments included both multiple-choice and free-response items. Asmaller number of students alsocompleted “hands-on” performanceassessments, to be reported later.
■ School, teacher, and student ques-tionnaires - Students answeredquestions about their mathematicsand science studies and beliefs.Teachers answered questions ontheir beliefs about math and sci-ence and on teaching practices.School administrators answeredquestions about school policiesand practices.
■ Curriculum analysis - This ex-ploratory study compared math-ematics and science curriculumguides and textbooks. It studiedsubject-matter content, sequenc-ing of topics, and expectations forstudent performance.

16
In conjunction with these three activi-ties, the United States sponsored twoadditional parts of TIMSS, which werecarried out in Germany, Japan, and theU.S. These three countries are all eco-nomic superpowers with close eco-nomic and political ties. They also arenations whose educators have learneda great deal from each other in the past,and whose school systems are both simi-lar to and different from each other inimportant ways. The TIMSS research-ers in Germany, Japan, and U.S. collabo-rated in sharing their assessment andquestionnaire data, and in carrying outthe following two parts of the study:
■ Videotapes of mathematics instruc-tion - In the U.S. and Germany, halfof the eighth-grade mathematicsclassrooms that participated in themain TIMSS study were randomlychosen to be filmed. In Japan, aneighth-grade classroom in a randomsample of 50 of the TIMSS schoolswas chosen to be videotaped. In allthree countries teachers were filmedteaching a typical lesson, and thesetapes were analyzed to compareteaching techniques and the qualityof instruction.
■ Ethnographic case studies of keypolicy topics - A team of 12 bilin-gual researchers each spent threemonths in Germany, Japan, or theU.S. observing classrooms and inter-viewing education authorities, prin-cipals, teachers, students, and par-ents. Topics of study were educationstandards, methods of dealing withindividual differences, the lives andworking conditions of teachers, andthe role of school in adolescents’ lives.
More detail on the findings and meth-odology of each of these parts of TIMSS
can be found in the additional reportslisted in Appendix 1.
THE TIMSS RESEARCH TEAMTHE TIMSS RESEARCH TEAM
TIMSS was conducted by the IEA,which is a Netherlands-based organi-zation of ministries of education andresearch institutions in its membercountries. The IEA delegated respon-sibility for overall coordination andmanagement of the TIMSS study toProfessor Albert Beaton at the TIMSSInternational Study Center, located atBoston College. Each of the 41 IEAmember-nations that made the deci-sion to participate in TIMSS paid forand carried out the data collection inits own country according to the in-ternational guidelines. The costs of theinternational coordination were paidby the National Center for EducationStatistics of the U.S. Department ofEducation (NCES), the National Sci-ence Foundation (NSF), and the Cana-dian Government.
TIMSS in the United States was alsofunded by NCES and NSF. ProfessorWilliam Schmidt of Michigan State Uni-versity was the U.S. National ResearchCoordinator. Policy decisions on thestudy were made by the U.S. NationalCoordinating Committee, composed ofWilliam Schmidt, Larry Suter of NSF,and Jeanne Griffith, Eugene Owen, andLois Peak of NCES. Lois Peak moni-tored the international and U.S. TIMSSdata collections. The U.S. data collec-tion was carried out by Westat, a pri-vate survey research firm. Trevor Will-iams and Nancy Caldwell were Westatproject co-directors. Professor JamesStigler at UCLA managed the TIMSSvideotape study of mathematics instruc-

17
tion, and Professor Harold Stevenson atthe University of Michigan managed theTIMSS ethnographic case studies. Themany advisors to the study are listed inAppendix 2.
The U.S. TIMSS team also includes thenearly 4,000 seventh and 7,000 eighthgraders who took the assessment, andtheir principals and teachers in morethan 180 schools nationwide. Their co-operation has made this report possible.Third, fourth, and twelfth graders alsotook different TIMSS tests, and find-ings from these parts of the study willbe reported during the next year.
ORGANIZAORGANIZATION OF THIS REPORTTION OF THIS REPORT
This report summarizes early findingsfrom the eighth-grade data based onresults from all five parts of the TIMSSstudy. Both seventh and eighth gradestudents took the TIMSS test, but thisinitial report focuses on findings forthe eighth grade. Future reports basedon a more complete and extensiveanalysis of the data will provide deeperunderstanding and investigate relation-ships between the findings from thedifferent parts of the study. Scienceteacher questionnaire data used in thisreport are based on preliminary weightswhich will be further refined in subse-quent reports. Extensive documentationof the data collection methodologies andstatistical analyses used in this report areavailable from NCES, and will be pub-lished separately.
This report combines the major find-ings from each of the five parts of thestudy into a single story about U.S.eighth-grade mathematics and scienceachievement in comparative perspective.
In some respects, results for mathemat-ics and science are similar. The reportfocuses more on mathematics for tworeasons. First, the way in which the sub-ject is taught makes it easier to compareacross countries. Second, TIMSS con-tains more data about mathematics be-cause the videotapes of classroom in-struction were conducted only in thissubject. Discussion of findings noteswhere the results in science differfrom those in math. This report de-scribes the U.S. against the backdropof the 41 TIMSS countries, with a spe-cial attention to comparisons withGermany and Japan, because wehave more information on thesecountries.
Chapter 1 draws from the results ofthe student assessments to describe howU.S. students perform in mathematicsand science. Succeeding chapters fo-cus on factors which may have an im-portant influence on achievement, anddescribe how our nation’s schools,teachers, and students compare to thosein other countries. Chapter 2 exam-ines educational standards and the cur-riculum, based on data from the cur-riculum analysis, case studies, video-tape study, and questionnaires.Chapter 3 focuses on how teachersactually teach that curriculum, drawingfrom results of the videotape study andquestionnaires. Chapter 4 examines theworking life of teachers, based uponfindings from the case studies and ques-tionnaires. Chapter 5 describes the livesof students, both in and out of school,based upon case study and questionnairedata. The Conclusions at the end of thereport looks across all of the findings forinsights about factors associated withstudent performance and indicates ques-tions for further study.

18
KEY POINTS:KEY POINTS:
U.S. eighth graders score below average in
mathematics achievement and above average in
science achievement, compared to the 41
nations in the TIMSS assessment.
In mathematics, our eighth-grade students’
international standing is stronger in Algebra and
Fractions than in Geometry and Measurement.
In science, our eighth graders’ international
standing is stronger in Earth Science, Life
Science, and Environmental Issues than in
Chemistry and Physics.
The U.S. is one of 11 TIMSS nations in which
there is no significant gender gap in eighth-
grade math and science achievement.
C H A P T E R 1 :C H A P T E R 1 :A C H I E V E M E N TA C H I E V E M E N T
19
In the past, the mathematics and scienceachievement of U.S. students has causednation-wide cries for improvement. Vari-ous international studies of these sub-jects conducted over the past thirty yearshave shown that our eighth graders havenot performed as well as we expect, incomparison to their peers in other na-tions. U.S. students are not weak in allsubjects, however. In a recent IEA studyof reading literacy3, U.S. eighth graderswere among the best in the world. In-deed, TIMSS shows that U.S. eighthgrade students also scored better thanthe average of the 41 participating coun-tries in science. The results in math-ematics, however, put our nation belowaverage compared to the other nations.
HOW WELL DO UHOW WELL DO U.S. STUDENTS.S. STUDENTSDO?DO?
Compared to their international coun-terparts, U.S. students are somewhatbelow the international average of 41TIMSS countries in mathematics. Inscience, our students are somewhatabove the international average. Fig-ures 1 and 2 on pages 20 and 21 showhow U.S. students perform in these sub-jects.
Tempting as it may be, it is not correct toreport U.S. scores by rank alone, aswould be the case if one were to saythe U.S. is “number x in mathemat-ics out of the 41 TIMSS countries.”This is because the process of esti-mating each country’s score from thesample of students who took the testproduces only an estimate of therange within which the country’s realscore lies. This margin of error is ex-pressed as a “plus or minus” intervalaround the estimated score. In TIMSS,we can say with 95 percent confi-
dence that comparisons of other coun-tries to the U.S. are accurate plus orminus about 20 points, depending onthe size and design of the sample in theother countries. Comparisons of theU.S. to the international average areaccurate plus or minus about 10 points.(Appendix 3 contains a list of standarderrors). Because the precise score can-not be determined with perfect accuracy,to fairly compare the U.S. to other coun-tries, nations have been grouped intobroad bands according to whethertheir performance is higher than, notsignificantly different from, or lowerthan the U.S.
In mathematics, students in 20 coun-tries outperform our eighth graders.Students in 13 countries are not sig-nificantly different than ours, and U.S.students outperform their counterpartsin 7 nations. In science, students in 9nations outperform U.S. eighth grad-ers, performance in 16 other nations isnot statistically different than ours, andwe outperform another 15 nations.
SOME SPECIAL NOSOME SPECIAL NOTES ON THETES ON THETEST SCORESTEST SCORES
TIMSS required participating nations toadhere to extremely high technical stan-dards at all stages of participation inthe project. Many nations experiencedsome difficulty in this respect. In twonations, difficulties in meeting the stan-dards were so severe that internationalmonitors decided that their data shouldnot be included in the report, and sofindings are reported only for the remain-ing 41 nations. Of the 41 nations, 25met or came close to meeting all tech-nical standards for the study. However,16 nations experienced difficulties ofvarious types. In some countries, these

20
difficulties arose because a large propor-tion of schools, teachers, or students de-clined to take the test. In others, theselection of schools or classrooms wasnot carried out according to interna-tional plan. In still others, students were
slightly older than the international tar-get age. The names of those nations inwhich major difficulties arose are shownin parentheses in the figures in this re-port, and Appendix 4 describes any de-viations from international specifica-
FIGURE 1:FIGURE 1:NNAATIONSTIONS’ A’ AVERAGEVERAGE M MAATHEMATHEMATICSTICS P PERFORMANCEERFORMANCE C COMPOMPAREDARED TTOO THETHE U U.S.S..
NATIONS WITH AVERAGE SCORESNOT SIGNIFICANTLY DIFFERENT
FROM THE U.S.
NANATIONTION AVERAGEAVERAGE
(THAILAND) 522
(ISRAEL) * 522
(GERMANY) *O 509
NEW ZEALAND 508
ENGLAND *O 506
NORWAY 503
(DENMARK) 502
UNITED STATES O 500
(SCOTLAND) 498
LATVIA (LSS) O 493
SPAIN 487
ICELAND 487
(GREECE) 484
(ROMANIA) 482
NOTES:1. Nations not meeting international guidelines are shown in parentheses.2. Nations in which more than 10 percent of the population was excluded from testing are shown with a *. Latvia is
designated LSS because only Latvian-speaking schools were tested, which represents less than 65 percent of thepopulation.
3. Nations in which a participation rate of 75 percent of the schools and students combined was achieved only afterreplacements for refusals were substituted, are shown with a o.
4. The international average is the average of the national averages of the 41 nations.5. The country average for Sweden may appear to be out of place; however, statistically, its placement is correct.
NANATIONTION AVERAGEAVERAGE
SINGAPORE 643
KOREA 607
JAPAN 605
HONG KONG 588
BELGIUM-FLEMISH O 565
CZECH REPUBLIC 564
SLOVAK REPUBLIC 547
SWITZERLAND O 545
(NETHERLANDS) 541
(SLOVENIA) 541
(BULGARIA) 540
(AUSTRIA) 539
FRANCE 538
HUNGARY 537
RUSSIAN FEDERATION 535
(AUSTRALIA) 530
IRELAND 527
CANADA 527
(BELGIUM-FRENCH) 526
SWEDEN 519
NATIONS WITH AVERAGE SCORESSIGNIFICANTLY HIGHER THAN THE U.S.
IINTERNANTERNATIONALTIONAL A AVERAGEVERAGE= 513= 513
SOURCE: Beaton et al. (1996) Mathematics achievementin the middle school years. Table 1.1. Boston College: Chest-nut Hill, MA.
(continued on page 23)
NANATIONTION AVERAGEAVERAGE
LITHUANIA * 477
CYPRUS 474
PORTUGAL 454
IRAN, ISLAMIC REPUBLIC 428
(KUWAIT) 392
(COLOMBIA) 385
(SOUTH AFRICA) 354
NATIONS WITH AVERAGE SCORESSIGNIFICANTLY LOWER THAN THE U.S.

21
NATIONS WITH AVERAGE SCORESSIGNIFICANTLY LOWER THAN THE U.S.
NANATIONTION AVERAGEAVERAGE
SPAIN 517
FRANCE 498
(GREECE) 497
ICELAND 494
(ROMANIA) 486
LATVIA (LSS) O 485
PORTUGAL 480
(DENMARK) 478
LITHUANIA * 476
(BELGIUM-FRENCH) 471
IRAN, ISLAMIC REPUBLIC 470
CYPRUS 463
(KUWAIT) 430
(COLOMBIA) 411
(SOUTH AFRICA) 326
IINTERNANTERNATIONALTIONAL A AVERAGEVERAGE= 516= 516
NOTES:1. Nations not meeting international guidelines are shown
in parentheses.2. Nations in which more than 10 percent of the popu-
lation was excluded from testing are shown with a *.Latvia is designated LSS because only Latvian-speakingschools were tested, which represents less than 65percent of the population.
3. Nations in which a participation rate of 75 percent ofthe schools and students combined was achieved onlyafter replacements for refusals were substituted, areshown with a o.
4. The international average is the average of the nationalaverages of the 41 nations.
5. The country average for Scotland (or Spain) may ap-pear to be out of place; however, statistically, its place-ment is correct.
SOURCE: Beaton et al. (1996) Science achievement inthe middle school years. Table 1.1. Boston College: Chest-nut Hill, MA.
NATIONS WITH AVERAGE SCORESNOT SIGNIFICANTLY DIFFERENT
FROM THE U.S.
NANATIONTION AVERAGEAVERAGE
ENGLAND *O 552
BELGIUM-FLEMISH O 550
(AUSTRALIA) 545
SLOVAK REPUBLIC 544
RUSSIAN FEDERATION 538
IRELAND 538
SWEDEN 535
UNITED STATES O 534
(GERMANY) *O 531
CANADA 531
NORWAY 527
NEW ZEALAND 525
(THAILAND) 525
(ISRAEL) * 524
HONG KONG 522
SWITZERLAND O 522
(SCOTLAND) 517
FIGURE 2:FIGURE 2:NNAATIONSTIONS’ A’ AVERAGEVERAGE S SCIENCECIENCE P PERFORMANCEERFORMANCE C COMPOMPAREDARED TTOO THETHE U U.S.S..
NANATIONTION AVERAGEAVERAGE
SINGAPORE 607
CZECH REPUBLIC 574
JAPAN 571
KOREA 565
(BULGARIA) 565
(NETHERLANDS) 560
(SLOVENIA) 560
(AUSTRIA) 558
HUNGARY 554
NATIONS WITH AVERAGE SCORESSIGNIFICANTLY HIGHER THAN THE U.S.
22
NNAT IONAT ION MM ATHATH SSCIENCEC IENCE
AVERAGE AVERAGE
AUSTRALIA 530 545
AUSTRIA 539 558
BELGIUM-FRENCH 526 471
BULGARIA 540 565
NETHERLANDS 541 560
SCOTLAND 498 517
FIGURE 3:FIGURE 3:AAVERAGEVERAGE A ACHIEVEMENTCHIEVEMENT OFOF N NAATIONSTIONS M MEETINGEETING,,ANDAND N NOOTT M MEETINGEETING, I, INTERNANTERNATIONALTIONAL G GUIDELINESUIDELINES
Notes:1. Nations in which more than 10 percent of the popula-
tion was excluded from testing are shown with a *. Latviais designated LSS because only Latvian-speaking schoolswere tested, which represents less than 65 percent ofthe population.
2. Nations in which a participation rate of 75 percent ofthe schools and students combined was achieved onlyafter replacements for refusals were substituted, areshown with a o.
3. The international average is 527 for both mathematicsand science. This is the average of the national averages ofthe 25 countries meeting international guidelines.
4. The international average based on all 41 countries listedis 513 for mathematics and 516 for science.
Source: Beaton et al. (1996) Mathematics achievementin the middle school years. Table 1.1. Boston College: Chest-nut Hill, MA., and Beaton et al. (1996) Science achievementin the middle school years. Table 1.1. Boston College: Chest-nut Hill, MA.
NNAATIONTION MMAATHTH SSCIENCECIENCE
AVERAGE AVERAGE
BELGIUM-FLEMISH O 565 550
CANADA 527 531
CYPRUS 474 463
CZECH REPUBLIC 564 574
ENGLAND *O 506 552
FRANCE 538 498
HONG KONG 588 522
HUNGARY 537 554
ICELAND 487 494
IRAN, ISLAMIC REPUBLIC 428 470
IRELAND 527 538
JAPAN 605 571
KOREA 607 565
LATVIA (LSS) O 493 485
LITHUANIA * 477 476
NEW ZEALAND 508 525
NORWAY 503 527
PORTUGAL 454 480
RUSSIAN FEDERATION 535 538
SINGAPORE 643 607
SLOVAK REPUBLIC 547 544
SPAIN 487 517
SWEDEN 519 535
SWITZERLAND O 545 522
UNITED STUNITED STAATESTES OO 500500 534534INTERNAINTERNATIONALTIONALAVERAGE =AVERAGE = 527527 527527
COUNTRIES COMPLYINGWITH SPECIFICATIONS
COUNTRIES WITH LOWPARTICIPATION RATES
NNAT IONAT ION MM ATHATH SSCIENCEC IENCE
AVERAGE AVERAGE
COLOMBIA 385 411
GERMANY 509 531
ROMANIA 482 486
SLOVENIA 541 560
COUNTRIES TESTINGOLDER-THAN-SPECIFIED STUDENTS
NNAT IONAT ION MM ATHATH SSCIENCEC IENCE
AVERAGE AVERAGE
DENMARK 502 478
GREECE 484 497
THAILAND 522 525
COUNTRIES WITH NON-STANDARDSELECTION OF CLASSROOMS
NNAT IONAT ION MM ATHATH SSCIENCEC IENCE
AVERAGE AVERAGE
ISRAEL 522 524
KUWAIT 392 430
SOUTH AFRICA 354 326
COUNTRIES WITH NON-STANDARDSELECTION OF CLASSROOMS AND
OTHER DEPARTURES FROM GUIDELINES

23
tions that occurred. It should be keptin mind that we cannot have the sameamount of confidence in the scores ofthe 16 nations in which major difficul-ties arose.
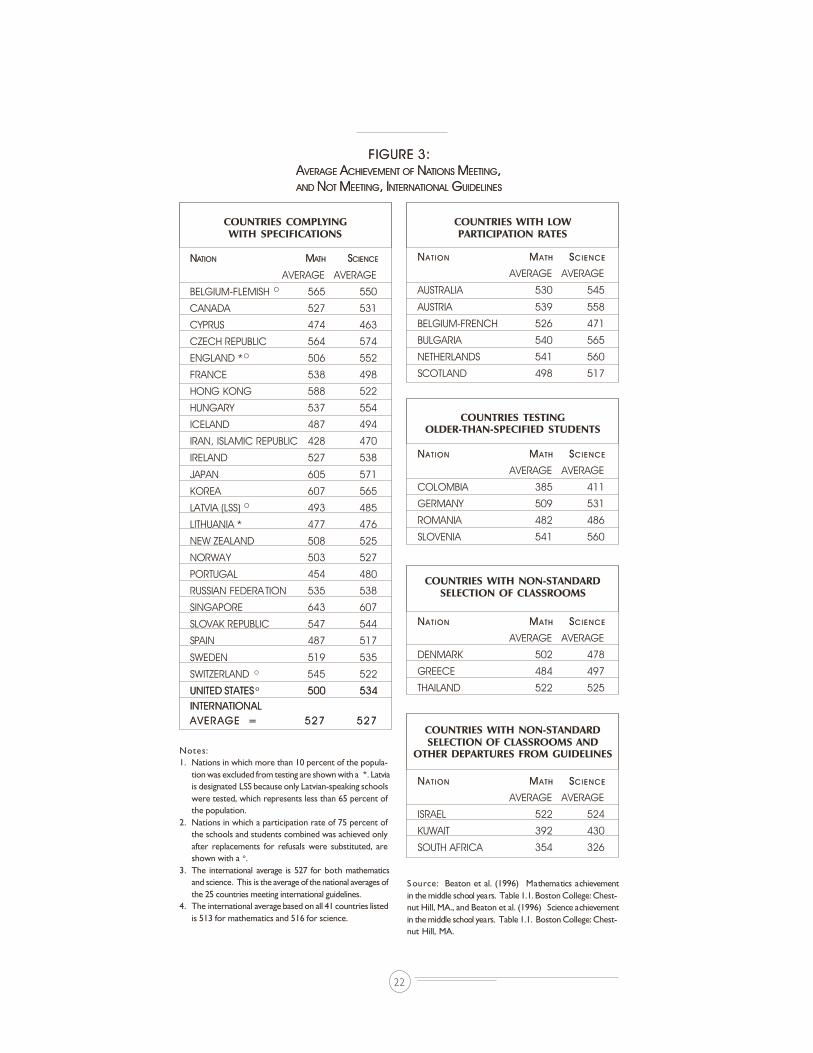
If the international average is calcu-lated only from the 25 countries inwhich no major difficulties arose incarrying out the international speci-fications, the U.S. mathematicsscore is still below the internationalaverage. In science, however, ourscore is no longer significantly dif-ferent from the average of the 25 na-tions. Our comparative position inscience becomes lower because manyof the countries who are removed fromconsideration are those that we out-performed. Figure 3 on page 22 showsour mathematics and science standingin comparison to these 25 nations, andthe types of anomalies that occurred inthe other 16 countries. The differencein U.S. standing between Figure 3 andthe previous figures demonstrates thatthe selection of countries against whichthe U.S. is compared can change our in-ternational standing.
Which comparison should we empha-size as TIMSS’ main finding – the com-parison to 25 countries, or to 41?NCES has chosen as the primary find-ing our standing with respect to 41countries because the internationalTIMSS reports present the results interms of all 41 nations.
What do the test scores mean? Due tothe complex nature of the TIMSS testdesign, scoring, and analysis, a score of600 does not mean either 600 items, or60 percent correct. One can interpretthe scores by considering where they fallalong the range of scores from 0 to 1000of other eighth-grade students who tookthe test. In mathematics, a score of 656would put a student in the top 10 per-cent of all students in the 41 TIMSScountries, and a score of 587 would puta student in the top 25 percent. In math-ematics, 509 was the average studentscore. In science, a score of 655 wouldput a student in the top 10 percent, ascore of 592 would put a student in thetop 25 percent, and 522 was the aver-age student score.
WHICH COUNTRIESWHICH COUNTRIESOUTPERFORM THE UOUTPERFORM THE U.S. IN BO.S. IN BOTHTHSUBJECTS?SUBJECTS?
We can say with confidence that fivenations outperformed us in both math-ematics and science. They are:
■ Three Asian nations - Singapore,Korea, and Japan.
■ Two Central European nations -Czech Republic and Hungary.
The Netherlands, Austria, Slovenia, andBulgaria also outperformed us in bothsubjects, but because these countriesdid not carry out TIMSS according tostrict international standards, we canbe less certain about their scores.These nine countries were the only onesthat outperformed us in science, andthey were also among the 20 countriesthat outperformed us in mathematics.

24
WHICH COUNTRIES DOES THE UWHICH COUNTRIES DOES THE U .S..S.OUTPERFORM IN BOOUTPERFORM IN BO TH SUBJECTS?TH SUBJECTS?
We can say with confidence that theU.S. outperformed four countries inboth mathematics and science:
■ Three European countries -Lithuania, Cyprus, and Portugal.
■ One Middle Eastern country - Iran.
The U.S. also outperformed Kuwait, Co-lombia, and South Africa in both sub-jects, but due to deviations in their ad-ministration of TIMSS, we have lessconfidence in their scores. These sevencountries were the only ones that weoutperformed in mathematics, andthey were also among the 15 countriesthat we outperformed in science.
HOW DO WE COMPHOW DO WE COMP ARE TARE TO OURO OURMAJOR ECONOMIC PMAJOR ECONOMIC P ARTNERS?ARTNERS?
The “Group of Seven” or G-7 countriesare major U.S. economic and politicalallies. The other six nations in this groupare the United Kingdom, France, Ger-many, Canada, Japan, and Italy. Italydid not administer the TIMSS test, sothe U.S. can only be compared to theremaining five. The United Kingdomincludes England, Scotland, NorthernIreland, and Wales. Northern Irelandand Wales did not participate in TIMSS,and England and Scotland both have thesame international standing in compari-son to the U.S. Therefore, in this sec-tion, we describe our standing in rela-tion to England.
In mathematics, Japan, France, andCanada outperform the U.S., while ourscores are not significantly different from
those of England and Germany. In sci-ence, we score lower than Japan; werenot significantly different than England,Canada, and Germany; and score higherthan France. Considering our stand-ing in relation to these five major eco-nomic partners, it can be said that theU.S. is in the bottom half in math-ematics, and about the middle in sci-e n c e .
Among the G-7 countries, Germany isthe only nation which appears in pa-rentheses, indicating problems in theimplementation of the internationalguidelines for carrying out the study.In Germany, the problem was a discrep-ancy in the age of the students tested.Because German children start schoolsomewhat later than children in othercountries, the average age of the Ger-man eighth-graders who took theTIMSS test was about four monthsolder than the international target age.Some would say that this means thatother nations’ eighth graders should becompared with Germany’s seventh grad-ers for a better age comparison. How-ever, this provides a less-than-ideal gradecomparison.
In a grade-based comparison, thereis no significant difference betweenGerman and U.S. eighth graders. Ifwe were to approximate an age-basedcomparison by matching the scoresof our eighth graders to those of Ger-man seventh graders, our eighthgraders do significantly better. Bothcomparisons are useful because mostexperts believe that achievement isbased partly on cognitive maturationwhich comes with age, and partly onyears of study which come with gradein school.

25
HOW FHOW FAR BEHIND THE TAR BEHIND THE T OPOPCOUNTRIES ARE WE?COUNTRIES ARE WE?
Particularly in mathematics, our stu-dents are far behind Singapore andJapan which are among the top-scor-ing nations in the world in both mathand science. One way to compare twonations’ scores is by considering theircomparative standing with relation tothe international percentiles. In math-ematics, the scores of our very best U.S.eighth graders, who perform at the 95th
percentile for our nation, are not signifi-cantly different than the scores of aver-age eighth graders in Singapore, who per-form at their nation’s 50th percentile. Incomparison to Japan, the scores of ourbest students, who are at the 95th per-centile for our nation, are significantlybelow the scores of the top quarter ofJapanese students, who perform at theirnation’s 75th percentile.
In science, the gap is not so large. Stu-dents at the U.S. 95th percentile aresignificantly better than students at the75th percentile in Singapore. In com-parison to Japan, there is no significantdifference between U.S. and Japanesestudents at the 95th percentile.
Another way to estimate distance be-tween the U.S. and top scoring coun-tries is to use the difference between ourseventh and our eighth graders as a unitof measure. In mathematics, the differ-ence between our seventh and eighthgraders’ scores was 24 points. The differ-ence between the scores of eighth grad-ers in the U.S. and in Singapore was 143points. This means that the differencein eighth-grade mathematics perfor-mance between the two countries is al-most six times the difference between U.S.seventh and eighth graders. The differ-
ence between U.S. and Japanese eighthgraders’ mathematics performance isabout four times this difference.
In science, the gap is smaller, but stillsubstantial. The difference between U.S.seventh and U.S. eighth graders’ scoresis 26 points. The difference between thescores of the U.S. and Singapore was 73points. The difference in science per-formance between eighth graders in theU.S. and Singapore is almost three timesthe difference between our seventh andeighth graders. The difference betweenU.S. and Japanese eighth graders’ sci-ence performance is almost one and ahalf times this difference.
HOW DO OUR BEST STUDENTSHOW DO OUR BEST STUDENTSCOMPCOMPARE WITH OARE WITH O THERS’ BEST?THERS’ BEST?
Comparisons of averages tell us howtypical students perform, but they donot tell us about the performance ofour nation’s best students - those whoare likely to become the next genera-tion of mathematicians, scientists,doctors, and engineers. If an interna-tional talent search were to select thetop ten percent of all students inthe 41 TIMSS countries combined,what percentage of U.S. studentswould be included?
In mathematics, 5 percent of U.S.eighth graders would be selected.High-scoring nations would have moreof their students represented in the “in-ternational top ten percent.” Figure 4on page 26 shows that 45 percent of allSingaporean students and 32 percent ofall Japanese students would be chosenin the international talent search inmathematics. In science, 13 percent

26
of U.S. students would be selected, incomparison to 31 percent ofSingaporean students and 18 percent ofJapanese students.
If the international talent search wereto lower its standards considerably tochoose the top half of all students inthe 41 TIMSS countries, 94 percent ofeighth graders in Singapore and 83 per-cent in Japan would be selected inmathematics, compared to 45 percentof eighth graders in the U.S. In sci-ence, 82 percent of the students inSingapore and 71 percent of studentsin Japan would be selected, comparedto 55 percent in the U.S.
HOW DOES THE UHOW DOES THE U.S..S.MAMATHEMATHEMATICS AND SCIENCETICS AND SCIENCEGENDER GAP COMPGENDER GAP COMPARE TARE TOOOOTHER COUNTRIES’?THER COUNTRIES’?
In the U.S. and in other countries,policy makers have made great effortsto make math and science more acces-sible to girls, and to encourage genderequity in these subjects. More TIMSScountries have achieved gender equityin their students’ scores in mathemat-ics than in science. The U.S. is one of11 TIMSS nations in which there isno significant gender gap in eighth-grade mathematics and scienceachievement. The U.S. was one of 33countries in which there was no statisti-cally significant difference between theperformance of eighth-grade boys and
FIGURE 4:FIGURE 4:PPERCENTERCENT OFOF S STUDENTSTUDENTS FROMFROM S SELECTEDELECTED
NNAATIONSTIONS S SCORINGCORING A AMONGMONG THETHE T TOPOP 10 10PPERCENTERCENT OFOF E EIGHTHIGHTH G GRADERSRADERS ININ THETHE 41 41
TIMSS CTIMSS COUNTRIESOUNTRIES
Source: Beaton et al. (1996) Mathematics achievementin the middle school years. Table 1.4. Boston College: Chest-nut Hill, MA., and Beaton et al. (1996) Science achievementin the middle school years. Table 1.4. Boston College: Chest-nut Hill, MA.
45
31
34
18
32
18
19
11
10
11
7
17
9
6
5
13
7
1
14
18
0 5 10 15 20 25 30 35 40 45 50
SINGAPORESINGAPORE
KOREAKOREA
JAPJAPANAN
CZECHCZECHREPUBLICREPUBLIC
HUNGARYHUNGARY
RUSSIANRUSSIANFEDERAFEDERATIONTION
FRANCEFRANCE
GERMANYGERMANY
UNITEDUNITEDSTSTAATESTES
CANADACANADA
ENGLANDENGLAND
7
11
MMAATHEMATHEMATICSTICS
SSCIENCECIENCE

27
girls in mathematics. In science, we wereone of 11 nations with no statisticallysignificant difference. All 11 nationswith no significant different in sciencealso demonstrated no difference in math-ematics. They are the United States,Singapore, the Russian Federation, Thai-land, Australia, Ireland, Romania, Flem-ish Belgium, Cyprus, Columbia, andSouth Africa.
HOW DO WE SCORE IN THEHOW DO WE SCORE IN THEDIFFERENT CONTENT AREAS OFDIFFERENT CONTENT AREAS OFMAMATHTHEMAEMATICSTICS AND SCIENCE? AND SCIENCE?
Representing student achievement inmathematics and science as a totalscore is a useful way to summarizeachievement. However, mathematicsand science contain different contentareas, which are emphasized and se-quenced differently in curricula aroundthe world. Based on these national pri-orities, in each country, some contentareas have been studied more than oth-ers at a particular grade level.
The TIMSS eighth-grade mathematicstest included sets of items designed tosample students’ ability to do work inthe following areas:
■ Algebra (patterns, relations, expres-sions, equations).
■ Data Representation, Analysis, and Prob-ability (representation and analysisof data using charts and graphs in-volving uncertainty and probability).
■ Fractions and Number Sense (fractions,decimals, percentages, estimation androunding).
.
■ Geometry (visualization and proper-ties of geometric figures, includingsymmetry, congruence, and similar-ity).
■ Measurement (units of length, weight,time, area, volume, and interpretationof measurement scales).
■ Proportionality (proportionality andratios).
Figure 5 on pages 28 and 29 shows thatamong these content areas, U.S. stu-dents’ performance is at about the in-ternational average in Algebra; DataRepresentation, Analysis, and Prob-ability; and Fractions and NumberSense. Compared to other countries,we do less well in Geometry; Measure-ment; and Proportionality. Our weakerperformance in these latter three topicsmay pull the overall U.S. score down tobelow average.
In science, the TIMSS eighth-grade testsampled students’ ability to do workin the following subjects:
■ Chemistry (classification of matter,chemical properties and transforma-tions).
■ Earth Science (earth features, earthprocesses, and the earth in the uni-verse).
■ Environmental Issues and the Nature ofScience (environmental and resourceissues, the nature of scientific knowl-edge, and the interaction of scienceand technology).
(Continued on page 32)

28
FRACTIONS &NUMBER
SENSE
NNAATIONTION PPERCENTERCENT C CORRECTORRECT
SINGAPORE 84JAPAN 75KOREA 74HONG KONG 72BELGIUM-FLEMISH O 71CZECH REPUBLIC 69SWITZERLAND O 67SLOVAK REPUBLIC 66(AUSTRIA) 66IRELAND 65HUNGARY 65FRANCE 64CANADA 64(SLOVENIA) 63SWEDEN 62(BELGIUM-FRENCH) 62RUSSIAN FEDERATION 62(NETHERLANDS) 62(AUSTRALIA) 61(ISRAEL) * 60(BULGARIA) 60(THAILAND) 60UNITED STATES O 59(GERMANY) *O 58NORWAY 58NEW ZEALAND 57ICELAND 54ENGLAND *O 54(SCOTLAND) 53(DENMARK) 53(GREECE) 53LATVIA (LSS) O 53SPAIN 52LITHUANIA * 51CYPRUS 50(ROMANIA) 48PORTUGAL 44IRAN, ISLAMIC REPUBLIC39(COLOMBIA) 31(KUWAIT) 27(SOUTH AFRICA) 26
GEOMETRY
NNAATIONTION PPERCENTERCENT C CORRECTORRECT
JAPAN 80SINGAPORE 76KOREA 75HONG KONG 73CZECH REPUBLIC 66FRANCE 66(BULGARIA) 65BELGIUM-FLEMISH O 64RUSSIAN FEDERATION 63SLOVAK REPUBLIC 63(THAILAND) 62(SLOVENIA) 60HUNGARY 60SWITZERLAND O 60(NETHERLANDS) 59(BELGIUM-FRENCH) 58CANADA 58(AUSTRALIA) 57(ISRAEL) * 57(AUSTRIA) 57LATVIA (LSS) O 57NEW ZEALAND 54ENGLAND *O 54(DENMARK) 54LITHUANIA * 53(ROMANIA) 52(SCOTLAND) 52IRELAND 51(GERMANY) *O 51ICELAND 51NORWAY 51(GREECE) 51SPAIN 49SWEDEN 48UNITED STATES O 48CYPRUS 47PORTUGAL 44IRAN, ISLAMIC REPUBLIC43(KUWAIT) 38(COLOMBIA) 29(SOUTH AFRICA) 24
ALGEBRA
NNAATIONTION PPERCENTERCENT C CORRECTORRECT
SINGAPORE 76JAPAN 72HONG KONG 70KOREA 69CZECH REPUBLIC 65HUNGARY 63RUSSIAN FEDERATION 63BELGIUM-FLEMISH O 63SLOVAK REPUBLIC 62(BULGARIA) 62(SLOVENIA) 61(ISRAEL) * 61(AUSTRIA) 59(AUSTRALIA) 55SPAIN 54FRANCE 54CANADA 54IRELAND 53(BELGIUM-FRENCH) 53(THAILAND) 53SWITZERLAND O 53(NETHERLANDS) 53(ROMANIA) 52UNITED STATES O 51LATVIA (LSS) O 51NEW ZEALAND 49ENGLAND *O 49(GERMANY) *O 48CYPRUS 48LITHUANIA * 47(SCOTLAND) 46(GREECE) 46NORWAY 45(DENMARK) 45SWEDEN 44ICELAND 40PORTUGAL 40IRAN, ISLAMIC REPUBLIC37(KUWAIT) 30(COLOMBIA) 28(SOUTH AFRICA) 23
NOTES:1. Nations not meeting international study guidelines are shown in parentheses.2. Nations in which more than 10 percent of the population was excluded from testing are shown with a *. Latvia is
designated LSS because only Latvian-speaking schools were tested, which represents less than 65 percent of thepopulation.
3. Nations in which a participation rate of 75 percent of the schools and students combined was achieved only afterreplacements for refusals were substituted, are shown with a o.
4. The international average is the average of the national averages of the 41 nations.
FIGURE 5:FIGURE 5:NNAATIONALTIONAL A AVERAGESVERAGES ININ M MAATHEMATHEMATICSTICS C CONTENTONTENT A AREAREASS
58
56
52

29
DATA REPRESENTATION,ANALYSIS,
& PROBABILITY
NNAATIONTION PPERCENTERCENT C CORRECTORRECT
SINGAPORE 79KOREA 78JAPAN 78BELGIUM-FLEMISH O 73SWITZERLAND O 72(NETHERLANDS) 72HONG KONG 72FRANCE 71SWEDEN 70IRELAND 69CANADA 69(AUSTRIA) 68CZECH REPUBLIC 68(BELGIUM-FRENCH) 68(AUSTRALIA) 67(DENMARK) 67NORWAY 66NEW ZEALAND 66(SLOVENIA) 66ENGLAND *O 66HUNGARY 66UNITED STATES O 65(SCOTLAND) 65(GERMANY) *O 64(ISRAEL) * 63ICELAND 63(THAILAND) 63(BULGARIA) 62SLOVAK REPUBLIC 62RUSSIAN FEDERATION 60SPAIN 60(GREECE) 56LATVIA (LSS) O 56PORTUGAL 54CYPRUS 53LITHUANIA * 52(ROMANIA) 49IRAN, ISLAMIC REPUBLIC41(KUWAIT) 38(COLOMBIA) 37(SOUTH AFRICA) 26
MEASUREMENT
NNAATIONTION PPERCENTERCENT C CORRECTORRECT
SINGAPORE 77JAPAN 67KOREA 66HONG KONG 65CZECH REPUBLIC 62(AUSTRIA) 62SWITZERLAND O 61SLOVAK REPUBLIC 60BELGIUM-FLEMISH O 60(SLOVENIA) 59(NETHERLANDS) 57FRANCE 57HUNGARY 56RUSSIAN FEDERATION 56SWEDEN 56(BELGIUM-FRENCH) 56(BULGARIA) 54(AUSTRALIA) 54IRELAND 53NORWAY 51CANADA 51(GERMANY) *O 51(THAILAND) 50ENGLAND *O 50(DENMARK) 49NEW ZEALAND 48(ISRAEL) * 48(SCOTLAND) 48(ROMANIA) 48LATVIA (LSS) O 47ICELAND 45SPAIN 44CYPRUS 44(GREECE) 43LITHUANIA * 43UNITED STATES O 40PORTUGAL 39IRAN, ISLAMIC REPUBLIC29(COLOMBIA) 25(KUWAIT) 23(SOUTH AFRICA) 18
PROPORTIONALITY
NNAATIONTION PPERCENTERCENT C CORRECTORRECT
SINGAPORE 75HONG KONG 62KOREA 62JAPAN 61BELGIUM-FLEMISH O 53SWITZERLAND O 52CZECH REPUBLIC 52(NETHERLANDS) 51(THAILAND) 51IRELAND 51(SLOVENIA) 49SLOVAK REPUBLIC 49(AUSTRIA) 49FRANCE 49RUSSIAN FEDERATION 48CANADA 48(BELGIUM-FRENCH) 48HUNGARY 47(BULGARIA) 47(AUSTRALIA) 47SWEDEN 44(ISRAEL) * 43NEW ZEALAND 42UNITED STATES O 42(GERMANY) *O 42(ROMANIA) 42ENGLAND *O 41(DENMARK) 41NORWAY 40SPAIN 40(SCOTLAND) 40CYPRUS 40(GREECE) 39LATVIA (LSS) O 39ICELAND 38IRAN, ISLAMIC REPUBLIC36LITHUANIA *O 35PORTUGAL 32(COLOMBIA) 23(SOUTH AFRICA) 21(KUWAIT) 21
SOURCE:Beaton et al. (1996) Mathematicsachievement in the middle school years.Table 2.1. Boston College: ChestnutHill, MA.
PPERCENTERCENT SIGNIFICANTLSIGNIFICANTLYY HIGHERHIGHER THANTHAN U U.S.S..PPERCENTERCENT NONOTT SIGNIFICANTLSIGNIFICANTLYY DIFFERENTDIFFERENT THANTHAN U U.S.S..PPERCENTERCENT SIGNIFICANTLSIGNIFICANTLYY LLOWEROWER THANTHAN U U.S.S..IINTERNANTERNATIONALTIONAL AAVERAGEVERAGE PERCENTPERCENT CORRECTCORRECT, , ALLALL NANATIONSTIONS
62
51 45
#

30
EARTH SCIENCE
NNAATIONTION PPERCENTERCENT C CORRECTORRECT
SINGAPORE 65(SLOVENIA) 64CZECH REPUBLIC 63KOREA 63BELGIUM-FLEMISH O 62(AUSTRIA) 62SWEDEN 62NORWAY 61IRELAND 61(NETHERLANDS) 61JAPAN 61SLOVAK REPUBLIC 60HUNGARY 60ENGLAND *O 59RUSSIAN FEDERATION 58(BULGARIA) 58UNITED STATES O 58SWITZERLAND O 58CANADA 58(AUSTRALIA) 57(GERMANY) *O 57SPAIN 57(THAILAND) 56NEW ZEALAND 56(ISRAEL) * 55FRANCE 55HONG KONG 54(SCOTLAND) 52PORTUGAL 50(BELGIUM-FRENCH) 50ICELAND 50(ROMANIA) 49(GREECE) 49(DENMARK) 49LATVIA (LSS) O 48LITHUANIA * 46CYPRUS 46IRAN, ISLAMIC REPUBLIC 45(KUWAIT) 43(COLOMBIA) 37(SOUTH AFRICA) 26
LIFESCIENCE
NNAATIONTION PPERCENTERCENT C CORRECTORRECT
SINGAPORE 72JAPAN 71KOREA 70CZECH REPUBLIC 69(NETHERLANDS) 67(THAILAND) 66HUNGARY 65(AUSTRIA) 65(SLOVENIA) 65(BULGARIA) 64ENGLAND *O 64BELGIUM-FLEMISH O 64(AUSTRALIA) 63(GERMANY) *O 63UNITED STATES O 63SWEDEN 63RUSSIAN FEDERATION 62CANADA 62HONG KONG 61NORWAY 61(ISRAEL) * 61NEW ZEALAND 60SLOVAK REPUBLIC 60IRELAND 60SWITZERLAND O 59ICELAND 58SPAIN 58(SCOTLAND) 57FRANCE 56(DENMARK) 56(ROMANIA) 55(BELGIUM-FRENCH) 55(GREECE) 54PORTUGAL 53LATVIA (LSS) O 53LITHUANIA * 52IRAN, ISLAMIC REPUBLIC 49CYPRUS 49(KUWAIT) 45(COLOMBIA) 44(SOUTH AFRICA) 27
PHYSICS
NNAATIONTION PPERCENTERCENT C CORRECTORRECT
SINGAPORE 69JAPAN 67KOREA 65CZECH REPUBLIC 64(NETHERLANDS) 63(AUSTRIA) 62ENGLAND *O 62SLOVAK REPUBLIC 61(SLOVENIA) 61BELGIUM-FLEMISH O 61(BULGARIA) 60(AUSTRALIA) 60HUNGARY 60CANADA 59HONG KONG 58NEW ZEALAND 58SWITZERLAND O 58RUSSIAN FEDERATION 57(GERMANY) *O 57SWEDEN 57(ISRAEL) * 57(SCOTLAND) 57NORWAY 57IRELAND 56UNITED STATES O 56SPAIN 55FRANCE 54(THAILAND) 54ICELAND 53(GREECE) 53(DENMARK) 53(BELGIUM-FRENCH) 51LATVIA (LSS) O 51LITHUANIA * 51(ROMANIA) 49PORTUGAL 48IRAN, ISLAMIC REPUBLIC 48CYPRUS 46(KUWAIT) 43(COLOMBIA) 37(SOUTH AFRICA) 27
FIGURE 6:NNAATIONALTIONAL A AVERAGESVERAGES ININ S SCIENCECIENCE C CONTENTONTENT A AREAREASS
55 59
55

31
CHEMISTRY
NNAATIONTION PPERCENTERCENT C CORRECTORRECT
SINGAPORE 69(BULGARIA) 65KOREA 63JAPAN 61CZECH REPUBLIC 60HUNGARY 60(AUSTRIA) 58SLOVAK REPUBLIC 57RUSSIAN FEDERATION 57(SLOVENIA) 56SWEDEN 56ENGLAND *O 55HONG KONG 55(GERMANY) *O 54IRELAND 54(AUSTRALIA) 54(ISRAEL) * 53UNITED STATES O 53NEW ZEALAND 53(NETHERLANDS) 52IRAN, ISLAMIC REPUBLIC 52CANADA 52SPAIN 51(GREECE) 51BELGIUM-FLEMISH O 51(SCOTLAND) 51PORTUGAL 50SWITZERLAND O 50NORWAY 49LATVIA (LSS) O 48LITHUANIA * 48FRANCE 47(ROMANIA) 46CYPRUS 45(THAILAND) 43ICELAND 42(BELGIUM-FRENCH) 41(DENMARK) 41(KUWAIT) 40(COLOMBIA) 32(SOUTH AFRICA) 26
ENVIRONMENTAL ISSUES& THE NATURE
OF SCIENCE
NNAATIONTION PPERCENTERCENT C CORRECTORRECT
SINGAPORE 74(NETHERLANDS) 65ENGLAND *O 65KOREA 64(AUSTRALIA) 62(THAILAND) 62UNITED STATES O 61CANADA 61IRELAND 60JAPAN 60(BULGARIA) 59CZECH REPUBLIC 59NEW ZEALAND 59(SLOVENIA) 59BELGIUM-FLEMISH O 58(SCOTLAND) 57NORWAY 55HONG KONG 55(AUSTRIA) 55SLOVAK REPUBLIC 53HUNGARY 53FRANCE 53SPAIN 53(ISRAEL) * 52SWEDEN 52(GERMANY) *O 51SWITZERLAND O 51(GREECE) 51RUSSIAN FEDERATION 50ICELAND 49(DENMARK) 47LATVIA (LSS) O 47CYPRUS 46(BELGIUM-FRENCH) 46PORTUGAL 45(ROMANIA) 42(COLOMBIA) 40LITHUANIA * 40(KUWAIT) 39IRAN, ISLAMIC REPUBLIC 39(SOUTH AFRICA) 26
PPERCENTERCENT SIGNIFICANTLSIGNIFICANTLYY
HIGHERHIGHER THANTHAN U U.S.S..PPERCENTERCENT NONOTT SIGNIFICANTLSIGNIFICANTLYY
DIFFERENTDIFFERENT FROMFROM U U.S.S..PPERCENTERCENT SIGNIFICANTLSIGNIFICANTLYY LLOWEROWER
THANTHAN U U.S.S.I.INTERNANTERNATIONALTIONAL
AAVERAGEVERAGE PERCENTPERCENT CORRECTCORRECT
51
53
#
NOTES:1. Nations not meeting international
study guidelines are shown in pa-rentheses.
2. Nations in which more than 10percent of the population was ex-cluded from testing are shownwith a *. Latvia is designated LSSbecause only Latvian-speakingschools were tested, which repre-sents less than 65 percent of thepopulation.
3. Nations in which a participationrate of 75 percent of the schoolsand students combined wasachieved only after replacementsfor refusals were substituted, areshown with a o.
4. The international average is the av-erage of the national averages ofthe 41 nations.
SOURCE:Beaton et al. (1996) Science achieve-ment in the middle school years. Table2.1. Boston College: Chestnut Hill,MA.

32
■ Life Science (structure, diversity, clas-sification, processes, cycles, and in-teractions of plants and animals).
■ Physics (energy forms, physical trans-formations, force and motion, andphysical properties of matter).
Figure 6 on pages 30 and 31 shows ourcomparative standing in these contentareas. The U.S. is among the top coun-tries in the world in Environmental Is-sues and the Nature of Science, and weare also above the international averagein Earth Science and Life Science. InChemistry and Physics, our perfor-mance is not significantly differentfrom the international average. Ourbetter-than-average scores in Environ-mental Issues, Earth Science, and LifeScience may pull our overall sciencescore up to above average.
WHAWHAT DID PRIOR STUDIES SHOWT DID PRIOR STUDIES SHOWABOUT HOW UABOUT HOW U .S. ST.S. STAATESTESCOMPCOMPARE TARE TO OO OTHER COUNTRIES?THER COUNTRIES?
Comparison of U.S. states with othernations reminds us that not all U.S.school systems are alike, and that widedifferences in achievement existwithin our own nation. Some wouldsay that comparisons of U.S. states andother nations are fair for two reasons.First, most U.S. states are larger eitherin size or population than many coun-tries in the TIMSS study. For example,California is larger in size than Japan,Germany, or England. New Jersey has alarger population than Austria, Den-mark, or Switzerland. A second reasonthat such comparisons are fair is thateach U.S. state is responsible for its owneducation system, similar to the way in
which most other TIMSS national gov-ernments are responsible for their owneducation system.
Future analyses may make possible suchcomparisons between U.S. states andthe TIMSS nations. Efforts are nowunderway to create an experimentallinkage between the TIMSS study andthe mathematics and science portions ofthe National Assessment of EducationalProgress (NAEP). This linkage will al-low an estimation of how states wouldhave performed on TIMSS if their stu-dents had taken the test. The resultsfor eighth-grade mathematics and sci-ence will be announced in 1997.
Until those findings are released, how-ever, we can look at the results of asimilar linkage which was performedin 1991 for eighth-grade mathematicsstudents’ scores on NAEP and on theInternational Assessment of Educa-tional Progress4. In that comparison,the mathematics scores of Iowa,North Dakota, and Minnesota weresimilar to top-scoring Taiwan andKorea. In contrast, Alabama, Loui-siana, and Mississippi scored aboutthe same as lowest-scoring Jordan.These findings underscore the con-siderable variation in achievementthat exists among states within our ownnation.
HAS UHAS U.S. INTERNA.S. INTERNATIONALTIONALSTSTANDING IMPROVED OVERANDING IMPROVED OVERTIME?TIME?
Results from the National Assess-ment of Education Progress show thatour eighth-grade students’ scores inmath and science have improved some-

33
what in comparison to our own perfor-mance during the past decades. If ourdomestic performance over time is im-proving, how does this affect our inter-national standing? It is possible thatonly U.S. achievement has improvedover time, while achievement in othercountries has not. Of course, it is alsopossible that improvements in the U.S.have been matched or exceeded by im-provements in other countries.
International comparisons over time aredifficult. The first international studiesof math and science achievement wereconducted in the 1960s, and there havebeen three previous assessments in eachsubject since that time. However, eachassessment has been done differently. Adifferent set of nations participated, dif-ferent topics in math and science wereincluded in the tests, the age and typeof students sampled in each countrychanged slightly, and indeed even theborders and names of some of the na-tions have changed. Furthermore, thefield of assessment has matured greatlyover the past thirty years, rendering themethods of the then-revolutionary earlystudies crude by today’s standards.These and other factors complicate com-parisons over time, and require that anyconclusions that are drawn be necessar-ily tentative.
In TIMSS mathematics, we have seenthat our eighth-graders scored below theinternational average. This is basicallythe same relative international standingreported for U.S. thirteen-year-olds inthe IEA First and Second InternationalMathematics Studies in the 1960s and1980s, and the mathematics portion ofthe International Assessment of Educa-tional Progress in the early 1990s5. Rela-tive to their international counter-parts, it is not likely that U.S. eighth-graders’ standing in mathematics hasimproved significantly.
In the three previous internationalscience assessments in the 1960s,1980s, and early 1990s, the U.S. per-formed below the international averageof thirteen or fourteen-year-olds. How-ever in TIMSS, our students scored ator above the international average. Be-cause comparisons over time are dif-ficult, caution should be exercised inassuming there has been significantimprovement in our internationalstanding in science, but it is a possi-bility.
We have now examined what TIMSStells us about what eighth-grade stu-dents have learned. Learning, of course,is closely related to what students aretaught. Next we turn to an examina-tion of how the U.S. mathematics andscience curricula compare with those ofother nations.

34
KEY POINTS:KEY POINTS:
The content taught in U.S. eighth-grade
mathematics classrooms is at a seventh-
grade level in comparison to other countries.
Topic coverage in U.S. eighth-grade
mathematics classes is not as focused as in
Germany and Japan.
In science, the degree of topic focus in the
eighth-grade curriculum may be similar to
that of other countries.
Our nation is atypical among TIMSS
countries in its lack of a nationally-defined
curriculum.
U.S. eighth graders spend more hours per
year in math and science classes than
German and Japanese students.
C H A P T E R 2 :C U R R I C U L U M

35
U.S. policy makers are concerned aboutwhether standards for our students arehigh enough, and, in particular, whetherthey are as challenging as those of ourforeign economic partners. There is awidespread belief that our nation’s eco-nomic productivity is related to our stu-dents’ performance in mathematics andscience, and that this in turn is relatedto the expectations that are set for stu-dent performance.
However, the relationship between stan-dards, teaching, and learning is not asimple one. Formal and informal deci-sions at many levels affect what stu-dents are taught. National, state, andlocal authorities as well as publishersset forth the officially intended curricu-lum in both curriculum guidelines andtextbooks. Teachers also make deci-sions about what should be taught. De-pending on the country, their decisionsare based more or less closely on the of-ficially intended curriculum. What
teachers actually teach their students issometimes called the “implemented cur-riculum.” Both the officially intendedcurriculum and the implemented cur-riculum must be considered when dis-cussing a nation’s goals for student learn-ing.
WHO SETS CURRICULUMWHO SETS CURRICULUMSTSTANDANDARDS?ARDS?
In most TIMSS countries, the curricu-lum is determined by national au-thorities. Figure 7 shows that curricu-lum is determined at the national levelin 29 of the TIMSS countries, at thestate or region in 3 countries, and at thelocal or district level in 9 countries.Germany, Japan, and the U.S. differ inthis respect, which makes comparisonsamong the three countries interesting.Which authority sets a country’s offi-cial curriculum standards makes a dif-ference in whether or not there is a single
FIGURE 7FIGURE 7NNUMBERUMBER OFOF TIMSS C TIMSS COUNTRIESOUNTRIES D DETERMININGETERMINING
CCURRICULURRICULUMUM AATT V VARIOUSARIOUS L LEVELSEVELS
LOCAL LEVEL-9 9 COUNTRIESCOUNTRIES
INCLINCLUDINGUDING THETHE
UU.S.S..
STATE LEVEL-3 3 COUNTRIESCOUNTRIES
INCLINCLUDINGUDING
GGERMANYERMANY
NATIONAL
LEVEL-29 29 COUNTRIESCOUNTRIES
INCLINCLUDINGUDING
JJAPAPANAN
SOURCE:Beaton et al. (1996) Mathematics achievement in the middle school years. Figure 1.Boston College: Chestnut Hill, MA.

36
official core curriculum for the entire na-tion, or whether there are as many offi-cial curricula as there are states or dis-tricts in the country.
Japan is one of the countries that de-termines curriculum at the nationallevel. The National Ministry of Educa-tion specifies one set of curriculumguidelines that details the topics of studyand the number of instructional hoursrequired in every accredited elementaryand junior high school. For these school-ing levels, it also approves textbookspublished by six commercial publishers.Textbooks resemble each other in con-tent because they must be based closelyon the national guidelines. Local schoolboards make only minor modificationsto the national guidelines, and choosetextbooks from among the approved list.However, the Ministry itself does notmonitor whether or not the standardsare adhered to, leaving the issue ofoversight to the local boards of edu-cation. Teachers of each subject in aschool work together closely to besure that they cover the material inthe textbooks at approximately thesame depth and rate. This is partlydue to the oversight of local authorities,and partly due to teachers’ desire thattheir students score well on the high-school entrance examination, which isbased directly on the national curricu-lum.
In Germany, each of the 16 statessets its own curriculum standardsfor students. To encourage some de-gree of similarity across states, the na-tional Conference of Ministers of Edu-cation discusses various issues relatedto standards and adopts broad recom-mended guidelines concerning curricu-lum, hours of instruction, and exami-nation guidelines. State curriculumstandards vary widely in their level of
specificity, and the degree to whichschools and teachers are held account-able for following them. Teachers instates where curriculum guidelines arenot highly specific, and where schoolsand districts are allowed to develop theirown secondary school exit examinations,have considerable flexibility in determin-ing what and how they teach.
In the U.S., most of the nearly16,000districts design their own curriculumor standards, usually within broadguidelines issued by each of the 50states. There are many different com-mercially published textbooks. Becausemost textbooks are designed with aneye to sales in as many districts as pos-sible, they include the content speci-fied by the guidelines from a number ofdifferent states. As a result, textbooksusually contain much more materialthan a teacher can cover fully in a year.Each of the many different textbooksincludes somewhat different topics fromwhich teachers in various districts canchoose. Few states or districts closelymonitor or enforce compliance withstate or district standards, and U.S.teachers usually have the latitude to de-sign the content and pace of theircourses to suit their perception of theirstudents’ needs.
IS CURRICULUM IN THE UIS CURRICULUM IN THE U.S..S.AS FOCUSED AS IN OAS FOCUSED AS IN OTHERTHERCOUNTRIES?COUNTRIES?
Evidence from a variety of sourcesin TIMSS shows us that the U.S.mathematics curriculum is less fo-cused than that of other countries.The U.S. science curriculum moreclosely resembles international prac-t i c e s .

37
The TIMSS curriculum analysis stud-ied the officially intended curriculum byasking U.S. curriculum experts to judgewhich topics were recommended to betaught at each grade level. Their judg-ments were compared with those of ex-perts in the other TIMSS countries.This effort revealed that the number oftopics recommended to be covered in theU.S. was greater than the internationalaverage at each of grades 1 through 8for mathematics.
Textbooks are another aspect of the of-ficially intended curriculum. Video-tapes of mathematics classes in Ger-many, Japan, and the U.S. showed thattextbooks were used during class in al-most half of U.S. lessons and a third ofGerman lessons, but in only 2 percentof Japanese lessons. Teacher-developedworksheets were common in U.S. andJapanese lessons. In Japan, students alsouse supplementary practice books whichare usually purchased from the schoolfor use in home study.
The TIMSS curriculum analysis com-pared the most commonly used text-books in the various countries. For theU.S. portion of this analysis, mathemat-ics experts were asked to recommend themost commonly-used U.S. eighth-gradetextbooks in these subjects. The TIMSSquestionnaire surveys of teachers foundthat these chosen texts were indeedamong the most widely used books inthe U.S, although they accounted for thetextbooks used by only 28 percent of thestudents. This finding that the five rec-ommended textbooks covered a fairlysmall proportion of students is an indi-cation of the great diversity of textbooksin our country. In Japan, close to 90percent of the students used one of thefive most common textbooks. Analysis
found that the set of 5 U.S. eighth-gradetexts included more different topicsacross all the texts than the set of textsin Japan and Germany.
Of course, not all teachers cover everytopic recommended by curriculum ex-perts, or included in textbooks. There-fore, TIMSS also studied the imple-mented curriculum—what teachers ac-tually cover in their classrooms. Usingthe same definitions of mathematics top-ics that the curriculum analysis used, thevideotape study of eighth-grade math-ematics lessons in Germany, Japan, andthe U.S. revealed that U.S. lessons in-clude a greater number of topics. Onaverage, U.S. teachers taught 1.9 topicsper lesson, compared with 1.6 in Ger-many and 1.3 in Japan. The variety oftopics was much wider in the U.S., too.
In science, the officially intended cur-riculum as reflected by U.S. curricu-lum experts’ recommendations abouttopics to be taught was close to theinternational average for grades 3through 8. Science experts in eachcountry chose the three most commontextbooks used in their classrooms,which were found to be used by 16percent of students in the U.S., and 84percent of students in Japan.
Thus, the evidence from a variety ofTIMSS sources reinforces the findingthat our eighth-grade mathematics cur-riculum is less focused than the cur-ricula of other nations, if focus is de-fined as number and variety of topicsin the intended and implemented cur-riculum. Although less information isavailable for science, U.S. curricular fo-cus may be more similar to the averageof the TIMSS countries in this subject.

38
IS CURRICULUM IN THE UIS CURRICULUM IN THE U .S..S.AS ADAS ADVVANCED AS IN OANCED AS IN O THERTHERCOUNTRIES?COUNTRIES?
The U.S. mathematics curriculum isnot as advanced as in Germany andJapan. Concerning the intended cur-riculum, analysis of textbooks found thatGeometry occupied more space in theGerman and Japanese books than in theU.S. texts. The Japanese textbooks alsodevoted more space to algebra than didthe books studied by the majority ofU.S. eighth graders, who are in non-al-gebra tracks.
The implemented curriculum in the U.S.is also less advanced than that of Germanyand Japan. In the videotapes studied, 40percent of U.S. eighth-grade mathemat-ics lessons included arithmetic topics suchas whole number operations, fractions,and decimals, whereas these topics weremuch less common in Germany and Ja-pan. In contrast, German and Japaneseeighth-grade lessons were more likely tocover algebra and geometry.
The topics being taught in U.S. math-ematics classrooms were at a seventh-grade level in comparison to other coun-tries, while the topics observed in theGerman and Japanese classroomswere at a high eighth-grade or evenninth-grade level. This was discoveredbased on a comparison of the TIMSScurriculum analysis and videotape stud-ies. The curriculum analysis asked ex-perts in each of the TIMSS countriesto report the grade level at which theircountry focused on various topics.These findings were compared to thetopics which the TIMSS videotapestudy observed eighth-grade teachers inJapan, Germany, and the U.S. to be ac-tually teaching.
TIMSS does not have data to judgewhether the U.S. curriculum in scienceis as advanced as that of other countriesbecause the videotape study was con-ducted only in mathematics.
HOW MUCH TIME IS SPENT IN CLASS?HOW MUCH TIME IS SPENT IN CLASS?
Lengthening the school year or schoolday has often been proposed as a mea-sure to improve U.S. students’ achieve-ment, as it has been thought that U.S.students spend less time at school thantheir international counterparts.TIMSS compared the amount of timethat teachers report U.S. studentsspend in mathematics and scienceclasses with the amount of time re-ported for students in Germany andJapan. In contrast to previous analy-ses, TIMSS carefully took into ac-count differences between countriesin the length of the school year, schoolweek, and class period, as well as differ-ences between the amount of time re-quired for students in high and lowtracks. On this basis, the averagenumber of hours per year that a stu-dent in each country spends in math-ematics and science class was calculated.
U.S. eighth-graders spend consider-ably more hours per year in math-ematics classes than their Japaneseand German counterparts. U.S. stu-dents also spend much more time in sci-ence classes than students in Japan. Fig-ure 8 on page 39 shows the amount oftime that students in the different coun-tries spend in math and science classesper year. U.S. students’ instructionaltime is both longer and more com-pressed, because it takes place within aschool year of approximately 180 days,as compared to 188 in Germany and 220

39
in Japan. Of course, time spent in home-work, after-school classes, and out-of-school study is also an important factorin learning, and findings concerningthese topics will be examined in Chap-ter 5.
Taken together, TIMSS curriculum-re-lated findings show that lack of suffi-cient class time is not the easy answer
to the question of why U.S. studentsare below the international averagein mathematics. Instead, findingssuggest that our students receive aless-advanced curriculum, which isalso less focused. Next we will con-sider how this curriculum is taught byexamining the findings concerning class-room teaching.
SOURCE:Third International Mathematics and Science Study; unpublished tabulations,U.S., German, and Japanese school and teacher surveys; Westat, Inc., 1996.
FIGURE 8FIGURE 8HHOURSOURS OFOF M MAATHEMATHEMATICSTICS ANDAND S SCIENCECIENCE I INSTRUCTIONALNSTRUCTIONAL
TTIMEIME PERPER Y YEAREAR FORFOR E EIGHTHIGHTH-G-GRADERSRADERS
1160
140
120
100
80
60
40
20
0
AVER
AGE
HOUR
S PE
R YE
AR
143 140
SSCIENCECIENCEMMAATHEMATHEMATICSTICS
114
136
90
117
UU.S.S..GERMANYGERMANYJAPJAPANAN

40
C H A P T E R C H A P T E R 3 3 ::T E A C H I N GT E A C H I N G
KEY POINTS:KEY POINTS:
The content of U.S. mathematics classes
requires less high-level thought than classes in
Germany and Japan.
U.S. mathematics teachers’ typical goal is to
teach students how to do something, while
Japanese teachers’ goal is to help them
understand mathematical concepts.
Japanese teachers widely practice what the U.S.
mathematics reform recommends, while U.S.
teachers do so less frequently.
Although most U.S. math teachers report
familiarity with reform recommendations, only a
few apply the key points in their classrooms.

41
During the past several years, mathemat-ics professional organizations, concernedabout the quality of instruction in U.S.classrooms, have issued calls for reform.In 1989, the National Council of Teach-ers of Mathematics (NCTM) set forthCurriculum and Evaluation Standards, fol-lowed in 1991 by Professional Standardsfor Teaching Mathematics, and in 1995 byAssessment Standards. The essence of therecommendations in these reform docu-ments is that instruction should be morethan mere mastery of facts and routineskills. It should require students to un-derstand and apply mathematical con-cepts in new situations.
Publication and discussion of docu-ments such as these, however, do notchange the behavior of all of America’shundreds of thousands of mathemat-ics teachers within a few years. Rec-ommendations for major changes inother areas of American life, such asimproving health through regular exer-cise and proper diet, have required de-cades of sustained effort by public healthorganizations at all levels to assist in-dividual citizens in changing in-grained personal habits and atti-tudes. Indeed, the campaign stillcontinues. Changing our nation’shabits of teaching and public atti-tudes toward mathematics and sci-ence may also require a similarly longand concerted effort by many commit-ted people.
TIMSS was not designed as an evalua-tion of the U.S. mathematics reformefforts described in the documentslisted above. There are three reasonswhy TIMSS is unsuitable as such anevaluation. First, because it is an inter-national study, it was designed to mea-sure those aspects of mathematics andscience knowledge and practice consid-ered important by the majority of
TIMSS nations, rather than those spe-cifically recommended by the U.S. re-form community. Second, TIMSStested U.S. students in the spring of1995, which was too soon after the pub-lication of the reform documents forstates and districts to have designed theirown reform programs, retrained teach-ers in the new practices, and nurtured ageneration of students according to thenew approach. Third, a proper evalua-tion requires matching “before and af-ter” measurements between whichprogress can be judged, and we have noprior measurement which matchesTIMSS. For these reasons, TIMSS isnot suitable as an evaluation. It shouldbe studied as a baseline measurementagainst which future progress can begauged.
Until TIMSS, no large nationally-rep-resentative study had observed U.S.classrooms to watch how teachers ac-tually teach. To overcome this lack,and to understand how U.S. classroomteaching compares to that of othercountries, NCES added an innovativenew research methodology to theTIMSS project— videotaping andquantitative coding of a nationalsample of eighth-grade mathematicsclasses in Germany, Japan, and theU.S.
In the U.S. and Germany, half of theeighth-grade mathematics class-rooms in which students were sched-uled to take the TIMSS test were ran-domly chosen to be filmed. In Japan,50 classrooms from the schools in whichthe TIMSS test was administered werechosen by the principal and officials atthe National Institute for EducationalResearch. Teachers whose classroomswere chosen and who agreed to partici-pate were videotaped teaching a typicallesson. In this way, videotapes of 230

42
lessons were collected in the three coun-tries combined. The videotapes werethen coded and analyzed to compare theteaching techniques and lesson contenttypical of the three countries. Teachersalso completed a questionnaire concern-ing the lesson that was videotaped. Thefindings can be considered representa-tive of the type of instruction receivedby German, Japanese, and U.S. eighth-grade mathematics students. The resultsprovide a window on actual teaching inU.S. classrooms, and also show how U.S.mathematics classes compare to thosein Germany and Japan.
HOW DO MAHOW DO MA THEMATHEMATICS TEACHERSTICS TEACHERSSTRUCTURE AND DELIVER THEIRSTRUCTURE AND DELIVER THEIRLESSONS?LESSONS?
When studying what teachers do intheir classrooms, we should first un-derstand what they mean to do.Therefore, the videotape study asked
teachers about their goals for the lesson.In contrast to expert recommendationthat well-taught lessons focus on hav-ing students think about and come tounderstand mathematical concepts,U.S. and German eighth-grade math-ematics teachers usually explainedthat the goal of their lesson was tohave students acquire particularskills, i.e. to learn how to do something.Learning a skill, such as being able tosolve a certain type of problem, or usinga standard formula, was listed as the goalby about 60 percent of the U.S. and Ger-man teachers, compared with 27 percentof the Japanese teachers. Japaneseteachers’ goals were more likely to re-semble the recommendations of U.S.reform experts. Mathematical thinking,such as exploring, developing, and un-derstanding concepts, or discoveringmultiple solutions to the same problems,was described as the goal of the lessonby 71 percent of the Japanese teachers,
SOURCE:Third International Mathematics and Science Study; unpublished tabulations, Videotape Classroom Study, UCLA, 1996.
FIGURE 9:FIGURE 9:CCOMPOMPARISONARISON OFOF THETHE S STEPSTEPS T TYPICALYPICAL OFOF E EIGHTHIGHTH-G-GRADERADE M MAATHEMATHEMATICSTICS L LESSONSESSONS ININ J JAPAPANAN, , THETHE
UU.S.S., ., ANDAND G GERMANYERMANY
The emphasis on understanding is evident in the steps typical of Japa-nese eighth-grade mathematics lessons:
■ Teacher poses a complex thought-provoking problem.■ Students struggle with the problem.■ Various students present ideas or solutions to the class.■ Class discusses the various solution methods.■ The teacher summarizes the class’ conclusions.■ Students practice similar problems.
In contrast, the emphasis on skill acquisition is evident in thesteps common to most U.S. and German math lessons:
■ Teacher instructs students in a concept or skill.■ Teacher solves example problems with class.■ Students practice on their own while the teacher assists individual students.

43
compared with 29 percent of Germanand 24 percent of U.S. teachers. Thisdifference in goals is played out in thetypical sequences of activities, or culturalscripts, which characterize mathematicslessons in the three countries. Figure 9on page 42 describes the steps typicalof these cultural scripts.
The U.S. and German emphasis onskills rather than understanding isalso carried over into the type ofmathematical work that students areassigned to do at their desks duringclass. Students were coded as practic-ing routine procedures if their seatworkrequired them to carry out a previously-learned solution method or procedureon a routine problem. In the U.S.,96 percent of seatwork time wasspent on routine procedures, in com-parison to 89 percent in Germany,and 41 percent in Japan. Studentswere assigned to invent new solu-tions, proofs, or procedures on theirown which require them to think andreason in 44 percent of Japanese, 4percent of German lessons, and lessthan 1 percent of U.S. lessons.Clearly, Japanese students muchmore often engage in the type ofmathematical thinking recommendedby experts and the U.S. reform move-ment.
When a lesson included a mathemati-cal concept, it was usually simplystated in U.S. classrooms, whereasit was developed in Japanese andGerman ones. For example, considera lesson on the Pythagorean theo-rem. When the concept is merelystated, the teacher or a student mightsimply say “we find the length of thehypotenuse of a right triangle by us-ing a2+ b2= c2.” In contrast, a con-cept was coded as having been de-
veloped if it was proven, derived, or ex-plained in some detail.
Figure 10 on page 44 shows that U.S.teachers rarely developed concepts, incontrast to German and Japaneseteachers, who usually did. In Germany,the teacher usually did the mentalwork in developing the concept, whilethe students listened or answeredshort questions designed to add to theflow of the teacher’s explanation. Japa-nese teachers, however, designed the les-son in such a way that the studentsthemselves derived the concept fromtheir own struggle with the problem.
These findings from the videotape studyare corroborated by the TIMSS ques-tionnaire findings. Teachers were askedto choose activities that were charac-teristic of their teaching from amongthose listed on the questionnaire. U.S.math teachers were more likely to re-port asking students to practice com-putational skills, in most or every classthan were their German and Japa-nese colleagues. Similarly, Japaneseteachers were more likely to reportthey ask students to analyze relation-ships, write equations, explain theirreasoning, and solve problems withno obvious solution in most or everyclass than teachers in the U.S. andGermany.
Linking concepts used in one part of thelesson to ideas or activities in anotherpart of the lesson is believed by expertsto improve students’ ability to learn andunderstand a subject in an integratedway. The videotape study found that96 percent of Japanese lessons includedsuch explicit linkages in comparison toabout 40 percent of U.S. and Germanlessons. Talking about such relationshipsmay help make lessons more coherent

44
for students by showing them the rela-tionships between ideas and activitiesused in different parts of the lesson.
Interruptions present a threat to the co-herence of lesson activities. The studyfound that the flow of mathematics les-sons was more frequently interruptedthan in Germany and Japan. One U.S.math lesson in four was temporarilyhalted by an outside interruption, typi-cally a loudspeaker announcement, or avisitor at the door. In contrast, inter-ruptions in German lessons were muchless common, and the Japanese lessonsobserved in the study never experiencedoutside interruptions. Interruptionscoming from within the classroom werealso more common in U.S. mathemat-ics lessons, such as substantial discus-sion of non-mathematical subjects likerecent sports events, or extended disci-plinary incidents. In the U.S., 23 per-cent of lessons were broken up in thisway, compared to 9 percent in Japan, and4 percent in Germany.
Taken together, these findings suggestthat Japanese rather than U.S. or Ger-man lessons more often resembled therecommendations of experts and theU.S. reform movement. U.S. lessonstypically focused on acquiring math-ematical skills rather than conceptualunderstanding, and were less coher-ently presented.
ISIS THETHE MAMATHEMATHEMATICALTICAL CONTENCONTENTT OF OFUU.S..S. LESSONSLESSONS ASAS RICHRICH ASAS THATHATT ININGERMANYGERMANY ANDAND JAPJAPAN?AN?
As noted earlier, the U.S. eighth-grademathematics curriculum focuses moreon arithmetic, while the German andJapanese curricula focus more on geom-etry and algebra. Furthermore, U.S.eighth graders are studying topics usu-ally learned at the seventh grade in mostother TIMSS countries.
How does the quality of the math-ematical reasoning used in U.S.classrooms compare with that in
SOURCE:Third International Mathematics and Science Study; unpublished tabulations, Videotape Classroom Study, UCLA, 1996.
FIGURE 10FIGURE 10AAVERAGEVERAGE P PERCENTERCENTAGEAGE OFOF T TOPICSOPICS ININ E EIGHTHIGHTH-G-GRADERADE
MMAATHEMATHEMATICSTICS L LESSONSESSONS THATHATT A ARERE S STTAATEDTED OROR D DEVELEVELOPEDOPED
1100
80
60
40
20
0
AVER
AGE
PERC
ENT
TOPI
CS
23
17
UU.S.S..JAPJAPANANGERMANYGERMANY
77
83
22
78SS TTAATEDTED
DDEVELEVELOPEDOPED

45
Germany and Japan? Videotape re-searchers requested the assistance of 3mathematics professors and one profes-sor of mathematics education in evalu-ating the quality of the mathematics con-tained in the videotaped lessons. Thisgroup of four experts was asked to judgethe quality of the “story” formed by thesequence of mathematical ideas in a ran-dom sample of 90 of the lessons dividedevenly among each of the three coun-tries. They studied such factors as thecoherence of the sequencing, the typeof reasoning required of students, the in-crease in cognitive complexity betweenthe beginning and end of the lesson, andthe way in which the problems and ex-amples contributed to the lesson’s cen-tral concept.
To ensure that the experts were notunconsciously biased toward anycountry, they were not allowed to actu-ally see the videotapes. Instead, theywere provided with a written summaryof each lesson’s sequence of mathemati-cal statements and equations, as well ashow these were embedded in learningactivities. The summaries were carefully
reviewed to disguise any words such as“yen,” or “football,” or other hintswhich might indicate the country inwhich the lesson was taught. Each ex-pert first independently rated the over-all quality of the mathematical contentof each lesson as either low, medium, orhigh. After comparing their ratings, theyfound high agreement among their judg-ments. Figure 11 below shows theirjudgments.
None of the U.S. lessons was consid-ered to contain a high-quality se-quence of mathematical ideas, com-pared to 30 percent of the Japanese,and 23 percent of the German lessons.Instead, the lowest rating was assignedto the mathematical reasoning used in87 percent of the U.S. lessons, in com-parison to 40 percent of the Germanand 13 percent of Japanese lessons.This finding does not mean that thereare no lessons with high-qualitymathematical reasoning anywhere inthe U.S. However, it does indicatethat they are probably a rare phe-nomenon.
FIGURE 11FIGURE 11EEXPERTXPERT J JUDGEMENTSUDGEMENTS OFOF THETHE Q QUALITYUALITY OFOF THETHE M MAATHEMATHEMATICALTICAL C CONTENTONTENT
OFOF E EIGHTHIGHTH-G-GRADERADE L LESSONSESSONS
SOURCE:Third International Mathematics and Science Study; unpublished tabulations, Videotape Classroom Study, UCLA, 1996.
1100
80
60
40
20
0
PERC
ENT
OF
LESS
ON
S
40
23
13
UU.S.S..JJAPAPANANGGERMANYERMANY
37
57
30
87
13
0
LOWLOWMEDIUMMEDIUMHIGHHIGH

46
These findings that our nation’s eighth-grade mathematics classes are based onless challenging material, and lack math-ematically rich content suggest that ourstudents have less opportunity to learnchallenging mathematics than theircounterparts in Germany and Japan.
TTO WHAO WHAT EXTENT ARE THET EXTENT ARE THERECOMMENDRECOMMENDAATIONS OF THETIONS OF THEMAMATHEMATHEMATICS REFORMTICS REFORMMOVEMENT BEING IMPLEMENTED?MOVEMENT BEING IMPLEMENTED?
A great deal of effort has been in-vested in the reform of mathematicsteaching in the U.S. in recent years.There is considerable agreementamong experts about what good in-struction should look like. The maingoal of the reform is to create class-rooms in which students are chal-lenged to think deeply about math-ematics and science, by discovering,understanding and applying con-cepts in new situations. For manyyears, Japanese mathematics educa-tors have closely studied U.S. edu-cation reform recommendations, andattempted to implement these andother ideas in their own country.
Has the message about mathemat-ics reform penetrated to U.S. class-rooms? TIMSS data suggest that itis beginning to, but still only in limitedways . . Ninety-five percent of U.S.teachers stated that they were either“very aware” or “somewhat aware” ofcurrent ideas about teaching andlearning mathematics. When asked tolist titles of books they read to stay in-formed about current ideas, one thirdof U.S. teachers wrote down the namesof two important documents by the Na-tional Council of Teachers of Mathemat-ics, Curriculum and Evaluation Standards
and Professional Teaching Standards.
U.S. teachers believe that their lessonsare already implementing the reform rec-ommendations, but the findings de-scribed so far in this chapter suggest thattheir lessons are not. When asked toevaluate to what degree the videotapedlesson was in accord with current ideasabout teaching and learning mathemat-ics, almost 75 percent of the teachersrespond either “a lot” or “a fair amount.”This discrepancy between teachers’ be-liefs and the TIMSS findings leads usto wonder how teachers themselves un-derstand the key goals of the reformmovement, and apply them in the class-room.
Teachers in the study were asked todescribe which aspects of the video-taped lesson exemplified currentideas about teaching and learningmathematics. Most U.S. teachers’answers fall into one of three catego-ries:
■ Hands-on, real-world math - 38percent of the teachers mentionedlesson activities that apply mathto daily life, such as temperaturein Alaska, or that use a physicalrepresentation of a mathematicalconcept, such as geometric blocks.
■ Cooperative learning - 31 percentof the teachers mentioned the useof peer tutoring, “study buddies,” ormath discussion groups.
■ Focus on thinking - 19 percent ofthe teachers mentioned focusingon conceptual thinking aboutmath in preference to computationalskills, or mention focusing on prob-lem solving.
Over 80 percent of the teachers in thestudy referred to something other than

47
a focus on thinking, which is the centralmessage of the mathematics reformmovement. The majority of the teach-ers cited examples of hands-on math orcooperative learning, which are tech-niques included among the reform rec-ommendations. However, these tech-niques can be used either with or with-out engaging students in real mathemati-cal thinking. In fact, the videotape studyobserved many examples of these tech-niques being conducted in the absenceof high-quality mathematical content.
These findings suggest that the in-structional habits and attitudes ofU.S. mathematics teachers are onlybeginning to change in the directionof implementation of mathematicsreform recommendations. Teachers’implementation of the reform stillconcentrates on isolated techniquesrather than the central message,which is to focus lessons on high-levelmathematical thought. The findingthat almost 20 percent of the teachersbelieved that they had implemented thisfocus on mathematical thinking, despiteexperts’ judgments that a high-qualitysequence of mathematical ideas was vir-tually absent in their lessons, suggeststhat teachers may not yet understandwhat the reform movement means bythis term.
The videotape study found that, inmany ways, Japanese teaching resembledthe recommendations of the U.S. reformmovement more closely than did Ameri-can teaching. Japan also scored amongthe top nations in the world on the
TIMSS test. However, until more stud-ies of other high-scoring nations are car-ried out, we cannot be sure that there isa relationship between Japan’s highscores and its style of teaching.
WHAWHA T DO IN ITT DO IN IT IIAL F INDINGSAL F INDINGSSHOW ABOUT SCIENCESHOW ABOUT SCIENCETEACHING?TEACHING?
TIMSS provides less data about scienceteaching than about mathematics teach-ing, because the videotape study wasconducted only in mathematics. How-ever, the TIMSS teacher and studentquestionnaires included some itemsabout instructional practices which helpus understand something about theteaching of science in Germany, Japan,and the U.S.. The questionnaire datahas only begun to be analyzed, and moreanalyses will soon be completed. Pre-liminary analyses suggest that U.S. sci-ence teaching may resemble mathemat-ics teaching in some respects, and differin others. Therefore, one should not as-sume that the videotape findings inmathematics apply to science or to othersubjects.
Taken together, the data suggest thatthe instruction in typical U.S. math-ematics classes is not of as high aquality as that in other countries.Next, we turn to the TIMSS findingsconcerning the teachers themselves.Do the daily working lives of U.S.teachers provide as much support fortheir instructional activities as thoseof other countries?

48
C H A P T E R C H A P T E R 4 4 ::T E A C H E R ST E A C H E R S ’ L I V E S’ L I V E S
KEY POINTS:KEY POINTS:
Unlike new U.S. teachers, new Japanese and
German teachers receive long-term
structured apprenticeships in their
profession.
Japanese teachers have more opportunities
to discuss teaching-related issues than do
U.S. teachers.
U.S. teachers have more college education
than their colleagues in all but a few TIMSS
countries.
Student diversity and poor discipline are
challenges not only for U.S. teachers, but for
their German colleagues as well.

49
Hoping to improve U.S. classroom in-struction, many policy makers have rec-ommended improvements in various as-pects of the U.S. teacher education sys-tem. Experts agree that both the qual-ity of the college preparation prospec-tive teachers receive as well as the qual-ity of the in-service training existingteachers receive are important. How-ever, each year, the percentage of newly-hired teachers is comparatively small inrelation to the size of the existing teach-ing force. Therefore, many experts agreethat, in the short run, the quickest wayto improve students’ learning opportu-nities is to improve the instruction pro-vided by existing teachers.
To better understand how the charac-teristics of teachers’ daily lives may ormay not contribute to high-qualityteaching, a team of twelve bilingual re-searchers each spent three months inGerman, Japanese, or U.S. schools, ob-serving and interviewing teachers, prin-cipals, and students. This activity wascarried out as a supplement to the U.S.TIMSS effort. As this chapter will de-scribe, researchers found important dif-ferences between U.S. teachers’ oppor-tunities for professional learning and im-provement of their teaching, and the op-portunities of their Japanese and Ger-man counterparts.
WHOWHO TEACHESTEACHES MAMATHTHEMAEMATICSTICSANDAND SCIENCE?SCIENCE?
U.S. teachers report that they havespent more years in college thanteachers in all but a few of the 41TIMSS countries. Nearly half of theteachers of U.S. eighth-graders had amasters’ degree, a proportion which was
exceeded by only four other TIMSScountries. In Japan, few teachers hadmore than a Bachelors’ degree withteacher training. In Germany, teacherscomplete 13 years of primary and sec-ondary school, followed by about sixyears of study at the university, afterwhich they write a thesis and pass anexamination to receive a degree consid-ered equivalent to a U.S. masters’ de-gree.
Spending many years in college, how-ever, does not necessarily result inteachers who are experts in their fields.Many U.S. policy makers consider it im-portant for mathematics and scienceteachers to have a strong college back-ground in those subjects. TIMSS, how-ever, was unable to collect informationon this topic due to the great variety ofways in which university training inmathematics and science is organized inthe participating countries.
Japanese and German teachers en-joy the security of the benefits andtenure which come from their statusas civil servants. As civil servants,their jobs are highly protected, andthey are comparatively free from con-cerns about labor-force downsizingor termination for incompetence.
The typical teacher of U.S. eighth-grade math and science students wasa woman in her forties, with about15 years of prior teaching experience.Forties was the norm for most of theother TIMSS countries. The typicalteacher of German students was aman nearly fifty, who had been teach-ing for about 19 years; and the typi-cal teacher of Japanese students wasa man in his late thirties, who hadbeen teaching for 14 years.

50
HOW DO TEACHERS SPENDHOW DO TEACHERS SPENDTHEIR TIME?THEIR TIME?
Teachers of the U.S. and Germaneighth-grade students teach moreclasses per week than Japanese teach-ers. Questionnaires asked teachers toreport the number of periods they teacheach week. Mathematics teachers inthe U.S. most commonly reportedteaching 26 periods per week. Ger-man teachers reported teaching 24,and Japanese teachers reportedteaching 16 periods. Science teach-ers in the U.S. and Germany mostoften reported teaching 25 periods perweek, and Japanese science teachers 18.Most mathematics teachers in all threecountries taught few periods outside oftheir subject, and the same was true ofscience teachers.
In addition to teaching, U.S. and Japa-nese teachers are formally scheduled toperform considerable additional dutiesduring the school day. In the U.S.,teachers reported that these additionalresponsibilities are primarily in studentsupervision and lesson planning. In Ja-pan, the time was roughly balanced be-tween student counseling, administra-tive duties, and lesson planning. MostGerman teachers were scheduled forvery few hours of non-teaching tasksat school, and they did their lesson plan-ning at home.
Eighth-grade math and science classsizes in the U.S. and Germany wereabout the same, averaging 24 to 25 stu-dents per class. Japanese math and sci-ence classes were much larger, aver-aging 37 students.
The rhythm of U.S. and Japanese teach-ers’ daily school life was more similarthan for their German colleagues. Ob-servations of U.S. teachers showed thatthey usually were at school around eighthours a day. They were expected to bein the building during school hours, al-though many came earlier, or stayedlater. Japanese teachers were usually atschool around nine hours a day. Theywere expected to be at school from thetime it started in the morning until about4:00 or 5:00, when student club activi-ties end. Many worked later on someevenings. Japanese schools also were insession for a half day two Saturdays permonth.
German teachers of eighth-grade stu-dents spent the shortest amount of timeat school. The hours during which theywere in the building usually varied fromday to day, depending on their teachingschedule. During periods when theywere not scheduled to teach, teachersoften were not at school and felt free tocome and go from the school much ascollege professors do in the UnitedStates. Most returned home whenschool was over around 1:30, ate theirlunch at home, and planned lessons andreviewed student work during the after-noon and evening.
U.S. and German teachers do not havethe rich informal opportunities tolearn from each other and to sharequestions about teaching-related is-sues that are enjoyed by their Japa-nese colleagues. Japanese schools aredesigned with one very large teachers’room, in which all teachers have theirmain desks, and the seating is arrangedso that all teachers from a particular

51
grade or subject sit near each other.When they were not actually instruct-ing classes, teachers spent most oftheir time in this large room with theircolleagues, providing many casual oppor-tunities each day to share advice, ideasand teaching materials. Japanese cul-tural norms expect junior teachers toquery their older colleagues for teach-ing tips and rely on their advice.
Formal discussions between teach-ers were more frequent in Japan, aswell. When asked how often theymeet to discuss curriculum, 76 per-cent of the teachers of the JapaneseTIMSS students reported “at leastonce a month,” compared to 60 per-cent of the U.S. and 44 percent of theGerman teachers.
HOW DO TEACHERS LEARN THOW DO TEACHERS LEARN TOOTEACH?TEACH?
U.S. teachers lack the long and care-fully mentored introduction to teach-ing that Japanese and German teach-ers receive. In Germany this period ofintensive training comes before beinghired as a teacher. In Japan, it comesduring the first year on the job. In allthree countries, prospective teachers firsttake a mixture of courses in educationand in academic subject areas leadingto graduation from college. After this,however, their experiences divergesharply.
In Germany, after passing a state ex-amination at the end of college, pro-spective teachers spend two years instudent teaching in a program resem-bling a traditional apprenticeship.During the two years, prospectiveteachers have a reduced teachingload that begins with classroom obser-
vation, then progresses to assisted teach-ing, and finally to unassisted teachingunder the close direction of a mentorteacher. They also attend seminars intheir subjects once or twice a week, andtheir seminar instructor joins the men-tor in observing and evaluating the pro-spective teacher. At the end of the sec-ond year, candidates take another stateexamination and apply for jobs. Place-ment is not guaranteed.
In Japan, after passing the teachercertification and employment selec-tion examinations, successful candi-dates are hired by various prefec-tures, which are similar to U.S.states. New teachers then undergointensive mentoring and trainingduring their first year on the job. Newteachers’ first year includes at least 60days of closely mentored teaching and30 days of further training at resourcecenters run by the local and prefecturalboards of education. Their teaching loadis reduced to allow time for these activi-ties. As is typical of Japanese society,mentoring and assistance between jun-ior and senior teachers continuesthroughout teachers’ working lives.
In comparison to the intensive on-the-job training that German andJapanese teachers receive, U.S.teachers’ induction is less structuredand comprehensive. Prospective U.S.teachers typically spend 12 weeks orless in student teaching near the endof their undergraduate training. Af-ter meeting state licensing require-ments and being hired by a schooldistrict, the nature of the inductionprogram varies by district, and mayinclude some type of in-service train-ing, and some mentoring by a moreexperienced teacher.

52
FIGURE 12FIGURE 12PPERCENTERCENTAGEAGE OFOF E EIGHTHIGHTH-G-GRADERADE
MMAATHEMATHEMATICSTICS T TEACHERSEACHERS
RREPORTINGEPORTING T THAHATT V VARIOUSARIOUS C CIRCUMSTIRCUMSTANCESANCES
LLIMITIMIT T THEIRHEIR T TEACHINGEACHING
““QQUITEUITE AA L LOOTT” ” OROR “ “A GA GREAREATT D DEALEAL””
UNINTERESTEDUNINTERESTEDSTUDENTSSTUDENTS
DIFFERENTDIFFERENTACADEMICACADEMIC
ABILITIESABILITIES
DISRUPTIVEDISRUPTIVESTUDENTSSTUDENTS
UNINTERESTEDUNINTERESTEDPARENTSPARENTS
HIGH STUDENT/HIGH STUDENT/TEACHER RATEACHER RATIOTIO
LOW STUDENTLOW STUDENTMORALEMORALE
THREATHREATS TOTS TOPERSONAL/PERSONAL/
STUDENT SAFETYSTUDENT SAFETY
51
43
37
44
55
63
39
40
31
19
15
7
8
0 10 20 30 40 50 60 70
N/ANot asked
Not asked
Not asked
42
29
38
29
Not asked
UU.S.S..GERMANYGERMANYJAPJAPANAN
SOURCE:Third InternationalMathematics and Sci-ence Study: Unpub-lished Tabulations,U.S., German, andJapanese teachersurveys, Westat, 1996.

53
WHAWHAT CHALLENGES DOT CHALLENGES DOTEACHERS FTEACHERS FACE?ACE?
Although teaching students is their job,dealing with students can be teachers’greatest challenge. During interviews,teachers in all three countries fre-quently described student diversity asa challenge. Diversity takes differentforms in each country, however. U.S.teachers referred primarily to differencesin American students’ social, economic,or ethnic background, or to the chal-lenges of dealing with non-English-speaking students. German teachers re-ferred to differences in ethnic back-ground, language, and national origin be-tween the children of German citizensand their country’s foreign workers.Japanese teachers referred to thewide differences in academic abilitywithin each classroom, which arise fromtheir nation’s policy of not separatingstudents by ability in any way until highschool, and not retaining low-perform-ing students in grade.
What circumstances do teachers in thethree countries believe limit their effec-tiveness? TIMSS questionnaires askedteachers to rate the extent to which vari-ous factors limited their ability to teach.Figure 12 on page 52 shows the results.
Uninterested students and a widerange of academic abilities challengeteachers in all three countries. Overa third of U.S. and German eighth-gradeteachers also felt that disruptive stu-dents limited their effectiveness asteachers. The Japanese chose not toinclude any questionnaire items re-lating to discipline or morale prob-lems in their schools.
Severe discipline problems andthreats to student and teacher safetyare neither widespread nor unique tothe U.S., despite stories in the popularmedia that sometimes give the impres-sion that these problems do not exist inother countries. An approximately equaland small number of German and U.S.eighth-grade teachers reported feelingthat threats to themselves or their stu-dents’ safety limited their effectivenessas teachers. Most teachers, however,never experience such serious problems.Seventy-six percent of the U.S. and 65percent of German teachers reportedthat threats to their own or students’safety did not limit their effectivenessat all. TIMSS researchers who ob-served and interviewed teachers intheir schools reported that, in bothcountries, the schools with such se-rious problems were generally inpoorer areas of the city.
Science teachers in all three coun-tries reported hindrances similar tothose of their mathematics col-leagues, except that they added short-ages of demonstration and instructionalequipment to the circumstances whichlimit the effectiveness of their teaching.
Students themselves reported some-what more discipline problems thantheir teachers, possibly because chil-dren often do not report all incidentsto school authorities. About 25 per-cent of the eighth-graders in bothGermany and the U.S. reported onthe questionniares that, during thepast month, they had been afraid thatanother student might hurt them.About 40 percent in each countrysaid that one of their friends had beenhurt by another student. Theft was

54
CLACLASSROOMSSROOMDISTURBANCESDISTURBANCES
TARDINESSTARDINESS
INTIMIDAINTIMIDATION ORTION OR VERBAL ABUSE OF VERBAL ABUSE OF
STUDENTS STUDENTS
PHYSICAL INJURYPHYSICAL INJURYTTO OTHERO OTHERSTUDENTSSTUDENTS
INTIMIDAINTIMIDATION ORTION ORVERBAL ABUSEVERBAL ABUSEOF TEACHERS/OF TEACHERS/
STSTAFFAFF
PHYSICAL INJURYPHYSICAL INJURY T TO TEACHERS/O TEACHERS/
STSTAFFAFF
VANDALISMVANDALISM
POSSESSIONPOSSESSIONOF WEAPONSOF WEAPONS
USE OFUSE OFILLEGALILLEGAL DRUGS DRUGS
FIGURE 13FIGURE 13DDISCIPLINEISCIPLINE P PROBLEMSROBLEMS E EIGHTHIGHTH-G-GRADERADE P PRINCIPRINCIPALSALS
DDEALEAL WITHWITH ONON AA D DAILAILYY B BAASISSIS
INAPPROPRIAINAPPROPRIATETE SEXUAL SEXUAL
BEHABEHAVIORVIOR
SOURCE:Third International Mathematics and Science Study; unpublishedtabulations, U.S., German, and Japanese School Surveys; Westat,1996.
0 10 20 30 40 50 60 70 80
58.0
53.0
33.0
18.0
7.0
2.0
8.0
1.0
3.0
0.0
6.0
5.0
2.0
3.0
2.0
2.0
2.0
5.0
21.0
UU.S.S..GERMANYGERMANY
68.0

55
more common in the U.S. than Ger-many. Fifty-eight percent of U.S. stu-dents but only 32 percent of Germanstudents said that one of their friendshad something stolen during the pastmonth. Skipping classes was more com-mon in Germany, with 66 percent of Ger-man students reporting that one of theirfriends had skipped class during the pastmonth, compared with 50 percent in theU.S.
Figure 13 on page 54 shows the percent-age of U.S. and German principals whoreported that they dealt with variouskinds of discipline problems on a dailybasis. Principals in both countries re-sponded that their most common disci-pline problems were classroom distur-bances, tardiness, and intimidation orverbal abuse of students by other stu-dents. More serious problems such asphysical injury of students, teachers, or
staff were rare. Use of illegal drugs andpossession of weapons was reported asa daily problem by only about 2 percentof the U.S. and German principals. Over90 percent of principals reported thatthey and their staff dealt with theseproblems rarely or never..
Teachers in all three countries founddealing with student diversity to be achallenge to their effectiveness. ManyGerman teachers also experienced prob-lems with student misbehavior. Manyteachers in all three countries believedtheir effectiveness was limited by therange of student abilities represented intheir classes, and also by disruptive anddisinterested students. The next chap-ter turns to the questions of how nationsdeal with student ability differences, aswell as the supports and incentives of-fered to students in their academic en-deavors.

56
C H A P T E R C H A P T E R 5 5 ::S T U D E N TS T U D E N T SS ’ L I V E S’ L I V E S
KEY POINTS:
Eighth-grade students of different abilities aretypically divided into different classrooms in theU.S., and different schools in Germany. In Japan,no ability grouping is practiced.
In the U.S. students in higher-level mathematicsclasses study different material than students inlower-level classes. In Germany and Japan, allstudents study the same material, although inGermany, lower-level classes study it less deeplyand rigorously.
Japanese eighth-graders are preparing for ahigh-stakes examination to enter high school atthe end of ninth grade.
U.S. teachers assign more homework and spendmore class time discussing it than teachers inGermany and Japan. U.S. students report aboutthe same amount of out-of-school math andscience study as their Japanese and Germancounterparts.
Heavy TV watching is as common among U.S.eighth graders as it is among their Japanesecounterparts.

57
On the surface, the lives of eighth grad-ers in most TIMSS countries are fairlysimilar. School and family occupy thebiggest portions, with friends, TV, home-work, clubs, and fun added around theside. Yet below the surface, the way inwhich societies choose to structure theschooling process gives rise to differentopportunities and expectations foryoung people. The motivators, supports,and obstacles to study in each countryare outgrowths of the choices providedby society and schools. In each coun-try, the expectations which adult soci-ety sets for young people form a frame-work within which students organizetheir lives.
WHAWHAT DOES THE SYSTEM REQUIRET DOES THE SYSTEM REQUIREOF STUDENTS?OF STUDENTS?
Some U.S. education policy makers havelooked admiringly at other nationswhich use periodic gateway examina-tions to control student access to thenext level of education. Such high-stakestests are believed to encourage studentsto study hard. The German and Japa-nese systems are frequently cited as ex-amples by the proponents of such prac-tices. TIMSS allows us to compare thepathways through schooling in these twocountries to those of our own, to under-stand how the expectations built into thesystem motivate students of differentability levels.
JJAPAPANAN
Japanese public schools offer a singlecurriculum for all students throughthe end of 9th grade. Students in el-ementary and junior high schools are vir-tually never tracked or grouped by aca-demic ability. There is a widespread be-lief that, to be fair to all students, thenine years of compulsory educationmust offer the same nationally deter-mined curriculum to all, regardless of in-dividual differences in motivation orability. Until the end of ninth grade,there are no gateway exams, and all stu-dents are promoted whether or not theyunderstand the material. Students whoare overly or insufficiently challenged byclassroom assignments may receive ex-tra help after school from a teacher, ortheir parents may pay to enroll them ina juku, which is a private after-schoolclass. In Japan, a substantial amount ofremedial and enrichment instruction isprovided by the private sector.
In mathematics, all eighth-grade Japa-nese students receive a curriculumheavily focused on algebra and geom-etry. Review of arithmetic is not in-cluded in the official curriculum goalsand textbooks. TIMSS observers notedthat there are differences in students’ability to keep up with the curriculumwithin each classroom, and also betweenschools where students come from fami-lies with predominantly high or low eco-nomic backgrounds. However, the Japa-nese system is designed such that teach-ers throughout the country strive tomeet similar standards for presentationof content, while allowing almost unlim-ited variation in the standards of per-formance attained by students.

58
At the end of ninth grade, virtuallyall Japanese students continue on tohigh school. Before they do, however,all must take the high school entranceexam. This examination covers the fivecore subjects, including mathematicsand science. Scores on the examinationserve as a gateway which divides stu-dents into high, medium, and low-levelhigh schools on the basis of eachstudent’s scores on the exam and prioracademic performance. The best of thegraduating ninth-graders are accepted atthe best academic high schools in eachcity, which prepare students for applica-tion to the best universities. The slow-est students are accepted only by thelesser-ranked commercial or vocationalhigh schools, which prepare graduatesto enter the labor force. Students andparents clearly understand the conse-quence of this examination at the endof ninth grade for future career and lifechoices. Japanese students say that theexamination motivates them to studyharder during their junior high schoolyears. For the majority of Japanese stu-dents, this is the only high-stakes examthey will experience.
Once Japanese students enter highschool, they are again promoted eachyear, until they graduate. Most studentsthen enter the labor force or vocationaltraining. Approximately one third of thehigh school graduates decide to applyto a university or two-year college, mostof which require an entrance examina-tion. Competition on the entrance ex-aminations for prestigious universities isintense, although some lower-ranked col-leges will accept most high-school gradu-ates who apply.
GGERMANYERMANY
Various exceptions and experimentsnotwithstanding, the German schoolsystem basically sorts students intoone of three types of schools at theend of the fourth grade of elementaryschool. This is accomplished through asystem of gateway examinations andability grouping which differs consider-ably from the Japanese. Most Germanstudents attend one of three types ofschools:
■ Gymnasium, which provides a de-manding, academic curriculumthrough grade 13 and leads to theAbitur exit examination and univer-sity study.
■ Realschule which provides a moder-ately-paced curriculum ending atgrade 10 and leads to a school-leav-ing certificate and vocational train-ing or further study at a Gymnasium.
■ Hauptschule, which provides practi-cally-oriented instruction ending atgrade 9 and leads to a school leavingcertificate and vocational training oremployment. Immigrant and non-German students are over-repre-sented in the Hauptschule.
The gateway into one of these schoolsis controlled by teacher recommenda-tions at the end of fourth grade. Par-ents can, and frequently do, overrideteacher recommendations if they believethat their child deserves to be placed ina higher track. If the student is unableto keep up with his classmates, however,he or she will be retained in grade andafter repeated failure will be returned to
59
repeat the grade, or may be moved to aless demanding school type. Principalsreported that 5 percent of students wererequired to repeat grade eight. Most stu-dents finishing the Hauptschule at theend of grade 9, or Realschule at the endof grade 10 receive a diploma, and moststates do not require an exit exam.About 10 percent of the students receiveonly a school-leaving certificate insteadof a diploma. Approximately one-thirdof German students are enrolled in aGymnasium, and about a quarter of theseend their studies before taking the Abiturexamination at the end of 13th grade.Very few students who sit for the Abiturfail it, although those with a lower scoremay not be able to enter their chosenuniversity or field of study.
UUNITEDNITED S STTAATESTES
It is more difficult to generalize aboutthe United States, because practices dif-fer among the thousands of school dis-tricts in the country. Generally speak-ing, however, within-class grouping or in-dividuation of instruction is fairly com-mon in elementary schools in the sub-jects of reading and mathematics. Inmiddle schools and high schools, stu-dents are frequently grouped by abil-ity into different mathematics classes.In the U.S., 80 percent of principals ofeighth graders reported that they pro-vided different ability-based classes inmathematics, but only 17 percent re-ported this in science. Course contentand textbooks usually differ between thehigher and lower-level classes. . In theeighth grade,
the next lower level of schooling. MostGerman parents and teachers are rela-tively comfortable with the fairness ofthis system, because they believe that itallows each child an education bestsuited to his or her abilities, interests andfuture career. However, there is a sub-stantial current of opinion within Ger-many which would prefer to delay thesorting of students into different schooltypes until later in the student’s life, andto make it easier for students to changeupward to a higher school type. Mostrecent policy reforms have made smallchanges to modify the system in this di-rection.
Classes in grades 5-9 basically cover thesame content in all three types of Ger-man schools, although there is consid-erable difference in the depth and rigorof instruction between the three schooltypes. Typically, Gymnasium studentsreceive a theoretical approach, andHauptschule students receive a practicalapproach to the same content. Ineighth-grade mathematics, the Germancurriculum focuses mostly on Geometryand Algebra for all three types of schools,with some mixture of other topics.
Within most schools, eighth graders allfollow the same course of study in mathand science, regardless of their abilitylevel. Seventy-five percent of the schoolsreported that they provide only onecourse of study in mathematics, and 90percent provide only one course in sci-ence. Generally speaking, the Germansystem separates students into differentability levels primarily between, ratherthan within, schools.
In Germany, students who have notlearned the material may be required to

60
systems in the three countries. Japan isthe only one of the three countrieswhich requires a high-stakes entranceexamination for all students. Math-ematics and science are included on thisexamination, and Japanese eighth-grad-ers are therefore likely to be studyingthese subjects harder than usual inpreparation. Methods of sorting stu-dents by ability into schools and classesdiffer among the three countries, butboth Germany and Japan teach alge-bra and geometry to all of their eighth-grade students, although the level ofrigor may differ by track. In contrast,in the U.S. a heavy focus on algebrais usually reserved for students in thehigher tracks, and few U.S. eighth-graders in any track study much ge-ometry .
In all three countries, the standards ofperformance for students at each gradelevel are set in such a way that almostall students are passed from one gradeto the next, and all who complete sec-ondary education can obtain some typeof secondary school diploma, regardlessof their level of academic ability.
HOW DO STUDENTS SPEND THEIRHOW DO STUDENTS SPEND THEIRTIME DURING SCHOOL?TIME DURING SCHOOL?
UUNITEDNITED S STTAATESTES
U.S. students attend school approxi-mately 180 days per year, five days perweek. Each day, school usually runs fromabout 8:00 in the morning until mid-afternoon, with a lunch break and fiveto seven-minute breaks between classes.
lower-level classes typically focus ona review of arithmetic and other ba-sic skills with a small amount of al-gebra. Higher-level classes focus moreheavily on algebra, with a smallamount of geometry.
In the U.S., educational expectationsand teaching standards can also differsubstantially between communities,based on a neighborhood’s economicstatus and parental expectations for theirchildren’s futures. Minority students areover-represented in lower-level classesand in schools in poorer areas.
There are various procedures for deal-ing with students who teachers judgehave not learned the course material.They may be promoted anyway, retainedin grade, moved to a lower-tracked class,or given remedial assistance. Principalsreported that 4 percent of the studentsin their schools were required to repeatgrade eight.
Generally speaking, the U.S. system doesnot have high-stakes gateway examina-tions which regulate entrance to furtherschooling before the end of twelfthgrade. Seventeen states currently havean exit examination as a requirement forhigh-school graduation. In most cases,this is a minimum-competency test. Stu-dents may take the test several times ifnecessary, and few students repeatedlyfail. Scores on college entrance exami-nations such as the SAT and ACT aregiven considerable weight by most se-lective universities, although non-selec-tive schools may not require them at all.
This section has examined the learningexpectations embedded in the school

61
Schools vary in how they organize stu-dents. Middle schools commonly in-clude either grades 7-9, or 6-8, althoughvariations exist. In some schools, thestudent body is subdivided into “houses”or “blocks” which include several classesof students and a single group of teach-ers, to strengthen continuity in student-teacher and student-student relation-ships. In other schools, students changeteachers and classmates at the end ofeach period.
Most U.S. schools offer a variety ofteacher-led after-school activities, includ-ing sports, music, art, theater, and aca-demic clubs. The range of after-schoolactivities varies by school and often re-flects the district’s and school’s resourcesand socioeconomic status. Participationin clubs is voluntary, and students canparticipate in more than one activity, assome are seasonal or do not meet everyday. Ten percent of U.S. students saidthat they participate in some type ofmath or science club each week.
GGERMANYERMANY
German students attend school approxi-mately 188 days per year. School usu-ally starts around 7:45 in the morning,and ends around 1:15, with 10 to 25minute breaks between classes. Thereis no lunch period, and most studentsreturn home for lunch. Gymnasium usu-ally include students from grades 5-13,Realschule grades 5-10, and Hauptschulegrades 5-9. Eighth-grade students re-main together throughout the day, withteachers changing classrooms. Classesare usually kept together for several yearsand develop a strong sense of unity.
Most German schools offer few extra-curricular activities. Schools visited byTIMSS observers offered mostly sports,arts, and student government. Studentparticipation was low, and some clubsrarely met. Six percent of German stu-dents said that they participate in a mathor science club each week. Over half ofall German students under the age of15 are involved in organized sports, butthese are sponsored by a nationalorganization’s local sports clubs ratherthan the school.
JJAPAPANAN
Japanese schools are in session 220 daysper year, five days per week, and two Sat-urday mornings per month. School usu-ally starts at 8:00 in the morning andends in the middle of the afternoon, witha lunch break, 5 to 15 minute breaksbetween various periods, and ahomeroom meeting at the beginning andend of each day. The number of classesper day is frequently reduced for specialseasonal events, school-wide meetings,and other activities. Junior high schoolsinclude grades 7-9. Students in a givenclass remain together throughout theday, and a different teacher for each sub-ject comes to the students’ classroom.
Extracurricular or “club” activities are avery important part of Japanese eighth-graders’ lives, and well over half of allstudents participate. Clubs meet dailythroughout the year from the time thatclasses are over until about 5:00 or 6:00.Four percent of Japanese students re-ported participating in a math or scienceclub.

62
In contrast to their German and U.S.counterparts, Japanese junior-highschool students are required to wear uni-forms to school, and must follow a strictdress code. Regular uniform inspectionschastise such deviations as non-regula-tion belts, shoes, hairstyles, jewelry, andnon-regulation book bags. The studentsthemselves play a major role in the en-forcement of school rules and discipline.Between students, there is a complicatedsenior-junior system of deference andbehavior training. Younger studentsspeak to students in upper grades usingthe respectful term sempai (upper-classman/woman). Particularly within theclubs, upper-class students are in chargeof overseeing the younger students.
HOW MUCH STUDHOW MUCH STUDY DOY DOSTUDENTS DO AFTER SCHOOL?STUDENTS DO AFTER SCHOOL?
Study at home is not the same as home-work. Ideally, students would be self-motivated to study mathematics and sci-ence more than the minimum requiredby homework assignments. The degreeto which this actually happens dependson the individual student, and the de-gree to which the culture encourages orrequires eighth-graders to take respon-sibility for their own learning.
Interviews with students about theirdaily lives found that, in all three coun-tries, most students tended to put in ex-tra non-assigned study before examina-tions and relax after they were finished.In Germany and the U.S., the only tests
1100
90
80
70
60
50
40
30
20
10
0UU.S.S.. GERMANYGERMANY JAP JAPANAN
MMAATHEMATHEMATICSTICS
SSCIENCECIENCE75
12
21
4
FIGURE 14FIGURE 14PPERCENTERCENT OFOF M MAATHEMATHEMATICSTICS ANDAND S SCIENCECIENCE T TEACHERSEACHERS W WHOHO
AASSIGNSSIGN H HOMEWORKOMEWORK 3 3 TTOO 5 T 5 TIMESIMES PERPER W WEEKEEK
48
86
SOURCE:Third International Mathematics and Science Study; unpublished tabulations,U.S., German, and Japanese National Surveys; Westat, 1996.

63
U.S. and German teachers not only as-sign more homework than Japanese,but they also spent more class timetalking about or doing it. Time spenton assigning, working on, or sharinghomework occupied 11 percent of U.S.and 8 percent of German lessons, incomparison to 2 percent of Japaneselessons. Furthermore, most U.S. teach-ers reported that they counted home-work toward student grades, whereasthis practice was not common in Ger-many and Japan. It was only in the U.S.that some teachers allocated class timefor students to begin their homework inclass.
The picture changes, however, when stu-dents themselves were asked how muchtime they spend studying math and sci-ence. On average, Japanese, German,and U.S. students reported that theyspent about the same amount of timeeach day — between 30 minutes andan hour — studying mathematics out-side of school, and about the sameamount studying science. These ques-tionnaire findings are in line with whatinterviewers found when they spokewith eighth graders in each countryabout their study habits.
Between 30 minutes and an hour ofafter-school study per night is an aver-age in each country. Of course therewere wide differences between studentseverywhere in how willing they wereto complete assignments or go beyondthem in extra personal study. SomeGerman, Japanese, and U.S. teachersnoted that low-achieving students, par-ticularly those from troubled family
with some consequences for students’academic lives were periodic teacher-pre-pared in-class examinations. There werebroad similarities across countries in stu-dents’ strategies of study for these ex-aminations. High-achieving students de-scribed doing extra hours of non-as-signed review and preparation, while thiswas much less common among lowachievers. In Japan, consciousness aboutthe examinations at the end of ninthgrade caused all eighth graders to bemindful of the need for extra personalstudy and preparation, although highachievers were more likely to translatethis into substantial home study.
Most Americans believe that homeworkis an important part of the learning pro-cess. Some have recommended assign-ment of more homework as a means ofimproving mathematics achievement. Itis frequently assumed that teachers inhigh-achieving countries assign morehomework than do U.S. teachers.
However, TIMSS found that Japaneseteachers actually assigned less home-work than U.S. and German teachers.The teacher questionnaire results andvideotapes of classroom practices bothagree on this finding. Figure 14 on page62 shows that 86 percent of U.S. math-ematics and 75 percent of Germanteachers assigned homework 3 to 5 timesper week, in comparison to 21 percentof Japanese teachers. When asked aboutthe amount of homework they assign,U.S. and German math teachers’ mostcommon response was about thirty min-utes or less, three or more times perweek. Japanese teachers typically as-signed the same amount, but once ortwice per week.

64
dents study in more depth to preparefor entrance examinations. Parents mustpay to send their children to these pri-vate classes, which are run by compa-nies or neighborhood tutors. Research-ers reported that some mothers take anextra job to provide the tuition. Al-though the purpose of juku is academic,students enjoy attending them, becausethey are able to spend time with theirfriends walking or riding subway trainsto and from the classes. Sixty-four per-cent of Japanese eighth graders re-ported attending weekly extra lessonsin math, and 41 percent in science.Most students attend juku one or twohours per week. Attendance drops offsubstantially once high school entranceexaminations are completed. Othertypes of non-academic after-schoolclasses, such as music or marital arts,were also popular among Japanese stu-dents.
Japanese experts report that instructionin mathematics juku focuses more on re-view and practice of basic skills than istypical of Japanese classrooms. This as-sists slower students who need reviewof prior material, and provides all stu-dents extra practice with conceptslearned but not drilled upon in class.Although more systematic study of jukuinstruction is needed, the hypothesismight be entertained that Japanese stu-dents benefit from the different butcomplementary nature of juku and class-room instruction.
backgrounds were less likely to completeassignments, either because they lackedthe motivation, or did not have a familyenvironment which was conducive tohome study. In contrast, some high-achieving students in each country en-gaged in extra study beyond what wasassigned.
If Japanese teachers assigned less home-work than German and U.S. teachers,but Japanese students reported that theystudied about as much as their counter-parts in these countries, how were typi-cal Japanese students motivated andsupported in this extra study? Research-ers who observed and interviewed inJapanese schools and homes reportedthat parents, teachers, and friends en-couraged students to study hard duringtheir eighth and ninth grade years inpreparation for the high school entranceexaminations. Students are believed tohave considerable personal responsibil-ity for this process. Some popular teenmagazines even run articles on how todevise a personal study and review plan.Japanese students described a combina-tion of peer support and competitionthat encouraged them to study harderduring these years. For students whoenter a commercial or vocational highschool, however, extra study tends to falloff again after entrance to high school.
Another important source of outside as-sistance for Japanese students is the juku,which are private after-school classes of-fered in a variety of subjects to helpslower students catch up, or faster stu-

65
WHAWHAT DO STUDENTS THINKT DO STUDENTS THINKABOUT MAABOUT MATHEMATHEMATICS ANDTICS ANDSCIENCE?SCIENCE?
At least half the students in Germany,Japan, and the U.S. reported that theylike math and science. In the U.S.,boys and girls were equally positive, butGerman and Japanese girls were lesspositive than boys in those countries.
How much students like math and sci-ence is a different question. Studentsin all three countries were more in-clined to agree that that it was im-portant to have time to have fun thanthat to do well in mathematics andscience. More students in the U.S. alsoagreed that it was important to do wellin sports than to do well in math andscience. In Germany and Japan, how-ever, fewer students considered it impor-tant to do well in sports than in math-ematics.
Japanese policy makers are currentlydiscussing an emerging social phenom-enon they term risu kirai, or “dislike ofmathematics and science.” Althoughmuch discussed among Japanese ex-perts, it is not clear how widespreadthis phenomenon is in Japan. About10 percent of Japanese students re-ported that they disliked mathematics“a lot,” which was comparable to thenumber of U.S. students who reportedstrongly disliking the subject. Inter-views with Japanese students who dis-liked the subject suggest that they dis-liked it because they saw it as difficultand uninteresting. Japanese teachersspeculated that many of these studentsmay have fallen behind in earlier gradesand never caught up. The teachersthought that the demanding pace of
SOURCE:Third International Mathematics and Science Study: Un-published Tabulations, U.S., German, and Japanese Surveys,Westat, 1996.
FIGURE 15FIGURE 15PPERCENTERCENT OFOF E EIGHTHIGHTH-G-GRADERSRADERS S SPENDINGPENDING 3 3 OROR
MMOREORE H HOURSOURS I INN V VARIOUSARIOUS A AFTERFTER--SSCHOOLCHOOL
AACTIVITIESCTIVITIES ONON AA N NORMALORMAL S SCHOOLCHOOL D DAAYY
WAWATTCHINGCHINGTELEVISIONTELEVISIONOR VIDEOOR VIDEO
PLAPLAYINGYINGWITHWITH
FRIENDSFRIENDS
ENGAGINGENGAGINGIN SPORTSIN SPORTS
READING AREADING ABOOKBOOK
FOR FUNFOR FUN
STUDYINGSTUDYINGMAMATHTH
STUDYINGSTUDYINGSCIENCESCIENCE
0 10 20 30 40 50 60 70
38
37
26
62
31
12
20
3
1
1
39
5
5
6
2
1
1
5
3
2
22
UU.S.S..JJAPAPANAN
GGERMANYERMANY
STUDYINGSTUDYINGOOTHERTHER
SUBJECTSSUBJECTS
66
the curriculum and the need to keep in-struction focused on the material whichwill be covered on the high school en-trance examination caused students tofall behind.
Most Japanese students experiencemathematics and science as difficult.Eighty-seven percent disagreed with thestatement “math is an easy subject,” and85 percent disagreed with a similar state-ment in science. About half of U.S. stu-dents on the other hand, reported thatmath and science are easy. Given thefindings reported in Chapter 3 that theU.S. mathematics curriculum focuses oneasier topics, and that classroom activi-ties are based mostly on routine proce-dures rather than conceptual thinking,the hypothesis might be entertained thatU.S. students’ classroom experiences, atleast in mathematics, lead them to be-lieve that these subjects are easy.
WHAWHAT DO STUDENTS DO AFTERT DO STUDENTS DO AFTERSCHOOL BESIDES STUDSCHOOL BESIDES STUDY?Y?
What other choices and opportunitiesdo societies offer their eighth-graders be-sides focus on school and study? Theway in which societies structure thechoices available to young people showssomething about the priority assignedto schooling and the society’s investmentin education.
Figure 15 on page 65 shows that eighth-graders in all three countries weremore likely to spend extended periodsafter school watching television or vid-eos, playing with friends, or engagingin sports than taking part in more aca-demically-related activities.
Students who watched a lot of televi-sion each day after school were fairlycommon in all three countries, especiallythe U.S. and Japan. After-school sportswere more popular in the U.S than inGermany or Japan. Almost one third ofU.S. eighth-graders reported spendingthree hours per day engaged in sportsactivities. In Germany, friends weremore popular than television. Two-thirdsof German students spent at least threehours per day playing with friends, pos-sibly because German schools finish be-fore lunch, and students have more timeto spend with their friends in the after-noon. Very few students in any of thethree countries spent extended periodsof time reading books for fun or study-ing school subjects.
The priorities that nations assign toschooling are evident in the opportuni-ties provided for students outside ofschool. Japan tries to encourage eighth-graders to focus primarily on school,family, and study. In contrast to U.S.and German schools, Japanese schoolsset and enforce policies for behavior offschool grounds. Examples include poli-cies regarding curfews; clothing to beworn in public; use of bicycle helmets:and prohibitions against entering gamearcades, dating, employment, smoking,and alcohol. In some towns, teachersand parents check shopping malls, parks,and other areas where students are likelyto congregate to monitor student com-pliance with the rules. These policiesmay contribute to Japanese students’reports that they spent less time withtheir friends than German and U.S.teenagers.
In the U.S. and Germany, working at apaid job was not uncommon even for

67
eighth graders. About a quarter of allstudents in these countries reported thatthey worked at a paid job before or af-ter school at least an hour per week. InJapan, this percentage was 4 percent.
In summary, eighth-graders’ lives in Ger-many, Japan, and the U.S. share broadsimilarities in their focus on school,friends, TV, and sports. However, theway in which each society has designed
its schooling process, and the expecta-tions that it sets for students providedifferent motivators, supports, and dis-tractions from study. Considering thechoices that other nations have made inthis regard may help us to better under-stand our own.

68
C O N C L U S I O N SC O N C L U S I O N S
KEY PO INTS :KEY PO INTS :
No single factor can be considered to
influence student performance in isolation
from other factors. There are no single
answers to complex questions.
The content of U.S. eighth-grade
mathematics classes is not as challenging as
that of other countries, and topic coverage is
not as focused.
Most U.S. mathematics teachers report
familiarity with reform recommendations,
although only a few apply the key points in
their classrooms.
Evidence suggests that U.S. teachers do not
receive as much practical training and daily
support as their German and Japanese
colleagues.
69
This report has presented highlightsfrom initial analyses of U.S. eighth-grad-ers in international perspective. Thesefindings lightly sketch only a corner ofthe entire picture of U.S. performancein mathematics and science which willbe painted over the next years as fur-ther analysis of the eighth-grade data iscarried out and findings from grades fourand twelve are added.
This section looks across the findingspresented in the previous pages for in-sights into the key questions with whichthe study started: How do our eighth-graders compare to their internationalcounterparts? What have we learnedabout mathematics achievement and thefactors that may be associated with it?What have we learned about science?What have we learned about how oureducation system as a whole comparesto that of other countries?
Looking for insights into factors associ-ated with student performance is com-plicated because achievement after eightyears of schooling and thirteen years oflife is the product of many different in-fluences. Furthermore, education in ourcountry is a vast system with many in-terrelated parts. No single factor canbe properly considered in isolationfrom others. Realizing that there areno single answers to complex ques-tions, let us review the data.
WHERE DO WE STWHERE DO WE STAND?AND?
The U.S. is far from being among thetop nations of the world in mathemat-ics and science. We are far from this goal.Singapore, Korea, Japan, the Czech Re-public, and Hungary outperform us in
both subjects. Particularly in mathemat-ics, our students lag far behind top-rank-ing countries. Compared to our goalof excellence among nations, we arenot where we aim to be.
However, we are on a par with manyof our international trading partners.Our students stand not far from the in-ternational average: somewhat below inmathematics, and somewhat above inscience. Our math scores are not sig-nificantly different than those of Ger-many and England. Our science scoresare not significantly different than thoseof Germany, England, Canada, and Rus-sia. We rank near the middle of the 41TIMSS countries, among other nationsto whom we frequently compare our-selves.
WHAWHAT HAT HAVE WE LEARNED ABOUTVE WE LEARNED ABOUTMAMATHEMATHEMATICS?TICS?
Our eighth graders score below the in-ternational average in mathematics. Al-though international comparisons overtime are difficult, there does not appearto have been much improvement dur-ing the past three decades in U.S. stu-dents’ international standing in this sub-ject. The following factors may be asso-ciated with this performance:
■ The content of U.S. eighth-gradeThe content of U.S. eighth-grademathematics classes is not as chal-mathematics classes is not as chal-lenging as that of other countries.lenging as that of other countries.
U.S. eighth-grade curriculum and in-struction both appear to be less chal

70
they are aware of current ideas aboutteaching and learning mathematics.Most believe that the lessons theyteach exemplify elements of the rec-ommendations. However, the way inwhich U.S. teachers understand andimplement these recommendationssuggests that they are focusing on iso-lated techniques rather than the cen-tral message that teaching and learn-ing should involve high-level math-ematical thought. Our mathematicsteachers’ typical goal is to teach stu-dents how to do something, ratherthan how to think about and under-stand mathematical concepts. In avariety of respects, Japanese math-ematics teaching more closely re-sembles the recommendations of theU.S. reform movement.
WHAWHAT HAT HAVE WE LEARNED ABOUTVE WE LEARNED ABOUTSCIENCE?SCIENCE?
U.S. eighth graders score above the in-ternational average in science. In thethree previous international science as-sessments, the U.S. scored below the in-ternational average. Because compari-sons of different international assess-ments over time are difficult, cautionshould be exercised in assuming thatthere has been significant improvementin our international standing in science,but it is a possibility.
This initial report contains less informa-tion about science than about math-ematics because the questionnaire datahave not yet been fully analyzed, andthe videotape study of classroom instruc-tion was conducted only in mathemat-ics. Furthermore, because we are unableto use multiple research methods to
lenging than those in other countries.Concerning curriculum, topics cov-ered in U.S. mathematics classroomsare at a seventh-grade level in com-parison to other countries. Virtuallyall German and Japanese studentsstudy algebra and geometry in theeighth grade, while in the U.S., onlystudents in higher-level classes receivesignificant exposure to algebra, andfew students study geometry.
Concerning instruction, the contentof U.S. classes requires less high-levelthought than classes in Germany andJapan. The sequence of mathemati-cal ideas used in lessons was judgedto be of low quality in a majority ofU.S. classrooms, while this was lessfrequently the case in the other twocountries.
■ Topic coverage is not as focusedTopic coverage is not as focusedin U.S. eighth-grade mathematicsin U.S. eighth-grade mathematicsclasses as in the classrooms ofclasses as in the classrooms ofother countries.other countries.
In the U.S., curriculum is determinedat the state and local level, which isatypical among TIMSS countries,most of whom determine curriculumnationally. In all grades 1-8, the U.S.mathematics curriculum recom-mends coverage of more topics thanthe international average. U.S. math-ematics lessons also include a greaternumber of topics and activities thanthose in Germany and Japan.
■ Most U.S. eighth-grade mathMost U.S. eighth-grade mathteachers report familiarity withteachers report familiarity withreform recommendations, al-reform recommendations, al-though only a few apply the keythough only a few apply the keypoints in their classrooms.points in their classrooms.
Ninety-five percent of U.S. eighth-grade mathematics teachers say that

71
verify the science findings from differ-ent perspectives, our findings are moretentative than for mathematics.
Fuller description of eighth-grade scienceteachers’ instructional practices mustawait further questionnaire analysis.
WHAWHAT HAT HAVE WE LEARNED ABOUTVE WE LEARNED ABOUTUU.S. EDUCA.S. EDUCATION AS A WHOLE?TION AS A WHOLE?
TIMSS provides several insights aboutU.S. eighth-grade teachers and students,which are true of both mathematics andscience education.
■ Evidence suggests that U.S. teach-Evidence suggests that U.S. teach-ers do not receive as much practi-ers do not receive as much practi-cal training and daily support ascal training and daily support astheir German and Japanese col-their German and Japanese col-leagues.leagues.
In contrast to new German and Japa-nese teachers, new U.S. teachers donot receive a long-term structured ap-prenticeship in their profession.Once on the job, they have fewer for-mal and informal opportunities todiscuss and share teaching-related is-sues and questions. Schools are man-aged in such a way that lessons arefrequently interrupted by loud-speaker announcements or visitors atthe door.
■ Our eighth-graders spend at leastOur eighth-graders spend at leastas much time studying mathemat-as much time studying mathemat-ics and science as students in Ger-ics and science as students in Ger-many and Japan.many and Japan.
During school, our eighth gradersspend more hours in mathematicsand science classes per year than stu-
dents in Germany and Japan. U.S.teachers assign more homework, andspend more class time discussing itthan teachers in those countries.Outside of school, our students re-port doing about as much math andscience-related homework and otherstudy as German and Japanese stu-dents, although most Japanese eighthgraders also attend after-schoolclasses in mathematics for an houror two per week in preparation forthe entrance exams to high school.
QUESTIONS FOR FURTHER STUDQUESTIONS FOR FURTHER STUDYY
The initial findings described in this re-port raise many important questions forfurther study. Some of these may be an-swered through continued analysis of theeighth-grade data. Others must awaitthe design of future international stud-ies. For this reason, TIMSS is an im-portant national resource for secondaryanalysis and further research. Some ex-amples are:
■ Why is our international standingWhy is our international standinglower in mathematics than in sci-lower in mathematics than in sci-ence?ence?
Deeper analysis of the TIMSS datawill help us to compare the curricu-lum and instructional practices usedin mathematics with those in science,to better understand the similaritiesand differences.

72
■ How is student achievement re-How is student achievement re-lated to curriculum coverage?lated to curriculum coverage?
Comparison of the curriculum analy-sis with achievement scores in thevarious content areas can illuminatethe degree to which our students’ per-formance in algebra, earth science,and other content areas is related tocurricular emphasis in these areas.
■ Does mathematics teaching inDoes mathematics teaching inhigh performing countries re-high performing countries re-semble the reform movement’ssemble the reform movement’srecommendations?recommendations?
The videotape study found that inmany ways, Japanese mathematicsteaching resembles the recommenda-tions of the U.S. reform movementmore closely than does U.S. and Ger-man teaching. Is this an importantfactor in understanding why Japanalso scores among the top nations ofthe world in mathematics? Under-taking similar videotape observa-tional studies of other high-perform-ing nations and further analysis of theTIMSS teacher questionnaire datacould provide insight into this ques-tion.
TIMSS’ LTIMSS’ LONG TERM UTILITY TONG TERM UTILITY TOO
THE NATHE NATIONTION
TIMSS is not an answer book, but a mir-ror through which we can see our owneducation system in international per-spective. It helps us view with new eyesthose aspects of our system which wemay take for granted. Its findings makeus think more deeply about the culturalassumptions and unconscious choiceswhich form the underpinnings of oursociety’s approach to schooling. Wecome to understand our own system bet-ter by comparing it to others. Carefulstudy of our country’s reflection in themirror of international comparisons canprovide information to assist educators,business leaders, teachers, and parentsas they guide our nation in the pursuitof excellence.

73
W O R K SW O R K SC I T E DC I T E D
1Elley, W.B. How in the world do students read? International Association for the Evalu-ation of Educational Achievement, The Hague, Netherlands, July 1992.
2Pelgrum, H. and Plomp, T. International IEA Computers in Education Study: PergamonPress, New York, NY, 1993.
3U.S. Department of Education. National Center for Education Statistics. ReadingLiteracy in the United States: Findings from the IEA Reading Literacy Study, by Binkley,M. and Williams, T. Washington, D.C.: U.S. Government Printing Office, 1996.
4U.S. Department of Education. National Center for Education Statistics. Educa-tion in states and nations: Indicators comparing U.S. states with other industrialized coun-tries in 1991, by Phelps, R.P.; Smith, T.M.; and Alsalam, N. Washington, D.C.: U.S.Government Printing Office, 1996.
5U.S. Department of Education. National Center for Education Statistics. Interna-tional mathematics and science assessments: What have we learned? (NCES 92-011), byMedrich, E.A. and Griffith, J.E.. Washington, D.C.: U.S. Government PrintingOffice, 1992.

74
APPENDIX 1APPENDIX 1ADDITIONAL TIMSS REPORTSADDITIONAL TIMSS REPORTS
For more information visit the TIMSSwebsite at: http://www.ed.gov/NCES/timss.
REPORTS PUBL ISHED ON ORREPORTS PUBL ISHED ON ORBEFORE NOVEMBER 20 , 1996BEFORE NOVEMBER 20 , 1996
Pursuing Excellence. National Center forEducation Statistics. U.S. Departmentof Education. Washington D.C. 1996.Available for downloading from theTIMSS website at: http://www.ed.gov/NCES/timss. Available for sale at theGovernment Printing Office. Phone(202) 512-1800.
Mathematics Achievement in the MiddleSchool Years: IEA’s Third InternationalMathematics and Science Study (TIMSS).Beaton, A.E. et al. Chestnut Hill, Bos-ton College (1996). For informationcontact the TIMSS International StudyCenter, Campion Hall, Rm. 323, Bos-ton College, Chestnut Hill, MA 02167.
Science Achievement in the Middle SchoolYears: IEA’s Third International Mathemat-ics and Science Study (TIMSS). Beaton,A.E. et al. Chestnut Hill, Boston Col-lege (1996). For information contact theTIMSS International Study Center,Campion Hall, Rm. 323, Boston College,Chestnut Hill, MA 02167.
Third International Mathematics and Sci-ence Study: Quality Assurance in Data Col-lection. Martin, M.O, and Mullis, I.V.S.Chestnut Hill, MA: Boston College(1996).
Third International Mathematics and Sci-ence Study Technical Report, Volume I: De-sign and Development. Martin, M.O., andKelly, D.L. Chestnut Hill, MA: BostonCollege (1996).
Characterizing Pedagogical Flow: An Inves-tigation of Mathematics and Science Teach-ing in Six Countries. Schmidt et al.Kluwer, Hingham, MA. (1996).
Mathematics Textbooks: A ComparativeStudy of Grade Eight Texts. Howson, A.G.Pacific Educational Press, University ofBritish Colombia, Vancouver, Canada.(1995).
Curriculum Frameworks for Mathematics andScience. Robitaille, D. F. (ed). PacificEducational Press, University of BritishColombia, Vancouver, Canada. (1993).
FORTHCOMING REPORTSFORTHCOMING REPORTS
Many Visions, Many Aims: A Cross-National Investigation of Curricular In-tentions in School Mathematics.
Many Visions, Many Aims: A Cross-National Investigation of Curricular In-tentions in School Science.
A Splintered Vision: An Investigationof U.S. Science and Mathematics Edu-cation.
U.S. TIMSS: Mathematics and Sciencein the Eighth Grade.
U.S. TIMSS: Compendium of Statistics;7th and 8th Grades.
U.S. TIMSS: Technical Report.
The TIMSS Videotape ClassroomStudy: Methods and Preliminary Find-ings. Stigler, James et al.
The Education System in Germany:Case Study Findings.
The Education System in the U.S.: Case

75
Study Findings.
The Education System in Japan: CaseStudy Findings.
Case Study Literature Review of Educa-tion Policy Topics in Germany, Japan,and the United States.
TIMSS - NAEP Link for Eighth-GradeMathematics in 41 Nations and 43States.
TIMSS - NAEP Link for Eighth-Grade
Science in 41 Nations and 43 States.
Various International and U.S. ReportsBased on 4th Grade TIMSS Data.
Various International and U.S. ReportsBased on 12th Grade TIMSS Data.

76
UU.S. TIMSS STEERING COMMITTEE.S. TIMSS STEERING COMMITTEE
William Schmidt - ChairU.S. TIMSS National Research Coordi-nator, Michigan State University Collegeof Education
Gordon AmbachCouncil of Chief State School Officers
Deborah BallUniversity of Michigan
Audrey ChampagneSUNY University at Albany
David CohenUniversity of Michigan
John DosseyIllinois State University
Emerson ElliottNational Council for Accreditation ofTeacher Education
Sheldon GlashowHarvard University
Larry HedgesUniversity of Chicago
Henry HeikkinenUniversity of Northern Colorado
Jeremy KilpatrickUniversity of Georgia
Mary LindquistColumbus College
Marcia LinnUniversity of California at Berkeley
Robert LinnUniversity of Colorado
Paul SallyThe University of Chicago
Richard ShavelsonStanford University
Bruce SpencerNorthwestern University
Elizabeth StageUniversity of California
James TaylorGlobal M
Kenneth TraversUniversity of Illinois
Paul WilliamsUniversity of Wisconsin
John DosseyIllinois State University
VIDEOVIDEOTTAPE AND CASE STUDAPE AND CASE STUDYYCONSULCONSULTTANT ROUNDTANT ROUNDTABLEABLEMEMBERSMEMBERS
Robert LeVine - ChairHarvard University
Philip AltbachBoston College
Jim HiebertUniversity of Delaware
Eugenia KembleAmerican Federation of Teachers
Dan LevineWestat
Mary LindquistColumbus College
APPENDIX 2APPENDIX 2ADADVISORS TVISORS TO THE UO THE U.S. TIMSS STUD.S. TIMSS STUDYY

77
Francisco RamirezStanford University
Paul Salley,University of Chicago
Rainer SilbereisenUniversity of Jena, Germany
Floraline StevensFloraline I. Stevens and Associates
David StevensonU.S. Department of Education
ADAD VISORS TVISORS T O DEVELO DEVEL OPMENTOPMENTOF THIS REPORTOF THIS REPORT
Joe CrosswhiteOhio State University
Henry HeikkinenUniversity of Northern Colorado
Ross BrewerExemplars
Eugenia KembleAmerican Federation of Teachers

78
NNAATIONALTIONAL A AVERAGEVERAGE S SCORESCORES ANDAND S STTANDARDANDARD E ERRORSRRORS
The 95 percent “plus or minus” confidence interval around eachnation’s score is two times the standard error.
NOTES:1. Nations not meeting international guidelines are shown in parentheses.2. Nations in which more than 10 percent of the population was excluded from testing are shown with a *. Latvia is
designated LSS because only Latvian-speaking schools were tested, which represents less than 65 percent of thepopulation.
3. Nations in which a participation rate of 75 percent of the schools and students combined was achieved only afterreplacements for refusals were substituted, are shown with a o.
4. The international average is the average of the national averages of the 41 nations. It has no standard error.
SOURCE:Beaton et al. (1996) Mathematics achievement in the middle school years. Table 1.1. Boston College: Chestnut Hill, MA.,Beaton et al. (1996) Science achievement in the middle school years. Table 1.1. Boston College: Chestnut Hill, MA.
A P P E N D I X 3
M MAATHEMATHEMATICSTICS S SCIENCECIENCE
CCOUNTRYOUNTRY AAVERVERAAGEGE SSTTANDANDARDARD AAVERVERAAGEGE SSTTANDANDARDARD
EERRORRROR EERRORRROR
(AUSTRALIA) 530 4.0 545 3.9(AUSTRIA) 539 3.0 558 3.7BELGIUM-FLEMISH O 565 5.7 550 4.2(BELGIUM-FRENCH) 526 3.4 471 2.8(BULGARIA) 540 6.3 565 5.3CANADA 527 2.4 531 2.6(COLOMBIA) 385 3.4 411 4.1CYPRUS 474 1.9 463 1.9CZECH REPUBLIC 564 4.9 574 4.3(DENMARK) 502 2.8 478 3.1ENGLAND *O 506 2.6 552 3.3FRANCE 538 2.9 498 2.5(GERMANY) *O 509 4.5 531 4.8(GREECE) 484 3.1 497 2.2HONG KONG 588 6.5 522 4.7HUNGARY 537 3.2 554 2.8ICELAND 487 4.5 494 4.0IRAN, ISLAMIC REPUBLIC 428 2.2 470 2.4IRELAND 527 5.1 538 4.5(ISRAEL) * 522 6.2 524 5.7JAPAN 605 1.9 571 1.6KOREA 607 2.4 565 1.9(KUWAIT) 392 2.5 430 3.7LATVIA (LSS) O 493 3.1 485 2.7LITHUANIA * 477 3.5 476 3.4(NETHERLANDS) 541 6.7 560 5.0NEW ZEALAND 508 4.5 525 4.4NORWAY 503 2.2 527 1.9PORTUGAL 454 2.5 480 2.3(ROMANIA) 482 4.0 486 4.7RUSSIAN FEDERATION 535 5.3 538 4.0(SCOTLAND) 498 5.5 517 5.1SINGAPORE 643 4.9 607 5.5SLOVAK REPUBLIC 547 3.3 544 3.2(SLOVENIA) 541 3.1 560 2.5(SOUTH AFRICA) 354 4.4 326 6.6SPAIN 487 2.0 517 1.7SWEDEN 519 3.0 535 3.0SWITZERLAND O 545 2.8 522 2.5(THAILAND) 522 5.7 525 3.7UNITED STATES O 500 4.6 534 4.7
INTERNATIONAL AVERAGE 513 516

79
Twenty-two of the 41 TIMSS countriesexperienced a more or less serious de-viation from international guidelines forexecution of the study. In 16 countries,the TIMSS International Study Centerconsidered the deviations to be suffi-ciently serious to raise questions aboutthe confidence to be placed in theirscores. These 16 nations with major dif-ficulties are noted with an asterisk in thisappendix, and with parentheses in Fig-ures 1, 2, 3, 5, and 6 in this report.
*Australia - Participation rate did notmeet the international criterion of 75percent of schools and students com-bined. Participation rate was 70 percentafter replacements for refusals were sub-stituted.
*Austria - Participation rate did not meetthe international criterion of at least 50percent participation by schools beforereplacement. The initial participationrate was 41 percent before replacement.Participation rate was 80 percent afterreplacements for refusals were substi-tuted.
*Belgium (Flemish) - Participation rateof 75 percent of schools and studentscombined was achieved only after re-placements for refusals were substituted.
Belgium (French) - Participation rate didnot meet the international criterion of75 percent of schools and students com-bined. Participation rate was 72 percentafter replacements for refusals were sub-stituted.
*Bulgaria - Participation rate did notmeet the international criterion of 75
percent of schools and students com-bined. Participation rate was 63 percentafter replacements for refusals were sub-stituted.
*Colombia - The pair of grades testedwas one grade higher than the interna-tional target. Average age of students inthe upper grade was 15.7.
*Denmark - International guidelines re-quiring random selection of the class-rooms to receive the assessment were notfollowed.
England - More than the internationalcriterion of ten percent of schools andstudents were excused from the test forvarious reasons with resulting coverageof 89 percent of the desired population.Participation rate of 75 percent ofschools and students combined wasachieved only after replacements for re-fusals were substituted.
*Germany - The pair of grades testedwas one grade higher than the interna-tional target. Average student age of stu-dents in the upper grade was 14.8. Oneof sixteen regions (Baden-Wuerttemberg)did not participate in the study, with re-sulting coverage of 88 percent of the de-sired population. Participation rate of75 percent of schools and students com-bined was achieved only after replace-ments for refusals were substituted.
*Greece - International guidelines requir-ing random selection of the classroomsto receive the assessment were not fol-lowed.
A P P E N D I X 4
S U M M A R Y O F N A T I O N A L D E V I A T I O N S F R O M
I N T E R N A T I O N A L S T U D Y G U I D E L I N E S

80
*Israel - Test administered only in theHebrew-speaking public school system,with resulting coverage of 74 percent ofthe desired population. Internationalguidelines requiring random selection ofthe classrooms to receive the assessmentwere not followed. Participation rate didnot meet the international criterion ofat least 50 percent participation byschools in the sample before replace-ment. The participation rate before re-placement was 45 percent.
*Kuwait - In contrast to other nations,which tested two adjacent grades, Ku-wait tested only one grade; the ninthgrade. This grade was higher than ei-ther of the grades which should havebeen the international target. Averagestudent age was 15.3.
Latvia (LSS) - Test administered only inLatvian-speaking schools, with resultingcoverage of 51 percent of the desiredpopulation. Because coverage falls be-low the international 65 percent popu-lation-coverage criterion, Latvia is des-ignated (LSS) for Latvian SpeakingSchools.
Lithuania - Test administered only inLithuanian-speaking schools, with re-sulting coverage of 84 percent of the de-sired population.
*Netherlands - Participation rate did notmeet the international criterion of atleast 50 percent participation by schoolsbefore replacement. The initial partici-pation rate before replacement was 24percent.
*Romania - The pair of grades tested wasone grade higher than the internationaltarget. Average student age in the up-per grade was 14.6.
*Scotland - Participation rate did notmeet the international criterion of 75percent of schools and students com-bined. Participation rate was 73 percentafter replacements for refusals were sub-stituted.
*Slovenia - The pair of grades tested wasone grade higher than the internationaltarget. Average student age was 14.8.
*South Africa - International guidelinesrequiring random selection of the class-rooms to receive the assessment were notfollowed. Participation rate did not meetthe international criterion of 75 percentof schools and students combined. Par-ticipation rate was 62 percent after re-placements for refusals were substituted.
Switzerland - Test administered in 22 of26 cantons, with resulting coverage of86 percent of the desired population.
*Thailand - International guidelines re-quiring random selection of the class-rooms to receive the assessment were notfollowed.
United States - Participation rate of 75percent of schools and students com-bined was achieved only after replace-ments for refusals were substituted.