putnam world trust - morningstar, inc
TRANSCRIPT

Putnam World Trust(formerly Putnam World Trust II)
Annual Report30 June 2008
Report and audited financial statements for the year ended
30 June 2008.
A Unit Trust authorised by the Irish Financial
Services Regulatory Authority under the
European Communities (Undertakings for
Collective Investment in Transferable Securities)
Regulations 2003, as amended.

This Report includes inter alia information in relation to the Putnam Global Fixed Income Alpha Fund S1 and Putnam Global Fixed
Income Alpha Fund S2, for which notice for public distribution pursuant to section 132 of the German Investment Act has not been
filed with the German Financial Regulator (the Bafin). Units in these Funds will not be publicly marketed to investors who are
governed by the German Investment Act.
2

Contents Page
Background to the Trust 4
Investment Objectives 6
Policies 8
Investment Manager’s Report 9
Putnam World Trust Total Return 10
Putnam Emerging Information Sciences Fund 13
Putnam Emerging Markets Debt Fund 13
Putnam Europe Equity Fund 14
Putnam Global Equity Multi-Alpha Fund 14
Putnam Global Fixed Income Alpha Fund S1 15
Putnam Global Fixed Income Alpha Fund S2 15
Putnam Global Growth Fund 16
Putnam Global High Yield Bond Fund 16
Putnam Growth and Income (U.S. Value Equity) Fund 17
Putnam International (Non U.S. Core) Equity Fund 17
Putnam Investors (U.S. Core Equity) Fund 18
Putnam New Opportunities
(U.S. Aggressive Growth Equity) Fund 18
Putnam Total Return Fund 19
Putnam U.S. Liquid Assets Fund 19
Putnam U.S. Small-Cap Value Equity Fund 20
Total Expense Ratio (TER) (Unaudited) 21
Portfolios’ Turnover Rate (PTR) (Unaudited) 21
Statement of Manager’s Responsibilities 22
Report of the Trustee to the Unitholders 22
Independent Auditor’s Report 24
Schedule of Investments
Putnam Emerging Information Sciences Fund 25
Putnam Emerging Markets Debt Fund 27
Putnam Europe Equity Fund 29
Putnam Global Equity Multi-Alpha Fund 32
Putnam Global Fixed Income Alpha Fund S1 35
Putnam Global Fixed Income Alpha Fund S2 51
Putnam Global Growth Fund 67
Putnam Global High Yield Bond Fund 72
Putnam Growth and Income (U.S. Value Equity) Fund 80
Putnam International (Non U.S. Core) Equity Fund 82
Putnam Investors (U.S. Core Equity) Fund 86
Putnam New Opportunities
(U.S. Aggressive Growth Equity) Fund 88
Putnam Total Return Fund 91
Putnam U.S. Liquid Assets Fund 112
Putnam U.S. Small-Cap Value Equity Fund 114
Contents Page
Profit and Loss Account 117
Balance Sheet 127
Statement of Changes in Net Assets Attributable
to Redeemable Participating Unitholders 137
Notes to the Financial Statements 147
Schedule of Portfolio Changes (Unaudited)
Putnam American Government Bond Fund 197
Putnam Emerging Information Sciences Fund 198
Putnam Emerging Markets Debt Fund 198
Putnam Europe Equity Fund 199
The George Putnam (U.S. Equity and Bond) Fund 200
Putnam Global Equity Multi-Alpha Fund 201
Putnam Global Fixed Income Alpha Fund S1 202
Putnam Global Fixed Income Alpha Fund S2 203
Putnam Global Growth Fund 204
Putnam Global High Yield Bond Fund 204
Putnam Growth and Income (U.S. Value Equity) Fund 205
Putnam International (Non U.S. Core) Equity Fund 205
Putnam Investors (U.S. Core Equity) Fund 206
Putnam New Opportunities
(U.S. Aggressive Growth Equity) Fund 206
Putnam Opportunistic Value Fund 207
Putnam Total Return Fund 208
Putnam U.S. Liquid Assets Fund 209
Putnam U.S. Small-Cap Value Equity Fund 209
Putnam Vista (U.S. Mid-Cap Equity) Fund 210
Organisation 211
3
Putnam World Trust (“the Trust”) is an umbrella unit trust established as an Undertaking for Collective Investment in TransferableSecurities pursuant to the European Communities (Undertakings for Collective Investment in Transferable Securities) Regulations,2003 (as amended). The Trust converted to UCITS III in 2006. The Trust was constituted on 18 February 2000 and commencedoperations on 22 February 2000. Prior to 2 September 2008, the Trust was known as Putnam World Trust II.
The Trust is an umbrella unit trust comprising Funds in which different classes of Units may be issued from time to time. Each Fundrepresents interests in a trust comprising a separate and distinct portfolio of investments. The Manager may issue different classesof Units in each Fund. Each Fund will bear its own liabilities and shall not bear the liabilities of any other Fund.
No material changes to the prospectus were made during this reporting period.
Effective 2 September 2008, a number of changes were made to the Trust’s prospectus. Additional detail about these changes, which werecommunicated to all Unitholders of the Trust, is available in the Trust’s prospectus and will be included in the semi-annual accounts.
1) The Trust’s name changed from Putnam World Trust II to Putnam World Trust.
2) The name of the Trust’s manager changed from Putnam Investments Limited to Putnam Investments (Ireland) Limited.
3) A number of revisions were made to the various sub-funds’ distribution policies and classes of Units (including the investmentminimums, management fees, class currencies, and sales charges for certain classes). In addition, the dealing days for some sub-funds were amended.
4) Six additional sub-funds of the Trust, offering investment in a variety of asset classes, are expected to be launched during fall 2008.
In addition, during the fiscal year, three sub-funds – Putnam American Government Bond Fund, Putnam Opportunistic Value Fund,and The George Putnam (U.S. Equity and Bond) Fund – were liquidated, and Putnam Vista (U.S. Mid-Cap Equity) Fund merged intoPutnam New Opportunities (U.S. Aggressive Growth Equity) Fund. Also, Class E Units were launched for Putnam New Opportunities(U.S. Aggressive Growth Equity) Fund. For more information on these changes, please refer to the Trust’s prospectus, or contact theManager for more detail.
4
PutnamWorld Trust Background to the Trust

As of 30 June 2008, the Trust comprised the following Funds and Classes of Units in issue:
Fund Base Currency————————————————————————————————————————————————————————————————————————————————————————————————————————————————
Putnam Diversified Income Fund‡ N/A US Dollar
Putnam Emerging Information Sciences Fund Classes A, B, C, E, I, and T†† US Dollar
Putnam Emerging Markets Debt Fund Classes A, B, C, and I US Dollar
Putnam Europe Equity Fund Classes A, B, C, E, and I US Dollar
Putnam European High Yield Fund‡ N/A Euro
Putnam Global Equity Multi-Alpha Fund Classes A, B, C, J†, M, and Q US Dollar
Putnam Global Fixed Income Alpha Fund S1* Class S Sterling
Putnam Global Fixed Income Alpha Fund S2** Classes I and S Sterling
Putnam Global Growth Fund Classes A, B, and I US Dollar
Putnam Global High Yield Bond Fund Classes A, B, C, E, I, S, and T†† US Dollar
Putnam Global Income Fund‡ N/A US Dollar
Putnam Growth and Income (U.S. Value Equity) Fund Classes A, B, C, E, and I US Dollar
Putnam High Yield Advantage Fund‡ N/A US Dollar
Putnam Income Fund‡ N/A US Dollar
Putnam International (Non U.S. Core) Equity Fund Classes A, B, C, and I US Dollar
Putnam Investors (U.S. Core Equity) Fund Classes A, B, C, E, I, and M US Dollar
Putnam New Opportunities
(U.S. Aggressive Growth Equity) Fund Classes A, B, C, E, and I US Dollar
Putnam Total Return Fund Classes A, B, C, E, J†, M, Q, and S US Dollar
Putnam U.S. Government Bond Fund‡ N/A US Dollar
Putnam U.S. Liquid Assets Fund Classes A, B, C, and I US Dollar
Putnam U.S. Small-Cap Value Equity Fund Classes A, B, C, E, I, and M US Dollar
* Class S Units of Putnam Global Fixed Income Alpha Fund S1 were launched on 21 February 2008.
** Class S Units of Putnam Global Fixed Income Alpha Fund S2 were launched on 25 February 2008. Class I Units were launched on 1 May 2008.
‡ This Fund has not been activated and is not available to investors at the time this report is issued.
† Class J Units are available for investment only by other collective investment funds.
†† Class T Units of Putnam Emerging Information Sciences Fund and Putnam Global High Yield Bond Fund were registered on 31 July 2007 and were launched
on 26 November 2007.
For Funds with Class E Units and certain Class M Units, Units are stated in euros (¤) throughout this report.
Effective 2 September 2008, various changes were made to the Unit Classes of the Funds, including termination of certain classes and launch of additional classes. Detailed
information on these changes is available in the Trust’s prospectus and will be included in the next semi-annual accounts.
5
Classes of Units
Currently in Issue

The assets of each Fund will be invested separately in accordancewith the investment objectives and policies of the Fund. EachFund has its own investment goal and strategy for pursuing it.
Six additional sub-funds of the Trust were created followingthe close of the financial year and will become available forinvestment during Autumn 2008. Details of these sub-funds areavailable in the Trust’s prospectus and will be included in the next semi-annual accounts.
Putnam Emerging Information Sciences Fund The Fund’s investment objective is long-term capital growth.The Fund seeks to achieve its objective by investing at least twothirds of its total assets (after deduction of ancillary liquidassets) in a diversified portfolio of equity securities issued bycompanies in the information science industries with specialemphasis on small or emerging companies whose equitysecurities will be listed or traded on Recognised Exchanges.
Putnam Emerging Markets Debt Fund The Fund’s investment objective is to seek high current income.The Fund seeks its objective by investing at least two thirds of itstotal assets (after deduction of ancillary liquid assets) in adiversified portfolio of global fixed income and other debt anddebt-related instruments. The Fund intends to invest in issuesfrom the so-called emerging markets, including but not limitedto Latin America, Asia, Central and Eastern Europe, Africa, andthe Middle East. Debt-related instruments shall include but arenot limited to corporate and government bonds. There is also nolimit on the percentage of the Fund’s assets that may be investedin any rating category or in unrated categories.
Putnam Europe Equity Fund The Fund’s investment objective is long-term capital appreciation.The Fund seeks its objective by investing at least two thirds of itstotal assets (after deduction of ancillary liquid assets) in adiversified portfolio of common stocks and other equity securitiesof European companies. The Fund will consider an issuer ofsecurities to be a “European company” if it is organised underthe laws of a European country or has a principal office in aEuropean country. The Fund may also invest in equity securitiestraded on US exchanges and over-the-counter markets,securities convertible into equity securities, and ADRs(American Depository Receipts).
Putnam Global Equity Multi-Alpha FundThe Fund’s investment objective is long-term capital appreciation,which the Fund will seek by investing at least two-thirds of itstotal assets (after deduction of ancillary liquid assets) in equitysecurities of companies that are listed or traded on a RecognisedExchange. ADRs, GDRs, and securities issued under Rule 144awill be permitted and investments may also be made indirectlythrough the use of derivatives, such as warrants and rights.
Putnam Global Fixed Income Alpha Fund S1
The Fund’s investment objective is to achieve an annual totalreturn before fees that exceeds six-month Sterling LIBOR by1.0% or more, as measured over rolling three-year periods.The Fund proposes to seek this objective by investingprincipally and at least two-thirds of its total assets (afterdeduction of ancillary liquid assets) in listed transferablesecurities, i.e. investment-grade and non-investment-gradegovernment, agency, supranational, corporate, and securitisedbonds (including commercial paper and convertible bonds),collateralised mortgage obligations, asset-backed and mortgage-backed securities, collateralised securities, securitised loaninterests, certificates of deposit, and other short-terminstruments and other similar instruments.
Putnam Global Fixed Income Alpha Fund S2
The Fund’s investment objective is to achieve an annual totalreturn before fees that exceeds six-month Sterling LIBOR by2.0% or more, as measured over rolling three-year periods.The Fund proposes to seek this objective by investingprincipally and at least two-thirds of its total assets (afterdeduction of ancillary liquid assets) in listed transferablesecurities, i.e. investment-grade and non-investment-gradegovernment, agency, supranational, corporate, and securitisedbonds (including commercial paper and convertible bonds),collateralised mortgage obligations, asset-backed andmortgage-backed securities, collateralised securities,securitised loan interests, certificates of deposit, and othershort-term instruments and other similar instruments.
Putnam Global Growth Fund The Fund’s investment objective is to seek capital appreciation.Current income is only an incidental consideration. The Fundfollows a global investment strategy of investing at least twothirds of its total assets (after deduction of ancillary liquidassets) in equity securities traded on Recognised Exchangeslocated in a number of countries. The Fund may at times investup to 100% of its assets in securities principally traded onRecognised Exchanges outside the United States. Under normalmarket conditions, the Fund invests at least 65% of its assets inat least three different countries, one of which may be theUnited States.
Putnam Global High Yield Bond Fund The Fund seeks high current income. Capital growth is asecondary objective when consistent with the objective of highcurrent income. The Fund seeks high current income byinvesting at least two thirds of its total assets (after deduction ofancillary liquid assets) in high-yielding, lower-rated debtsecurities such as securities rated lower than BBB by Standard& Poor’s or Baa by Moody’s, and listed or traded on RecognisedExchanges, constituting a portfolio that the Investment Advisorbelieves does not involve undue risk to income or principal.
6
PutnamWorld Trust Investment Objectives*
* Funds that no longer offer their Units and are in the process of deauthorisation are not listed.

Putnam Growth and Income (U.S. Value Equity) Fund The primary investment objective of the Fund is capital growth.Current income is a secondary objective. The Fund invests atleast two thirds of its total assets (after deduction of ancillaryliquid assets) in equity securities of companies organised orwhose principal office is in the United States that offer potentialfor capital growth and may, consistent with the Fund’s primaryinvestment objective, invest in stocks that offer potential forcurrent income. The Fund may invest up to 20% of its net assetsin securities principally traded in non-US markets.
Putnam International (Non U.S. Core) Equity Fund The Fund’s investment objective is long-term capital appreciation.The Fund seeks its objective by investing at least two thirds of itstotal assets (after deduction of ancillary liquid assets) in equitysecurities of companies located outside the United States. TheFund may invest in equity securities traded on US exchanges(including the Nasdaq) and over-the-counter markets, securitiesconvertible into equity securities (including warrants), and ADRs.
Putnam Investors (U.S. Core Equity) Fund The Fund aims to achieve long-term capital growth and anyincome that results from this growth. The Fund is designed forinvestors seeking long-term growth of capital from a portfolioinvesting at least two thirds of its total assets (after deduction ofancillary liquid assets) in equity securities issued by companiesorganised or whose principal office is in the United States.Although the Fund’s investments are not limited to anyparticular type of company, the Investment Advisor currentlyexpects that the Fund will invest a substantial portion of itsassets in common stocks of companies with marketcapitalisations of more than US$1 billion.
Putnam New Opportunities (U.S. Aggressive Growth Equity) Fund The Fund’s investment objective is long-term capital appreciation.The Fund seeks its objective by investing at least two thirds of itstotal assets (after deduction of ancillary liquid assets) in commonstocks of companies organised or whose principal office is in theUnited States that are in sectors of the US economy that theInvestment Advisor believes possess above-average, long-termgrowth potential. The Fund will generally invest in companiesthat the Investment Advisor identifies as offering the bestprospects for long-term growth within a particular sector.
Putnam Total Return FundThe Fund’s investment objective is to provide positive totalreturn, both relative and absolute, by investing its net assetsprimarily in a diversified multi-asset class portfolio of globalequities (including preferred stocks and convertible securities),and in a wide range of fixed-income securities. The portfolio willinclude US and non-US securities and US and non-US debtinstruments, which are listed or traded on Recognised Exchanges.
Putnam U.S. Liquid Assets Fund††
The Fund seeks as high a level of current income as the InvestmentAdvisor believes is consistent with preservation of capital andmaintenance of liquidity. The Fund pursues its objectives byinvesting in a portfolio of high-quality US dollar-denominatedmoney market instruments issued by entities organised orhaving their principal offices in the United States. Examples ofthese instruments include (but are not limited to) bank certificatesof deposit (CDs), bankers’ acceptances, prime commercialpaper, corporate obligations, and government securities.
Putnam U.S. Small-Cap Value Equity Fund The Fund’s investment objective is to achieve long-term capitalgrowth and any income that results from this growth. The Fundis designed for investors seeking long-term growth of capitalfrom a portfolio investing at least two-thirds of its total assets(after deduction of ancillary liquid assets) in equity securities ofcompanies with market capitalisations of not more thanUS$5 billion (“small-cap companies”). The Fund will invest atleast two thirds of its total assets (after deduction of ancillaryliquid assets) in equity securities issued by small-cap companiesorganised or whose principal office is located in the UnitedStates. The Fund may invest up to one-third of its net assets inequity securities with larger market capitalisations or equitysecurities principally traded on non-US securities markets.
7
† Putnam U.S. Liquid Assets Fund was terminated on 19 September 2008.

8
PutnamWorld Trust Policies
DISTRIBUTION POLICY AS OF 30 JUNE 2008
Each Fund has its own specific distribution policy. If theManager decides to make a distribution, it will be paid at theManager’s discretion as set out in the relevant prospectussupplement for the Fund. For certain Funds, the Manager willdistribute all net investment income of a Fund at least annuallyand sometimes more frequently, as specified in the relevantsupplement. The Manager does not currently intend to makeany distributions of realised capital gains, unless otherwisespecified in the prospectus.
Distributions shall be made to the Unitholders on record on thedate of distribution rate in accordance with the number of Unitsheld in that particular Fund. The distributions payable toUnitholders will be reinvested in Units of the relevant Fundunless otherwise requested by the Unitholder.
Putnam Total Return Fund, Putnam Global Fixed Income AlphaFund S1, Putnam Global Fixed Income Alpha Fund S2 andPutnam Global Equity Multi-Alpha Fund, as well as Class TUnits of Putnam Emerging Information Sciences Fund andPutnam Global High Yield Bond Fund, do not currently intendto distribute net investment income, though the Manager hasthe discretion to do so at any time. If, in the future, it isdetermined that this will be done, the amount to be distributedto Unitholders will be decided upon by the Manager. Suchdistributions, if any, will be made annually within four monthsof the financial year-end.
Effective 2 September 2008, changes were made to thedistribution policies of the existing Units of the Trust. Detailedinformation on these changes is available in the Trust’sprospectus and will be included in the next semi-annual accounts.
CALCULATION OF NET ASSET VALUE The net asset value of each Fund will be expressed in the basecurrency of the relevant Fund and will be calculated on eachDealing Day by ascertaining the value of the assets of the Fundon such Dealing Day and deducting, from such value, theliabilities of the Fund on such Dealing Day. The net asset valueper Unit is calculated by dividing the net asset value of therelevant Fund by the number of Units then outstanding for thatFund, or the net asset value of the relevant Fund attributable tothe Class of Unit divided by the number of Units in that Classthen in issue or deemed to be in issue on such Dealing Day androunding the result to the nearest Unit of currency.
The most recently available net asset value per Unit and the netasset value per Unit per Class on each Dealing Day will be madepublic at the registered office of the Administrator and either atthe Financial Times or at the following website address:www.putnam.com; and/or in any other publication that theManager may from time to time determine.
CALCULATION OF SALES CHARGES AS OF 30 JUNE 2008
For all Funds except for Putnam Global Equity Multi-AlphaFund and Putnam Total Return Fund, Class I, J, and M Unitsmay be subject to an initial sales charge of up to 5% of the NetAsset Value per Unit at the discretion of the Manager. Class A,E, S, and T Units may be subject to a sales charge of up to 6.25%.Class B and C Units may be subject to a deferred sales charge.
Class C Units are not subject to an initial sales charge at the timeof purchase, but a higher ongoing management fee is paid out ofassets, and Unitholders may incur a 1% CDSC (ContingentDeferred Sale Charge) if the Units are redeemed within one yearof purchase.
For Putnam Total Return Fund, Class E, I, J, M, Q, and S Unitshave no initial or deferred sales charge.
For Putnam Global Equity Multi-Alpha Fund, Class I, J, M, andQ Units have no initial or deferred sales charges. It is currentlyexpected that Class J Units will only be available for investmentby other collective investment funds (e.g., feeder funds) but theManager reserves the right to vary this policy at any time.
Effective 2 September 2008, changes were made to the salescharges of the existing Units of the Trust. Detailed informationon these changes is available in the Trust’s prospectus and willbe included in the next semi-annual accounts.
FINANCIAL DERIVATIVES INSTRUMENTSThe Manager may, on behalf of each Fund, employ techniquesand instruments relating to transferable securities and moneymarket instruments under and in accordance with conditions orrequirements imposed by the Financial Regulator. Thederivatives used by the Funds may include futures, swaps,options, TBA purchase and sales, forward contracts, andcontracts for difference, and they may be used for hedging andfor investment purposes, including as a substitute for directinvestment in securities or to obtain additional exposure beyondthat which might be obtained from a traditional securitiesportfolio, subject always to the restrictions and requirements ofthe Financial Regulator. Details of the derivatives that may beused are set out in the derivatives risk management process filedwith the Financial Regulator. The Funds may also use forwardforeign exchange contracts and other currency instruments forhedging or to alter the currency exposure characteristics oftransferable securities held by the Funds as an alternativecurrency exposure management strategy. The techniques andinstruments that the Manager may use on behalf of the Trust orany Fund are set out in Appendix II of the Prospectus and,if applicable to a particular Fund, the relevant Supplement.
For the purpose of providing margin or collateral in respect oftransactions in techniques and instruments, the Trustee maytransfer, mortgage, charge, or encumber any assets or cashforming part of the relevant Fund.
Dear Unitholder:
Global financial markets are currently experiencing the kind of upheaval not seen in many years. Investor confidence hasbeen shaken by losses across a range of sectors worldwide and by the collapse of several prominent financial companies.On 3 October, US lawmakers approved a US$700 billion rescue plan for the financial industry. The plan allows theUS Treasury to buy the failed mortgages and mortgage-related securities that are at the heart of the crisis. Treasurysecretary Henry Paulson said that this comprehensive plan was necessary because the “case-by-case” rescues of firms suchas Bear Stearns, AIG, Fannie Mae, and Freddie Mac had not done enough to restore investor confidence. Europeangovernments had also begun to take steps to protect the financial system, which included measures to shore up banks.We are encouraged by the actions being taken, which we believe will restore stability to the financial system in due course,although the process likely will take some time.
As a Unitholder of one or more Putnam World Trust Funds, you should feel confident about the financial standing of PutnamInvestments. Our parent companies, Great-West Lifeco and Power Financial Corporation, are among the largest and mostsuccessful organisations in the financial services industry. All three companies are well-capitalised with strong cash flows.
We are pleased to announce that Robert L. Reynolds, a well-known leader and visionary in the mutual fund industry,joined the Putnam leadership team as President and Chief Executive Officer of Putnam Investments effective 1 July 2008.Charles E. Haldeman, Jr., former President and CEO, has taken on the role of Chairman of Putnam InvestmentManagement, LLC, the firm’s United States fund management company.
Mr. Reynolds brings to Putnam substantial industry experience and an outstanding record of success. He was Vice Chairmanand Chief Operating Officer at Fidelity Investments from 2000 to 2007, and President of Fidelity’s Institutional RetirementGroup from 1996 to 2000. We are extremely pleased to be working with Bob as we continue to position Putnam to exceed ourinvestors’ expectations.
I would like to take this opportunity to welcome new investors to the Funds and, on behalf of everyone at Putnam Investments(Ireland) Limited, to thank all of our investors for your continued confidence in the Putnam World Trust family of funds.
Respectfully yours,
Joseph T. Phoenix
Director
Putnam Investments (Ireland) Limited
24 October 2008
9
PutnamWorld Trust Investment Manager’s Report

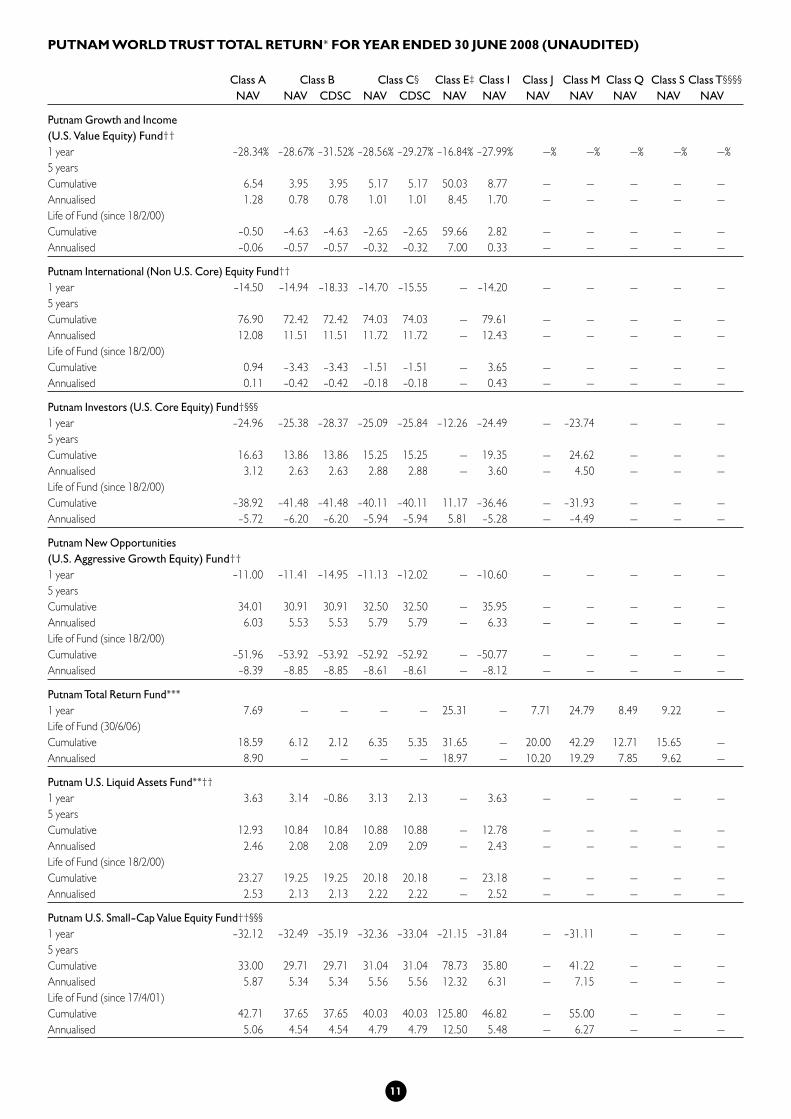
PUTNAM WORLD TRUST TOTAL RETURN* FOR YEAR ENDED 30 JUNE 2008 (UNAUDITED)
Class A Class B Class C§ Class E‡ Class I Class J Class M Class Q Class S Class T§§§§
NAV NAV CDSC NAV CDSC NAV NAV NAV NAV NAV NAV NAV
Putnam Emerging Information Sciences Fund†
1 year -19.79% -20.18% -23.37% -19.91% -20.71% -6.59% -19.47% —% —% —% —% —%
5 years
Cumulative 47.06 43.56 43.56 45.32 45.32 101.23 50.14 — — — — —
Annualised 8.02 7.50 7.50 7.76 7.76 15.01 8.47 — — — — —
Life of Fund (since 3/4/00)
Cumulative -77.70 -78.66 -78.66 -78.15 -78.15 30.75 -76.97 — — — — —
Annualised -16.65 -17.09 -17.09 -16.86 -16.86 3.95 -16.32 — — — — —
Putnam Emerging Markets Debt Fund
1 year 4.10 3.50 -0.49 3.46 2.46 — 3.92 — — — — —
Life of Fund (since 31/1/05)
Cumulative 23.43 21.07 20.07 21.49 21.49 — 23.04 — — — — —
Annualised 6.34 5.75 5.49 5.85 5.85 — 6.25 — — — — —
Putnam Europe Equity Fund††
1 year -16.93 -17.32 -20.63 -17.12 -17.95 -12.22 -16.61 — — — — —
5 years
Cumulative 86.36 81.99 81.99 83.19 83.19 98.26 90.32 — — — — —
Annualised 13.26 12.72 12.72 12.87 12.87 14.67 13.74 — — — — —
Life of Fund (since 18/2/00)
Cumulative 4.52 0.26 0.26 1.99 1.99 59.03 7.83 — — — — —
Annualised 0.53 0.03 0.03 0.24 0.24 6.94 0.91 — — — — —
Putnam Global Equity Multi-Alpha Fund***
1 year -12.76 — — — — — — -11.40 -12.70 -12.05 — —
Life of Fund (30/6/06)
Cumulative 10.24 -15.53 -18.91 -15.41 -16.26 — — 12.47 10.00 -0.35 — —
Annualised 5.00 — — — — — — 6.46 4.88 -0.22 — —
Putnam Global Fixed Income Alpha Fund S1
Life of fund (since 21/2/08)
Cumulative — — — — — — — — — — 2.80 —
Annualised — — — — — — — — — — — —
Putnam Global Fixed Income Alpha Fund S2‡‡
Life of fund (since 25/2/08)
Cumulative — — — — — — -0.91 — — — 1.32 —
Annualised — — — — — — — — — — — —
Putnam Global Growth Fund†
1 year -11.96 -12.37 -15.87 — — — -11.62 — — — — —
5 years
Cumulative 55.43 51.49 51.49 — — — 58.43 — — — — —
Annualised 9.22 8.66 8.66 — — — 9.64 — — — — —
Life of Fund (since 18/2/00)
Cumulative -39.05 -41.56 -41.56 — — — -36.99 — — — — —
Annualised -5.75 -6.22 -6.22 — — — -5.37 — — — — —
Putnam Global High Yield Bond Fund†§§
1 year -3.95 -4.35 -7.95 -4.18 -5.06 11.61 -4.11 — — — -3.35 -4.07
5 years
Cumulative 34.07 30.95 30.95 31.80 31.80 76.99 34.25 — — — — 33.90
Annualised 6.04 5.54 5.54 5.68 5.68 12.10 6.07 — — — — 6.01
Life of Fund (since 18/2/00)
Cumulative 35.30 29.55 29.55 31.97 31.97 78.03 38.19 — — — 37.60 35.13
Annualised 3.68 3.14 3.14 3.37 3.37 11.96 3.94 — — — 7.49 3.66
10
Putnam Growth and Income
(U.S. Value Equity) Fund††
1 year -28.34% -28.67% -31.52% -28.56% -29.27% -16.84% -27.99% —% —% —% —% —%
5 years
Cumulative 6.54 3.95 3.95 5.17 5.17 50.03 8.77 — — — — —
Annualised 1.28 0.78 0.78 1.01 1.01 8.45 1.70 — — — — —
Life of Fund (since 18/2/00)
Cumulative -0.50 -4.63 -4.63 -2.65 -2.65 59.66 2.82 — — — — —
Annualised -0.06 -0.57 -0.57 -0.32 -0.32 7.00 0.33 — — — — —
Putnam International (Non U.S. Core) Equity Fund††
1 year -14.50 -14.94 -18.33 -14.70 -15.55 — -14.20 — — — — —
5 years
Cumulative 76.90 72.42 72.42 74.03 74.03 — 79.61 — — — — —
Annualised 12.08 11.51 11.51 11.72 11.72 — 12.43 — — — — —
Life of Fund (since 18/2/00)
Cumulative 0.94 -3.43 -3.43 -1.51 -1.51 — 3.65 — — — — —
Annualised 0.11 -0.42 -0.42 -0.18 -0.18 — 0.43 — — — — —
Putnam Investors (U.S. Core Equity) Fund†§§§
1 year -24.96 -25.38 -28.37 -25.09 -25.84 -12.26 -24.49 — -23.74 — — —
5 years
Cumulative 16.63 13.86 13.86 15.25 15.25 — 19.35 — 24.62 — — —
Annualised 3.12 2.63 2.63 2.88 2.88 — 3.60 — 4.50 — — —
Life of Fund (since 18/2/00)
Cumulative -38.92 -41.48 -41.48 -40.11 -40.11 11.17 -36.46 — -31.93 — — —
Annualised -5.72 -6.20 -6.20 -5.94 -5.94 5.81 -5.28 — -4.49 — — —
Putnam New Opportunities
(U.S. Aggressive Growth Equity) Fund††
1 year -11.00 -11.41 -14.95 -11.13 -12.02 — -10.60 — — — — —
5 years
Cumulative 34.01 30.91 30.91 32.50 32.50 — 35.95 — — — — —
Annualised 6.03 5.53 5.53 5.79 5.79 — 6.33 — — — — —
Life of Fund (since 18/2/00)
Cumulative -51.96 -53.92 -53.92 -52.92 -52.92 — -50.77 — — — — —
Annualised -8.39 -8.85 -8.85 -8.61 -8.61 — -8.12 — — — — —
Putnam Total Return Fund***
1 year 7.69 — — — — 25.31 — 7.71 24.79 8.49 9.22 —
Life of Fund (30/6/06)
Cumulative 18.59 6.12 2.12 6.35 5.35 31.65 — 20.00 42.29 12.71 15.65 —
Annualised 8.90 — — — — 18.97 — 10.20 19.29 7.85 9.62 —
Putnam U.S. Liquid Assets Fund**††
1 year 3.63 3.14 -0.86 3.13 2.13 — 3.63 — — — — —
5 years
Cumulative 12.93 10.84 10.84 10.88 10.88 — 12.78 — — — — —
Annualised 2.46 2.08 2.08 2.09 2.09 — 2.43 — — — — —
Life of Fund (since 18/2/00)
Cumulative 23.27 19.25 19.25 20.18 20.18 — 23.18 — — — — —
Annualised 2.53 2.13 2.13 2.22 2.22 — 2.52 — — — — —
Putnam U.S. Small-Cap Value Equity Fund††§§§
1 year -32.12 -32.49 -35.19 -32.36 -33.04 -21.15 -31.84 — -31.11 — — —
5 years
Cumulative 33.00 29.71 29.71 31.04 31.04 78.73 35.80 — 41.22 — — —
Annualised 5.87 5.34 5.34 5.56 5.56 12.32 6.31 — 7.15 — — —
Life of Fund (since 17/4/01)
Cumulative 42.71 37.65 37.65 40.03 40.03 125.80 46.82 — 55.00 — — —
Annualised 5.06 4.54 4.54 4.79 4.79 12.50 5.48 — 6.27 — — —
PUTNAM WORLD TRUST TOTAL RETURN* FOR YEAR ENDED 30 JUNE 2008 (UNAUDITED)
Class A Class B Class C§ Class E‡ Class I Class J Class M Class Q Class S Class T§§§§
NAV NAV CDSC NAV CDSC NAV NAV NAV NAV NAV NAV NAV
11

* Total return is the change in Unit value and assumes reinvestment of all distributions back into the Fund. Performance data represent past results. Past performance may not be a reliable
guide to future performance. Investment returns and principal value will fluctuate so an investor’s Units, when sold, may be worth more or less than their original cost. Fund performance
data do not take into account any adjustment for taxes payable on reinvested distributions.
** Putnam U.S. Liquid Assets Fund is not subject to an initial sales charge.
*** Class I Units of Putnam Global Equity Multi-Alpha Fund and Putnam Total Return Fund were redesignated Class A Units on 10 July 2007. Class A and M Units of Putnam Global Equity
Multi-Alpha Fund and Putnam Total Return Fund launched 30 June 2006. Class B and C Units of Putnam Global Equity Multi-Alpha Fund and Putnam Total Return Fund launched on 10 July 2007.
Class J Units of Putnam Global Equity Multi-Alpha Fund and Putnam Total Return Fund launched on 14 August 2006. Class E, Q, and S Units of Putnam Total Return Fund and Class Q Units
of Putnam Global Equity Multi-Alpha Fund launched on 30 November 2006.
† Class I performance has been restated based on Class A performance. Actual Class I performance began on 8 June 2000.
†† Class I performance has been restated based on Class A performance. Actual Class I performance began on 18 April 2001.
‡ Actual Class E performance for the Funds began on 1 August 2001 with the exception of Putnam Global High Yield Bond Fund, which began 23 May 2003. Putnam Investors (U.S. Core Equity)
Fund Class E Units launched on 14 August 2006. Returns for periods of less than six months are not reported. Performance is based on US dollar valuations.
‡‡ Class I Units launched on 1 May 2008.
§ Class C performance has been restated based on Class A performance. Actual Class C performance began on 27 February 2004, with the exception of Putnam Europe Equity Fund and
Putnam International (Non U.S. Core) Equity Fund, which began 1 June 2005, and Putnam U.S. Liquid Assets Fund, which began on 1 November 2005.
§§ Class S Units launched on 30 January 2004. Performance is based on US dollar valuations.
§§§ Putnam Investors (U.S. Core Equity) Fund and Putnam U.S. Small-Cap Value Equity Fund offer Class M Units (28 April 2006), which have been restated based on Class A performance.
§§§§ Performance of Class T Units has been restated based on performance of Class A Units. Actual Class T performance began on 26 November 2007.
Returns shown for Class B and Class I Units for the periods prior to inception are derived from the historical performance of Class A Units adjusted to reflect the lower operating expenses
applicable to such Units. Class B Units returns reflect the applicable CDSC, which is 4% in the first year, declining to 1% in the fourth year, and is eliminated thereafter. Class C Units reflect
a 1% CDSC in the first year and is eliminated thereafter.
Data is historical. Past performance is not a guarantee of future results. More recent returns may be less or more than those shown.Investment return, net asset value, and market price will fluctuate, and you may have a gain or a loss when you sell your Units.Performance assumes reinvestment of distributions at NAV and does not account for any taxes or sales charges. The payment of anysales charges will reduce performance.
The difference at any one time between the issue price and the redemption price of Fund Units means that the investment shouldbe viewed as medium to long term. For funds with income as an objective, income may fluctuate in accordance with marketconditions and taxation arrangements. Changes in the exchange rate may have an adverse effect on the value, price, or income ofthe US dollar-based Funds.
Class A1 Units have been re-designated Class I Units as of 17 October 2003. Returns shown for Class C and Class I Units for periodsprior to inception are derived from the historical performance of Class A Units, adjusted to reflect the different operating expensesapplicable to such Units, but not adjusted to reflect the current maximum sales charge.
The Funds are sub-funds of Putnam World Trust, an umbrella unit trust domiciled in Dublin, Ireland. Prior to 22 February 2000,certain of the Funds were domiciled in the Cayman Islands and were subject to lower fees and expenses (except for PutnamEmerging Information Sciences Fund, which was re-domiciled from Luxembourg to Ireland on 3 April 2000). The Trust isestablished as an undertaking for collective investment in transferable securities pursuant to the European Communities(Undertakings for Collective Investment in Transferable Securities) Regulations, 2003 (as amended).
Effective 2 September 2008, various changes were made to the Unit classes of the Funds, including termination of certain classes,launch of additional classes, changes to fee structure and investment minimums. The performance information also does not reflectthese changes, which took place after the end of the period.
12

Putnam Emerging Information Sciences Fund
A broad mix of factors affected US financial markets over thepast year. Following a period of extended tranquillity, volatilityreturned to both the stock and bond markets. What had beenample liquidity conditions reversed abruptly early in the periodas the decline in the prices of subprime mortgage securitiesspread throughout the credit markets and inaugurated the creditcrunch. During the period’s second half, the credit crunchbecame a full-blown liquidity crisis as turmoil continued tospread well beyond subprime securities. Oil prices rosethroughout the period and reached US$140 per barrel on theNew York Mercantile Exchange near the end of the period.Surging food and energy prices resulted in rising US inflation asthe period came to a close.
As the US economy weakened and financial turbulencecontinued, the Federal Reserve Board (the Fed) moved aggressivelyand cut the federal funds target rate by 3.25 percentage points fromSeptember 2007 through April 2008, reducing the benchmarklending rate from 5.25% to 2.00%. By the second quarter of 2008,the Fed’s creative policy approach appeared to restore a measureof order to financial markets, and numerous indicators ofmarket distress eased significantly.
Broad US indexes registered double-digit negative returns. On arelative basis, large- and mid-cap stocks held up better thansmall-cap stocks, and growth stocks outperformed value stocks,but still posted negative results overall.
Within this environment, the Fund posted negative returns:-19.79% for Class A Units, -20.18% for Class B Units, -19.91% forClass C Units, -6.59% (-19.77% in euro terms) for Class E Units,and -19.47% for Class I Units, all at net asset value (NAV, orwithout sales charges). The Fund’s benchmark, the Russell 2500Growth Technology Index, declined 10.33% for the period.
During the period, we remained focused on bottom-up stockselection within industries where we have high levels ofconviction. These industries include communicationsequipment, where valuations recovered from exceptionally lowlevels, and computer hardware manufacturers, which generatedmodest growth in gross revenues. In the case of computerhardware companies, we believe their recent growth trajectory,combined with favourable valuations, offers the possibility ofsolid upside potential with limited downside risk. Lastly,software companies remain highly profitable and continue togenerate robust cash flows.
Class A Class B Class C Class E* Class I
Unit value NAV NAV NAV NAV NAV
30/6/07 $13.09 $15.36 $10.85 ¤7.74 $13.46
30/6/08 10.50 12.26 8.69 6.21 10.84
* Values stated in euros.
The Fund made no distributions during the year.
International investing involves certain risks, such as currency fluctuations,
economic instability, and political developments. Additional risks may be
associated with emerging-market securities, including illiquidity and
volatility. The Fund invests some or all of its assets in small and/or midsize
companies. Such investments increase the risk of greater price fluctuations.
The Fund invests in fewer issuers or concentrates its investments by region
or sector, and involves more risk than a fund that invests more broadly.
Putnam Emerging Markets Debt Fund
Thanks to strong returns during the first half of the year,emerging markets (EM) debt posted positive results for the yearoverall. The Fund’s benchmark, the JPMorgan EmergingMarkets Bond Global Diversified Index, returned 4.92% for the12 months ended 30 June 2008. Performance weakened duringthe period’s second half as the EM debt market grappled withinvestor anxiety about the potential effects of a US economicslowdown and the ensuing flight to quality. Still, even against thisbackdrop, EM debt significantly outpaced most domestic andinternational stock benchmarks during the latter half of theperiod, and also outperformed the US high-yield bond market.Country fundamentals remained strong, as did the technical(supply and demand) backdrop for EM debt.
Within this environment, the Fund generated positive returnsacross all Unit classes: 4.10% for Class A Units, 3.50% for Class BUnits, 3.46% for Class C Units, and 3.92% for Class I Units, all atnet asset value (NAV, or without sales charges).
Advantageous country allocations bolstered the Fund’s resultsduring the period. Specifically, an overweight position in Peru,which posted some of the best gains during the period, helpedreturns, as did underweight positions in Pakistan and Indonesia.
EM debt spreads versus US Treasuries widened significantly asthe period came to a close. Inflation in emerging economiescontinues to accelerate; however, record-high commodity pricesare beneficial to EM exporters. At the same time, interest rateshave risen sharply in many EM countries and governments arestruggling to maintain growth while keeping inflation contained.All told, our outlook for EM debt has become increasinglydefensive as we wait to see how current spikes in inflation andinterest rates will be addressed.
Class A Class B Class C Class I
Unit value NAV NAV NAV NAV
30/6/07 $9.09 $9.08 $9.10 $9.61
30/6/08 9.06 9.05 9.05 9.58
Distributions Number Income Capital gain Total
Class A 12 $0.3960 — $0.3960
Class B 12 0.3430 — 0.3430
Class C 12 0.3600 — 0.3600
Class I 1 0.3981 — 0.3981
International investing involves certain risks, such as currency fluctuations,
economic instability, and political developments. Additional risks may be
associated with emerging-market securities, including illiquidity and
volatility. Lower-rated bonds may offer higher yields for more risk.
Mutual funds that invest in bonds are subject to certain risks, including
interest-rate risk, credit risk, and inflation risk. As interest rates rise, the
prices of bonds fall. Long-term bonds are more exposed to interest-rate
risk than short-term bonds. Unlike bonds, bond funds have ongoing fees
and expenses.
13

Putnam Europe Equity Fund
The credit crisis that began in the United States in 2007 causedsevere and recurring market dislocations for Europe. In July andAugust 2007, investors began to realise that the US subprimemortgage crisis would pose a threat to the worldwide financialsystem. European financial companies with significant holdingsin US mortgage-backed securities were among the first to beinjured. As a consequence, investors fled risky stocks andcrowded into a handful of high-quality, large-cap companies withstrong earnings momentum, regardless of their valuation. Thiswas a particular problem for the Fund’s strategy, becausevaluation signals are at the core of our investment process.
Against this backdrop, the Fund posted negative returns: -16.93%for Class A Units, -17.32% for Class B Units, -17.12% for Class C Units,-12.22% (-24.55% in euro terms) for Class E Units, and -16.61% forClass I Units, all at net asset value (NAV, or without sales charges).The Fund’s benchmark, the MSCI Europe Index, declined 11.34%for the period.
The Fund was well positioned in the second half of the period,benefiting from favouring large and mega-cap stocks, and fromsector positioning, especially an overweight position in energyand underweight positions in financials and consumer cyclicals.
Overall, economic growth in Europe is slowing and the marketsare reflecting that slowdown. Growth in Europe continues to bedriven by Germany, which in turn is supported by exports toemerging markets. Emerging markets face the threat of centralbanks taking actions to dampen growth and stem inflationarypressures from increased food and energy prices. Also, withinEurope, the European Central Bank’s focus on fighting inflationand the strength of the euro together create a headwind forEuropean exporters and a risk for stocks. Therefore, a cautiousoutlook is necessary in these uncertain times.
We plan to continue our defensive posture by increasinglarge-cap exposure and positioning the Fund for a period ofslower growth in Europe. At period’s end, the Fund had anoverweight position in the energy sector, while consumercyclicals, financials, and capital goods were the largestunderweight positions. By country, the Fund maintainedoverweight positions in Switzerland and Norway.
Class A Class B Class C Class E* Class I
Unit value NAV NAV NAV NAV NAV
30/6/07 $19.73 $18.82 $13.66 ¤9.98 $19.38
30/6/08 16.39 15.56 11.30 7.53 16.16
Distributions Number Income Capital gain Total
Class A — — — —
Class B — — — —
Class C 1 $0.0246 — $0.0246
Class E — — — —
Class I — — — —
* Values stated in euros.
International investing involves certain risks, such as currency fluctuations,
economic instability, and political developments. Additional risks may be
associated with emerging-market securities, including illiquidity and
volatility. The Fund invests some or all of its assets in small and/or midsize
companies. Such investments increase the risk of greater price
fluctuations. The Fund invests in fewer issuers or concentrates its
investments by region or sector, and involves more risk than a fund that
invests more broadly.
Putnam Global Equity Multi-Alpha Fund
Despite continuing concerns about a worldwide liquidity crisis,record-high energy prices, and the future of the US economy,global stock markets outperformed many of the major US equitymarket benchmarks for the year ended 30 June 2008.Specifically, the Fund’s benchmark, the MSCI® World Index fell10.68% during the period. However, this result comparedfavourably with the Standard & Poor’s 500 Index and the broad-market Russell 3000 Index, which declined by 13.12% and12.69%, respectively, for the year. The United Kingdom suffered aloss comparable to that of the benchmark and was hurt by manyof the same negative factors as the US markets. Finland, HongKong, and Belgium fared even worse, all falling more than 20%during the second half of the period. Japan and Norway,meanwhile, held up relatively well, particularly during theperiod’s second half.
Within this environment, the Fund posted negative returns:-12.76% for Class A Units, -15.53% for Class B Units, -15.41% forClass C Units, -11.40% for Class J Units, -12.70% for Class M Units(-25.00% in euro terms), and -12.05% for Class Q Units, all at netasset value (NAV, or without sales charges).
With respect to country exposure, during the first half of theperiod, positive contributors to performance included longpositions in Hong Kong, Singapore, and Australia, and shortpositions in Sweden, Japan, and France. Long positions inBelgium and Germany, and a short position in Canadadetracted from results. During the second half of the period,a long position in Australia, and short positions in Sweden,France, the Netherlands, and Switzerland aided results. Longpositions in the United States, the United Kingdom, Italy,and Germany, and short positions in Canada and Japan weighedon performance. At the end of the period, the Fund’s largestcountry overweight positions were in the United Kingdom andItaly, and the largest underweight positions were in Switzerland,Singapore, and Sweden.
Looking ahead, we will continue to follow our disciplinedprocess of developing country forecasts using four key factors:value, macro, growth, and expectational. Value factors favourrelatively inexpensive markets while disfavouring expensivemarkets. Macro factors seek to identify countries withinterest-rate environments that are favourable to stocks. Growthfactors, such as momentum, and expectational factors, such asearnings surprises, provide further insights into markets andstocks that appear attractive as either buy or sell candidates, andguide us in taking long or short positions.
Class A Class B§ Class C§ Class J Class M* Class Q
Unit value NAV NAV NAV NAV NAV NAV
30/6/07 $10.74 — — $10.79 ¤7.92 $9.63
10/7/07 — $8.50 $8.50 — — —
30/6/08 9.37 7.18 7.19 9.56 5.94 8.47
The Fund made no distributions during the year.
* Values stated in euros.
§ Launched 10 July 2007.
Global investing involves certain risks, such as currency fluctuations,
economic instability, and political developments. Additional risks may be
associated with emerging market securities. The Fund invests some or all
of its assets in small and/or midsize companies. Such investments increase
the risk of greater price fluctuations. The use of derivatives involves
special risks and may result in losses.
14

Putnam Global Fixed Income Alpha Fund S1
During the final three months of the period, investors moved outof sovereign bonds and into higher-yielding, riskier assets assystemic-risk fears subsided. Bond yields spiked and creditspreads tightened until late June, when risk aversion crept backinto the markets. Inflation was the dominant concern, as crudeoil prices consistently breached previous highs and the dollardepreciated. But as data on the economy grew more dismal,concerns about its prospects shifted to the fore. Both theUS Federal Reserve Board (the Fed) and the Bank of England cuttheir target overnight rates by 0.25% in April and held themsteady for the rest of the quarter. Meanwhile, inflation remainedthe main focus of the European Central Bank; it kept ratesunchanged during the final months of the period, but raisedthem by 0.25% in early July.
Against this backdrop, the Fund’s Class S Units returned 2.80%(1.20% in sterling terms) at net asset value (NAV, or without salescharges) versus 1.01% for the Fund’s benchmark, the 6-MonthLIBOR Index (2.07% in sterling terms). (Please note that Fundreturns are from inception and do not cover the entire reportingperiod.)
The Fund’s short-duration stance in the US aided returns, whilelong-duration positions in Continental Europe and the UnitedKingdom detracted as rates rose in all three regions. Maintaininga steeper yield curve bias in the United States and UnitedKingdom also impeded results, while a flat yield curve bias inEurope proved beneficial. The Fund’s volatility positioning alsohampered performance.
In terms of sectors, exposure to the securitised sectors was thegreatest contributor to returns during the period. Allocations toAAA-rated commercial mortgage-backed securities (CMBS),and to a lesser extent, interest-only collateralised mortgageobligations boosted returns. In contrast, a short position ininvestment-grade corporate bonds hindered results, as didallocations to AAA-rated home equity loans and manufacturedhousing loans.
Following a 10-year credit boom, we believe the US economy hasentered a multi-year process of retrenchment to reduce theleverage of private-sector balance sheets, particularly those ofhouseholds. There will likely be two features to this process: apersistent rise in the household savings rate that will curtail thegrowth of domestic demand, and an increased reliance onforeign demand as a source of growth. Our economists alsobelieve that the Fed likely will begin to raise interest rates by theend of 2008 in response to inflationary pressures.
Class S*§
Unit value NAV
30/6/07 —
21/2/08 £10.00
30/6/08 10.12
* Values stated in pound sterling.
§ Launched 21 February 2008.
The Fund made no distributions during the year.
International investing involves certain risks, such as currency fluctuation,
economic instability, and political developments. Additional risks may be
associated with emerging-market securities, including illiquidity and
volatility. Lower-rated bonds may offer higher yields in return for more
risk. Mutual funds that invest in government securities are not guaranteed.
Mortgage-backed securities are subject to prepayment risk. Mutual funds
that invest in bonds are subject to certain risks including interest-rate risk,
credit risk, and inflation risk. As interest rates rise, the prices of bonds fall.
Long-term bonds are more exposed to interest-rate risk than short-term
bonds. Unlike bonds, bond funds have ongoing fees and expenses.
Putnam Global Fixed Income Alpha Fund S2
During the final three months of the period, investors moved out ofsovereign bonds and into higher-yielding, riskier assets assystemic-risk fears subsided. Bond yields spiked and credit spreadstightened until late June, when risk aversion crept back into themarkets. Inflation was the dominant concern, as crude oil pricesconsistently breached previous highs and the dollar depreciated.But as data on the economy grew more dismal, concerns about itsprospects shifted to the fore. Both the US Federal Reserve Board(the Fed) and the Bank of England cut their target overnight ratesby 0.25% in April and held them steady for the rest of the quarter.Meanwhile, inflation remained the main focus of the EuropeanCentral Bank; it kept rates unchanged during the final months ofthe period, but raised them by 0.25% in early July.
Against this backdrop, the Fund’s Class S Units returned 1.32%(0.00% in sterling terms) versus 0.98% for the Fund’s benchmark,the 6-Month LIBOR Index (2.01% in sterling terms). The Fund’sClass I Units returned -0.91% (-1.99% in sterling terms) versus0.49% for the benchmark (0.98% in sterling terms). (Please notethat Fund returns are from inception and do not cover the entirereporting period.)
The Fund’s short-duration stance in the US aided returns, whilelong-duration positions in Continental Europe and the UnitedKingdom detracted as rates rose in all three regions. Maintaininga steeper yield curve bias in the United States and UnitedKingdom also impeded results, while a flat yield curve bias inEurope proved beneficial. The Fund’s volatility positioning alsohampered performance.
In terms of sectors, exposure to the securitized sectors was thegreatest contributor to returns during the period. Allocations toAAA-rated commercial mortgage-backed securities (CMBS), andto a lesser extent, interest-only collateralized mortgage obligationsboosted returns. In contrast, a short position in investment-gradecorporate bonds hindered results, as did allocations to AAA-ratedhome equity loans and manufactured housing loans.
Following a 10-year credit boom, we believe the US economy hasentered a multi-year process of retrenchment to reduce theleverage of private-sector balance sheets, particularly those ofhouseholds. There will likely be two features to this process: apersistent rise in the household savings rate that will curtail thegrowth of domestic demand, and an increased reliance onforeign demand as a source of growth. Our economists alsobelieve that the Fed likely will begin to raise interest rates by theend of 2008 in response to inflationary pressures.
Class I*§ Class S*§§
Unit value NAV NAV
30/6/07 — —
5/1/08 £5.03 —
25/2/08 — £10.00
30/6/08 4.93 10.00
* Values stated in pound sterling.
§ Launched 1 May 2008.
§§ Launched 25 February 2008.
The Fund made no distributions during the year.
International investing involves certain risks, such as currency fluctuation,
economic instability, and political developments. Additional risks may be
associated with emerging-market securities, including illiquidity and volatil-
ity. Lower-rated bonds may offer higher yields in return for more risk.
Mutual funds that invest in government securities are not guaranteed.
Mortgage-backed securities are subject to prepayment risk. Mutual funds
that invest in bonds are subject to certain risks including interest-rate risk,
credit risk, and inflation risk. As interest rates rise, the prices of bonds fall.
Long-term bonds are more exposed to interest-rate risk than short-term
bonds. Unlike bonds, bond funds have ongoing fees and expenses.
15

Putnam Global Growth Fund
Despite continuing concerns about a worldwide liquidity crisis,record-high energy prices, and the future of the US economy,global stock markets outperformed many of the majorUS equity market benchmarks for the year ended 30 June 2008.Specifically, the Fund’s benchmark, the MSCI® WorldGrowth Index fell 3.08% during the period. However, this resultcompared quite favourably with the Standard & Poor’s 500 Indexand the broad-market Russell 3000 Index, which declined by13.12% and 12.69%, respectively, for the year.
US equity markets trended downward from October 2007 toMarch 2008 before rebounding from March to May, only to movedownward again from May 2008 to the end of the period.European markets enjoyed positive returns in September andOctober 2007, but soon came under the influence of the subprimemortgage crisis and rising crude oil prices that dampened returnsworldwide. Following a solid rally during September, Pacificequity markets struggled during the balance of 2007 and the earlymonths of 2008 before recovering to post a modest gain over thefinal three months of the period. Emerging markets (EM)equities benefited from robust returns in China during the firsthalf of the period, but positive results in February 2008 wereoutweighed by declines in January and March. EM equitiesfollowed the global pattern of progressively weakeningperformance during the concluding months of the period.
Within this environment, the Fund posted negative returns:-11.96% for Class A Units, -12.37% for Class B Units, and -11.62% forClass I Units, all at net asset value (NAV, or without sales charges).
Stock selection within the energy, industrial, and basic materialssectors contributed to results, while stock selection amongconsumer cyclicals detracted from results.
Global economic growth continues to be positive but isdecelerating. While the world feared the impact of lower lendinglevels and the liquidity crunch, the far greater source of loweredexpectations for growth is now coming from high oil prices. As aresult, inflation fear has taken the place of liquidity fear. Againstthat backdrop, we have returned to a defensive stance.Accordingly, we prefer the business-to-business salesopportunities offered by information technology firms andinfrastructure-related capital goods companies.
Class A Class B Class I
Unit value NAV NAV NAV
30/6/07 $20.16 $18.60 $20.74
30/6/08 17.75 16.30 18.33
The Fund made no distributions during the year.
International investing involves certain risks, such as currency fluctuation,
economic instability, and political developments. Additional risks may be
associated with emerging-market securities, including illiquidity and
volatility. The Fund invests some or all of its assets in small and/or midsize
companies. Such investments increase the risk of greater price fluctuations.
Putnam Global High Yield Bond Fund
Following nine months of substantial volatility, the global high-yieldmarket began to recover during the final three months of theperiod as investor risk-aversion diminished. Despite continuingconcerns about a worldwide liquidity crisis, record-high energyprices, and the future of the US economy, high-yield bondsoutperformed many of the major US equity market benchmarksfor the year ended 30 June 2008. Specifically, the Fund’sbenchmark, the Merrill Lynch Global High Yield ConstrainedIndex (hedged to US$) fell 2.51% during the period. However, thisresult significantly outdistanced the Standard & Poor’s 500Index and the broad-market Russell 3000 Index, which declinedby 13.12% and 12.69%, respectively, for the year.
Against this backdrop, the Fund posted mostly negative returns:-3.95% for Class A Units, -4.35% for Class B Units, -4.18% for Class CUnits, 11.61% (-4.17% in euro terms) for Class E Units, -4.11% forClass I Units, -3.35% (-2.52% in sterling terms) for Class S Units,and -4.07% for Class T Units, all at net asset value (NAV, or withoutsales charges).
The Fund benefited from its defensive positioning during the periodas the high-yield market declined. The Fund’s below-benchmarkexposure to lower-rated issues helped relative performance ashigher-rated issues outperformed. Our emphasis on US versusEuropean bonds (hedged in US dollars) also aided results.Underweight positions in housing and financials, which were twoof the worst-performing industry groups, also bolstered returns.
Fundamentals remain in a downward trajectory, with notableweakness in the housing, financials, automotive, and retailsectors. Given current market conditions, we plan to maintain abroadly diversified portfolio and focus on managing risk bydetecting deteriorating credits early. At the same time, we willcontinue to seek attractively valued opportunities that we believeoffer the potential for capital appreciation.
Class A Class B Class C Class E* Class I Class S** Class T§
Unit value NAV NAV NAV NAV NAV NAV NAV
30/6/07 $7.38 $7.30 $8.93 ¤8.53 $2.71 £5.44 —
26/11/07 — — — — — — $6.96
30/6/08 6.65 6.58 7.90 7.61 2.59 4.67 6.90
Distributions Number Income Capital gain Total
Class A 12 $0.4440 — $0.4440
Class B 12 0.4080 — 0.4080
Class C 13 0.6694 — 0.6694
Class E* 1 ¤0.5780 — ¤0.5780
Class I 1 0.0090 — 0.0090
Class S** 13 £0.6380 — £0.6380
Class T — — — —
* Values stated in euros.
** Values stated in pound sterling.
§ Launched 26 November 2007.
International investing involves certain risks, such as currency fluctuation,
economic instability, and political developments. Additional risks may be
associated with emerging-market securities, including illiquidity and
volatility. Lower-rated bonds may offer higher yields in return for more
risk. Mutual funds that invest in government securities are not
guaranteed. Mortgage-backed securities are subject to prepayment risk.
Mutual funds that invest in bonds are subject to certain risks including
interest-rate risk, credit risk, and inflation risk. As interest rates rise, the
prices of bonds fall. Long-term bonds are more exposed to interest-rate
risk than short-term bonds. Unlike bonds, bond funds have ongoing fees
and expenses.
16

Putnam Growth and Income (U.S. Value Equity) FundA broad mix of factors affected US financial markets over the pastyear. Following a period of extended tranquillity, volatility returnedto both the stock and bond markets. What had been ample liquidityconditions reversed abruptly early in the period as the precipitousdecline in the prices of subprime mortgage securities quicklyspread throughout the credit markets and inaugurated the creditcrunch. During the period’s second half, the credit crunch becamea full-blown liquidity crisis as turmoil continued to spread beyondsubprime securities. Oil prices rose throughout the period,breaking one record high after another, and reached a staggering$140 per barrel on the New York Mercantile Exchange near the endof the period. Surging food and energy prices resulted in risingUS inflation as the period came to a close.
As theUS economy weakened and financial turbulence continued,the US Federal Reserve Board (the Fed) moved aggressively andcut the federal funds target rate by 3.25 percentage points fromSeptember 2007 through April 2008, reducing the benchmarklending rate from 5.25% to 2.00%. The Fed also created a numberof new lending facilities to inject liquidity into the financial system.By the second quarter of 2008, the Fed’s creative policy approachappeared to restore a measure of order to financial markets, andnumerous indicators of market distress eased significantly.
Against this backdrop, the Fund posted negative returns: -28.34% forClass A Units, -28.67% for Class B Units, -28.56% for Class C Units,-16.84% (-28.59% in euro terms) for Class E Units, and -27.99% forClass I Units, all at net asset value (NAV, or without sales charges).For the period, the Fund’s primary benchmark, the Russell 1000Value Index, declined 18.78%, and its secondary benchmark, theS&P 500/Citigroup Value Index, fell 20.25%.
During the second half of the period, an underweight position inconglomerates – particularly our avoidance of General Electric –was a key positive contributor to the Fund’s returns. After earlierweakness, select holdings within the investment banking andbrokerage and insurance industries also bolstered results. Anoverweight position in the technology sector was also beneficial.Weak stock selection among energy and transportationcompanies detracted from performance.
Looking ahead, we continue to believe that many financialstocks, as well as select consumer stocks, are trading atincreasingly compelling valuations. As such, we believe stocks inthese areas have the potential to contribute to returns forUnitholders who maintain a long-term perspective.
Class A Class B Class C Class E* Class I
Unit value NAV NAV NAV NAV NAV
30/6/07 $16.83 $15.87 $10.82 ¤10.62 $17.22
30/6/08 12.06 11.32 7.73 7.43 12.40
Distributions Number Income Capital gain Total
Class A — — — —
Class B — — — —
Class C — — — —
Class E* 1 ¤0.1890 — ¤0.1890
Class I — — — —
* Values stated in euros.
Putnam International(Non U.S. Core) Equity FundThe credit crisis that began in the United States in 2007 causedsevere and recurring market dislocations internationally. In Julyand August 2007, investors began to realise that theUS subprime mortgage crisis would pose a threat to theworldwide financial system and have ramifications for the globaleconomy. Investors fled risky stocks and crowded into a handfulof high-quality, large-cap companies with strong earningsmomentum, regardless of their valuation. This posed aparticular problem for the Fund’s strategy, because valuationsignals are at the core of our investment process. The trend wasquite pronounced in Europe, though less so in Asia, illustratingthe benefits of the portfolio’s broad diversification.
In this environment, the Fund posted negative returns: -14.50% for Class A Units, -14.94% for Class B Units, -14.70% for Class C Units, and -14.20% for Class I Units, all at net asset value(NAV, or without sales charges). The Fund’s benchmark, theMSCI EAFE Index, declined 10.61% for the period.
Though the Fund’s absolute returns were negative, our shift to amore defensive stance, coupled with favourable stock selectionresulted in substantial improvement in relative performanceduring the second half of the year.
The Fund maintained overweight positions in the energy,health-care, and utilities sectors and underweight positions inconsumer cyclicals and financials. In terms of markets, theportfolio had overweight positions in Switzerland, where wefavoured health-care stocks, and in Norway, which contributedto the energy overweight. We maintained underweight positionsin the United Kingdom and Australia because of unattractivevaluations.
As the global economy moves through a transitional phase, weare gauging the potential impact of a US recession on otherdeveloped and emerging economies. A consequence of thesubprime mortgage crisis in the United States is that the buoyantliquidity conditions that had been a key driver of global marketsover the past several years are no longer in place. Rising inflationand potentially higher interest rates are common themes in bothdeveloped and developing markets. Nevertheless, the developingworld continues to record robust growth. We are currentlypositioning the Fund to benefit from this broadly baseddeveloping market growth.
Class A Class B Class C Class I
Unit value NAV NAV NAV NAV
30/6/07 $21.31 $20.21 $13.22 $21.71
30/6/08 18.05 17.10 11.25 18.44
Distributions Number Income Capital gain Total
Class A 1 $0.1965 — $0.1965
Class B 1 0.1040 — 0.1040
Class C 1 0.0310 — 0.0310
Class I 1 0.2140 — 0.2140
International investing involves certain risks, such as currency fluctuation,
economic instability, and political developments. Additional risks may be
associated with emerging-market securities, including illiquidity and
volatility. The Fund invests some or all of its assets in small and/or midsize
companies. Such investments increase the risk of greater price fluctuations.
17

Putnam Investors (U.S. Core Equity) Fund
A broad mix of factors affected US financial markets over thepast year. Following a period of extended tranquillity, volatilityreturned to both the stock and bond markets. What had beenample liquidity conditions reversed abruptly early in the periodas the decline in the prices of subprime mortgage securitiesspread throughout the credit markets and inaugurated the creditcrunch. During the period’s second half, the credit crunchbecame a full-blown liquidity crisis as turmoil continued tospread well beyond subprime securities. Oil prices rosethroughout the period and reached US$140 per barrel on theNew York Mercantile Exchange near the end of the period.Surging food and energy prices resulted in rising US inflation asthe period came to a close.
As the US economy weakened and financial turbulencecontinued, the US Federal Reserve Board (the Fed) movedaggressively and cut the federal funds target rate by3.25 percentage points from September 2007 through April 2008,reducing the benchmark lending rate from 5.25% to 2.00%.The Fed also created a number of new lending facilities to injectliquidity into the financial system. By the second quarter of 2008,the Fed’s creative policy approach appeared to restore a measureof order to financial markets, and numerous indicators ofmarket distress eased significantly.
Against this backdrop, the Fund posted negative returns:-24.96% for Class A Units, -25.38% for Class B Units, -25.09% forClass C Units, -12.26% (-22.02% in euro terms) for Class E Units,-24.49% for Class I Units, and -23.74% for Class M Units, all at netasset value (NAV, or without sales charges). The Fund’sbenchmark, the S&P 500 Index, declined 13.12% for the period.
During the second half of the period, stock selection amonginformation technology companies was a key positivecontributor to the Fund’s performance. In addition, anunderweight position in industrial conglomerates, along withstock selection among consumer staples and basic materialscompanies also proved favourable. An overweight position infinancials, and avoidance of the strong-performing utilitiessector, detracted from relative results.
Frequently, when the market overreacts to near-term company-specific or macro events, stocks of solid companies may declineto levels that represent compelling valuations. Thus, despitecontinued market volatility, we plan to continue our emphasis onbottom-up stock selection rather than top-down macro forecasts.
Class A Class B Class C Class E* Class I Class M
Unit value NAV NAV NAV NAV NAV NAV
30/6/07 $12.34 $11.78 $11.20 ¤7.96 $12.74 $9.56
30/6/08 9.26 8.79 8.39 5.87 9.62 7.29
Distributions Number Income Capital gain Total
Class A — — — —
Class B — — — —
Class C — — — —
Class E* 1 ¤0.3940 — ¤0.3940
Class I — — — —
Class M — — — —
* Values stated in euros.
The Fund made no distributions during the year.
Returns for periods of less then six months are not reported.
Putnam New Opportunities (U.S. Aggressive Growth Equity) FundA broad mix of factors affected US financial markets over thepast year. Following a period of extended tranquillity, volatilityreturned to both the stock and bond markets. What had beenample liquidity conditions reversed abruptly early in the periodas the precipitous decline in the prices of subprime mortgagesecurities quickly spread throughout the credit markets andinaugurated the credit crunch. During the second half of theperiod, the credit crunch became a full-blown liquidity crisis asturmoil continued to spread well beyond subprime securities.Oil prices rose throughout the period and reached a staggeringUS$140 per barrel on the New York Mercantile exchange nearthe end of the period. Surging food and energy prices resulted inrising US inflation as the period came to a close.
As the US economy weakened and financial turbulencecontinued, the US Federal Reserve Board (the Fed) movedaggressively and cut the federal funds target rate by3.25 percentage points from September 2007 through April 2008,reducing the benchmark lending rate from 5.25% to 2.00%. TheFed also created several new lending facilities to inject liquidityinto the financial system. By the second quarter of 2008, theFed’s creative policy approach appeared to restore a measure oforder to financial markets, and numerous indicators of marketdistress eased significantly.
On a relative basis, large- and mid-cap stocks held up better thansmall-cap stocks, and growth stocks outperformed value stocks,but still posted negative results overall. The Fund’s benchmark,the Russell 3000 Growth Index, fell 6.38%.
In this environment, the Fund posted negative returns: -11.00%for Class A Units, -11.41% for Class B Units, -11.13% for Class CUnits, and -10.60% for Class I Units, all at net asset value (NAV, orwithout sales charges).
The Fund benefited from an overweight position in thestrong-performing basic materials sector, and from favourablestock selection among health-care companies. The primarydetractor from results was unfavourable stock selection in thetechnology and consumer staples sectors, which caused theFund to trail its benchmark for the period.
Recent events have some investors concerned about the outlookfor US stocks. While it is important not to underestimate theseriousness of these events, US equity markets are no stranger toturmoil and have proven to be resilient over the long term. Withthis long-term perspective in mind, we plan to maintain theFund’s global exposure and expand our positions in sectors andindustry groups that we currently find most attractive. Theseinclude basic materials, capital goods, consumer staples, andlarger technology companies.
Class A Class B Class C Class E*§ Class I
Unit value NAV NAV NAV NAV NAV
30/6/07 $13.37 $12.62 $10.78 — $13.58
30/6/08 11.90 11.18 9.58 ¤10.00 12.14
* Values stated in euros.
§ Launched 30 June 2008.
The Fund made no distributions during the year.
The Fund invests all or a portion of its assets in small to midsize
companies. Such investments increase the risk of greater price fluctuations.
18

Putnam Total Return Fund
A mix of factors affected global financial markets for the yearended 30 June 2008, and broad US and internationalstock-market indexes registered double-digit negative returns.In the fixed-income markets, bonds with the lowest levels of creditrisk generated the highest returns as investors sought refuge fromcredit-market turmoil and deteriorating economic conditions.
Within this environment, the Fund generated positive returnsacross all unit classes: 7.69% for Class A Units, 6.12% for Class BUnits, 6.35% for Class C Units, 25.31% for Class E Units(7.58% in euro terms), 7.71% for Class J Units, 24.79% for Class MUnits (7.12% in euro terms), 8.49% for Class Q Units, and 9.22%for Class S Units (10.05% in sterling terms), all at net asset value(NAV, or without sales charges). The Fund’s benchmark, theMerrill Lynch 1-Month LIBOR Index, returned 4.45% for theperiod.
During the second half of the period, underweight positions inUS equities, US fixed income (including high-yield corporatebonds), real-estate investment trusts, and an overweight positionin US Treasury Inflation Protected Securities benefited results.An underweight position in commodities and an overweightposition in international fixed income detracted from returns.All of our equity alpha strategies contributed to performance,with US all-cap equity and US small-cap growth adding the mostvalue. Security selection strategies had a neutral impact overall.Lastly, the net effect of our overlay strategies added alpha duringthe period.
Looking ahead, the combination of weakening growth andintensifying inflation creates an extremely difficult environmentfor US stocks. Therefore, we continue to emphasize safety,favouring larger companies and those with profit models that areless sensitive to the economic cycle. Within US fixed income, wecurrently regard the securitized sectors as the most attractivearea. Although these sectors are still under stress, we do notexpect losses from defaults for the most senior and protectedsecuritized instruments even if there is a US recession. We have abullish long-term outlook for commodities, but after strong pricegains during the final months of the period, caution is warranted.
Class A Class B§ Class C§ Class E* Class J Class M* Class Q Class S**
Unit value NAV NAV NAV NAV NAV NAV NAV NAV
30/6/07 $9.36 — — ¤6.60 $9.47 ¤7.16 $8.83 £4.48
10/7/07 — $8.50 $8.50 — — — — —
30/6/08 10.08 9.02 9.04 7.10 10.20 7.67 9.58 4.93
The Fund made no distributions during the year.
* Values stated in euros.
** Values stated in pound sterling.
§ Launched 10 July 2007.
Global investing involves certain risks, such as currency fluctuations,
economic instability, and political developments. The Fund invests some
or all of its assets in small and/or midsize companies. Such investments
increase the risk of greater price fluctuations. Lower-rated bonds may
offer higher yields in return for more risk. The Fund may have a significant
portion of its holdings in bonds. The use of derivatives involves special
risks and may result in losses. Mutual funds that invest in bonds are
subject to certain risks including interest-rate risk, credit risk, and
inflation risk. As interest rates rise, the prices of bonds fall. Long-term
bonds are more exposed to interest-rate risk than short-term bonds.
Unlike bonds, bond funds have ongoing fees and expenses. Diversification
does not assure a profit or protect against loss. It is possible to lose
money in a diversified portfolio.
Putnam U.S. Liquid Assets Fund
Facing a weakening US economy, a full-blown liquidity crisis,and volatile financial markets, the US Federal Reserve Board(the Fed) moved aggressively to cut the federal funds target rateby 3.25 percentage points from September 2007 throughApril 2008, reducing the benchmark lending rate from 5.25%to 2.00%. With the goal of easing credit-market stress byrestoring confidence in inter-bank lending, the central bank alsocreated a number of new lending facilities to inject liquidity intothe financial system. By the second quarter of 2008, the Fed’screative policy approach appeared to restore a measure of orderto financial markets, and numerous indicators of market distresseased significantly from March to May. However, amid signs ofincreasing inflationary pressures, the Fed opted to hold ratessteady at its June meeting.
Within this environment, bonds with the lowest levels of creditrisk generated the highest returns as investors sought refuge fromcredit-market turmoil and deteriorating economic conditions.However, amid a backdrop of stabilising sentiment in the creditmarkets and the Fed’s suspension of its rate-reduction campaign,interest rates rose during the April-June period and weighed onthe returns of investment-grade bonds. US Treasuries sustainedthe largest declines, which was a sharp reversal from earlier in theperiod when they benefited from a widespread flight to quality.
For the year, the Fund returned 3.63% for Class A Units, 3.14% forClass B Units, 3.13% for Class C Units, and 3.63% for Class I Units,all at net asset value (NAV, or without sales charges). The Fund’sbenchmark, the Lipper Money Market Funds Average, returned3.48% for the period.
Despite the moderate sell-off that occurred during the finalmonths of the period, investor risk aversion remains a significantsupporting factor for US government securities, as marketturmoil and a weakening economy continue to drive manyinvestors to the safety of Treasuries. During the last threemonths of the period, we began to extend the weighted averagematurity of the portfolio to a more neutral level by investing infixed-rate paper with maturities of six to nine months, which alsoenabled us to lock in attractive yields. Amidst the uncertainty inthe market, we continue to maintain our conservative,high-quality focus. This conservative approach to managing theFund has helped us to avoid areas of the market that have beenunder pressure, while enabling us to capitalise on numerouscompelling investment opportunities.
Putnam U.S. Liquid Assets Fund was terminatedon 19 September 2008.
Class A Class B Class C Class I
Unit value NAV NAV NAV NAV
30/6/07 $1.00 $1.00 $1.00 $1.00
30/6/08 1.00 1.00 1.00 1.00
Distributions Number Income Capital gain Total
Class A 12 $0.035732 — $0.035732
Class B 12 0.030945 — 0.030945
Class C 12 0.030907 — 0.030907
Class I 12 0.035733 — 0.035733
Money market funds are not insured or guaranteed by any governmental
agency. Although the Fund seeks to preserve the value of your
investment at $1.00 per unit, it is possible to lose money by investing in
this Fund.
19
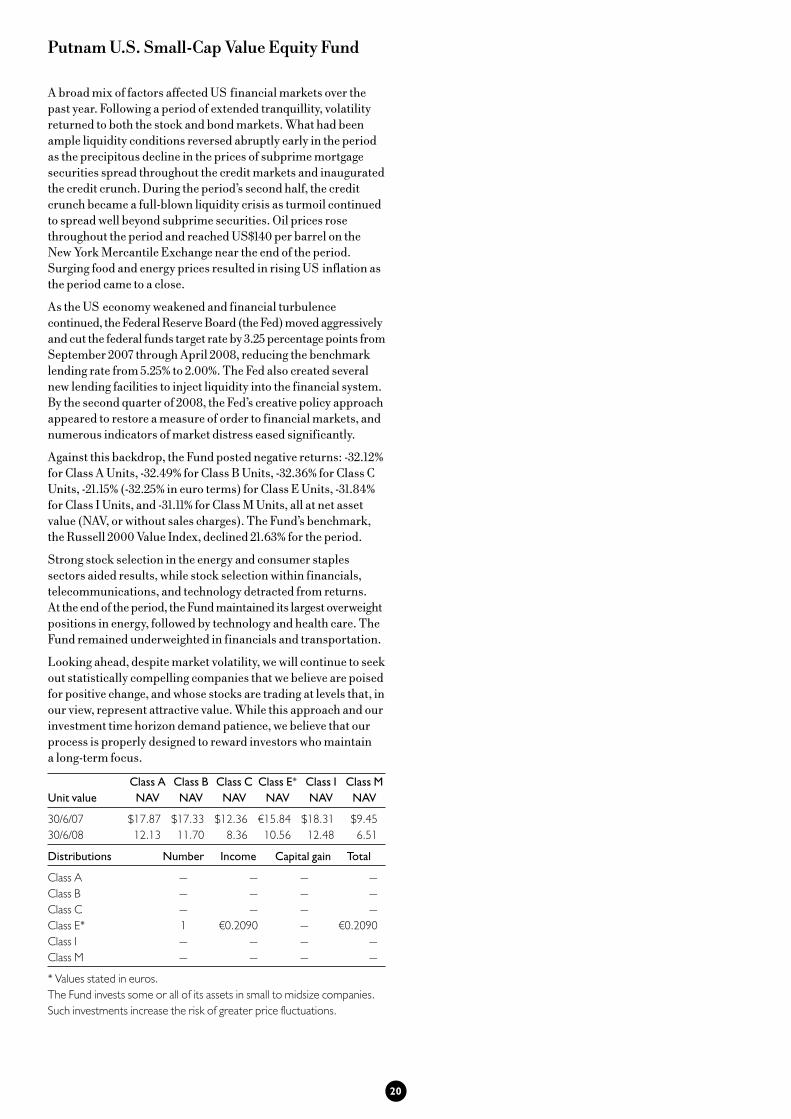
Putnam U.S. Small-Cap Value Equity Fund
A broad mix of factors affected US financial markets over thepast year. Following a period of extended tranquillity, volatilityreturned to both the stock and bond markets. What had beenample liquidity conditions reversed abruptly early in the periodas the precipitous decline in the prices of subprime mortgagesecurities spread throughout the credit markets and inauguratedthe credit crunch. During the period’s second half, the creditcrunch became a full-blown liquidity crisis as turmoil continuedto spread well beyond subprime securities. Oil prices rosethroughout the period and reached US$140 per barrel on theNew York Mercantile Exchange near the end of the period.Surging food and energy prices resulted in rising US inflation asthe period came to a close.
As the US economy weakened and financial turbulencecontinued, the Federal Reserve Board (the Fed) moved aggressivelyand cut the federal funds target rate by 3.25 percentage points fromSeptember 2007 through April 2008, reducing the benchmarklending rate from 5.25% to 2.00%. The Fed also created severalnew lending facilities to inject liquidity into the financial system.By the second quarter of 2008, the Fed’s creative policy approachappeared to restore a measure of order to financial markets, andnumerous indicators of market distress eased significantly.
Against this backdrop, the Fund posted negative returns: -32.12%for Class A Units, -32.49% for Class B Units, -32.36% for Class CUnits, -21.15% (-32.25% in euro terms) for Class E Units, -31.84%for Class I Units, and -31.11% for Class M Units, all at net assetvalue (NAV, or without sales charges). The Fund’s benchmark,the Russell 2000 Value Index, declined 21.63% for the period.
Strong stock selection in the energy and consumer staplessectors aided results, while stock selection within financials,telecommunications, and technology detracted from returns.At the end of the period, the Fund maintained its largest overweightpositions in energy, followed by technology and health care. TheFund remained underweighted in financials and transportation.
Looking ahead, despite market volatility, we will continue to seekout statistically compelling companies that we believe are poisedfor positive change, and whose stocks are trading at levels that, inour view, represent attractive value. While this approach and ourinvestment time horizon demand patience, we believe that ourprocess is properly designed to reward investors who maintaina long-term focus.
Class A Class B Class C Class E* Class I Class M
Unit value NAV NAV NAV NAV NAV NAV
30/6/07 $17.87 $17.33 $12.36 ¤15.84 $18.31 $9.45
30/6/08 12.13 11.70 8.36 10.56 12.48 6.51
Distributions Number Income Capital gain Total
Class A — — — —
Class B — — — —
Class C — — — —
Class E* 1 ¤0.2090 — ¤0.2090
Class I — — — —
Class M — — — —
* Values stated in euros.
The Fund invests some or all of its assets in small to midsize companies.
Such investments increase the risk of greater price fluctuations.
20

TOTAL EXPENSE RATIO (TER)* (UNAUDITED)
The Total Expense Ratio (TER) of each of the Funds for the year ended 30 June 2008 is presented below:
Class A Class B Class C Class E Class I Class J Class M Class Q Class S Class T
Fund % % % % % % % % % %
Putnam American Government Bond Fund 1.88 2.28 2.11 — 1.62 — — — — —
Putnam Emerging Information Sciences Fund 3.30 3.80 3.55 2.90 2.91 — — — — 0.41
Putnam Emerging Markets Debt Fund 1.55 2.05 1.94 — 1.55 — — — — —
Putnam Europe Equity Fund 3.01 3.51 3.27 2.61 2.61 — — — — —
The George Putnam (U.S. Equity and Bond) Fund 1.99 2.35 2.19 — 1.79 — — — — —
Putnam Global Equity Multi-Alpha Fund** 1.84 2.27 — — 2.03 0.41 1.84 1.07 — —
Putnam Global Fixed Income Alpha Fund S1** — — — — — — — — 0.44 —
Putnam Global Fixed Income Alpha Fund S2** — — — — 0.31 — — — 0.43 —
Putnam Global Growth Fund 3.15 3.65 — — 2.74 — — — — —
Putnam Global High Yield Bond Fund 1.91 2.42 2.32 1.91 1.91 — — — 1.91 0.98
Putnam Growth and Income (U.S. Value Equity) Fund 2.86 3.36 3.11 2.46 2.46 — — — — —
Putnam International (Non U.S. Core) Equity Fund 2.83 3.33 3.08 — 2.42 — — — — —
Putnam Investors (U.S. Core Equity) Fund 2.33 2.98 3.25 1.23 1.68 — 0.07 — — —
Putnam New Opportunities (U.S. Aggressive Growth Equity) Fund 3.06 3.61 2.97 0.95 2.54 — — — — —
Putnam Opportunistic Value Fund 2.46 2.78 2.41 2.26 2.25 — — — — —
Putnam Total Return Fund** 1.67 2.16 0.26 0.98 — 1.71 3.41 0.90 0.18 —
Putnam U.S. Liquid Assets Fund** 0.68 1.18 1.20 — 0.68 — — — — —
Putnam U.S. Small-Cap Value Equity Fund 2.70 3.20 2.94 2.27 2.30 — 1.27 — — —
Putnam Vista (U.S. Mid-Cap Equity) Fund 3.16 3.66 3.41 2.73 2.15 — — — — —
* The Total Expense Ratio (TER) is calculated as the total operating expenses for each Unit Class of each Fund in the accounting currency of the Fund for the period in question as a percentageof the average assets of the Fund for the period in question.
** Not registered in Switzerland.
PORTFOLIOS’ TURNOVER RATE (UNAUDITED)
The Portfolio Turnover Rate (PTR) shows the turnover* incurred by each Fund, whose redeemable participating units are registered
for sale in Switzerland during the reporting period, expressed as a rate of the average net asset value of that Fund for the
corresponding period.
PTR
Fund %
Putnam Emerging Information Sciences Fund 57.52
Putnam Emerging Markets Debt Fund 284.02
Putnam Europe Equity Fund 122.05
Putnam Global Equity Multi-Alpha Fund** 12.13
Putnam Global Fixed Income Alpha Fund S1** 179.00
Putnam Global Fixed Income Alpha Fund S2** 796.00
Putnam Global Growth Fund 182.46
Putnam Global High Yield Bond Fund 61.32
Putnam Growth and Income (U.S. Value Equity) Fund 76.86
Putnam International (Non U.S. Core) Equity Fund 127.79
Putnam Investors (U.S. Core Equity) Fund 213.19
Putnam New Opportunities (U.S. Aggressive Growth Equity) Fund 94.30
Putnam Total Return Fund** 367.70
Putnam U.S. Liquid Assets Fund** 3,041.51
Putnam U.S. Small-Cap Value Equity Fund 104.88
* Turnover being a Fund’s aggregate value of total cost of securities purchased plus total disposal proceeds of securities sold less the aggregate value of that Fund’s redeemable participating unitssubscriptions plus redemptions during the reporting period. All values in the turnover calculation are in the functional currency of the respective Fund.
** Not registered in Switzerland.
21

22
PutnamWorld TrustSTATEMENT OF MANAGER’S RESPONSIBILITIESThe Manager is responsible for the preparation of financialstatements, which give a true and fair view of the financialaffairs of the Trust and of its income for the year. In preparingthose financial statements the Manager is required to:
Ω select suitable accounting policies and then apply them consistently;
Ω make judgements and estimates that are reasonable andprudent; and
Ω prepare the financial statements on the going concern basisunless it is inappropriate to presume that the Trust willcontinue in operation.
The Manager is responsible for keeping proper books of accountwhich disclose with reasonable accuracy at any time the financialposition of the Trust and to enable it to ensure that the financialstatements are prepared in accordance with accounting standardsgenerally accepted in Ireland and comply with the Trust Deed andthe European Communities (Undertakings for CollectiveInvestment in Transferable Securities) Regulations, 2003,(as amended).
The measures taken by the Manager to secure compliance withthe Trust’s obligations to keep proper books of account are theuse of appropriate systems and procedures and the employmentof competent persons. To this end, the directors of the Managerhave appointed State Street Fund Services (Ireland) Limited forthe purpose of maintaining proper books of account. The booksof account are kept at Guild House, Guild Street, InternationalFinancial Services Centre, Dublin 1, Ireland. The Manager isalso responsible for safeguarding the assets of the Trust. In thisregard it has entrusted the assets of the Trust to a Trustee forsafekeeping in accordance with the Trust Deed. The Manager isalso responsible for taking reasonable steps for the preventionand detection of fraud, error and non-compliance with laws andregulations.
ON BEHALF OF THE MANAGER:
Director: David Dillon
Director: Wyndham Williams
24 October 2008
REPORT OF THE TRUSTEE TO THE UNITHOLDERS We have enquired into the conduct of the Manager in respect ofPutnam World Trust (‘the Trust’) for the year ended30 June 2008, in our capacity as Trustee to the Trust.
This report including the opinion has been prepared for andsolely for the unitholders in the Trust as a body, in accordancewith the Financial Regulator’s UCITS Notice 4, and for no otherpurpose. We do not, in giving this opinion, accept or assumeresponsibility for any other purpose or to any other person towhom this report is shown.
RESPONSIBILITIES OF THE TRUSTEEOur duties and responsibilities are outlined in the FinancialRegulator’s UCITS Notice 4. One of those duties is to enquireinto the conduct of the Trust in each annual accounting periodand report thereon to the unitholders.
Our report shall state whether, in our opinion, the Trust hasbeen managed in that period in accordance with the provisionsof the Trust’s Trust Deed and the UCITS Regulations. It is theoverall responsibility of the Manager to comply with theseprovisions. If the Manager has not so complied, we as Trusteemust state why this is the case and outline the steps which wehave taken to rectify the situation.
BASIS OF TRUSTEE OPINIONThe Trustee conducts such reviews as it, in its reasonableopinion, considers necessary in order to comply with its dutiesas outlined in UCITS Notice 4 and to ensure that, in all materialrespects, the Trust has been managed (i) in accordance with thelimitations imposed on its investment and borrowing powers bythe provisions of its constitutional documentation and theappropriate regulations and (ii) otherwise in accordance withthe Trust’s constitutional documentation and the appropriateregulations.

23
OPINIONIn our opinion, the Trust has been managed during the year, inall material respects:
(i) in accordance with the limitations imposed on theinvestment and borrowing powers of the Manager and theTrustee by the Trust Deed and by the EuropeanCommunities (Undertakings for Collective Investment inTransferable Securities) Regulations 2003, (as amended),(‘the Regulations’); and
(ii)otherwise in accordance with the provisions of the TrustDeed and the Regulations.
State Street Custodial Services (Ireland) LimitedGuild HouseGuild StreetInternational Financial Services CentreDublin 1Ireland
Date: 24 October 2008

24
PutnamWorld Trust Independent Auditor’s Report
INDEPENDENT AUDITORS REPORT TO THEUNITHOLDERS OF PUTNAM WORLD TRUST(the “TRUST”)We have audited the Trust’s financial statements for the yearended 30 June 2008 which comprise for each of the Trusts’Funds the Balance Sheet, the Profit and Loss Account, theStatement of Changes in Net Assets Attributable to RedeemableParticipating Unitholders, the Schedule of Investments and therelated notes. These financial statements have been preparedunder the accounting policies set out therein.
RESPECTIVE RESPONSIBILITIES OF THE MANAGER AND THE AUDITORSThe Manager’s responsibilities for preparing the Annual Reportand the financial statements in accordance with applicable Irishlaw and the accounting standards issued by the AccountingStandards Board and published by the Institute of CharteredAccountants in Ireland (Generally Accepted AccountingPractice in Ireland) are set out in the Statement of Manager’sResponsibilities.
Our responsibility is to audit the financial statements inaccordance with relevant legal and regulatory requirements andInternational Standards on Auditing (UK and Ireland). Thisreport, including the opinion, has been prepared for and onlyfor each Fund’s Unitholders as a body and for no other purpose.We do not, in giving this opinion, accept or assume responsibilityfor any other purpose or to any other person to whom this reportis shown or into whose hands it may come save where expresslyagreed by our prior consent in writing.
We report to you our opinion as to whether the financialstatements give a true and fair view in accordance with GenerallyAccepted Accounting Practice in Ireland, and are properlyprepared in accordance with Irish statute comprising theEuropean Communities (Undertakings for Collective Investmentin Transferable Securities) Regulations, 2003 (as amended).
We read the other information contained in the Annual Report,and consider whether it is consistent with the audited financialstatements. We consider the implications for our report if webecome aware of any apparent misstatements or materialinconsistencies with the financial statements. Ourresponsibilities do not extend to any other information.
BASIS OF AUDIT OPINIONWe conducted our audit in accordance with InternationalStandards on Auditing (UK and Ireland) issued by the AuditingPractices Board. An audit includes examination, on a test basis,of evidence relevant to the amounts and disclosures in thefinancial statements. It also includes an assessment of thesignificant estimates and judgements made by the Manager inthe preparation of the financial statements, and of whether theaccounting policies are appropriate to the Fund’scircumstances, consistently applied and adequately disclosed.
We planned and performed our audit so as to obtain all theinformation and explanations which we considered necessary inorder to provide us with sufficient evidence to give reasonableassurance that the financial statements are free from materialmisstatement, whether caused by fraud or other irregularity orerror. In forming our opinion we also evaluated the overalladequacy of the presentation of information in the financialstatements.
OPINIONIn our opinion the financial statements:
• give a true and fair view in accordance with GenerallyAccepted Accounting Practice in Ireland, of the state of eachFund’s affairs at 30 June 2008 and of their results for the yearthen ended; and
• have been properly prepared in accordance with therequirements of the European Communities (Undertakingsfor Collective Investment in Transferable Securities)Regulations, 2003, (as amended).
PricewaterhouseCoopersChartered Accountants and Registered AuditorsDublin
24 October 2008

25
Putnam Emerging Information Sciences Fund
Schedule of Investments
30 June 2008
21,467 Acme Packet Incorporated $166,584 0.81
13,700 Actel Corporation 232,900 1.13
25,300 Advanced Analogic Technologies Incorporated 101,200 0.49
10,100 Advent Software Incorporated 363,600 1.77
4,900 Affiliated Computer Services Incorporated (Class A) 259,700 1.26
16,500 Akamai Technologies Incorporated 577,500 2.81
29,550 Altera Corporation 620,550 3.01
3,200 Amphenol Corporation (Class A) 144,000 0.70
11,300 Analog Devices Incorporated 361,600 1.75
5,800 Ansoft Corporation 208,800 1.01
12,500 Ansys Incorporated 587,500 2.84
3,100 Autodesk Incorporated 105,400 0.51
2,750 Avnet Incorporated 74,250 0.36
7,200 Belden CDT Incorporated 244,800 1.18
11,200 Blackbaud Incorporated 235,200 1.14
6,700 BMC Software Incorporated 241,200 1.17
5,300 CommScope Incorporated 280,900 1.36
4,200 Dolby Laboratories Incorporated (Class A) 168,000 0.81
1,900 EchoStar Corporation (Class A) 58,900 0.28
6,500 Equifax Incorporated 221,000 1.07
850 Equinix Incorporated 75,650 0.37
31,100 F5 Networks Incorporated 870,800 4.23
5,600 FLIR Systems Incorporated 229,600 1.11
25,650 Foundry Networks Incorporated 307,800 1.49
7,800 Harris Corporation 390,000 1.89
8,150 Hittite Microwave Corporation 293,400 1.42
126 Illumina Incorporated 10,962 0.05
31,850 Informatica Corporation 477,750 2.31
20,400 Intermec Incorporated 428,400 2.07
7,000 International Rectifier Corporation 133,000 0.64
5,000 Intersil Corporation (Class A) 120,000 0.58
6,000 Jack Henry & Associates Incorporated 132,000 0.64
5,600 JDA Software Group Incorporated 100,800 0.49
12,800 Juniper Networks Incorporated 281,600 1.36
4,700 Liberty Global Incorporated (Class A) 145,700 0.70
9,300 Maxim Integrated Products Incorporated 196,695 0.95
17,700 McAfee Incorporated 601,800 2.91
23,400 Micrel Incorporated 210,600 1.02
16,300 Micros Systems Incorporated 489,000 2.36
1,400 MicroStrategy Incorporated 91,000 0.44
19,000 Molex Incorporated 456,000 2.22
7,300 Moog Incorporated 270,100 1.31
17,500 National Instruments Corporation 490,000 2.37
7,950 NCI Incorporated 182,850 0.88
7,700 NCR Corporation 192,500 0.93
14,100 Netezza Corporation 169,200 0.82
7,450 Netlogic Microsystems Incorporated 245,850 1.19
14,900 NeuStar Incorporated (Class A) 327,800 1.58
15,100 Novatel Wireless Incorporated 166,100 0.80
38,800 Nuance Communications Incorporated 620,800 3.00
12,500 NVIDIA Corporation 237,500 1.15
20,500 PDF Solutions Incorporated 123,000 0.59
17,800 PROS Holdings Incorporated 195,800 0.95
24,800 Quest Software Incorporated 372,000 1.80
40,600 Red Hat Incorporated 852,600 4.12
600 Salesforce.com Incorporated $40,800 0.20
29,600 Sapient Corporation 177,600 0.86
23,200 Smart Modular Technologies WWH Incorporated 92,800 0.45
19,100 Solera Holdings Incorporated 534,800 2.59
14,900 Switch & Data Facilities Co. Incorporated 253,300 1.22
17,900 Synopsys Incorporated 429,600 2.08
18,000 Teradata Corporation 414,000 2.00
3,500 Trimble Navigation Limited 126,000 0.61
8,639 TTM Technologies Incorporated 112,307 0.54
2,750 Varian Semiconductor Equipment 96,250 0.47
5,800 Varian Incorporated 295,800 1.43
Total U.S. Equities $18,315,498 88.57
NON-U.S. EQUITIES (10.19%)
15,350 Amdocs Limited $445,150 2.15
52,300 ARM Holdings PLC 261,500 1.26
31,200 Marvell Technology Group Limited 561,600 2.71
11,500 Nice Systems Limited 345,000 1.67
16,550 O2Micro International Limited 115,850 0.56
1,428 Realex Properties Corporation 1,474 0.01
19,900 Seagate Technology 378,100 1.83
Total Non-U.S. Equities $2,108,674 10.19
CONVERTIBLE PREFERRED STOCKS (—%)
78,732 MartketSoft Software Corporation $8 —
46,220 Totality Corporation 5 —
Total Convertible Preferred Stocks $13 —
REPURCHASE AGREEMENTS (0.76%)
$158,000 Repurchase Agreement– Goldman Sachs 2.33 01/07/2008 $158,000 0.76
Total Repurchase Agreements $158,000 0.76
Total Value of Investments $20,582,185 99.52
THE ACCOMPANYING NOTES ARE AN INTEGRAL PART OF THESE FINANCIAL STATEMENTS.
Number of Shares
ValueUSD
% ofFund
U.S. EQUITIES (88.57%) U.S. EQUITIES (Continued)
Number of Shares
ValueUSD
% ofFund
Number of Shares
ValueUSD
% ofFund
Number of Shares
ValueUSD
% ofFund
PrincipalAmount
CouponRate %
MaturityDate
ValueUSD
% ofFund

26
Putnam Emerging Information Sciences Fund
THE ACCOMPANYING NOTES ARE AN INTEGRAL PART OF THESE FINANCIAL STATEMENTS.
FORWARD FOREIGN EXCHANGE CURRENCY CONTRACTS (0.06%)
17/09/2008 USD 12,400 EUR 8,018 Citibank NA $178 —
17/09/2008 EUR 76,393 USD 118,200 Credit Suisse First Boston (1,637) (0.01)
17/09/2008 GBP 20,200 EUR 25,492 HSBC Bank USA (36) —
17/09/2008 EUR 240,454 USD 372,400 HSBC Bank USA (4,796) (0.02)
17/09/2008 USD 21,700 EUR 14,019 JP Morgan Chase Bank 292 —
17/09/2008 EUR 117,043 USD 181,100 Lehman Brothers* (2,503) (0.01)
17/09/2008 USD 797,200 EUR 515,338 Merrill Lynch 11,206 0.05
17/09/2008 USD 847,300 EUR 547,238 UBS AG 11,143 0.05
17/09/2008 EUR 17,156 GBP 13,600 Westpac Banking Group 35 —
20/08/2008 HKD 46,900 EUR 3,928 JP Morgan Chase Bank 151 —
Net Unrealised Appreciation on Forward Foreign Exchange Currency Contracts $14,033 0.06
Total Financial Assets at Fair Value through Profit or Loss $20,596,218 99.58
* Please refer to note 12 Subsequent events for more detail.
Analysis of Investments (Unaudited)
(a) Transferable securities admitted to official stock exchange listing 97.67
(b) Transferable securities dealt in on another regulated market —
(c) Transferable securities other than those admitted to official stock exchange listing or dealt in on another regulated market 0.76
(d) Collective Investment Schemes —
(e) OTC financial derivative instruments 0.11
(f ) Exchange traded financial derivative instruments —
(g) Other assets 1.46
Total Investments 100.00
% ofTotal Assets
SettlementDates
CurrencySold
AmountSold
CurrencyBought
AmountBought Counterparty
Unrealised Appreciation/
(Depreciation)USD
% ofFund

27
$100,000 VTB Capital SA 6.61 31/10/2012 $97,659 3.44
100,000 VTB Capital SA 6.32 04/02/2015 98,960 3.48
Total Corporate Bonds & Notes $594,191 20.92
COMMERCIAL PAPER (17.57%)
$500,000 Federal Home Loan Bank System 0.00 25/07/2008 $499,300 17.57
Total Commercial Paper $499,300 17.57
MUTUAL FUNDS (8.80%)
$250,000 U.S. Liquid Assets Fund 20.06 31/12/2049 $250,000 8.80
Total Mutual Funds $250,000 8.80
U.S. GOVERNMENT & AGENCY OBLIGATIONS (1.05%)
$30,000 U.S. Treasury Bill# 0.00 18/09/2008 $29,909 1.05
Total U.S. Government & Agency Obligations $29,909 1.05
REPURCHASE AGREEMENTS (5.88%)
$167,000 Repurchase Agreement– Goldman Sachs 2.33 01/07/2008 $167,000 5.88
Total Repurchase Agreements $167,000 5.88
Total Value of Investments $2,795,249 98.37
# At 30 June 2008, securities in part or in entirety have been designated as collateralfor open futures contracts.
THE ACCOMPANYING NOTES ARE AN INTEGRAL PART OF THESE FINANCIAL STATEMENTS.
27
$10,000 Argentina Government International Bond 7.00 12/09/2013 $7,725 0.27
160,000 Argentina Government International Bond 10.5 01/01/2012 34,400 1.21
85,000 Argentina Government International Bond 0.00 30/04/2013 40,460 1.42
5,000 Argentina Government International Bond 7.00 03/10/2015 3,494 0.12
150,000 Argentina Government International Bond 3.09 03/08/2012 126,259 4.44
95,000 Colombia Governament International Notes 10.00 23/01/2012 110,081 3.87
125,000 Egypt Treasury Bill 0.00 18/09/2008 22,465 0.79
225,000 Egypt Treasury Bill 0.00 18/09/2008 41,528 1.46
17,600 Federative Republicof Brazil Bond 10.00 01/01/2012 101,408 3.57
20,000 Federative Republic of Brazil Bond 8.25 20/01/2034 24,625 0.87
115,000 Peru Government International Bond 9.88 06/02/2015 140,731 4.95
11,832 Republic of Ecuador Bond 12.00 15/11/2012 12,069 0.42
30,000 Republic of Peru Bond 8.75 21/11/2033 38,550 1.36
80,000 Republic of Peru Bond 8.38 03/05/2016 92,700 3.26
54,175 Russia Government International Bond 5.00 31/03/2030 60,744 2.14
73,000 Turkey Government International Bond 6.88 17/03/2036 60,316 2.12
100,000 Ukraine Government International Bond 6.75 14/11/2017 89,000 3.13
10,000 United Mexican States Notes 5.63 15/01/2017 10,113 0.36
125,000 Venezuela Government International Bond 5.38 07/08/2010 118,281 4.16
85,000 Venezuela Government International Notes 10.75 19/09/2013 88,400 3.11
35,000 Venezuela Government International Notes 3.91 20/04/2011 31,500 1.11
Total Foreign Government Bonds & Notes $1,254,849 44.15
CORPORATE BONDS & NOTES (20.92%)
$130,000 Grupo Televisa SA 6.00 15/05/2018 $126,356 4.45
10,000 Pemex Project Funding Master Trust 5.75 01/03/2018 9,875 0.35
10,000 Pemex Project Funding Master Trust 6.63 15/06/2035 9,866 0.35
60,000 Pemex Project Funding Master Trust 6.63 15/06/2038 58,950 2.07
100,000 RSHB Capital SA 7.75 29/05/2018 98,000 3.45
100,000 Sarawak International Incorporated 5.50 03/08/2015 94,525 3.33
Putnam Emerging Markets Debt Fund
Schedule of Investments
30 June 2008
PrincipalAmounts
CouponRate %
MaturityDates
ValueUSD
% ofFund
FOREIGN GOVERNMENT BONDS & NOTES (44.15%)
PrincipalAmounts
CouponRate %
MaturityDates
ValueUSD
% ofFund
PrincipalAmount
CouponRate %
MaturityDate
ValueUSD
% ofFund
PrincipalAmount
CouponRate %
MaturityDate
ValueUSD
% ofFund
PrincipalAmount
CouponRate %
MaturityDate
ValueUSD
% ofFund
CORPORATE BONDS & NOTES (Continued)
PrincipalAmounts
CouponRate %
MaturityDates
ValueUSD
% ofFund
PrincipalAmount
CouponRate %
MaturityDate
ValueUSD
% ofFund

28
Putnam Emerging Markets Debt Fund
THE ACCOMPANYING NOTES ARE AN INTEGRAL PART OF THESE FINANCIAL STATEMENTS.
CREDIT DEFAULT CONTRACTS OUTSTANDING (-1.10%)
Barclays Bank PLCPeru CD $10,084 07/01/2009 170 bp $33 —Peru CD 9,572 10/11/2008 170 bp 26 —
Citibank, N.A.Republic of the Philippines, 10.625%, 3/16/25 50,000 20/10/2017 138.5 bp (5,779) (0.20)
Credit Suisse First Boston InternationalUkraine Government, 7.65%, 6/11/13 40,000 20/10/2011 194 bp (1,522) (0.05)
Deutsche Bank AGIndia Government Bond, 5.87%, 1/2/10 40,000 (F) 11/01/2010 170 bp (4) —Korea Monetary STAB Bond, 5%, 2/14/09 5,000 (F) 23/02/2009 105 bp 2 —Korea Monetary STAB Bond, 5.15%, 2/12/10 5,000 (F) 19/02/2010 115 bp 12 —Malaysian Government, 6.844%, 10/1/09 6,000 01/10/2009 90 bp 27 —Republic of Argentina, 8.28%, 12/31/33 35,000 20/07/2012 (199.5 bp) 4,905 0.17Republic of Argentina, 8.28%, 12/31/33 15,000 20/08/2012 (380 bp) 1,252 0.04Republic of Argentina, 8.28%, 12/31/33 55,000 20/03/2013 (551 bp) 1,901 0.07Republic of Brazil, 12 1/4%, 3/6/30 30,000 20/10/2017 105 bp (971) (0.03)Republic of China, zero coupon, 12/05/2008 8,000 (F) 12/12/2008 115 bp — —Republic of Indonesia, 6.75%, 2014 80,000 20/09/2016 292 bp (1,462) (0.05)Republic of South Korea, 5.45% 1/23/10 15,000 (F) 01/02/2010 101 bp (1) —Republic of Venezuela, 9 1/4%, 9/15/27 10,000 20/06/2014 220 bp (1,508) (0.05)Republic of Venezuela, 9 1/4%, 9/15/27 35,000 20/07/2012 (205 bp) 3,670 0.13Russian Federation, 7.5%, 3/31/30 30,000 20/08/2017 86 bp (884) (0.03)United Mexican States, 7.5%, 4/8/33 15,000 20/03/2014 56 bp (476) (0.02)United Mexican States, 7.5%, 4/8/33 25,000 20/04/2017 66 bp (1,214) (0.04)
JPMorgan Chase Bank, N.A.Republic of Argentina, 8.28%, 12/31/33 15,000 20/06/2014 235 bp (2,740) (0.10)Republic of Brazil, 12.25%, 3/6/30 80,000 20/11/2012 90 bp (605) (0.02)Republic of Turkey, 11 7/8%, 1/15/30 40,000 20/05/2017 230 bp (3,542) (0.12)Republic of Turkey, 11 7/8%, 1/15/30 140,000 20/10/2012 154 bp (6,999) (0.25)Russian Federation, 7 1/2%, 3/31/30 35,000 20/05/2017 60 bp (1,623) (0.06)Russian Federation, 7.5%, 3/31/30 45,000 20/08/2012 65 bp (624) (0.02)Russian Federation, 7.5%, 3/31/30 30,000 20/08/2017 85 bp (906) (0.03)
Lehman Brothers Special Financing, Inc.**Republic of Argentina, 8.28%, 12/31/33 10,000 20/09/2012 (469 bp) 564 0.02Republic of Argentina, 8.28%, 12/31/33 25,000 20/05/2017 296 bp (5,299) (0.19)Republic of Brazil, 12.25%, 3/6/30 5,000 20/04/2013 170 bp 116 —Republic of Ecuador, 10%, 8/15/30 10,000 20/06/2012 600 bp 166 0.01Republic of Ecuador, 10%, 8/15/30 45,000 20/05/2012 540 bp (22) —Republic of Turkey, 11 7/8%, 1/15/30 20,000 20/05/2017 228 bp (1,796) (0.06)Republic of Venezuela, 9 1/4%, 09/15/27 25,000 20/05/2012 183 bp (2,764) (0.10)United Mexican States, 7.5%, 4/8/33 70,000 20/08/2017 72 bp (3,102) (0.11)
Net Unrealised Depreciation on Credit Default Contracts $(31,169) (1.10)
* Payments related to the reference debt are made upon a credit default event.
** Please refer to note 12 Subsequent events for more detail.
(F) Is valued at fair value following procedures approved by the Manager.
Swap counterparty/Referenced debt*
Notional Amount
TerminationDate
Fixed payments received (paid)
by Fund per annum
Unrealised Appreciation/
(Depreciation)USD
% ofFund
FUTURES CONTRACTS (-0.05%)
9 U.S. Government Long Bond Sept 2008 Lehman Brothers* $(1,399) (0.05)
Net Unrealised Depreciation on Futures Contracts $(1,399) (0.05)
Total Financial Assets at Fair Value through Profit or Loss $2,795,249 98.37
Total Financial Liabilities at Fair Value through Profit or Loss $(32,568) (1.15)
* Please refer to note 12 Subsequent events for more detail.
Analysis of Investments (Unaudited)
(a) Transferable securities admitted to official stock exchange listing 80.65
(b) Transferable securities dealt in on another regulated market —
(c) Transferable securities other than those admitted to official stock exchange listing or dealt in on another regulated market 5.66
(d) Collective Investment Schemes 8.48
(e) OTC financial derivative instruments 0.43
(f ) Exchange traded financial derivative instruments —
(g) Other assets 4.78
Total Investments 100.00
% ofTotal Assets
Number of ContractsLong Counterparty
Unrealised (Depreciation)
USD% of
Fund

29
Putnam Europe Equity Fund
Schedule of Investments
30 June 2008
4,438 Air France-KLM $106,519 0.94
2,219 Akzo Nobel NV 152,579 1.35
1,762 Allianz SE 310,769 2.75
11,987 Allied Irish Banks PLC 184,819 1.64
1,942 Arcelor Mittal 192,040 1.70
2,882 ASML Holding NV 70,897 0.63
27,660 BAE Systems PLC 243,821 2.16
18,230 Banco Santander Central Hispano SA 334,764 2.96
3,300 BASF AG 227,688 2.02
3,056 Bayerische Motoren Werke (BMW) AG 146,793 1.30
7,834 BHP Billiton PLC 299,647 2.65
3,329 BNP Paribas SA 301,673 2.67
45,138 BP PLC 524,520 4.64
19,036 Britvic PLC 109,749 0.97
2,476 Credit Suisse Group 113,881 1.01
9,923 Davis Service Group PLC 88,361 0.78
3,893 Deutsche Post AG 101,469 0.90
9,602 DnB Holdings ASA 122,330 1.08
3,272 EFG Eurobank Ergasias 77,811 0.69
25,780 Enel SpA 245,230 2.17
4,064 Finmeccanica SpA 106,823 0.95
22,252 GKN PLC 98,796 0.87
14,867 GlaxoSmithKline PLC 329,666 2.92
4,440 Hellenic Telecommunication Organization SA 111,881 0.99
6,155 ING Groep NV 196,294 1.74
15,457 Koninklijke KPN NV 265,341 2.35
17,758 Koninklijke Ahold NV 238,839 2.11
23,088 Lloyds TSB Group PLC 142,889 1.27
903 Lukoil 87,591 0.78
530 Lukoil ADR 52,338 0.46
756 Merck KGaA 107,240 0.95
977 Modern Times Group AB (Class B) 57,469 0.51
1,818 National Bank of Greece SA 81,944 0.73
7,700 Nestle SA 348,414 3.09
13,379 Nokia OYJ 326,173 2.89
6,957 Novartis AG 383,771 3.40
2,909 Petroleum Geo-Services ASA 71,491 0.63
2,074 Praktiker Bau- und Heimwerkermaerkte AG 43,769 0.39
48,752 Premier Foods PLC 92,314 0.82
19,950 Prudential PLC 211,745 1.87
4,811 Reckitt Benckiser PLC 243,951 2.16
842 Renault SA 69,075 0.61
2,047 Rio Tinto PLC 245,131 2.17
2,194 Roche Holding AG 395,682 3.50
1,578 RWE AG 199,263 1.76
414 Salzgitter AG 75,196 0.67
14,441 Saras SpA 82,046 0.73
7,683 Statoil ASA 286,849 2.54
4,734 Suez SA 322,379 2.85
746 Swisscom AG 249,289 2.21
3,110 Telekom Austria AG 64,359 0.57
5,053 Tognum AG 135,922 1.20
5,839 Total SA 498,231 4.41
23,488 UniCredito Italiano SpA 143,711 1.27
7,464 Vivendi SA 283,179 2.51
1,604 Xstrata PLC 128,619 1.14
983 Zurich Financial Services AG 252,088 2.23
Total Non-U.S. Equities $10,985,118 97.26
$10,000 U.S. Treasury Bills# 0.00% 18/09/2008 $9,970 0.09
Total U.S. Government & Agency Obligations $9,970 0.09
Total Value of Investments $10,995,088 97.35
FUTURES CONTRACTS (0.26%)
¢
1 FTSE 100 Index Sept 2008 JP Morgan Chase Bank $(3,229) (0.03)
Net Unrealised Depreciation on Futures Contracts $(3,229) (0.03)
Variation margin settlement to date $33,066 0.29
Cumulate unrealised less variation marginsettlement to date $29,837 0.26
# At 30 June 2008, securities in part or in entirety have been designated as collateralfor open futures contracts.
THE ACCOMPANYING NOTES ARE AN INTEGRAL PART OF THESE FINANCIAL STATEMENTS.
Number of Shares
ValueUSD
% ofFund
NON-U.S. EQUITIES (97.26%) U.S. GOVERNMENT & AGENCY OBLIGATIONS (0.09%)
PrincipalAmount
CouponRate %
MaturityDate
ValueUSD
% ofFund
Number of ContractsLong Counterparty
Unrealised (Depreciation)
USD% of
Fund

30
Putnam Europe Equity Fund
THE ACCOMPANYING NOTES ARE AN INTEGRAL PART OF THESE FINANCIAL STATEMENTS.
FORWARD FOREIGN EXCHANGE CURRENCY CONTRACTS (0.07%)
17/09/2008 USD 9,832 NOK 50,900 Bank of America Securities $97 —
17/09/2008 CHF 167,800 USD 160,362 Bank of America Securities (4,316) (0.04)
17/09/2008 USD 232,019 SEK 1,407,300 Bank of America Securities 825 0.01
17/09/2008 USD 246,837 GBP 127,200 Bank of America Securities 5,186 0.05
17/09/2008 SEK 336,400 EUR 36,006 Bank of America Securities 827 0.01
17/09/2008 USD 79,200 EUR 51,212 Citibank NA 1,136 0.01
17/09/2008 GBP 18,500 EUR 23,350 Citibank NA (30) —
17/09/2008 NOK 1,333,100 USD 258,593 Citibank NA (1,457) (0.01)
17/09/2008 USD 89,601 CHF 93,400 Citibank NA 2,061 0.02
17/09/2008 USD 319,587 GBP 164,700 Citibank NA 6,735 0.06
17/09/2008 USD 326,692 EUR 211,500 Citibank NA 5,087 0.05
17/09/2008 SEK 1,100,900 USD 181,961 Citibank NA (188) —
17/09/2008 EUR 38,700 USD 60,346 Credit Suisse First Boston (358) —
17/09/2008 USD 279,845 NOK 1,448,200 Credit Suisse First Boston 2,658 0.02
17/09/2008 EUR 46,120 NOK 369,900 Credit Suisse First Boston (184) —
17/09/2008 GBP 23,000 USD 44,929 Credit Suisse First Boston (641) (0.01)
17/09/2008 EUR 54,000 USD 83,631 Deutsche Bank, London (1,074) (0.01)
17/09/2008 USD 31,843 NOK 164,000 HSBC Bank USA 149 —
17/09/2008 USD 124,176 GBP 63,600 HSBC Bank USA 1,835 0.02
17/09/2008 GBP 362,300 EUR 457,219 HSBC Bank USA (647) (0.01)
17/09/2008 USD 15,923 EUR 10,300 HSBC Bank USA 234 —
17/09/2008 SEK 180,900 USD 29,787 JP Morgan Chase Bank (144) —
17/09/2008 USD 196,234 CHF 204,300 JP Morgan Chase Bank 4,265 0.04
17/09/2008 EUR 38,800 USD 59,804 JP Morgan Chase Bank (1,058) (0.01)
17/09/2008 USD 31,162 GBP 16,000 Lehman Brothers* 539 0.01
17/09/2008 USD 84,100 EUR 54,353 Lehman Brothers* 1,162 0.01
17/09/2008 GBP 13,200 EUR 16,651 Lehman Brothers* (36) —
17/09/2008 USD 59,465 NOK 306,800 Lehman Brothers* 383 —
17/09/2008 CHF 110,300 USD 105,651 Lehman Brothers* (2,597) (0.02)
17/09/2008 NOK 1,173,800 EUR 146,728 Lehman Brothers* 1,178 0.01
17/09/2008 USD 103,556 EUR 66,800 Lehman Brothers* 1,227 0.01
17/09/2008 USD 38,877 NOK 201,300 Merrill Lynch 391 —
17/09/2008 USD 20,900 EUR 13,510 Merrill Lynch 292 (0.01)
17/09/2008 CHF 196,000 USD 187,838 Merrill Lynch (4,515) (0.04)
17/09/2008 CHF 19,400 EUR 12,127 Merrill Lynch (15) —
17/09/2008 EUR 48,500 USD 75,021 Merrill Lynch (1,055) (0.01)
17/09/2008 CHF 509,400 USD 488,458 UBS AG (11,465) (0.10)
17/09/2008 EUR 727,200 USD 1,126,787 UBS AG (13,900) (0.12)
17/09/2008 EUR 115,948 USD 179,200 UBS AG (2,688) (0.03)
17/09/2008 USD 7,238 GBP 3,700 UBS AG 93 —
SettlementDates
CurrencySold
AmountSold
CurrencyBought
AmountBought Counterparty
Unrealised Appreciation/
(Depreciation)USD
% ofFund

31
THE ACCOMPANYING NOTES ARE AN INTEGRAL PART OF THESE FINANCIAL STATEMENTS.
Putnam Europe Equity Fund
17/09/2008 USD 213,341 NOK 1,103,100 UBS AG $1,843 —
17/09/2008 CHF 189,000 EUR 118,262 UBS AG 49 —
17/09/2008 USD 824,019 GBP 424,200 Westpac Banking Group 16,452 0.15
Net Unrealised Appreciation on Forward Foreign Exchange Currency Contracts $8,336 0.07
Total Financial Assets at Fair Value through Profit or Loss $11,033,261 97.55
* Please refer to note 12 Subsequent events for more detail.
Analysis of Investments (Unaudited)
(a) Transferable securities admitted to official stock exchange listing 90.40
(b) Transferable securities dealt in on another regulated market —
(c) Transferable securities other than those admitted to official stock exchange listing or dealt in on another regulated market —
(d) Collective Investment Schemes —
(e) OTC financial derivative instruments 0.45
(f ) Exchange traded financial derivative instruments —
(g) Other assets 9.15
Total Investments 100.00
% ofTotal Assets
FORWARD FOREIGN EXCHANGE CURRENCY CONTRACTS (Continued)
SettlementDates
CurrencySold
AmountSold
CurrencyBought
AmountBought Counterparty
Unrealised Appreciation/
(Depreciation)USD
% ofFund

U.S. EQUITIES (Continued)U.S. EQUITIES (42.39%)
32
3,019 Aetna Incorporated $122,330 0.75
978 AK Steel Holding Corporation 67,433 0.41
2,594 Altria Group Incorporated 53,229 0.33
1,830 Ameriprise Financial Incorporated 74,426 0.46
1,774 AmerisourceBergen Corporation 70,907 0.43
894 Annaly Capital Management Incorporated 13,866 0.08
182 Apache Corporation 25,285 0.15
2,847 Atmos Energy Corporation 78,492 0.48
1,986 Best Buy Company Incorporated 78,487 0.48
2,650 BJ’s Wholesale Club Incorporated 102,052 0.63
383 BlackRock Incorporated 67,791 0.42
1,200 BMC Software Incorporated 43,104 0.26
2,472 Boeing Company/The 162,435 1.00
1,020 Casey’s General Stores Incorporated 23,633 0.14
1,886 Caterpillar Incorporated 139,036 0.85
505 CF Industries Holdings Incorporated 77,053 0.47
2,717 Chevron Corporation 269,037 1.65
1,751 Chubb Corporation 85,817 0.53
5,374 Coca-Cola Enterprises Incorporated 92,970 0.57
335 Comtech Telecommunications Corporation 16,415 0.10
1,391 ConocoPhillips 131,004 0.80
8,114 Electronic Data Systems Corporation 199,929 1.23
2,000 Eli Lilly & Company 92,180 0.56
4,882 Exxon Mobil Corporation 428,835 2.63
121 Fairpoint Communications Incorporated 872 0.01
1,200 Federated Investors Incorporated 41,304 0.25
1,398 General Electric Company 37,159 0.23
93 Global IndustriesLimited 1,667 0.01
1,007 Hewlett-Packard Company 44,429 0.27
3,992 Hill-Rom Holdings Incorporated 107,065 0.66
1,444 IBM Corporation 170,840 1.05
7,750 Intel Corporation 166,470 1.02
2,517 iShares MSCI EAFE Index Fund 172,717 1.06
2,656 Invitrogen Corporation 104,115 0.64
2,795 Johnson & Johnson 179,663 1.10
2,810 JPMorgan Chase & Company 96,411 0.59
928 Kinetic Concepts Incorporated 36,962 0.23
8,401 King Pharmaceuticals Incorporated 87,958 0.54
1,460 Lockheed Martin Corporation 143,898 0.88
3,061 Marathon Oil Corporation 158,682 0.97
1,370 MEMC Electronic Materials Incorporated 84,282 0.52
7,415 Microsoft Corporation 204,135 1.25
971 Monsanto Company 122,472 0.75
754 The Mosaic Company 109,096 0.67
1,921 Nasdaq OMX Group Incorporated 51,022 0.31
1,588 National-Oilwell Varco Incorporated 140,887 0.86
1,684 NIKE Incorporated 100,366 0.62
700 Northrop Grumman Corporation 46,830 0.29
1,438 Occidental Petroleum Corporation 129,104 0.79
2,014 Owens-Illinois Incorporated 83,964 0.51
3,963 The Pepsi Bottling Group Incorporated 110,528 0.68
7,787 Pfizer Incorporated 135,883 0.83
15 PharMerica Corporation 339 —
2,426 Philip Morris International Incorporated 119,626 0.73
400 Polaris Industries Incorporated 16,152 0.10
2,013 The Procter & Gamble Company 122,209 0.75
800 ProLogis Trust $43,408 0.27
211 Reliance Steel & Aluminum Company 16,264 0.10
1,218 Reynolds American Incorporated 56,820 0.35
1,382 S&P 500 Index Depository Receipts 176,523 1.08
1,537 Shaw Group Incorporated 94,648 0.58
1,306 Southern Copper Corporation 139,259 0.85
892 State Street Corporation 56,981 0.35
3,997 Syniverse Holdings Incorporated 64,671 0.40
1,030 Synopsys Incorporated 24,607 0.15
1,571 Telephone and Data Systems Incorporated 74,073 0.45
1,510 Thermo Electron Corporation 84,107 0.52
1,091 Travelers Cos. Incorporated 47,273 0.29
1,711 UnitedHealth Group Incorporated 44,914 0.28
1,880 Valero Energy Corporation 77,362 0.47
5,761 Verizon Communications Incorporated 203,536 1.25
1,378 WellPoint Incorporated 65,538 0.40
100 WESCO International Incorporated 3,994 0.02
Total U.S. Equities $6,916,831 42.39
NON-U.S. EQUITIES (48.18%)
4,813 3i Group PLC $79,097 0.48
91 Agrium Incorporated 9,834 0.06
55 ALPS Electric Company Limited 569 —
2,520 Anglo American PLC 177,056 1.09
8,421 Antofagasta PLC 110,360 0.68
573 Arch Capital Group Limited 38,001 0.23
35,000 Ascendas Real Estate Investment Trust 56,892 0.35
379 Autobacs Seven Company Limited 10,617 0.07
10,069 BAE Systems PLC 88,757 0.54
8,304 Balfour Beatty PLC 70,303 0.43
986 Baloise Holding AG 103,947 0.64
8,830 Banco Santander Central Hispano SA 162,148 0.99
5,411 Bank Leumi Le-Israel BM 26,986 0.17
5,701 Bank of Ireland PLC 49,472 0.30
2,114 Bank of Nova Scotia 96,973 0.59
1,892 BASF AG 130,541 0.80
3,354 BAT Industries PLC 116,189 0.71
1,319 BCE Incorporated 46,089 0.28
3,485 BG Group PLC 90,719 0.56
3,632 BHP Billiton Limited 151,486 0.93
1,570 BNP Paribas SA 142,273 0.87
718 Bobst Group AG 57,105 0.35
10,203 Bombardier Incorporated 74,311 0.46
19,594 BP PLC 227,689 1.40
766 Canadian Imperial Bank of Commerce 42,102 0.26
4,200 Canon Sales Company Incorporated 73,922 0.45
17 Canon Incorporated 867 0.01
9,432 China Mobile Limited 126,657 0.78
80,950 China Steel Corporation 124,830 0.77
3,210 Circle K Sunkus Company Limited 56,255 0.34
619 Corio NV 48,382 0.30
3,972 Credit Agricole SA 81,196 0.50
6,000 Dainippon Sumitomo Pharma Company Limited 48,557 0.30
1,261 Deutsche Bank AG 109,128 0.67
5,167 Deutsche Lufthansa AG 111,240 0.68
THE ACCOMPANYING NOTES ARE AN INTEGRAL PART OF THESE FINANCIAL STATEMENTS.
Putnam Global Equity Multi-Alpha Fund
Schedule of Investments
30 June 2008
Number of Shares
ValueUSD
% ofFund
Number of Shares
ValueUSD
% ofFund
Number of Shares
ValueUSD
% ofFund

NON-U.S. EQUITIES (Continued) NON-U.S. EQUITIES (Continued)
13,370 Singapore Airlines Limited $144,556 0.89
4,676 Stagecoach Group PLC 26,073 0.16
2,200 Suzuken Company Limited 81,136 0.50
32,036 Taisei Corporation 76,147 0.47
9 Taiwan Semiconductor Manufacturing Company Limited 19 —
1,200 TDK Corporation 71,647 0.44
2,634 Teck Cominco Limited 127,299 0.78
19,847 Telstra Corporation Limited 80,667 0.49
21,805 Tenaga Nasional Berhad 54,429 0.33
354 Total SA 30,206 0.19
1,029 Toyo Suisan Kaisha Limited 23,245 0.14
352 Vastned Retail NV 28,273 0.17
2,827 Vivendi SA 107,255 0.66
54,202 Vodafone Group PLC 161,081 0.98
483 Volkswagon AG 139,630 0.86
4,300 Yamaha Motor Company Limited 80,508 0.49
470 Zurich Financial Services AG 120,531 0.74
Total Non-U.S. Equities $7,861,214 48.18
U.S. GOVERNMENT & AGENCY OBLIGATIONS (6.11%)
$1,000,000 United States Treasury Bill 18/09/2008 $996,969 6.11
Total U.S. Government & Agency Obligations $996,969 6.11
Total Value of Investments $15,775,014 96.68
33
1 Discovery Holdings Limited $3 —
8,104 DnB Holdings ASA 103,246 0.63
808 E.On AG 163,175 1.00
873 Emera Incorporated 19,796 0.12
14,592 Enel SpA 138,805 0.85
5,157 ENI SpA 192,080 1.18
7,900 Esprit Holdings Limited 82,020 0.50
20 FamilyMart Company Limited 815 —
37,746 FirstRand Limited 64,356 0.39
863 Fording Canadian Coal Trust 82,703 0.51
26,111 Formosa Chemicals & Fibre Corporation 51,449 0.32
354 Fuji Heavy Industries 1,733 0.01
1,073 Fujitsu Limited 7,945 0.05
14 Galenica Holdings AG 4,943 0.03
1,700 Gaz de France SA 109,262 0.67
2,955 Hennes & Mauritz AB 160,315 0.98
1,000 Hitachi Limited 7,197 0.04
3,800 Honda Motor Company Limited 128,674 0.79
4,112 ING Groep NV 131,139 0.80
82 IT Holdings Corporation 1,647 0.01
616 Itochu Corporation 6,548 0.04
7,000 Jardine Cycle & Carriage Limited 87,320 0.54
1 KDDI Corporation 6,178 0.04
4,101 Koninklijke Ahold NV 55,157 0.34
76 Korea Electric Power Corporation 1,104 0.01
179 Liechtenstein Landesbank 13,868 0.08
1,218 Lloyds TSB Group PLC 7,538 0.05
1,000 Marubeni Corporation 8,319 0.05
2,300 Methanex Corporation 65,152 0.40
2,189 Mitsubishi Corporation 71,852 0.44
637 Muenchener Rueckversicherungs-Gesellschaft AG 111,627 0.68
51,572 Nan Ya Plastic Corporation 109,435 0.67
1,569 National Express Group PLC 29,757 0.18
21,683 Neptune Orient Lines Limited 51,512 0.32
21,000 Nippon Oil Corporation 141,030 0.86
40 Nippon Telegraph & Telephone (NTT) Corporation 194,680 1.19
7,615 Nokia OYJ 185,650 1.14
10,728 Nordea AB 148,133 0.91
826 Novo Nordisk A/S 54,086 0.33
1,409 Paddy Power PLC 44,048 0.27
106 Potash Corporation Of Saskatchewan Incorporated 24,648 0.15
25,000 PT Astra International Incorporated 52,225 0.32
5,800 Public Bank Berhad 18,297 0.11
16,569 Qantas Airways Limited 48,284 0.30
2,450 Remgro Limited 58,983 0.36
6,000 Ricoh Company Limited 108,036 0.66
8,313 RMB Holdings Limited 22,379 0.14
169 Rothmans Incorporated 4,502 0.03
2,333 Royal Bank of Canada 104,290 0.64
16,012 Royal Bank of Scotland Group PLC 68,538 0.42
325 Sanofi-Aventis 21,712 0.13
3,439 Seagate Technology 65,651 0.40
4,546 Seiko Epson Corporation 125,206 0.77
193 Shimizu Corporation 914 0.01
THE ACCOMPANYING NOTES ARE AN INTEGRAL PART OF THESE FINANCIAL STATEMENTS.
Putnam Global Equity Multi-Alpha Fund
Number of Shares
ValueUSD
% ofFund
Number of Shares
ValueUSD
% ofFund
PrincipalAmount
CouponRate %
MaturityDate
ValueUSD
% ofFund

34
FUTURES CONTRACTS (0.23%)
(6) Amsterdam Exchanges Index July 2008 Goldman Sachs International $45,026 0.28
(6) BEL 20 Index July 2008 Goldman Sachs International 31,187 0.19
3 DAX Index Sept 2008 Goldman Sachs International (39,913) (0.24)
(10) Euro-CAC 40 Index Sept 2008 Goldman Sachs International 26,058 0.16
16 New Financial Times Stock Exchange 100 Index Sept 2008 Goldman Sachs International (30,256) (0.19)
60 OBX Index July 2008 Goldman Sachs International (31,201) (0.19)
(87) OMXS 30 Index July 2008 Goldman Sachs International 113,979 0.70
26 S&P 500 Index E-Mini Sept 2008 Goldman Sachs International (102,700) (0.63)
4 S&P/MIB Index Sept 2008 Goldman Sachs International (27,222) (0.17)
3 S&P/Toronto Stock Exchange 60 Index Sept 2008 Goldman Sachs International (4,140) (0.03)
(30) SGX MSCI Singapore Index July 2008 Goldman Sachs International 15,615 0.10
2 SPI 200 Index Sept 2008 Goldman Sachs International (9,317) (0.06)
(19) Swiss Market Index Sept 2008 Goldman Sachs International 34,362 0.21
8 Tokyo Price Index Sept 2008 Goldman Sachs International (59,324) (0.36)
Net Unrealised Depreciation on Futures Contracts $(37,846) (0.23)
Variation margin settlement to date $(75,521) (0.46)
Cumulate unrealised less variation margin settlement to date $37,675 0.23
Total Financial Assets at Fair Value through Profit or Loss $15,812,689 96.94
Analysis of Investments (Unaudited)
(a) Transferable securities admitted to official stock exchange listing 74.93
(b) Transferable securities dealt in on another regulated market —
(c) Transferable securities other than those admitted to official stock exchange listing or dealt in on another regulated market —
(d) Collective Investment Schemes —
(e) OTC financial derivative instruments —
(f ) Exchange traded financial derivative instruments 1.27
(g) Other assets 23.80
Total Investments 100.00
% ofTotal Assets
Putnam Global Equity Multi-Alpha Fund
THE ACCOMPANYING NOTES ARE AN INTEGRAL PART OF THESE FINANCIAL STATEMENTS.
Number of ContractsLong/(Short) Counterparty
Unrealised Appreciation/
(Depreciation)USD
% ofFund

35
Putnam Global Fixed Income Alpha Fund S1
Schedule of Investments
30 June 2008
453,096 Ace Securities Corporation 144A 6.50 15/08/2030 £199,465 0.04
704,000 BankAmerica Manufactured Housing Contract Trust 6.90 10/04/2028 445,704 0.10
1,605,211 Bombardier Capital Mortgage Securitization Corporation 6.53 15/10/2028 605,699 0.13
535,000 Credit-Based Asset Servicing and Securitization 144A (Class M1) 6.25 25/10/2036 225,467 0.05
234,000 Credit-Based Asset Servicing and Securitization 144A (Class M2) 6.25 25/10/2036 96,267 0.02
2,228,000 Green Tree Financial Corporation 7.95 15/09/2027 976,287 0.21
1,260,000 Green Tree Financial Corporation 7.60 15/04/2026 492,608 0.11
171,956 Green Tree Financial Corporation 6.85 15/10/2018 77,618 0.02
2,883,757 Greenpoint Manufactured Housing 8.45 20/06/2031 1,229,778 0.27
578,082 Mid-State Trust 7.34 01/07/2035 278,948 0.06
1,657,663 Mid-State Trust 4.86 15/07/2038 616,917 0.14
466,000 Oakwood Mortgage Investors Incorporated 6.83 15/05/2028 174,575 0.04
393,968 Oakwood Mortgage Investors Incorporated 6.45 15/11/2017 166,328 0.04
2,236,320 Oakwood Mortgage Investors Incorporated 5.26 15/01/2019 699,776 0.15
457,910 Oakwood Mortgage Investors Incorporated 2.77 15/03/2014 143,723 0.03
1,309,767 Vanderbilt Mortgage & Finance Incorporated 7.74 07/04/2031 624,459 0.14
Total Asset-Backed Securities £7,053,619 1.55
COLLATERALISED MORTGAGE OBLIGATIONS (28.86%)
23,000 Banc of America Commercial Mortgage Incorporated 5.63 10/04/2049 £11,310 —
4,450,000 Banc of America Commercial Mortgage Incorporated 5.45 15/01/2049 2,188,986 0.48
2,165,000 Banc of America Commercial Mortgage Incorporated 5.31 10/10/2045 1,085,650 0.24
2,950,430 Banc of America Funding Corporation 5.99 20/05/2036 1,176,797 0.26
2,112,938 Bear Stearns*Alternative A Trust 6.25 25/08/2036 819,569 0.18
1,993,054 Bear Stearns*Alternative A Trust 5.69 25/09/2035 767,744 0.17
90,000 Bear Stearns*Commercial Mortgage Securities Trust 5.85 11/06/2040 44,518 0.01
3,060,000 Citigroup Commercial Mortgage Trust 6.03 10/10/2012 1,543,414 0.34
5,635,000 Citigroup Commercial Mortgage Trust 6.30 10/11/2014 2,871,164 0.63
1,445,415 Citigroup Mortgage Loan Trust Incorporated 6.21 25/07/2036 £526,818 0.12
3,012,740 Citigroup Mortgage Loan Trust Incorporated 5.66 25/11/2036 1,137,411 0.25
10,803,000 Commercial Mortgage Loan Trust 6.22 10/09/2017 5,353,766 1.18
1,308,434 Countrywide Alternative Loan Trust 5.54 25/03/2047 592,707 0.13
1,121,313 Countrywide Alternative Loan Trust 5.12 25/03/2034 29,447 0.01
2,875,586 Countrywide Alternative Loan Trust (Class 2A2) 6.00 25/02/2037 1,174,221 0.26
2,295,213 Countrywide Alternative Loan Trust (Class A4) 6.00 25/02/2037 938,490 0.21
4,767,000 Credit Suisse Mortgage Capital Certificates 6.43 15/02/2041 2,403,788 0.53
14,000 Credit Suisse Mortgage Capital Certificates 6.01 15/09/2039 6,964 —
5,215,000 Credit Suisse Mortgage Capital Certificates 5.91 15/06/2039 2,589,630 0.57
15,600,000 CS First Boston Mortgage Securities Corporation 5.71 15/02/2039 7,788,480 1.71
3,438,314 CWMBS Incorporated 5.71 20/11/2035 1,345,517 0.30
40,071 CWMBS Incorporated 3.13 25/05/2035 471 —
6,789,195 Federal Home Loan Mortgage Corporation 3.93 15/11/2037 270,491 0.06
91,503 Federal Home Loan Mortgage Corporation 0.00 15/07/2037 37,874 0.01
84,947 Federal Home Loan Mortgage Corporation 0.00 15/10/2036 38,348 0.01
65,803 Federal Home Loan Mortgage Corporation 0.00 15/03/2036 31,605 0.01
112,282 Federal Home Loan Mortgage Corporation 0.00 15/08/2035 47,036 0.01
37,013 Federal Home Loan Mortgage Corporation 0.03 25/05/2043 55 —
40,457 Federal Home Loan Mortgage Corporation 0.28 25/05/2043 171 —
31,468 Federal Home Loan Mortgage Corporation 0.37 25/05/2043 203 —
42,541 Federal Home Loan Mortgage Corporation 0.52 25/05/2043 341 —
830,586 Federal Home Loan Mortgage Corporation 3.29 15/08/2037 27,075 0.01
5,534,862 Federal Home Loan Mortgage Corporation 3.48 15/11/2036 180,614 0.04
2,716,939 Federal Home Loan Mortgage Corporation 3.68 15/04/2035 84,265 0.02
THE ACCOMPANYING NOTES ARE AN INTEGRAL PART OF THESE FINANCIAL STATEMENTS.
ASSET-BACKED SECURITIES (1.55%)
PrincipalAmounts
CouponRate %
MaturityDates
ValueGBP
% ofFund
PrincipalAmounts
CouponRate %
MaturityDates
ValueGBP
% ofFund
COLLATERALISED MORTGAGE OBLIGATIONS (Continued)
PrincipalAmounts
CouponRate %
MaturityDates
ValueGBP
% ofFund

36
2,353,116 Federal Home Loan Mortgage Corporation 3.78 15/02/2038 £94,693 0.02
3,600,547 Federal Home Loan Mortgage Corporation 3.93 15/10/2037 139,271 0.03
788,602 Federal Home Loan Mortgage Corporation 3.94 15/05/2037 37,215 0.01
1,121,793 Federal Home Loan Mortgage Corporation 3.98 15/09/2037 46,941 0.01
608,834 Federal Home Loan Mortgage Corporation 4.02 15/11/2036 25,900 0.01
1,186,383 Federal Home Loan Mortgage Corporation 4.10 15/05/2036 52,247 0.01
1,056,243 Federal Home Loan Mortgage Corporation 4.18 15/09/2035 46,166 0.01
2,534,302 Federal Home Loan Mortgage Corporation 4.20 15/10/2037 97,298 0.02
79,664 Federal Home Loan Mortgage Corporation 4.26 15/10/2035 3,159 —
2,470,852 Federal Home Loan Mortgage Corporation 4.28 15/05/2035 89,360 0.02
4,930,398 Federal Home Loan Mortgage Corporation 4.73 15/08/2036 214,895 0.05
3,379,737 Federal Home Loan Mortgage Corporation 6.13 15/05/2037 213,014 0.05
49,085 Federal Home Loan Mortgage Corporation 7.00 25/07/2032 25,854 0.01
151,136 Federal Home Loan Mortgage Corporation 10.70 15/08/2035 75,243 0.02
266,451 Federal Home Loan Mortgage Corporation 11.58 15/10/2036 138,890 0.03
199,653 Federal Home Loan Mortgage Corporation 17.28 15/09/2036 39,989 0.01
367,999 Federal Home Loan Mortgage Corporation 18.14 15/09/2032 187,095 0.04
254,604 Federal Home Loan Mortgage Corporation 18.72 15/04/2032 139,741 0.03
173,913 Federal Home Loan Mortgage Corporation 20.74 15/05/2036 102,538 0.02
109,266 Federal Home Loan Mortgage Corporation 24.41 15/08/2036 68,085 0.01
79,427 Federal Home Loan Mortgage Corporation (Class KF) 0.00 15/11/2036 41,189 0.01
116,984 Federal Home Loan Mortgage Corporation (Class TP) 0.00 15/11/2036 51,651 0.01
61,315 Federal Home Loan Mortgage Corpration 4.18 15/09/2030 2,243 —
41,839 Federal National*Mortgage Association 0.00 25/08/2035 18,758 —
2,396,562 Federal National*Mortgage Association 4.27 25/10/2034 £114,679 0.03
13,939,555 Federal National*Mortgage Association 5.07 25/02/2038 877,831 0.19
82,040 Federal National*Mortgage Association 6.00 25/10/2022 6,464 —
605,005 Federal National*Mortgage Association 6.00 25/02/2038 67,305 0.01
77,969 Federal National*Mortgage Association 6.50 25/09/2022 6,155 —
120,645 Federal National*Mortgage Association 7.00 25/01/2038 11,624 —
138,687 Federal National*Mortgage Association 7.50 25/08/2037 13,553 —
101,670 Federal National*Mortgage Association 17.74 25/06/2037 54,872 0.01
41,877 Federal National*Mortgage Association 0.35 25/09/2042 250 —
39,739 Federal National*Mortgage Association 0.37 25/09/2042 218 —
300,371 Federal National*Mortgage Association 0.45 25/12/2041 1,817 —
39,147 Federal National*Mortgage Association 0.47 25/07/2042 272 —
28,650 Federal National*Mortgage Association 0.68 25/09/2042 284 —
53,814 Federal National*Mortgage Association 0.81 25/07/2042 729 —
73,528 Federal National*Mortgage Association 1.64 25/12/2042 1,918 —
34,246 Federal National*Mortgage Association 1.92 25/06/2043 942 —
25,256 Federal National*Mortgage Association 1.94 25/06/2043 707 —
39,204 Federal National*Mortgage Association 2.22 25/06/2043 1,242 —
254,814 Federal National*Mortgage Association 3.62 25/09/2035 7,770 —
6,228,591 Federal National*Mortgage Association 3.62 25/10/2025 197,332 0.04
4,606,550 Federal National*Mortgage Association 3.74 25/03/2038 165,466 0.04
304,210 Federal National*Mortgage Association 3.96 25/04/2037 12,778 —
2,468,792 Federal National*Mortgage Association 3.97 25/02/2038 97,686 0.02
2,491,729 Federal National*Mortgage Association 3.97 25/08/2036 111,669 0.02
9,991,369 Federal National* Mortgage Association 3.98 25/11/2037 384,486 0.08
2,042,408 Federal National*Mortgage Association 4.12 25/05/2035 80,500 0.02
8,739,366 Federal National*Mortgage Association 4.14 25/11/2036 411,084 0.09
749,838 Federal National*Mortgage Association 4.17 25/05/2034 35,858 0.01
2,492,500 Federal National*Mortgage Association 4.17 25/12/2036 111,100 0.02
701,918 Federal National*Mortgage Association 4.21 25/11/2036 30,794 0.01
1,160,612 Federal National*Mortgage Association 4.22 25/03/2037 53,540 0.01
1,792,464 Federal National*Mortgage Association 4.22 25/08/2034 75,181 0.02
2,794,430 Federal National*Mortgage Association 4.22 25/02/2035 110,925 0.02
Putnam Global Fixed Income Alpha Fund S1
THE ACCOMPANYING NOTES ARE AN INTEGRAL PART OF THESE FINANCIAL STATEMENTS.
COLLATERALISED MORTGAGE OBLIGATIONS (Continued)
PrincipalAmounts
CouponRate %
MaturityDates
ValueGBP
% ofFund
COLLATERALISED MORTGAGE OBLIGATIONS (Continued)
PrincipalAmounts
CouponRate %
MaturityDates
ValueGBP
% ofFund
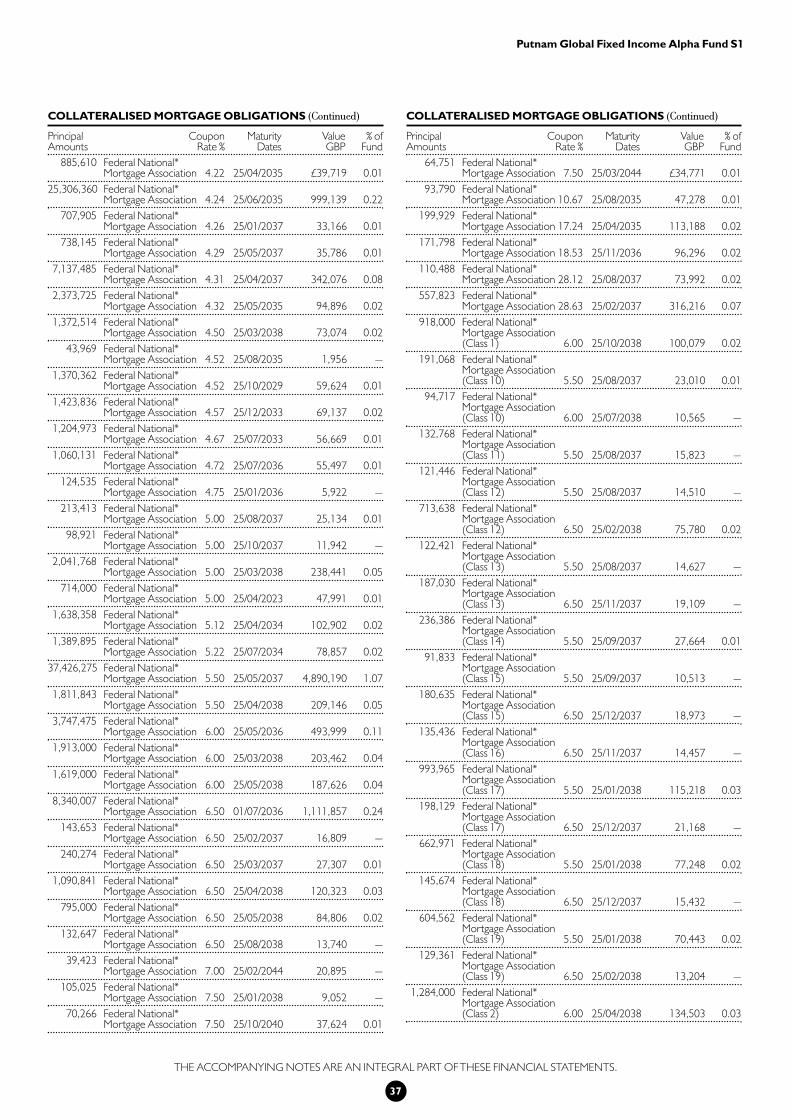
37
885,610 Federal National* Mortgage Association 4.22 25/04/2035 £39,719 0.01
25,306,360 Federal National* Mortgage Association 4.24 25/06/2035 999,139 0.22
707,905 Federal National* Mortgage Association 4.26 25/01/2037 33,166 0.01
738,145 Federal National* Mortgage Association 4.29 25/05/2037 35,786 0.01
7,137,485 Federal National* Mortgage Association 4.31 25/04/2037 342,076 0.08
2,373,725 Federal National* Mortgage Association 4.32 25/05/2035 94,896 0.02
1,372,514 Federal National* Mortgage Association 4.50 25/03/2038 73,074 0.02
43,969 Federal National* Mortgage Association 4.52 25/08/2035 1,956 —
1,370,362 Federal National* Mortgage Association 4.52 25/10/2029 59,624 0.01
1,423,836 Federal National* Mortgage Association 4.57 25/12/2033 69,137 0.02
1,204,973 Federal National* Mortgage Association 4.67 25/07/2033 56,669 0.01
1,060,131 Federal National* Mortgage Association 4.72 25/07/2036 55,497 0.01
124,535 Federal National* Mortgage Association 4.75 25/01/2036 5,922 —
213,413 Federal National* Mortgage Association 5.00 25/08/2037 25,134 0.01
98,921 Federal National* Mortgage Association 5.00 25/10/2037 11,942 —
2,041,768 Federal National* Mortgage Association 5.00 25/03/2038 238,441 0.05
714,000 Federal National* Mortgage Association 5.00 25/04/2023 47,991 0.01
1,638,358 Federal National* Mortgage Association 5.12 25/04/2034 102,902 0.02
1,389,895 Federal National* Mortgage Association 5.22 25/07/2034 78,857 0.02
37,426,275 Federal National* Mortgage Association 5.50 25/05/2037 4,890,190 1.07
1,811,843 Federal National* Mortgage Association 5.50 25/04/2038 209,146 0.05
3,747,475 Federal National* Mortgage Association 6.00 25/05/2036 493,999 0.11
1,913,000 Federal National* Mortgage Association 6.00 25/03/2038 203,462 0.04
1,619,000 Federal National* Mortgage Association 6.00 25/05/2038 187,626 0.04
8,340,007 Federal National* Mortgage Association 6.50 01/07/2036 1,111,857 0.24
143,653 Federal National* Mortgage Association 6.50 25/02/2037 16,809 —
240,274 Federal National* Mortgage Association 6.50 25/03/2037 27,307 0.01
1,090,841 Federal National* Mortgage Association 6.50 25/04/2038 120,323 0.03
795,000 Federal National* Mortgage Association 6.50 25/05/2038 84,806 0.02
132,647 Federal National* Mortgage Association 6.50 25/08/2038 13,740 —
39,423 Federal National* Mortgage Association 7.00 25/02/2044 20,895 —
105,025 Federal National* Mortgage Association 7.50 25/01/2038 9,052 —
70,266 Federal National* Mortgage Association 7.50 25/10/2040 37,624 0.01
64,751 Federal National* Mortgage Association 7.50 25/03/2044 £34,771 0.01
93,790 Federal National* Mortgage Association 10.67 25/08/2035 47,278 0.01
199,929 Federal National* Mortgage Association 17.24 25/04/2035 113,188 0.02
171,798 Federal National* Mortgage Association 18.53 25/11/2036 96,296 0.02
110,488 Federal National* Mortgage Association 28.12 25/08/2037 73,992 0.02
557,823 Federal National* Mortgage Association 28.63 25/02/2037 316,216 0.07
918,000 Federal National* Mortgage Association (Class 1) 6.00 25/10/2038 100,079 0.02
191,068 Federal National* Mortgage Association (Class 10) 5.50 25/08/2037 23,010 0.01
94,717 Federal National* Mortgage Association (Class 10) 6.00 25/07/2038 10,565 —
132,768 Federal National* Mortgage Association (Class 11) 5.50 25/08/2037 15,823 —
121,446 Federal National* Mortgage Association (Class 12) 5.50 25/08/2037 14,510 —
713,638 Federal National* Mortgage Association (Class 12) 6.50 25/02/2038 75,780 0.02
122,421 Federal National* Mortgage Association (Class 13) 5.50 25/08/2037 14,627 —
187,030 Federal National* Mortgage Association (Class 13) 6.50 25/11/2037 19,109 —
236,386 Federal National* Mortgage Association (Class 14) 5.50 25/09/2037 27,664 0.01
91,833 Federal National* Mortgage Association (Class 15) 5.50 25/09/2037 10,513 —
180,635 Federal National* Mortgage Association (Class 15) 6.50 25/12/2037 18,973 —
135,436 Federal National* Mortgage Association (Class 16) 6.50 25/11/2037 14,457 —
993,965 Federal National* Mortgage Association (Class 17) 5.50 25/01/2038 115,218 0.03
198,129 Federal National* Mortgage Association (Class 17) 6.50 25/12/2037 21,168 —
662,971 Federal National* Mortgage Association (Class 18) 5.50 25/01/2038 77,248 0.02
145,674 Federal National* Mortgage Association (Class 18) 6.50 25/12/2037 15,432 —
604,562 Federal National* Mortgage Association (Class 19) 5.50 25/01/2038 70,443 0.02
129,361 Federal National* Mortgage Association (Class 19) 6.50 25/02/2038 13,204 —
1,284,000 Federal National* Mortgage Association (Class 2) 6.00 25/04/2038 134,503 0.03
Putnam Global Fixed Income Alpha Fund S1
THE ACCOMPANYING NOTES ARE AN INTEGRAL PART OF THESE FINANCIAL STATEMENTS.
COLLATERALISED MORTGAGE OBLIGATIONS (Continued)
PrincipalAmounts
CouponRate %
MaturityDates
ValueGBP
% ofFund
COLLATERALISED MORTGAGE OBLIGATIONS (Continued)
PrincipalAmounts
CouponRate %
MaturityDates
ValueGBP
% ofFund

38
373,316 Federal National* Mortgage Association (Class 20) 5.50 25/07/2037 £44,394 0.01
353,677 Federal National* Mortgage Association (Class 21) 5.50 25/07/2037 42,059 0.01
136,455 Federal National* Mortgage Association (Class 21) 7.00 25/12/2037 13,427 —
239,119 Federal National* Mortgage Association (Class 22) 5.50 25/07/2037 28,364 0.01
215,630 Federal National* Mortgage Association (Class 23) 5.50 25/07/2037 25,578 0.01
133,054 Federal National* Mortgage Association (Class 23) 7.00 25/12/2037 12,485 —
151,518 Federal National* Mortgage Association (Class 24) 5.50 25/07/2037 17,374 —
90,284 Federal National* Mortgage Association (Class 24) 7.00 25/03/2038 8,413 —
103,508 Federal National* Mortgage Association (Class 25) 5.50 25/01/2038 11,621 —
93,229 Federal National* Mortgage Association (Class 25) 7.00 25/03/2038 8,748 —
111,265 Federal National* Mortgage Association (Class 26) 5.50 25/07/2037 13,265 —
82,049 Federal National* Mortgage Association (Class 27) 7.50 25/12/2037 7,072 —
1,264,497 Federal National* Mortgage Association (Class 28) 6.00 25/01/2038 147,324 0.03
84,672 Federal National* Mortgage Association (Class 28) 7.50 25/12/2037 7,298 —
1,137,444 Federal National* Mortgage Association (Class 29) 6.00 25/01/2038 132,864 0.03
1,046,394 Federal National* Mortgage Association (Class 3) 5.50 25/09/2037 120,362 0.03
365,989 Federal National* Mortgage Association (Class 3) 5.50 25/12/2037 41,879 0.01
838,825 Federal National* Mortgage Association (Class 30) 6.00 25/01/2038 98,697 0.02
740,443 Federal National* Mortgage Association (Class 31) 6.00 25/01/2038 87,121 0.02
574,321 Federal National* Mortgage Association (Class 32) 6.00 25/01/2038 68,122 0.01
491,203 Federal National* Mortgage Association (Class 33) 6.00 25/01/2038 58,263 0.01
198,604 Federal National* Mortgage Association (Class 34) 6.00 25/12/2037 23,069 0.01
164,479 Federal National* Mortgage Association (Class 35) 6.00 25/12/2037 19,056 —
129,445 Federal National* Mortgage Association (Class 36) 6.00 25/12/2037 15,068 —
190,428 Federal National* Mortgage Association (Class 37) 6.00 25/01/2038 £22,759 —
89,585 Federal National* Mortgage Association (Class 38) 6.00 25/12/2037 10,383 —
924,348 Federal National* Mortgage Association (Class 4) 5.50 25/09/2037 106,970 0.02
148,957 Federal National* Mortgage Association (Class 4) 5.50 25/12/2037 17,350 —
1,208,330 Federal National* Mortgage Association (Class 40) 6.00 25/04/2038 139,320 0.03
1,060,587 Federal National* Mortgage Association (Class 41) 6.00 25/04/2038 122,179 0.03
767,305 Federal National* Mortgage Association (Class 42) 6.00 25/04/2038 88,855 0.02
692,787 Federal National* Mortgage Association (Class 43) 6.00 25/04/2038 80,469 0.02
633,330 Federal National* Mortgage Association (Class 44) 6.00 25/04/2038 73,340 0.02
487,257 Federal National* Mortgage Association (Class 45) 6.00 25/04/2038 57,133 0.01
423,792 Federal National* Mortgage Association (Class 46) 6.00 25/04/2038 49,670 0.01
375,477 Federal National* Mortgage Association (Class 47) 6.00 25/04/2038 44,008 0.01
336,594 Federal National* Mortgage Association (Class 48) 6.00 25/04/2038 39,569 0.01
173,685 Federal National* Mortgage Association (Class 49) 6.00 25/06/2037 20,026 —
586,987 Federal National* Mortgage Association (Class 5) 5.50 25/09/2037 67,929 0.01
96,324 Federal National* Mortgage Association (Class 5) 5.50 25/12/2037 11,398 —
1,911,000 Federal National* Mortgage Association (Class 5) 6.00 25/04/2038 212,752 0.05
230,241 Federal National* Mortgage Association (Class 50) 6.00 25/12/2037 26,339 0.01
179,618 Federal National* Mortgage Association (Class 51) 6.00 25/06/2037 20,548 —
136,889 Federal National* Mortgage Association (Class 52) 6.00 25/04/2038 16,092 —
88,094 Federal National* Mortgage Association (Class 53) 6.00 25/06/2037 10,179 —
109,715 Federal National* Mortgage Association (Class 57) 6.00 25/06/2037 12,705 —
295,007 Federal National* Mortgage Association (Class 58) 6.50 25/08/2037 33,336 0.01
184,101 Federal National* Mortgage Association (Class 59) 6.50 25/08/2037 20,444 —
Putnam Global Fixed Income Alpha Fund S1
THE ACCOMPANYING NOTES ARE AN INTEGRAL PART OF THESE FINANCIAL STATEMENTS.
COLLATERALISED MORTGAGE OBLIGATIONS (Continued)
PrincipalAmounts
CouponRate %
MaturityDates
ValueGBP
% ofFund
COLLATERALISED MORTGAGE OBLIGATIONS (Continued)
PrincipalAmounts
CouponRate %
MaturityDates
ValueGBP
% ofFund

39
528,059 Federal National* Mortgage Association (Class 6) 5.50 25/09/2037 £61,295 0.01
355,951 Federal National* Mortgage Association (Class 6) 6.00 25/12/2037 41,079 0.01
1,031,000 Federal National* Mortgage Association (Class 6) 6.00 25/10/2038 98,192 0.02
630,179 Federal National* Mortgage Association (Class 60) 6.50 25/10/2037 73,078 0.02
147,006 Federal National* Mortgage Association (Class 61) 6.50 25/08/2037 16,383 —
173,794 Federal National* Mortgage Association (Class 62) 6.50 25/10/2037 19,770 —
136,336 Federal National* Mortgage Association (Class 63) 6.50 25/09/2037 15,153 —
253,161 Federal National* Mortgage Association (Class 64) 6.50 25/09/2037 29,027 0.01
173,838 Federal National* Mortgage Association (Class 65) 6.50 25/08/2037 20,106 —
177,418 Federal National* Mortgage Association (Class 66) 6.50 25/08/2037 20,459 0.01
133,204 Federal National* Mortgage Association (Class 67) 6.50 25/09/2037 15,099 —
91,692 Federal National* Mortgage Association (Class 68) 6.50 25/09/2037 10,426 —
99,485 Federal National* Mortgage Association (Class 69) 6.50 25/10/2037 11,317 —
519,908 Federal National* Mortgage Association (Class 7) 5.50 25/09/2037 60,167 0.01
738,541 Federal National* Mortgage Association (Class 7) 6.00 25/01/2038 89,453 0.02
371,516 Federal National* Mortgage Association (Class 70) 6.50 25/01/2037 42,260 0.01
157,331 Federal National* Mortgage Association (Class 71) 6.50 25/12/2036 17,754 —
705,446 Federal National* Mortgage Association (Class 72) 6.50 25/05/2037 82,086 0.02
198,378 Federal National* Mortgage Association (Class 74) 6.50 25/01/2037 22,496 0.01
125,630 Federal National* Mortgage Association (Class 75) 6.50 25/12/2036 14,530 —
105,962 Federal National* Mortgage Association (Class 77) 6.50 25/05/2037 12,122 —
108,099 Federal National* Mortgage Association (Class 78) 6.50 25/05/2037 12,334 —
128,219 Federal National* Mortgage Association (Class 79) 7.00 25/08/2037 13,992 —
210,188 Federal National* Mortgage Association (Class 8) 5.50 25/08/2037 25,313 0.01
843,608 Federal National* Mortgage Association (Class 8) 6.00 25/07/2038 £90,507 0.02
278,225 Federal National* Mortgage Association (Class 80) 7.00 25/08/2037 30,920 0.01
154,169 Federal National* Mortgage Association (Class 81) 7.00 25/08/2037 16,144 —
152,139 Federal National* Mortgage Association (Class 82) 7.00 25/08/2037 15,572 —
127,088 Federal National* Mortgage Association (Class 83) 7.00 25/08/2037 13,391 —
125,139 Federal National* Mortgage Association (Class 84) 7.00 25/09/2037 13,311 —
87,742 Federal National* Mortgage Association (Class 85) 7.00 25/09/2037 9,214 —
84,369 Federal National* Mortgage Association (Class 86) 7.00 25/09/2037 8,860 —
111,145 Federal National* Mortgage Association (Class 88) 7.50 25/09/2037 10,482 —
87,103 Federal National* Mortgage Association (Class 89) 7.50 25/09/2037 8,250 —
200,621 Federal National* Mortgage Association (Class 9) 5.50 25/08/2037 24,160 0.01
132,145 Federal National* Mortgage Association (Class 92) 5.00 25/10/2022 10,461 —
88,398 Federal National* Mortgage Association (Class 93) 5.00 25/10/2022 7,125 —
152,419 Federal National* Mortgage Association (Class 94) 5.50 25/08/2022 12,470 —
303,941 Federal National* Mortgage Association (Class 95) 5.50 25/09/2022 25,288 0.01
166,867 Federal National* Mortgage Association (Class 96) 5.50 25/08/2022 13,019 —
128,899 Federal National* Mortgage Association (Class 97) 5.50 25/09/2022 10,327 —
194,559 Federal National* Mortgage Association (Class 98) 6.00 25/09/2022 15,749 —
85,949 Federal National* Mortgage Association (Class 99) 6.00 25/09/2022 6,759 —
10,000,000 GE Capital Commercial Mortgage Corporation 5.52 10/03/2044 4,937,022 1.08
47,000 GE Capital Commercial Mortgage Corporation 5.42 10/12/2049 22,926 0.01
3,224,940 Government National Mortgage Association 3.52 20/03/2034 65,831 0.01
3,230,152 Government National Mortgage Association 3.62 20/01/2035 102,489 0.02
1,378,490 Government National Mortgage Association 3.68 16/10/2037 42,576 0.01
Putnam Global Fixed Income Alpha Fund S1
THE ACCOMPANYING NOTES ARE AN INTEGRAL PART OF THESE FINANCIAL STATEMENTS.
COLLATERALISED MORTGAGE OBLIGATIONS (Continued)
PrincipalAmounts
CouponRate %
MaturityDates
ValueGBP
% ofFund
COLLATERALISED MORTGAGE OBLIGATIONS (Continued)
PrincipalAmounts
CouponRate %
MaturityDates
ValueGBP
% ofFund

40
1,136,474 Government National Mortgage Association 3.70 20/02/2035 £40,271 0.01
403,008 Government National Mortgage Association 3.73 16/05/2037 15,452 —
1,137,882 Government National Mortgage Association 3.77 20/01/2035 39,899 0.01
2,236,402 Government National Mortgage Association 3.81 20/03/2036 80,848 0.02
1,601,387 Government National Mortgage Association 3.82 20/09/2035 61,543 0.01
2,682,556 Government National Mortgage Association 3.89 16/09/2035 96,379 0.02
3,791,067 Government National Mortgage Association 3.92 20/01/2032 110,182 0.02
7,881,692 Government National Mortgage Association 3.93 16/05/2038 284,495 0.06
1,685,181 Government National Mortgage Association 3.98 20/02/2036 57,376 0.01
8,677,730 Government National Mortgage Association 3.99 20/06/2037 312,393 0.07
1,989,614 Government National Mortgage Association 4.00 20/02/2038 79,648 0.02
1,375,154 Government National Mortgage Association 4.02 20/01/2037 49,157 0.01
2,944,893 Government National Mortgage Association 4.03 16/01/2038 106,082 0.02
3,909,220 Government National Mortgage Association 4.04 20/03/2037 147,885 0.03
17,105,304 Government National Mortgage Association 4.05 16/01/2038 621,496 0.14
1,219,567 Government National Mortgage Association 4.10 16/05/2037 45,125 0.01
22,165,337 Government National Mortgage Association 4.21 20/06/2037 900,627 0.20
1,003,527 Government National Mortgage Association 4.22 20/04/2032 30,680 0.01
1,284,198 Government National Mortgage Association 4.23 16/03/2034 58,158 0.01
1,785,447 Government National Mortgage Association 4.25 20/09/2037 83,248 0.02
1,474,000 Government National Mortgage Association 4.43 16/10/2035 58,898 0.01
899,434 Government National Mortgage Association 4.63 16/08/2036 44,554 0.01
879,114 Government National Mortgage Association 4.73 16/04/2034 28,344 0.01
1,032,149 Government National Mortgage Association 4.78 16/08/2034 50,208 0.01
618,537 Government National Mortgage Association 4.82 20/06/2032 £31,585 0.01
4,414,031 Government National Mortgage Association 5.30 20/03/2038 210,554 0.05
361,897 Government National Mortgage Association 7.50 16/04/2037 45,584 0.01
166,966 Government National Mortgage Association 23.47 20/03/2036 102,791 0.02
87,943 Government National Mortgage Association 24.59 20/08/2037 51,700 0.01
101,509 Government National Mortgage Association 7.92 20/07/2037 60,650 0.01
101,509 Government National Mortgage Association 7.68 16/07/2037 61,020 0.01
118,711 Government National Mortgage Association 25.19 20/07/2037 71,694 0.02
261,068 Government National Mortgage Association 25.31 20/07/2037 160,795 0.04
125,031 Government National Mortgage Association 31.91 16/06/2037 83,686 0.02
169,537 Government National Mortgage Association 44.62 20/05/2037 133,474 0.03
826,643 Government National Mortgage Association 0.00 20/06/2037 369,795 0.08
798,500 Government National Mortgage Association 0.00 20/02/2037 358,485 0.08
6,380,727 Government National Mortgage Association 4.02 20/06/2036 252,762 0.06
9,144,988 Government National Mortgage Association 4.27 20/12/2034 400,564 0.09
1,439,266 Government National Mortgage Association 4.27 20/07/2037 53,559 0.01
3,697,134 Government National Mortgage Association 4.32 20/03/2037 151,895 0.03
1,417,066 Government National Mortgage Association 4.32 20/12/2036 58,745 0.01
2,053,373 Government National Mortgage Association 4.32 20/11/2035 85,433 0.02
735,680 Government National Mortgage Association 4.90 20/12/2036 36,369 0.01
1,429,889 Government National Mortgage Association 4.90 20/11/2036 55,712 0.01
17,913,825 Government National Mortgage Association (Class S) 4.02 20/05/2037 647,098 0.14
5,135,457 Government National Mortgage Association (Class SA) 4.86 20/11/2036 219,728 0.05
5,109,220 Government National Mortgage Association (Class SB) 4.86 20/11/2036 235,731 0.05
Putnam Global Fixed Income Alpha Fund S1
THE ACCOMPANYING NOTES ARE AN INTEGRAL PART OF THESE FINANCIAL STATEMENTS.
COLLATERALISED MORTGAGE OBLIGATIONS (Continued)
PrincipalAmounts
CouponRate %
MaturityDates
ValueGBP
% ofFund
COLLATERALISED MORTGAGE OBLIGATIONS (Continued)
PrincipalAmounts
CouponRate %
MaturityDates
ValueGBP
% ofFund

41
37,452,370 Government National Mortgage Association (Class SG) 3.99 20/06/2037 £1,338,792 0.29
15,758,901 Government National Mortgage Association (Class SG) 4.02 20/05/2037 634,605 0.14
58,601 Greenpoint Mortgage Funding Trust 4.04 25/06/2045 809 —
52,000 GS Mortgage Securities Corporation II 5.51 10/04/2038 26,037 0.01
22,466,000 Holmes Financing PLC 2.79 15/07/2040 10,973,760 2.41
3,476,557 HSI Asset Loan Obligation 6.14 25/01/2037 1,438,973 0.32
874,539 IndyMac Indx Mortgage Loan Trust 6.33 25/09/2036 350,131 0.08
2,953,262 IndyMac Indx Mortgage Loan Trust 6.08 25/04/2037 1,170,518 0.26
2,930,191 IndyMac Indx Mortgage Loan Trust 6.25 25/08/2037 1,161,374 0.26
2,355,934 IndyMac Indx Mortgage Loan Trust 5.65 25/06/2037 792,567 0.17
3,589,222 IndyMac MBS Incorporated 5.64 25/01/2036 1,350,839 0.30
2,454,589 IndyMac MBS Incorporated 5.46 25/05/2035 1,047,252 0.23
1,259,733 JPMorgan Alternative Loan Trust 6.07 25/07/2036 486,715 0.11
2,075,619 JPMorgan Alternative Loan Trust 5.89 25/03/2036 833,080 0.18
1,409,534 JPMorgan Alternative Loan Trust 2.55 25/11/2036 517,762 0.11
18,000,000 JPMorgan Chase Commercial Mortgage Securities Corporation 6.01 15/06/2049 8,710,470 1.91
103,386,044 JPMorgan Chase Commercial Mortgage Securities Corporation 0.65 12/02/2051 1,414,251 0.31
23,000 LB-UBS Commercial Mortgage Trust 5.85 12/07/2012 11,440 —
100,875,022 LB-UBS Commercial Mortgage Trust 0.18 15/04/2040 443,031 0.10
1,828,959 MASTR Alternative Loans Trust 6.25 25/07/2036 688,199 0.15
94,000 Merrill Lynch Countrywide Commercial Mortgage Trust 6.16 12/08/2049 45,516 0.01
3,464,372 Merrill Lynch Mortgage Trust 5.71 12/02/2051 1,690,960 0.37
2,726,678 Merrill Lynch Mortgage Trust 5.43 12/02/2051 1,332,338 0.29
40,965,000 Merrill Lynch Mortgage Trust 5.71 12/02/2051 583,313 0.13
4,352,000 Morgan StanleyCapital I Trust 5.62 12/12/2049 2,137,135 0.47
15,000,000 Morgan Stanley Capital I Trust 5.61 12/03/2044 7,457,556 1.64
3,624,000 Permanent Master Issuer PLC 2.79 15/10/2033 1,750,000 0.38
2,850,985 Residential Asset Securitization Trust 6.00 25/05/2037 1,280,169 0.28
1,009,077 Structured Adjustable Rate Mortgage Loan Trust 5.69 25/10/2036 397,566 0.09
5,976,943 Structured Asset Securities Corporation 3.59 28/03/2045 176,670 0.04
20,720,318 Structured Asset Securities Corporation 2.95 25/11/2037 564,222 0.12
10,600,000 Wachovia Bank Commercial Mortgage Trust 6.10 15/02/2051 £5,163,485 1.13
17,140,000 Wachovia Bank Commercial Mortgage Trust 5.25 15/12/2043 8,396,506 1.84
7,012,564 WAMU Mortgage Pass-Through Certificates Trust 3.20 25/05/2034 219,890 0.05
Total Collateralised Mortgage Obligations £132,006,945 28.86
CORPORATE BONDS & NOTES (23.30%)
470,000 Allstate Life Global Funding Trusts 5.38 30/04/2013 £234,877 0.05
3,980,000 AmerisourceBergen Corporation 5.63 15/09/2012 1,984,760 0.44
2,660,000 Arrow Electronics, Incorporated 9.15 01/10/2010 1,436,150 0.32
1,405,000 AT&T Incorporated 5.60 15/05/2018 688,639 0.15
1,700,000 Banco Nacional de Desenvolvimento 6.37 16/06/2018 848,635 0.19
560,000 BankAmerica Capital III 3.28 15/01/2027 221,989 0.05
600,000 Barclays Bank PLC 7.70 29/04/2049 303,557 0.07
985,000 Berry Plastics Corporation 7.57 15/02/2015 473,178 0.10
1,910,000 Best Buy Co.Incorporated 6.75 15/07/2013 964,654 0.21
2,140,000 Block Financial Corporation 5.13 30/10/2014 986,139 0.22
205,000 Capital One Financial Corporation 2.98 10/09/2009 95,999 0.02
930,000 Cardinal Health Incorporated 5.65 15/06/2012 470,390 0.10
3,880,000 Cardinal Health Incorporated 5.50 15/06/2013 1,937,331 0.43
670,000 CCH II LLC Capital Corporation 10.25 15/09/2010 324,378 0.07
255,000 Centennial Communications Corporation 10.00 01/01/2013 129,854 0.03
900,000 Centennial Communications Corporation 8.45 01/01/2013 435,731 0.10
1,350,000 CenturyTel Incorporated 5.50 01/04/2013 638,467 0.14
971,000 Ceva Group PLC 8.50 01/12/2014 549,715 0.12
6,015,000 CNA Financial Corporation 6.50 15/08/2016 2,908,747 0.64
390,000 CNA Financial Corporation 6.00 15/08/2011 196,520 0.04
2,260,000 Computer Sciences Corporation 6.50 15/03/2018 1,139,346 0.25
1,385,000 Countrywide Financial Corporation 2.87 05/01/2009 681,268 0.15
4,480,000 Cox Communications Incorporated 4.63 15/01/2010 2,235,239 0.49
1,027,000 Cricket Communications Incorporated 10.00 15/07/2015 504,947 0.11
260,000 D.R. Horton Incorporated company 8.00 01/02/2009 130,117 0.03
383,000 D.R. Horton Incorporated company 5.00 15/01/2009 188,551 0.04
Putnam Global Fixed Income Alpha Fund S1
THE ACCOMPANYING NOTES ARE AN INTEGRAL PART OF THESE FINANCIAL STATEMENTS.
COLLATERALISED MORTGAGE OBLIGATIONS (Continued)
PrincipalAmounts
CouponRate %
MaturityDates
ValueGBP
% ofFund
COLLATERALISED MORTGAGE OBLIGATIONS (Continued)
PrincipalAmounts
CouponRate %
MaturityDates
ValueGBP
% ofFund
PrincipalAmounts
CouponRate %
MaturityDates
ValueGBP
% ofFund

42
2,815,000 Darden Restaurants, Incorporated 6.20 15/10/2017 £1,310,469 0.29
3,365,000 Electronic Data Systems Corporation 6.50 01/08/2013 1,732,044 0.38
1,800,000 Embarq Corporation 7.08 01/06/2016 857,695 0.19
4,545,000 Embarq Corporation 6.74 01/06/2013 2,200,177 0.48
1,235,000 Federated Department Stores Incorporated 6.63 01/04/2011 611,306 0.13
3,010,000 FelCor Lodging LP company 8.50 01/01/2011 1,476,156 0.32
745,000 Fleet Capital Trust V 3.76 18/12/2028 307,244 0.07
660,000 Freeport-McMoRan Copper & Gold Incorporated 8.38 01/04/2017 350,166 0.08
2,540,000 Freeport-McMoRan Copper & Gold Incorporated 5.88 01/04/2015 1,274,634 0.28
103,000 Gaz Capital SA 7.34 11/04/2013 53,264 0.01
223,000 Gaz Capital SA 8.15 11/04/2018 117,051 0.03
314,000 Gaz Capital SA 6.51 07/03/2022 141,388 0.03
150,000 Genworth Life Institutional Funding Trust 5.88 03/05/2013 75,047 0.02
1,620,000 Georgia (Republic of ) 7.50 15/04/2013 808,870 0.18
1,925,000 Grupo Televisa SA 6.00 15/05/2018 938,713 0.21
4,530,000 Hanson PLC 6.13 15/08/2016 2,254,948 0.50
1,465,000 Hawker Beechcraft Acquisition Co. LLC 9.75 01/04/2017 734,999 0.16
376,000 Hawker Beechcraft Acquisition Co. LLC 8.50 01/04/2015 190,056 0.04
1,065,000 Hexion U.S. Finance Corporation 7.18 15/11/2014 443,483 0.10
1,187,000 Huntsman International LLC 7.88 15/11/2014 544,905 0.12
5,170,000 International Lease Finance Corporation 5.63 20/09/2013 2,295,548 0.50
1,540,000 International Lease Finance Corporation 6.63 15/11/2013 713,360 0.16
200,000 International Paper Co. 7.40 15/06/2014 100,376 0.02
655,000 International Paper Co. 7.95 15/06/2018 326,788 0.07
42,000,000 JPMorgan Chase & Co. 0.27 20/06/2011 903,552 0.20
565,000 Lehman Brothers*Holdings, Incorporated 5.75 03/01/2017 250,148 0.05
4,690,000 Lexmark International Incorprated 5.90 01/06/2013 2,316,439 0.51
2,810,000 Liberty Media LLC 7.88 15/07/2009 1,423,513 0.31
1,070,000 Liberty Mutual Group 10.75 15/06/2058 523,618 0.11
5,935,000 Limited Brands Incorporated 6.13 01/12/2012 2,842,081 0.62
5,305,000 Marriott International Incorporated 4.63 15/06/2012 2,467,139 0.54
4,470,000 Masco Corporation 5.85 15/03/2017 2,032,695 0.45
319,000 Meritor Automotive Incorporated 6.80 15/02/2009 157,443 0.03
5,165,000 Merrill Lynch & Co. Incorporated 6.88 25/04/2018 2,462,517 0.54
1,000,000 MetLife Capital Trust 9.25 08/04/2068 567,048 0.12
710,000 Momentive Performance Materials Incorporated 9.75 01/12/2014 304,561 0.07
3,775,000 Newell Rubbermaid, Incorporated 5.50 15/04/2013 £1,863,269 0.41
5,620,000 Nextel Communications Incorporated 6.88 31/10/2013 2,382,551 0.52
1,800,000 ONEOK Partners LP 6.15 01/10/2016 889,917 0.20
1,230,000 Ono Finance II PLC 10.50 15/05/2014 696,829 0.15
7,235,000 Owens-Illinois Incorporated 7.50 15/05/2010 3,693,364 0.81
7,365,000 Packaging Corporation of America 5.75 01/08/2013 3,610,136 0.79
4,640,000 Pearson Dollar Finance Two PLC 6.25 06/05/2018 2,297,343 0.50
900,000 Pemex Project Funding Master Trust 6.63 15/06/2038 443,633 0.10
2,615,000 Pitney Bowes Incorporated 5.60 15/03/2018 1,289,698 0.28
3,895,000 PPG Industries Incorporated 6.65 15/03/2018 1,985,897 0.44
1,240,000 Prudential Financial Incorporated 8.88 15/06/2038 615,798 0.14
2,795,000 Qwest Corporation 6.03 15/06/2013 1,339,166 0.29
3,370,000 R. R. Donnelley & Sons Co. 5.63 15/01/2012 1,655,887 0.36
1,050,000 Rexam PLC 6.75 01/06/2013 524,805 0.12
350,000 Rhodia SA 7.50 15/10/2013 246,266 0.05
750,000 RSHB Capital SA for OJSC Russian Agricultural Bank 6.97 21/09/2016 363,290 0.08
630,000 Russian Agricultural Bank 7.75 29/05/2018 309,753 0.07
625,000 Russian Agricultural Bank 7.13 14/01/2014 309,239 0.07
511,000 Ryerson Tull Incorporated 12.00 01/11/2015 254,449 0.06
1,270,000 Sara Lee Corporation 3.88 15/06/2013 589,228 0.13
620,000 SLM Corporation 4.50 26/07/2010 287,824 0.06
1,265,000 Sovereign Bank 8.75 30/05/2018 639,741 0.14
340,000 State Street Capital Trust IV 3.78 15/06/2037 130,961 0.03
202,000 Steel Dynamics Incorporated 7.75 15/04/2016 100,838 0.02
25,000 Steel Dynamics Incorporated 6.75 01/04/2015 12,010 —
5,523,000 Supervalu Incorporated 7.88 01/08/2009 2,812,485 0.62
4,820,000 Telecom Italia Capital SA 3.34 18/07/2011 2,304,401 0.51
275,000 Tenet Healthcare Corporation 6.38 01/12/2011 132,106 0.03
163,000 THL Buildco, Incorporated 10.00 01/12/2013 78,098 0.02
1,090,000 Toll Brothers Incorporated 8.25 01/02/2011 530,454 0.12
4,215,000 Tyco Electronics Group SA 6.55 01/10/2017 2,133,654 0.47
5,630,000 Tyson Foods, Incorporated 8.25 01/10/2011 2,840,998 0.62
45,000 United Rentals NA Incorporated 6.50 15/02/2012 20,319 —
4,420,000 United States Steel Corporation 7.00 01/02/2018 2,212,663 0.49
470,000 United Technologies Corporation 6.13 15/07/2038 235,941 0.05
2,775,000 Viacom Incorporated 5.63 15/08/2012 1,381,330 0.30
Putnam Global Fixed Income Alpha Fund S1
THE ACCOMPANYING NOTES ARE AN INTEGRAL PART OF THESE FINANCIAL STATEMENTS.
CORPORATE BONDS & NOTES (Continued)
PrincipalAmounts
CouponRate %
MaturityDates
ValueGBP
% ofFund
CORPORATE BONDS & NOTES (Continued)
PrincipalAmounts
CouponRate %
MaturityDates
ValueGBP
% ofFund

43
3,401,000 Viacom, Incorporated 6.63 15/05/2011 £1,747,246 0.38
2,750,000 VTB Capital SA 6.32 04/02/2015 1,365,342 0.30
4,640,000 VTB Capital SA 6.88 29/05/2018 2,269,717 0.50
1,380,000 VTB Capital SA 6.61 31/10/2012 676,146 0.15
337,000 Wells Fargo & Co. 7.70 29/12/2049 168,068 0.04
3,740,000 Yum! Brands Incorporated 6.25 15/03/2018 1,829,648 0.40
Total Corporate Bonds & Notes £106,089,127 23.30
FOREIGN GOVERNMENT BONDS & NOTES (0.71%)
441,000 Republic of Argentina 7.00 12/09/2013 £170,918 0.04
1,249,000 Republic of Argentina 7.00 03/10/2015 437,858 0.10
1,421,875 Republic of Argentina 3.09 03/08/2012 600,458 0.13
78,000 Federal Republic of Brazil 10.00 01/01/2012 225,478 0.05
330,000 Federal Republic of Brazil 6.00 17/01/2017 168,874 0.04
560,000 Republic of Indonesia 6.75 10/03/2014 281,306 0.06
1,045,000 Republic of Indonesia 7.75 17/01/2038 492,826 0.11
995,000 Republic of Venezuela 3.91 20/04/2011 449,278 0.10
795,000 Republic of Venezuela 5.38 07/08/2010 377,418 0.08
Total Foreign Government Bonds & Notes £3,204,414 0.71
MUTUAL FUNDS (1.08%)
9,800,000 U.S. Liquid Assets Fund 20.06 31/12/2049 £4,916,717 1.08
Total Mutual Funds £4,916,717 1.08
SHORT-TERM INVESTMENTS (34.03%)
30,000,000 Atlantic Asset Securitization Corporation 0.00 08/07/2008 £15,043,272 3.30
30,000,000 Gemini Securitization Corporation II 0.00 03/07/2008 15,049,025 3.30
39,300,000 Old Line Funding Corporation 0.00 05/08/2008 19,665,089 4.32
40,000,000 Sheffield Receivables 0.00 14/07/2008 20,049,607 4.40
30,000,000 Three Pillars Funding Corporation 0.00 10/07/2008 15,041,164 3.30
30,000,000 Thunder Bay Funding Incorporated 0.00 11/07/2008 15,040,303 3.30
40,000,000 Tulip Funding Corporation 0.00 07/07/2008 20,059,201 4.41
30,000,000 Victory Receivables Corporation 0.00 02/07/2008 15,049,898 3.30
40,000,000 Windmill Funding Corporation 0.00 11/07/2008 20,053,741 4.40
Total Short-Term Investments £155,051,300 34.03
59,000,000 Federal National*Mortgage Association (TBA) 5.50 01/08/2038 £29,095,350 6.39
313,000,000 Federal National*Mortgage Association (TBA) 5.50 01/07/2035 154,727,480 33.97
52,000,000 Federal National*Mortgage Association (TBA) 5.00 01/08/2038 24,943,246 5.48
137,000,000 Federal National*Mortgage Association (TBA) 5.00 01/07/2038 65,860,839 14.46
8,426,000 U.S. Treasury Bill# 0.00 18/09/2008 4,214,573 0.93
Total U.S. Government & AgencyMortgage Obligations £278,841,488 61.23
REPURCHASE AGREEMENTS (7.39%)
37,090,000 Repurchase Agreement- Bank of America 2.25 01/07/2008 £18,593,904 4.08
30,000,000 Repurchase Agreement- Goldman Sachs 2.33 01/07/2008 15,065,535 3.31
Total Repurchase Agreements £33,659,439 7.39
Total Value of Investments £720,823,049 158.29
TBA SALE COMMITMENTS OUTSTANDING (-32.41%)
248,000,000 Federal National* Mortgage Association 5.50 01/07/2038 £(122,595,575) (26.92)
52,000,000 Federal National* Mortgage Association 5.50 01/07/2038 (24,998,275) (5.49)
Total TBA Sale Commitments £(147,593,850) (32.41)
* Please refer to note 12 Subsequent events for more detail.
# At 30 June 2008, securities in part or in entirety have been designated as collateralfor open futures contracts.
Putnam Global Fixed Income Alpha Fund S1
THE ACCOMPANYING NOTES ARE AN INTEGRAL PART OF THESE FINANCIAL STATEMENTS.
CORPORATE BONDS & NOTES (Continued)
PrincipalAmounts
CouponRate %
MaturityDates
ValueGBP
% ofFund
PrincipalAmounts
CouponRate %
MaturityDates
ValueGBP
% ofFund
PrincipalAmount
CouponRate %
MaturityDate
ValueGBP
% ofFund
PrincipalAmounts
CouponRate %
MaturityDates
ValueGBP
% ofFund
U.S. GOVERNMENT & AGENCY MORTGAGE OBLIGATIONS (61.23%)
PrincipalAmounts
CouponRate %
MaturityDates
ValueGBP
% ofFund
PrincipalAmounts
CouponRate %
MaturityDates
ValueGBP
% ofFund
PrincipalAmounts
CouponRate %
MaturityDates
ValueGBP
% ofFund

44
Putnam Global Fixed Income Alpha Fund S1
THE ACCOMPANYING NOTES ARE AN INTEGRAL PART OF THESE FINANCIAL STATEMENTS.
INTEREST RATE SWAP CONTRACTS OUTSTANDING (-0.53%)
Bank of America, N.A.
£2,350,000 23/05/2010 3 month USD-LIBOR-BBA 3.155% £(7,357) —
7,550,000 08/05/2028 4.95% 3 month USD-LIBOR-BBA (10,303) —
14,803,000 06/06/2018 4.668% 3 month USD-LIBOR-BBA 3,045 —
17,661,000 15/05/2018 4.48% 3 month USD-LIBOR-BBA 133,352 0.03
Credit Suisse International5,850,000 13/03/2018 6 month CHF-LIBOR-BBA 3.3175% (107,043) (0.02)5,850,000 14/03/2018 6 month CHF-LIBOR-BBA 3.3% (111,101) (0.02)
25,820,000 15/03/2010 2.59% 6 month CHF-LIBOR-BBA 153,228 0.0325,820,000 15/03/2010 2.6625% 6 month CHF-LIBOR-BBA 138,147 0.03
Deutsche Bank AG6,240,000 26/04/2038 6 month EUR-EURIBOR-Reuters 5.065% 64,638 0.01
12,820,000 30/04/2020 6 month EUR-EURIBOR-Reuters 4.7975% (156,198) (0.03)15,552,000 26/06/2010 6 month GBP-LIBOR-BBA 6.180% (15,241) —32,000,000 25/04/2013 3.795% 3 month USD-LIBOR-BBA 310,977 0.0745,770,000 30/04/2015 4.475% 6 month EUR-EURIBOR-Reuters 667,597 0.1553,560,000 30/04/2012 6 month EUR-EURIBOR-Reuters 4.31% (569,623) (0.13)
Goldman Sachs International28,000,000 19/03/2012 3.015% 3 month USD-LIBOR-BBA 510,777 0.1130,260,000 26/03/2010 6 month EUR-EURIBOR-Reuters 4.129% (456,342) (0.10)25,220,000 29/03/2010 6 month GBP-LIBOR-BBA 5.25% (395,954) (0.09)
6,110,000 27/03/2018 5.0675% 6 month GBP-LIBOR-BBA 270,062 0.0621,039,000 02/04/2018 4.076% 3 month USD-LIBOR-BBA 489,664 0.1139,490,000 05/04/2010 2.89% 6 month CHF-LIBOR-BBA 166,512 0.04
9,010,000 03/04/2018 6 month CHF-LIBOR-BBA 3.42% (130,464) (0.03)12,590,000 01/04/2010 2.9% 6 month CHF-LIBOR-BBA 51,104 0.01
2,860,000 02/04/2018 6 month CHF-LIBOR-BBA 3.44% (39,119) (0.01)3,271,000 23/04/2018 4.43% 3 month USD-LIBOR-BBA 31,033 0.018,251,000 19/05/2018 4.525% 3 month USD-LIBOR-BBA 48,019 0.01
63,061,000 30/05/2028 5.014% 3 month USD-LIBOR-BBA (349,917) (0.08)4,518,950,000 07/05/2010 6 month JPY-LIBOR-BBA 1.09125% (32,715) (0.01)
994,170,000 07/05/2018 2.205% 6 month JPY-LIBOR-BBA 8,844 —
JPMorgan Chase Bank, N.A.42,000,000 13/06/2013 4.47% 3 month USD-LIBOR-BBA (201,234) (0.04)43,047,000 07/05/2013 3.9325% 3 month USD-LIBOR-BBA 292,207 0.06
3,917,000 23/05/2010 3 month USD-LIBOR-BBA 3.16% (12,066) —
Lehman Brothers Special Financing, Inc.*16,578,000 10/06/2038 5.128% 3 month USD-LIBOR-BBA (200,280) (0.04)12,440,000 11/06/2038 4.52% 6 month EUR-EURIBOR-Reuters 276,203 0.0618,650,000 11/06/2038 3 month USD-LIBOR-BBA 5.54% 181,709 0.0410,655,000 12/06/2038 4.763% 6 month EUR-EURIBOR-Reuters 80,821 0.0215,980,000 12/06/2038 3 month USD-LIBOR-BBA 5.418% 80,573 0.0216,624,000 12/06/2018 4.723% 6 month EUR-EURIBOR-Reuters 98,777 0.0224,668,000 12/06/2018 3 month USD-LIBOR-BBA 5.158% (21,658) — 13,000,000 26/06/2013 3 month USD-LIBOR-BBA 4.465% 59,939 0.0130,726,000 22/03/2010 3 month USD-LIBOR-BBA 2.253% (303,992) (0.07)
113,434,000 07/03/2018 4.34% 3 month USD-LIBOR-BBA 1,417,072 0.3115,180,000 20/03/2013 3 month USD-LIBOR-BBA 3.215% (328,930) (0.07)51,650,000 26/03/2010 3 month USD-LIBOR-BBA 2.3525% (473,173) (0.10)51,650,000 26/03/2010 3 month USD-LIBOR-BBA 2.395% (454,775) (0.10)
5,870,000 26/03/2038 5.05% 3 month USD-LIBOR-BBA 54,601 0.0111,740,000 22/03/2038 5.29% 3 month USD-LIBOR-BBA (177) —16,421,000 20/03/2013 3 month USD-LIBOR-BBA 3.155% (376,994) (0.08)
7,830,000 22/03/2038 6 month EUR-EURIBOR-Reuters 4.864% (16,333) — 55,306,000 25/03/2010 3 month USD-LIBOR-BBA 2.345% (508,609) (0.11)
7,100,000 25/03/2013 3 month USD-LIBOR-BBA 3.2292% (152,316) (0.03)2,400,000 25/03/2038 4.583% 3 month USD-LIBOR-BBA 73,498 0.02
55,306,000 25/03/2010 3 month USD-LIBOR-BBA 2.268% (544,126) (0.12)20,170,000 22/03/2010 6 month GBP-LIBOR-BBA 5.075% (370,724) (0.08)
5,690,000 20/03/2018 4.99% 6 month GBP-LIBOR-BBA 283,931 0.065,110,000 29/03/2038 6 month EUR-EURIBOR-Reuters 4.9625% 20,794 —
53,790,000 12/04/2012 6 month EUR-EURIBOR-Reuters 4.10% (730,175) (0.16)45,770,000 13/04/2015 4.31% 6 month EUR-EURIBOR-Reuters 909,900 0.2012,780,000 13/04/2020 6 month EUR-EURIBOR-Reuters 4.6575% (255,983) (0.06)
351,983,000 30/05/2010 3 month USD-LIBOR-BBA 3.4275% (238,399) (0.05)2,692,000 21/04/2038 4.945% 3 month USD-LIBOR-BBA 6,199 — 9,360,000 26/04/2038 5.3325% 3 month USD-LIBOR-BBA (16,107) —
16,624,000 03/06/2018 6 month EUR-EURIBOR-Reuters 4.912% (13,660) — 24,668,000 03/06/2018 5.28% 3 month USD-LIBOR-BBA (32,920) (0.01)
250,736,000 03/06/2010 3 month USD-LIBOR-BBA 3.41% (245,302) (0.05)38,513,000 03/06/2038 5.0975% 3 month USD-LIBOR-BBA (374,464) (0.08)
3,915,000 26/03/2038 6 month EUR-EURIBOR-Reuters 4.74% (37,554) (0.01)51,650,000 26/03/2010 3 month USD-LIBOR-BBA 2.325% (485,093) (0.11)30,260,000 29/03/2010 6 month EUR-EURIBOR-Reuters 4.25% (417,222) (0.09)
7,660,000 29/03/2038 5.31% 3 month USD-LIBOR-BBA (6,264) —
Swap counterparty
Notional Amount
TerminationDate
Payments made by Fund
per annum
Fixed paymentsreceived by Fund
per annum
Unrealised Appreciation/
(Depreciation)GBP
% ofFund

45
Putnam Global Fixed Income Alpha Fund S1
THE ACCOMPANYING NOTES ARE AN INTEGRAL PART OF THESE FINANCIAL STATEMENTS.
Morgan Stanley Capital Services, Inc.£9,560,000 28/03/2018 5.065% 6 month GBP-LIBOR-BBA £424,366 0.0939,680,000 29/03/2010 6 month GBP-LIBOR-BBA 5.21% (648,768) (0.14)
Net Unrealised Depreciation on Interest Rate Swap Contracts £(2,541,086) (0.53)
* Please refer to note 12 Subsequent events for more detail.
INTEREST RATE SWAP CONTRACTS OUTSTANDING (Continued)
Swap counterparty
Notional Amount
TerminationDate
Payments made by Fund
per annum
Fixed paymentsreceived by Fund
per annum
Unrealised Appreciation/
(Depreciation)GBP
% ofFund
CREDIT DEFAULT CONTRACTS OUTSTANDING (0.44%)
Bank of America, N.A.Cigna Corp., 7 7/8%, 5/15/27 £(550,000) 20/06/2013 (52 bp) £1,807 —Computer Science Corp., 5%, 2/15/13 (2,260,000) 20/03/2018 (71 bp) 4,830 — Cox Communications, Inc., 6.8%, 8/1/28 (1,120,000) 20/06/2013 (80 bp) 1,011 — Cox Communications, Inc., 6.8%, 8/1/28 (1,095,000) 20/06/2013 (88 bp) (967) — Embarq Corp., 7.082%, 6/1/16 (1,800,000) 20/06/2016 (265 bp) (12,688) — Limited Brands, Inc., 6 1/8%, 12/1/12 (1,775,000) 20/12/2012 (252 bp) 7,017 — Marriott International, 4 5/8%, 6/15/12 (895,000) 20/06/2012 (139 bp) 14,454 — Merrill Lynch & Co., 5%, 1/15/15 (1,916,000) 20/06/2018 (136 bp) 47,765 0.01 Merrill Lynch & Co., 5%, 1/15/15 (96,000) 20/06/2013 (136 bp) 2,255 — Oneok Partners, 7.1%, 3/15/11 (1,800,000) 20/12/2016 (102 bp) 3,919 — Temple—Inland Inc., 6 5/8%, 1/15/18 (1,110,000) 20/09/2013 (400 bp) (1,209) —Time Warner Cable Inc., 5.85%, 5/1/17 1,095,000 20/06/2013 166 bp 1,862 — Time Warner Cable, Inc., 5.85%, 5/1/17 1,120,000 20/06/2013 139 bp (4,681) — Time Warner Inc., 5 7/8%, 11/15/16 (5,745,000) 20/09/2013 (135 bp) 9,022 — Tyson Foods, Inc., 6.6%, 4/1/16 (2,940,000) 20/09/2013 (240 bp) 33,969 0.01 Wellpoint, Inc., 6.8%, 8/1/12 550,000 20/06/2013 97 bp (1,451) — Weyerhaeuser Co., 7 1/8%, 7/15/23 (1,085,000) 20/06/2013 (157 bp) 14,785 —
Citibank, N.A.American Axle & Manufacturing, Inc., 5 1/4%, 2/11/14 (1,700,000) 20/09/2013 (652 bp) 80,249 0.02 Countrywide Financial Corp., USLibor+14, 1/5/09 (1,385,000) 20/03/2009 (875 bp) (24,077) (0.01)Darden Restaurants Inc., 6%, 8/15/35 (2,850,000) 20/09/2013 (175 bp) (6,406) — DJ ABX NA HE AAA Index 3,328,755 25/07/2045 18 bp 40,352 0.01Donnelley (R.R.) & Sons, 4.95%, 4/1/14 (3,370,000) 20/03/2012 (102 bp) 24,211 0.01 DTE Energy Co., 7.05%, 6/1/11 (5,000,000) 20/03/2013 (105 bp) (14,248) — Electronic Data Systems Corp., 6.5%, 8/1/13 (1,815,000) 20/09/2013 (155 bp) (39,984) (0.01)Hanson Plc, 7 7/8%, 9/27/10 (840,000) 20/09/2016 (71 bp) (1,509) — International Lease Finance Corp., 4.15%, 1/20/15 (5,170,000) 20/09/2013 (105 bp) 205,326 0.05 Lear Corp., 5 3/4%, 8/1/14 1,700,000 20/09/2013 630 bp (68,104) (0.01)Lexmark International, Inc., 5.9%, 6/1/13 (1,685,000) 20/06/2013 108.5 bp 2,400 — Limited Brands, Inc., 6 1/8%, 12/1/12 (3,330,000) 20/12/2012 (275 bp) (1,186) — Limited Brands, Inc., 6 1/8%, 12/1/12 (555,000) 20/06/2011 (250 bp) (108) — Limited Brands, Inc., 6 1/8%, 12/1/12 (5,835,000) 20/09/2013 (265 bp) 24,356 0.01 Macy’s Retail Holdings, Inc., 6 5/8%, 4/1/11 (1,235,000) 20/06/2011 (162 bp) 7,219 — Masco Corp., 5 7/8%, 7/15/12 (4,470,000) 20/03/2017 (213 bp) 47,275 0.01 Newell Rubbermaid, Inc., 6.35%, 7/15/28 (3,775,000) 20/06/2013 (85 bp) (7,841) — Qwest Capital Funding, 7 3/4%, 2/15/31 (2,795,000) 20/06/2013 (263 bp) 34,944 0.01 Rexam PLC, 4 3/8%, 3/15/13 (630,000) 20/06/2013 (145 bp) 1,325 — Seat Pagine Gialle S.P.A., 8%, 4/30/14 640,000 20/03/2013 815 bp (3,307) —
Credit Suisse InternationalArrow Electronics, Inc., 6 7/8%, 6/1/18 (2,660,000) 01/10/2010 (54.2 bp) (376) — Bundesrepublic of Deutschland, 6%, 6/20/16 16,432,000 20/09/2018 9 bp — — DJ ABX NA HE AAA Index 6,773,858 25/07/2045 18 bp 240,779 0.05DJ ABX NA HE AAA Index 12,975,833 25/07/2045 18 bp 262,149 0.06DJ ABX NA HE AAA Index 12,975,833 25/07/2045 18 bp 195,789 0.04DJ CMB NA CMBX AAA Index 2,322,000 (F) 17/02/2051 35 bp 101,474 0.02Republic of Italy, 6 7/8%, 9/27/23 (16,432,000) 20/09/2018 (48.75 bp) 3,215 — Wachovia Corp., 3 5/8%, 2/17/09 5,000,000 20/03/2013 173 bp (39,785) (0.01)
Deutsche Bank AGAnadarko Petroleum Corp., 5.95%, 9/15/16 (1,640,000) 20/06/2018 (59 bp) 11,774 — CBS Corp., 4 5/8%, 5/15/18 2,775,000 20/09/2012 (87 bp) 25,416 0.01 CBS Corp, 4 5/8%, 5/15/18 (3,235,000) 20/06/2011 (102 bp) 8,269 — CNA Financial Corp., 5.85%, 12/15/14 (6,015,000) 20/09/2016 (155 bp) (31,365) (0.01)Deutsche Telekom International Finance, 8 1/8%, 5/29/12 (1,660,000) 20/06/2013 (84 bp) 9,954 — Diageo Capital PLC, 5 1/2%, 9/30/16 (5,570,000) 20/09/2013 (46 bp) 3,186 — DJ ABX NA HE AAA Index 1,553,945 25/07/2045 18 bp 14,098 —DJ CDX NA IG Series 10 Index (435,000) 20/06/2013 (155 bp) 3,058 —DJ iTraxx Europe Series 9 Version 1,561,000 20/12/2012 375 bp 3,853 —General Electric Capital Corp., 6%, 6/15/12 435,000 20/09/2013 109 bp (5,408) — Grohe Holding GmbH, 8 5/8%, 10/1/14 350,000 20/06/2009 400 bp 1,610 —
Swap counterparty/Referenced debt*
Notional Amount
TerminationDate
Fixed payments received (paid)
by Fund per annum
Unrealised Appreciation/
(Depreciation)GBP
% ofFund

46
Putnam Global Fixed Income Alpha Fund S1
THE ACCOMPANYING NOTES ARE AN INTEGRAL PART OF THESE FINANCIAL STATEMENTS.
Grohe Holding GmbH, 8 5/8%, 10/1/14 £1,275,000 20/06/2009 400 bp £5,864 — iStar Financial, Inc., 6%, 12/15/10 495,000 20/03/2009 500 bp 8,352 — ITV PLC, 5 3/8%, 10/19/15 (1,107,000) 20/09/2013 (280 bp) 20,581 — Korea Monetary STAB Bond, 5%, 2/14/09 2,840,000 (F) 23/02/2009 105 bp 467 — Korea Monetary STAB Bond, 5.15%, 2/12/10 2,840,000 (F) 19/02/2010 115 bp 3,410 — Malaysian Government, 6.844%, 10/1/09 3,503,000 01/10/2009 90 bp 7,891 — Packaging Corporation of America, 5 3/4%, 8/1/13 (7,365,000) 20/09/2013 (129 bp) (25,468) (0.01)Pitney Bowes, Inc., 4 5/8%, 10/1/12 (2,615,000) 20/03/2018 (95 bp) (18,421) — PPG Industries, Inc., 7.05%, 8/15/09 (3,895,000) 20/03/2018 (154 bp) (90,987) (0.02)Republic of Argentina, 8.28%, 12/31/33 (845,000) 20/04/2013 (565 bp) 13,384 — Republic of China, zero coupon, 12/5/08 4,733,000 (F) 12/12/2008 115 bp (35) — Russian Federation, 7 1/2%, 3/31/30 (1,900,000) 20/04/2013 (112 bp) 9,008 — Russian Federation, 7 1/2%, 3/31/30 (845,000) 20/06/2013 (87 bp) (856) — Smurfit Kappa Funding, 10 1/8%, 10/1/12 400,000 20/06/2009 135 bp (278) — Societe Telefon Francais 1, 4 3/8%, 11/12/10 (1,670,000) 20/09/2013 (55 bp) (13) — Stora Enso Oyj, 7 3/8%, 5/15/11 (2,995,000) 20/03/2013 (401.5 bp) (48,820) (0.01)Tyco Electronics Group, 6.55%, 10/1/17 (4,215,000) 20/12/2017 (125.5 bp) (60,269) (0.01)Unity Media GmbH, 8 3/4%, 2/15/15 570,000 20/06/2013 460 bp (13,471) — Virgin Media Finance PLC, 8 3/4%, 4/15/14 570,000 20/09/2013 477 bp (8,327) — Weyerhaeuser Co., 7 1/8%, 7/15/23 (1,085,000) 20/06/2013 (157 bp) 14,952 — XTO Energy, Inc., 4.9%, 2/1/14 1,640,000 20/06/2018 82 bp (21,631) —
Goldman Sachs InternationalBonos Y Oblig Del Estado, 5 1/2%, 7/30/17 25,791,000 20/06/2018 (42 bp) 43,735 0.01 British Airways, 7 1/4%, 8/23/16 (4,335,000) 20/09/2013 (374 bp) 109,028 0.02 Bundesrepublic of Deutschland, 6%, 6/20/16 25,791,000 20/06/2018 9.5 bp 6,728 — Cigna Corp., 7 7/8%, 5/15/27 (1,105,000) 20/06/2013 (58 bp) 2,151 — CMS Energy Corp., 6 7/8%, 12/15/15 5,000,000 20/03/2013 201 bp 39,434 0.01 CSC Holdings, Inc., 7 5/8%, 7/15/18 1,040,000 20/09/2013 495 bp (2,023) — DJ CDX NA HY Series 9 Index (20,000,000) 20/17/2017 (80 bp) (110,410) (0.02)DJ CDX NA HY Series 9 Index 35-100% tranche 24,662,487 (F) 20/12/2010 153.5 bp 116,235 0.03General Mills, Inc., 5.7%, 2/15/17 (2,960,000) 20/06/2013 (54.9 bp) 683 — General Mills, Inc., 5.7%, 2/15/17 (4,935,000) 20/09/2013 (57.9 bp) (4,518) — ITV PLC, 5 3/8%, 10/19/15 (553,000) 20/09/2013 (281 bp) 10,650 — Lighthouse International Co, SA, 8%, 4/30/14 540,000 20/03/2013 680 bp (19,147) — Lowe’s Companies, Inc., 8 1/4%, 6/1/10 (740,000) 20/06/2013 (104 bp) (6,197) — Nordstrom, Inc., 6.95%, 3/15/28 (740,000) 20/06/2013 (130 bp) (3,193) — ONO Finance II, 8%, 5/16/14 (1,230,000) 20/06/2013 (955 bp) 33,889 0.01 Pernod Ricard, 4 5/8%, 12/6/13 (1,545,000) (F) 20/06/2013 (350 bp) (29,578) (0.01)Radioshack Corp., 7 3/8%, 5/15/2011 (1,910,000) 20/09/2013 (205 bp) 6,295 — Reynolds America, Inc., 7 5/8%, 6/1/16 3,460,000 20/09/2013 98.5 bp (9,079) — Rhodia SA, Euribor+275, 10/15/13 (190,000) 20/09/2013 (367 bp) 3,459 — Rhodia SA, Euribor+275, 10/15/13 (160,000) 20/09/2013 (387 bp) 1,904 — Southern California Edison Co., 7 5/8%, 1/15/10 1,095,000 20/06/2013 88.1 bp (4,309) — UST Inc., 6 5/8%, 7/15/12 (10,000,000) 20/03/2018 (88 bp) (139,625) (0.03)Wellpoint, Inc., 6.8%, 8/1/12 1,105,000 20/06/2013 93 bp (3,881) — Wind Acquisition 9 3/4%, 12/1/15 540,000 20/03/2013 597 bp 21,556 —
JPMorgan Chase Bank, N.A.Cardinal Health Inc., 5.85%, 12/15/17 (930,000) 20/06/2012 (40 bp) 70 — CBS Corp., 4 5/8%, 5/15/18 6,180,000 20/09/2013 (129 bp) 22,541 — CenturyTel. Inc., 6%, 4/1/17 (1,350,000) 20/06/2013 (95 bp) 23,435 0.01 Codere Finance (Luxembourg) S.A., 8.25%, 6/15/15 540,000 20/03/2013 795 bp 26,270 0.01 Cox Communications, Inc., 6.8%, 8/1/28 (4,480,000) 20/03/2010 (45 bp) (1,663) — Darden Restaurants, Inc., 6%, 8/15/35 (2,815,000) 20/12/2017 (155.3 bp) 9,307 — DJ CDX NA HY Series 9 Index 25-35% tranche 40,000,000 20/12/2010 388.75 bp 504,716 0.11 DJ iTraxx Europe Crossover Series 8 Version 1 (500,000) 20/12/2012 (375 bp) (16,034) — DJ iTraxx Europe Series 9 Version 1 (710,000) 20/06/2013 (650 bp) (7,308) —DJ iTraxx Europe Series 9 Version 1 (660,000) 20/06/2013 (650 bp) 2,940 —Freeport-McMoRan Copper & Gold, Inc., 8 3/8%, 4/1/17 (2,540,000) 20/06/2013 (145 bp) (2,651) — Illinois Tool Works, 5 3/4%, 3/1/09 (550,000) 20/06/2013 (35 bp) 1,085 — iStar Financial, Inc., 6%, 12/15/10 475,000 (F) 20/03/2009 500 bp 9,188 — Lexmark International, Inc., 5.9%, 6/1/13 (1,540,000) 20/06/2013 (113 bp) (170) — Lexmark International, Inc., 5.9%, 6/1/13 (1,465,000) 20/06/2013 (113 bp) (162) — Merrill Lynch & Co., 5%, 1/15/15 (2,836,000) 20/06/2018 (125 bp) 81,059 0.02 Merrill Lynch & Co., 5%, 1/15/15 (420,000) 20/06/2013 (135 bp) 9,950 — Nextel Communications, 7 3/8%, 8/1/15 (3,190,000) 20/09/2013 (540 bp) (63,073) (0.01)Qwest Corp., 7.2%, 11/10/26 1,285,000 20/09/2013 330 bp 58 — Smurfit-Stone Container Enterprises, 7 1/2%, 6/1/13 655,000 (F) 20/06/2013 685 bp (18,391) — UST Inc., 6 5/8%, 7/15/12 (6,920,000) 20/09/2013 (36.5 bp) 9,721 —
Lehman Brothers Special Financing, Inc.**Anadarko Petroleum Corp., 5.95%, 9/15/16 (750,000) 20/06/2013 (58 bp) 1,498 — Arcelormittal Finance, 5 1/8%, 9/24/10 2,210,000 20/06/2013 130 bp (23,084) (0.01)Centex Corp., 5 1/4%, 6/15/15 (1,105,000) 20/06/2013 (405 bp) 11,021 — CNA Financial Corp., 5.85%, 12/15/14 (390,000) 20/09/2011 (174 bp) (3,810) — DirecTV Holdings/Financing, 8 3/8%, 3/15/13 1,275,000 20/06/2013 280 bp (4,120) — DJ ABX HE PEN AAA Index 276,500 (F) 25/05/2046 11 bp (10,410) — DJ ABX HE PEN AAA Index 278,362 (F) 25/05/2046 11 bp (10,303) — DJ CDX NA IG Series 10 Index (870,000) 20/06/2013 (155 bp) 5,229 —
CREDIT DEFAULT CONTRACTS OUTSTANDING (Continued)
Swap counterparty/Referenced debt*
Notional Amount
TerminationDate
Fixed payments received (paid)
by Fund per annum
Unrealised Appreciation/
(Depreciation)GBP
% ofFund

47
Putnam Global Fixed Income Alpha Fund S1
THE ACCOMPANYING NOTES ARE AN INTEGRAL PART OF THESE FINANCIAL STATEMENTS.
DJ CMB NA CMBX AAA Index £8,582,500 (F) 17/02/2051 35 bp £181,169 0.04Echostar DBS Corp., 6 5/8%, 10/1/14 (1,275,000) 20/06/2013 (241.5 bp) 14,617 — Embarq Corp., 7.082%, 6/1/16 (4,320,000) 20/06/2013 (237 bp) (4,356) — Embarq Corp., 7.082%, 6/1/16 (2,420,000) 20/09/2013 (243.8 bp) (4,796) — Energy Future Holdings, 5.55%, 11/15/14 (2,750,000) 20/09/2013 (589 bp) 21,578 — Felcor Lodging LP, 8 1/2%, 6/1/11 (1,550,000) 20/06/2011 (334 bp) 24,146 0.01 First Data Corp., 5 5/8%, 11/1/11 (1,280,000) 20/09/2013 (643 bp) 18,296 — General Electric Capital Corp., 6%, 6/15/12 870,000 20/09/2013 115 bp (9,655) — GMAC, LLC, 6 7/8%, 8/28/12 1,640,000 20/03/2009 500 bp (6,636) —Hanson Plc, 7 7/8%, 9/27/10 (3,690,000) 20/09/2016 (140 bp) (92,713) (0.02)International Lease Finance Corp., 4.15%, 1/20/15 (1,540,000) 20/12/2013 (165 bp) 42,680 0.01 Jefferson Smurfit Corp., 7 1/2%, 6/1/13 1,060,000 (F) 20/03/2013 645 bp (36,752) (0.01)Lafarge SA, 5.448%, 12/4/13 (1,240,000) 20/06/2013 (185 bp) (8,001) — Lennar Corp., 5.95%, 3/1/13 (1,390,000) 20/06/2013 (555 bp) 28,306 0.01 MediaCom LLC/ Cap Corp., 9 1/2%, 1/15/13 720,000 20/09/2013 820 bp 79 — Owens-Illinois, Inc., 7.8%, 5/15/18 (4,305,000) 20/06/2010 (128 bp) 3,089 — Owens-Illinois, Inc., 7.8%, 5/15/18 (1,465,000) 20/06/2010 (130 bp) 772 — Owens-Illinois, Inc., 7.8%, 5/15/18 (1,465,000) 20/06/2010 (140 bp) (618) — Pearson PLC, 7%, 10/27/14 (2,800,000) 20/06/2018 (69 bp) 19,962 — Progress Energy, Inc., 5 5/8%, 1/15/16 (2,910,000) 20/06/2013 (79 bp) (19,710) — Republic of Argentina, 8.28%, 12/31/33 (845,000) 20/04/2013 (565 bp) 13,384 — Russian Federation, 7 1/2%, 3/31/30 (845,000) 20/04/2013 (112 bp) (856) — Safeway, Inc., 5.8%, 8/15/12 (740,000) 20/06/2013 (65 bp) (282) — Sprint Nextel Corp., 6%, 12/1/16 (1,700,000) 20/06/2013 (390 bp) (31,370) (0.01)Telecom Italia SPA, 5 3/8%, 1/29/19 (1,525,000) 20/07/2011 (105 bp) 3,374 — Telecom Italia SPA, 5 3/8%, 1/29/19 (3,080,000) 20/07/2011 (108 bp) 5,486 — Telus Corp., 8%, 6/1/11 (3,310,000) 20/09/2013 (80 bp) (3,903) — Texas Comp Electric Holdings, LLC, 7%, 3/15/13 2,750,000 20/09/2013 559 bp (21,578) — Thomson (EX-TMM), 5 3/4%, 9/25/15 (644,000) 20/06/2013 (405 bp) 40,494 0.01 US Steel Corp., 6.65%, 6/1/37 (4,420,000) 20/03/2018 (141 bp) 38,356 0.01 US Steel Corp., 6.65%, 6/1/37 (2,210,000) 20/06/2013 (130 bp) (832) — XTO Energy, Inc., 4.9%, 2/1/14 750,000 20/06/2013 88 bp (1,976) — Yum! Brands, Inc., 8 7/8%, 4/15/11 (3,740,000) 20/03/2018 (130 bp) (8,950) —
Merrill Lynch InternationalAmerisourceBergen Corp., 5 7/8%, 9/15/15 (3,980,000) 20/09/2012 (65 bp) 16,533 — Block Financial LLC. 5 1/8%, 10/30/14 (2,000,000) 20/12/2014 (69 bp) 9,342 — Cargill Inc., 7 3/8%, 10/1/25 (5,650,000) 20/09/2013 (84 bp) 7,767 — Diageo Capital PLC, 5 1/2%, 9/30/16 (1,255,000) 20/09/2013 (43 bp) 1,605 — Eaton Corp., 7.65%, 11/15/29 1,105,000 20/06/2013 65 bp 344 — Electronic Data Systems Corp., 6%, 8/1/13 (1,550,000) 20/09/2013 (100 bp) (14,177) — Felcor Lodging LP, 8 1/2%, 6/1/11 (1,460,000) 20/06/2011 (316 bp) 26,172 0.01 Goodrich Corp., 7 5/8%, 12/15/12 (555,000) 20/06/2013 (30 bp) 1,509 — Liberty Media LLC., 5.7%, 5/15/13 (2,810,000) 20/06/2009 (203 bp) (9,784) — Marriott International, 4 5/8%, 6/15/12 (4,410,000) 20/06/2012 (119 bp) 86,753 0.02 Pearson PLC, 7%, 10/27/14 (1,840,000) 20/06/2018 (65 bp) 15,961 — Rogers Communications, 6 3/8%, 3/1/14 480,000 20/09/2013 161 bp (308) — Sara Lee Corp., 6 1/8%, 11/1/32 (1,270,000) 20/06/2013 55.5 bp 2,440 — Supervalu, Inc., 7 1/2%, 05/15/12 (5,523,000) 01/08/2009 (90 bp) 8,895 — Temple-Inland Inc., 6 5/8%, 1/15/18 (1,105,000) 20/09/2013 (395 bp) (61) — Tyson Foods, Inc., 6.6%, 4/1/16 (2,815,000) 20/12/2011 (141 bp) 51,295 0.01 Tyson Foods, Inc., 6.6%, 4/1/16 (2,815,000) 20/10/2011 (152.50 bp) 42,454 0.01 Yum! Brands, Inc., 8 7/8%, 4/15/11 (5,695,000) 20/09/2013 (94 bp) 20,685 —
Morgan Stanley Capital Services, Inc.Bundesrepublic of Deutschland, 6%, 6/20/16 2,471,000 20/06/2018 8 bp (868) — Embarq Corp., 7.082%, 6/1/16 (2,030,000) 20/09/2013 (242 bp) 1,562 — Republic of Austria, 5 1/4%, 1/4/11 (2,471,000) 20/06/2018 (17 bp) (3,074) — Rogers Communications, 6 3/8%, 3/1/14 2,830,000 20/09/2013 165 bp 696 —
UBS, AGCardinal Health Inc., 5.85%, 12/15/17 (3,880,000) 20/06/2013 (49 bp) 3,367 — Sempra Energy, 6%, 2/1/13 (10,000,000) 20/03/2018 (101 bp) (126,928) (0.03)Wells Fargo & Co., USLibor+20, 10/28/15 (5,000,000) 20/03/2013 (94 bp) 19,115 —
Net Unrealised Appreciation on Credit Default Contracts Outstanding £2,010,405 0.44
* Payments related to the reference debt are made upon a credit default event.
** Please refer to note 12 Subsequent events for more detail.
(F) Is valued at fair va lue following procedures approved by the Manager.
CREDIT DEFAULT CONTRACTS OUTSTANDING (Continued)
Swap counterparty/Referenced debt*
Notional Amount
TerminationDate
Fixed payments received (paid)
by Fund per annum
Unrealised Appreciation/
(Depreciation)GBP
% ofFund

48
Putnam Global Fixed Income Alpha Fund S1
THE ACCOMPANYING NOTES ARE AN INTEGRAL PART OF THESE FINANCIAL STATEMENTS.
Swap counterparty
Notional Amount
TerminationDate
Fixed payments received (paid)
by Fund per annum
Total returnreceived by
or paid by Fund
Unrealised Appreciation/
(Depreciation)GBP
% ofFund
TOTAL RETURN SWAP CONTRACTS OUTSTANDING (0.00%)
Goldman Sachs International£24,928,000 (F) 26/03/2009 (2.27%) £155,603 0.03
(13,870,000) 30/04/2013 2.375% (240,664) (0.05)
13,870,000 (F) 30/04/2013 (2.41%) 330,907 0.07
(13,870,000) 06/05/2013 2.34% (253,157) (0.06)
13,870,000 06/05/2013 (2.385%) 280,993 0.06
(8,322,000) 09/05/2013 3.10% (279,952) 0.06
Net Unrealised Depreciation on Total Return Swap Contracts £(6,270) —
(F) Is valued at fair value following procedures approved by the Manager.
GBP Non-revisedRetail Price Index
Eurostat EurozoneHICP excluding tobacco
French ConsumerPrice Index excluding tobacco
Eurostat EurozoneHICP excluding tobacco
French ConsumerPrice Index excluding tobacco
Eurostat EurozoneHICP excluding tobacco
FUTURES CONTRACTS (-0.14%)
340 Euro-Bund 10 yr Sept 2008 Goldman Sachs, Lehman Brothers* £(80,914) (0.02)
(125) Euro-Schatz 2 yr Sept 2008 Lehman Brothers* (8,054) —
46 Sterling Interest Rate 90 day Dec 2008 Lehman Brothers* (29,312) (0.01)
217 Sterling Interest Rate 90 day June 2009 Lehman Brothers* (156,867) (0.03)
203 Sterling Interest Rate 90 day Sept 2009 Lehman Brothers* (136,137) (0.03)
50 Sterling Interest Rate 90 day March 2009 Lehman Brothers* (36,765) (0.01)
1194 U.S. Treasury Bond 20 yr Sept 2008 Goldman Sachs, Lehman Brothers* 637,337 0.14
(4992) U.S. Treasury Note 2 yr Sept 2008 Lehman Brothers* (669,224) (0.15)
(551) U.S. Treasury Note 5 yr Sept 2008 Lehman Brothers* 40,217 0.01
(664) U.S. Treasury Note 10 yr Sept 2008 Lehman Brothers* (207,659) (0.05)
Net Unrealised Depreciation on Futures Contracts £(647,378) (0.15)
Variation margin settlement to date £30,109 0.01
Cumulate unrealised less variation margin settlement to date £(617,269) (0.14)
* Please refer to note 12 Subsequent events for more detail.
Number of ContractsLong/(Short) Counterparty
Unrealised Appreciation/
(Depreciation)GBP
% ofFund

49
Putnam Global Fixed Income Alpha Fund S1
THE ACCOMPANYING NOTES ARE AN INTEGRAL PART OF THESE FINANCIAL STATEMENTS.
FORWARD FOREIGN EXCHANGE CURRENCY CONTRACTS (2.12%)
16/07/2008 AUD 3,552,500 USD 3,266,837 Bank of America Securities £(65,954) (0.01)
16/07/2008 CAD 2,304,900 USD 2,371,997 Citibank NA 3,479 —
16/07/2008 AUD 1,164,000 USD 1,109,222 Citibank NA (2,133) —
16/07/2008 AUD 1,191,900 USD 1,122,693 Credit Suisse First Boston (8,764) —
16/07/2008 CAD 4,447,500 USD 4,376,692 Credit Suisse First Boston 3,040 —
16/07/2008 USD 1,125,157 AUD 1,193,800 Goldman Sachs International 8,440 —
16/07/2008 USD 33,505 AUD 37,200 JP Morgan Chase Bank 1,044 —
16/07/2008 USD 599,054 CAD 609,400 JP Morgan Chase Bank (94) —
16/07/2008 AUD 2,477,000 USD 2,224,852 Lehman Brothers* (58,162) (0.01)
16/07/2008 CAD 2,314,500 USD 2,264,747 Lehman Brothers* (4,892) —
16/07/2008 USD 1,123,813 AUD 1,192,400 Merrill Lynch 8,442 —
16/07/2008 AUD 18,800 USD 16,922 State Street Bank & Trust (533) —
16/07/2008 CAD 2,284,000 USD 2,234,567 UBS AG (5,394) —
16/07/2008 AUD 900 USD 809 UBS AG (26) —
16/07/2008 CAD 1,146,700 USD 1,138,820 Westpac Banking Group 5,989 —
16/07/2008 USD 20,518,259 AUD 22,792,000 Westpac Banking Group 644,396 0.14
17/09/2008 CHF 2,933,600 USD 2,803,570 Bank of America Securities (37,853) —
17/09/2008 SEK 16,298,900 USD 2,687,170 Bank of America Securities (4,793) —
17/09/2008 EUR 717,300 USD 1,116,886 Bank of America Securities (4,149) —
17/09/2008 USD 730,265 EUR 475,00 Citibank NA 7,436 —
17/09/2008 USD 1,690,662 NOK 8,715,700 Citibank NA 4,781 —
17/09/2008 SEK 13,317,500 USD 2,200,791 Citibank NA (1,328) —
17/09/2008 USD 1,068,141 GBP 548,600 Citibank NA 9,435 —
17/09/2008 USD 1,102,168 CHF 1,148,900 Citibank NA 12,722 —
17/09/2008 USD 1,108,222 EUR 705,200 Credit Suisse First Boston (1,025) —
17/09/2008 USD 5,517,198 NOK 28,551,500 Credit Suisse First Boston 26,289 —
17/09/2008 CHF 1,143,600 USD 1,121,957 Credit Suisse First Boston (183) —
17/09/2008 SEK 6,726,300 USD 1,119,634 Credit Suisse First Boston 3,380 —
17/09/2008 USD 2,215,524 GBP 1,129,200 Credit Suisse First Boston 10,922 —
17/09/2008 EUR 12,572,900 USD 19,472,027 Deutsche Bank, London (125,351) —
17/09/2008 NOK 5,680,400 USD 1,102,947 HSBC Bank USA (2,579) —
17/09/2008 SEK 6,761,500 USD 1,115,041 HSBC Bank USA (1,846) —
17/09/2008 USD 301,026,438 GBP 154,864,300 HSBC Bank USA 2,913,702 0.64
17/09/2008 EUR 716,500 USD 1,118,349 HSBC Bank USA (2,787) —
17/09/2008 SEK 13,462,700 USD 2,215,509 JP Morgan Chase Bank (5,998) —
17/09/2008 USD 1,548,632 CHF 1,608,900 JP Morgan Chase Bank 15,219 —
17/09/2008 USD 685,930 EUR 442,300 JP Morgan Chase Bank 3,945 —
17/09/2008 USD 307,465,781 GBP 159,452,000 Lehman Brothers* 3,249,345 0.71
17/09/2008 GBP 54,600 USD 106,383 Lehman Brothers* (901) —
17/09/2008 USD 12,004,749 NOK 61,936,100 Lehman Brothers* 38,757 0.01
17/09/2008 SEK 6,750,200 USD 1,115,772 Lehman Brothers* (540) —
17/09/2008 CHF 3,372,100 USD 3,229,981 Lehman Brothers* (39,825) (0.01)
17/09/2008 EUR 722,700 USD 1,111,404 Lehman Brothers* (11,151) —
17/09/2008 USD 2,255,218 NOK 11,626,100 Merrill Lynch 6,377 —
17/09/2008 USD 2,021,453 CHF 2,087,900 Merrill Lynch 13,847 —
17/09/2008 USD 8,387 GBP 4,300 Merrill Lynch 66 —
17/09/2008 EUR 711,100 USD 1,101,323 State Street Bank & Trust (7,079) —
SettlementDates
CurrencySold
AmountSold
CurrencyBought
AmountBought Counterparty
Unrealised Appreciation/
(Depreciation)GBP
% ofFund

50
Putnam Global Fixed Income Alpha Fund S1
THE ACCOMPANYING NOTES ARE AN INTEGRAL PART OF THESE FINANCIAL STATEMENTS.
17/09/2008 USD 2,574,411 EUR 1,660,000 UBS AG £14,784 —
17/09/2008 USD 291,078,750 GBP 150,000,000 UBS AG 3,069,235 0.67
17/09/2008 GBP 709,100 USD 1,400,525 UBS AG (2,218) —
17/09/2008 CHF 1,344,100 USD 1,297,650 UBS AG (10,756) —
17/09/2008 USD 1,073,164 NOK 5,548,900 UBS AG 4,652 —
17/09/2008 SEK 6,761,500 USD 1,115,617 UBS AG (1,556) —
17/09/2008 GBP 617,100 USD 1,198,575 Westpac Banking Group (12,087) —
20/08/2008 USD 1,692,655 JPY 178,635,700 Citibank NA (1,510) —
20/08/2008 USD 1,125,395 JPY 120,821,300 Credit Suisse First Boston 8,730 —
20/08/2008 USD 2,254,250 JPY 236,411,900 Goldman Sachs International (9,100) —
20/08/2008 USD 551,525 JPY 56,867,000 UBS AG (6,848) —
Net Unrealised Appreciation on Forward Foreign Exchange Currency Contracts £9,651,039 2.12
Total Financial Assets at Fair Value through Profit or Loss £732,484,493 160.85
Total Financial Liabilities at Fair Value through Profit or Loss £(150,758,475) (33.11)
* Please refer to note 12 Subsequent events for more detail.
Analysis of Investments (Unaudited)
(a) Transferable securities admitted to official stock exchange listing 72.68
(b) Transferable securities dealt in on another regulated market —
(c) Transferable securities other than those admitted to official stock exchange listing or dealt in on another regulated market 3.59
(d) Collective Investment Schemes 0.52
(e) OTC financial derivative instruments 1.29
(f ) Exchange traded financial derivative instruments 0.07
(g) Other assets 21.85
Total Investments 100.00
% ofTotal Assets
FORWARD FOREIGN EXCHANGE CURRENCY CONTRACTS (Continued)
SettlementDates
CurrencySold
AmountSold
CurrencyBought
AmountBought Counterparty
Unrealised Appreciation/
(Depreciation)GBP
% ofFund

51
Putnam Global Fixed Income Alpha Fund S2
Schedule of Investments
30 June 2008
1,279,850 Ace Securities Corporation 144A 6.50 15/08/2030 £563,425 0.08
2,272,000 BankAmerica Manufactured Housing Contract Trust 6.90 10/04/2028 1,438,409 0.21
9,577,347 Bombardier Capital Mortgage Securitization Corporation 8.29 15/06/2030 3,120,854 0.47
2,186,901 Bombardier Capital Mortgage Securitization Corporation 7.58 15/06/2030 645,362 0.10
5,450,984 Bombardier Capital Mortgage Securitization Corporation 6.53 15/10/2028 2,056,836 0.31
1,513,000 Credit-Based Asset Servicing and Securitization (Class M1) 6.25 25/10/2036 637,628 0.10
659,000 Credit-Based Asset Servicing and Securitization (Class M2) 6.25 25/10/2036 271,112 0.04
3,790,006 Green Tree Financial Corporation 8.60 15/07/2019 1,195,073 0.18
7,581,000 Green Tree Financial Corporation 7.95 15/09/2027 3,321,917 0.50
4,289,000 Green Tree Financial Corporation 7.60 15/04/2026 1,676,824 0.25
568,162 Green Tree Financial Corporation 6.85 15/10/2018 256,459 0.04
8,859,736 Greenpoint Manufactured Housing 8.45 20/06/2031 3,778,234 0.56
276,906 Mid-State Trust 7.34 01/07/2035 133,619 0.02
794,251 Mid-State Trust 4.86 15/07/2038 295,589 0.04
1,314,000 Oakwood Mortgage Investors Incorporated 6.83 15/05/2028 492,256 0.07
7,643,620 Oakwood Mortgage Investors Incorporated 5.26 15/01/2019 2,391,795 0.36
1,558,313 Oakwood Mortgage Investors Incorporated 2.77 15/03/2014 489,103 0.07
627,529 Vanderbilt Mortgage Finance FRB Ser. 01-A, (Class M1) 7.74 07/04/2031 299,188 0.04
Total Asset-Backed Securities £23,063,683 3.44
COLLATERALISED MORTGAGE OBLIGATIONS (63.65%)
9,044,000 Banc of America Alternative Loan Trust 5.71 25/10/2036 £4,281,063 0.64
29,700,000 Banc of America Commercial Mortgage Incorporated 5.84 10/06/2049 14,530,609 2.17
15,000 Banc of America Commercial Mortgage Incorporated 5.63 10/04/2049 7,376 —
2,300,000 Banc of America Commercial Mortgage Incorporated 5.45 15/01/2049 1,131,386 0.17
7,561,000 Banc of America Commercial Mortgage Incorporated 5.31 10/10/2045 3,791,501 0.57
7,455,354 Banc of America Funding Corporation 5.99 20/05/2036 £2,973,614 0.44
6,248,229 Bear Stearns*Alternative Trust 6.25 25/08/2036 2,423,571 0.36
5,006,322 Bear Stearns*Alternative Trust 5.69 25/09/2035 1,928,484 0.29
60,000 Bear Stearns*Commercial Mortgage Securities Incorporated 5.85 11/06/2040 29,679 —
9,070,000 Citigroup Commercial Mortgage Trust 6.03 10/10/2012 4,574,760 0.68
16,678,000 Citigroup Commercial Mortgage Trust 6.30 10/11/2014 8,497,830 1.27
35,500,000 Citigroup Commercial Mortgage Trust 5.89 10/12/2049 17,727,761 2.65
4,268,547 Citigroup Mortgage Loan Trust Incorporated 6.21 25/07/2036 1,555,781 0.23
7,867,813 Citigroup Mortgage Loan Trust Incorporated 5.66 25/11/2036 2,970,364 0.44
35,525,000 Commercial Mortgage Loan Trust 6.22 10/09/2017 17,605,529 2.63
4,656,951 Countrywide Alternative Loan Trust 5.54 25/03/2047 2,109,551 0.32
933,726 Countrywide Alternative Loan Trust 5.12 25/03/2034 24,521 —
7,192,277 Countrywide Alternative Loan Trust (Class 2A2) 6.00 25/02/2037 2,936,905 0.44
5,766,338 Countrywide Alternative Loan Trust (Class A4) 6.00 25/02/2037 2,357,800 0.35
10,400,000 Credit Suisse First Boston Mortgage Securities Corporation 5.71 15/02/2039 5,192,320 0.78
21,233,000 Credit Suisse Mortgage Capital Certificates 6.43 15/02/2041 10,706,867 1.60
21,502,000 Credit Suisse Mortgage Capital Certificates 5.91 15/06/2039 10,677,320 1.59
10,000 Credit Suisse Mortgage Capital Certificates (Class A2) 6.01 15/09/2039 4,974 —
18,800,000 Credit Suisse Mortgage Capital Certificates (Class A3) 6.01 15/09/2039 9,186,222 1.37
9,548,395 CWMBS Incorporated 5.71 20/11/2035 3,736,578 0.56
227,547 CWMBS Incorporated 3.13 25/05/2035 2,676 —
127,427 Federal Home Loan Mortgage Corporation 0.00 15/02/2037 63,414 0.01
170,875 Federal Home Loan Mortgage Corporation 0.00 15/11/2036 75,445 0.01
102,788 Federal Home Loan Mortgage Corporation 0.00 15/05/2035 41,622 0.01
211,714 Federal Home Loan Mortgage Corporation 0.00 15/09/2036 100,986 0.02
215,230 Federal Home Loan Mortgage Corporation 0.03 25/05/2043 319 —
234,603 Federal Home Loan Mortgage Corporation 0.28 25/05/2043 990 —
THE ACCOMPANYING NOTES ARE AN INTEGRAL PART OF THESE FINANCIAL STATEMENTS.
ASSET-BACKED SECURITIES (3.44%)
PrincipalAmounts
CouponRate %
MaturityDates
ValueGBP
% ofFund
PrincipalAmounts
CouponRate %
MaturityDates
ValueGBP
% ofFund
COLLATERALISED MORTGAGE OBLIGATIONS (Continued)
PrincipalAmounts
CouponRate %
MaturityDates
ValueGBP
% ofFund

52
180,989 Federal Home Loan Mortgage Corporation 0.37 25/05/2043 £1,165 —
250,008 Federal Home Loan Mortgage Corporation 0.52 25/05/2043 2,005 —
4,501,369 Federal Home Loan Mortgage Corporation 3.29 15/08/2037 146,733 0.02
24,579,783 Federal Home Loan Mortgage Corporation 3.48 15/11/2036 802,090 0.12
16,864,042 Federal Home Loan Mortgage Corporation 3.68 15/04/2035 523,034 0.08
12,743,775 Federal Home Loan Mortgage Corporation 3.78 15/02/2038 512,830 0.08
3,032,524 Federal Home Loan Mortgage Corporation 3.93 15/10/2037 117,300 0.02
4,269,575 Federal Home Loan Mortgage Corporation 3.94 15/05/2037 201,483 0.03
6,075,298 Federal Home Loan Mortgage Corporation 3.98 15/09/2037 254,217 0.04
3,297,434 Federal Home Loan Mortgage Corporation 4.02 15/11/2036 140,274 0.02
6,426,402 Federal Home Loan Mortgage Corporation 4.10 15/05/2036 283,009 0.04
816,102 Federal Home Loan Mortgage Corporation 4.18 15/09/2035 35,670 0.01
2,052,503 Federal Home Loan Mortgage Corporation 4.20 15/10/2037 78,801 0.01
456,260 Federal Home Loan Mortgage Corporation 4.26 15/10/2035 18,093 —
15,337,025 Federal Home Loan Mortgage Corporation 4.28 15/05/2035 554,677 0.08
22,171,166 Federal Home Loan Mortgage Corporation 4.73 15/08/2036 966,346 0.14
20,981,952 Federal Home Loan Mortgage Corporation 6.13 15/05/2037 1,322,425 0.20
144,232 Federal Home Loan Mortgage Corporation 10.70 15/08/2035 71,805 0.01
189,449 Federal Home Loan Mortgage Corporation 11.58 15/10/2036 98,752 0.01
79,768 Federal Home Loan Mortgage Corporation 12.87 15/05/2036 40,779 0.01
1,083,702 Federal Home Loan Mortgage Corporation 17.28 15/09/2036 217,059 0.03
2,468,993 Federal Home Loan Mortgage Corporation 18.14 15/09/2032 1,255,264 0.19
1,708,388 Federal Home Loan Mortgage Corporation 18.72 15/04/2032 937,659 0.14
166,008 Federal Home Loan Mortgage Corporation 20.74 15/05/2036 97,877 0.01
104,456 Federal Home Loan Mortgage Corporation 28.06 15/07/2037 £69,681 0.01
92,898 Federal Home Loan Mortgage Corporation 28.87 15/08/2037 61,412 0.01
219,727 Federal Home Loan Mortgage Corporation 0.00 15/09/2035 96,377 0.01
82,945 Federal Home Loan Mortgage Corporation 0.00 15/03/2036 39,839 0.01
168,073 Federal Home Loan Mortgage Corporation 0.00 15/11/2036 87,159 0.01
95,154 Federal Home Loan Mortgage Corporation 0.00 15/08/2035 39,862 0.01
78,624 Federal Home Loan Mortgage Corporation 0.00 15/11/2034 36,485 0.01
61,113 Federal Home Loan Mortgage Corporation 0.00 15/10/2036 27,589 —
42,144,104 Federal Home Loan Mortgage Corporation 3.93 15/11/2037 1,679,080 0.25
265,460 Federal Home Loan Mortgage Corporation 4.18 15/09/2030 9,709 —
204,671 Federal National*Mortgage Association 0.00 25/10/2035 89,359 0.01
245,435 Federal National*Mortgage Association 0.35 25/09/2042 1,466 —
234,419 Federal National*Mortgage Association 0.37 25/09/2042 1,283 —
1,772,887 Federal National*Mortgage Association 0.45 25/12/2041 10,724 —
230,798 Federal National*Mortgage Association 0.47 25/07/2042 1,603 —
160,351 Federal National*Mortgage Association 0.68 25/09/2042 1,589 —
318,102 Federal National*Mortgage Association 0.81 25/07/2042 4,310 —
434,546 Federal National*Mortgage Association 1.64 25/12/2042 11,334 —
193,209 Federal National*Mortgage Association 1.92 25/06/2043 5,312 —
129,056 Federal National*Mortgage Association 1.94 25/06/2043 3,613 —
226,910 Federal National*Mortgage Association 2.22 25/06/2043 7,188 —
1,505,526 Federal National*Mortgage Association 3.62 25/09/2035 45,910 0.01
38,665,218 Federal National*Mortgage Association 3.62 25/10/2025 1,224,977 0.18
3,627,444 Federal National*Mortgage Association 3.74 25/03/2038 130,297 0.02
305,055 Federal National*Mortgage Association 3.96 25/04/2037 12,814 —
524,423 Federal National*Mortgage Association 3.97 25/02/2038 20,751 —
1,926,078 Federal National*Mortgage Association 3.97 25/08/2036 86,319 0.01
9,679,426 Federal National*Mortgage Association 3.98 25/11/2037 372,482 0.06
12,678,405 Federal National*Mortgage Association 4.12 25/05/2035 499,710 0.07
Putnam Global Fixed Income Alpha Fund S2
THE ACCOMPANYING NOTES ARE AN INTEGRAL PART OF THESE FINANCIAL STATEMENTS.
COLLATERALISED MORTGAGE OBLIGATIONS (Continued)
PrincipalAmounts
CouponRate %
MaturityDates
ValueGBP
% ofFund
COLLATERALISED MORTGAGE OBLIGATIONS (Continued)
PrincipalAmounts
CouponRate %
MaturityDates
ValueGBP
% ofFund

53
6,755,872 Federal National*Mortgage Association 4.14 25/11/2036 £317,784 0.05
3,802,258 Federal National*Mortgage Association 4.21 25/11/2036 166,812 0.02
6,287,054 Federal National*Mortgage Association 4.22 25/03/2037 290,025 0.04
5,580,960 Federal National*Mortgage Association 4.22 25/04/2035 250,303 0.04
24,589,166 Federal National*Mortgage Association 4.24 25/06/2035 970,823 0.15
3,835,027 Federal National*Mortgage Association 4.26 25/01/2037 179,675 0.03
3,999,324 Federal National*Mortgage Association 4.29 25/05/2037 193,891 0.03
31,702,030 Federal National*Mortgage Association 4.31 25/04/2037 1,519,371 0.23
14,733,611 Federal National*Mortgage Association 4.32 25/05/2035 589,017 0.09
7,432,292 Federal National*Mortgage Association 4.50 25/03/2038 395,704 0.06
7,712,089 Federal National*Mortgage Association 4.57 25/12/2033 374,472 0.06
7,481,301 Federal National*Mortgage Association 4.67 25/07/2033 351,839 0.05
5,742,458 Federal National*Mortgage Association 4.72 25/07/2036 300,613 0.04
733,314 Federal National*Mortgage Association 4.75 25/01/2036 34,871 0.01
1,871,171 Federal National*Mortgage Association 5.00 25/08/2037 220,374 0.03
1,073,730 Federal National*Mortgage Association 5.00 25/10/2037 129,617 0.02
4,250,111 Federal National*Mortgage Association 5.00 25/03/2038 496,336 0.07
4,268,103 Federal National*Mortgage Association 5.00 25/04/2023 286,874 0.04
13,516,853 Federal National*Mortgage Association 5.07 25/02/2038 851,212 0.13
1,423,092 Federal National*Mortgage Association 5.12 25/04/2034 89,381 0.01
1,110,551 Federal National*Mortgage Association 5.22 25/07/2034 63,008 0.01
151,914,422 Federal National*Mortgage Association 5.50 25/05/2037 19,849,433 2.96
1,170,092 Federal National*Mortgage Association 5.50 25/01/2038 131,360 0.02
3,771,287 Federal National*Mortgage Association 5.50 25/04/2038 435,330 0.07
881,109 Federal National*Mortgage Association 6.00 25/10/2022 69,421 0.01
899,226 Federal National*Mortgage Association 6.00 25/11/2037 103,236 0.02
11,930,115 Federal National*Mortgage Association 6.00 25/03/2038 1,268,857 0.19
9,671,331 Federal National*Mortgage Association 6.00 25/05/2038 1,120,813 0.17
1,568,722 Federal National*Mortgage Association 6.50 25/02/2037 183,561 0.03
2,085,899 Federal National*Mortgage Association 6.50 25/03/2037 237,062 0.04
5,561,848 Federal National*Mortgage Association 6.50 25/04/2038 613,488 0.09
4,637,551 Federal National*Mortgage Association 6.50 25/05/2038 494,711 0.07
1,431,292 Federal National*Mortgage Association 6.50 25/08/2038 148,253 0.02
93,790 Federal National*Mortgage Association 10.67 25/08/2035 £47,278 0.01
97,441 Federal National*Mortgage Association 14.99 25/07/2036 50,816 0.01
190,772 Federal National*Mortgage Association 17.24 25/04/2035 108,004 0.02
172,674 Federal National*Mortgage Association 18.53 25/11/2036 96,788 0.01
3,742,124 Federal National*Mortgage Association 28.63 25/02/2037 2,121,318 0.32
4,063,088 Federal National* Mortgage Association 4.17 25/05/2034 194,300 0.03
2,165,587 Federal National*Mortgage Association 4.17 25/12/2036 96,528 0.01
9,711,114 Federal National*Mortgage Association 4.22 25/08/2034 407,309 0.06
17,345,968 Federal National*Mortgage Association 4.22 25/02/2035 688,547 0.10
14,875,955 Federal National*Mortgage Association 4.27 25/10/2034 711,839 0.11
71,229 Federal National*Mortgage Association 4.52 25/08/2035 3,168 —
7,422,721 Federal National*Mortgage Association 4.52 25/10/2029 322,961 0.05
8,993,939 Federal National*Mortgage Association 6.00 25/05/2036 1,185,598 0.18
4,854,337 Federal National*Mortgage Association 6.00 25/02/2038 540,033 0.08
45,178,248 Federal National*Mortgage Association 6.50 01/07/2036 6,022,985 0.90
1,772,595 Federal National*Mortgage Association 6.50 25/11/2037 181,114 0.03
5,588,864 Federal National* Mortgage Association 6.50 25/02/2038 593,469 0.09
1,307,822 Federal National*Mortgage Association 7.00 25/01/2038 126,007 0.02
1,291,380 Federal National*Mortgage Association 7.50 25/08/2037 126,198 0.02
1,141,182 Federal National*Mortgage Association 7.50 25/01/2038 98,357 0.01
890,743 Federal National*Mortgage Association (Class 1) 5.00 25/11/2037 107,930 0.02
6,134,370 Federal National*Mortgage Association (Class 1) 6.00 25/10/2038 668,758 0.10
1,819,877 Federal National*Mortgage Association (Class 10) 5.50 25/08/2037 219,164 0.03
1,022,002 Federal National*Mortgage Association (Class 10) 6.00 25/07/2038 114,002 0.02
872,477 Federal National*Mortgage Association (Class 101) 6.50 25/09/2022 68,877 0.01
759,301 Federal National*Mortgage Association (Class 102) 6.50 25/09/2022 59,561 0.01
1,435,970 Federal National*Mortgage Association (Class 11) 5.50 25/08/2037 171,135 0.03
922,904 Federal National*Mortgage Association (Class 11) 6.00 25/07/2038 105,122 0.02
1,400,863 Federal National*Mortgage Association (Class 12) 5.50 25/08/2037 167,372 0.03
Putnam Global Fixed Income Alpha Fund S2
THE ACCOMPANYING NOTES ARE AN INTEGRAL PART OF THESE FINANCIAL STATEMENTS.
COLLATERALISED MORTGAGE OBLIGATIONS (Continued)
PrincipalAmounts
CouponRate %
MaturityDates
ValueGBP
% ofFund
COLLATERALISED MORTGAGE OBLIGATIONS (Continued)
PrincipalAmounts
CouponRate %
MaturityDates
ValueGBP
% ofFund

54
1,410,669 Federal National*Mortgage Association (Class 13) 5.50 25/08/2037 £168,543 0.03
2,032,175 Federal National*Mortgage Association (Class 14) 5.50 25/09/2037 237,818 0.04
989,043 Federal National*Mortgage Association (Class 15) 5.50 25/09/2037 113,221 0.02
1,705,269 Federal National*Mortgage Association (Class 15) 6.50 25/12/2037 179,110 0.03
970,031 Federal National*Mortgage Association (Class 16) 5.50 25/09/2037 115,897 0.02
1,468,455 Federal National*Mortgage Association (Class 16) 6.50 25/11/2037 156,745 0.02
4,071,399 Federal National*Mortgage Association (Class 17) 5.50 25/01/2038 471,947 0.07
1,736,278 Federal National*Mortgage Association (Class 17) 6.50 25/12/2037 185,504 0.03
5,235,536 Federal National*Mortgage Association (Class 18) 5.50 25/01/2038 610,034 0.09
1,583,619 Federal National*Mortgage Association (Class 18) 6.50 25/12/2037 167,766 0.03
4,842,024 Federal National*Mortgage Association (Class 19) 5.50 25/01/2038 564,182 0.08
1,399,779 Federal National*Mortgage Association (Class 19) 6.50 25/02/2038 142,881 0.02
876,056 Federal National*Mortgage Association (Class 2) 5.00 25/11/2037 106,062 0.02
7,857,436 Federal National*Mortgage Association (Class 2) 6.00 25/04/2038 823,094 0.12
3,117,520 Federal National*Mortgage Association (Class 20) 5.50 25/07/2037 370,731 0.06
2,938,890 Federal National*Mortgage Association (Class 21) 5.50 25/07/2037 349,489 0.05
1,479,743 Federal National*Mortgage Association (Class 21) 7.00 25/12/2037 145,605 0.02
2,057,733 Federal National*Mortgage Association (Class 22) 5.50 25/07/2037 244,086 0.04
1,906,133 Federal National*Mortgage Association (Class 23) 5.50 25/07/2037 226,103 0.03
1,443,191 Federal National*Mortgage Association (Class 23) 7.00 25/12/2037 135,424 0.02
1,565,078 Federal National*Mortgage Association (Class 24) 5.50 25/07/2037 179,462 0.03
933,534 Federal National*Mortgage Association (Class 24) 7.00 25/03/2038 86,990 0.01
1,027,308 Federal National*Mortgage Association (Class 25) 7.00 25/03/2038 96,399 0.01
1,268,793 Federal National*Mortgage Association (Class 26) 5.50 25/07/2037 151,264 0.02
1,004,818 Federal National*Mortgage Association (Class 27) 5.50 25/07/2037 £117,984 0.02
842,645 Federal National*Mortgage Association (Class 27) 7.50 25/12/2037 72,626 0.01
5,855,248 Federal National*Mortgage Association (Class 28) 6.00 25/01/2038 682,184 0.10
805,229 Federal National*Mortgage Association (Class 28) 7.50 25/12/2037 69,402 0.01
8,163,544 Federal National*Mortgage Association (Class 3) 5.50 25/09/2037 939,017 0.14
3,052,087 Federal National*Mortgage Association (Class 3) 5.50 25/12/2037 349,243 0.05
6,598,579 Federal National*Mortgage Association (Class 30) 6.00 25/01/2038 776,396 0.12
5,800,283 Federal National*Mortgage Association (Class 31) 6.00 25/01/2038 682,468 0.10
4,584,696 Federal National*Mortgage Association (Class 32) 6.00 25/01/2038 543,807 0.08
4,068,054 Federal National*Mortgage Association (Class 33) 6.00 25/01/2038 482,525 0.07
1,740,920 Federal National*Mortgage Association (Class 34) 6.00 25/12/2037 202,219 0.03
1,539,876 Federal National*Mortgage Association (Class 35) 6.00 25/12/2037 178,404 0.03
1,405,399 Federal National*Mortgage Association (Class 36) 6.00 25/12/2037 163,598 0.02
1,826,660 Federal National*Mortgage Association (Class 37) 6.00 25/01/2038 218,315 0.03
830,456 Federal National*Mortgage Association (Class 38) 6.00 25/12/2037 96,255 0.01
7,286,417 Federal National*Mortgage Association (Class 4) 5.50 25/09/2037 843,222 0.13
1,619,304 Federal National*Mortgage Association (Class 4) 5.50 25/12/2037 188,614 0.03
9,008,027 Federal National*Mortgage Association (Class 40) 6.00 25/04/2038 1,038,625 0.16
8,282,927 Federal National*Mortgage Association (Class 41) 6.00 25/04/2038 954,192 0.14
6,017,753 Federal National*Mortgage Association (Class 42) 6.00 25/04/2038 696,864 0.10
5,500,097 Federal National*Mortgage Association (Class 43) 6.00 25/04/2038 638,848 0.10
5,001,635 Federal National*Mortgage Association (Class 44) 6.00 25/04/2038 579,196 0.09
4,034,241 Federal National*Mortgage Association (Class 45) 6.00 25/04/2038 473,034 0.07
3,487,257 Federal National*Mortgage Association (Class 46) 6.00 25/04/2038 408,722 0.06
Putnam Global Fixed Income Alpha Fund S2
THE ACCOMPANYING NOTES ARE AN INTEGRAL PART OF THESE FINANCIAL STATEMENTS.
COLLATERALISED MORTGAGE OBLIGATIONS (Continued)
PrincipalAmounts
CouponRate %
MaturityDates
ValueGBP
% ofFund
COLLATERALISED MORTGAGE OBLIGATIONS (Continued)
PrincipalAmounts
CouponRate %
MaturityDates
ValueGBP
% ofFund

55
3,142,755 Federal National*Mortgage Association (Class 47) 6.00 25/04/2038 £368,345 0.06
2,803,487 Federal National*Mortgage Association (Class 48) 6.00 25/04/2038 329,565 0.05
1,647,379 Federal National*Mortgage Association (Class 49) 6.00 25/06/2037 189,943 0.03
4,690,352 Federal National*Mortgage Association (Class 5) 5.50 25/09/2037 542,792 0.08
1,037,632 Federal National*Mortgage Association (Class 5) 5.50 25/12/2037 122,782 0.02
11,553,193 Federal National*Mortgage Association (Class 5) 6.00 25/04/2038 1,286,220 0.19
1,993,398 Federal National*Mortgage Association (Class 50) 6.00 25/12/2037 228,040 0.03
1,713,277 Federal National*Mortgage Association (Class 51) 6.00 25/06/2037 195,995 0.03
1,485,593 Federal National*Mortgage Association (Class 52) 6.00 25/04/2038 174,639 0.03
913,531 Federal National*Mortgage Association (Class 53) 6.00 25/06/2037 105,559 0.02
676,213 Federal National*Mortgage Association (Class 54) 6.00 25/06/2037 78,103 0.01
874,148 Federal National*Mortgage Association (Class 55) 6.00 25/06/2037 101,534 0.02
744,427 Federal National*Mortgage Association (Class 56) 6.00 25/06/2037 86,728 0.01
1,257,836 Federal National*Mortgage Association (Class 57) 6.00 25/06/2037 145,659 0.02
2,448,556 Federal National*Mortgage Association (Class 58) 6.50 25/08/2037 276,693 0.04
1,764,889 Federal National*Mortgage Association (Class 59) 6.50 25/08/2037 195,984 0.03
4,278,016 Federal National*Mortgage Association (Class 6) 5.50 25/09/2037 496,573 0.07
2,964,136 Federal National*Mortgage Association (Class 6) 6.00 25/12/2037 342,083 0.05
5,989,241 Federal National*Mortgage Association (Class 6) 6.00 25/10/2038 570,414 0.09
4,991,749 Federal National*Mortgage Association (Class 60) 6.50 25/10/2037 578,864 0.09
1,601,729 Federal National*Mortgage Association (Class 61) 6.50 25/08/2037 178,508 0.03
1,641,293 Federal National*Mortgage Association (Class 62) 6.50 25/10/2037 186,706 0.03
1,476,668 Federal National*Mortgage Association (Class 63) 6.50 25/09/2037 164,125 0.02
2,221,910 Federal National* Mortgage Association (Class 64) 6.50 25/09/2037 254,762 0.04
1,633,160 Federal National* Mortgage Association (Class 65) 6.50 25/08/2037 £188,896 0.03
1,669,927 Federal National* Mortgage Association (Class 66) 6.50 25/08/2037 192,562 0.03
1,438,775 Federal National* Mortgage Association (Class 67) 6.50 25/09/2037 163,092 0.02
864,654 Federal National* Mortgage Association (Class 68) 6.50 25/09/2037 98,316 0.01
1,097,073 Federal National* Mortgage Association (Class 69) 6.50 25/10/2037 124,799 0.02
4,307,942 Federal National* Mortgage Association (Class 7) 5.50 25/09/2037 498,538 0.07
5,864,615 Federal National* Mortgage Association (Class 7) 6.00 25/01/2038 710,330 0.11
3,122,388 Federal National* Mortgage Association (Class 70) 6.50 25/01/2037 355,172 0.05
1,468,425 Federal National* Mortgage Association (Class 71) 6.50 25/12/2036 165,706 0.02
5,533,137 Federal National* Mortgage Association (Class 72) 6.50 25/05/2037 643,838 0.10
1,739,352 Federal National* Mortgage Association (Class 74) 6.50 25/01/2037 197,240 0.03
1,365,692 Federal National* Mortgage Association (Class 75) 6.50 25/12/2036 157,953 0.02
1,209,214 Federal National* Mortgage Association (Class 77) 6.50 25/05/2037 138,337 0.02
1,243,138 Federal National* Mortgage Association (Class 78) 6.50 25/05/2037 141,844 0.02
1,229,929 Federal National* Mortgage Association (Class 79) 7.00 25/08/2037 134,216 0.02
1,837,726 Federal National* Mortgage Association (Class 8) 5.50 25/08/2037 221,313 0.03
2,451,151 Federal National* Mortgage Association (Class 80) 7.00 25/08/2037 272,407 0.04
1,362,831 Federal National* Mortgage Association (Class 81) 7.00 25/08/2037 142,713 0.02
1,404,945 Federal National* Mortgage Association (Class 82) 7.00 25/08/2037 143,801 0.02
1,378,990 Federal National* Mortgage Association (Class 83) 7.00 25/08/2037 145,302 0.02
1,355,387 Federal National* Mortgage Association (Class 84) 7.00 25/09/2037 144,176 0.02
817,751 Federal National* Mortgage Association (Class 85) 7.00 25/09/2037 85,877 0.01
861,412 Federal National* Mortgage Association (Class 86) 7.00 25/09/2037 90,463 0.01
1,208,030 Federal National* Mortgage Association (Class 88) 7.50 25/09/2037 113,926 0.02
Putnam Global Fixed Income Alpha Fund S2
THE ACCOMPANYING NOTES ARE AN INTEGRAL PART OF THESE FINANCIAL STATEMENTS.
COLLATERALISED MORTGAGE OBLIGATIONS (Continued)
PrincipalAmounts
CouponRate %
MaturityDates
ValueGBP
% ofFund
COLLATERALISED MORTGAGE OBLIGATIONS (Continued)
PrincipalAmounts
CouponRate %
MaturityDates
ValueGBP
% ofFund

56
989,608 Federal National* Mortgage Association (Class 89) 7.50 25/09/2037 £93,726 0.01
1,919,151 Federal National* Mortgage Association (Class 9) 5.50 25/08/2037 231,119 0.03
738,660 Federal National* Mortgage Association (Class 90) 8.00 25/08/2037 65,146 0.01
672,426 Federal National* Mortgage Association (Class 91) 8.00 25/08/2037 59,136 0.01
1,433,334 Federal National* Mortgage Association (Class 92) 5.00 25/10/2022 113,465 0.02
1,013,930 Federal National* Mortgage Association (Class 93) 5.00 25/10/2022 81,718 0.01
1,418,926 Federal National* Mortgage Association (Class 94) 5.50 25/08/2022 116,088 0.02
2,686,393 Federal National* Mortgage Association (Class 95) 5.50 25/09/2022 223,512 0.03
1,591,719 Federal National* Mortgage Association (Class 96) 5.50 25/08/2022 124,184 0.02
1,399,471 Federal National* Mortgage Association (Class 97) 5.50 25/09/2022 112,116 0.02
1,660,078 Federal National* Mortgage Association (Class 98) 6.00 25/09/2022 134,373 0.02
945,439 Federal National* Mortgage Association (Class 99) 6.00 25/09/2022 74,347 0.01
5,000,000 GE Capital Commercial Mortgage Corporation 5.52 10/03/2044 2,468,511 0.37
6,500,000 GE Capital Commercial Mortgage Corporation 5.48 10/12/2049 3,181,191 0.48
16,000 GE Capital Commercial Mortgage Corporation 5.42 10/12/2049 7,805 —
787,850 Government National Mortgage Association 0.00 20/06/2037 352,441 0.05
134,344 Government National Mortgage Association 0.00 20/11/2037 79,120 0.01
21,090,452 Government National Mortgage Association 3.52 20/03/2034 430,523 0.06
21,011,492 Government National Mortgage Association 3.62 20/01/2035 666,673 0.10
9,015,775 Government National Mortgage Association 3.68 16/10/2037 278,464 0.04
7,430,106 Government National Mortgage Association 3.70 20/02/2035 263,286 0.04
117,660 Government National Mortgage Association 3.73 16/05/2037 4,511 —
5,738,783 Government National Mortgage Association 3.77 20/01/2035 201,224 0.03
14,622,458 Government National Mortgage Association 3.81 20/03/2036 528,616 0.08
9,939,643 Government National Mortgage Association 3.82 20/09/2035 £381,990 0.06
2,112,388 Government National Mortgage Association 3.89 16/09/2035 75,894 0.01
23,531,647 Government National Mortgage Association 3.92 20/01/2032 683,916 0.10
34,171,180 Government National Mortgage Association 3.93 16/05/2038 1,233,434 0.18
9,126,441 Government National Mortgage Association 3.98 20/02/2036 310,728 0.05
10,779,304 Government National Mortgage Association 4.00 20/02/2038 431,516 0.06
8,538,996 Government National Mortgage Association 4.02 20/01/2037 305,239 0.05
19,260,565 Government National Mortgage Association 4.03 16/01/2038 693,813 0.10
21,175,439 Government National Mortgage Association 4.04 20/03/2037 801,062 0.12
75,975,939 Government National Mortgage Association 4.05 16/01/2038 2,760,474 0.41
7,975,965 Government National Mortgage Association 4.10 16/05/2037 295,117 0.04
92,271,272 Government National Mortgage Association 4.21 20/06/2037 3,749,185 0.56
6,739,949 Government National Mortgage Association 4.22 20/04/2032 206,059 0.03
7,972,388 Government National Mortgage Association 4.23 16/03/2034 361,048 0.05
9,264,186 Government National Mortgage Association 4.25 20/09/2037 431,948 0.06
7,798,003 Government National Mortgage Association 4.27 20/07/2037 290,185 0.04
7,676,475 Government National Mortgage Association 4.32 20/12/2036 318,230 0.05
1,161,000 Government National Mortgage Association 4.43 16/10/2035 46,391 0.01
4,537,481 Government National Mortgage Association 4.63 16/08/2036 224,766 0.03
5,750,384 Government National Mortgage Association 4.73 16/04/2034 185,403 0.03
6,407,225 Government National Mortgage Association 4.78 16/08/2034 311,675 0.05
3,350,503 Government National Mortgage Association 4.82 20/06/2032 171,092 0.03
1,204,971 Government National Mortgage Association 4.90 20/11/2036 46,949 0.01
3,720,317 Government National Mortgage Association 5.30 20/03/2038 177,463 0.03
Putnam Global Fixed Income Alpha Fund S2
THE ACCOMPANYING NOTES ARE AN INTEGRAL PART OF THESE FINANCIAL STATEMENTS.
COLLATERALISED MORTGAGE OBLIGATIONS (Continued)
PrincipalAmounts
CouponRate %
MaturityDates
ValueGBP
% ofFund
COLLATERALISED MORTGAGE OBLIGATIONS (Continued)
PrincipalAmounts
CouponRate %
MaturityDates
ValueGBP
% ofFund

57
1,958,965 Government National Mortgage Association 7.50 16/04/2037 £246,748 0.04
158,000 Government National Mortgage Association 19.88 20/04/2035 91,795 0.01
77,679 Government National Mortgage Association 24.65 20/07/2036 47,053 0.01
102,174 Government National Mortgage Association 24.71 20/07/2037 61,047 0.01
102,174 Government National Mortgage Association 24.95 16/07/2037 61,419 0.01
118,711 Government National Mortgage Association 25.19 20/07/2037 71,694 0.01
261,868 Government National Mortgage Association 25.31 20/07/2037 161,288 0.02
125,031 Government National Mortgage Association 31.91 16/06/2037 83,686 0.01
170,411 Government National Mortgage Association 44.62 20/05/2037 134,162 0.02
761,047 Government National Mortgage Association 0.00 20/02/2037 341,671 0.05
41,729,592 Government National Mortgage Association 4.02 20/06/2036 1,653,053 0.25
38,070,921 Government National Mortgage Association 4.27 20/12/2034 1,667,565 0.25
1,640,418 Government National Mortgage Association 4.32 20/11/2035 68,252 0.01
18,920,480 Government National Mortgage Association 4.32 20/03/2037 777,342 0.12
3,985,347 Government National Mortgage Association 4.90 20/12/2036 197,017 0.03
79,568,432 Government National Mortgage Association (Class S) 4.02 20/05/2037 2,874,236 0.43
44,417,840 Government National Mortgage Association (Class SA) 3.99 20/06/2037 1,599,014 0.24
4,972,764 Government National Mortgage Association (Class SA) 4.86 20/11/2036 212,767 0.03
4,947,358 Government National Mortgage Association (Class SB) 4.86 20/11/2036 228,263 0.03
121,807,116 Government National Mortgage Association (Class SG) 3.99 20/06/2037 4,354,183 0.65
70,130,735 Government National Mortgage Association (Class SG) 4.02 20/05/2037 2,824,138 0.42
158,357 Greenpoint Mortgage Funding Trust 4.04 25/06/2045 2,242 —
15,000,000 GS Mortgage Securities Corporation II 5.78 10/08/2045 7,390,729 1.10
19,000 GS Mortgage Securities Corporation II 5.51 10/04/2038 9,513 —
10,864,000 Holmes Financing PLC 2.79 15/07/2040 5,306,638 0.79
9,750,745 HSI Asset Loan Obligation 6.14 25/01/2037 £4,035,905 0.60
2,267,205 IndyMac Index Mortgage Loan Trust 6.33 25/09/2036 907,701 0.14
7,311,226 IndyMac Index Mortgage Loan Trust 6.08 25/04/2037 2,897,787 0.43
7,359,194 IndyMac Index Mortgage Loan Trust 6.25 25/08/2037 2,916,799 0.44
17,307,593 IndyMac Index Mortgage Loan Trust 5.65 25/06/2037 5,822,503 0.87
10,562,449 IndyMac Index Mortgage Loan Trust 5.64 25/01/2036 3,975,282 0.59
6,139,235 IndyMac Index Mortgage Loan Trust 5.46 25/05/2035 2,619,308 0.39
3,717,232 JPMorgan Alternative Loan Trust 6.07 25/07/2036 1,436,204 0.21
5,138,531 JPMorgan Alternative Loan Trust 5.89 25/03/2036 2,062,425 0.31
3,655,486 JPMorgan Alternative Loan Trust 2.55 25/11/2036 1,342,766 0.20
10,000,000 JPMorgan Chase Commercial MortgageSecurities Corporation 6.01 15/06/2049 4,839,150 0.72
59,000,000 JPMorgan Chase Commercial Mortgage Securities Corporation 5.32 15/01/2049 28,534,669 4.26
305,418,990 JPMorgan Chase Commercial MortgageSecurities Corporation 0.65 12/02/2051 4,177,926 0.62
295,889,926 LB-UBS Commercial Mortgage Trust 0.18 15/04/2040 1,299,514 0.19
130,482 Lehman Mortgage*Trust 4.67 25/09/2036 5,140 —
4,528,401 MASTER Alternative Loans Trust 6.25 25/07/2036 1,703,944 0.25
45,000 Merrill Lynch Countrywide Commercial Mortgage Trust 6.16 12/08/2049 21,790 —
11,648,405 Merrill Lynch Mortgage Trust 5.71 12/02/2051 5,685,588 0.85
9,168,022 Merrill Lynch Mortgage Trust 5.43 12/02/2051 4,479,777 0.67
31,172,354 Merrill Lynch Mortgage Trust 4.53 12/06/2050 15,223,344 2.27
121,268,000 Merrill Lynch Mortgage Trust (Class X) 5.71 12/02/2051 1,726,771 0.26
14,534,000 Morgan Stanley Capital I Incorporated 5.62 12/12/2049 7,137,206 1.07
8,333,000 Morgan StanleyCapital I Incorporated 5.61 12/03/2044 4,142,921 0.62
1,752,000 Permanent Master Issuer PLC 2.79 15/10/2033 846,027 0.13
7,561,819 Residential Asset Securitization Trust 6.00 25/05/2037 3,395,459 0.51
2,534,547 Structured Adjustable Rate Mortgage Loan Trust 5.69 25/10/2036 998,585 0.15
73,151,696 Structured Asset Securities Corporation 2.95 25/11/2037 1,991,950 0.30
6,275,000 Wachovia Bank Commercial Mortgage Trust 6.10 15/02/2051 3,056,686 0.46
63,666,000 Wachovia Bank Commercial Mortgage Trust 5.25 15/12/2043 31,188,561 4.66
Total Collateralised Mortgage Obligations £425,955,089 63.65
Putnam Global Fixed Income Alpha Fund S2
THE ACCOMPANYING NOTES ARE AN INTEGRAL PART OF THESE FINANCIAL STATEMENTS.
COLLATERALISED MORTGAGE OBLIGATIONS (Continued)
PrincipalAmounts
CouponRate %
MaturityDates
ValueGBP
% ofFund
COLLATERALISED MORTGAGE OBLIGATIONS (Continued)
PrincipalAmounts
CouponRate %
MaturityDates
ValueGBP
% ofFund

58
1,926 Lehman Brothers*Holdings Incorporated 7.25 04/01/2013 £777,309 0.12
Total Convertible Preferred Stocks £777,309 0.12
CORPORATE BONDS & NOTES (22.28%)
1,005,000 Allstate Life Global Funding Trusts 5.38 30/04/2013 £502,237 0.08
5,902,000 AmerisourceBergen Corporation 5.63 15/09/2012 2,943,230 0.44
3,920,000 Arrow Electronics Incorporated 9.15 01/10/2010 2,116,432 0.32
3,395,000 AT&T Incorporated 5.60 15/05/2018 1,664,008 0.25
2,115,000 Banco Nacional de Desenvolvimento Economico e Social 6.37 16/06/2018 1,055,802 0.16
1,625,000 BankAmerica Capital III 3.28 15/01/2027 644,166 0.10
1,775,000 Barclays Bank PLC 7.70 29/04/2049 898,022 0.13
2,910,000 Berry Plastics Corporation 7.57 15/02/2015 1,397,915 0.21
5,610,000 Best Buy Co. Incorporated 6.75 15/07/2013 2,833,356 0.42
6,345,000 Block Financial Corporation 5.13 30/10/2014 2,923,857 0.44
600,000 Capital One Financial Corporation 2.98 10/09/2009 280,974 0.04
1,370,000 Cardinal Health Incorporated 5.65 15/06/2012 692,941 0.10
1,985,000 CCH II LLC 10.25 15/09/2010 961,030 0.14
760,000 Centennial Communications Corporation 10.00 01/01/2013 387,016 0.06
2,660,000 Centennial Communications Corporation 8.45 01/01/2013 1,287,829 0.19
2,000,000 CenturyTel Incorporated 5.50 01/04/2013 945,877 0.14
2,249,000 Ceva Group PLC 8.5 01/12/2014 1,273,232 0.19
1,530,000 CNA Financial Corporation 6.00 15/08/2011 770,964 0.12
3,330,000 Computer Sciences Corporation 6.50 15/03/2018 1,678,771 0.25
2,040,000 Countrywide Financial Corporation 2.87 05/01/2009 1,003,456 0.15
6,590,000 Cox Communications Incorporated 4.63 15/01/2010 3,287,997 0.49
3,015,000 Cricket Communications Incorporated 10.00 15/07/2015 1,482,390 0.22
767,000 D.R. Horton Incorporated 8.00 01/02/2009 383,847 0.06
1,134,000 D.R. Horton Incorporated 5.00 15/01/2009 558,267 0.08
4,140,000 Darden Restaurants Incorporated 6.20 15/10/2017 1,927,297 0.29
2,285,000 Electronic Data Systems Corporation 6.50 01/08/2013 1,176,143 0.18
2,640,000 Embarq Corporation 7.08 01/06/2016 1,257,953 0.19
1,830,000 Federated Department Stores Incorporated 6.63 01/04/2011 905,822 0.14
4,425,000 FelCor Lodging LP 8.50 01/01/2011 2,170,097 0.32
2,215,000 Fleet Capital Trust V 3.76 18/12/2028 913,483 0.14
1,990,000 Freeport-McMoRan Copper & Gold Incorporated 8.38 01/04/2017 £1,055,802 0.16
3,760,000 Freeport-McMoRan Copper & Gold Incorporated 5.88 01/04/2015 1,886,860 0.28
474,000 Gaz Capital SA 144A 7.34 11/04/2013 245,119 0.04
471,000 Gaz Capital SA 144A 8.15 11/04/2018 247,226 0.04
705,000 Gaz Capital SA 144A 6.51 07/03/2022 317,448 0.05
6,505,000 Genworth Financial Incorporated 6.52 22/05/2018 3,063,097 0.46
445,000 Genworth Life Institutional Funding Trust 5.88 03/05/2013 222,640 0.03
1,270,000 Georgia (Republic of ) 7.50 15/04/2013 634,114 0.09
3,425,000 Grupo Televisa SA 6.00 15/05/2018 1,670,177 0.25
6,740,000 Hanson PLC 6.13 15/08/2016 3,355,044 0.50
4,345,000 Hawker Beechcraft Acquisition Company LLC 9.75 01/04/2017 2,179,912 0.33
1,115,000 Hawker Beechcraft Acquisition Company LLC 8.50 01/04/2015 563,598 0.08
3,160,000 Hexion U.S. Finance Corporation/Hexion Nova Scotia Finance ULC 7.18 15/11/2014 1,315,874 0.20
563,000 Huntsman International LLC 7.88 15/11/2014 258,451 0.04
7,620,000 International Lease Finance Corporation 5.63 20/09/2013 3,383,380 0.51
2,285,000 International Lease Finance Corporation 6.63 15/11/2013 1,058,460 0.16
580,000 International Paper Company 7.40 15/06/2014 291,092 0.04
1,955,000 International Paper Company 7.95 15/06/2018 975,375 0.15
110,000,000 JPMorgan Chase & Co. 0.27 20/06/2011 2,366,446 0.35
4,780,000 Lexmark International Incorporated 5.90 01/06/2013 2,360,891 0.35
4,135,000 Liberty Media LLC 7.88 15/07/2009 2,094,743 0.31
3,170,000 Liberty Mutual Group 10.75 15/06/2058 1,551,279 0.23
8,750,000 Limited Brands Incorporated 6.13 01/12/2012 4,190,094 0.63
7,805,000 Marriott International Incorporated 4.63 15/06/2012 3,629,787 0.54
6,575,000 Masco Corporation 5.85 15/03/2017 2,989,926 0.45
937,000 Meritor Automotive Incorporated 6.80 15/02/2009 462,459 0.07
7,610,000 Merrill Lynch & Co. Incorporated 6.88 25/04/2018 3,628,219 0.54
500,000 MetLife Capital Trust 9.25 08/04/2068 283,524 0.04
2,110,000 Momentive Performance Materials Incorporated 9.75 01/12/2014 905,102 0.14
1,165,000 Motorola Incorporated 8.00 01/11/2011 596,875 0.09
11,915,000 Nextel Communications Incorporated 6.88 31/10/2013 5,051,262 0.75
2,640,000 ONEOK Partners LP 6.15 01/10/2016 1,305,212 0.20
3,655,000 Ono Finance II PLC 10.5 15/05/2014 2,070,659 0.31
10,675,000 Owens-Illinois Incorporated 7.50 15/05/2010 5,449,435 0.81
6,800,000 Pearson Dollar Finance Two PLC 6.25 06/05/2018 3,366,796 0.50
Putnam Global Fixed Income Alpha Fund S2
THE ACCOMPANYING NOTES ARE AN INTEGRAL PART OF THESE FINANCIAL STATEMENTS.
CONVERTIBLE PREFERRED STOCKS (0.12%)
PrincipalAmount
CouponRate %
MaturityDate
ValueGBP
% ofFund
PrincipalAmounts
CouponRate %
MaturityDates
ValueGBP
% ofFund
CORPORATE BONDS & NOTES (Continued)
PrincipalAmounts
CouponRate %
MaturityDates
ValueGBP
% ofFund
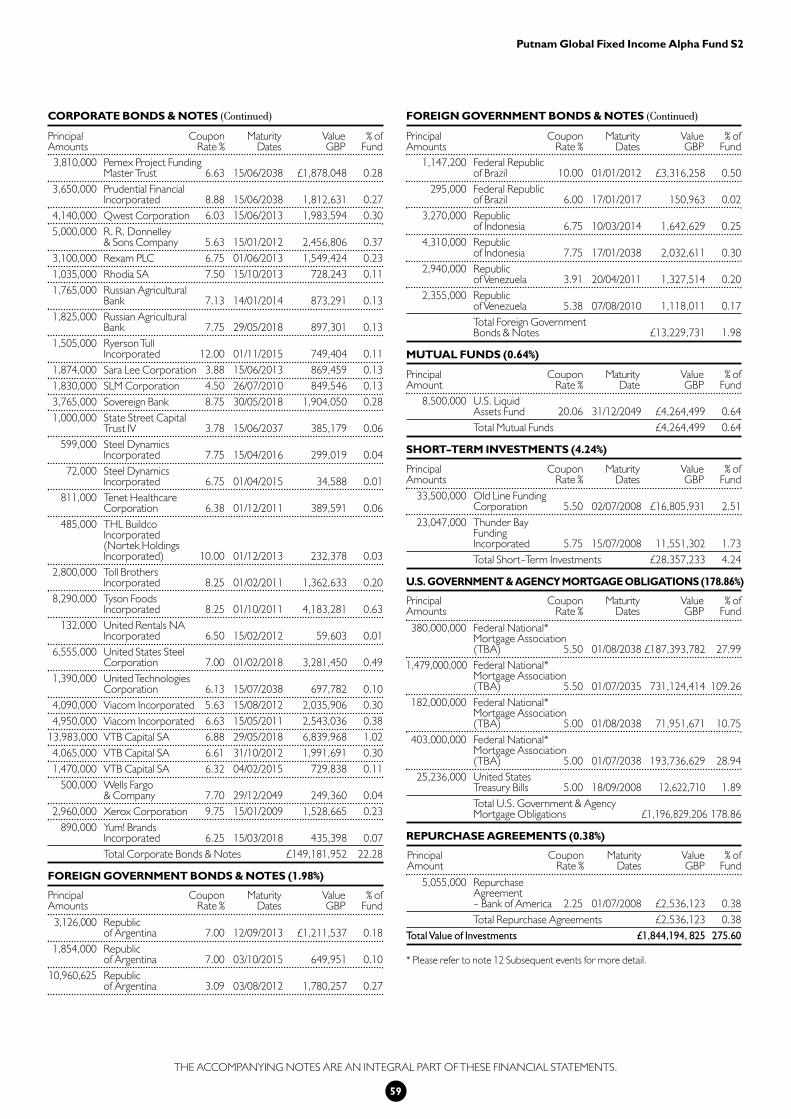
59
3,810,000 Pemex Project Funding Master Trust 6.63 15/06/2038 £1,878,048 0.28
3,650,000 Prudential Financial Incorporated 8.88 15/06/2038 1,812,631 0.27
4,140,000 Qwest Corporation 6.03 15/06/2013 1,983,594 0.30
5,000,000 R. R. Donnelley & Sons Company 5.63 15/01/2012 2,456,806 0.37
3,100,000 Rexam PLC 6.75 01/06/2013 1,549,424 0.23
1,035,000 Rhodia SA 7.50 15/10/2013 728,243 0.11
1,765,000 Russian Agricultural Bank 7.13 14/01/2014 873,291 0.13
1,825,000 Russian Agricultural Bank 7.75 29/05/2018 897,301 0.13
1,505,000 Ryerson Tull Incorporated 12.00 01/11/2015 749,404 0.11
1,874,000 Sara Lee Corporation 3.88 15/06/2013 869,459 0.13
1,830,000 SLM Corporation 4.50 26/07/2010 849,546 0.13
3,765,000 Sovereign Bank 8.75 30/05/2018 1,904,050 0.28
1,000,000 State Street Capital Trust IV 3.78 15/06/2037 385,179 0.06
599,000 Steel Dynamics Incorporated 7.75 15/04/2016 299,019 0.04
72,000 Steel Dynamics Incorporated 6.75 01/04/2015 34,588 0.01
811,000 Tenet Healthcare Corporation 6.38 01/12/2011 389,591 0.06
485,000 THL Buildco Incorporated (Nortek Holdings Incorporated) 10.00 01/12/2013 232,378 0.03
2,800,000 Toll Brothers Incorporated 8.25 01/02/2011 1,362,633 0.20
8,290,000 Tyson Foods Incorporated 8.25 01/10/2011 4,183,281 0.63
132,000 United Rentals NA Incorporated 6.50 15/02/2012 59,603 0.01
6,555,000 United States Steel Corporation 7.00 01/02/2018 3,281,450 0.49
1,390,000 United Technologies Corporation 6.13 15/07/2038 697,782 0.10
4,090,000 Viacom Incorporated 5.63 15/08/2012 2,035,906 0.30
4,950,000 Viacom Incorporated 6.63 15/05/2011 2,543,036 0.38
13,983,000 VTB Capital SA 6.88 29/05/2018 6,839,968 1.02
4,065,000 VTB Capital SA 6.61 31/10/2012 1,991,691 0.30
1,470,000 VTB Capital SA 6.32 04/02/2015 729,838 0.11
500,000 Wells Fargo & Company 7.70 29/12/2049 249,360 0.04
2,960,000 Xerox Corporation 9.75 15/01/2009 1,528,665 0.23
890,000 Yum! Brands Incorporated 6.25 15/03/2018 435,398 0.07
Total Corporate Bonds & Notes £149,181,952 22.28
FOREIGN GOVERNMENT BONDS & NOTES (1.98%)
3,126,000 Republic of Argentina 7.00 12/09/2013 £1,211,537 0.18
1,854,000 Republic of Argentina 7.00 03/10/2015 649,951 0.10
10,960,625 Republic of Argentina 3.09 03/08/2012 1,780,257 0.27
1,147,200 Federal Republic of Brazil 10.00 01/01/2012 £3,316,258 0.50
295,000 Federal Republic of Brazil 6.00 17/01/2017 150,963 0.02
3,270,000 Republic of Indonesia 6.75 10/03/2014 1,642,629 0.25
4,310,000 Republic of Indonesia 7.75 17/01/2038 2,032,611 0.30
2,940,000 Republic of Venezuela 3.91 20/04/2011 1,327,514 0.20
2,355,000 Republic of Venezuela 5.38 07/08/2010 1,118,011 0.17
Total Foreign Government Bonds & Notes £13,229,731 1.98
MUTUAL FUNDS (0.64%)
8,500,000 U.S. Liquid Assets Fund 20.06 31/12/2049 £4,264,499 0.64
Total Mutual Funds £4,264,499 0.64
SHORT-TERM INVESTMENTS (4.24%)
33,500,000 Old Line Funding Corporation 5.50 02/07/2008 £16,805,931 2.51
23,047,000 Thunder Bay Funding Incorporated 5.75 15/07/2008 11,551,302 1.73
Total Short-Term Investments £28,357,233 4.24
U.S. GOVERNMENT & AGENCY MORTGAGE OBLIGATIONS (178.86%)
380,000,000 Federal National*Mortgage Association (TBA) 5.50 01/08/2038 £187,393,782 27.99
1,479,000,000 Federal National*Mortgage Association (TBA) 5.50 01/07/2035 731,124,414 109.26
182,000,000 Federal National*Mortgage Association (TBA) 5.00 01/08/2038 71,951,671 10.75
403,000,000 Federal National*Mortgage Association (TBA) 5.00 01/07/2038 193,736,629 28.94
25,236,000 United States Treasury Bills 5.00 18/09/2008 12,622,710 1.89
Total U.S. Government & Agency Mortgage Obligations £1,196,829,206 178.86
REPURCHASE AGREEMENTS (0.38%)
5,055,000 Repurchase Agreement- Bank of America 2.25 01/07/2008 £2,536,123 0.38
Total Repurchase Agreements £2,536,123 0.38
Total Value of Investments £1,844,194, 825 275.60
* Please refer to note 12 Subsequent events for more detail.
Putnam Global Fixed Income Alpha Fund S2
THE ACCOMPANYING NOTES ARE AN INTEGRAL PART OF THESE FINANCIAL STATEMENTS.
CORPORATE BONDS & NOTES (Continued)
PrincipalAmounts
CouponRate %
MaturityDates
ValueGBP
% ofFund
PrincipalAmounts
CouponRate %
MaturityDates
ValueGBP
% ofFund
FOREIGN GOVERNMENT BONDS & NOTES (Continued)
PrincipalAmounts
CouponRate %
MaturityDates
ValueGBP
% ofFund
PrincipalAmount
CouponRate %
MaturityDate
ValueGBP
% ofFund
PrincipalAmounts
CouponRate %
MaturityDates
ValueGBP
% ofFund
PrincipalAmounts
CouponRate %
MaturityDates
ValueGBP
% ofFund
PrincipalAmount
CouponRate %
MaturityDates
ValueGBP
% ofFund

60
Putnam Global Fixed Income Alpha Fund S2
THE ACCOMPANYING NOTES ARE AN INTEGRAL PART OF THESE FINANCIAL STATEMENTS.
INTEREST RATE SWAP CONTRACTS OUTSTANDING (-0.93%)
Bank of America, N.A.£35,835,000 23/05/2010 3 month USD-LIBOR-BBA 3.155% £(112,187) (0.02)
28,514,000 15/05/2018 4.48% 3 month USD-LIBOR-BBA 215,300 0.03
Credit Suisse International2,830,000 13/03/2018 6 month CHF-LIBOR-BBA 3.3175% (51,783) (0.01)
12,500,000 15/03/2010 2.59% 6 month CHF-LIBOR-BBA 74,181 0.0112,500,000 15/03/2010 2.6625% 6 month CHF-LIBOR-BBA 66,880 0.01
2,830,000 14/03/2018 6 month CHF-LIBOR-BBA 3.3% (53,747) (0.01)
Deutsche Bank AG120,000,000 25/04/2013 3.7950% 3 month USD-LIBOR-BBA 1,166,165 0.17
45,878,000 26/06/2010 6 month GBP-LIBOR-BBA 6.180% (44,960) (0.01)61,510,000 26/04/2038 6 month EUR-EURIBOR-Reuters 5.065% 637,163 0.10
158,550,000 30/04/2012 6 month EUR-EURIBOR-Reuters 4.31% (1,686,217) (0.25)135,510,000 30/04/2015 4.475% 6 month EUR-EURIBOR-Reuters 1,976,538 0.30
37,950,000 30/04/2020 6 month EUR-EURIBOR-Reuters 4.7975% (462,379) (0.07)
Goldman Sachs International13,500,000 19/03/2012 3.015% 3 month USD-LIBOR-BBA 246,267 0.04
1,340,000,000 16/04/2010 3 month USD-LIBOR-BBA 2.615% (9,862,432) (1.47)174,000,000 16/04/2038 4.715% 3 month USD-LIBOR-BBA 3,530,283 0.53212,330,000 21/04/2010 6 month GBP-LIBOR-BBA 5.34125% (3,029,949) (0.45)
51,500,000 23/04/2018 5.20% 6 month GBP-LIBOR-BBA 1,746,365 0.2614,450,000 26/03/2010 6 month EUR-EURIBOR-Reuters 4.129% (217,917) (0.03)17,578,000 27/03/2018 4.125% 3 month USD-LIBOR-BBA 373,660 0.0612,040,000 29/03/2010 6 month GBP-LIBOR-BBA 5.25% (189,028) (0.03)
2,910,000 27/03/2018 5.0675% 6 month GBP-LIBOR-BBA 128,622 0.0212,493,000 02/04/2018 4.076% 3 month USD-LIBOR-BBA 290,764 0.0419,120,000 05/04/2010 2.89% 6 month CHF-LIBOR-BBA 80,621 0.01
4,360,000 03/04/2018 6 month CHF-LIBOR-BBA 3.42% (63,133) (0.01)6,090,000 01/04/2010 2.9% 6 month CHF-LIBOR-BBA 24,720 — 1,380,000 02/04/2018 6 month CHF-LIBOR-BBA 3.44% (18,876) —
12,236,000 23/04/2018 4.43% 3 month USD-LIBOR-BBA 116,086 0.0235,689,000 19/05/2018 4.525% 3 month USD-LIBOR-BBA 207,702 0.03
130,876,000 30/05/2028 5.014% 3 month USD-LIBOR-BBA (726,214) (0.11)13,314,730,000 07/05/2010 6 month JPY-LIBOR-BBA 1.09125% (96,394) (0.01)
2,929,240,000 07/05/2018 2.205% 6 month JPY-LIBOR-BBA 26,056 —
JPMorgan Chase Bank, N.A.218,000,000 13/06/2013 4.47% 3 month USD-LIBOR-BBA (1,044,501) (0.16)
18,000,000 27/06/2018 3 month USD-LIBOR-BBA 4.8305% 110,175 0.02184,616,000 08/04/2013 3 month USD-LIBOR-BBA 3.58406% (2,589,737) (0.39)152,277,000 07/05/2013 3.9325% 3 month USD-LIBOR-BBA 1,033,668 0.15
59,725,000 23/05/2010 3 month USD-LIBOR-BBA 3.16% (183,982) (0.03)
Lehman Brothers Special Financing, Inc.*50,205,000 10/06/2038 5.1275% 3 month USD-LIBOR-BBA (606,530) (0.09)
5,930,000 11/06/2038 4.52% 6 month EUR-EURIBOR-Reuters 131,663 0.028,890,000 11/06/2038 3 month USD-LIBOR-BBA 5.54% 86,616 0.01
63,615,000 12/06/2038 4.7625% 6 month EUR-EURIBOR-Reuters 482,540 0.0795,420,000 12/06/2038 3 month USD-LIBOR-BBA 5.4175% 481,121 0.0749,233,000 12/06/2018 4.7225% 6 month EUR-EURIBOR-Reuters 292,534 0.0473,055,000 12/06/2018 3 month USD-LIBOR-BBA 5.1575% (64,141) (0.01)39,000,000 26/06/2013 3 month USD-LIBOR-BBA 4.465% 179,816 0.0328,000,000 30/06/2013 3 month USD-LIBOR-BBA 4.3620% 65,574 0.0155,942,000 07/03/2018 4.34% 3 month USD-LIBOR-BBA 698,854 0.10
2,795,000 26/03/2038 5.05% 3 month USD-LIBOR-BBA 25,998 — 5,590,000 22/03/2038 5.29% 3 month USD-LIBOR-BBA (84) — 3,730,000 22/03/2038 6 month EUR-EURIBOR-Reuters 4.864% (7,780) — 9,630,000 22/03/2010 6 month GBP-LIBOR-BBA 5.075% (176,999) (0.03)2,720,000 20/03/2018 4.99% 6 month GBP-LIBOR-BBA 135,728 0.022,440,000 29/03/2038 6 month EUR-EURIBOR-Reuters 4.9625% 9,929 —
159,240,000 12/04/2012 6 month EUR-EURIBOR-Reuters 4.10% (2,161,610) (0.32)135,510,000 13/04/2015 4.31% 6 month EUR-EURIBOR-Reuters 2,693,916 0.40
37,840,000 13/04/2020 6 month EUR-EURIBOR-Reuters 4.6575% (757,934) (0.11)652,201,000 30/05/2010 3 month USD-LIBOR-BBA 3.4275% (441,738) (0.07)
10,068,000 21/04/2038 4.945% 3 month USD-LIBOR-BBA 23,185 — 92,265,000 26/04/2038 5.3325% 3 month USD-LIBOR-BBA (158,774) (0.02)49,233,000 03/06/2018 6 month EUR-EURIBOR-Reuters 4.912% (40,457) (0.01)73,055,000 03/06/2018 5.28% 3 month USD-LIBOR-BBA (97,494) (0.01)
615,692,000 03/06/2010 3 month USD-LIBOR-BBA 3.41% (602,348) (0.09)94,568,000 03/06/2038 5.0975% 3 month USD-LIBOR-BBA (919,490) (0.14)
1,865,000 26/03/2038 6 month EUR-EURIBOR-Reuters 4.74% (17,889) — 14,450,000 29/03/2010 6 month EUR-EURIBOR-Reuters 4.25% (199,235) (0.03)
3,660,000 29/03/2038 5.31% 3 month USD-LIBOR-BBA (2,993) —
Merrill Lynch Capital Services, Inc.432,350,000 21/05/2013 3.86% 3 month USD-LIBOR-BBA 3,661,483 0.55169,855,000 21/05/2038 3 month USD-LIBOR-BBA 4.86% (1,509,197) (0.23)157,525,000 07/05/2038 4.87750% 3 month USD-LIBOR-BBA 1,195,742 0.18
30,453,000 19/05/2010 3.2925% 3 month USD-LIBOR-BBA 57,018 0.01
Swap counterparty
Notional Amount
TerminationDate
Payments made by Fund
per annum
Fixed paymentsreceived by Fund
per annum
Unrealised Appreciation/
(Depreciation)GBP
% ofFund
(F)
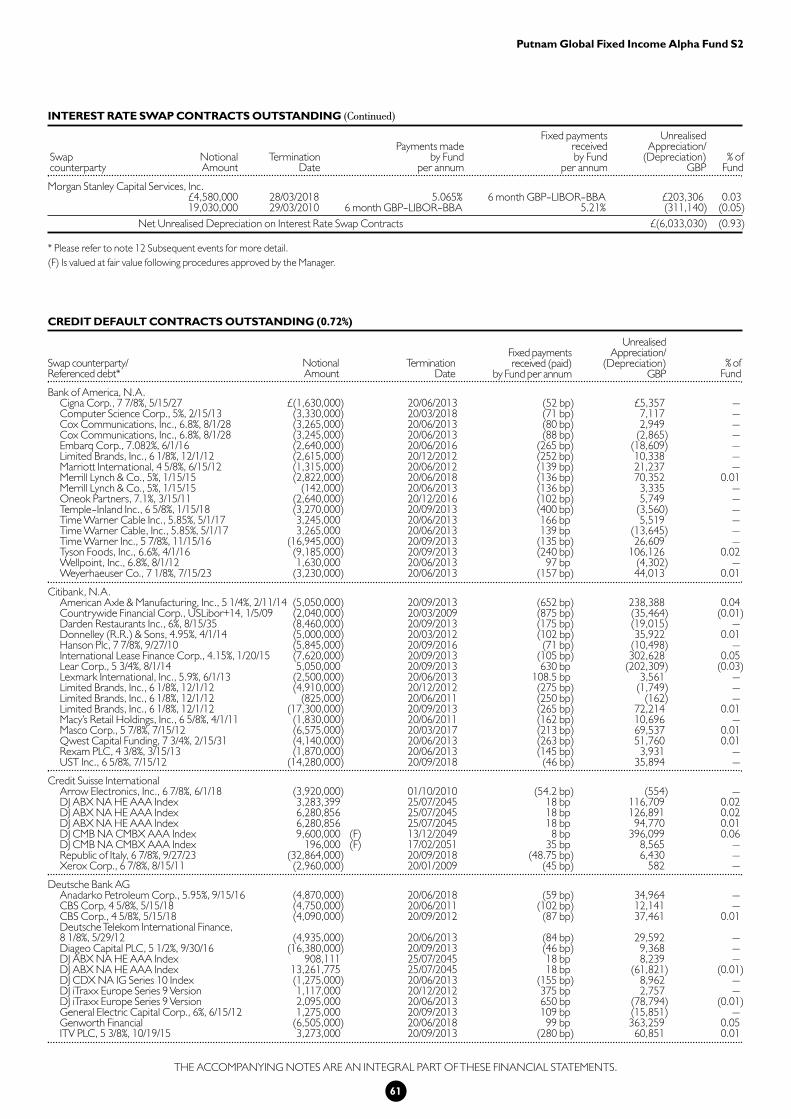
61
Putnam Global Fixed Income Alpha Fund S2
THE ACCOMPANYING NOTES ARE AN INTEGRAL PART OF THESE FINANCIAL STATEMENTS.
Morgan Stanley Capital Services, Inc.£4,580,000 28/03/2018 5.065% 6 month GBP-LIBOR-BBA £203,306 0.0319,030,000 29/03/2010 6 month GBP-LIBOR-BBA 5.21% (311,140) (0.05)
Net Unrealised Depreciation on Interest Rate Swap Contracts £(6,033,030) (0.93)
* Please refer to note 12 Subsequent events for more detail.
(F) Is valued at fair value following procedures approved by the Manager.
INTEREST RATE SWAP CONTRACTS OUTSTANDING (Continued)
CREDIT DEFAULT CONTRACTS OUTSTANDING (0.72%)
Bank of America, N.A.Cigna Corp., 7 7/8%, 5/15/27 £(1,630,000) 20/06/2013 (52 bp) £5,357 —Computer Science Corp., 5%, 2/15/13 (3,330,000) 20/03/2018 (71 bp) 7,117 —Cox Communications, Inc., 6.8%, 8/1/28 (3,265,000) 20/06/2013 (80 bp) 2,949 —Cox Communications, Inc., 6.8%, 8/1/28 (3,245,000) 20/06/2013 (88 bp) (2,865) —Embarq Corp., 7.082%, 6/1/16 (2,640,000) 20/06/2016 (265 bp) (18,609) —Limited Brands, Inc., 6 1/8%, 12/1/12 (2,615,000) 20/12/2012 (252 bp) 10,338 —Marriott International, 4 5/8%, 6/15/12 (1,315,000) 20/06/2012 (139 bp) 21,237 —Merrill Lynch & Co., 5%, 1/15/15 (2,822,000) 20/06/2018 (136 bp) 70,352 0.01 Merrill Lynch & Co., 5%, 1/15/15 (142,000) 20/06/2013 (136 bp) 3,335 —Oneok Partners, 7.1%, 3/15/11 (2,640,000) 20/12/2016 (102 bp) 5,749 —Temple-Inland Inc., 6 5/8%, 1/15/18 (3,270,000) 20/09/2013 (400 bp) (3,560) —Time Warner Cable Inc., 5.85%, 5/1/17 3,245,000 20/06/2013 166 bp 5,519 —Time Warner Cable, Inc., 5.85%, 5/1/17 3,265,000 20/06/2013 139 bp (13,645) —Time Warner Inc., 5 7/8%, 11/15/16 (16,945,000) 20/09/2013 (135 bp) 26,609 —Tyson Foods, Inc., 6.6%, 4/1/16 (9,185,000) 20/09/2013 (240 bp) 106,126 0.02 Wellpoint, Inc., 6.8%, 8/1/12 1,630,000 20/06/2013 97 bp (4,302) —Weyerhaeuser Co., 7 1/8%, 7/15/23 (3,230,000) 20/06/2013 (157 bp) 44,013 0.01
Citibank, N.A.American Axle & Manufacturing, Inc., 5 1/4%, 2/11/14 (5,050,000) 20/09/2013 (652 bp) 238,388 0.04 Countrywide Financial Corp., USLibor+14, 1/5/09 (2,040,000) 20/03/2009 (875 bp) (35,464) (0.01)Darden Restaurants Inc., 6%, 8/15/35 (8,460,000) 20/09/2013 (175 bp) (19,015) —Donnelley (R.R.) & Sons, 4.95%, 4/1/14 (5,000,000) 20/03/2012 (102 bp) 35,922 0.01 Hanson Plc, 7 7/8%, 9/27/10 (5,845,000) 20/09/2016 (71 bp) (10,498) —International Lease Finance Corp., 4.15%, 1/20/15 (7,620,000) 20/09/2013 (105 bp) 302,628 0.05 Lear Corp., 5 3/4%, 8/1/14 5,050,000 20/09/2013 630 bp (202,309) (0.03)Lexmark International, Inc., 5.9%, 6/1/13 (2,500,000) 20/06/2013 108.5 bp 3,561 —Limited Brands, Inc., 6 1/8%, 12/1/12 (4,910,000) 20/12/2012 (275 bp) (1,749) —Limited Brands, Inc., 6 1/8%, 12/1/12 (825,000) 20/06/2011 (250 bp) (162) —Limited Brands, Inc., 6 1/8%, 12/1/12 (17,300,000) 20/09/2013 (265 bp) 72,214 0.01 Macy’s Retail Holdings, Inc., 6 5/8%, 4/1/11 (1,830,000) 20/06/2011 (162 bp) 10,696 —Masco Corp., 5 7/8%, 7/15/12 (6,575,000) 20/03/2017 (213 bp) 69,537 0.01 Qwest Capital Funding, 7 3/4%, 2/15/31 (4,140,000) 20/06/2013 (263 bp) 51,760 0.01 Rexam PLC, 4 3/8%, 3/15/13 (1,870,000) 20/06/2013 (145 bp) 3,931 —UST Inc., 6 5/8%, 7/15/12 (14,280,000) 20/09/2018 (46 bp) 35,894 —
Credit Suisse InternationalArrow Electronics, Inc., 6 7/8%, 6/1/18 (3,920,000) 01/10/2010 (54.2 bp) (554) —DJ ABX NA HE AAA Index 3,283,399 25/07/2045 18 bp 116,709 0.02DJ ABX NA HE AAA Index 6,280,856 25/07/2045 18 bp 126,891 0.02DJ ABX NA HE AAA Index 6,280,856 25/07/2045 18 bp 94,770 0.01DJ CMB NA CMBX AAA Index 9,600,000 (F) 13/12/2049 8 bp 396,099 0.06DJ CMB NA CMBX AAA Index 196,000 (F) 17/02/2051 35 bp 8,565 —Republic of Italy, 6 7/8%, 9/27/23 (32,864,000) 20/09/2018 (48.75 bp) 6,430 —Xerox Corp., 6 7/8%, 8/15/11 (2,960,000) 20/01/2009 (45 bp) 582 —
Deutsche Bank AGAnadarko Petroleum Corp., 5.95%, 9/15/16 (4,870,000) 20/06/2018 (59 bp) 34,964 —CBS Corp, 4 5/8%, 5/15/18 (4,750,000) 20/06/2011 (102 bp) 12,141 —CBS Corp., 4 5/8%, 5/15/18 (4,090,000) 20/09/2012 (87 bp) 37,461 0.01 Deutsche Telekom International Finance, 8 1/8%, 5/29/12 (4,935,000) 20/06/2013 (84 bp) 29,592 —Diageo Capital PLC, 5 1/2%, 9/30/16 (16,380,000) 20/09/2013 (46 bp) 9,368 —DJ ABX NA HE AAA Index 908,111 25/07/2045 18 bp 8,239 —DJ ABX NA HE AAA Index 13,261,775 25/07/2045 18 bp (61,821) (0.01)DJ CDX NA IG Series 10 Index (1,275,000) 20/06/2013 (155 bp) 8,962 —DJ iTraxx Europe Series 9 Version 1,117,000 20/12/2012 375 bp 2,757 —DJ iTraxx Europe Series 9 Version 2,095,000 20/06/2013 650 bp (78,794) (0.01)General Electric Capital Corp., 6%, 6/15/12 1,275,000 20/09/2013 109 bp (15,851) —Genworth Financial (6,505,000) 20/06/2018 99 bp 363,259 0.05 ITV PLC, 5 3/8%, 10/19/15 3,273,000 20/09/2013 (280 bp) 60,851 0.01
Swap counterparty/Referenced debt*
Notional Amount
TerminationDate
Fixed payments received (paid)
by Fund per annum
Unrealised Appreciation/
(Depreciation)GBP
% ofFund
Swap counterparty
Notional Amount
TerminationDate
Payments made by Fund
per annum
Fixed paymentsreceived by Fund
per annum
Unrealised Appreciation/
(Depreciation)GBP
% ofFund

62
Putnam Global Fixed Income Alpha Fund S2
THE ACCOMPANYING NOTES ARE AN INTEGRAL PART OF THESE FINANCIAL STATEMENTS.
Malaysian Government, 6.844%, 10/1/09 £13,000,000 01/10/2009 90 bp £29,285 —Republic of Argentina, 8.28%, 12/31/33 (2,490,000) 20/04/2013 (565 bp) 39,439 0.01 Russian Federation, 7 1/2%, 3/31/30 (2,490,000) 20/04/2013 (112 bp) (2,524) —Russian Federation, 7 1/2%, 3/31/30 (5,725,000) 20/06/2013 (87 bp) 27,143 —Smurfit Kappa Funding, 10 1/8%, 10/1/12 1,180,000 20/06/2009 135 bp (821) —Societe Telefon Francais 1, 4 3/8%, 11/12/10 (4,900,000) 20/09/2013 (55 bp) (39) —Unity Media GmbH, 8 3/4%, 2/15/15 1,690,000 20/06/2013 460 bp (39,940) (0.01)Virgin Media Finance PLC, 8 3/4%, 4/15/14 1,680,000 20/09/2013 477 bp (24,544) —Weyerhaeuser Co., 7 1/8%, 7/15/23 (3,230,000) 20/06/2013 (157 bp) 44,512 0.01 XTO Energy, Inc., 4.9%, 2/1/14 4,870,000 20/06/2018 82 bp (64,235) (0.01)
Goldman Sachs InternationalBritish Airways, 7 1/4%, 8/23/16 (12,850,000) 20/09/2013 (374 bp) 323,184 0.05 Cigna Corp., 7 7/8%, 5/15/27 (3,260,000) 20/06/2013 (58 bp) 6,346 —CSC Holdings, Inc., 7 5/8%, 7/15/18 3,060,000 20/09/2013 495 bp (5,952) —DJ ABX NA HE AAA Index 6,409,036 25/07/2045 18 bp (11,867) —DJ CDX NA HY Series 9 Index (10,500,000) 20/12/2017 (80 bp) 57,965 (0.01)DJ CDX NA HY Series 9 Index 35-100% tranche 15,898,461 (F) 20/12/2010 153.5 bp 74,930 0.01 DJ CDX NA IG Series 10 Index (134,520,000) 20/06/2018 (150 bp) 1,749,042 0.26General Mills, Inc., 5.7%, 2/15/17 (1,420,000) 20/06/2013 (54.9 bp) 328 —General Mills, Inc., 5.7%, 2/15/17 (18,060,000) 20/09/2013 (57.9 bp) (16,534) —ITV PLC, 5 3/8%, 10/19/15 (1,637,000) 20/09/2013 (281 bp) 31,527 —Lighthouse International Co, SA, 8%, 4/30/14 260,000 20/03/2013 680 bp (9,219) —Lowe’s Companies, Inc., 8 1/4%, 6/1/10 (355,000) 20/06/2013 (104 bp) (2,973) —Nordstrom, Inc., 6.95%, 3/15/28 (355,000) 20/06/2013 (130 bp) (1,532) —ONO Finance II, 8%, 5/16/14 (3,655,000) 20/06/2013 (955 bp) 100,703 0.02 Pernod Ricard, 4 5/8%, 12/6/13 (740,000) (F) 20/06/2013 (350 bp) (14,167) —Radioshack Corp., 7 3/8%, 5/15/2011 (5,610,000) 20/09/2013 (205 bp) 18,489 —Reynolds America, Inc., 7 5/8%, 6/1/16 10,155,000 20/09/2013 98.5 bp (26,646) —Rhodia SA, Euribor+275, 10/15/13 (565,000) 20/09/2013 (367 bp) 10,285 —Rhodia SA, Euribor+275, 10/15/13 (470,000) 20/09/2013 (387 bp) 5,593 —Southern California Edison Co., 7 5/8%, 1/15/10 3,250,000 20/06/2013 88.1 bp (12,790) —Wellpoint, Inc., 6.8%, 8/1/12 3,260,000 20/06/2013 93 bp (11,449) —Wind Acquisition 9 3/4%, 12/1/15 260,000 20/03/2013 597 bp 10,379 —
JPMorgan Chase Bank, N.A.Cardinal Health Inc., 5.85%, 12/15/17 (1,370,000) 20/06/2012 (40 bp) 103 —CenturyTel. Inc., 6%, 4/1/17 (2,000,000) 20/06/2013 (95 bp) 34,718 —Codere Finance (Luxembourg) S.A., 8.25%, 6/15/15 260,000 20/03/2013 795 bp 12,649 —Cox Communications, Inc., 6.8%, 8/1/28 (6,590,000) 20/03/2010 (45 bp) (2,447) —Darden Restaurants, Inc., 6%, 8/15/35 (4,140,000) 20/12/2017 (155.3 bp) 13,688 —DJ iTraxx Europe Crossover Series 8 Version 1 (410,000) 20/12/2012 (375 bp) (13,148) —DJ iTraxx Europe Series 9 Version 1 2,420,000 20/06/2013 650 bp (37,389) (0.01)Freeport-McMoRan Copper & Gold, Inc., 8 3/8%, 4/1/17 (3,760,000) 20/06/2012 (145 bp) (3,924) —Illinois Tool Works, 5 3/4%, 3/1/09 (1,640,000) 20/06/2013 (35 bp) 3,233 —iStar Financial, Inc., 6%, 12/15/10 465,000 (F) 20/03/2009 500 bp 8,994 —Lexmark International, Inc., 5.9%, 6/1/13 (2,280,000) 20/06/2013 (113 bp) (252) —Merrill Lynch & Co., 5%, 1/15/15 (4,179,000) 20/06/2018 (125 bp) 119,445 0.02 Merrill Lynch & Co., 5%, 1/15/15 (618,000) 20/06/2013 (135 bp) 14,641 —Nextel Communications, 7 3/8%, 8/1/15 (4,705,000) 20/09/2013 (540 bp) (93,028) (0.01)Qwest Corp., 7.2%, 11/10/26 3,775,000 20/09/2013 330 bp 171 —UST Inc., 6 5/8%, 7/15/12 (20,310,000) 20/09/2013 (36.5 bp) 28,531 —Viacom, 129%, 9/20/13 (18,240,000) 20/09/2013 (129 bp) 66,529 0.01
Lehman Brothers Special Financing, Inc.**Anadarko Petroleum Corp., 5.95%, 9/15/16 (2,245,000) 20/06/2013 (58 bp) 4,483 —Arcelormittal Finance, 5 1/8%, 9/24/10 6,525,000 20/06/2013 130 bp (68,157) (0.01)Centex Corp., 5 1/4%, 6/15/15 (3,270,000) 20/06/2013 (405 bp) 32,615 —CNA Financial Corp., 5.85%, 12/15/14 (1,530,000) 20/09/2011 (174 bp) (14,946) —DirecTV Holdings/Financing, 8 3/8%, 3/15/13 3,795,000 20/06/2013 280 bp (12,262) —DJ ABX HE PEN AAA Index 1,106,000 (F) 25/05/2046 11 bp (41,638) (0.01)DJ ABX HE PEN AAA Index 1,110,655 (F) 25/05/2046 11 bp (41,107) (0.01)DJ ABX NA HE AAA Index 20,538,496 (F) 25/07/2045 18 bp (64,153) (0.01)DJ ABX NA HE AAA Index 4,122,489 (F) 25/07/2045 18 bp (9,135) —DJ CDX NA HY Series 9 Index 25-35% tranche 18,000,000 20/12/2010 390.4 bp 230,644 0.03 DJ CDX NA HY Series 9 Index 25-35% tranche 30,000,000 20/12/2010 335 bp 187,839 0.03 DJ CDX NA IG Series 10 Index (2,550,000) 20/06/2013 (155 bp) 15,325 —DJ iTraxx Europe Series 9 Version 4,480,000 20/06/2013 650 bp (151,555) 0.02Echostar DBS Corp., 6 5/8%, 10/1/14 (3,795,000) 20/06/2013 (241.5 bp) 43,506 0.01Embarq Corp., 7.082%, 6/1/16 (7,125,000) 20/09/2013 (243.8 bp) (14,120) —Energy Future Holdings, 5.55%, 11/15/14 (8,150,000) 20/09/2013 (589 bp) 63,950 0.01 Felcor Lodging LP, 8 1/2%, 6/1/11 (2,280,000) 20/06/2011 (334 bp) 35,518 —First Data Corp., 5 5/8%, 11/1/11 (3,800,000) 20/09/2013 (643 bp) 54,316 0.01 General Electric Capital Corp., 6%, 6/15/12 2,550,000 20/09/2013 115 bp (28,299) —GMAC, LLC, 6 7/8%, 8/28/12 785,000 20/03/2009 500 bp (3,177) —Hanson Plc, 7 7/8%, 9/27/10 (895,000) 20/09/2016 (140 bp) (22,487) —International Lease Finance Corp., 4.15%, 1/20/15 (2,285,000) 20/12/2013 (165 bp) 63,327 0.01 Lafarge SA, 5.448%, 12/4/13 (595,000) 20/06/2013 (185 bp) (3,839) —Lennar Corp., 5.95%, 3/1/13 (4,110,000) 20/06/2013 (555 bp) 83,697 0.01 MediaCom LLC/ Cap Corp., 9 1/2%, 1/15/13 2,150,000 20/09/2013 820 bp 237 —
CREDIT DEFAULT CONTRACTS OUTSTANDING (Continued)
Swap counterparty/Referenced debt*
Notional Amount
TerminationDate
Fixed payments received (paid)
by Fund per annum
Unrealised Appreciation/
(Depreciation)GBP
% ofFund

63
Putnam Global Fixed Income Alpha Fund S2
THE ACCOMPANYING NOTES ARE AN INTEGRAL PART OF THESE FINANCIAL STATEMENTS.
Motorola, Inc., 6 1/2%, 9/1/25 £(1,165,000) 20/11/2011 (335 bp) £(13,712) —Owens-Illinois, Inc., 7.8%, 5/15/18 (6,335,000) 20/06/2010 (128 bp) 4,545 —Owens-Illinois, Inc., 7.8%, 5/15/18 (2,170,000) 20/06/2010 (130 bp) 1,143 —Owens-Illinois, Inc., 7.8%, 5/15/18 (2,170,000) 20/06/2010 (140 bp) (915) —Pearson PLC, 7%, 10/27/14 (4,100,000) 20/06/2018 (69 bp) 29,230 —Progress Energy, Inc., 5 5/8%, 1/15/16 (1,390,000) 20/06/2013 (79 bp) (9,415) —Republic of Argentina, 8.28%, 12/31/33 (2,490,000) 20/04/2013 (565 bp) 39,439 0.01 Russian Federation, 7 1/2%, 3/31/30 (2,490,000) 20/04/2013 (112 bp) (2,524) —Safeway, Inc., 5.8%, 8/15/12 (355,000) 20/06/2013 (65 bp) (135) —Sprint Nextel Corp., 6%, 12/1/16 (5,050,000) 20/06/2013 (390 bp) (93,186) (0.01)Telus Corp., 8%, 6/1/11 (9,760,000) 20/09/2013 (80 bp) (11,507) —Thomson (EX-TMM), 5 3/4%, 9/25/15 (1,902,000) 20/06/2013 (405 bp) 119,596 0.02 TXU Energy, LLC, 7%, 3/15/13 8,150,000 20/09/2013 559 bp (63,950) (0.01)US Steel Corp., 6.65%, 6/1/37 (6,555,000) 20/03/2018 (141 bp) 56,883 0.01 US Steel Corp., 6.65%, 6/1/37 (6,525,000) 20/06/2013 (130 bp) (2,455) —XTO Energy, Inc., 4.9%, 2/1/14 2,245,000 20/06/2013 88 bp (5,913) —Yum! Brands, Inc., 8 7/8%, 4/15/11 (890,000) 20/03/2018 (130 bp) (2,130) —
Merrill Lynch InternationalAmerisourceBergen Corp., 5 7/8%, 9/15/15 (5,902,000) 20/09/2012 (65 bp) 24,518 —Block Financial LLC. 5 1/8%, 10/30/14 (5,920,000) 20/12/2014 (69 bp) 27,652 —Cargill Inc., 7 3/8%, 10/1/25 (16,675,000) 20/09/2013 (84 bp) 22,923 —Diageo Capital PLC, 5 1/2%, 9/30/16 (3,690,000) 20/09/2013 (43 bp) 4,721 —Eaton Corp., 7.65%, 11/15/29 3,280,000 20/06/2013 65 bp 1,020 —Electronic Data Systems Corp., 6%, 8/1/13 (2,285,000) 20/09/2013 (100 bp) (20,899) —Felcor Lodging LP, 8 1/2%, 6/1/11 (2,145,000) 20/06/2011 (316 bp) 38,451 0.01 Goodrich Corp., 7 5/8%, 12/15/12 (1,640,000) 20/06/2013 (30 bp) 4,460 —Liberty Media LLC., 5.7%, 5/15/13 (4,135,000) 20/06/2009 (203 bp) (14,398) —Marriott International, 4 5/8%, 6/15/12 (6,490,000) 20/06/2012 (119 bp) 127,671 0.02 Pearson PLC, 7%, 10/27/14 (2,700,000) 20/06/2018 (65 bp) 23,421 —Rogers Communications, 6 3/8%, 3/1/14 1,415,000 20/09/2013 161 bp (909) —Sara Lee Corp., 6 1/8%, 11/1/32 (1,874,000) 20/06/2013 55.5 bp 3,601 —Temple-Inland Inc., 6 5/8%, 1/15/18 (3,265,000) 20/09/2013 (395 bp) (180) —Tyson Foods, Inc., 6.6%, 4/1/16 (4,145,000) 20/12/2011 (141 bp) 75,530 0.01 Tyson Foods, Inc., 6.6%, 4/1/16 (4,145,000) 20/10/2011 (152.50 bp) 62,512 0.01 Yum! Brands, Inc., 8 7/8%, 4/15/11 (17,005,000) 20/09/2013 (94 bp) 61,768 0.01
Morgan Stanley Capital Services, Inc.Bundesrepublic of Deutschland, 6%, 6/20/16 7,337,000 20/06/2018 8 bp (2,577) —DJ CMB NA CMBX AAA Index 1,894,000 (F) 17/02/2051 35 bp 52,360 0.01DJ CMB NA CMBX AAA Index 1,894,000 (F) 13/12/2049 8 bp 48,875 0.01DJ CMB NA CMBX AAA Index (8,582,500) (F) 17/02/2051 (35 bp) (388,886) (0.06)Embarq Corp., 7.082%, 6/1/16 (5,985,000) 20/09/2013 (242 bp) 4,606 —Republic of Austria, 5 1/4%, 1/4/11 (7,337,000) 20/06/2018 (17 bp) (9,129) —Rogers Communications, 6 3/8%, 3/1/14 8,345,000 20/09/2013 165 bp 2,051 —
Net Unrealised Appreciation on Credit Default Contracts Outstanding £4,837,094 0.72
* Payments related to the reference debt are made upon a credit default event.
** Please refer to note 12 Subsequent events for more detail.
(F) Is valued at fair value following procedures approved by the Manager.
CREDIT DEFAULT CONTRACTS OUTSTANDING (Continued)
Swap counterparty/Referenced debt*
Notional Amount
TerminationDate
Fixed payments received (paid)
by Fund per annum
Unrealised Appreciation/
(Depreciation)GBP
% ofFund

PrincipalAmounts
CouponRate %
MaturityDates
ValueGBP
% ofFund
TBA SALE COMMITMENTS OUTSTANDING (-81.37%)
£906,000,000 Federal National Mortgage Association* 5.50 01/07/2038 £(447,869,318) (66.93)
201,000,000 Federal National Mortgage Association* 5.50 01/07/2038 (96,627,947) (14.44)
Total TBA Sale Commitments £(544,497,265) (81.37)
* Please refer to note 12 Subsequent events for more detail.
64
Putnam Global Fixed Income Alpha Fund S2
THE ACCOMPANYING NOTES ARE AN INTEGRAL PART OF THESE FINANCIAL STATEMENTS.
Swap counterparty
Notional Amount
TerminationDate
Fixed payments received (paid) by
Fund per annum
Total returnreceived by
or paid by Fund
Unrealised Appreciation/
(Depreciation)GBP
% ofFund
TOTAL RETURN SWAP CONTRACTS OUTSTANDING (-0.06%)
Goldman Sachs International£11,904,000 (F) 26/03/2009 (2.27%) £74,305 0.01
(40,680,000) 30/04/2013 2.375% (705,855) (0.11)
40,680,000 (F) 30/04/2013 (2.41%) 970,711 0.15
(40,680,000) 06/05/2013 2.34% (742,498) (0.11)
40,680,000 06/05/2013 (2.385%) 824,140 0.12
(24,408,000) 09/05/2013 3.10% (821,085) (0.12)
Net Unrealised Depreciation on Total Return Swap Contracts £(400,282) (0.06)
(F) Is valued at fair value following procedures approved by the Manager.
GBP Non-revised Retail Price Index
Eurostat EurozoneHICP excluding tobacco
French ConsumerPrice Index excluding tobacco
Eurostat EurozoneHICP excluding tobacco
French ConsumerPrice Index excluding tobacco
Eurostat EurozoneHICP excluding tobacco
FUTURES CONTRACTS (-0.30%)
3,772 U.S. Long Bond Sept 2008 Lehman Brothers* £2,229,323 0.33
205 U.S. 5 yr Note Sept 2008 Lehman Brothers* 78,666 0.01
1,009 Euro-Bond Sept 2008 Goldman Sachs International, Lehman Brothers* (390,066) (0.06)
922 Euro-Schatz Sept 2008 Lehman Brothers* (69,921) (0.01)
138 90 Day GBP Libor Dec 2008 Lehman Brothers* (87,936) (0.01)
599 90 Day GBP Libor June 2009 Lehman Brothers* (432,014) (0.06)
583 90 Day GBP Libor Sept 2009 Lehman Brothers* (391,211) (0.06)
140 90 Day GBP Libor March 2009 Lehman Brothers* (102,882) (0.02)
(13,249) U.S. 2 yr Note Sept 2008 Lehman Brothers* (2,602,814) (0.39)
4,495 U.S. 10 yr Note Sept 2008 Lehman Brothers* (976,892) (0.14)
Net Unrealised Depreciation on Futures Contracts £(2,745,747) (0.41)
Variation margin settlement to date £714,278 0.11
Cumulate unrealised less variation margin settlement to date £(2,031,469) (0.30)
* Please refer to note 12 Subsequent events for more detail.
Number of ContractsLong/(Short) Counterparty
Unrealised Appreciation/
(Depreciation)GBP
% ofFund
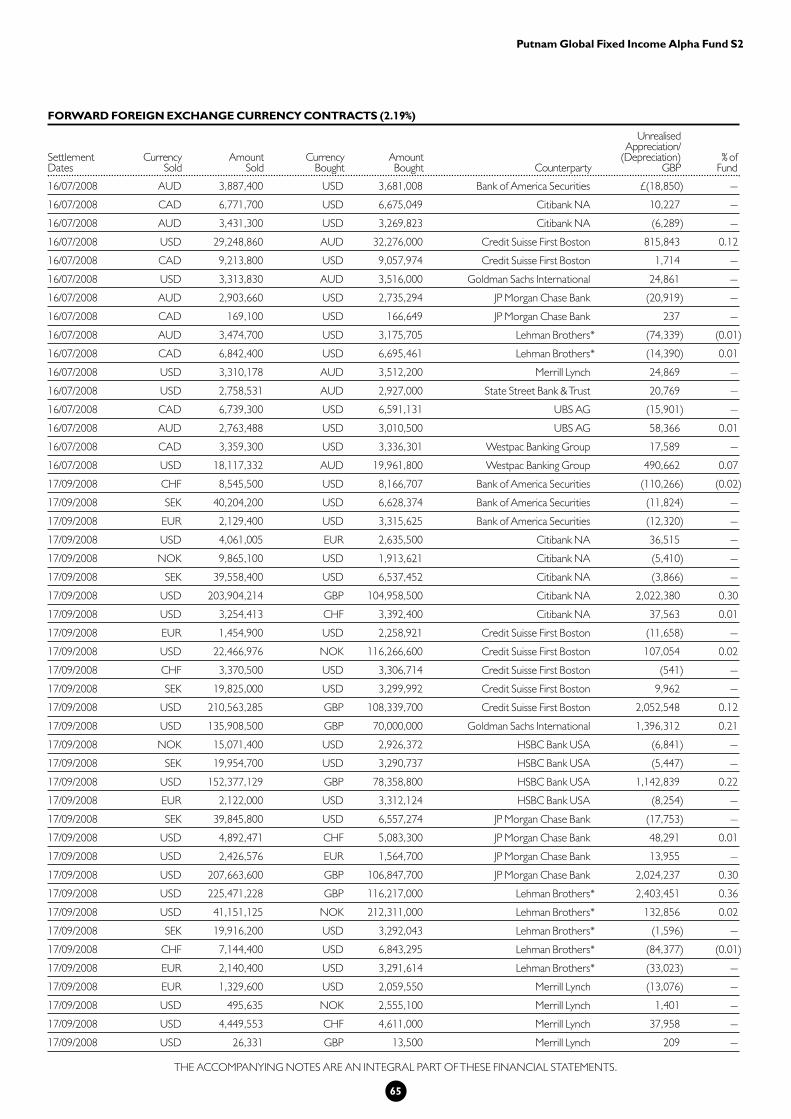
65
Putnam Global Fixed Income Alpha Fund S2
THE ACCOMPANYING NOTES ARE AN INTEGRAL PART OF THESE FINANCIAL STATEMENTS.
FORWARD FOREIGN EXCHANGE CURRENCY CONTRACTS (2.19%)
16/07/2008 AUD 3,887,400 USD 3,681,008 Bank of America Securities £(18,850) —
16/07/2008 CAD 6,771,700 USD 6,675,049 Citibank NA 10,227 —
16/07/2008 AUD 3,431,300 USD 3,269,823 Citibank NA (6,289) —
16/07/2008 USD 29,248,860 AUD 32,276,000 Credit Suisse First Boston 815,843 0.12
16/07/2008 CAD 9,213,800 USD 9,057,974 Credit Suisse First Boston 1,714 —
16/07/2008 USD 3,313,830 AUD 3,516,000 Goldman Sachs International 24,861 —
16/07/2008 AUD 2,903,660 USD 2,735,294 JP Morgan Chase Bank (20,919) —
16/07/2008 CAD 169,100 USD 166,649 JP Morgan Chase Bank 237 —
16/07/2008 AUD 3,474,700 USD 3,175,705 Lehman Brothers* (74,339) (0.01)
16/07/2008 CAD 6,842,400 USD 6,695,461 Lehman Brothers* (14,390) 0.01
16/07/2008 USD 3,310,178 AUD 3,512,200 Merrill Lynch 24,869 —
16/07/2008 USD 2,758,531 AUD 2,927,000 State Street Bank & Trust 20,769 —
16/07/2008 CAD 6,739,300 USD 6,591,131 UBS AG (15,901) —
16/07/2008 AUD 2,763,488 USD 3,010,500 UBS AG 58,366 0.01
16/07/2008 CAD 3,359,300 USD 3,336,301 Westpac Banking Group 17,589 —
16/07/2008 USD 18,117,332 AUD 19,961,800 Westpac Banking Group 490,662 0.07
17/09/2008 CHF 8,545,500 USD 8,166,707 Bank of America Securities (110,266) (0.02)
17/09/2008 SEK 40,204,200 USD 6,628,374 Bank of America Securities (11,824) —
17/09/2008 EUR 2,129,400 USD 3,315,625 Bank of America Securities (12,320) —
17/09/2008 USD 4,061,005 EUR 2,635,500 Citibank NA 36,515 —
17/09/2008 NOK 9,865,100 USD 1,913,621 Citibank NA (5,410) —
17/09/2008 SEK 39,558,400 USD 6,537,452 Citibank NA (3,866) —
17/09/2008 USD 203,904,214 GBP 104,958,500 Citibank NA 2,022,380 0.30
17/09/2008 USD 3,254,413 CHF 3,392,400 Citibank NA 37,563 0.01
17/09/2008 EUR 1,454,900 USD 2,258,921 Credit Suisse First Boston (11,658) —
17/09/2008 USD 22,466,976 NOK 116,266,600 Credit Suisse First Boston 107,054 0.02
17/09/2008 CHF 3,370,500 USD 3,306,714 Credit Suisse First Boston (541) —
17/09/2008 SEK 19,825,000 USD 3,299,992 Credit Suisse First Boston 9,962 —
17/09/2008 USD 210,563,285 GBP 108,339,700 Credit Suisse First Boston 2,052,548 0.12
17/09/2008 USD 135,908,500 GBP 70,000,000 Goldman Sachs International 1,396,312 0.21
17/09/2008 NOK 15,071,400 USD 2,926,372 HSBC Bank USA (6,841) —
17/09/2008 SEK 19,954,700 USD 3,290,737 HSBC Bank USA (5,447) —
17/09/2008 USD 152,377,129 GBP 78,358,800 HSBC Bank USA 1,142,839 0.22
17/09/2008 EUR 2,122,000 USD 3,312,124 HSBC Bank USA (8,254) —
17/09/2008 SEK 39,845,800 USD 6,557,274 JP Morgan Chase Bank (17,753) —
17/09/2008 USD 4,892,471 CHF 5,083,300 JP Morgan Chase Bank 48,291 0.01
17/09/2008 USD 2,426,576 EUR 1,564,700 JP Morgan Chase Bank 13,955 —
17/09/2008 USD 207,663,600 GBP 106,847,700 JP Morgan Chase Bank 2,024,237 0.30
17/09/2008 USD 225,471,228 GBP 116,217,000 Lehman Brothers* 2,403,451 0.36
17/09/2008 USD 41,151,125 NOK 212,311,000 Lehman Brothers* 132,856 0.02
17/09/2008 SEK 19,916,200 USD 3,292,043 Lehman Brothers* (1,596) —
17/09/2008 CHF 7,144,400 USD 6,843,295 Lehman Brothers* (84,377) (0.01)
17/09/2008 EUR 2,140,400 USD 3,291,614 Lehman Brothers* (33,023) —
17/09/2008 EUR 1,329,600 USD 2,059,550 Merrill Lynch (13,076) —
17/09/2008 USD 495,635 NOK 2,555,100 Merrill Lynch 1,401 —
17/09/2008 USD 4,449,553 CHF 4,611,000 Merrill Lynch 37,958 —
17/09/2008 USD 26,331 GBP 13,500 Merrill Lynch 209 —
SettlementDates
CurrencySold
AmountSold
CurrencyBought
AmountBought Counterparty
Unrealised Appreciation/
(Depreciation)GBP
% ofFund

66
Putnam Global Fixed Income Alpha Fund S2
THE ACCOMPANYING NOTES ARE AN INTEGRAL PART OF THESE FINANCIAL STATEMENTS.
17/09/2008 EUR 2,094,500 USD 3,243,878 State Street Bank & Trust £(20,850) —
17/09/2008 GBP 2,532,900 USD 4,920,222 Westpac Banking Group (49,286) (0.01)
17/09/2008 EUR 33,375,400 USD 51,666,748 UBS AG (344,156) (0.05)
17/09/2008 USD 206,729,756 GBP 106,532,900 UBS AG 2,179,831 0.33
17/09/2008 CHF 5,405,800 USD 5,208,859 UBS AG (48,346) (0.01)
17/09/2008 USD 3,169,323 NOK 16,387,300 UBS AG 13,737 —
17/09/2008 SEK 19,954,700 USD 3,292,436 UBS AG (4,594) —
17/09/2008 USD 16,304,980 GBP 8,404,000 Westpac Banking Group 163,527 0.02
20/08/2008 USD 4,996,926 JPY 527,350,000 Citibank NA (4,477) —
20/08/2008 USD 3,321,128 JPY 356,553,000 Credit Suisse First Boston 25,765 —
20/08/2008 USD 4,044,126 JPY 424,239,100 Goldman Sachs International (15,776) —
20/08/2008 USD 1,642,709 JPY 169,377,400 UBS AG (20,393) —
Net Unrealised Appreciation on Forward Foreign Exchange Currency Contracts £14,630,710 2.19
Total Financial Assets at Fair Value through Profit or Loss £1,863,662,629 278.51
Total Financial Liabilities at Fair Value through Profit or Loss £(552,962,046) (82.64)
* Please refer to note 12 Subsequent events for more detail.
Analysis of Investments (Unaudited)
(a) Transferable securities admitted to official stock exchange listing 71.98
(b) Transferable securities dealt in on another regulated market —
(c) Transferable securities other than those admitted to official stock exchange listing or dealt in on another regulated market 0.10
(d) Collective Investment Schemes 0.17
(e) OTC financial derivative instruments 1.25
(f ) Exchange traded financial derivative instruments 0.09
(g) Other assets 26.41
Total Investments 100.00
% ofTotal Assets
FORWARD FOREIGN EXCHANGE CURRENCY CONTRACTS (Continued)
SettlementDates
CurrencySold
AmountSold
CurrencyBought
AmountBought Counterparty
Unrealised Appreciation/
(Depreciation)GBP
% ofFund

67
Putnam Global Growth Fund
Schedule of Investments
30 June 2008
3,985 Adobe Systems Incorporated $156,690 1.09
1,300 Affiliated Computer Services Incorporated 69,524 0.48
718 AGCO Corporation 37,551 0.26
1,645 Akamai Technologies Incorporated 57,230 0.40
1,130 American Tower Corporation (Class A) 47,460 0.33
550 Amphenol Corporation 24,750 0.17
1,376 Amtrust Financial Services Incorporated 17,888 0.12
714 Apple Computer Incorporated 119,238 0.83
1,316 Arrow Electronics Incorporated 40,796 0.28
1,338 Assurant Incorporated 88,308 0.61
8,250 Atmel Corporation 24,750 0.20
1,334 Bank Mutual Corporation 13,340 0.09
1,200 Bank of New York Mellon Corporation 45,600 0.32
2,220 Baxter International Incorporated 142,080 0.99
1,133 Becton, Dickinson and Company 91,773 0.64
18 Berkshire Hathaway Incorporated 72,198 0.50
410 BJ’s Wholesale Club Incorporated 15,990 0.11
2,070 Boeing Company 136,620 0.95
310 Cabot Oil & Gas Corporation 21,080 0.15
550 CACI International Incorporated 25,300 0.17
290 Cameron International Corporation 15,950 0.11
250 Carpenter Technology Corporation 11,000 0.08
700 Cash America International Incorporated 21,700 0.15
2,850 Celanese Corporation 131,100 0.90
598 Cephalon Incorporated 40,066 0.28
400 Ceradyne Incorporated 13,600 0.10
300 Charles River Laboratories International Incorporated 19,200 0.13
4,769 Cisco Systems Incorporated 109,687 0.77
3,021 Citizens Incorporated 18,126 0.13
500 Cleveland-Cliffs Incorporated 59,500 0.42
815 CMS Energy Corporation 12,225 0.08
650 Columbus McKinnon Corporation 15,600 0.11
1,050 Complete Production Services Incorporated 37,800 0.27
800 Comstock Resources Incorporated 67,200 0.47
500 Comtech Telecommunications Corporation 24,500 0.17
1,767 Conmed Corporation 47,709 0.33
300 CONSOL Energy Incorporated 33,600 0.24
800 Corvel Corporation 27,200 0.19
1,300 Cubist Pharmaceuticals Incorporated 23,400 0.16
275 Cullen/Frost Bankers Incorporated 13,750 0.10
2,073 Danaher Corporation 159,621 1.11
654 Darden Restaurants Incorporated 20,928 0.15
500 DaVita Incorporated 26,500 0.18
570 Denbury Resources Incorporated 20,520 0.14
1,500 DirecTV Group Incorporated 39,000 0.27
1,570 Dr. Pepper Snapple Group Incorporated 32,970 0.23
1,827 Energizer Holdings Incorporated 133,535 0.93
400 ENSCO International Incorporated 32,400 0.22
445 Entergy Corporation 53,400 0.37
550 Esterline Technologies Corporation 26,950 0.19
748 Exelon Corporation 67,320 0.47
4,050 Exxon Mobil Corporation 356,400 2.47
80 First Solar Incorporated 21,840 0.15
536 Fluor Corporation 99,696 0.69
260 FMC Technologies Incorporated 20,020 0.14
650 Frontier Oil Corporation $15,600 0.11
700 Genzyme Corporation 50,400 0.35
180 Google Incorporated (Class A) 94,860 0.66
1,450 GrafTech International Limited 39,150 0.27
3,650 Grey Wolf Incorporated 32,850 0.23
400 Grief Incorporated Class A 25,600 0.18
800 Gymboree Corporation 32,000 0.22
6,158 Health Management Associates Incorporated 43,106 0.30
400 Henry Schein Incorporated 20,400 0.14
1,748 Hess Corporation 220,248 1.53
2,710 Hewlett-Packard Company 119,240 0.83
2,034 IBM Corporation 240,012 1.67
550 Interactive Brokers Group Incorporated 17,600 0.12
800 Interactive Data Corporation 20,000 0.14
600 Invitrogen Corporation 23,400 0.16
1,050 Jakks Pacific Incorporated 23,100 0.16
1,821 JDA Software Group Incorporated 32,778 0.23
2,033 Johnson & Johnson 130,112 0.91
300 Kinetic Concepts Incorporated 12,000 0.08
4,778 Kroger Company 138,562 0.96
650 Lam Research Corporation 23,400 0.16
500 Layne Christensen Company 22,000 0.15
700 Lexmark International Incorporated 23,100 0.16
372 Lockheed Martin Corporation 36,828 0.25
550 Manitowoc Company Incorporated 17,600 0.12
650 Maximus Incorporated 22,750 0.16
1,050 McDonald’s Corporation 58,800 0.41
2,130 Medco Health Solutions Incorporated 100,110 0.70
1,000 MEMC Electronic Materials Incorporated 62,000 0.43
900 Meridian Bioscience Incorporated 24,300 0.17
344 Mettler-Toledo International Incorporated 32,680 0.23
4,825 Microsoft Corporation 135,100 0.94
1,050 Mitcham Industries Incorporated 17,850 0.12
648 Monsanto Company 81,648 0.57
700 Mueller Industries Incorporated 22,400 0.16
500 Nash Finch Company 17,000 0.12
800 NBTY Incorporated 25,600 0.18
700 Netflix Incorporated 18,200 0.13
900 Nordstrom Incorporated 27,000 0.19
440 Northeast Utilities 11,440 0.08
2,284 Northern Trust Corporation 157,596 1.09
1,165 Omnicom Group Incorporated 52,425 0.36
1,050 Papa John’s International Incorporated 28,350 0.19
2,461 Parametric Technology Corporation 41,837 0.29
950 Patterson-UTI Energy Incorporated 34,200 0.24
1,120 Penson Worldwide Incorporated 13,440 0.09
1,350 Petroquest Energy Incorporated 36,450 0.25
3,018 PG&E Corporation 120,720 0.83
347 Priceline.com Incorporated 39,905 0.28
700 Pride International Incorporated 32,900 0.23
2,077 Procter & Gamble Company 126,697 0.88
370 Questar Corporation 26,270 0.18
5,245 Raymond James Financial Incorporated 136,370 0.96
400 Salesforce.com Incorporated 27,200 0.19
491 SBA Communications Corporation 17,676 0.12
1,050 Sepracor Incorporated 21,000 0.15
Number of Shares
ValueUSD
% ofFund
Number of Shares
ValueUSD
% ofFund
THE ACCOMPANYING NOTES ARE AN INTEGRAL PART OF THESE FINANCIAL STATEMENTS.
U.S. EQUITIES (46.60%) U.S. EQUITIES (Continued)

68
2,180 Sierra Pacific Resources $28,340 0.19
800 Steel Dynamics Incorporated 31,200 0.22
400 Sunoco Incorporated 16,400 0.11
150 Sunpower Corporation 10,800 0.08
700 Superior Energy Services 38,500 0.27
567 Target Corporation 26,082 0.18
2,740 Teradyne Incorporated 30,140 0.21
498 Terex Corporation 25,398 0.18
400 Terra Industries Incorporated 19,600 0.14
550 Timken Company 18,150 0.13
375 Transocean Incorporated 57,000 0.40
800 Tupperware Brands Corporation 27,200 0.19
250 United States Cellular Corporation 14,000 0.10
265 United States Steel Corporation 49,025 0.34
610 United Technologies Corporation 37,820 0.26
1,750 Varian Medical Systems Incorporated 90,738 0.63
500 Watson Wyatt Worldwide Incorporated 26,500 0.18
1,200 Wolverine World Wide Incorporated 32,400 0.23
Total U.S. Equities $6,703,563 46.60
NON-U.S. EQUITIES (53.98%)
874 Actelion NV $46,322 0.32
1,757 Aggreko PLC 26,355 0.18
30,747 Air Arabia 15,320 0.11
649 Allianz SE 114,224 0.79
597 Alstom 137,907 0.96
1,090 ArcelorMittal 107,910 0.75
410 Arch Capital Group Limited 27,060 0.19
2,100 Astellas Pharma Incorporated 88,200 0.61
510 Astral Media Incorporated 16,056 0.11
3,003 Axa SA 90,090 0.63
5,046 BAE Systems PLC 45,414 0.32
2,810 Balfour Beatty PLC 22,480 0.16
4,801 Banco Santander Central Hispano SA 86,418 0.60
6,242 Bank of Cyprus PCL 74,904 0.52
2,080 Barrick Gold Corporation 95,680 0.67
85 Barry Callebaut AG 55,420 0.39
176 Basilea Pharmaceutical AG 28,512 0.20
1,615 BAT Industries PLC 56,525 0.39
434 Bayer AG 36,456 0.25
9,998 Beazley Group PLC 19,996 0.14
607 Beiersdorf AG 44,918 0.31
4,354 BG Group PLC 113,204 0.79
3,167 BHP Billiton PLC 120,346 0.84
1,014 BHP Billiton Limited 42,588 0.30
570 BioMerieux 64,980 0.45
900 Black Earth Farming Ltd. 6,794 0.05
700 BML Incorporated 13,300 0.09
824 BNP Paribas SA 74,984 0.52
4,792 BP PLC 57,504 0.40
8,104 Britvic PLC 48,624 0.34
219 Burckhardt Compression Holding AG 66,576 0.46
900 Capcom Company Limited 26,100 0.18
7,887 Centennial Coal Company Limited 39,435 0.27
42,000 Chartered Semiconductor Manufacturing Limited 42,000 0.29
884 Clarkson PLC $16,796 0.12
1,400 Commerzbank AG 42,000 0.29
2,840 Cookson Group PLC 34,080 0.24
1,700 Daiichi Sankyo Company Limited 45,900 0.32
300 Disco Corporation 12,600 0.09
11,965 Domino’s Pizza UK & IRL PLC 47,860 0.33
43,457 DP World Limited 37,373 0.26
5,706 Enel SpA 57,060 0.40
4,500 Esprit Holdings Limited 45,000 0.31
2,932 Gemalto NV 105,552 0.73
355 Gerresheimer AG 19,880 0.14
4,074 Gildan Activewear Incorporated 104,953 0.73
2,204 GlaxoSmithKline PLC 48,488 0.34
1,400 Glory Limited 32,947 0.23
2,290 Goals Soccer Centres PLC 11,450 0.08
1,160 Grontmij NV 48,720 0.34
8,862 Hansen Transmissions International NV 44,310 0.31
3,548 Hargreaves Lansdown PLC 10,644 0.07
4,200 Hemisphere GPS Incorporated 17,999 0.13
3,000 Hitachi Metals Limited 48,000 0.33
700 Hogy Medical Company Limited 35,700 0.25
170 Honam Petrochemical, Corporation 12,070 0.08
690 Hyundai Department Store Company Limited 55,890 0.39
6,398 ICAP PLC 70,378 0.49
6,695 IG Group Holdings PLC 46,865 0.33
583 IMS-International Metal Service 19,822 0.14
66,000 Industrial & Commercial Bank of China 66,000 0.46
2,220 Industrial & Financial Systems 19,980 0.14
3,534 ING Canada Incorporated 123,485 0.86
8,268 ING Industrial Fund 8,268 0.06
1,004 Ingenico 35,140 0.24
1,345 JC Decaux SA 33,625 0.23
1,900 Komatsu Limited 53,200 0.37
826 Konecranes OYJ 33,866 0.24
797 Lanxess AG 32,677 0.23
891 Leoni AG 38,313 0.27
327 LG Chemical Limited 31,392 0.22
25,500 Link REIT 51,000 0.36
600 Lukoil 58,200 0.41
1,800 Lupatech SA 66,600 0.46
4,632 MacArthur Coal Limited 74,112 0.52
1,562 Medion AG 24,992 0.17
2,000 Mitsubishi Estate Company Limited 46,000 0.32
2,000 Mitsui & Company Limited 44,000 0.31
4,000 Mitsui O.S.K. Lines Limited 56,000 0.39
22 NET One Systems Company Limited 24,486 0.17
650 New Oriental Education & Technology Group ADR 37,700 0.26
677 Nexans SA 83,271 0.58
1,501 Nexen Incorporated 60,040 0.42
300 Nihon Dempa Kogyo Co Limited 6,300 0.04
300 Nissha Printing Company Limited 17,400 0.12
1,100 NOK Corporation 17,600 0.12
869 Novartis AG 47,795 0.33
2,200 Novo Nordisk A/S 143,000 0.99
6,000 NSK Limited 54,000 0.38
372 Nutreco Holding NV 24,924 0.17
Putnam Global Growth Fund
THE ACCOMPANYING NOTES ARE AN INTEGRAL PART OF THESE FINANCIAL STATEMENTS.
Number of Shares
ValueUSD
% ofFund
Number of Shares
ValueUSD
% ofFund
NON-U.S. EQUITIES (Continued)U.S. EQUITIES (Continued)
Number of Shares
ValueUSD
% ofFund

69
62,295 NZ Farming Systems Uruguay Limited $82,552 0.57
1,600 Oilexco Incorporated 30,604 0.21
14,000 Olam International Limited 28,000 0.20
1,650 Petroleum Geo-Services ASA 41,250 0.29
6,516 Prudential PLC 71,676 0.50
1,260 PVA TePla AG 13,860 0.10
42,000 Raffles Education Corporation Limited 42,000 0.29
8,566 Raven Russia Limited 17,132 0.12
2,714 Reckitt Benckiser PLC 138,414 0.96
5,470 Redes Energeticas Nacionais SA 21,880 0.15
308 Rio Tinto Limited 40,040 0.28
243 Roche Holding AG 43,740 0.30
2,159 Rogers Communications 83,949 0.58
1,334 Rotork PLC 29,348 0.20
1,487 Royal Dutch Shell PLC 60,967 0.42
255 Salzgitter AG 46,410 0.32
16 Samantha Thavasa Japan Limited 18,110 0.13
198 Samsung Electronics Company Limited 118,404 0.82
1,600 Sanei-International Company Limited 25,600 0.18
8,000 SembCorp Industries Limited 24,000 0.17
27 Seven Bank Limited 59,859 0.42
3,000 Sharp Corporation 48,000 0.33
400 Shima Seiki Manufacturing Limited 10,904 0.08
5,000 Snow Brand Milk Products Company Limited 20,000 0.14
620 Sonova Holdings AG 50,840 0.35
20 Sony Financial Holdings Incorporated 80,360 0.56
262 Stallergenes 22,532 0.16
4,279 Standard Chartered PLC 119,812 0.83
34,000 StarHub Limited 66,000 0.46
4,002 Statoil ASA 148,074 1.03
1,488 Suez SA 101,184 0.70
6 Sumitomo Mitsui Financial Group Incorporated 45,048 0.31
2,000 Sumitomo Realty & Development Company Limited 40,000 0.28
1,200 Suncor Energy Incorporated 69,600 0.48
700 Suzuken Company Limited 25,900 0.18
1,798 Swissquote Group Holding SA 79,112 0.55
4,000 Tanabe Seiyaku Company Limited 52,000 0.36
10,885 Taylor Nelson Sofres PLC 54,425 0.38
812 Technicas Reunidas SA 67,396 0.47
3,134 Telefonica SA 84,618 0.59
895 Teva Pharmaceutical Industries Limited ADR 41,170 0.29
4,561 TGS Nopec Geophysical Company ASA 63,854 0.44
1,011 Tognum AG 27,297 0.19
20,347 Torex Retail PLC 4 —
8,000 Toshiba Corporation 56,000 0.39
2,290 Total SA 194,650 1.35
1,000 Toyo Suisan Kaisha Limited 23,000 0.16
5,208 Troy Resources NL 10,416 0.07
1,900 Tsumura & Company 49,400 0.34
6,000 Ube Industries Limited 24,000 0.17
2,957 United Internet AG 59,140 0.41
154 Vallourec SA 54,054 0.38
350 Vestas Wind Systems A/S 45,850 0.32
26 Vetropack Holding AG 58,656 0.41
1,308 Victrex PLC 19,620 0.14
132 Vilmorin & Cie $24,948 0.17
3,356 Vivendi SA 127,528 0.89
6,000 VTech Holdings Limited 36,000 0.25
130 Wereldhave NV 13,650 0.10
4,500 Western Goldfields Incorporated 10,350 0.07
1,700 Westjet Airlines Limited 22,842 0.16
1,000 Wing Hang Bank Limited 13,000 0.09
794 Xstrata PLC 63,520 0.44
222 Zurich Financial Services AG 56,832 0.40
Total Non-U.S. Equities $7,757,686 53.98
Total Value of Investments $14,461,249 100.58
Putnam Global Growth Fund
Number of Shares
ValueUSD
% ofFund
NON-U.S. EQUITIES (Continued)
Number of Shares
ValueUSD
% ofFund
NON-U.S. EQUITIES (Continued)
THE ACCOMPANYING NOTES ARE AN INTEGRAL PART OF THESE FINANCIAL STATEMENTS.

70
Putnam Global Growth Fund
THE ACCOMPANYING NOTES ARE AN INTEGRAL PART OF THESE FINANCIAL STATEMENTS.
FORWARD FOREIGN EXCHANGE CURRENCY CONTRACTS (0.01%)
16/07/2008 AUD 478,200 USD 433,933 Bank of America Securities $(24,109) (0.17)
16/07/2008 USD 14,571 CAD 14,800 Citibank NA (27) —
16/07/2008 AUD 38,200 USD 36,402 Citibank NA (140) —
16/07/2008 USD 42,919 AUD 45,400 Credit Suisse First Boston 510 —
16/07/2008 USD 2,972 CAD 3,000 Credit Suisse First Boston (24) —
16/07/2008 USD 58,522 AUD 64,900 Deutsche Bank, London 3,561 (0.03)
16/07/2008 CAD 14,100 USD 14,041 Deutsche Bank, London 185 —
16/07/2008 USD 39,208 AUD 41,600 Goldman Sachs International 586 —
16/07/2008 USD 463,189 AUD 515,800 HSBC Bank USA 30,223 0.21
16/07/2008 AUD 63,000 USD 56,743 JP Morgan Chase Bank (3,522) (0.02)
16/07/2008 CAD 99.300 USD 97,653 JP Morgan Chase Bank 70 —
16/07/2008 USD 317,897 AUD 354,600 Lehman Brothers* 21,319 0.15
16/07/2008 CAD 14,800 USD 14,480 Lehman Brothers* (64) —
16/07/2008 USD 39,207 AUD 41,600 Merrill Lynch 587 —
16/07/2008 AUD 52,000 USD 46,805 State Street Bank & Trust (2,938) (0.02)
16/07/2008 CAD 79,200 USD 77,699 UBS AG (132) —
16/07/2008 USD 112,500 AUD 123,700 UBS AG 6,305 (0.04)
16/07/2008 CAD 40,700 USD 40,669 Westpac Banking Group 672 —
16/07/2008 USD 152,719 AUD 170,200 Westpac Banking Group 10.093 0.07
17/09/2008 CHF 4,800 USD 4,587 Bank of America Securities (123) —
17/09/2008 USD 61,380 SEK 372,300 Bank of America Securities 219 —
17/09/2008 USD 39,781 GBP 20,500 Bank of America Securities 836 0.01
17/09/2008 USD 169,033 NOK 871,400 Citibank NA 952 0.01
17/09/2008 USD 50,782 GBP 26,100 Citibank NA 931 0.01
17/09/2008 EUR 210,100 USD 325,275 Citibank NA (4,290) (0.03)
17/09/2008 EUR 200 USD 310 Credit Suisse First Boston (4) —
17/09/2008 USD 24,792 NOK 128,300 Credit Suisse First Boston 236 —
17/09/2008 USD 76,618 GBP 39,200 Credit Suisse First Boston 1,050 0.01
17/09/2008 EUR 24,400 USD 37,789 Deutsche Bank, London (484) —
17/09/2008 USD 49,665 GBP 25,000 Goldman Sachs International 1,057 0.01
17/09/2008 USD 202,710 NOK 1,044,000 HSBC Bank USA 945 0.01
17/09/2008 USD 84,978 GBP 43,400 HSBC Bank USA 1,010 0.01
17/09/2008 EUR 23,600 USD 36,858 HSBC Bank USA (161) —
17/09/2008 USD 84,914 CHF 88,600 JP Morgan Chase Bank 2,038 —
17/09/2008 NOK 1,377,500 USD 267,078 Lehman Brothers* (1,634) (0.01)
17/09/2008 CHF 66,100 USD 63,314 Lehman Brothers* (1,556) (0.01)
17/09/2008 USD 108,982 EUR 70,300 Lehman Brothers* 1,291 0.01
17/09/2008 USD 236,596 NOK 1,219,700 Merrill Lynch 1,333 0.01
17/09/2008 USD 38,229 GBP 19,600 Merrill Lynch 603 —
17/09/2008 USD 48,324 EUR 31,200 Merrill Lynch 611 (0.02)
17/09/2008 CHF 512,500 USD 491,159 Merrill Lynch (11,806) (0.08)
17/09/2008 EUR 24,800 USD 38,409 State Street Bank & Trust (492) —
17/09/2008 USD 206,166 CHF 214,100 UBS AG 3,950 0.03
17/09/2008 EUR 355,100 USD 550,085 UBS AG (6925) (0.05)
17/09/2008 USD 108,762 GBP 55,600 UBS AG 1,399 0.01
17/09/2008 USD 103,102 NOK 533,100 UBS AG 891 0.01
SettlementDates
CurrencySold
AmountSold
CurrencyBought
AmountBought Counterparty
Unrealised Appreciation/
(Depreciation)USD
% ofFund

71
Putnam Global Growth Fund
17/09/2008 USD 176,545 GBP 90,900 Westpac Banking Group $3,556 0.03
20/08/2008 JPY 8,199,900 USD 78,162 Bank of America Securities 603 —
20/08/2008 JPY 1,786,100 USD 17,005 Citibank NA 111 —
20/08/2008 USD 474,729 JPY 49,777,600 Goldman Sachs International (3.905) (0.03)
20/08/2008 JPY 16,770,100 USD 159,941 UBS AG 1,263 0.01
Net Unrealised Appreciation on Forward Foreign Exchange Currency Contracts $36,660 0.01
Total Financial Assets at Fair Value through Profit or Loss $14,497,909 100.79
* Please refer to note 12 Subsequent events for more detail.
Analysis of Investments (Unaudited)
(a) Transferable securities admitted to official stock exchange listing 80.47
(b) Transferable securities dealt in on another regulated market —
(c) Transferable securities other than those admitted to official stock exchange listing or dealt in on another regulated market —
(d) Collective Investment Schemes —
(e) OTC financial derivative instruments 0.69
(f ) Exchange traded financial derivative instruments 18.84
(g) Other assets —
Total Investments 100.00
% ofTotal Assets
FORWARD FOREIGN EXCHANGE CURRENCY CONTRACTS (Continued)
THE ACCOMPANYING NOTES ARE AN INTEGRAL PART OF THESE FINANCIAL STATEMENTS.
SettlementDates
CurrencySold
AmountSold
CurrencyBought
AmountBought Counterparty
Unrealised Appreciation/
(Depreciation)USD
% ofFund

72
Putnam Global High Yield Bond Fund
Schedule of Investments
30 June 2008
$925,000 AccellentIncorporated 10.50 01/12/2013 $846,375 0.30
825,000 Activant SolutionsIncorporated 9.50 01/05/2016 651,750 0.23
1,174,000 Advanced Micro Devices Incorporated 7.75 01/11/2012 1,012,575 0.36
16,000 AES Corporation 8.75 15/05/2013 16,620 0.01
220,000 AES Corporation 8.00 01/06/2020 212,300 0.08
110,000 AES Corporation 8.00 15/10/2017 107,800 0.04
645,000 Affinion Group Incorporated 10.13 15/10/2013 646,613 0.23
290,000 Affinion Group Incorporated 11.50 15/10/2015 289,275 0.10
415,000 Affinity Group Incorporated 9.00 15/02/2012 365,200 0.13
735,000 Airgas Incorporated 7.13 01/10/2018 740,513 0.26
1,150,000 AK Steel Corporation 7.75 15/06/2012 1,152,875 0.41
35,000 Aleris International Incorporated 10.00 15/12/2016 25,638 0.01
1,555,000 Aleris International Incorporated 9.00 15/12/2014 1,238,169 0.44
70,000 Algoma Acquisition Corporation 9.88 15/06/2015 66,500 0.02
510,000 Allegheny Energy Supply 8.25 15/04/2012 531,675 0.19
370,000 Alliant Techsystems Incorporated 6.75 01/04/2016 358,900 0.13
1,755,000 Allied Waste North America Incorporated 6.50 15/11/2010 1,755,000 0.63
1,295,000 Allison Transmission 11.00 01/11/2015 1,159,025 0.41
1,085,000 AMC Entertainment Incorporated 11.00 01/02/2016 1,074,150 0.38
5,000 AMC Entertainment Incorporated 8.00 01/03/2014 4,438 —
175,000 American Media Incorporated 8.88 15/01/2011 140,000 0.05
925,000 American Media Incorporated 10.25 01/05/2009 744,625 0.27
6,363 American Media Incorporated 8.88 15/01/2011 5,186 —
15,453 American Media Incorporated 10.25 01/05/2009 12,440 —
1,220,000 American Tower Corporation 7.00 15/10/2017 1,207,800 0.43
570,000 Amkor Technologies Incorporated 7.75 15/05/2013 528,675 0.19
35,000 AMR Holding Company Incorporated 10.00 15/02/2015 37,100 0.01
1,110,000 Arch Western Finance 6.75 01/07/2013 1,087,800 0.39
5,787 Archibald Candy Corporation 10.00 01/11/2008 85 —
1,695,000 Ardagh Glass Finance PLC 7.13 15/06/2017 2,188,954 0.78
2,055,012 Asset Repackaging Trust BV 12.27 21/12/2011 3,139,346 1.12
1,345,000 Associated Materials Incorporated 9.75 15/04/2012 1,331,550 0.48
100,000 Atlantic Broadband Finance 9.38 15/01/2014 92,000 0.03
545,000 Avago Technologies Finance 10.13 01/12/2013 577,700 0.21
40,000 Avis Budget Car Rental LLC 7.75 15/05/2016 30,700 0.01
$840,000 Avis Budget Car Rental LLC 7.63 15/05/2014 $672,000 0.24
255,000 Baldor Electric Company 8.63 15/02/2017 255,638 0.09
125,000 Barry Callebaut Services NV 6.00 13/07/2017 175,540 0.06
570,000 BBC Holding Corporation 8.88 15/09/2014 493,050 0.18
410,000 Berry Plastics Corporation 7.57 15/02/2015 392,575 0.14
1,000,000 Blount Incorporated 8.88 01/08/2012 1,000,000 0.36
323,109 Boats Investments BV 12.23 15/12/2015 330,762 0.12
150,000 Bombardier Incorporated 7.25 15/11/2016 223,715 0.08
710,000 Bombardier Incorporated 7.98 15/11/2013 1,116,837 0.40
410,000 Bon-Ton Stores Incorporated 10.25 15/03/2014 269,063 0.10
65,000 Boyd Gaming Corporation 6.75 15/04/2014 50,050 0.02
560,000 Boyd Gaming Corporation 7.13 01/02/2016 413,000 0.15
150,000 Buffets Incorporated 12.50 01/11/2014 2,250 —
335,000 Builders FirstSource Incorporated 6.93 15/02/2012 227,800 0.08
450,000 Cablecom SCA 8.00 01/11/2016 619,408 0.22
940,000 Cablevision Systems Corporation 8.00 15/04/2012 888,300 0.32
445,000 CanWest Media Incorporated 8.00 15/09/2012 396,050 0.14
1,654,000 CCH I Holdings LLC 11.00 01/10/2015 1,226,028 0.44
1,111,000 CCH II Holdings LLC 10.25 15/09/2010 1,074,893 0.38
1,490,000 CCH II Holdings LLC 10.25 15/09/2010 1,437,850 0.51
700,000 Celestica Incorporated 7.63 01/07/2013 672,000 0.24
115,000 Celestica Incorporated 7.88 01/07/2011 115,000 0.04
950,000 Centennial Cellular Operating Company LLC 10.13 15/06/2013 978,500 0.35
884,000 Central European Distribution Corporation 8.00 25/07/2012 1,352,534 0.48
745,000 Ceva Group PLC 8.50 01/12/2014 840,670 0.30
1,296,000 Chaparral Energy Incorporated 8.50 01/12/2015 1,124,280 0.40
25,000 Chaparral Energy Incorporated 8.88 01/02/2017 21,688 0.01
200,000 CHC Helicopter Corporation 7.38 01/05/2014 207,500 0.07
1,905,000 Chesapeake Energy Corporation 7.50 15/09/2013 1,905,000 0.68
400,000 Chesapeake Energy Corporation 7.00 15/08/2014 392,000 0.14
1,510,000 Chiquita Brands International Incorporated 7.50 01/11/2014 1,230,650 0.44
10,000 Chiquita Brands International Incorporated 8.88 01/12/2015 8,750 —
40,000 Church & Dwight Company Incorporated 6.00 15/12/2012 38,400 0.01
610,000 Cinemark Incorporated 0.00 15/03/2014 579,500 0.21
THE ACCOMPANYING NOTES ARE AN INTEGRAL PART OF THESE FINANCIAL STATEMENTS.
PrincipalAmounts
CouponRate %
MaturityDates
ValueUSD
% ofFund
PrincipalAmounts
CouponRate %
MaturityDates
ValueUSD
% ofFund
CORPORATE BONDS & NOTES (Continued)CORPORATE BONDS & NOTES (88.85%)

73
$660,000 Citizens Communications Company 9.25 15/05/2011 $683,100 0.24
510,000 Clondalkin Industries BV 8.00 15/03/2014 641,756 0.23
1,095,000 Codere Finance Luxembourg SA 8.25 15/06/2015 1,471,012 0.52
123,000 Colorado Interstate Gas Company 6.80 15/11/2015 125,639 0.04
1,455,000 Community Health Systems Incorporated 8.88 15/07/2015 1,464,094 0.52
1,670,000 Complete Production Services Incorporated 8.00 15/12/2016 1,667,913 0.60
1,185,000 Compton Petroleum Corporation 7.63 01/12/2013 1,164,263 0.42
175,000 Compucom Systems Incorporated 12.50 01/10/2015 160,125 0.06
90,000 Comstock Resources Incorporated 6.88 01/03/2012 88,425 0.03
1,285,000 Connacher Oil and Gas Limited 10.25 15/12/2015 1,355,675 0.48
1,320,000 Cricket Communications Incorporated 9.38 01/11/2014 1,270,500 0.45
775,000 Crown Americas LLC 7.63 15/11/2013 773,063 0.28
1,370,000 CSC Holdings Incorporated 7.63 01/04/2011 1,342,600 0.48
60,000 D.R. Horton Incorporated 8.00 01/02/2009 59,850 0.02
765,000 D.R. Horton Incorporated 5.00 15/01/2009 750,656 0.27
690,000 DaVita Incorporated 6.63 15/03/2013 662,400 0.24
645,000 Dean Foods Company 7.00 01/06/2016 559,538 0.20
85,000 Del Monte Corporation 6.75 15/02/2015 80,963 0.03
1,235,000 Del Monte Corporation 8.63 15/12/2012 1,253,525 0.45
85,000 Denbury Resources Incorporated 7.50 01/04/2013 84,788 0.03
565,000 Denbury Resources Incorporated 7.50 15/12/2015 562,175 0.20
95,000 Dex Media Incorporated 0.00 15/11/2013 67,925 0.02
260,000 Digicel Group Limited 8.88 15/01/2015 245,375 0.09
375,000 Digicel Limited 9.25 01/09/2012 385,781 0.14
215,000 DirecTV Holdings LLC 7.63 15/05/2016 211,775 0.08
1,350,000 DirecTV Holdings LLC 6.38 15/06/2015 1,265,625 0.45
109,000 Dresser-Rand Group Incorporated 7.38 01/11/2014 107,638 0.04
1,130,000 Dynegy Holdings Incorporated 7.50 01/06/2015 1,042,425 0.37
285,000 Dynegy Holdings Incorporated 8.38 01/05/2016 276,450 0.10
125,000 E*Trade Financial Corporation 8.00 15/06/2011 115,000 0.04
320,000 Echostar DBS Corporation 7.00 01/10/2013 304,800 0.11
1,530,000 Echostar DBS Corporation 6.38 01/10/2011 1,476,450 0.53
1,730,000 Edison Mission Energy 7.75 15/06/2016 1,721,350 0.61
110,000 Edison Mission Energy 7.20 15/05/2019 102,575 0.04
95,000 Edison Mission Energy 7.00 15/05/2017 88,825 0.03
300,000 El Paso Corporation 7.75 15/01/2032 300,535 0.11
270,000 El Paso Corporation 7.80 01/08/2031 272,025 0.10
$545,000 El Paso Corporation 7.00 15/06/2017 $533,385 0.19
150,000 El Paso Natural Gas Company 8.63 15/01/2022 166,449 0.06
1,140,000 Elan Finance PLC/Elan Finance Corporation 7.75 15/11/2011 1,121,475 0.40
315,000 Elizabeth Arden Incorporated 7.75 15/01/2014 295,313 0.11
675,000 Encore Acquisition Company 6.00 15/07/2015 634,500 0.23
420,000 Escada AG 7.50 01/04/2012 508,661 0.18
675,000 EXCO Resources Incorporated 7.25 15/01/2011 663,188 0.24
1,340,000 Ferrellgas LP/Finance 6.75 01/05/2014 1,222,750 0.44
635,000 Ford Motor Credit Company 7.88 15/06/2010 548,105 0.20
3,735,000 Ford Motor Credit Company 9.88 10/08/2011 3,137,719 1.12
920,000 Ford Motor Credit Corporation 7.25 25/10/2011 712,964 0.25
1,335,000 Forest Oil Corporation 8.00 15/12/2011 1,375,050 0.49
390,000 Freeport-McMoRan Copper & Gold Incorporated 8.25 01/04/2015 402,675 0.14
2,625,000 Freeport-McMoRan Copper & Gold Incorporated 8.38 01/04/2017 2,775,938 0.99
115,000 Freeport-McMoRan Copper & Gold Incorporated 5.88 01/04/2015 115,027 0.04
2,440,000 Freescale Semiconductor Incorporated 8.88 15/12/2014 1,982,500 0.71
260,000 Freescale Semiconductor Incorporated 9.13 15/12/2014 202,150 0.07
440,000 Freescale Semiconductor Incorporated 10.13 15/12/2016 335,500 0.12
375,000 General Cable Corporation 5.07 01/04/2015 332,813 0.12
1,935,000 General Motors Corporation 7.20 15/01/2011 1,489,950 0.53
1,310,000 Georgia-Pacific Corporation 9.50 01/12/2011 1,331,288 0.47
455,000 Gerdau Ameristeel Corporation 10.38 15/07/2011 472,631 0.17
189,000 Gerresheimer Holdings GmbH 7.88 01/03/2015 294,382 0.11
315,000 Global Crossing UK Finance PLC 11.75 15/12/2014 617,812 0.22
530,000 GMAC LLC 6.88 15/09/2011 380,843 0.14
1,460,000 GMAC LLC 6.75 01/12/2014 964,250 0.34
530,000 GMAC LLC 6.88 28/08/2012 362,932 0.13
2,955,000 GMAC LLC 7.75 19/01/2010 2,526,912 0.90
70,000 GMAC LLC 4.88 01/12/2014 46,014 0.02
1,015,000 Goodyear Tire & Rubber Company 9.00 01/07/2015 1,012,463 0.36
410,000 Greenbrier Cos. Incorporated 8.38 15/05/2015 390,525 0.14
1,320,000 Hanesbrands Incorporated 6.51 15/12/2014 1,227,600 0.44
1,665,000 Harrah’s Operating Company Incorporated 10.75 01/02/2016 1,381,950 0.49
10,000 Harry & David Holdings Incorporated 9.00 01/03/2013 8,800 —
Putnam Global High Yield Bond Fund
THE ACCOMPANYING NOTES ARE AN INTEGRAL PART OF THESE FINANCIAL STATEMENTS.
CORPORATE BONDS & NOTES (Continued) CORPORATE BONDS & NOTES (Continued)
PrincipalAmounts
CouponRate %
MaturityDates
ValueUSD
% ofFund
PrincipalAmounts
CouponRate %
MaturityDates
ValueUSD
% ofFund

74
$10,000 Harry & David Holdings Incorporated 7.68 01/03/2012 $8,400 —
85,000 Harvest Operations Corporation 7.88 15/10/2011 80,750 0.03
785,000 Hawker Beechcraft Acquisition Company LLC 9.75 01/04/2017 785,000 0.28
100,000 Hawker Beechcraft Acquisition Company LLC 8.88 01/04/2015 100,500 0.04
2,850,000 HCA Incorporated 9.13 15/11/2014 2,914,125 1.04
45,000 HCA Incorporated 9.63 15/11/2016 46,350 0.02
1,850,000 HCA Incorporated 9.25 15/11/2016 1,905,500 0.68
80,000 HCA Incorporated 6.38 15/01/2015 66,400 0.02
200,000 HCA Incorporated 7.88 01/02/2011 197,000 0.07
1,440,000 Health Management Associates Incorporated 6.13 15/04/2016 1,260,000 0.45
1,410,000 Helix Energy Solutions Group Incorporated 9.50 15/01/2016 1,445,250 0.52
220,000 Hellas Telecommunications Luxembourg III 8.50 15/10/2013 293,120 0.10
855,000 Hellas Telecommunications Luxembourg V 8.25 15/10/2012 1,242,183 0.44
1,310,000 Hercules Incorporated 6.75 15/10/2029 1,270,700 0.45
1,670,000 Hertz Corporation 8.88 01/01/2014 1,528,050 0.55
1,340,000 Hexcel Corporation 6.75 01/02/2015 1,303,150 0.46
510,000 Hexion U.S. Finance Corporation/Hexion Nova Scotia Finance ULC 9.75 15/11/2014 461,550 0.16
1,160,000 Host Marriott LP 7.00 15/08/2012 1,096,200 0.39
50,000 HUB International Holdings Incorporated 10.25 15/06/2015 41,000 0.01
200,000 HUB International Holdings Incorporated 9.00 15/12/2014 181,000 0.06
115,000 HUB International Holdings Incorporated 9.00 15/12/2014 104,075 0.04
80,000 HUB International Holdings Incorporated 10.25 15/06/2015 65,600 0.02
50,000 Huntsman International LLC 6.88 15/11/2013 67,406 0.02
590,000 Huntsman International LLC 7.88 15/11/2014 539,850 0.19
1,000 Huntsman LLC 11.63 15/10/2010 1,033 —
1,340,000 IASIS Healthcare/IASIS Capital Corporation 8.75 15/06/2014 1,353,400 0.48
2,130,000 Idearc Incorporated 8.00 15/11/2016 1,339,238 0.48
510,000 Iesy Hessen GmbH & Company 7.72 15/04/2013 762,878 0.27
435,000 Iesy Repository GmbH 8.75 15/02/2015 617,601 0.22
1,335,000 Inergy LP/Inergy Finance Corporation 6.88 15/12/2014 1,241,550 0.44
1,010,000 Inmarsat Finance PLC 0.00 15/11/2012 1,020,100 0.36
1,436,000 Intelsat Bermuda Limited 11.25 15/06/2016 1,455,745 0.52
15,000 Intelsat Intermediate Holding Company Limited 0.00 01/02/2015 12,075 —
$515,000 International Paper Company 7.40 15/06/2014 $515,181 0.18
35,000 Ion Media Networks Incorporated 8.96 15/01/2013 22,575 0.01
530,000 Ipalco Enterprises Incorporated 7.25 01/04/2016 522,050 0.19
40,000 iPCS Incorporated 5.00 01/05/2013 36,000 0.01
85,000 Iron Mountain Incorporated 8.75 15/07/2018 87,550 0.03
1,620,000 Iron Mountain Incorporated 8.63 01/04/2013 1,630,125 0.58
290,000 Iron Mountain Incorporated 8.00 15/06/2020 285,288 0.10
1,075,000 Jarden Corporation 7.50 01/05/2017 935,250 0.33
85,000 Jefferson Smurfit Corporation 8.25 01/10/2012 74,163 0.03
761,000 Jostens IH Corporation 7.63 01/10/2012 747,683 0.27
300,000 K. Hovnanian Enterprises Incorporated 11.50 01/05/2013 311,250 0.11
615,000 Kabel Deutscheland GmbH 10.75 01/07/2014 960,331 0.34
1,270,000 Key Energy Services Incorporated 8.38 01/12/2014 1,295,400 0.46
1,000,000 L-3 Communications Corporation 6.13 15/01/2014 937,500 0.33
235,000 Lamar Media Corporation 7.25 01/01/2013 225,894 0.08
130,000 Lamar Media Corporation 6.63 15/08/2015 118,300 0.04
690,000 Lamar Media Corporation 6.63 15/08/2015 627,900 0.22
1,305,000 Lear Corporation 8.50 01/12/2013 1,078,256 0.38
210,000 Legrand SA 8.50 15/02/2025 236,117 0.08
580,000 Lender Processing Services Incorporated 8.13 01/07/2016 580,725 0.21
736,000 Leucadia National Corporation 8.13 15/09/2015 739,680 0.26
325,000 Level 3 Financing Incorporated 8.75 15/02/2017 279,500 0.10
1,695,000 Level 3 Financing Incorporated 9.25 01/11/2014 1,542,450 0.55
335,000 Levi Strauss & Company 8.88 01/04/2016 325,788 0.12
1,665,000 Levi Strauss & Company 9.75 15/01/2015 1,673,325 0.60
120,000 Liberty Media LLC 5.70 15/05/2013 107,541 0.04
145,000 Liberty Media LLC 7.88 15/07/2009 146,411 0.05
310,000 Liberty Mutual Group 10.75 15/06/2058 302,373 0.11
980,000 Lottomatica SpA 8.25 31/03/2066 1,398,183 0.50
15,000 Lucent Technologies Incorporated 5.50 15/11/2008 14,963 0.01
490,000 Lucent Technologies Incorporated 6.45 15/03/2029 374,850 0.13
540,000 Manitowoc Company Incorporated 7.13 01/11/2013 513,000 0.18
315,000 Marquee Holdings Incorporated 12.00 15/08/2014 247,275 0.09
1,150,000 Mashantucket Western Pequot Tribe 8.50 15/11/2015 1,014,875 0.36
1,560,000 Massey Energy Company 6.63 15/11/2010 1,560,000 0.56
15,000 Meritage Homes Corporation 7.00 01/05/2014 12,150 —
225,000 Meritage Homes Corporation 6.25 15/03/2015 180,563 0.06
Putnam Global High Yield Bond Fund
THE ACCOMPANYING NOTES ARE AN INTEGRAL PART OF THESE FINANCIAL STATEMENTS.
CORPORATE BONDS & NOTES (Continued) CORPORATE BONDS & NOTES (Continued)
PrincipalAmounts
CouponRate %
MaturityDates
ValueUSD
% ofFund
PrincipalAmounts
CouponRate %
MaturityDates
ValueUSD
% ofFund

75
$135,000 Meritor Automotive Incorporated 6.80 15/02/2009 $132,806 0.05
1,305,000 Metals USA Incorporated 11.13 01/12/2015 1,357,200 0.48
670,000 MetroPCS Wireless Incorporated 9.25 01/11/2014 644,875 0.23
285,000 MGM Mirage Incorporated 6.00 01/10/2009 280,369 0.10
1,415,000 MGM Mirage Incorporated 8.50 15/09/2010 1,397,313 0.50
350,000 Michaels Stores Incorporated 10.00 01/11/2014 303,188 0.11
955,000 Michaels Stores Incorporated 11.38 01/11/2016 759,225 0.27
805,000 Mirant Americas Generation Incorporated 8.30 01/05/2011 833,175 0.30
335,000 Mirant North America LLC 7.38 31/12/2013 332,069 0.12
1,065,000 Momentive Performance MaterialsIncorporated 9.75 01/12/2014 910,575 0.32
145,000 Moog Incorporated 7.25 15/06/2018 143,550 0.05
1,030,000 Mosaic Company 7.63 01/12/2016 1,096,950 0.39
85,000 Nalco Company 9.00 15/11/2013 132,662 0.05
1,610,000 Neiman-Marcus Group Incorporated 9.00 15/10/2015 1,589,875 0.57
370,000 Newfield Exploration Company 7.13 15/05/2018 351,500 0.13
1,340,000 Newfield Exploration Company 6.63 01/09/2014 1,259,600 0.45
1,230,000 NewPage Corporation 10.00 01/05/2012 1,245,375 0.44
85,960 NewPage Holding Corporation 9.99 01/11/2013 82,951 0.03
1,495,000 Nielsen Finance LLC/Nielsen Finance Company 10.00 01/08/2014 1,541,719 0.55
15,000 Nielsen Finance LLC/Nielsen Finance Company 10.00 01/08/2014 15,113 0.01
425,000 Nielsen Finance LLC/Nielsen Finance Company 0.00 01/08/2016 292,188 0.10
800,000 Nordic Telephone Company Holdings 8.25 01/05/2016 1,136,448 0.41
75,000 Nordic Telephone Company Holdings 8.88 01/05/2016 73,500 0.03
670,000 Norske Skog Canada Limited 8.63 15/06/2011 569,500 0.20
295,000 Nortel Networks Limited 10.75 15/07/2016 292,050 0.10
180,000 Nortel Networks Limited 10.75 15/07/2016 178,200 0.06
595,000 Nortel Networks Limited 6.96 15/07/2011 562,275 0.20
955,000 Novelis Incorporated 7.25 15/02/2015 902,475 0.32
335,000 NRG Energy Incorporated 7.25 01/02/2014 319,925 0.11
525,000 NRG Energy Incorporated 7.38 15/01/2017 496,125 0.18
2,140,000 NRG Energy Incorporated 7.38 01/02/2016 2,014,275 0.72
390,000 NTK Holdings Incorporated 0.00 01/03/2014 177,450 0.06
930,000 Nuveen Investments Incorporated 10.50 15/11/2015 857,925 0.31
$2,085,000 NXP BV/NXP Funding LLC 7.88 15/10/2014 $1,918,200 0.68
910,000 Omnicare Incorporated 6.13 01/06/2013 832,650 0.30
800,000 Ono Finance II PLC 8.00 16/05/2014 857,376 0.31
1,230,000 Open Solutions Incorporated 9.75 01/02/2015 1,002,450 0.36
15,000 Open Solutions Incorporated 9.75 01/02/2015 12,225 —
735,000 Orion Power Holdings Incorporated 12.00 01/05/2010 793,800 0.28
40,000 Outback Steakhouse Incorporated 10.00 15/06/2015 25,900 0.01
600,000 Owens Brockway Glass Container Incorporated 6.75 01/12/2014 600,000 0.21
65,000 Owens-Brockway Glass Container Incorporated 6.75 01/12/2014 93,974 0.03
1,105,000 PAETEC Holding Corporation 9.50 15/07/2015 1,019,363 0.36
340,000 Peabody Energy Corporation 7.38 01/11/2016 339,150 0.12
2,040,000 Peabody Energy Corporation 6.88 15/03/2013 2,045,100 0.73
640,000 PetroHawk Energy Corporation 9.13 15/07/2013 656,000 0.23
1,055,000 Petroleum Development Corporation 12.00 15/02/2018 1,115,663 0.40
1,330,000 Petroplus Finance Limited 7.00 01/05/2017 1,173,725 0.42
100,000 Pinnacle Entertainment Incorporated 7.50 15/06/2015 76,500 0.03
1,185,000 Pinnacle Entertainment Incorporated 8.25 15/03/2012 1,164,263 0.42
250,000 Pinnacle Foods Finance LLC 9.25 01/04/2015 220,000 0.08
50,000 Pinnacle Foods Finance LLC 10.63 01/04/2017 40,000 0.01
80,000 Plains Exploration & Production Company 7.75 15/06/2015 80,600 0.03
1,665,000 Plains Exploration & Production Company 7.00 15/03/2017 1,598,400 0.57
1,110,000 PNM Resources Incorporated 9.25 15/05/2015 1,146,075 0.41
987,000 Prestige Brands Incorporated 9.25 15/04/2012 987,000 0.35
1,080,000 Pride International Incorporated 7.38 15/07/2014 1,077,300 0.38
1,335,000 Psychiatric Solutions Incorporated 7.75 15/07/2015 1,321,650 0.47
335,000 Public Service Company of New Mexico 7.95 15/05/2018 344,673 0.12
110,000 Quebecor Media Incorporated 7.75 15/03/2016 102,300 0.04
2,435,000 Qwest Communications International Incorporated 7.50 15/02/2014 2,313,250 0.83
85,000 Qwest Corporation 7.25 15/09/2025 75,225 0.03
95,000 Qwest Corporation 8.88 15/03/2012 96,900 0.03
5,000 R.H. Donnelley Corporation 6.88 15/01/2013 2,975 —
770,000 R.H. Donnelley Incorporated 11.75 15/05/2015 700,700 0.25
Putnam Global High Yield Bond Fund
THE ACCOMPANYING NOTES ARE AN INTEGRAL PART OF THESE FINANCIAL STATEMENTS.
CORPORATE BONDS & NOTES (Continued) CORPORATE BONDS & NOTES (Continued)
PrincipalAmounts
CouponRate %
MaturityDates
ValueUSD
% ofFund
PrincipalAmounts
CouponRate %
MaturityDates
ValueUSD
% ofFund

76
Putnam Global High Yield Bond Fund
THE ACCOMPANYING NOTES ARE AN INTEGRAL PART OF THESE FINANCIAL STATEMENTS.
$220,000 Range Resources Corporation 7.25 01/05/2018 $217,800 0.08
1,155,000 RBS Global Incorporated/RexnordCorporation 9.50 01/08/2014 1,114,575 0.40
175,000 Reader’s Digest Association Incorporated 9.00 15/02/2017 127,750 0.05
245,000 Reader’s Digest Association Incorporated 9.00 15/02/2017 178,850 0.06
1,335,000 Realogy Corporation 10.50 15/04/2014 927,825 0.33
720,000 Reliant Resources Incorporated 6.75 15/12/2014 734,400 0.26
335,000 Reliant Resources Incorporated 7.63 15/06/2014 326,625 0.12
110,000 Rexam PLC 6.75 29/06/2067 134,226 0.05
205,000 Reynolds American Incorporated 7.25 01/06/2013 211,915 0.08
1,130,000 Rhodia SA 7.50 15/10/2013 1,584,767 0.57
75,000 Rite Aid Corporation 9.38 15/12/2015 50,250 0.02
290,000 Rite Aid Corporation 7.50 01/03/2017 234,175 0.08
580,000 Rite Aid Corporation 8.13 01/05/2010 585,800 0.21
215,000 Rockwood Specialties Group Incorporated 7.63 14/11/2014 307,791 0.11
60,000 Rouse Co LP/TRC Co-Issuer Incorporated 6.75 01/05/2013 54,062 0.02
125,000 Rural Cellular Corporation 9.88 01/02/2010 127,188 0.05
55,000 Rural Cellular Corporation 5.68 01/06/2013 55,688 0.02
1,285,000 Ryerson Tull Incorporated 12.00 01/11/2015 1,275,363 0.46
345,000 Sabine Pass LNG 7.25 30/11/2013 313,950 0.11
470,000 SandRidge Energy Incorporated 8.00 01/06/2018 472,350 0.17
70,000 Sealy Mattress Company 8.25 15/06/2014 57,400 0.02
1,070,000 Seat Pagine Gialle SpA 8.00 30/04/2014 1,262,172 0.45
1,450,000 Select Medical Corporation 7.63 01/02/2015 1,272,375 0.45
1,175,000 Seminole Hard Rock Entertainment Incorporated 5.28 15/03/2014 994,344 0.35
50,000 Service Corporation International 6.75 01/04/2016 47,375 0.02
1,185,000 Sierra Pacific Resources 8.63 15/03/2014 1,242,253 0.44
490,000 Sirius Satellite Radio Incorporated 9.63 01/08/2013 396,900 0.14
65,000 Smurfit Kappa Funding PLC 7.75 01/04/2015 90,750 0.03
415,000 Smurfit-Stone Container Enterprises Incorporated 8.00 15/03/2017 332,000 0.12
50,000 SPCM SA 8.25 15/06/2013 73,115 0.03
1,120,000 Spectrum Brands Incorporated 7.38 01/02/2015 705,600 0.25
225,000 Spectrum Brands Incorporated 12.00 02/10/2013 184,500 0.07
1,565,000 Sprint Capital Corporation 8.75 15/03/2032 1,490,663 0.53
1,685,000 Sprint Nextel Corporation 6.00 01/12/2016 1,449,100 0.52
1,275,000 Stallion Oilfield Finance Corporation 9.75 01/02/2015 1,090,125 0.39
$900,000 Station Casinos Incorporated 6.00 01/04/2012 $715,500 0.26
955,000 Steel Dynamics Incorporated 7.38 01/11/2012 955,000 0.34
395,000 Steel Dynamics Incorporated 6.75 01/04/2015 378,213 0.13
305,000 Stewart Enterprises Incorporated 6.25 15/02/2013 289,750 0.10
610,000 Stichting Participate I Regs 17.00 29/09/2049 883,834 0.32
675,000 Stone Container Corporation 8.38 01/07/2012 592,313 0.21
885,000 Sun Healthcare Group Incorporated 9.13 15/04/2015 885,000 0.32
560,000 SunGard Data Systems Incorporated 10.25 15/08/2015 562,800 0.20
1,370,000 SunGard Data Systems Incorporated 9.13 15/08/2013 1,383,700 0.49
115,000 Surgical Care Affiliates Incorporated 10.00 15/07/2017 89,700 0.03
1,050,000 Surgical Care Affiliates Incorporated 8.88 15/07/2015 918,750 0.33
30,000 Surgical Care Affiliates Incorporated 10.00 15/07/2017 23,400 0.01
30,000 Surgical Care Affiliates Incorporated 8.88 15/07/2015 26,250 0.01
520,000 Syniverse Technologies Incorporated 7.75 15/08/2013 488,800 0.17
1,360,000 Targa Resources Incorporated 8.50 01/11/2013 1,332,800 0.48
1,290,000 TD Funding Corporation 7.75 15/07/2014 1,273,875 0.45
125,000 Teco Finance Incorporated 7.00 01/05/2012 130,348 0.05
440,000 Tenet Healthcare Corporation 7.38 01/02/2013 413,600 0.15
325,000 Tenet Healthcare Corporation 6.50 01/06/2012 306,313 0.11
2,100,000 Tenet Healthcare Corporation 6.38 01/12/2011 2,010,750 0.72
195,000 Tenneco Automotive Incorporated 8.63 15/11/2014 172,088 0.06
98,000 Tenneco Automotive Incorporated 10.25 15/07/2013 102,533 0.04
150,000 Tenneco Incorporated 8.13 15/11/2015 135,750 0.05
15,000 Tennessee Gas PipelineCompany 7.00 15/10/2028 14,629 0.01
1,345,000 Tennessee Gas PipelineCompany 7.50 01/04/2017 1,417,136 0.51
145,000 Tereos Europe 6.38 15/04/2014 176,180 0.06
1,405,000 Terex Corporation 7.38 15/01/2014 1,383,925 0.49
800,000 Texas Competitive Electric Holdings Company LLC 10.25 01/11/2015 784,000 0.28
2,020,000 Texas Competitive Electric Holdings Company LLC 10.25 01/11/2015 1,979,570 0.71
145,000 THL Buildco Incorporated 10.00 01/12/2013 138,475 0.05
1,215,000 THL Buildco Incorporated 8.50 01/09/2014 777,600 0.28
630,000 Time Warner Telecom Incorporated 9.25 15/02/2014 644,175 0.23
1,215,000 Titan International Incorporated 8.00 15/01/2012 1,190,700 0.43
385,000 Toll Brothers Incorporated 8.25 01/02/2011 373,450 0.13
CORPORATE BONDS & NOTES (Continued) CORPORATE BONDS & NOTES (Continued)
PrincipalAmounts
CouponRate %
MaturityDates
ValueUSD
% ofFund
PrincipalAmounts
CouponRate %
MaturityDates
ValueUSD
% ofFund
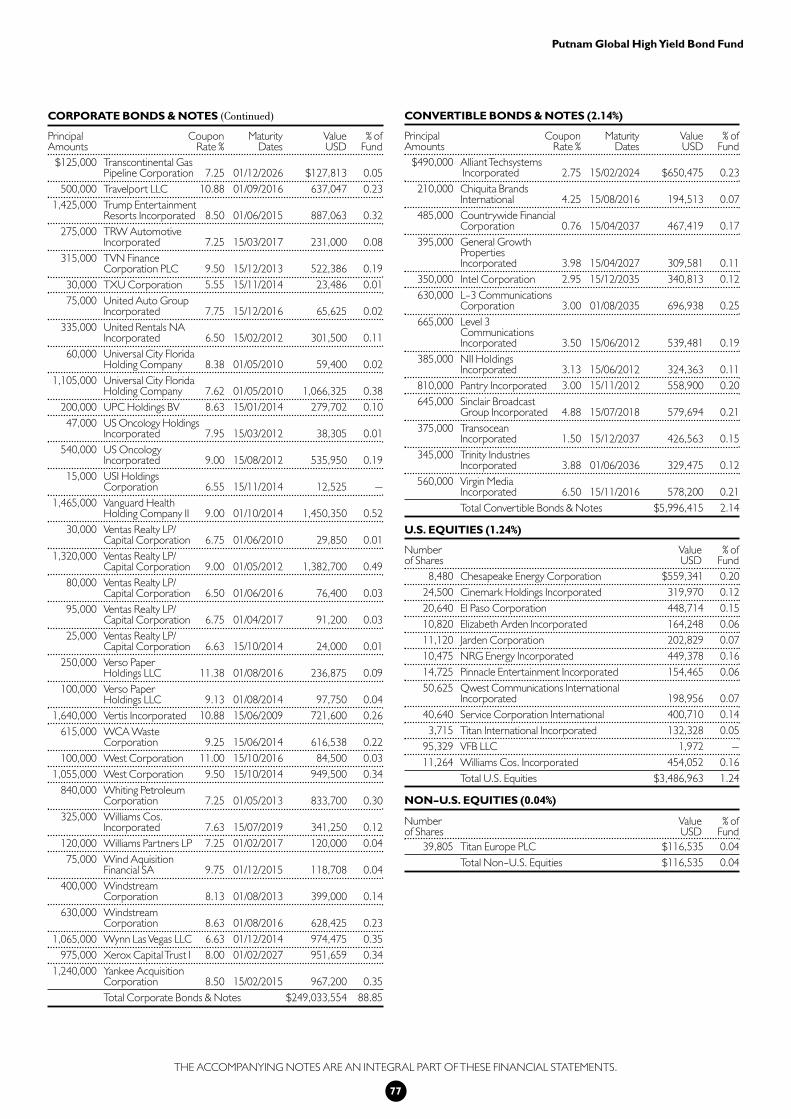
77
Putnam Global High Yield Bond Fund
THE ACCOMPANYING NOTES ARE AN INTEGRAL PART OF THESE FINANCIAL STATEMENTS.
$125,000 Transcontinental Gas Pipeline Corporation 7.25 01/12/2026 $127,813 0.05
500,000 Travelport LLC 10.88 01/09/2016 637,047 0.23
1,425,000 Trump Entertainment Resorts Incorporated 8.50 01/06/2015 887,063 0.32
275,000 TRW Automotive Incorporated 7.25 15/03/2017 231,000 0.08
315,000 TVN Finance Corporation PLC 9.50 15/12/2013 522,386 0.19
30,000 TXU Corporation 5.55 15/11/2014 23,486 0.01
75,000 United Auto Group Incorporated 7.75 15/12/2016 65,625 0.02
335,000 United Rentals NA Incorporated 6.50 15/02/2012 301,500 0.11
60,000 Universal City Florida Holding Company 8.38 01/05/2010 59,400 0.02
1,105,000 Universal City Florida Holding Company 7.62 01/05/2010 1,066,325 0.38
200,000 UPC Holdings BV 8.63 15/01/2014 279,702 0.10
47,000 US Oncology HoldingsIncorporated 7.95 15/03/2012 38,305 0.01
540,000 US Oncology Incorporated 9.00 15/08/2012 535,950 0.19
15,000 USI Holdings Corporation 6.55 15/11/2014 12,525 —
1,465,000 Vanguard Health Holding Company II 9.00 01/10/2014 1,450,350 0.52
30,000 Ventas Realty LP/Capital Corporation 6.75 01/06/2010 29,850 0.01
1,320,000 Ventas Realty LP/Capital Corporation 9.00 01/05/2012 1,382,700 0.49
80,000 Ventas Realty LP/Capital Corporation 6.50 01/06/2016 76,400 0.03
95,000 Ventas Realty LP/Capital Corporation 6.75 01/04/2017 91,200 0.03
25,000 Ventas Realty LP/Capital Corporation 6.63 15/10/2014 24,000 0.01
250,000 Verso Paper Holdings LLC 11.38 01/08/2016 236,875 0.09
100,000 Verso Paper Holdings LLC 9.13 01/08/2014 97,750 0.04
1,640,000 Vertis Incorporated 10.88 15/06/2009 721,600 0.26
615,000 WCA Waste Corporation 9.25 15/06/2014 616,538 0.22
100,000 West Corporation 11.00 15/10/2016 84,500 0.03
1,055,000 West Corporation 9.50 15/10/2014 949,500 0.34
840,000 Whiting Petroleum Corporation 7.25 01/05/2013 833,700 0.30
325,000 Williams Cos. Incorporated 7.63 15/07/2019 341,250 0.12
120,000 Williams Partners LP 7.25 01/02/2017 120,000 0.04
75,000 Wind Aquisition Financial SA 9.75 01/12/2015 118,708 0.04
400,000 Windstream Corporation 8.13 01/08/2013 399,000 0.14
630,000 Windstream Corporation 8.63 01/08/2016 628,425 0.23
1,065,000 Wynn Las Vegas LLC 6.63 01/12/2014 974,475 0.35
975,000 Xerox Capital Trust I 8.00 01/02/2027 951,659 0.34
1,240,000 Yankee Acquisition Corporation 8.50 15/02/2015 967,200 0.35
Total Corporate Bonds & Notes $249,033,554 88.85
CORPORATE BONDS & NOTES (Continued)
PrincipalAmounts
CouponRate %
MaturityDates
ValueUSD
% ofFund
CONVERTIBLE BONDS & NOTES (2.14%)
$490,000 Alliant TechsystemsIncorporated 2.75 15/02/2024 $650,475 0.23
210,000 Chiquita Brands International 4.25 15/08/2016 194,513 0.07
485,000 Countrywide Financial Corporation 0.76 15/04/2037 467,419 0.17
395,000 General Growth Properties Incorporated 3.98 15/04/2027 309,581 0.11
350,000 Intel Corporation 2.95 15/12/2035 340,813 0.12
630,000 L-3 Communications Corporation 3.00 01/08/2035 696,938 0.25
665,000 Level 3 Communications Incorporated 3.50 15/06/2012 539,481 0.19
385,000 NII Holdings Incorporated 3.13 15/06/2012 324,363 0.11
810,000 Pantry Incorporated 3.00 15/11/2012 558,900 0.20
645,000 Sinclair Broadcast Group Incorporated 4.88 15/07/2018 579,694 0.21
375,000 Transocean Incorporated 1.50 15/12/2037 426,563 0.15
345,000 Trinity Industries Incorporated 3.88 01/06/2036 329,475 0.12
560,000 Virgin Media Incorporated 6.50 15/11/2016 578,200 0.21
Total Convertible Bonds & Notes $5,996,415 2.14
U.S. EQUITIES (1.24%)
8,480 Chesapeake Energy Corporation $559,341 0.20
24,500 Cinemark Holdings Incorporated 319,970 0.12
20,640 El Paso Corporation 448,714 0.15
10,820 Elizabeth Arden Incorporated 164,248 0.06
11,120 Jarden Corporation 202,829 0.07
10,475 NRG Energy Incorporated 449,378 0.16
14,725 Pinnacle Entertainment Incorporated 154,465 0.06
50,625 Qwest Communications International Incorporated 198,956 0.07
40,640 Service Corporation International 400,710 0.14
3,715 Titan International Incorporated 132,328 0.05
95,329 VFB LLC 1,972 —
11,264 Williams Cos. Incorporated 454,052 0.16
Total U.S. Equities $3,486,963 1.24
NON-U.S. EQUITIES (0.04%)
39,805 Titan Europe PLC $116,535 0.04
Total Non-U.S. Equities $116,535 0.04
PrincipalAmounts
CouponRate %
MaturityDates
ValueUSD
% ofFund
Number of Shares
ValueUSD
% ofFund
Number of Shares
ValueUSD
% ofFund

CREDIT DEFAULT CONTRACTS OUTSTANDING (-0.06%)
Bank of America, N.A.Abitibibowater Inc., 6 1/2%, 6/15/13 $75,000 20/12/2008 550 bp $(2,379) —Nalco, Co. 7.75%,11/15/11 25,000 20/09/2012 350 bp (484) —
Citibank, N.A.Abitibibowater Inc., 6 1/2%, 6/15/13 75,000 20/12/2008 725 bp (1,775) —Abitibibowater Inc., 6 1/2%, 6/15/13 75,000 20/12/2008 800 bp (1,516) —Abitibibowater Inc., 6 1/2%, 6/15/13 75,000 20/12/2008 825 bp (1,430) —Amkor Technologies, Inc., 7 3/4%, 5/15/13 260,000 20/06/2013 450 bp (15,018) (0.01)Wind Acquisition 9 3/4%, 12/1/15 (45,000) 20/03/2013 (495 bp) (933) —
Credit Suisse InternationalAdvanced Micro Devices, 7 3/4%, 11/1/12 55,000 20/06/2009 165 bp (2,166) —Dynegy Holdings Inc., 6 7/8%, 4/1/11 40,000 20/06/2017 297 bp (4,420) —Echostar DBS Corp., 6 5/8%, 10/1/14 (320,000) 20/06/2013 (225 bp) 10,481 —
Deutsche Bank AGGrohe Holding GmbH, 8 5/8%, 10/1/14 500,000 20/06/2009 400 bp 4,584 —Kabel Deutsch GmbH, 10.75%, 7/1/14 (200,000) 20/03/2013 490 bp 6,693 —Smurfit Kappa Funding, 10 1/8%, 10/1/12 125,000 20/06/2009 135 bp (173) —Nalco, Co. 7.75%, 11/15/11 15,000 20/12/2012 363 bp (297) —Ono Finance II, 8%, 5/16/14 200,000 20/03/2013 635 bp (40,264) (0.01)
Goldman Sachs InternationalKabel Deutsch GmbH, 10.75%, 7/1/14 (205,000) 20/03/2013 457 bp 10,657 —Ono Finance II, 8%, 5/16/14 205,000 20/03/2013 600 bp (42,231) (0.02)Rhodia SA, Euribor +275, 10/15/13 (65,000) 20/09/2013 387 bp 1,542 —Rhodia SA, Euribor +275, 10/15/13 (80,000) 20/09/2013 367 bp 2,903 —UPC Holding BV 7.75%, 1/15/14 495,000 20/09/2013 496 bp (5,774) —
JPMorgan Chase Bank, N.A.Kabel Deutsch GmbH, 10.75%, 7/1/14 (100,000) 20/03/2013 515 bp 1,943 —Kabel Deutsch GmbH, 10.75%, 7/1/14 (105,000) 20/03/2013 515 bp 2,041 —Ono Finance II, 8%, 5/16/14 100,000 20/03/2013 655 bp (19,189) (0.01)Ono Finance II, 8%, 5/16/14 105,000 20/03/2013 655 bp (20,148) (0.01)Smurfit-Stone Container Enterprises, 7 1/2%, 6/1/13 130,000 (F) 20/03/2013 685 bp (7,275) —
Lehman Brothers Special Financing, Inc.**Community Health Systems, 8 7/8%, 7/15/15 $313,000 20/12/2012 360 bp $(11,471) —Jefferson Smurfit Corp., 7 1/2%, 6/1/13 205,000 (F) 20/03/2013 645 bp (14,167) —Mediacom LLC Cap Corp, 9 1/2%, 1/15/13 580,000 20/06/2013 740 bp (14,430) —Sungard Data Systems, Inc., 9 1/8%, 8/15/13 50,000 20/09/2012 395 bp (779) —
Merrill Lynch InternationalDynegy Holdings Inc., 6 7/8%, 4/1/11 40,000 20/06/2017 295 bp (4,465) —
Morgan Stanley Capital Services, Inc.Aramark Services, Inc., 8.5%, 2/1/15 115,000 20/12/2012 355 bp (5,444) —Dynegy Holdings Inc., 6 7/8%, 4/1/11 40,000 20/06/2012 225 bp (2,667) —Nalco Co. 7.75%, 11/15/11 25,000 20/09/2012 330 bp (669) —Nalco Co. 7.75%, 11/15/11 215,000 20/03/2013 460 bp 2,735 —
Net Unrealised Depreciation on Credit Default Contracts $(175,985) (0.06)
* Payments related to the reference debt are made upon a credit default event.
** Please refer to note 12 Subsequent events for more detail.
(F) Is valued at fair value following procedures approved by the Manager.
Swap counterparty/ Referenced debt*
Notional Amount
TerminationDate
Fixed paymentsreceived (paid)
by Fund per annum
Unrealised Appreciation/
(Depreciation)USD
% ofFund
Putnam Global High Yield Bond Fund
78
9,900 Crown Castle International Corporation $568,013 0.20
12,640 Digital Realty Trust Incorporated 290,720 0.11
5,780 Emmis Communications Corporation 141,610 0.05
3,403 Freeport-McMoRan Copper & Gold Incorporated 570,428 0.20
545 Interpublic Group of Companies Incorporated 446,734 0.16
669 Lehman Brothers Holdings Incorporated* 538,164 0.19
Total Convertible Preferred Stocks $2,555,669 0.91
FOREIGN GOVERNMENT BONDS & NOTES (0.01%)
$65,000 Republic of Argentina 0.00 30/04/2013 $30,940 0.01
Total Foreign Government Bonds & Notes $30,940 0.01
MUTUAL FUNDS (1.96%)
$5,500,000 U.S. Liquid Assets Fund 20.06 31/12/2049 $5,500,000 1.96
Total Mutual Funds $5,500,000 1.96
REPURCHASE AGREEMENTS (3.50%)
$9,797,000 Repurchase Agreement- Bank of America 2.25 01/07/2008 $9,797,000 3.50
Total Repurchase Agreements $9,797,000 3.50
Total Value of Investments $276,517,076 98.65
* Please refer to note 12 Subsequent events for more detail.
CONVERTIBLE PREFERRED STOCKS (0.91%)
THE ACCOMPANYING NOTES ARE AN INTEGRAL PART OF THESE FINANCIAL STATEMENTS.
Number of Shares
ValueUSD
% ofFund
PrincipalAmount
CouponRate %
MaturityDate
ValueUSD
% ofFund
PrincipalAmount
CouponRate %
MaturityDate
ValueUSD
% ofFund
PrincipalAmount
CouponRate %
MaturityDate
ValueUSD
% ofFund

79
Putnam Global High Yield Bond Fund
THE ACCOMPANYING NOTES ARE AN INTEGRAL PART OF THESE FINANCIAL STATEMENTS.
INTEREST RATE SWAP CONTRACTS OUTSTANDING (-0.01%)
JPMorgan Chase Bank, N.A.$16,000,000 09/06/2013 3 month USD-LIBOR-BBA 4.21875% $(22,240) (0.01)
Net Unrealised Depreciation on Interest Rate Swap Contracts $(22,240) (0.01)
Swap counterparty
Notional Amount
TerminationDate
Payments madeby Fund
per annum
Payments received by Fund
per annum
Unrealised (Depreciation)
USD% of
Fund
FORWARD FOREIGN EXCHANGE CURRENCY CONTRACTS (-0.10%)
17/09/2008 USD 729,734 EUR 462,400 JP Morgan Chase Bank $588 —
17/09/2008 GBP 327,800 USD 636,760 Westpac Banking Group (12,713) (0.01)
17/09/2008 EUR 8,097,500 USD 12,544,109 UBS AG (157,645) (0.06)
17/09/2008 USD 654,600 EUR 422,781 UBS AG 8,609 —
17/09/2008 EUR 594,800 USD 921,345 Merrill Lynch (11,659) (0.01)
17/09/2008 EUR 307,000 USD 475,700 Credit Suisse First Boston (5,861) (0.01)
17/09/2008 EUR 564,400 USD 878,601 Lehman Brothers* (6,718) (0.01)
17/09/2008 EUR 8,136,400 USD 12,601,087 Deutsche Bank, London (161,686) (0.07)
17/09/2008 EUR 84,200 USD 130,502 Citibank NA (1,574) —
17/09/2008 USD 47,300 EUR 30,645 Westpac Banking Group 773 —
17/09/2008 USD 157,600 EUR 101,875 Merrill Lynch 2,209 —
17/09/2008 USD 68,300 EUR 44,164 Citibank NA 980 —
17/09/2008 USD 5,000 EUR 3,228 HSBC Bank USA 64 —
17/09/2008 USD 38,700 GBP 19,952 Deutsche Bank, London 837 —
17/09/2008 USD 635,100 GBP 327,127 Westpac Banking Group 13,117 0.01
Net Unrealised Depreciation on Forward Foreign Exchange Currency Contracts $(330,679) (0.10)
Total Financial Assets at Fair Value through Profit or Loss $276,517,076 98.65
Total Financial Liabilities at Fair Value through Profit or Loss $(528,904) (0.23)
* Please refer to note 12 Subsequent events for more detail.
Analysis of Investments (Unaudited)
(a) Transferable securities admitted to official stock exchange listing 90.93
(b) Transferable securities dealt in on another regulated market —
(c) Transferable securities other than those admitted to official stock exchange listing or dealt in on another regulated market - repurchase agreement 3.41
(d) Collective Investment Schemes - mutual funds 1.91
(e) OTC financial derivative instruments - forwards/swaps 0.03
(f ) Exchange traded financial derivative instruments - futures/options —
(g) Other assets 3.72
Total Investments 100.00
% ofTotal Assets
SettlementDates
CurrencySold
AmountSold
CurrencyBought
AmountBought Counterparty
Unrealised Appreciation/
(Depreciation)USD
% ofFund

80
Putnam Growth and Income (U.S. Value Equity) Fund
Schedule of Investments
30 June 2008
1,200 3M Company $83,412 0.47
1,750 Abbott Laboratories 92,505 0.52
3,000 Allstate Corporation 136,530 0.77
8,100 American International Group Incorporated 213,678 1.21
2,250 AmerisourceBergen Corporation 89,933 0.51
2,800 Amgen Incorporated 132,048 0.75
250 Ambac Financial Group Incorporated 4,413 0.02
1,400 Apache Corporation 194,502 1.10
12,650 AT&T Incorporated 424,914 2.40
950 Avnet Incorporated 25,850 0.15
9,200 Bank of America Corporation 218,684 1.24
1,050 Baxter International Incorporated 67,053 0.38
38 Berkshire Hathaway Incorporated (Class B) 152,418 0.86
700 Best Buy Company Incorporated 27,664 0.16
1,250 Big Lots Incorporated 38,975 0.22
1,600 Boeing Company 105,136 0.59
10,100 Boston Scientific Corporation 123,927 0.70
5,600 Brunswick Corporation 59,304 0.34
7,050 Capital One Financial Corporation 267,689 1.51
1,610 Cardinal Health Incorporated 82,915 0.47
1,700 Career Education Corporation 24,837 0.14
550 Carnival Corporation 18,106 0.10
1,850 Caterpillar Incorporated 136,382 0.77
2,250 Celanese Corporation 102,713 0.58
2,700 Chevron Corporation 267,354 1.51
1,350 Chubb Corporation 66,164 0.37
3,800 Cisco Systems Incorporated 88,388 0.50
7,839 Citigroup Incorporated 130,833 0.74
4,650 Clorox Company 242,730 1.37
1,150 Colgate–Palmolive Company 79,373 0.45
950 ConocoPhillips 89,471 0.51
1,900 Corning Incorporated 43,795 0.25
5,668 Countrywide Financial Corporation 24,089 0.14
3,777 Covidien Limited 180,843 1.02
850 Crown Holdings Incorporated 22,041 0.12
1,200 Devon Energy Corporation 144,036 0.81
5,600 E.I. du Pont de Nemours & Company 240,016 1.36
6,400 Edison International 328,448 1.86
600 Eli Lilly & Company 27,654 0.16
400 Embarq Corporation 18,908 0.11
4,550 EMC Corporation 66,749 0.38
2,050 Emerson Electric Company 101,270 0.57
600 Energizer Holdings Incorporated 43,854 0.25
1,210 Entergy Corporation 145,527 0.82
1,800 Exelon Corporation 161,784 0.91
7,800 Exxon Mobil Corporation 685,152 3.87
810 Fannie Mae* 15,795 0.09
1,500 FirstEnergy Corporation 123,375 0.70
17,624 Ford Motor Company 84,771 0.48
7,500 Freddie Mac* 122,700 0.69
1,500 Freeport-McMoRan Copper & Gold Incorporated (Class B) 175,770 0.99
4,150 General Electric Company 110,307 0.62
12,815 Genworth Financial Incorporated (Class A) 227,466 1.29
4,050 Global Industries Limited 72,617 0.41
1,655 Goldman Sachs Group Incorporated 288,665 1.63
900 Harley-Davidson Incorporated $32,598 0.18
17,900 Health Management Associates Incorporated (Class A) 116,529 0.66
2,240 Hewlett-Packard Company 98,829 0.56
6,530 Home Depot Incorporated 152,541 0.86
2,050 Honeywell International Incorporated 102,951 0.58
2,450 Hospira Incorporated 98,245 0.56
780 Huntsman Corporation 8,876 0.05
1,750 IBM Corporation 207,043 1.17
8,385 Idearc Incorporated 19,537 0.11
7,550 Intel Corporation 162,174 0.92
2,450 JC Penney Company Incorporated 88,886 0.50
4,550 Johnson & Johnson 292,474 1.65
10,145 JPMorgan Chase & Company 348,075 1.97
5,957 Kraft Foods Incorporated (Class A) 169,477 0.96
650 L-3 Communications Holdings Incorporated 59,066 0.33
4,550 Lehman Brothers Holdings Incorporated* 89,408 0.51
3,800 Lennar Corporation 46,550 0.26
1,900 Lockheed Martin Corporation 187,264 1.06
3,050 Loews Corporation 143,015 0.81
400 iShares Russell 2000 Growth Index Fund 27,588 0.16
8,850 Marathon Oil Corporation 458,784 2.59
7,850 Masco Corporation 123,402 0.70
1,300 Mattel Incorporated 22,256 0.13
1,850 Medtronic Incorporated 95,571 0.54
1,400 Merck & Company Incorporated 52,710 0.30
3,150 MGIC Investment Corporation 19,026 0.11
5,600 Microsoft Corporation 154,168 0.87
2,350 Molson Coors Brewing Company (Class B) 127,676 0.72
3,707 Morgan Stanley 133,526 0.75
2,088 Newell Rubbermaid Incorporated 35,016 0.20
450 Norfolk Southern Corporation 28,170 0.16
1,150 Northrop Grumman Corporation 76,935 0.43
700 Nucor Corporation 52,269 0.30
2,600 Occidental Petroleum Corporation 233,428 1.32
1,750 Omnicom Group Incorporated 78,295 0.44
4,412 Parametric Technology Corporation 73,548 0.42
1,680 Parker-Hannifin Corporation 119,633 0.68
4,850 Pepsi Bottling Group Incorporated 135,267 0.76
23,980 Pfizer Incorporated 418,451 2.37
7,560 PG&E Corporation 299,754 1.69
450 Philip Morris International Incorporated 22,190 0.13
1,900 PMI Group Incorporated 3,686 0.02
500 PNC Financial Services Group 28,505 0.16
8,450 Procter & Gamble Company 513,000 2.90
1,550 Quest Diagnostics Incorporated 75,020 0.42
12,595 Qwest Communications International Incorporated 49,246 0.28
3,750 Radian Group Incorporated 5,400 0.03
2,450 Rohm & Haas Company 113,778 0.64
3,080 Service Corporation International 30,307 0.17
2,410 Sierra Pacific Resources 30,583 0.17
12,800 Sprint Nextel Corporation 121,344 0.69
7,100 Staples Incorporated 168,554 0.95
1,030 Supervalu Incorporated 31,765 0.18
8,250 Symantec Corporation 159,638 0.90
THE ACCOMPANYING NOTES ARE AN INTEGRAL PART OF THESE FINANCIAL STATEMENTS.
Number of Shares
ValueUSD
% ofFund
Number of Shares
ValueUSD
% ofFund
U.S. EQUITIES (Continued)U.S. EQUITIES (91.38%)

81
1,600 Textron Incorporated $76,688 0.43
3,850 TJX Cos. Incorporated 121,083 0.68
2,100 Toll Brothers Incorporated 39,333 0.22
650 Transocean Incorporated 98,917 0.56
14,200 U.S. Bancorp 394,760 2.23
2,100 United Technologies Corporation 129,465 0.73
1,000 UnitedHealth Group Incorporated 26,250 0.15
2,100 Valero Energy Corporation 86,415 0.49
15,850 Verizon Communications Incorporated 559,981 3.17
2,030 Wal-Mart Stores Incorporated 113,883 0.64
7,250 Walt Disney Company 225,983 1.28
3,950 Waste Management Incorporated 148,797 0.84
800 Watson Pharmaceuticals Incorporated 21,704 0.12
450 WellPoint Incorporated 21,402 0.12
6,170 Wells Fargo & Company 146,044 0.83
1,050 WESCO International Incorporated 41,937 0.24
1,200 Wisconsin Energy Corporation 54,253 0.31
3,606 Wyndham Worldwide Corporation 64,475 0.36
700 Xerox Corporation 9,478 0.05
Total U.S. Equities $16,166,408 91.38
Putnam Growth and Income (U.S. Value Equity) Fund
THE ACCOMPANYING NOTES ARE AN INTEGRAL PART OF THESE FINANCIAL STATEMENTS.
Number of Shares
ValueUSD
% ofFund
5,910 ACE Limited $325,110 1.84
4,700 BP PLC 326,650 1.85
1,401 Everest Reinsurance Group Limited 111,660 0.63
4,700 Nexen Incorporated 186,496 1.05
3,450 Total SA 293,871 1.66
877 Tyco Electronics Limited 31,414 0.18
2,077 Tyco International Limited 83,163 0.47
Total Non-U.S. Equities $1,358,364 7.68
REPURCHASE AGREEMENTS (0.78%)
$138,000 Repurchase Agreement- Goldman Sachs 2.33 01/07/2008 $138,000 0.78
Total Repurchase Agreements $138,000 0.78
Total Value of Investments $17,662,772 99.83
* Please refer to note 12 Subsequent events for more detail.
Number of Shares
ValueUSD
% ofFund
NON-U.S. EQUITIES (7.68%)U.S. EQUITIES (Continued)
FORWARD FOREIGN EXCHANGE CURRENCY CONTRACTS (0.03%)
17/09/2008 GBP 3,100 EUR 3,912 HSBC Bank USA $(6) —
17/09/2008 USD 31,800 EUR 20,551 Lehman Brothers* 439 —
17/09/2008 USD 210,350 EUR 135,856 UBS AG 2,766 0.02
17/09/2008 EUR 2,717 USD 4,200 Bank of America Securities (62) —
17/09/2008 USD 104,100 EUR 68,584 Merrill Lynch 1,488 0.01
17/09/2008 EUR 8,014 USD 12,400 Credit Suisse First Boston (172) —
17/09/2008 EUR 38,348 USD 59,300 Citibank NA (857) —
17/09/2008 USD 13,500 EUR 8,721 JP Morgan Chase Bank 182 —
17/09/2008 USD 7,000 EUR 4,519 HSBC Bank USA 90 —
Net Unrealised Appreciation on Forward Foreign Exchange Currency Contracts $3,868 0.03
Total Financial Assets at Fair Value through Profit or Loss $17,666,640 99.89
* Please refer to note 12 Subsequent events for more detail.
Analysis of Investments (Unaudited)
(a) Transferable securities admitted to official stock exchange listing 95.76
(b) Transferable securities dealt in on another regulated market —
(c) Transferable securities other than those admitted to official stock exchange listing or dealt in on another regulated market - repurchase agreement 0.75
(d) Collective Investment Schemes - mutual funds —
(e) OTC financial derivative instruments - forwards/swaps 0.03
(f ) Exchange traded financial derivative instruments - futures/options —
(g) Other assets 3.46
Total Investments 100.00
% of Total Assets
SettlementDates
CurrencySold
AmountSold
CurrencyBought
AmountBought Counterparty
Unrealised Appreciation/
(Depreciation)USD
% ofFund
PrincipalAmount
CouponRate %
MaturityDate
ValueUSD
% ofFund

NON-U.S. EQUITIES (99.71%)
82
Putnam International (Non U.S. Core) Equity Fund
Schedule of Investments
30 June 2008
29,000 Acer Incorporated $57,142 0.31
296 Adidas-Salomon AG 18,707 0.10
1,400 Aeon Company Limited 17,233 0.09
4,632 Air France-KLM 111,175 0.61
2,216 Akzo Nobel NV 152,372 0.83
1,501 Alcatel SA 9,113 0.05
28,028 Aldar Properties PJSC 95,708 0.52
2,251 Allianz SE 397,016 2.17
15,540 Allied Irish Banks PLC 239,600 1.31
41 Alstom 9,471 0.05
2,876 Arcelor Mittal 284,402 1.56
731 ASML Holding NV 17,983 0.10
6,600 Astellas Pharma Incorporated 279,513 1.53
1,555 Australia & New Zealand Banking Group Limited 27,875 0.15
847 Axa SA 25,158 0.14
31,314 BAE Systems PLC 276,030 1.51
19,931 Banco Santander Central Hispano SA 365,999 2.00
5,374 BASF AG 370,787 2.03
2,223 BAT Industries PLC 77,009 0.42
2,566 Bayerische Motoren Werke (BMW) AG 123,257 0.67
163 Beiersdorf AG 12,017 0.07
11,764 BHP Billiton PLC 449,967 2.46
1,174 BHP Billiton Limited 48,966 0.27
4,374 BNP Paribas SA 396,371 2.17
84,500 BOC Hong Kong Holdings Limited 223,257 1.22
167 Bouygues SA 11,086 0.06
47,992 BP PLC 557,686 3.05
900 Bridgestone Corporation 13,735 0.08
4,418 Britvic PLC 25,471 0.14
600 Canon Incorporated 30,617 0.17
155,000 Chartered Semiconductor Manufacturing Limited 87,777 0.48
108,000 China Petroleum & Chemical Corporation 100,980 0.55
900 China Petroleum & Chemical Corporation ADR 83,520 0.46
2,000 China Shenhua Energy Company Limited 7,824 0.04
471 Commerzbank AG 13,975 0.08
4,300 Credit Saison Company Limited 90,445 0.49
2,716 Credit Suisse Group 124,919 0.68
3,900 Daito Trust Construction Company Limited 189,077 1.03
1,540 Davis Service Group PLC 13,713 0.08
11,000 DBS Group Holdings Limited 152,589 0.83
4,419 Deutsche Post AG 115,179 0.63
18,800 DnB Holdings ASA 239,514 1.31
1,000 Dowa Mining Company Limited 7,291 0.04
11,317 DP World Limited 9,733 0.05
201 E.On AG 40,592 0.22
38 East Japan Railway Company 309,319 1.69
5,439 EFG Eurobank Ergasias 129,345 0.71
153 Electricite de France 14,530 0.08
34,982 Enel SpA 332,763 1.82
1,500 Esprit Holdings Limited 15,573 0.09
200 Fanuc Limited 19,562 0.11
3,661 Finmeccanica SpA 96,230 0.53
2,200 Focus Media Holding Limited ADR 60,874 0.33
517 France Telecom SA 15,234 0.08
300 Fuji Photo Film Cos. Limited $10,272 0.06
8 Fuji Television Network Incorporated 11,998 0.07
3,787 GKN PLC 16,814 0.09
10,420 GlaxoSmithKline PLC 231,057 1.26
7,054 Hellenic Telecommunication Organization SA 177,750 0.97
1,100 Honda Motor Company Limited 37,248 0.20
2,000 Hutchison Whampoa Limited 20,136 0.11
1,600 Iberdrola SA 20,713 0.11
286 InBev NV 19,855 0.11
221 Industria de Diseno Textil SA 10,184 0.06
99,000 Industrial & Commercial Bank of China 67,676 0.37
6,757 ING Groep NV 215,492 1.18
4,126 Intesa Sanpaolo SpA 23,491 0.13
3,200 IShares MSCI Eafe Index Fund 219,584 1.20
37 Japan Tobacco Incorporated 156,697 0.86
400 JFE Holdings Incorporated 20,072 0.11
172 Julius Baer Holding Limited (Class B) 11,630 0.06
24 KDDI Corporation 148,274 0.81
700 Komatsu Limited 19,510 0.11
14,589 Koninklijke KPN NV 250,441 1.37
14,362 Koninklijke Ahold NV 193,163 1.06
103 Lafarge SA 15,796 0.09
400 Lawson Incorporated 19,430 0.11
410 LG Chemical Limited 39,201 0.21
3,889 Lloyds TSB Group PLC 24,069 0.13
2,094 Lukoil ADR (Russia) 206,783 1.13
4,127 Macquarie Airports 8,150 0.04
12,000 Matsushita Electric Industrial Company Limited 258,065 1.41
1,033 Merck KGaA 146,532 0.80
5,600 Mitsubishi Corporation 183,814 1.01
3,100 Mitsubishi UFJ Financial Group Incorporated 27,368 0.15
6,000 Mitsui & Company Limited 131,862 0.72
1,000 Mitsui Fudosan Company Limited 21,270 0.12
15,000 Mitsui O.S.K. Lines Limited 213,639 1.17
235 Modern Times Group AB (Class B) 13,823 0.08
449 National Australia Bank Limited 11,393 0.06
2,498 National Bank of Greece SA 112,594 0.62
11,550 Nestle SA 522,621 2.86
11 NET One Systems Company Limited 12,243 0.07
300 Nintendo Company Limited 169,496 0.93
5,500 Nippon Electric Glass Company Limited 95,039 0.52
265 Nobel Biocare Holding AG 8,664 0.05
14,001 Nokia OYJ 341,337 1.87
7,825 Novartis AG 431,653 2.36
25,000 NSK Limited 218,828 1.20
6 NTT DoCoMo Incorporated 8,772 0.05
385 OAO Gazprom ADR 22,330 0.12
920 ORIX Corporation 131,553 0.72
542 Petroleum Geo-Services ASA 13,320 0.07
101 Pinault-Printemps-Redoute SA 11,240 0.06
2,467 Praktiker Bau- und Heimwerkermaerkte AG 52,063 0.28
15,256 Premier Foods PLC 28,887 0.16
21,681 Prudential PLC 230,118 1.26
563 QBE Insurance Group Limited 12,014 0.07
5,755 Reckitt Benckiser PLC 291,819 1.60
794 Reed Elsevier PLC 9,108 0.05
THE ACCOMPANYING NOTES ARE AN INTEGRAL PART OF THESE FINANCIAL STATEMENTS.
Number of Shares
ValueUSD
% ofFund
Number of Shares
ValueUSD
% ofFund
NON-U.S. EQUITIES (Continued)

83
1,156 Renault SA $94,834 0.52
2,871 Rio Tinto PLC 343,807 1.88
144 Rio Tinto Limited 18,659 0.10
2,906 Roche Holding AG 524,089 2.87
3,615 Royal Bank of Scotland Group PLC 15,474 0.08
1,422 RWE AG 179,564 0.98
574 Salzgitter AG 104,257 0.57
251 Samsung Electronics Company Limited 149,990 0.82
300 Sankyo Company Limited 19,553 0.11
207 Sanofi-Aventis 13,829 0.08
7,927 Saras SpA 45,037 0.25
1,251 Shinhan Financial Group Company Limited 56,336 0.31
211 Siemens AG 23,301 0.13
19,140 Singapore Airlines Limited 206,942 1.13
162 Societe Generale 14,088 0.08
200 Sony Corporation 8,734 0.05
669 Standard Chartered PLC 19,055 0.10
10,279 Statoil ASA 383,773 2.10
4,037 Suez SA 274,914 1.50
2,400 Sumitomo Electric Industries Limited 30,447 0.17
5 Sumitomo Mitsui Financial Group Incorporated 37,540 0.21
225 Suncor Energy Incorporated 13,068 0.07
1,788 Suncorp-Metway Limited 22,282 0.12
2,000 Suruga Bank Limited 25,995 0.14
700 Suzuken Company Limited 25,816 0.14
4,000 Suzuki Motor Corporation 94,322 0.52
2,500 Swire Pacific Limited 25,571 0.14
743 Swisscom AG 248,286 1.36
31 Syngenta AG 10,093 0.06
332 Teck Cominco Limited (Class B) 16,045 0.09
838 Telefonaktiebolaget LM Ericsson AB (Class B) 8,745 0.05
1,223 Telefonica SA 32,493 0.18
4,700 Tenaga Nasional Berhad 11,732 0.06
2,300 Terumo Corporation 117,582 0.64
300 Teva Pharmaceutical Industries Limited ADR 13,743 0.08
964 Tognum AG 25,931 0.14
48,000 Tokyo Gas Company Limited 193,320 1.06
6,743 Total SA 575,367 3.15
3,000 Toyo Suisan Kaisha Limited 67,770 0.37
900 Toyota Boshoku Corporation 24,151 0.13
400 Toyota Motor Corporation 18,864 0.10
26,286 UniCredito Italiano SpA 160,831 0.88
391 Unilever PLC 11,129 0.06
6,000 United Overseas Bank Limited 82,171 0.45
136 Vinci SA 8,351 0.04
9,260 Vivendi SA 351,318 1.92
11,042 Vodafone Group PLC 32,816 0.18
7,375 Wharf Holdings Limited 30,884 0.17
2,190 WM Morrison Supermarkets PLC 11,611 0.06
845 WPP Group PLC 8,152 0.04
1,950 Xstrata PLC 156,363 0.86
1,208 Zurich Financial Services AG 309,788 1.70
Total Non-U.S. Equities $18,221,045 99.71
Total Value of Investments $18,221,045 99.71
Putnam International (Non U.S. Core) Equity Fund
THE ACCOMPANYING NOTES ARE AN INTEGRAL PART OF THESE FINANCIAL STATEMENTS.
Number of Shares
ValueUSD
% ofFund
NON-U.S. EQUITIES (Continued)

84
Putnam International (Non U.S. Core) Equity Fund
THE ACCOMPANYING NOTES ARE AN INTEGRAL PART OF THESE FINANCIAL STATEMENTS.
16/07/2008 USD 648,878 AUD 716,300 Bank of America Securities $36,329 0.20
16/07/2008 CAD 172,600 USD 169,907 Bank of America Securities 290 —
16/07/2008 USD 9,735 AUD 10,700 Citibank NA 501 —
16/07/2008 CAD 172,000 USD 169,805 Citibank NA 188 —
16/07/2008 AUD 97,400 USD 91,790 Credit Suisse First Boston (1,382) (0.01)
16/07/2008 USD 471,422 AUD 522,800 Deutsche Bank, London 28,685 0.16
16/07/2008 USD 88,312 AUD 93,700 Goldman Sachs International 1,321 0.01
16/07/2008 USD 135,778 AUD 151,200 HSBC Bank USA 8,859 0.05
16/07/2008 AUD 127,800 USD 115,108 JP Morgan Chase Bank (7,145) (0.04)
16/07/2008 CAD 10,000 USD 9,855 JP Morgan Chase Bank 28 —
16/07/2008 USD 152,319 AUD 162,200 Lehman Brothers* 2,840 0.02
16/07/2008 USD 88,310 AUD 93,700 Merrill Lynch 1,323 0.01
16/07/2008 USD 110,364 AUD 118,200 State Street Bank & Trust 2,705 0.02
16/07/2008 USD 527,674 AUD 586,800 UBS AG 33,655 0.19
16/07/2008 AUD 359,200 USD 338,785 Westpac Banking Group (4,823) (0.03)
16/07/2008 CAD 172,600 USD 169,905 Westpac Banking Group 288 —
20/08/2008 JPY 5,628,800 USD 53,679 Bank of America Securities 439 —
20/08/2008 JPY 3,161,800 USD 30,065 Citibank NA 159 —
20/08/2008 JPY 45,829 USD 4,920,200 Credit Suisse First Boston 709 —
20/08/2008 USD 10,159,100 JPY 97,019 Deutsche Bank, London 929 0.01
20/08/2008 USD 449,739 JPY 48,302,800 Goldman Sachs International 7,134 0.04
20/08/2008 HKD 1,915,400 USD 246,244 JP Morgan Chase Bank 324 —
20/08/2008 USD 51,304 JPY 5,421,500 Lehman Brothers* (25) —
20/08/2008 HKD 245,000 USD 31,498 Lehman Brothers* 42 —
20/08/2008 JPY 11,168,400 USD 106,978 Merrill Lynch 1,343 0.01
20/08/2008 JPY 9,817,400 USD 91,317 UBS AG (1,541) (0.01)
20/08/2008 USD 5,045,800 JPY 47,115 Westpac Banking Group (611) —
17/09/2008 USD 240,821 GBP 124,100 Bank of America Securities 5,059 0.03
17/09/2008 USD 107,148 SEK 649,900 Bank of America Securities 381 —
17/09/2008 EUR 32,500 USD 50,605 Bank of America Securities (375) —
17/09/2008 NOK 480,900 USD 92,588 Bank of America Securities (1,222) (0.01)
17/09/2008 CHF 30,800 USD 29,435 Bank of America Securities (792) —
17/09/2008 USD 61,597 GBP 31,400 Citibank NA 616 —
17/09/2008 USD 16,372 NOK 84,400 Citibank NA 92 —
17/09/2008 EUR 169,900 USD 263,330 Citibank NA (3,175) (0.02)
17/09/2008 CHF 97,200 USD 94,071 Citibank NA (1,321) (0.01)
17/09/2008 USD 125,403 GBP 64,200 Credit Suisse First Boston 1,797 0.01
17/09/2008 USD 83,858 EUR 53,400 Credit Suisse First Boston (95) —
17/09/2008 USD 139,169 NOK 720,200 Credit Suisse First Boston 1,322 0.01
17/09/2008 SEK 276,100 USD 45,959 Credit Suisse First Boston 277 —
17/09/2008 CHF 47,000 USD 46,111 Credit Suisse First Boston (15) —
17/09/2008 EUR 236,200 USD 365,810 Deutsche Bank, London (4,694) (0.03)
17/09/2008 SEK 219,500 USD 36,188 Deutsche Bank, London (129) —
17/09/2008 USD 170,982 EUR 110,600 HSBC Bank USA 2,505 0.02
17/09/2008 USD 95,317 NOK 490,900 HSBC Bank USA 444 —
17/09/2008 USD 4,698 GBP 2,400 HSBC Bank USA 57 —
FORWARD FOREIGN EXCHANGE CURRENCY CONTRACTS (0.61%)
SettlementDates
CurrencySold
AmountSold
CurrencyBought
AmountBought Counterparty
Unrealised Appreciation/
(Depreciation)USD
% ofFund

85
Putnam International (Non U.S. Core) Equity Fund
THE ACCOMPANYING NOTES ARE AN INTEGRAL PART OF THESE FINANCIAL STATEMENTS.
17/09/2008 SEK 277,800 USD 45,812 HSBC Bank USA $(151) —
17/09/2008 USD 122,867 GBP 62,900 JP Morgan Chase Bank 1,757 0.01
17/09/2008 USD 45,594 EUR 29,400 JP Morgan Chase Bank 523 —
17/09/2008 CHF 78,900 USD 75,617 JP Morgan Chase Bank (1,815) (0.01)
17/09/2008 EUR 33,600 USD 51,643 Lehman Brothers* (1,062) (0.01)
17/09/2008 NOK 458,600 USD 88,888 Lehman Brothers* (572) —
17/09/2008 CHF 46,700 USD 44,732 Lehman Brothers* (1,099) (0.01)
17/09/2008 USD 167,210 NOK 862,000 Merrill Lynch 942 (0.01)
17/09/2008 USD 40,149 CHF 41,800 Merrill Lynch 873 0.01
17/09/2008 USD 29,257 GBP 15,000 Merrill Lynch 463 —
17/09/2008 EUR 243,100 USD 376,375 Merrill Lynch (4,952) (0.03)
17/09/2008 EUR 55,900 USD 86,576 State Street Bank & Trust (1,109) (0.01)
17/09/2008 USD 75,590 GBP 38,700 UBS AG 1,087 0.01
17/09/2008 USD 154,856 NOK 800,700 UBS AG 1,338 0.01
17/09/2008 EUR 221,700 USD 343,374 UBS AG (4,385) (0.02)
17/09/2008 SEK 277,800 USD 45,836 UBS AG (127) —
17/09/2008 CHF 758,000 USD 726,475 UBS AG (17,422) (0.09)
17/09/2008 USD 1,211,987 GBP 623,700 Westpac Banking Group 23,755 0.13
Net Unrealised Appreciation on Forward Foreign Exchange Currency Contracts $111,340 0.61
Total Financial Assets at Fair Value through Profit or Loss $18,332,385 100.31
* Please refer to note 12 Subsequent events for more detail.
Analysis of Investments (Unaudited)
(a) Transferable securities admitted to official stock exchange listing 89.08
(b) Transferable securities dealt in on another regulated market —
(c) Transferable securities other than those admitted to official stock exchange listing or dealt in on another regulated market - repurchase agreement —
(d) Collective Investment Schemes - mutual funds —
(e) OTC financial derivative instruments - forwards/swaps 0.84
(f ) Exchange traded financial derivative instruments - futures/options —
(g) Other assets 10.08
Total Investments 100.00
% ofTotal Assets
FORWARD FOREIGN EXCHANGE CURRENCY CONTRACTS (Continued)
SettlementDates
CurrencySold
AmountSold
CurrencyBought
AmountBought Counterparty
Unrealised Appreciation/
(Depreciation)USD
% ofFund

86
Putnam Investors (U.S. Core Equity) Fund
Schedule of Investments
30 June 2008
2,450 Adobe Systems Incorporated $96,334 0.85
4,274 Aetna Incorporated 173,182 1.53
2,550 Akamai Technologies Incorporated 88,715 0.79
1,250 Alliance Data Systems Corporation 70,600 0.63
250 Alliant Techsystems Incorporated 25,420 0.23
4,858 American International Group Incorporated 128,154 1.14
2,300 Amphenol Corporation (Class A) 103,155 0.91
1,075 Apache Corporation 149,350 1.32
1,748 Apple Computer Incorporated 292,685 2.59
7,433 AT&T Incorporated 249,674 2.21
350 AutoZone Incorporated 42,329 0.38
7,901 Bank of America Corporation 187,807 1.66
2,600 Bank of New York Mellon Corporation 98,306 0.87
2,600 Best Buy Company Incorporated 102,752 0.91
1,300 Boeing Company 85,423 0.76
2,700 Burger King Holdings Incorporated 72,171 0.64
970 Burlington Northern Santa Fe Corporation 96,748 0.86
4,409 Capital One Financial Corporation 167,410 1.48
1,900 Carnival Corporation 62,548 0.55
1,020 Caterpillar Incorporated 75,194 0.67
14,100 Cisco Systems Incorporated 327,966 2.91
800 Citrix Systems Incorporated 23,472 0.21
302 CME Group Incorporated 115,717 1.03
3,600 Cognizant Technology Solutions Corporation 117,000 1.04
1,438 ConocoPhillips 135,431 1.20
1,100 Costco Wholesale Corporation 77,198 0.68
4,970 CVS Caremark Corporation 196,414 1.74
1,500 Danaher Corporation 115,875 1.03
2,300 Dell Incorporated 50,347 0.45
1,050 Devon Energy Corporation 126,032 1.12
800 DirecTV Group Incorporated 20,720 0.18
1,308 Dun & Bradstreet Corporation 114,502 1.01
1,936 eBay Incorporated 52,872 0.47
4,300 EMC Corporation 63,081 0.56
634 Energizer Holdings Incorporated 46,339 0.41
1,550 Expedia Incorporated 28,489 0.25
1,350 Expeditors International of Washington Incorporated 58,064 0.51
1,570 Express Scripts Incorporated 98,486 0.87
4,366 Fannie Mae* 85,137 0.75
1,475 Franklin Resources Incorporated 135,184 1.20
6,662 Freddie Mac* 108,990 0.97
957 Freeport-McMoRan Copper & Gold Incorporated (Class B) 112,141 0.99
1,450 GameStop Corporation 58,493 0.52
1,150 General Dynamics Corporation 96,830 0.86
3,050 General Growth Properties Incorporated 106,689 0.95
7,389 Genworth Financial Incorporated (Class A) 131,155 1.16
1,997 Goldman Sachs Group Incorporated 348,320 3.09
434 Google Incorporated (Class A) 228,544 2.02
1,000 Halliburton Company 53,040 0.47
1,925 Harley-Davidson Incorporated $69,724 0.62
813 Hess Corporation 102,584 0.91
6,210 Hewlett-Packard Company 273,985 2.43
2,600 Iron Mountain Incorporated 68,978 0.61
2,200 ITT Corporation 139,194 1.23
750 ITT Educational Services Incorporated 61,965 0.55
800 Jacobs Engineering Group Incorporated 64,456 0.57
1,000 John Deere & Company 72,130 0.64
3,350 Johnson & Johnson 215,338 1.91
3,850 Johnson Controls Incorporated 110,187 0.98
350 L-3 Communications Holdings Incorporated 31,805 0.28
5,602 Lehman Brothers Holdings Incorporated* 110,079 0.98
450 Lockheed Martin Corporation 44,352 0.39
1,390 M&T Bank Corporation 98,051 0.87
1,900 Marathon Oil Corporation 98,496 0.87
2,350 McDonald’s Corporation 131,976 1.17
2,892 Medco Health Solutions Incorporated 136,416 1.21
3,597 Medtronic Incorporated 185,821 1.65
2,950 Merck & Company Incorporated 111,068 0.98
3,650 Merrill Lynch & Company Incorporated 115,559 1.02
996 Mettler-Toledo International Incorporated 94,471 0.84
10,150 Microsoft Corporation 279,430 2.49
1,154 Monsanto Company 145,554 1.29
1,400 National-Oilwell Varco Incorporated 124,208 1.10
1,750 Occidental Petroleum Corporation 157,115 1.39
2,320 Omnicom Group Incorporated 103,797 0.92
8,450 Oracle Corporation 177,450 1.57
2,400 PepsiCo Incorporated 152,592 1.35
250 Priceline.com Incorporated 28,858 0.26
900 Procter & Gamble Company 54,639 0.48
1,850 Quest Diagnostics Incorporated 89,540 0.79
950 Roper Industries Incorporated 62,349 0.55
2,000 Royal Caribbean Cruises Limited 44,820 0.40
2,700 Safeway Incorporated 77,085 0.68
4,350 Staples Incorporated 103,269 0.91
2,100 State Street Corporation 134,148 1.19
600 Stericycle Incorporated 31,020 0.27
2,500 Stryker Corporation 157,175 1.39
1,500 Terex Corporation 76,980 0.68
250 TJX Cos. Incorporated 7,863 0.07
3,900 U.S. Bancorp 108,420 0.96
2,317 United Technologies Corporation 142,843 1.27
5,130 UnitedHealth Group Incorporated 134,663 1.19
1,600 Verizon Communications Incorporated 56,528 0.50
500 Wal-Mart Stores Incorporated 28,050 0.25
3,900 Walt Disney Company 121,560 1.08
750 Waters Corporation 48,375 0.43
4,500 Wells Fargo & Company 106,515 0.94
800 Wiley (John) & Sons Incorporated (Class A) 36,024 0.32
1,275 XTO Energy Incorporated 87,261 0.77
Total U.S. Equities $10,815,251 95.83
THE ACCOMPANYING NOTES ARE AN INTEGRAL PART OF THESE FINANCIAL STATEMENTS.
Number of Shares
ValueUSD
% ofFund
U.S. EQUITIES (95.83%)
Number of Shares
ValueUSD
% ofFund
U.S. EQUITIES (Continued)

87
Putnam Investors (U.S. Core Equity) Fund
THE ACCOMPANYING NOTES ARE AN INTEGRAL PART OF THESE FINANCIAL STATEMENTS.
2,761 Accenture Limited $112,317 1.00
2,500 Nokia Oyj 61,250 0.54
504 Potash Corporation 115,199 1.02
2,216 Suncor Energy Incorporated 128,550 1.14
Total Non-U.S. Equities $417,316 3.70
REPURCHASE AGREEMENTS (1.30%)
$147,000 Repurchase Agreement– Bank of America 2.33 01/07/2008 $147,000 1.30
Total Repurchase Agreements $147,000 1.30
Total Value of Investments $11,379,567 100.83
* Please refer to note 12 Subsequent events for more detail.
Number of Shares
ValueUSD
% ofFund
NON-U.S. EQUITIES (3.70%)
FORWARD FOREIGN EXCHANGE CURRENCY CONTRACTS (0.04%)
SettlementDates
CurrencySold
AmountSold
CurrencyBought
AmountBought Counterparty
Unrealised Appreciation/
(Depreciation)USD
% ofFund
16/07/2008 CAD 3,800 EUR 2,410 JP Morgan Chase Bank $58 —
16/07/2008 CAD 4,000 EUR 2,494 UBS AG (5) —
17/09/2008 USD 7,800 EUR 5,044 Citibank NA 112 —
17/09/2008 EUR 22,750 USD 35,200 Credit Suisse First Boston (488) —
17/09/2008 USD 9,500 EUR 6,142 Deutsche Bank, London 135 —
17/09/2008 EUR 15,755 USD 24,400 HSBC Bank USA (314) —
17/09/2008 USD 1,300 EUR 840 JP Morgan Chase Bank 18 —
17/09/2008 USD 600 EUR 388 Lehman Brothers* 9 —
17/09/2008 USD 60,000 EUR 38,785 Merrill Lynch 841 0.01
17/09/2008 USD 245,400 EUR 158,494 UBS AG 3,228 0.03
17/09/2008 USD 12,000 EUR 7,775 Westpac Banking Group 196 —
Net Unrealised Appreciation on Forward Foreign Exchange Currency Contracts $3,790 0.04
Total Financial Assets at Fair Value through Profit or Loss $11,383,357 100.87
* Please refer to note 12 Subsequent events for more detail.
Analysis of Investments (Unaudited)
(a) Transferable securities admitted to official stock exchange listing 97.83
(b) Transferable securities dealt in on another regulated market —
(c) Transferable securities other than those admitted to official stock exchange listing or dealt in on another regulated market - repurchase agreement 1.28
(d) Collective Investment Schemes - mutual funds —
(e) OTC financial derivative instruments - forwards/swaps 0.05
(f ) Exchange traded financial derivative instruments - futures/options —
(g) Other assets 0.84
Total Investments 100.00
% of Total Assets
PrincipalAmount
CouponRate %
MaturityDate
ValueUSD
% ofFund
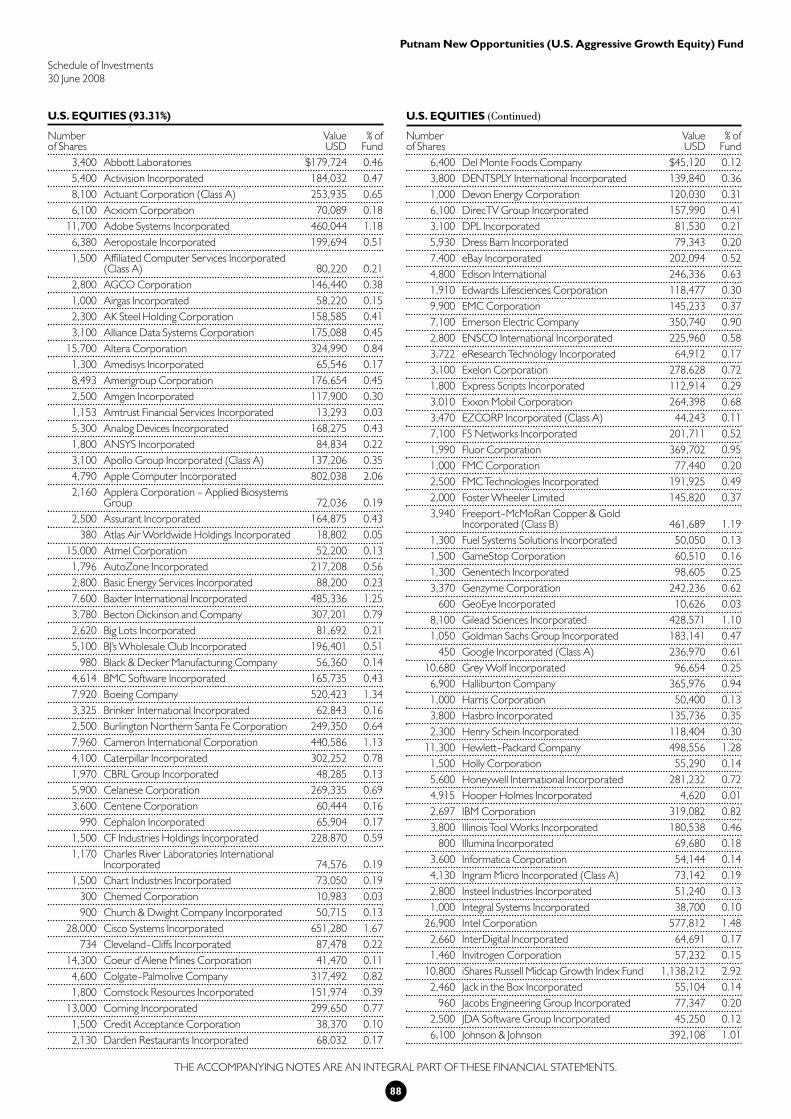
88
Putnam New Opportunities (U.S. Aggressive Growth Equity) Fund
Schedule of Investments
30 June 2008
3,400 Abbott Laboratories $179,724 0.46
5,400 Activision Incorporated 184,032 0.47
8,100 Actuant Corporation (Class A) 253,935 0.65
6,100 Acxiom Corporation 70,089 0.18
11,700 Adobe Systems Incorporated 460,044 1.18
6,380 Aeropostale Incorporated 199,694 0.51
1,500 Affiliated Computer Services Incorporated (Class A) 80,220 0.21
2,800 AGCO Corporation 146,440 0.38
1,000 Airgas Incorporated 58,220 0.15
2,300 AK Steel Holding Corporation 158,585 0.41
3,100 Alliance Data Systems Corporation 175,088 0.45
15,700 Altera Corporation 324,990 0.84
1,300 Amedisys Incorporated 65,546 0.17
8,493 Amerigroup Corporation 176,654 0.45
2,500 Amgen Incorporated 117,900 0.30
1,153 Amtrust Financial Services Incorporated 13,293 0.03
5,300 Analog Devices Incorporated 168,275 0.43
1,800 ANSYS Incorporated 84,834 0.22
3,100 Apollo Group Incorporated (Class A) 137,206 0.35
4,790 Apple Computer Incorporated 802,038 2.06
2,160 Applera Corporation - Applied Biosystems Group 72,036 0.19
2,500 Assurant Incorporated 164,875 0.43
380 Atlas Air Worldwide Holdings Incorporated 18,802 0.05
15,000 Atmel Corporation 52,200 0.13
1,796 AutoZone Incorporated 217,208 0.56
2,800 Basic Energy Services Incorporated 88,200 0.23
7,600 Baxter International Incorporated 485,336 1.25
3,780 Becton Dickinson and Company 307,201 0.79
2,620 Big Lots Incorporated 81,692 0.21
5,100 BJ’s Wholesale Club Incorporated 196,401 0.51
980 Black & Decker Manufacturing Company 56,360 0.14
4,614 BMC Software Incorporated 165,735 0.43
7,920 Boeing Company 520,423 1.34
3,325 Brinker International Incorporated 62,843 0.16
2,500 Burlington Northern Santa Fe Corporation 249,350 0.64
7,960 Cameron International Corporation 440,586 1.13
4,100 Caterpillar Incorporated 302,252 0.78
1,970 CBRL Group Incorporated 48,285 0.13
5,900 Celanese Corporation 269,335 0.69
3,600 Centene Corporation 60,444 0.16
990 Cephalon Incorporated 65,904 0.17
1,500 CF Industries Holdings Incorporated 228,870 0.59
1,170 Charles River Laboratories International Incorporated 74,576 0.19
1,500 Chart Industries Incorporated 73,050 0.19
300 Chemed Corporation 10,983 0.03
900 Church & Dwight Company Incorporated 50,715 0.13
28,000 Cisco Systems Incorporated 651,280 1.67
734 Cleveland-Cliffs Incorporated 87,478 0.22
14,300 Coeur d’Alene Mines Corporation 41,470 0.11
4,600 Colgate-Palmolive Company 317,492 0.82
1,800 Comstock Resources Incorporated 151,974 0.39
13,000 Corning Incorporated 299,650 0.77
1,500 Credit Acceptance Corporation 38,370 0.10
2,130 Darden Restaurants Incorporated 68,032 0.17
6,400 Del Monte Foods Company $45,120 0.12
3,800 DENTSPLY International Incorporated 139,840 0.36
1,000 Devon Energy Corporation 120,030 0.31
6,100 DirecTV Group Incorporated 157,990 0.41
3,100 DPL Incorporated 81,530 0.21
5,930 Dress Barn Incorporated 79,343 0.20
7,400 eBay Incorporated 202,094 0.52
4,800 Edison International 246,336 0.63
1,910 Edwards Lifesciences Corporation 118,477 0.30
9,900 EMC Corporation 145,233 0.37
7,100 Emerson Electric Company 350,740 0.90
2,800 ENSCO International Incorporated 225,960 0.58
3,722 eResearch Technology Incorporated 64,912 0.17
3,100 Exelon Corporation 278,628 0.72
1,800 Express Scripts Incorporated 112,914 0.29
3,010 Exxon Mobil Corporation 264,398 0.68
3,470 EZCORP Incorporated (Class A) 44,243 0.11
7,100 F5 Networks Incorporated 201,711 0.52
1,990 Fluor Corporation 369,702 0.95
1,000 FMC Corporation 77,440 0.20
2,500 FMC Technologies Incorporated 191,925 0.49
2,000 Foster Wheeler Limited 145,820 0.37
3,940 Freeport-McMoRan Copper & Gold Incorporated (Class B) 461,689 1.19
1,300 Fuel Systems Solutions Incorporated 50,050 0.13
1,500 GameStop Corporation 60,510 0.16
1,300 Genentech Incorporated 98,605 0.25
3,370 Genzyme Corporation 242,236 0.62
600 GeoEye Incorporated 10,626 0.03
8,100 Gilead Sciences Incorporated 428,571 1.10
1,050 Goldman Sachs Group Incorporated 183,141 0.47
450 Google Incorporated (Class A) 236,970 0.61
10,680 Grey Wolf Incorporated 96,654 0.25
6,900 Halliburton Company 365,976 0.94
1,000 Harris Corporation 50,400 0.13
3,800 Hasbro Incorporated 135,736 0.35
2,300 Henry Schein Incorporated 118,404 0.30
11,300 Hewlett-Packard Company 498,556 1.28
1,500 Holly Corporation 55,290 0.14
5,600 Honeywell International Incorporated 281,232 0.72
4,915 Hooper Holmes Incorporated 4,620 0.01
2,697 IBM Corporation 319,082 0.82
3,800 Illinois Tool Works Incorporated 180,538 0.46
800 Illumina Incorporated 69,680 0.18
3,600 Informatica Corporation 54,144 0.14
4,130 Ingram Micro Incorporated (Class A) 73,142 0.19
2,800 Insteel Industries Incorporated 51,240 0.13
1,000 Integral Systems Incorporated 38,700 0.10
26,900 Intel Corporation 577,812 1.48
2,660 InterDigital Incorporated 64,691 0.17
1,460 Invitrogen Corporation 57,232 0.15
10,800 iShares Russell Midcap Growth Index Fund 1,138,212 2.92
2,460 Jack in the Box Incorporated 55,104 0.14
960 Jacobs Engineering Group Incorporated 77,347 0.20
2,500 JDA Software Group Incorporated 45,250 0.12
6,100 Johnson & Johnson 392,108 1.01
THE ACCOMPANYING NOTES ARE AN INTEGRAL PART OF THESE FINANCIAL STATEMENTS.
Number of Shares
ValueUSD
% ofFund
Number of Shares
ValueUSD
% ofFund
U.S. EQUITIES (93.31%) U.S. EQUITIES (Continued)

89
2,000 Joy Global Incorporated $151,640 0.39
2,690 JPMorgan Chase & Company 92,294 0.24
10,700 Juniper Networks Incorporated 236,898 0.61
1,490 Kinetic Concepts Incorporated 59,347 0.15
5,600 King Pharmaceuticals Incorporated 58,632 0.15
4,300 Kirby Corporation 206,400 0.53
3,300 Korn/Ferry International 51,909 0.13
5,300 Kroger Company 152,852 0.39
3,100 Laboratory Corporation of America Holdings 215,822 0.55
2,150 Lam Research Corporation 77,637 0.20
4,600 Linear Technology Corporation 149,730 0.38
3,300 Lockheed Martin Corporation 325,248 0.84
2,500 Lorillard Incorporated 172,575 0.44
2,500 Manitowoc Company Incorporated 81,200 0.21
3,100 Marvel Entertainment Incorporated 99,603 0.26
3,100 Massey Energy Company 290,315 0.75
2,300 Maximus Incorporated 80,086 0.21
8,100 McDonald’s Corporation 454,896 1.17
9,900 Medtronic Incorporated 511,434 1.31
970 Mettler-Toledo International Incorporated 92,005 0.24
24,610 Microsoft Corporation 677,513 1.74
980 Millipore Corporation 66,493 0.17
5,300 Molex Incorporated 129,373 0.33
3,833 Monsanto Company 483,456 1.24
2,800 Mosaic Company 405,132 1.04
2,300 Multi-Fineline Electronix Incorporated 63,687 0.16
3,470 National-Oilwell Varco Incorporated 307,858 0.79
4,100 Navigant Consulting Incorporated 80,196 0.21
2,470 NBTY Incorporated 79,164 0.20
4,600 NeuStar Incorporated (Class A) 99,130 0.25
2,000 Newmont Mining Corporation 104,220 0.27
1,670 NII Holdings Incorporated 79,258 0.20
7,400 NIKE Incorporated (Class B) 441,040 1.13
3,800 Noble Corporation 246,278 0.63
2,300 Noble Energy Incorporated 230,851 0.59
800 Nordson Corporation 58,312 0.15
3,600 Northern Trust Corporation 246,600 0.63
4,800 Novatel Wireless Incorporated 53,424 0.14
4,600 Nuance Communications Incorporated 71,944 0.18
3,200 Nucor Corporation 238,944 0.61
7,900 NVIDIA Corporation 147,414 0.38
156 NVR Incorporated 78,011 0.20
3,600 Occidental Petroleum Corporation 323,208 0.83
3,800 Omnicom Group Incorporated 170,012 0.44
10,800 Oracle Corporation 226,800 0.58
2,500 Patterson Co.s Incorporated 73,300 0.19
1,700 Peabody Energy Corporation 149,617 0.38
5,860 PepsiCo Incorporated 372,579 0.96
2,800 Perry Ellis International Incorporated 59,472 0.15
2,000 PharMerica Corporation 45,180 0.12
7,000 Philip Morris International Incorporated 345,170 0.89
3,100 Pioneer Drilling Company 58,404 0.15
1,500 Precision Castparts Corporation 144,555 0.37
6,100 Premiere Global Services Incorporated 88,938 0.23
1,750 Priceline.com Incorporated 202,003 0.52
1,840 Pride International Incorporated 86,866 0.22
7,200 Procter & Gamble Company $437,112 1.12
6,100 Qualcomm Incorporated 270,657 0.70
800 Questar Corporation 56,760 0.15
3,440 Raytheon Company 193,294 0.50
1,500 Rex Energy Corporation 39,585 0.10
1,660 Rowan Cos. Incorporated 77,539 0.20
6,919 S1 Corporation 54,300 0.14
800 Salesforce.com Incorporated 54,472 0.14
10,900 Sapient Corporation 69,978 0.18
4,300 Schlumberger Limited 461,562 1.19
3,100 Sigma-Adrich Corporation 166,842 0.43
2,300 Simon Property Group Incorporated 206,747 0.53
1,500 Stanley Works 67,230 0.17
7,100 Staples Incorporated 168,554 0.43
3,600 Sun Healthcare Group Incorporated 48,204 0.12
1,650 Superior Energy Services 90,965 0.23
2,000 Supervalu Incorporated 61,680 0.16
2,500 Sybase Incorporated 73,550 0.19
7,000 Synopsys Incorporated 167,230 0.43
2,900 T. Rowe Price Group Incorporated 163,589 0.42
6,600 TD Ameritrade Holding Corporation 119,658 0.31
980 Techne Corporation 75,842 0.19
5,870 Teradata Corporation 135,597 0.35
1,130 Terex Corporation 57,992 0.15
1,620 Terra Industries Incorporated 79,850 0.21
3,400 Thermo Electron Corporation 189,380 0.49
2,940 Timken Company 96,608 0.25
9,700 TJX Incorporated 305,065 0.78
1,000 Umpqua Holdings Corporation 12,140 0.03
1,170 Unit Corporation 97,075 0.25
600 United States Steel Corporation 110,862 0.28
2,800 Varian Medical Systems Incorporated 145,180 0.37
2,000 VeriSign Incorporated 75,600 0.19
3,200 Verizon Communications Incorporated 113,056 0.29
2,100 Viacom Incorporated (Class B) 64,071 0.16
1,700 Wal-Mart Stores Incorporated 95,370 0.25
1,500 Walter Industries Incorporated 162,885 0.42
4,880 Waters Corporation 314,760 0.81
6,100 Watson Pharmaceuticals Incorporated 165,493 0.43
370 WellCare Health Plans Incorporated 13,376 0.03
764 Western Refining Incorporated 9,015 0.02
500 Whiting Petroleum Corporation 52,945 0.14
3,275 XTO Energy Incorporated 224,141 0.58
6,100 Yum! Brands Incorporated 213,927 0.55
1,800 Zoll Medical Corporation 60,624 0.16
Total U.S. Equities $36,329,436 93.31
NON-U.S. EQUITIES (6.79%)
12,500 Accenture Limited (Class A) $508,500 1.31
1,160 Agnico-Eagle Mines Limited 86,258 0.22
8,900 American Oriental Bioengineering Incorporated 87,843 0.23
8,889 ARM Holdings PLC ADR 45,245 0.12
2,000 Barrick Gold Corporation 91,000 0.23
6,900 Celestica Incorporated 58,029 0.15
1,800 China Medical Technologies Incorporated ADR 88,938 0.23
Putnam New Opportunities (U.S. Aggressive Growth Equity) Fund
THE ACCOMPANYING NOTES ARE AN INTEGRAL PART OF THESE FINANCIAL STATEMENTS.
Number of Shares
ValueUSD
% ofFund
Number of Shares
ValueUSD
% ofFund
Number of Shares
ValueUSD
% ofFund
U.S. EQUITIES (Continued) U.S. EQUITIES (Continued)

90
1,000 Frontline Limited $69,780 0.18
6,590 JA Solar Holdings Company 111,042 0.29
660 Lazard Limited (Class A) 22,532 0.06
5,100 Marvell Technology Group Limited 89,913 0.23
2,300 Net 1 UEPS Technologies Incorporated 55,890 0.14
3,600 NetEase.com ADR 78,444 0.20
800 New Oriental Education & Technology Group ADR 46,608 0.12
2,170 Penn West Energy Trust 73,346 0.19
4,500 Petroleo Brasileiro SA 318,375 0.82
900 Potash Corporation of Saskatchewan 205,713 0.53
16,973 Seagate Technology 324,015 0.83
2,000 Shanda Interactive Entertainment Limited 54,300 0.14
800 Sohu.com Incorporated 56,320 0.14
3,100 Solarfun Power Holdings Company Limited 54,126 0.14
1,000 Suntech Power Holdings Company Limited 37,380 0.10
600 Tsingtao Brewery Company Limited 12,570 0.03
400 Vestas Wind Systems A/S 52,216 0.13
700 Xyratex Limited 11,627 0.03
Total Non-U.S. Equities $2,640,010 6.79
REPURCHASE AGREEMENTS (9.84%)
$3,829,000 Repurchase Agreement– Bank of America 2.25 01/07/2008 $3,829,000 9.84
Total Repurchase Agreements $3,829,000 9.84
Total Value of Investments $42,798,446 109.94
WRITTEN OPTIONS OUTSTANDING (—%)
Big Lots, Inc. (Call) UBS Jul-08/30.89 $120 $(208) (0.00)
Walter Industries, Inc. (Call)Deutsche Bank Jul-08/103.07 40 (408) (0.00)
Total Written Options Outstanding $(616) (0.00)
Putnam New Opportunities (U.S. Aggressive Growth Equity) Fund
THE ACCOMPANYING NOTES ARE AN INTEGRAL PART OF THESE FINANCIAL STATEMENTS.
Number of Shares
ValueUSD
% ofFund
NON-U.S. EQUITIES (Continued)
PrincipalAmount
CouponRate %
MaturityDate
ValueUSD
% ofFund
Expiration date/strike price
Contractvalue
ValueUSD
% ofFund
FORWARD FOREIGN EXCHANGE CURRENCY CONTRACTS (0.00%)
17/09/2008 USD 920,500 EUR 586,904 JP Morgan Chase Bank $119 —
Net Unrealised Appreciation on Forward Foreign Exchange Currency Contracts $119 —
Total Financial Assets at Fair Value through Profit or Loss $42,798,565 109.94
Total Financial Liabilities at Fair Value through Profit or Loss $(616) —
Analysis of Investments (Unaudited)
(a) Transferable securities admitted to official stock exchange listing 58.40
(b) Transferable securities dealt in on another regulated market —
(c) Transferable securities other than those admitted to official stock exchange listing or dealt in on another regulated market - repurchase agreement 5.74
(d) Collective Investment Schemes - mutual funds —
(e) OTC financial derivative instruments - forwards/swaps —
(f ) Exchange traded financial derivative instruments - futures/options —
(g) Other assets 35.86
Total Investments 100.00
% of Total Assets
SettlementDate
CurrencySold
AmountSold
CurrencyBought
AmountBought Counterparty
Unrealised Appreciation
USD% of
Fund

91
Putnam Total Return Fund
Schedule of Investments
30 June 2008
1,275 3M Company $88,625 0.07
553 Aaron Rents Incorporated 12,348 0.01
2,075 Acadia Realty Trust 48,036 0.04
1,269 Accuride Corporation 5,393 0.00
4,795 Acme Packet Incorporated 37,209 0.03
8,779 Actuate Corporation 34,326 0.03
1,956 Acuity Brands Incorporated 94,044 0.08
5,030 Acxiom Corporation 57,795 0.05
442 Administaff Incorporated 12,327 0.01
141 Advanced Analogic Technologies Incorporated 582 0.00
9,081 Advanced Energy Industries Incorporated 124,410 0.10
7,169 Advanta Corporation (Class B) 45,093 0.04
3,146 Advent Software Incorporated 113,634 0.09
834 Aecom Technology Corporation 27,130 0.02
3,121 Aeropostale Incorporated 97,687 0.08
1,332 Aetna Incorporated 53,973 0.04
3,518 AGCO Corporation 183,991 0.15
1,667 Agree Realty Corporation 36,724 0.03
80 Alaska Air Group Incorporated 1,227 0.00
2,691 Albany Molecular Research Incorporated 35,710 0.03
5,412 Alberto-Culver Company 141,903 0.12
613 Alexandria Real Estate Equities Incorporated 59,669 0.05
78 Align Technology Incorporated 818 0.00
8,032 Alliance Imaging Incorporated 69,637 0.06
4,771 Alliance One International Incorporated 24,380 0.02
1,365 Alliance Resource Partners 75,744 0.06
958 Alliant Energy Corporation 32,764 0.03
2,193 Allstate Corporation 99,803 0.08
1,337 Alnylam Pharmaceuticals Incorporated 35,738 0.03
1,139 Alpha Natural Resources Incorporated 118,786 0.10
2,155 Alpharma Incorporated (Class A) 48,552 0.04
4,394 Altria Group Incorporated 90,165 0.07
911 Amazon.com Incorporated 66,740 0.05
1,767 AMB Property Corporation 88,898 0.07
3,095 Amedisys Incorporated 156,050 0.13
1,318 American Campus Communities Incorporated 36,680 0.03
2,169 American Ecology Corporation 64,051 0.05
1,700 American Financial Group Incorporated 45,475 0.04
910 American Science & Engineering Incorporated 46,892 0.04
365 American States Water Company 12,749 0.01
1,033 American Woodmark Corporation 21,858 0.02
4,026 AMERIGROUP Corporation 83,741 0.07
1,616 Ameriprise Financial Incorporated 65,723 0.05
3,735 Amerisafe Incorporated 59,536 0.05
137 Ameron International Corporation 16,437 0.01
877 Ametek Incorporated 41,412 0.03
1,857 Amgen Incorporated 87,576 0.07
5,078 AMN Healthcare Services Incorporated 85,920 0.07
2,391 Andersons Incorporated 97,338 0.08
1,003 Anixter International Incorporated 59,668 0.05
4,463 Annaly Capital Management Incorporated 69,221 0.06
895 Ansoft Corporation 32,596 0.03
5,446 ANSYS Incorporated 256,670 0.21
1,052 Apartment Investment & Management Company (Class A) 35,821 0.03
1,017 Apple Computer Incorporated 170,286 0.14
124 Applera Corporation - Applied Biosystems Group $4,135 0.00
4,271 Applied Industrial Technologies Incorporated 103,230 0.08
1,550 Applied Materials Incorporated 29,590 0.02
1,128 Aqua America Incorporated 18,003 0.02
2,951 Arbor Realty Trust Incorporated 26,382 0.02
1,981 Arch Chemicals Incorporated 65,670 0.05
174 Arch Coal Incorporated 13,029 0.01
597 Arkansas Best Corporation 21,874 0.02
15,033 Arris Group Incorporated 127,179 0.10
2,203 Asta Funding Incorporated 19,981 0.02
181 Astec Industries Incorporated 5,817 0.01
5,841 AT&T Incorporated 196,199 0.16
1,711 Atheros Communications 51,330 0.04
1,984 Atlantic Tele-Network Incorporated 54,580 0.05
3,943 AuthenTec Incorporated 41,165 0.03
3,020 Autodesk Incorporated 101,985 0.08
1,456 AvalonBay Communities Incorporated 129,817 0.11
2,371 Aventine Renewable Energy Holdings Incorporated 10,409 0.01
749 Avnet Incorporated 20,380 0.02
2,604 Avocent Corporation 48,434 0.04
305 Badger Meter Incorporated 15,409 0.01
716 Bally Technologies Incorporated 24,194 0.02
2,937 Bank of America Corporation 69,812 0.06
1,896 Bank of the Ozarks Incorporated 28,175 0.02
3,035 Basic Energy Services Incorporated 95,603 0.08
998 Becton, Dickinson and Company 81,107 0.07
1,427 Biogen Idec Incorporated 79,655 0.07
2,329 BioMed Realty Trust Incorporated 57,107 0.05
548 Bio-Rad Laboratories Incorporated (Class A) 44,366 0.04
2,059 BJ’s Wholesale Club Incorporated 79,292 0.07
94 Black Hills Corporation 3,013 0.00
1,998 Blackbaud Incorporated 42,757 0.04
1,360 Blackboard Incorporated 51,993 0.04
846 Blue Coat Systems Incorporated 11,937 0.01
483 Blyth Industries Incorporated 5,810 0.01
5,003 BMC Software Incorporated 179,708 0.15
2,310 Boeing Company 151,790 0.12
1,650 Boston Beer Company Incorporated (Class A) 67,122 0.06
2,198 Boston Properties Incorporated 198,062 0.16
867 BRE Properties 37,524 0.03
1,083 Brinker International Incorporated 20,469 0.02
1,614 Bristol-Myers Squibb Company 33,119 0.03
2,812 Brocade Communications Systems Incorporated 23,171 0.02
6,321 Buckeye Technologies Incorporated 53,412 0.04
4,192 Buckle Incorporated 191,323 0.16
128 Bucyrus International Incorporated (Class A) 9,339 0.01
698 Builders FirstSource Incorporated 3,699 0.00
1,002 CACI International Incorporated (Class A) 45,862 0.04
853 Calamos Asset Management Incorporated (Class A) 14,527 0.01
767 Calgon Carbon Corporation 11,850 0.01
371 California Water Service Group 12,154 0.01
500 Callaway Golf Company 5,915 0.01
2,870 Cal-Maine Foods Incorporated 94,681 0.08
394 Campbell Soup Company 13,167 0.01
THE ACCOMPANYING NOTES ARE AN INTEGRAL PART OF THESE FINANCIAL STATEMENTS.
U.S. EQUITIES (34.08%)
Number of Shares
ValueUSD
% ofFund
Number of Shares
ValueUSD
% ofFund
U.S. EQUITIES (Continued)

92
1,165 Capital Trust Incorporated (Class A) $22,321 0.02
4,960 Capstone Turbine Corporation 20,882 0.02
2,440 Carpenter Technology Corporation 106,286 0.09
281 Casey’s General Stores Incorporated 6,511 0.01
1,508 Cash America International Incorporated 46,748 0.04
1,793 Cathay General Bancorp 19,490 0.02
2,862 CB Richard Ellis Group Incorporated (Class A) 54,922 0.04
3,994 CBL & Associates Properties 91,023 0.07
996 CBRL Group Incorporated 24,412 0.02
937 CEC Entertainment Incorporated 26,236 0.02
197 Celanese Corporation Series A 8,993 0.01
10,734 Centennial Communications Corporation 75,138 0.06
2,310 Center Financial Corporation 19,566 0.02
1,220 Central European Distribution Corporation 90,475 0.07
863 Cephalon Incorporated 57,450 0.05
1,214 Ceradyne Incorporated 41,628 0.03
1,809 CF Industries Holdings Incorporated 276,017 0.23
5,047 Charlotte Russe Holding Incorporated 89,433 0.07
1,489 Chattem Incorporated 96,859 0.08
2,493 Checkpoint Systems Incorporated 52,054 0.04
3,323 Chevron Corporation 329,043 0.27
472 Childrens Place Retail Stores Incorporated 17,020 0.01
1,300 Chordiant Software Incorporated 6,500 0.01
1,541 Chubb Corporation 75,524 0.06
1,446 CIGNA Corporation 51,116 0.04
10,965 Cisco Systems Incorporated 255,046 0.21
2,730 Citigroup Incorporated 45,564 0.04
1,972 City Bank 16,959 0.01
1,345 City Holding Company 54,836 0.04
1,499 Clean Harbors Incorporated 106,519 0.09
2,181 Cleco Corporation 50,883 0.04
3,947 Cleveland-Cliffs Incorporated 470,403 0.38
2,467 Coach Incorporated 71,124 0.06
534 Coca-Cola Company 27,693 0.02
4,200 Coeur d’Alene Mines Corporation 12,180 0.01
1,138 Colgate-Palmolive Company 78,545 0.06
3,186 Colonial Properties Trust 63,688 0.05
2,714 Columbus McKinnon Corporation 65,353 0.05
1,737 Comcast Corporation (Class A) 32,899 0.03
109 Comerica Incorporated 2,793 0.00
2,599 CommScope Incorporated 136,655 0.11
2,382 Complete Production Services Incorporated 86,752 0.07
2,634 Compuware Corporation 25,128 0.02
1,887 Comstock Resources Incorporated 159,319 0.13
1,487 Comtech Telecommunications Corporation 72,863 0.06
1,852 ConocoPhillips 174,421 0.14
142 CONSOL Energy Incorporated 15,940 0.01
1,441 Consolidated Graphics Incorporated 70,998 0.06
516 Constellation Energy Group Incorporated 42,286 0.03
1,084 Corporate Office Properties Trust 37,138 0.03
673 Corvel Corporation 22,788 0.02
6,287 Credence Systems Corporation 8,173 0.01
1,541 CSG Systems International Incorporated 16,982 0.01
230 Cubic Corporation 5,134 0.00
2,001 Cubist Pharmaceuticals Incorporated 35,678 0.03
2,069 Cummins Incorporated 135,313 0.11
1,176 Curtiss-Wright Corporation $52,602 0.04
732 Cutera Incorporated 6,581 0.01
3,833 Cybersource Corporation 64,126 0.05
840 Cynosure Incorporated (Class A) 16,649 0.01
1,523 Cypress Bioscience Incorporated 10,859 0.01
658 Darling International Incorporated 10,870 0.01
1,166 Deckers Outdoor Corporation 162,319 0.13
452 Delek US Holdings Incorporated 4,163 0.00
3,285 Deluxe Corporation 58,539 0.05
16,476 Denny’s Corporation 46,792 0.04
1,284 Developers Diversified Realty Corporation 44,478 0.04
147 Devon Energy Corporation 17,644 0.01
166 DeVry Incorporated 8,893 0.01
4,595 DiamondRock Hospitality Company 49,948 0.04
2,692 DirecTV Group Incorporated 69,723 0.06
1,229 Discover Financial Services 16,161 0.01
830 DISH Network Corporation (Class A) 24,253 0.02
678 Dolby Laboratories Incorporated (Class A) 27,269 0.02
1,589 Dollar Tree Incorporated 51,960 0.04
2,952 Domino’s Pizza Incorporated 33,918 0.03
1,043 Dow Chemical Company 36,369 0.03
118 Dress Barn Incorporated 1,579 0.00
1,832 Dresser-Rand Group Incorporated 71,466 0.06
2,849 DSW Incorporated (Class A) 33,561 0.03
22,652 E*Trade Financial Corporation 70,674 0.06
891 Eastgroup Properties Incorporated 38,162 0.03
1,678 eBay Incorporated 45,826 0.04
2,622 Eclipsys Corporation 48,061 0.04
2,720 Edison International 139,590 0.11
1,365 eHealth Incorporated 24,106 0.02
4,364 Electronic Data Systems Corporation 107,529 0.09
1,117 Eli Lilly & Company 51,483 0.04
397 Embarq Corporation 18,766 0.02
5,822 EMC Corporation 85,409 0.07
3,819 Emergent Biosolutions Incorporated 37,923 0.03
2,121 Emerson Electric Company 104,777 0.09
3,739 Emulex Corporation 43,559 0.04
3,444 Energen Corporation 268,288 0.22
282 Energizer Holdings Incorporated 20,611 0.02
2,353 Energy Conversion Devices Incorporated 173,181 0.14
1,268 EnergySolutions Incorporated 28,340 0.02
671 EnerSys 22,948 0.02
769 EnPro Industries Incorporated 28,714 0.02
677 ENSCO International Incorporated 54,634 0.04
2,305 Entertainment Properties Trust 113,959 0.09
6,278 Enzon Pharmaceuticals Incorporated 44,762 0.04
872 Equity Lifestyle Properties Incorporated 38,368 0.03
3,525 Equity Residential Properties Trust 134,831 0.11
5,926 eResearch Technology Incorporated 103,349 0.08
443 Essex Property Trust Incorporated 47,180 0.04
1,185 Estee Lauder Cos. Incorporated (Class A) 55,008 0.04
874 Evercore Partners Incorporated 8,303 0.01
717 Evergreen Solar Incorporated 6,933 0.01
1,119 Exide Technologies 18,754 0.02
1,351 Expedia Incorporated 24,831 0.02
1,178 Extra Space Storage Incorporated 18,071 0.01
Putnam Total Return Fund
THE ACCOMPANYING NOTES ARE AN INTEGRAL PART OF THESE FINANCIAL STATEMENTS.
Number of Shares
ValueUSD
% ofFund
Number of Shares
ValueUSD
% ofFund
U.S. EQUITIES (Continued) U.S. EQUITIES (Continued)

93
5,720 Exxon Mobil Corporation $502,445 0.41
8,555 EZCORP Incorporated (Class A) 109,076 0.09
2,147 F5 Networks Incorporated 60,996 0.05
1,598 Factset Research Systems Incorporated 90,063 0.07
97 Fairpoint Communications Incorporated 699 0.00
1,130 Family Dollar Stores Incorporated 22,532 0.02
2,263 FBL Financial Group Incorporated (Class A) 44,988 0.04
1,293 FCStone Group Incorporated 36,113 0.03
520 Federal Realty Investment Trust 35,880 0.03
1,151 Federated Investors Incorporated 39,617 0.03
924 FEI Company 21,058 0.02
99 First Industrial Realty Trust 2,720 0.00
2,754 First Mercury Financial Corporation 48,581 0.04
408 First Midwest Bancorp Incorporated 7,609 0.01
1,754 First Niagara Financial Group Incorporated 22,556 0.02
1,313 First Regional Bancorp 7,418 0.01
204 First Solar Incorporated 55,631 0.05
896 FirstEnergy Corporation 73,696 0.06
937 FirstMerit Corporation 15,292 0.01
2,482 Flowers Foods Incorporated 70,340 0.06
1,688 FMC Corporation 130,719 0.11
1,171 Forest Laboratories Incorporated 40,681 0.03
937 Fossil Incorporated 27,239 0.02
719 Foster Wheeler Limited 52,422 0.04
109 Foundation Coal Holdings Incorporated 9,647 0.01
417 Franklin Electric Company Incorporated 16,171 0.01
3,685 Franklin Street Properties Corporation 46,689 0.04
1,270 Freightcar America Incorporated 45,110 0.04
5,545 Frontier Oil Corporation 132,581 0.11
1,045 Fuel Systems Solutions Incorporated 40,233 0.03
887 Fuel Tech Incorporated 15,647 0.01
3,421 FuelCell Energy Incorporated 24,289 0.02
1,165 GameStop Corporation 46,996 0.04
2,289 Gardner Denver Incorporated 130,015 0.11
1,084 General Cable Corporation 65,907 0.05
4,640 General Electric Company 123,331 0.10
3,049 General Growth Properties Incorporated 106,654 0.09
2,260 Genesco Incorporated 69,585 0.06
1,864 Genoptix Incorporated 58,455 0.05
701 Gen-Probe Incorporated 33,290 0.03
2,023 GFI Group Incorporated 18,227 0.01
363 Global Industries Limited 6,509 0.01
3,616 GLG Partners Incorporated 28,205 0.02
3,000 Golden Star Resources Limited 7,950 0.01
924 Goldman Sachs Group Incorporated 161,164 0.13
396 Gorman-Rupp Company 15,808 0.01
1,295 GrafTech International Limited 34,745 0.03
719 Gramercy Capital Corporation 8,333 0.01
614 Greatbatch Incorporated 10,616 0.01
3,090 Green Bankshares Incorporated 43,353 0.04
997 Greenhill & Company Incorporated 52,961 0.04
1,082 Grief Incorporated (Class A) 69,280 0.06
2,392 Gymboree Corporation 95,847 0.08
2,239 H.B. Fuller Company 50,243 0.04
801 Haemonetics Corporation 44,415 0.04
218 Halliburton Company 11,563 0.01
348 Hancock Holding Company $13,673 0.01
1,295 Hansen Natural Corporation 37,322 0.03
886 Harris & Harris Group Incorporated 5,316 0.00
925 Hasbro Incorporated 33,041 0.03
1,900 HCP Incorporated 60,325 0.05
2,466 Headwaters Incorporated 29,025 0.02
865 Health Care REIT Incorporated 38,493 0.03
1,959 Healthcare Services Group Incorporated 29,796 0.02
3,860 Healthsouth Corporation 64,192 0.05
2,776 Healthspring Incorporated 46,859 0.04
1,130 Hecla Mining Company 10,464 0.01
1,048 Heico Corporation 34,102 0.03
924 Heidrick & Struggles International Incorporated 25,539 0.02
2,073 Helmerich & Payne Incorporated 149,297 0.12
1,997 Herman Miller Incorporated 49,705 0.04
3,644 Hewlett-Packard Company 160,773 0.13
2,750 Hillenbrand Incorporated 58,438 0.05
1,534 Holly Corporation 56,543 0.05
1,385 Home Properties of NY Incorporated 66,563 0.05
1,973 Honeywell International Incorporated 99,084 0.08
2,238 Hooker Furniture Corporation 38,762 0.03
9,481 Host Marriott Corporation 129,321 0.11
5,545 HRPT Properties Trust 37,540 0.03
1,080 Humana Incorporated 42,930 0.04
884 Hutchinson Technology Incorporated 11,881 0.01
2,382 IBM Corporation 281,814 0.23
2,023 ICF International Incorporated 33,582 0.03
369 IHS Incorporated (Class A) 25,682 0.02
1,530 II-VI Incorporated 53,443 0.04
812 Illinois Tool Works Incorporated 38,578 0.03
1,476 Illumina Incorporated 128,560 0.10
1,784 Immucor Incorporated 46,170 0.04
1,175 Imperial Sugar Company 18,248 0.01
5,511 Informatica Corporation 82,885 0.07
5,790 Inland Real Estate Corporation 83,376 0.07
719 Insituform Technologies Incorporated 10,950 0.01
3,673 Integra Bank Corporation 28,796 0.02
8,286 Intel Corporation 177,983 0.15
2,197 Interactive Brokers Group Incorporated (Class A) 70,590 0.06
2,491 Interactive Data Corporation 62,599 0.05
3,621 InterDigital Incorporated 88,063 0.07
5,836 International Coal Group Incorporated 76,160 0.06
694 Intervest Bancshares Corporation 3,359 0.00
890 Interwoven Incorporated 10,689 0.01
774 Intevac Incorporated 8,731 0.01
969 Intuit Incorporated 26,677 0.02
268 Intuitive Surgical Incorporated 72,127 0.06
2,285 Investment Technology Group Incorporated 76,456 0.06
4,185 Investors Real Estate Trust 39,925 0.03
1,185 Invitrogen Corporation 46,452 0.04
8,033 ION Geophysical Corporation 140,176 0.11
2,317 iShares Dow Jones U.S. Real Estate Index Fund 214,138 0.17
15,546 iShares MSCI EAFE Index Fund 1,066,767 0.87
1,650 iShares Russell 2000 Growth Index Fund 125,615 0.10
2,239 iShares Russell 2000 Index Fund 154,558 0.13
1,520 iShares Russell 2000 Value Index Fund 96,748 0.08
Putnam Total Return Fund
THE ACCOMPANYING NOTES ARE AN INTEGRAL PART OF THESE FINANCIAL STATEMENTS.
Number of Shares
ValueUSD
% ofFund
Number of Shares
ValueUSD
% ofFund
U.S. EQUITIES (Continued) U.S. EQUITIES (Continued)

94
704 Itron Incorporated $69,231 0.06
1,210 ITT Educational Services Incorporated 99,970 0.08
423 J Crew Group Incorporated 13,959 0.01
2,743 j2 Global Communications Incorporated 63,089 0.05
3,743 Jack Henry & Associates Incorporated 80,999 0.07
2,278 Jack in the Box Incorporated 51,027 0.04
3,947 Jakks Pacific Incorporated 86,242 0.07
181 James River Coal Company 10,612 0.01
2,159 Janus Capital Group Incorporated 57,062 0.05
5,234 JDA Software Group Incorporated 94,735 0.08
2,283 Johnson & Johnson 146,751 0.12
1,262 Jones Lang LaSalle Incorporated 75,947 0.06
1,946 Jos. A. Bank Clothiers Incorporated 52,017 0.04
125 Joy Global Incorporated 9,478 0.01
2,908 JPMorgan Chase & Company 99,773 0.08
1,340 Kaiser Aluminum Corporation 71,730 0.06
2,943 Kimco Realty Corporation 101,504 0.08
1,318 Kinetic Concepts Incorporated 52,496 0.04
2,012 King Pharmaceuticals Incorporated 21,066 0.02
431 Kirby Corporation 20,688 0.02
3,020 Knight Capital Group Incorporated (Class A) 54,300 0.04
4,330 Koppers Holdings Incorporated 181,297 0.15
1,154 Korn/Ferry International 18,152 0.01
2,406 Kroger Company 69,389 0.06
1,537 Landauer Incorporated 86,441 0.07
760 Layne Christensen Company 33,280 0.03
789 Lear Corporation 11,180 0.01
2,000 Lennox International Incorporated 57,920 0.05
4,578 Lexington Corporate Properties Trust 62,398 0.05
1,710 Liberty Global Incorporated (Class A) 53,728 0.04
1,387 Liberty Property Trust 45,979 0.04
194 Lindsay Corporation 16,484 0.01
1,710 Lockheed Martin Corporation 168,538 0.14
875 Loews Corporation 41,029 0.03
5,164 Longs Drug Stores Corporation 217,456 0.18
846 LSB Industries Incorporated 16,818 0.01
5,570 LTC Properties Incorporated 142,369 0.12
4,094 LTX Corporation 9,007 0.01
829 Lufkin Industries Incorporated 69,039 0.06
3,770 Luminex Corporation 77,436 0.06
633 Macerich Company 39,328 0.03
1,977 Mack-Cali Realty Corporation 67,534 0.06
3,037 Magellan Health Services Incorporated 112,460 0.09
3,344 Maidenform Brands Incorporated 45,144 0.04
306 Manitowoc Company Incorporated 9,939 0.01
1,561 Mannatech Incorporated 8,492 0.01
285 Manpower Incorporated 16,561 0.01
3,501 Marathon Oil Corporation 181,492 0.15
3,755 Mariner Energy Incorporated 138,785 0.11
8,050 Martek Biosciences Corporation 271,366 0.22
2,889 Marvel Entertainment Incorporated 92,824 0.08
1,022 Massey Energy Company 95,710 0.08
203 Mastercard Incorporated (Class A) 53,901 0.04
2,703 Mattel Incorporated 46,275 0.04
1,885 Matthews International Corporation 85,315 0.07
377 Maximus Incorporated 13,127 0.01
432 McDermott International Incorporated $26,732 0.02
1,088 McDonald’s Corporation 61,102 0.05
2,842 McMoRan Exploration Company 77,984 0.06
836 Medcath Corporation 15,031 0.01
5,116 Medical Properties Trust Incorporated 51,723 0.04
3,584 Medicines Company 71,035 0.06
394 Medicis Pharmaceutical Corporation (Class A) 8,183 0.01
1,152 MEMC Electronic Materials Incorporated 70,871 0.06
621 Men’s Wearhouse Incorporated 10,116 0.01
3,094 Mentor Corporation 86,044 0.07
5,169 Merck & Company Incorporated 194,613 0.16
1,824 Meridian Bioscience Incorporated 49,102 0.04
5,628 Merit Medical Systems Incorporated 82,732 0.07
1,046 Methode Electronics Incorporated (Class A) 10,931 0.01
227 Met-Pro Corporation 3,028 0.00
7,164 Micrel Incorporated 65,551 0.05
11,638 Microsoft Corporation 320,394 0.26
965 MicroStrategy Incorporated 62,484 0.05
747 Mid-America Apartment Communities Incorporated 38,127 0.03
25 Minerals Technologies Incorporated 1,590 0.00
147 Mirant Corporation 5,743 0.00
3,531 Mission West Properties 38,700 0.03
3,070 Monro Muffler Incorporated 47,278 0.04
938 Monsanto Company 118,310 0.10
4,067 Moog Incorporated 151,455 0.12
1,669 Morgan Stanley 60,117 0.05
1,417 Morningstar Incorporated 102,067 0.08
1,787 Mueller Water Products Incorporated (Class A) 14,421 0.01
1,560 MWI Veterinary Supply Incorporated 51,652 0.04
1,360 Myriad Genetics Incorporated 61,880 0.05
1,089 Nalco Holding Company 23,032 0.02
3,220 Nara Bancorp Incorporated 34,454 0.03
1,295 Nasdaq OMX Group Incorporated 34,395 0.03
4,334 Nash Finch Company 148,526 0.12
3,720 National Health Investors Incorporated 106,020 0.09
2,520 National Instruments Corporation 71,543 0.06
5,640 National Retail Properties Incorporated 117,876 0.10
3,294 National Semiconductor Corporation 67,659 0.06
412 Nationwide Financial Services Incorporated (Class A) 19,780 0.02
1,871 Nationwide Health Properties Incorporated 58,918 0.05
1,653 Navigators Group Incorporated 89,245 0.07
855 NBTY Incorporated 27,403 0.02
1,416 NetApp Incorporated 30,628 0.02
2,489 Netflix Incorporated 64,764 0.05
2,021 Neurocrine Biosciences Incorporated 8,468 0.01
1,041 NewMarket Corporation 68,935 0.06
650 Newmont Mining Corporation 33,872 0.03
746 NIKE Incorporated (Class B) 44,462 0.04
498 Noble Corporation 32,275 0.03
290 Nordson Corporation 21,138 0.02
737 Northern Trust Corporation 50,485 0.04
276 Northrop Grumman Corporation 18,464 0.02
5,350 NorthStar Realty Finance Corporation 44,512 0.04
524 Northwest Natural Gas Company 24,240 0.02
256 Northwest Pipe Company 14,287 0.01
Putnam Total Return Fund
THE ACCOMPANYING NOTES ARE AN INTEGRAL PART OF THESE FINANCIAL STATEMENTS.
Number of Shares
ValueUSD
% ofFund
Number of Shares
ValueUSD
% ofFund
U.S. EQUITIES (Continued) U.S. EQUITIES (Continued)

95
2,201 Northwestern Corporation $55,949 0.05
3,084 Novatel Wireless Incorporated 34,325 0.03
2,003 NTELOS Holdings Corporation 49,534 0.04
6,033 Nuance Communications Incorporated 94,356 0.08
34 Nucor Corporation 2,539 0.00
837 NVIDIA Corporation 15,618 0.01
5,620 Obagi Medical Products Incorporated 48,051 0.04
944 Occidental Petroleum Corporation 84,752 0.07
1,111 Odyssey Re Holdings Corporation 39,441 0.03
369 OGE Energy Corporation 11,646 0.01
1,117 Oil States International Incorporated 70,740 0.06
483 Olin Corporation 12,645 0.01
1,584 Olympic Steel Incorporated 120,257 0.10
3,238 OM Group Incorporated 106,077 0.09
7,658 Omega Healthcare Investors Incorporated 127,199 0.10
374 Omnicell Incorporated 4,929 0.00
1,077 Onyx Pharmaceuticals Incorporated 38,341 0.03
2,130 optionsXpress Holdings Incorporated 47,584 0.04
6,299 Oracle Corporation 132,279 0.11
3,091 Orbital Sciences Corporation 72,824 0.06
1,863 Ormat Technologies Incorporated 91,622 0.07
2,088 OSI Pharmaceuticals Incorporated 86,276 0.07
1,306 Overseas Shipholding Group 103,618 0.08
1,197 Owens & Minor Incorporated 54,691 0.04
3,269 Pacific Capital BanCorporation 45,080 0.04
462 Packaging Corporation of America 9,928 0.01
709 Pall Corporation 28,069 0.02
267 Palm Incorporated 1,439 0.00
652 Papa John’s International Incorporated 17,343 0.01
1,000 Par Pharmaceutical Cos. Incorporated 16,220 0.01
8,204 Parametric Technology Corporation 136,761 0.11
1,313 Park Electrochemical Corporation 31,919 0.03
214 Parker-Hannifin Corporation 15,239 0.01
95 Patriot Coal Corporation 14,516 0.01
3,043 PC Mall Incorporated 42,746 0.03
1,427 PDL BioPharma Incorporated 15,126 0.01
197 Peabody Energy Corporation 17,338 0.01
722 Pentair Incorporated 25,277 0.02
1,474 Pepsi Bottling Group Incorporated 41,110 0.03
828 PepsiCo Incorporated 52,644 0.04
706 Perini Corporation 23,333 0.02
3,160 Perry Ellis International Incorporated 67,118 0.05
5,267 Pfizer Incorporated 91,909 0.08
2,533 PG&E Corporation 100,433 0.08
2,310 Philadelphia Consolidated Holding Corporation 78,471 0.06
1,997 Philip Morris International Incorporated 98,472 0.08
4,831 Phillips-Van Heusen Corporation 176,911 0.14
2,513 Photronics Incorporated 17,692 0.01
377 Pico Holdings Incorporated 16,392 0.01
1,919 Plantronics Incorporated 42,832 0.03
1,072 Polycom Incorporated 26,114 0.02
3,206 Portland General Electric Company 72,199 0.06
378 Potlatch Corporation 17,055 0.01
6,460 Premiere Global Services Incorporated 94,187 0.08
9,039 Prestige Brands Holdings Incorporated 96,356 0.08
1,076 Priceline.com Incorporated 124,203 0.10
1,489 Procter & Gamble Company $90,397 0.07
1,649 Progress Software Corporation 42,165 0.03
4,471 ProLogis Trust 242,596 0.20
3,352 PROS Holdings Incorporated 37,643 0.03
2,369 PS Business Parks Incorporated 122,288 0.10
181 Public Service Enterprise Group Incorporated 8,313 0.01
1,659 Public Storage Incorporated 134,014 0.11
1,209 Qualcomm Incorporated 53,643 0.04
621 Quanex Building Products Corporation 9,228 0.01
1,445 Questar Corporation 102,523 0.08
8,394 Questcor Pharmaceuticals Incorporated 38,948 0.03
4,016 Quidel Corporation 65,782 0.05
1,112 RadioShack Corporation 13,644 0.01
341 Ralcorp Holdings Incorporated 16,815 0.01
2,626 Ramco-Gershenson Properties 53,912 0.04
1,898 Rayonier Incorporated 80,589 0.07
2,310 Raytheon Company 129,799 0.11
1,875 Realty Income Corporation 42,656 0.03
594 Regency Centers Corporation 35,111 0.03
2,235 Regeneron Pharmaceuticals Incorporated 32,273 0.03
2,860 Rent-A-Center Incorporated 58,802 0.05
2,527 Reynolds American Incorporated 117,885 0.10
992 Robert Half International Incorporated 23,768 0.02
484 Roper Industries Incorporated 31,765 0.03
434 Rosetta Resources Incorporated 12,369 0.01
380 Royal Gold Incorporated 11,913 0.01
8,660 Ruby Tuesday Incorporated 46,764 0.04
863 Ryder System Incorporated 59,323 0.05
3,126 S&P 500 Index Depository Receipts 400,378 0.33
282 S&P Midcap 400 Index Depository Receipts 42,046 0.03
1,962 S&T Bancorp Incorporated 57,016 0.05
1,151 Safety Insurance Group Incorporated 41,033 0.03
3,078 Safeway Incorporated 87,877 0.07
762 SAIC Incorporated 15,857 0.01
133 Sanderson Farms Incorporated 4,591 0.00
3,573 Sara Lee Corporation 43,698 0.04
892 Saul Centers Incorporated 41,701 0.03
1,681 Schering-Plough Corporation 33,065 0.03
235 Schnitzer Steel Industries Incorporated (Class A) 26,908 0.02
1,863 Scholastic Corporation 53,394 0.04
4,947 Sciele Pharma Incorporated 95,823 0.08
4,472 SeaBright Insurance Holdings Incorporated 64,576 0.05
2,016 Selective Insurance Group 37,820 0.03
4,551 Senior Housing Properties Trust 88,881 0.07
2,694 Sepracor Incorporated 53,557 0.04
2,420 Silgan Holdings Incorporated 122,791 0.10
8,968 Silicon Image Incorporated 65,018 0.05
1,838 Silicon Storage Technology Incorporated 5,091 0.00
3,310 Simon Property Group Incorporated 297,536 0.24
8,247 Sinclair Broadcast Group Incorporated (Class A) 62,677 0.05
402 SJW Corporation 10,613 0.01
94 Skechers U.S.A. Incorporated (Class A) 1,853 0.00
1,717 SkyWest Incorporated 21,720 0.02
636 SL Green Realty Corporation 52,597 0.04
884 Sonic Corporation 13,083 0.01
17,572 SonicWall Incorporated 113,339 0.09
Putnam Total Return Fund
THE ACCOMPANYING NOTES ARE AN INTEGRAL PART OF THESE FINANCIAL STATEMENTS.
Number of Shares
ValueUSD
% ofFund
Number of Shares
ValueUSD
% ofFund
U.S. EQUITIES (Continued) U.S. EQUITIES (Continued)

96
1,464 Southern Copper Corporation $156,106 0.13
2,310 Southwest Bancorp Incorporated 26,565 0.02
540 Southwest Water Company 5,411 0.00
419 Sovran Self Storage Incorporated 17,372 0.01
3,398 Spartan Stores Incorporated 77,508 0.06
2,418 SPSS Incorporated 87,967 0.07
2,681 Standard Parking Corporation 48,741 0.04
1,295 State Street Corporation 82,725 0.07
2,716 Steel Dynamics Incorporated 106,114 0.09
3,431 Steelcase Incorporated 34,207 0.03
3,401 Steris Corporation 97,507 0.08
1,262 Sterling Bancshares Incorporated 11,472 0.01
672 Sterling Financial Corporation 2,782 0.00
5,320 Steven Madden Limited 97,888 0.08
1,860 Stifel Financial Corporation 63,965 0.05
2,331 Stone Energy Corporation 153,636 0.13
1,738 Suffolk Bancorp 51,062 0.04
79 Sun Hydraulics Corporation 2,549 0.00
2,040 Sunoco Incorporated 82,885 0.07
156 Sunpower Corporation (Class A) 11,191 0.01
2,179 Sunstone Hotel Investors Incorporated 36,084 0.03
177 Superior Essex Incorporated 7,898 0.01
447 SVB Financial Group 21,501 0.02
1,487 Swift Energy Company 98,231 0.08
5,612 SWS Group Incorporated 93,159 0.08
5,969 Sybase Incorporated 175,608 0.14
5,534 Sykes Enterprises Incorporated 104,482 0.09
565 Synaptics Incorporated 21,317 0.02
3,419 Syniverse Holdings Incorporated 55,319 0.05
1,614 Tanger Factory Outlet Centers 57,991 0.05
505 Target Corporation 23,472 0.02
1,247 Taubman Centers Incorporated 60,604 0.05
1,184 Techne Corporation 91,630 0.07
1,900 Teledyne Technologies Incorporated 92,701 0.08
247 Telephone and Data Systems Incorporated 11,646 0.01
1,004 Tenneco Automotive Incorporated 13,584 0.01
128 Terex Corporation 6,569 0.01
4,469 Terra Industries Incorporated 220,277 0.18
1,295 Tesoro Corporation 25,550 0.02
842 Tetra Tech Incorporated 18,953 0.02
394 Texas Instruments Incorporated 11,079 0.01
846 TIBCO Software Incorporated 6,472 0.01
1,875 Tidewater Incorporated 121,669 0.10
6,759 Time Warner Incorporated 99,695 0.08
727 TJX Cos. Incorporated 22,864 0.02
3,125 Toro Company 103,969 0.08
4,690 Town Sports International Holdings Incorporated 43,805 0.04
633 Travelers Cos. Incorporated 27,428 0.02
1,315 Trico Marine Services Incorporated 47,919 0.04
1,111 Trizetto Group 23,742 0.02
2,135 True Religion Apparel Incorporated 56,962 0.05
1,701 TrueBlue Incorporated 22,470 0.02
9,828 TTM Technologies Incorporated 129,828 0.11
863 Tupperware Brands Corporation 29,532 0.02
4,482 U.S. Bancorp 124,600 0.10
373 Ultralife Batteries Incorporated 3,987 0.00
1,399 Unit Corporation $116,075 0.09
5,967 United Online Incorporated 59,551 0.05
847 United Technologies Corporation 52,218 0.04
951 United Therapeutics Corporation 92,960 0.08
766 UnitedHealth Group Incorporated 20,108 0.02
338 Universal Corporation 15,284 0.01
1,619 Universal Health Realty Income Trust 48,473 0.04
1,331 Urban Outfitters Incorporated 41,461 0.03
5,724 Urstadt Biddle Properties Incorporated (Class A) 83,914 0.07
1,193 USA Mobility Incorporated 9,019 0.01
1,558 USEC Incorporated 9,457 0.01
6,670 Vaalco Energy Incorporated 56,495 0.05
1,007 Valero Energy Corporation 41,438 0.03
1,272 Varian Medical Systems Incorporated 65,953 0.05
1,633 Varian Semiconductor Equipment 56,861 0.05
762 Varian Incorporated 38,908 0.03
1,039 Veeco Instruments Incorporated 16,718 0.01
2,022 Ventas Incorporated 86,077 0.07
3,534 VeraSun Energy Corporation 14,560 0.01
5,229 Verizon Communications Incorporated 184,741 0.15
4,821 Virginia Commerce BanCorporation 25,021 0.02
1,910 Vornado Realty Trust 168,080 0.14
4,375 W.R. Berkley Corporation 105,350 0.09
1,733 Wabtec Corporation 84,258 0.07
1,099 Waddell & Reed Financial Incorporated (Class A) 38,476 0.03
1,108 Wal-Mart Stores Incorporated 62,159 0.05
1,609 Walt Disney Company 50,153 0.04
443 Walter Industries Incorporated 48,105 0.04
5,152 Warnaco Group Incorporated 226,997 0.19
969 Waters Corporation 62,501 0.05
2,768 Watson Wyatt Worldwide Incorporated (Class A) 146,400 0.12
550 Watts Water Technologies Incorporated (Class A) 13,695 0.01
1,148 Weingarten Realty Investors 34,807 0.03
1,175 WellCare Health Plans Incorporated 42,476 0.03
1,219 WellPoint Incorporated 57,976 0.05
2,415 WESCO International Incorporated 96,455 0.08
247 Westar Energy Incorporated 5,313 0.00
364 WGL Holdings Incorporated 12,645 0.01
571 Wiley & Sons Incorporated (Class A) 25,712 0.02
65 WMS Industries Incorporated 1,935 0.00
4,241 Wolverine World Wide Incorporated 113,107 0.09
2,260 World Acceptance Corporation 76,072 0.06
2,645 Wyeth 126,748 0.10
461 Xilinx Incorporated 11,617 0.01
1,200 Yahoo! Incorporated 24,792 0.02
1,707 Yum! Brands Incorporated 59,864 0.05
778 Zenith National Insurance Corporation 27,354 0.02
1,723 Zoll Medical Corporation 58,031 0.05
Total U.S. Equities $41,749,355 34.08
NON-U.S. EQUITIES (20.16%)
19,608 3i Group PLC $322,159 0.26
53,792 A2A SpA 196,879 0.16
1,247 ABB Limited 35,540 0.03
Putnam Total Return Fund
THE ACCOMPANYING NOTES ARE AN INTEGRAL PART OF THESE FINANCIAL STATEMENTS.
Number of Shares
ValueUSD
% ofFund
Number of Shares
ValueUSD
% ofFund
Number of Shares
ValueUSD
% ofFund
U.S. EQUITIES (Continued) U.S. EQUITIES (Continued)

97
NON-U.S. EQUITIES (Continued) NON-U.S. EQUITIES (Continued)
Number of Shares
ValueUSD
% ofFund
Number of Shares
ValueUSD
% ofFund
1,314 Abengoa SA $41,102 0.03
97 Accenture Limited 3,946 0.00
173 Acciona SA 41,004 0.03
233 Adidas-Salomon AG 14,726 0.01
356 Agnico-Eagle Mines Limited 26,472 0.02
2,200 Aisin Seiki Company Limited 71,808 0.06
400 Alfresa Holdings Corporation 28,524 0.02
307 Allianz SE 54,146 0.04
3,657 Allied Irish Banks PLC 56,391 0.05
1,078 Allied World Assurance Company Holdings Limited 42,700 0.04
5,600 ALPS Electric Company Limited 57,904 0.05
12,508 American Oriental Bioengineering Incorporated 123,454 0.10
2,194 Andritz AG 131,026 0.11
631 AngloGold Ashanti Limited ADR 21,366 0.02
5,673 Ansell Limited 49,866 0.04
19,619 Antofagasta PLC 257,205 0.21
461 Apex Silver Mines Limited 2,277 0.00
4,879 Arcelor Mittal 482,484 0.39
708 Arch Capital Group Limited 46,955 0.04
3,092 Aspen Insurance Holdings Limited 73,188 0.06
14,246 AstraZeneca PLC 607,877 0.50
455 Aurizon Mines Limited 2,170 0.00
716 Autoliv Incorporated 33,301 0.03
800 Axfood AB 26,520 0.02
4,075 Balfour Beatty PLC 34,515 0.03
949 Ballard Power Systems Incorporated 3,986 0.00
3,232 Banco Latinoamericano de Exportaciones SA (Class E) 52,294 0.04
77,422 Barclays PLC 411,982 0.33
900 Barrick Gold Corporation 40,950 0.03
2,664 BASF AG 183,816 0.15
744 Belgacom SA 32,089 0.03
16,535 BHP Billiton Limited 689,675 0.56
1,900 Bilfinger Berger AG 165,680 0.14
98 BKW FMB Energie AG 12,974 0.01
21,146 BlueScope Steel Limited 224,993 0.18
4,145 BNP Paribas SA 375,620 0.31
91,634 Boart Longyear Group 196,097 0.16
4,730 Bouygues SA 313,977 0.26
20,096 BP PLC 233,516 0.19
74,848 British Airways PLC 321,098 0.26
4,500 BYD Company Limited 5,715 0.01
189 Canadian Solar Incorporated 7,579 0.01
4,000 Canon Incorporated 204,120 0.17
1,273 Centennial Coal Company Limited 6,785 0.01
25 Central Japan Railway Company 273,533 0.22
5,142 Charter PLC 89,059 0.07
8,000 China Coal Energy Company 14,000 0.01
4,258 China Medical Technologies Incorporated 210,388 0.17
5,000 China Shenhua Energy Company Limited 19,550 0.02
567 China Sunergy Company Limited 4,695 0.00
343 Cia de Minas Buenaventura SA 22,422 0.02
628 Cia de Saneamento Basico do Estado de Sao Paulo 32,128 0.03
1,189 Colruyt SA 314,062 0.26
586 Commerzbank AG 17,387 0.01
225 Conergy AG 4,653 0.00
356 Consolidated Water Company Incorporated $7,020 0.01
4,424 Cookson Group PLC 55,300 0.05
1,154 Core Laboratories NV 164,053 0.13
32,533 Corporacion Mapfre SA 155,833 0.13
2,753 Cosan Limited (Class A) 34,743 0.03
600 Credit Saison Company Limited 12,618 0.01
2,900 Crystallex International Corporation 3,074 0.00
895 CTC Media Incorporated 22,071 0.02
1,000 Daiichi Sankyo Company Limited 27,490 0.02
3,964 Daily Mail and General Trust (Class A) 24,775 0.02
3,727 Davis Service Group PLC 33,170 0.03
37,000 DBS Group Holdings Limited 513,190 0.42
306 Deutsche Bank AG 26,481 0.02
3,300 Diamond Lease Company Limited 143,187 0.12
333 EDF Energies Nouvelles SA 22,274 0.02
2,100 Eldorado Gold Corporation 17,955 0.02
10,071 Enel SpA 95,775 0.08
10,256 Energias de Portugal SA 53,536 0.04
10,527 ENI SpA 392,131 0.32
72 Ersol Solar Energy AG 11,452 0.01
1,093 European Aeronautic Defense and Space Company 20,712 0.02
3,549 Experian Group Limited 26,405 0.02
414 Felix Resources Limited 6,628 0.01
21,204 Fiat SpA 347,322 0.28
14,058 Fletcher Building Limited 67,987 0.06
13,418 France Telecom SA 395,428 0.32
63,000 Fujitsu Limited 466,200 0.38
8,000 Fushan International Energy Group Limited 6,080 0.01
1,245 Gammon Gold Incorporated 13,259 0.01
8,755 GlaxoSmithKline PLC 194,098 0.16
2,363 Global Sources Limited 35,870 0.03
417 Gloucester Coal Limited 5,112 0.00
1,649 Gold Fields Limited 20,827 0.02
880 Goldcorp Incorporated 40,630 0.03
700 Great Basin Gold Limited 2,345 0.00
6,000 GS Yuasa Corporation 28,740 0.02
1,518 Harmony Gold Mining Company Limited 18,550 0.02
12,854 HBOS PLC 51,272 0.04
1,769 Heineken NV 90,325 0.07
94 Helen of Troy Limited 1,515 0.00
906 Herbalife Limited 35,108 0.03
4,000 Hidili Industry International Development Limited 6,920 0.01
33,000 Hitachi Limited 237,600 0.19
3,210 Home Retail Group 13,931 0.01
16,000 Huaneng Power International Incorporated 11,040 0.01
6,000 Hyflux Limited 13,140 0.01
2,200 Iamgold Corporation 13,222 0.01
2,613 Iaws Group PLC 65,194 0.05
4,123 IMI PLC 35,870 0.03
23,077 Immofinanz Immobilien Anlagen AG 226,385 0.18
6,095 InBev NV 423,115 0.35
23,202 Inchcape PLC 147,565 0.12
5,190 ING Groep NV 165,509 0.14
3,641 Innospec Incorporated 68,451 0.06
5,215 International Power PLC 44,901 0.04
14,169 Investor AB (Class B) 298,966 0.24
Putnam Total Return Fund
THE ACCOMPANYING NOTES ARE AN INTEGRAL PART OF THESE FINANCIAL STATEMENTS.

98
18,000 Itochu Corporation $191,340 0.16
4,957 JA Solar Holdings Company Limited 83,525 0.07
4,000 Jardine Cycle & Carriage Limited 49,880 0.04
1,000 JFE Holdings Incorporated 50,180 0.04
5,000 KAO Corporation 130,650 0.11
3,891 KBC Groupe SA 432,212 0.35
70 KDDI Corporation 432,466 0.35
7,969 Kerry Group PLC (Class A) 235,962 0.19
1,260 Kinross Gold Corporation 29,749 0.02
1,373 Koninklijke Ahold NV 18,467 0.02
1,206 Koninklijke DSM NV 70,973 0.06
71 Kuoni Reisen Holding AG 34,205 0.03
314 LDK Solar Company Limited 11,860 0.01
1,151 Lloyds TSB Group PLC 28,395 0.02
428 MacArthur Coal Limited 6,921 0.01
547 Macquarie Bank Limited 25,490 0.02
108 MAN AG 11,962 0.01
9,000 Marubeni Corporation 74,880 0.06
28,000 Matsushita Electric Industrial Company Limited 602,280 0.49
3,000 Matsushita Electric Works Limited 30,630 0.02
2,389 Mediaset SpA 15,744 0.01
950 Metallica Resources Incorporated 6,480 0.01
550 Minefinders Corporation 5,665 0.00
4,800 Mitsubishi Corporation 157,536 0.13
7,000 Mitsubishi Electric Corporation 75,320 0.06
1,000 Mitsui Mining Company Limited 3,410 0.00
103 Muenchener Rueckversicherungs-Gesellschaft AG 18,050 0.01
2,442 National Express Group PLC 46,325 0.04
2,848 National Grid PLC 37,480 0.03
1,351 Nationale A Portefeuille 101,325 0.08
34,000 Neptune Orient Lines Limited 80,920 0.07
730 New Oriental Education & Technology Group 42,530 0.03
5,129 Next PLC 99,041 0.08
4,107 Nice Systems Limited 121,239 0.10
33 Nippon Telegraph & Telephone Corporation 160,611 0.13
3,700 Nokia OYJ 90,206 0.07
34,533 Nordea AB 476,901 0.39
3,200 Northgate Minerals Corporation 8,800 0.01
3,087 Novartis AG 170,279 0.14
31 NTT Data Corporation 120,760 0.10
5,820 OCE NV 71,702 0.06
71,206 Old Mutual PLC 131,731 0.11
5,000 Olympus Corporation 168,850 0.14
880 ORIX Corporation 125,831 0.10
37,000 Osaka Gas Company Limited 135,050 0.11
451 PAN American Silver Corporation 15,596 0.01
2,390 Platinum Underwriters Holdings Limited 77,938 0.06
18,549 Prysmian SpA 471,701 0.38
9,980 Public Power Corporation SA 351,096 0.29
2,455 PV Crystalox Solar PLC 9,722 0.01
120 Q-Cells AG 12,167 0.01
1,473 Queensland Gas Company Limited 7,571 0.01
360 Rangold Resources Limited 16,592 0.01
425 Renewable Energy Corporation AS 11,029 0.01
1,776 Repsol YPF SA 70,010 0.06
112 Rieter Holding AG 36,603 0.03
Putnam Total Return Fund
THE ACCOMPANYING NOTES ARE AN INTEGRAL PART OF THESE FINANCIAL STATEMENTS.
Number of Shares
ValueUSD
% ofFund
Number of Shares
ValueUSD
% ofFund
NON-U.S. EQUITIES (Continued) NON-U.S. EQUITIES (Continued)
603 Riversdale Mining Limited $6,820 0.01
23 Roth & Rau AG 5,281 0.00
18,087 Royal Bank of Scotland Group PLC 77,412 0.06
2,864 Royal Dutch Shell PLC (Class A) 117,710 0.10
11,185 Royal Dutch Shell PLC (Class B) 450,084 0.37
92 S.A. D’Ieteren NV 25,399 0.02
179 Saft Groupe SA 7,808 0.01
3,450 Sai-Soc Assicuratrice Industriale SpA 114,437 0.09
11,000 Sanyo Electric Company Limited 25,630 0.02
277 Sasol Limited ADR 16,326 0.01
300 Seabridge Gold Incorporated 6,567 0.01
490 Silver Standard Resources Incorporated 14,039 0.01
1,170 Silver Wheaton Corporation 17,141 0.01
5,200 Skanska AB (Class B) 74,724 0.06
367 Sohu.com Incorporated 25,837 0.02
118 Solar Millennium AG 5,059 0.00
489 Solarfun Power Holdings Company Limited 8,538 0.01
431 Solaria Energia y Medio Ambiente SA 6,202 0.01
214 Solarworld AG 10,191 0.01
77 Solon AG Fuer Solartechnik 7,176 0.01
2,820 Solvay SA 368,969 0.30
2,600 Sony Corporation 113,542 0.09
526 Stantec Incorporated 13,540 0.01
13,891 Statoil ASA 518,690 0.42
4,280 Suedzucker AG 77,596 0.06
921 Suez SA 62,720 0.05
245 Suntech Power Holdings Company Limited 9,158 0.01
3,600 Suzuken Company Limited 132,768 0.11
34,000 Swire Pacific Limited 347,820 0.28
5,000 Taisho Pharmaceutical Company Limited 92,850 0.08
6,944 Tanfield Group PLC 4,375 0.00
3,796 Telefonica SA 100,860 0.08
890 Telekom Austria AG 18,414 0.02
26,930 Terna SPA 113,914 0.09
495 Theolia SA 13,083 0.01
44,888 Thomas Cook Group PLC 209,178 0.17
4,800 Tokyo Electric Power Company 123,360 0.10
6,208 Tomkins PLC 18,624 0.02
8,000 Toyo Suisan Kaisha Limited 180,720 0.15
500 Toyota Motor Corporation 23,580 0.02
130 TransAlta Corporation 4,706 0.00
156 Trina Solar Limited 4,778 0.00
9,175 TUI Travel PLC 37,434 0.03
509 UK Coal PLC 5,655 0.00
1,113 Unilever NV 31,598 0.03
2,834 Valeo SA 91,056 0.07
2,116 Validus Holdings Limited 44,753 0.04
14,882 Vector Limited 21,762 0.02
662 Veolia Environnement 37,138 0.03
4,588 Vivendi SA 174,069 0.14
7,272 Voestalpine AG 596,586 0.49
99 Volkswagen AG 14,357 0.01
102 Volkswagon AG 29,487 0.02
5,800 Volvo AB (Class A) 68,208 0.06
9,947 Westpac Banking Corporation 190,684 0.16
4,930 William Hill PLC 31,453 0.03

99
8,747 Wolseley PLC $65,603 0.05
14,666 Woolworths Limited 343,184 0.28
1,600 Yamana Gold Incorporated 26,400 0.02
8,000 Yanzhou Coal Mining Company Limited 14,880 0.01
471 Yingli Green Energy Holding Company Limited 7,475 0.01
5,300 Yucheng Technologies Limited 59,307 0.05
1,138 Zurich Financial Services AG 291,840 0.24
Total Non-U.S. Equities $24,695,071 20.16
U.S. GOVERNMENT & AGENCY MORTGAGE OBLIGATIONS (15.19%)
$1,000,000 Federal National*Mortgage Association (TBA) 5.50 01/08/2038 $982,930 0.80
14,000,000 Federal National*Mortgage Association (TBA) 5.50 01/07/2035 13,794,375 11.26
4,000,000 Federal National* Mortgage Association (TBA) 5.00 01/07/2038 3,832,812 3.13
Total U.S. Government & Agency Mortgage Obligations $18,610,117 15.19
COMMERCIAL PAPER (8.03%)
$887,999 Enterprise Funding Company LLC 0.00 14/07/2008 $887,166 0.73
2,500,000 Gemini Securitization Corporation LLC 0.00 03/07/2008 2,499,639 2.04
2,000,000 Three Pillars Funding Corporation 0.00 10/07/2008 1,998,670 1.63
2,000,000 Thunder Bay Funding Incorporated 0.00 16/07/2008 1,997,792 1.63
2,449,999 Tulip Funding Corporation 0.00 09/07/2008 2,448,584 2.00
Total Commercial Paper $9,831,851 8.03
COLLATERALISED MORTGAGE OBLIGATIONS (4.23%)
$73,000 Banc of America Alternative Loan Trust 5.71 25/10/2036 $68,876 0.06
200,000 Banc of America Commercial Mortgage Incorporated 6.12 10/08/2014 199,898 0.16
102,783 Banc of America Funding Corporation 5.99 20/05/2036 81,713 0.07
76,173 Bear Stearns*Alternative A Trust 6.25 25/08/2036 58,891 0.05
68,859 Bear Stearns*Alternative A Trust 5.69 25/09/2035 52,870 0.04
45,000 Citigroup Commercial Mortgage Trust 6.03 10/10/2012 45,240 0.04
75,000 Citigroup Commercial Mortgage Trust 6.30 10/11/2014 76,169 0.06
104,070 Citigroup Mortgage Loan Trust Incorporated 5.66 25/11/2036 78,312 0.06
98,558 Countrywide Alternative Loan Trust (Class 2A2) 6.00 25/02/2037 80,217 0.06
$79,257 Countrywide Alternative Loan Trust (Class A4) 6.00 25/02/2037 $64,594 0.05
56,098 Countrywide Alternative Loan Trust 5.54 25/03/2047 50,651 0.04
159,506 Countrywide Alternative Loan Trust 5.12 25/03/2034 8,349 0.01
119,793 Countrywide Home Loans 5.71 20/11/2035 93,439 0.08
71,333 Federal National*Mortgage Association 28.63 25/02/2037 80,599 0.07
76,309 Federal National*Mortgage Association 17.24 25/04/2035 86,109 0.07
1,293,669 Federal National*Mortgage Association 6.50 01/07/2036 343,761 0.28
100,000 Federal National*Mortgage Association 6.00 25/10/2038 21,730 0.02
140,000 Federal National*Mortgage Association 6.00 25/05/2038 32,339 0.03
100,000 Federal National* Mortgage Association 6.00 25/04/2038 20,879 0.02
186,371 Federal National* Mortgage Association 5.22 25/07/2034 21,076 0.02
213,805 Federal National* Mortgage Association 5.12 25/04/2034 26,766 0.02
116,059 Federal National* Mortgage Association 4.72 25/07/2036 12,110 0.01
155,832 Federal National* Mortgage Association 4.57 25/12/2033 15,082 0.01
150,427 Federal National* Mortgage Association 4.52 25/10/2029 13,046 0.01
81,182 Federal National* Mortgage Association 4.26 25/01/2037 7,581 0.01
127,068 Federal National* Mortgage Association 4.22 25/03/2037 11,684 0.01
99,858 Federal National* Mortgage Association 4.22 25/04/2035 8,927 0.01
196,776 Federal National* Mortgage Association 4.22 25/08/2034 16,450 0.01
81,524 Federal National* Mortgage Association 4.21 25/11/2036 7,129 0.01
326,066 Federal National* Mortgage Association 4.17 25/12/2036 28,969 0.02
81,966 Federal National* Mortgage Association 4.17 25/05/2034 7,813 0.01
1,215,376 Federal National* Mortgage Association 4.14 25/11/2036 113,950 0.09
346,372 Federal National* Mortgage Association 3.97 25/08/2036 30,940 0.02
615,031 Federal National*Mortgage Association 3.74 25/03/2038 44,033 0.04
400,133 Federal Home Loan Mortgage Corporation 4.73 15/08/2036 34,762 0.03
357,464 Federal Home Loan Mortgage Corporation 4.20 15/10/2037 27,354 0.02
146,961 Federal Home Loan Mortgage Corporation 4.18 15/09/2035 12,803 0.01
129,670 Federal Home Loan Mortgage Corporation 4.10 15/05/2036 11,382 0.01
89,716 Federal Home Loan Mortgage Corporation 3.94 15/05/2037 8,439 0.01
526,595 Federal Home Loan Mortgage Corporation 3.93 15/10/2037 40,599 0.03
55,296 Federal Home Loan Mortgage Corporation 0.00 15/03/2036 52,938 0.04
Putnam Total Return Fund
THE ACCOMPANYING NOTES ARE AN INTEGRAL PART OF THESE FINANCIAL STATEMENTS.
PrincipalAmounts
CouponRate %
MaturityDates
ValueUSD
% ofFund
PrincipalAmounts
CouponRate %
MaturityDates
ValueUSD
% ofFund
PrincipalAmounts
CouponRate %
MaturityDates
ValueUSD
% ofFund
PrincipalAmounts
CouponRate %
MaturityDates
ValueUSD
% ofFund
Number of Shares
ValueUSD
% ofFund
NON-U.S. EQUITIES (Continued) COLLATERALISED MORTGAGE OBLIGATIONS (Continued)
PrincipalAmounts
CouponRate %
MaturityDates
ValueUSD
% ofFund

100
$646,394 Government National Mortgage Association 5.30 20/03/2038 $61,458 0.05
209,407 Government National Mortgage Association 4.90 20/11/2036 16,263 0.01
103,069 Government National Mortgage Association 4.73 16/04/2034 6,624 0.00
92,273 Government National Mortgage Association 4.63 16/08/2036 9,110 0.01
197,000 Government National Mortgage Association 4.43 16/10/2035 15,690 0.01
392,757 Government National Mortgage Association 4.32 20/03/2037 32,163 0.03
275,514 Government National Mortgage Association 4.32 20/11/2035 22,848 0.02
157,543 Government National Mortgage Association 4.27 20/07/2037 11,685 0.01
193,649 Government National Mortgage Association 4.25 20/09/2037 17,997 0.01
121,582 Government National Mortgage Association 4.22 20/04/2032 7,409 0.01
142,864 Government National Mortgage Association 4.10 16/05/2037 10,536 0.01
344,697 Government National Mortgage Association 4.03 16/01/2038 24,749 0.02
747,661 Government National Mortgage Association 4.02 20/06/2036 59,033 0.05
218,406 Government National Mortgage Association 4.00 20/02/2038 17,427 0.01
920,873 Government National Mortgage Association 3.99 20/06/2037 66,076 0.05
2,318,942 Government National Mortgage Association(Class SG) 3.99 20/06/2037 165,225 0.13
612,868 Government National Mortgage Association 3.93 16/05/2038 44,093 0.04
358,154 Government National Mortgage Association 3.89 16/09/2035 25,648 0.02
261,589 Government National Mortgage Association 3.81 20/03/2036 18,849 0.01
116,706 Government National Mortgage Association 3.77 20/01/2035 8,156 0.01
92,646 Government National Mortgage Association 3.73 16/05/2037 7,080 0.01
132,980 Government National Mortgage Association 3.70 20/02/2035 9,392 0.01
161,803 Government National Mortgage Association 3.68 16/10/2037 9,961 0.01
375,115 Government National Mortgage Association 3.62 20/01/2035 23,723 0.02
377,513 Government National Mortgage Association 3.52 20/03/2034 15,360 0.01
102,978 Government National Mortgage Association 0.00 20/06/2037 91,820 0.07
99,625 Government National Mortgage Association 0.00 20/02/2037 89,149 0.07
111,127 HSI Asset Loan Obligation 6.14 25/01/2037 91,679 0.07
32,182 IndyMac Index Mortgage Loan Trust 6.33 25/09/2036 25,681 0.02
101,710 IndyMac Index Mortgage Loan Trust 6.08 25/04/2037 80,351 0.06
101,599 IndyMac Index Mortgage 6.25 25/08/2037 80,263 0.07
28,879 IndyMac Index Mortgage Loan Trust 5.65 25/06/2037 19,364 0.02
128,635 IndyMac MBS Incorporated 5.64 25/01/2036 96,497 0.08
$84,133 IndyMac MBS Incorporated 5.46 25/05/2035 $71,546 0.06
45,199 JPMorgan Alternative Loan Trust 6.07 25/07/2036 34,808 0.03
71,317 JPMorgan Alternative Loan Trust 5.89 25/03/2036 57,054 0.05
3,925,318 JPMorgan Chase Commercial Mortgage Securities Corporation 0.65 12/02/2051 107,026 0.09
63,268 MASTER Alternative Loans Trust 6.25 25/07/2036 47,451 0.04
901,000 Permanent Master Issuer PLC 2.79 15/10/2033 867,213 0.71
88,884 Residential Asset Securitization Trust 6.00 25/05/2037 79,551 0.06
34,821 Structured Adjustable Rate Mortgage Loan Trust 5.69 25/10/2036 27,345 0.02
529,000 Wachovia Bank Commercial Mortgage Trust 5.25 15/12/2043 516,529 0.42
Total Collateralised Mortgage Obligations $5,188,351 4.23
CORPORATE BONDS (3.57%)
$45,000 Arrow Electronics Incorporated 9.15 01/10/2010 $48,426 0.04
5,000 Associated Materials Incorporated 9.75 15/04/2012 4,950 0.00
60,000 AT&T Incorporated 5.60 15/05/2018 58,616 0.05
20,000 BankAmerica Capital III 3.28 15/01/2027 15,802 0.01
10,000 Berry Plastics Corporation 7.57 15/02/2015 9,575 0.01
85,000 Cadbury Schweppes US Finance LLC 5.13 01/10/2013 81,346 0.07
10,000 Capital One Financial Corporation 2.98 10/09/2009 9,334 0.01
15,000 Cardinal Health Incorporated 5.65 15/06/2012 15,122 0.01
125,000 Cardinal Health Incorporated 5.50 15/06/2013 124,404 0.10
25,000 CCH II LLC 10.25 15/09/2010 24,125 0.02
10,000 Cenevo Corporation 10.50 15/08/2016 9,900 0.01
110,000 CNA Financial Corporation 6.50 15/08/2016 106,026 0.09
15,000 CNA Financial Corporation 6.00 15/08/2011 15,066 0.01
25,000 Countrywide Financial Corporation 2.87 05/01/2009 24,511 0.02
75,000 Cox Communications Incorporated 4.63 15/01/2010 74,586 0.06
10,000 Cricket Communications Incorporated 10.00 15/07/2015 9,800 0.01
10,000 D.R. Horton Incorporated 8.00 01/02/2009 9,975 0.01
13,000 D.R. Horton Incorporated 5.00 15/01/2009 12,756 0.01
45,000 Darden Restaurants Incorporated 6.20 15/10/2017 41,755 0.03
27,000 DirecTV Holdings LLC 6.38 15/06/2015 25,313 0.02
30,000 Electronic Data Systems Corporation 6.50 01/08/2013 30,778 0.03
Putnam Total Return Fund
THE ACCOMPANYING NOTES ARE AN INTEGRAL PART OF THESE FINANCIAL STATEMENTS.
PrincipalAmounts
CouponRate %
MaturityDates
ValueUSD
% ofFund
COLLATERALISED MORTGAGE OBLIGATIONS (Continued) COLLATERALISED MORTGAGE OBLIGATIONS (Continued)
PrincipalAmounts
CouponRate %
MaturityDates
ValueUSD
% ofFund
PrincipalAmounts
CouponRate %
MaturityDates
ValueUSD
% ofFund

101
$35,000 Embarq Corporation 7.08 01/06/2016 $33,241 0.03
160,000 Embarq Corporation 6.74 01/06/2013 154,381 0.13
50,000 FelCor Lodging LP 8.50 01/01/2011 48,875 0.04
30,000 Fleet Capital Trust 3.76 18/12/2028 24,660 0.02
25,000 Freeport-McMoRan Copper & Gold Incorporated 8.38 01/04/2017 26,438 0.02
80,000 Genworth Financial Incorporated 6.52 22/05/2018 75,085 0.06
80,000 Hanson PLC 6.13 15/08/2016 79,374 0.06
205,000 Hartford Financial Services Group Incorporated 5.50 15/10/2016 195,576 0.16
4,000 Huntsman International LLC 7.88 15/11/2014 3,660 0.00
15,000 International Lease Finance Corporation 6.38 25/03/2013 13,838 0.01
75,000 International Lease Finance Corporation 5.63 20/09/2013 66,376 0.05
10,000 International PaperCompany 7.40 15/06/2014 10,004 0.01
25,000 International Paper Company 7.95 15/06/2018 24,861 0.02
15,000 Iron Mountain Incorporated 8.00 15/06/2020 14,756 0.01
5,000 iStar Financial Incorporated 4.88 15/01/2009 4,800 0.00
55,000 Liberty Media LLC 7.88 15/07/2009 55,535 0.05
105,000 Limited Brands Incorporated 6.13 01/12/2012 100,220 0.08
110,000 Marriott International Incorporated 4.63 15/06/2012 101,965 0.08
90,000 Masco Corporation 5.85 15/03/2017 81,575 0.07
125,000 Mattel Incorporated 5.63 15/03/2013 122,494 0.10
15,000 Meritor Automotive Incorporated 6.80 15/02/2009 14,756 0.01
85,000 Mohawk Industries Incorporated 6.13 15/01/2016 81,261 0.07
15,000 Motorola Incorporated 8.00 01/11/2011 15,318 0.01
10,000 Newell Rubbermaid Incorporated 5.50 15/04/2013 9,838 0.01
55,000 Nextel Communications Incorporated 6.88 31/10/2013 46,475 0.04
5,000 Nortek Incorporated 10.00 01/12/2013 4,775 0.00
5,000 Nortel Networks Limited 10.75 15/07/2016 4,950 0.00
35,000 ONEOK Partners LP 6.15 01/10/2016 34,490 0.03
125,000 Owens-Illinois Incorporated 7.50 15/05/2010 127,188 0.10
135,000 Packaging Corporation of America 5.75 01/08/2013 131,897 0.11
45,000 Pitney Bowes Incorporated 5.60 15/03/2018 44,236 0.04
29,000 PNM Resources Incorporated 9.25 15/05/2015 29,943 0.02
70,000 PPG Industries Incorporated 6.65 15/03/2018 71,137 0.06
45,000 Prudential Financial Incorporated 8.88 15/06/2038 44,543 0.04
255,000 Reynolds American Incorporated 7.25 01/06/2013 263,601 0.22
95,000 Rhodia SA 7.50 15/10/2013 132,410 0.11
125,000 Ryder System Incorporated 6.00 01/03/2013 125,137 0.10
$15,000 SandRidge Energy Incorporated 8.00 01/06/2018 $15,075 0.01
12,000 Sanmina Corporation 6.75 01/03/2013 10,770 0.01
21,000 Sanmina Corporation 8.13 01/03/2016 18,900 0.01
25,000 Sara Lee Corporation 3.88 15/06/2013 23,119 0.02
25,000 SLM Corporation 4.50 26/07/2010 23,133 0.02
125,000 Spectra Energy Capital LLC 5.67 15/08/2014 122,121 0.10
260,000 Starwood Hotels & Resorts Worldwide Incorporated 7.88 01/05/2012 264,563 0.22
10,000 State Street Capital Trust 3.78 15/06/2037 7,677 0.01
195,000 Supervalu Incorporated 7.88 01/08/2009 197,925 0.16
10,000 Tenet Healthcare Corporation 6.38 01/12/2011 9,575 0.01
40,000 Toll Brothers Incorporated 8.25 01/02/2011 38,800 0.03
90,000 Tyson Foods Incorporated 8.25 01/10/2011 90,522 0.07
10,000 Unisys Corporation 12.50 15/01/2016 10,000 0.01
2,000 United Rentals NA Incorporated 6.50 15/02/2012 1,800 0.00
50,000 Viacom Incorporated 5.63 15/08/2012 49,608 0.04
65,000 Viacom Incorporated 6.63 15/05/2011 66,560 0.05
245,000 Xerox Corporation 5.50 15/05/2012 242,168 0.20
10,000 Yum! Brands Incorporated 6.25 15/03/2018 9,751 0.01
Total Corporate Bonds $4,373,902 3.57
ASSET-BACKED SECURITIES (2.33%)
$24,518 Ace Securities Corporation 144A 6.50 15/08/2030 $21,514 0.02
37,000 BankAmerica Manufactured Housing Contract Trust Ser. 97-2, Class M 6.90 10/04/2028 46,690 0.04
157,447 Bombardier Capital Mortgage Securitization Corporation 8.29 15/06/2030 102,262 0.08
36,518 Bombardier Capital Mortgage Securitization Corporation 7.58 15/06/2030 21,480 0.02
65,757 Green Tree Financial Corporation 8.60 15/07/2019 41,328 0.03
9,422 Green Tree Financial Corporation 6.85 15/10/2018 8,477 0.01
124,042 Greenpoint Manufactured Housing 8.45 20/06/2031 105,436 0.08
22,000 Oakwood Mortgage Investors Incorporated 6.83 15/05/2028 16,427 0.01
2,500,000 Victory Receivables Corporation 0.00 11/07/2008 2,498,021 2.04
Total Asset-Backed Securities $2,861,635 2.33
Putnam Total Return Fund
THE ACCOMPANYING NOTES ARE AN INTEGRAL PART OF THESE FINANCIAL STATEMENTS.
CORPORATE BONDS (Continued) CORPORATE BONDS (Continued)
PrincipalAmounts
CouponRate %
MaturityDates
ValueUSD
% ofFund
PrincipalAmounts
CouponRate %
MaturityDates
ValueUSD
% ofFund
PrincipalAmounts
CouponRate %
MaturityDates
ValueUSD
% ofFund

102
Putnam Total Return Fund
THE ACCOMPANYING NOTES ARE AN INTEGRAL PART OF THESE FINANCIAL STATEMENTS.
$6,384,000 U.S. Treasury Bill# 0.00 18/09/2008 $6,364,669 5.19
Total U.S. Government & Agency Obligations $6,364,669 5.19
CONVERTIBLE PREFERRED STOCKS (0.02%)
23 Lehman Brothers* Holdings Incorporated 7.25 01/04/2013 $18,502 0.02
Total Convertible Preferred Stocks $18,502 0.02
MUTUAL FUNDS (4.69%)
$5,750,000 U.S. Liquid Assets Fund 20.06 31/12/2049 $5,750,000 4.69
Total Mutual Funds $5,750,000 4.69
REPURCHASE AGREEMENTS (14.61%)
$17,904,000 Repurchase Agreement– Bank of America 2.25 01/07/2008 $17,904,000 14.61
Total Repurchase Agreements $17,904,000 14.61
Total Value of Investments $137,347,453 112.06
TBA SALE COMMITMENTS OUTSTANDING (-6.43%)
$8,000,000 Federal National*Mortgage Association 5.00 01/07/2038 $(7,882,500) (6.43)
Total TBA Sale Commitments $(7,882,500) (6.43)
WRITTEN OPTIONS OUTSTANDING (-0.02%)
Option on an interest rate swap with Lehman Brothers* Special Financing, Inc.for the obligation to receive a fixed rate of 4.54% versus the three month USD-LIBOR-BBA maturing on 17 March 2009. Mar-09/4.545 350,000 $(15,743) (0.01)
Option on an interest rate swap with Lehman Brothers* Special Financing, Inc.for the obligation to pay a fixed rate of 4.54% versus the three month USD-LIBOR-BBA maturing on 17 March 2009. Mar-09/4.545 350,000 (7,045) (0.01)
Total Written Options Outstanding $(22,788) (0.02)
* Please refer to note 12 Subsequent events for more detail.
# At 30 June 2008, securities in part or in entirety have been designated as collateralfor open futures contracts.
U.S. GOVERNMENT & AGENCY OBLIGATIONS (5.19%)
Numberof Shares
CouponRate %
MaturityDate
ValueUSD
% ofFund
PrincipalAmount
CouponRate %
MaturityDate
ValueUSD
% ofFund
Expiration date/strike price
Contractvalue USD
ValueUSD
% ofFund
PrincipalAmount
CouponRate %
MaturityDate
ValueUSD
% ofFund
PrincipalAmount
CouponRate %
MaturityDate
ValueUSD
% ofFund
PrincipalAmount
CouponRate %
MaturityDate
ValueUSD
% ofFund

THE ACCOMPANYING NOTES ARE AN INTEGRAL PART OF THESE FINANCIAL STATEMENTS.
103
Putnam Total Return Fund
INTEREST RATE SWAP CONTRACTS OUTSTANDING (0.61%)
Bank of America, N.A.$2,700,000 21/05/2018 4.3975% 3 month USD-LIBOR-BBA $58,509 0.05
1,426,000 23/05/2010 3 month USD-LIBOR-BBA 3.155% (8,898) (0.01)287,000 15/05/2018 4.48% 3 month USD-LIBOR-BBA 4,319 —
Citibank, N.A.3,400,000 04/06/2038 6 month JPY-LIBOR-BBA 2.625% 846 —
Credit Suisse International210,000 13/03/2018 6 month CHF-LIBOR-BBA 3.3175% (7,669) (0.01)930,000 15/03/2010 2.59% 6 month CHF-LIBOR-BBA 11,015 0.01930,000 15/03/2010 2.6625% 6 month CHF-LIBOR-BBA 9,931 0.01210,000 14/03/2018 6 month CHF-LIBOR-BBA 3.3% (7,960) (0.01)
Deutsche Bank AG556,000 26/06/2010 6 month GBP-LIBOR-BBA 6.180% (1,086) —240,000 26/04/2038 6 month EUR-EURIBOR-Reuters 5.065% 4,955 —
1,920,000 30/04/2012 6 month EUR-EURIBOR-Reuters 4.31% (40,713) (0.03)1,650,000 30/04/2015 4.475% 6 month EUR-EURIBOR-Reuters 47,985 0.04
460,000 30/04/2020 6 month EUR-EURIBOR-Reuters 4.7975% (11,174) (0.01)
Goldman Sachs International5,110,000 10/06/2013 4.139% 3 month USD-LIBOR-BBA 25,448 0.024,100,000 12/06/2018 3 month USD-LIBOR-BBA 4.84% 53,669 0.04
22,500,000 12/06/2013 4.497% 3 month USD-LIBOR-BBA (242,325) (0.20)1,070,000 26/03/2010 6 month EUR-EURIBOR-Reuters 4.129% (32,173) (0.03)
548,000 27/03/2018 4.125% 3 month USD-LIBOR-BBA 23,219 0.02890,000 29/03/2010 6 month GBP-LIBOR-BBA 5.25% (27,804) (0.02)220,000 27/03/2018 5.0675% 6 month GBP-LIBOR-BBA 19,350 0.02192,000 02/04/2018 4.076% 3 month USD-LIBOR-BBA 8,907 0.01
1,420,000 05/04/2010 2.89% 6 month CHF-LIBOR-BBA 11,950 0.01320,000 03/04/2018 6 month CHF-LIBOR-BBA 3.42% (9,248) (0.01)540,000 08/04/2010 3 month USD-LIBOR-BBA 2.64% (7,528) (0.01)450,000 01/04/2010 2.9% 6 month CHF-LIBOR-BBA 3,646 —100,000 02/04/2018 6 month CHF-LIBOR-BBA 3.44% (2,730) —306,000 23/04/2018 4.43% 3 month USD-LIBOR-BBA 5,786 —
99,000 19/05/2018 4.525% 3 month USD-LIBOR-BBA 1,148 —1,326,000 30/05/2028 5.014% 3 month USD-LIBOR-BBA (14,666) (0.01)
486,000 11/04/2012 3.1825% 3 month USD-LIBOR-BBA 15,275 0.01162,600,000 07/05/2010 6 month JPY-LIBOR-BBA 1.09125% (2,346) —
35,770,000 07/05/2018 2.205% 6 month JPY-LIBOR-BBA 634 —1,870,000 18/06/2017 3 month USD-LIBOR-BBA 5.809% 164,018 0.134,000,000 16/11/2017 3 month USD-LIBOR-BBA 4.9875% 105,040 0.091,160,000 10/04/2017 3 month USD-LIBOR-BBA 5.186% 48,859 0.041,390,000 10/04/2012 3 month USD-LIBOR-BBA 5.008% 44,925 0.04
JPMorgan Chase Bank, N.A.3,300,000 20/03/2018 3 month USD-LIBOR-BBA 4.087% (149,193) (0.12)6,300,000 20/03/2013 3 month USD-LIBOR-BBA 3.228% (268,632) (0.22)
727,000 16/05/2018 4.53% 3 month USD-LIBOR-BBA 8,099 0.013,500,000 21/05/2010 3.175% 3 month USD-LIBOR-BBA 20,510 0.024,000,000 30/01/2018 3 month USD-LIBOR-BBA 4.190% (145,160) (0.12)8,000,000 30/01/2013 3.50% 3 month USD-LIBOR-BBA 239,200 0.201,104,000 26/03/2010 3 month USD-LIBOR-BBA 2.33375% (20,501) (0.02)1,042,000 07/05/2013 3.9325% 3 month USD-LIBOR-BBA 14,098 0.014,000,000 28/09/2011 3 month USD-LIBOR-BBA 5.034% 128,640 0.102,376,000 23/05/2010 3 month USD-LIBOR-BBA 3.16% (14,589) (0.01)
Lehman Brothers Special Financing, Inc.*430,000 11/06/2038 4.52% 6 month EUR-EURIBOR-Reuters 19,036 0.02650,000 11/06/2038 3 month USD-LIBOR-BBA 5.54% 12,623 0.01395,000 12/06/2038 4.7625% 6 month EUR-EURIBOR-Reuters 5,972 —595,000 12/06/2038 3 month USD-LIBOR-BBA 5.4175% 5,980 —594,000 12/06/2018 4.7225% 6 month EUR-EURIBOR-Reuters 7,035 0.01881,000 12/06/2018 3 month USD-LIBOR-BBA 5.1575% (1,542) —
1,000,000 26/06/2013 3 month USD-LIBOR-BBA 4.465% 9,190 0.01965,000 20/05/2013 3.85% 3 month USD-LIBOR-BBA 16,714 0.01
3,000,000 09/05/2018 3 month USD-LIBOR-BBA 4.470% (47,520) (0.04)2,950,000 16/05/2012 3 month USD-LIBOR-BBA 5.088% 104,548 0.093,971,000 07/03/2018 4.34% 3 month USD-LIBOR-BBA 98,878 0.082,849,000 20/03/2013 3 month USD-LIBOR-BBA 3.13666% (132,592) (0.11)2,300,000 26/03/2010 3 month USD-LIBOR-BBA 2.3525% (41,998) (0.03)2,300,000 26/03/2010 3 month USD-LIBOR-BBA 2.395% (40,365) (0.03)
205,000 26/03/2038 5.05% 3 month USD-LIBOR-BBA 3,801 —410,000 22/03/2038 5.29% 3 month USD-LIBOR-BBA (12) —270,000 22/03/2038 6 month EUR-EURIBOR-Reuters 4.864% (1,123) —720,000 22/03/2010 6 month GBP-LIBOR-BBA 5.075% (26,333) (0.02)200,000 20/03/2018 4.99% 6 month GBP-LIBOR-BBA 19,859 0.02180,000 29/03/2038 6 month EUR-EURIBOR-Reuters 4.9625% 1,460 —
1,930,000 12/04/2012 6 month EUR-EURIBOR-Reuters 4.10% (52,236) (0.04)1,650,000 13/04/2015 4.31% 6 month EUR-EURIBOR-Reuters 65,403 0.05
460,000 13/04/2020 6 month EUR-EURIBOR-Reuters 4.6575% (18,370) (0.01)9,822,000 30/05/2010 3 month USD-LIBOR-BBA 3.4275% (13,260) (0.01)
360,000 26/04/2038 5.3325% 3 month USD-LIBOR-BBA (1,235) —4,970,000 16/05/2017 3 month USD-LIBOR-BBA 5.2315% 225,887 0.18
Swap counterparty
Notional Amount
TerminationDate
Payments made by Fund
per annum
Fixed paymentsreceived by Fund
per annum
Unrealised Appreciation/
(Depreciation)USD
% ofFund

104
Putnam Total Return Fund
THE ACCOMPANYING NOTES ARE AN INTEGRAL PART OF THESE FINANCIAL STATEMENTS.
INTEREST RATE SWAP CONTRACTS OUTSTANDING (Continued)
$1,230,000 16/05/2012 5.088% 3 month USD-LIBOR-BBA $(43,591) (0.04)594,000 03/06/2018 6 month EUR-EURIBOR-Reuters 4.912% (973) —881,000 03/06/2018 5.28% 3 month USD-LIBOR-BBA (2,343) —
6,358,000 03/06/2010 3 month USD-LIBOR-BBA 3.41% (12,398) (0.01)977,000 03/06/2038 5.0975% 3 month USD-LIBOR-BBA (18,934) (0.02)900,000 19/06/2012 3 month USD-LIBOR-BBA 5.619% 49,311 0.04
6,000,000 05/07/2016 3 month USD-LIBOR-BBA 5.73% 476,700 0.391,000,000 28/09/2016 3 month USD-LIBOR-BBA 5.12375% 37,980 0.03
250,000 06/02/2012 3 month USD-LIBOR-BBA 5.235% 9,880 0.011,600,000 06/02/2017 3 month USD-LIBOR-BBA 5.324% 83,040 0.07
500,000 06/02/2012 3 month USD-LIBOR-BBA 5.2385% 19,820 0.021,500,000 13/02/2012 3 month USD-LIBOR-BBA 5.204% 58,005 0.051,500,000 13/02/2017 5.3015% 3 month USD-LIBOR-BBA (75,630) (0.06)2,200,000 23/11/2017 4.87% 3 month USD-LIBOR-BBA (38,258) (0.03)
135,000 26/03/2038 6 month EUR-EURIBOR-Reuters 4.74% (2,581) —2,300,000 26/03/2010 3 month USD-LIBOR-BBA 2.325% (43,056) (0.04)1,070,000 29/03/2010 6 month EUR-EURIBOR-Reuters 4.25% (29,415) (0.02)
270,000 29/03/2038 5.31% 3 month USD-LIBOR-BBA (440) —
Merrill Lynch International623,000 07/05/2038 4.8775% 3 month USD-LIBOR-BBA 9,426 0.01
Morgan Stanley Capital Services, Inc.350,000 28/03/2018 5.065% 6 month GBP-LIBOR-BBA 30,916 0.02
1,420,000 29/03/2010 6 month GBP-LIBOR-BBA 5.21% (46,199) (0.04)
Net Unrealised Appreciation on Interest Rate Swap Contracts ` $746,646 0.61
* Please refer to note 12 Subsequent events for more detail.
Swap counterparty
Notional Amount
TerminationDate
Payments made by Fund
per annum
Fixed paymentsreceived by Fund
per annum
Unrealised Appreciation/
(Depreciation)USD
% ofFund
CREDIT DEFAULT CONTRACTS OUTSTANDING (-0.29%)
Bank of America, N.A.DJ ABX NA HE AAA Index $23,664 (F) 25/07/2045 18 bp $809 —DJ CDX NA HY Series 10 5,000,000 20/06/2013 500 bp (2,100) —DJ CDX NA HY Series 10 1,900,000 20/06/2013 500 bp (62,548) (0.05)DJ CDX NA HY Series 9 2,970,000 20/12/2012 375 bp 92,783 0.08Embarq Corp., 7.082%, 6/1/16 (35,000) 20/06/2016 (265 bp) (492) —Limited Brands, Inc., 6 1/8%, 12/1/12 (30,000) 20/12/2012 (252 bp) 236 — Marriott International, 4 5/8%, 6/15/12 (20,000) 20/06/2012 (139 bp) 644 — Mattel, Inc., 7 1/4%, 7/9/12 (125,000) 20/03/2013 (157.2 bp) (4,558) —Oneok Partners, 7.1%, 3/15/11 (35,000) 20/12/2016 (102 bp) 152 — Ryder System Inc., 6.95%, 12/1/25 (125,000) 20/03/2013 (135 bp) (1,639) —Spectra Energy Capital, 6 1/4%, 2/15/13 (125,000) 20/09/2014 (115 bp) (1,651) —
Citibank, N.A.Countrywide Financial Corp., USLibor+14, 1/5/09 (25,000) 20/03/2009 (875 bp) (866) —DJ ABX NA HE AAA Index 45,356 25/07/2045 18 bp 1,076 —DJ ABX NA HE AAA Index 78,880 25/07/2045 18 bp 45 —DJ ABX NA HE AAA Index 78,880 25/07/2045 18 bp (154) —DJ CDX EM Series 9 30,000 20/06/2013 265 bp (328) — Electronic Data Systems Corp., 6.5%, 8/1/13 (5,000) 20/09/2013 (155 bp) (220) —Hanson Plc, 7 7/8%, 9/27/10 (15,000) 20/09/2016 (71 bp) (54) —Hartford Financial Services Group, 4 3/4%, 3/1/14 (185,000) 20/12/2016 (75 bp) 5,870 — International Lease Finance Corp., 4.15%, 1/20/15 (15,000) 20/06/2013 (222.50 bp) 502 — International Lease Finance Corp., 4.15%, 1/20/15 (75,000) 20/09/2013 (105 bp) 5,937 — Limited Brands, Inc., 6 1/8%, 12/1/12 (60,000) 20/12/2012 (275 bp) (43) —Limited Brands, Inc., 6 1/8%, 12/1/12 (10,000) 20/06/2011 (250 bp) (4) —Masco Corp., 5 7/8%, 7/15/12 (90,000) 20/03/2017 (213 bp) 1,897 — Mohawk Industries, Inc., 7.2%, 4/15/12 (85,000) 20/03/2016 (140 bp) 1,424 — Newell Rubbermaid, Inc., 6.35%, 7/15/28 (10,000) 20/06/2013 (85 bp) (41) —Sanmina-Sci Corp., 8 1/8%, 3/1/16 15,000 20/06/2013 585 bp (578) —Seat Pagine Gialle S.P.A., 8%, 4/30/14 10,000 20/03/2017 815 bp (103) —
Credit Suisse InternationalArrow Electronics, Inc., 6 7/8%, 6/1/18 (45,000) 01/10/2010 (54.2 bp) (13) —Bundesrepublic of Deutschland, 6%, 6/20/16 583,000 20/09/2018 9 bp — — DJ ABX NA HE AAA Index 98,601 25/07/2045 18 bp 6,901 0.01DJ ABX NA HE AAA Index 187,341 25/07/2045 18 bp 7,415 0.01DJ ABX NA HE AAA Index 187,341 25/07/2045 18 bp 5,516 —DJ CMB NA CMBX AAA Index 950,000 (F) 13/12/2049 8 bp 80,288 0.07DJ CMB NA CMBX AAA Index 486,000 (F) 17/02/2051 35 bp 43,373 0.04Republic of Italy, 6 7/8%, 9/27/23 (583,000) 20/09/2018 (48.75 bp) 227 — Xerox Corp., 6 7/8%, 8/15/11 (245,000) 20/06/2012 (86.5 bp) 2,573 —
Swap counterparty/Referenced debt*
Notional Amount
TerminationDate
Fixed payments received (paid)
by Fund per annum
Unrealised Appreciation/
(Depreciation)USD
% ofFund

105
Putnam Total Return Fund
Deutsche Bank AGCBS Corp, 4 5/8%, 5/15/18 $(65,000) 20/06/2011 (102 bp) $331 — CBS Corp., 4 5/8%, 5/15/18 (50,000) 20/09/2012 (87 bp) 913 — CNA Financial Corp., 5.85%, 12/15/14 (110,000) 20/09/2016 (155 bp) (1,143) — DJ ABX NA HE AAA Index 20,706 25/07/2045 18 bp 383 — DJ ABX NA HE AAA Index 49,300 25/07/2045 18 bp (456) — DJ CDX NA EM Series 8 1,400,000 20/12/2012 175 bp 7,112 0.01DJ CDX NA EM Series 8 Index 3,800,000 20/12/2012 175 bp (91,048) (0.07)DJ CDX NA IG Series 10 Index (15,000) 20/06/2013 (155 bp) 204 — DJ iTraxx Europe Series 8 Version 1 (10,000) 20/12/2012 (375 bp) (269) — General Electric Capital Corp., 6%, 6/15/12 15,000 20/09/2013 109 bp (372) — Genworth Financial Inc., 5 3/4%, 6/15/14 (80,000) 20/06/2018 (143 bp) 6,545 0.01 Grohe Holding GmbH, 8 5/8%, 10/1/14 5,000 20/06/2009 400 bp 46 — Korea Monetary STAB Bond, 5%, 2/14/09 105,000 (F) 23/02/2009 105 bp 34 — Korea Monetary STAB Bond, 5.15%, 2/12/10 105,000 (F) 19/02/2010 115 bp 251 — Malaysian Government, 6.844%, 10/1/09 130,000 01/10/2009 90 bp 584 — Packaging Corporation of America, 5 3/4%, 8/1/13 (135,000) 20/09/2013 (129 bp) (930) — Pitney Bowes, Inc., 4 5/8%, 10/1/12 (45,000) 20/03/2018 (95 bp) (632) — PPG Industries, Inc., 7.05%, 8/15/09 (70,000) 20/03/2018 (154 bp) (3,259) — Republic of China, zero coupon, 12/5/08 175,000 (F) 12/12/2008 115 bp (3) — Reynolds American, Inc., 7 5/8%, 6/1/16 (255,000) 20/06/2013 (105 bp) 477 — Smurfit Kappa Funding, 10 1/8%, 10/1/12 15,000 20/06/2009 135 bp (21) — Unity Media GmbH, 8 3/4%, 2/15/15 20,000 20/06/2013 460 bp (942) — Virgin Media Finance PLC, 8 3/4%, 4/15/14 20,000 20/09/2013 477 bp (582) —
Goldman Sachs InternationalBonos Y Oblig Del Estado, 5 1/2%, 7/30/17 (915,000) 20/06/2018 (42 bp) 3,093 — Bundesrepublic of Deutschland, 6%, 6/20/16 915,000 20/06/2018 9.5 bp 476 — CSC Holdings, Inc., 7 5/8%, 7/15/18 40,000 20/09/2013 495 bp (155) — DJ ABX NA HE AAA Index 29,580 25/07/2045 18 bp (106) — DJ CDX NA HY Series 10 Index 420,000 20/06/2013 500 bp (176) — DJ CDX NA HY Series 10 Index 10,230,000 20/06/2013 500 bp (247,259) (0.21)DJ CDX NA HY Series 9 Index (600,000) 20/12/2017 (80 bp) (6,545) (0.01)DJ CDX NA HY Series 9 Index 811,800 20/12/2012 375 bp (3,560) — DJ CDX NA HY Series 9 Index 25-35% tranche 3,510,000 20/12/2010 417.1 bp 111,758 0.09 DJ CDX NA IG Series 10 Index 170,000 20/06/2013 155 bp (1,872) — DJ CDX NA IG Series 10 Index 650,000 20/06/2013 155 bp (7,248) — DJ CDX NA IG Series 10 Index (1,270,000) 20/06/2018 (150 bp) 32,407 0.03DJ CDX NA IG Series 10 Index 150,000 20/06/2013 155 bp (131) — Rhodia SA, Euribor+275, 10/15/13 (95,000) 20/09/2013 (387 bp) 2,253 —
JPMorgan Chase Bank, N.A.Cardinal Health Inc., 5.85%, 12/15/17 (15,000) 20/06/2012 (40 bp) 2 — Cox Communications, Inc., 6.8%, 8/1/28 (75,000) 20/03/2010 (45 bp) (56) — Darden Restaurants, Inc., 6%, 8/15/35 (45,000) 20/12/2017 (155.3 bp) 297 —DJ CDX EM Series 9 1,000,000 20/06/2013 265 bp (16,150) (0.01)DJ CDX NA EM Series 8 2,000,000 20/12/2012 175 bp (14,840) (0.01)DJ CDX NA HY Series 9 Index 2,277,000 20/12/2012 375 bp (106,757) (0.09)DJ CDX NA IG Series 10 Index 170,000 20/06/2013 155 bp 169 — iStar Financial, Inc., 6%, 12/15/10 5,000 (F) 20/03/2009 500 bp 198 — Nextel Communications, 7 3/8%, 8/1/15 (55,000) 20/09/2013 (540 bp) (2,168) — Sanmina-Sci Corp., 8 1/8%, 3/1/16 15,000 20/06/2013 595 bp (524) —
Lehman Brothers Special Financing, Inc.**Cadbury Scheppes US Finance, 5 1/8%, 10/1/13 (85,000) 20/10/2013 (70 bp) 570 — CNA Financial Corp., 5.85%, 12/15/14 (15,000) 20/09/2011 (174 bp) (292) — DJ ABX HE PEN AAA Index 10,241 (F) 25/05/2046 11 bp (778) — DJ ABX HE PEN AAA Index 10,241 (F) 25/05/2046 11 bp (765) — DJ ABX NA HE AAA Index 78,880 (F) 25/07/2045 18 bp (488) — DJ ABX NA HE AAA Index 33,524 (F) 25/07/2045 18 bp (165) — DJ CDX EM Series 7 2,000,000 20/06/2012 125 bp (84,320) (0.07)DJ CDX NA EM Series 7 Index 2,950,000 20/06/2012 125 bp (128,797) (0.11)DJ CDX NA EM Series 7 Index 750,000 20/06/2012 125 bp (35,205) (0.03)DJ CDX NA IG Series 10 Index (30,000) 20/06/2013 155 bp 350 — DJ CDX NA IG Series 10 Index 600,000 20/06/2013 (155 bp) (6,748) (0.01)DJ CMB NA CMBX AAA Index 753,000 (F) 17/02/2051 35 bp 38,317 0.03Embarq Corp., 7.082%, 6/1/16 (155,000) 20/06/2013 (237 bp) (312) (0.00)Felcor Lodging LP, 8 1/2%, 6/1/11 (25,000) 20/06/2011 (334 bp) 776 — General Electric Capital Corp., 6%, 6/15/12 30,000 20/09/2013 115 bp (664) (0.00)Hanson Plc, 7 7/8%, 9/27/10 (65,000) 20/09/2016 (140 bp) (3,255) (0.00)MediaCom LLC/ Cap Corp., 9 1/2%, 1/15/13 25,000 20/09/2013 820 bp 6 — Motorola, Inc., 6 1/2%, 9/1/25 (15,000) 20/11/2011 (335 bp) (352) (0.00)Owens-Illinois, Inc., 7.8%, 5/15/18 (75,000) 20/06/2010 (128 bp) 107 — Owens-Illinois, Inc., 7.8%, 5/15/18 (25,000) 20/06/2010 (130 bp) 26 — Owens-Illinois, Inc., 7.8%, 5/15/18 (25,000) 20/06/2010 (140 bp) (21) (0.00)Yum! Brands, Inc., 8 7/8%, 4/15/11 (10,000) 20/03/2018 (130 bp) (48) (0.00)
THE ACCOMPANYING NOTES ARE AN INTEGRAL PART OF THESE FINANCIAL STATEMENTS.
CREDIT DEFAULT CONTRACTS OUTSTANDING (Continued)
Swap counterparty/Referenced debt*
Notional Amount
TerminationDate
Fixed payments received (paid)
by Fund per annum
Unrealised Appreciation/
(Depreciation)USD
% ofFund

Swap counterparty
Notional Amount
TerminationDate
Fixed payments received (paid)
by Fund per annum
Total returnreceived by
or paid by Fund
Unrealised Appreciation/
(Depreciation)USD
% ofFund
TOTAL RETURN SWAP CONTRACTS OUTSTANDING (0.88%)
Citibank, N.A.$723 04/03/2009 $(10,649) —
13,045 04/03/2009 (203,242) 0.17
Credit Suisse International4,773 30/04/2009 (52,359) (0.04)
Goldman Sachs International880,000 (F) 26/03/2009 (2.27%) 24,677 0.02
2,000,000 26/03/2018 (2.795%) 36,600 0.03
(490,000) 30/04/2013 2.375% (22,239) (0.02)
490,000 (F) 30/04/2013 (2.41%) 28,597 0.02
(490,000) 06/05/2013 2.34% (34,780) (0.03)
490,000 06/05/2013 (2.385%) 36,740 0.03
(294,000) 09/05/2013 3.10% (33,561) (0.03)
4,100,000 12/06/2018 (3.045%) (21,279) (0.02)
1,160,000 (F) 10/04/2017 (2.76%) 30,972 0.03
JPMorgan Chase Bank, N.A.1,168 15/04/2009 (225,094) (0.22)
(1,168) 15/04/2009 278,026 0.23
14,854 02/02/2009 (157,007) (0.13)
200,000 (F) 30/01/2018 (2.66%) 6,300 0.01USA Non Revised Consumer Price Index- Urban (CPI-U)
iShares MSCI Emerging Markets Index
(3 month USD-LIBOR-BBAminus 150 bp)
A basket of common stock(3 month USD-LIBOR-BBAminus 40 bp)
A basket of common stock(3 month USD-LIBOR-BBAplus 25 bp)
USA Non Revised Consumer Price Index- Urban (CPI-U)
USA Non Revised Consumer Price Index- Urban (CPI-U)
GBP Non-revised RetailPrice Index
Eurostat Eurozone HICP excluding tobacco
French Consumer Price Index excluding tobacco
Eurostat Eurozone HICP excluding tobacco
French Consumer Price Index excluding tobacco
USA Non Revised ConsumerPrice Index- Urban (CPI-U)
Eurostat Eurozone HICP excluding tobacco
iShares MSCI Emerging Markets Index
(3 month USD-LIBOR-BBA minus x percent)
iShares MSCI Emerging Markets Index
(1 month USD-LIBOR-BBAminus 1.25 percent)
iShares MSCI Emerging Markets Index
(1 month USD-LIBOR-BBAminus 1.25 percent)
106
Putnam Total Return Fund
THE ACCOMPANYING NOTES ARE AN INTEGRAL PART OF THESE FINANCIAL STATEMENTS.
Merrill Lynch InternationalElectronic Data Systems Corp., 6%, 8/1/13 $(25,000) 20/09/2013 (100 bp) $(456) — Felcor Lodging LP, 8 1/2%, 6/1/11 (25,000) 20/06/2011 (316 bp) 893 — Liberty Media LLC., 5.7%, 5/15/13 (55,000) 20/06/2009 (203 bp) (382) — Marriott International, 4 5/8%, 6/15/12 (90,000) 20/06/2012 (119 bp) 3,529 — Sara Lee Corp., 6 1/8%, 11/1/32 (25,000) 20/06/2013 55.5 bp 96 — Supervalu, Inc., 7 1/2%, 5/15/12 (195,000) 01/08/2009 (90 bp) 626 — Tyson Foods, Inc., 6.6%, 4/1/16 (45,000) 20/12/2011 (141 bp) 1,634 — Tyson Foods, Inc., 6.6%, 4/1/16 (45,000) 20/10/2011 (152.50 bp) 1,353 —
Morgan Stanley Capital Services, Inc.Bundesrepublic of Deutschland, 6%, 6/20/16 88,000 20/06/2018 8 bp (62) — DJ CDX NA HY Series 10 Index 1,400,000 20/06/2013 500 bp (9,338) (0.01)DJ CMB NA CMBX AAA Index 274,000 (F) 17/02/2051 35 bp 15,036 0.01DJ CMB NA CMBX AAA Index 274,000 (F) 13/12/2049 8 bp 14,025 0.01Republic of Austria, 5 1/4%, 1/4/11 (88,000) 20/06/2018 (17 bp) (218) (0.00)
UBS, AGCardinal Health Inc., 5.85%, 12/15/17 (125,000) 20/06/2013 (49 bp) 216 — Starwood Hotels & Resort, 7 7/8%, 5/1/12 (260,000) 20/06/2012 (195 bp) 2,703 —
Net Unrealised Depreciation on Credit Default Contracts Outstanding $(349,798) (0.29)
* Payments related to the reference debt are made upon a credit default event.
** Please refer to note 12 Subsequent events for more detail.
(F) Is valued at fair value following procedures approved by the Manager.
CREDIT DEFAULT CONTRACTS OUTSTANDING (Continued)
Swap counterparty/Referenced debt*
Notional Amount
TerminationDate
Fixed payments received (paid)
by Fund per annum
Unrealised Appreciation/
(Depreciation)USD
% ofFund

107
THE ACCOMPANYING NOTES ARE AN INTEGRAL PART OF THESE FINANCIAL STATEMENTS.
Putnam Total Return Fund
FUTURES CONTRACTS (0.30%)
2 Sterling Interest Rate 90 Day Dec 08 Lehman Brothers* $(5,063) —
7 Sterling Interest Rate 90 Day March 09 Lehman Brothers* (20,537) (0.02)
2 Sterling Interest Rate 90 Day March 09 Lehman Brothers* (5,848) —
7 Sterling Interest Rate 90 Day Sept 09 Lehman Brothers* (18,719) (0.02)
5 Amsterdam Index July 08 Merrill Lynch (51,365) (0.04)
61 Australian Government Bond 10yr. Sept 08 Lehman Brothers* 129,112 0.10
19 Australian Government Bond 3yr. Sept 08 Lehman Brothers* 14,425 0.01
11 CAC 40 Euro Index July 08 Merrill Lynch (38,849) (0.03)
(27) Canadian Government Bond 10yr. Sept 08 Lehman Brothers* 18,458 0.02
(12) DAX Index Sept 08 Merrill Lynch 155,632 0.13
(181) Dow Jones Euro Stoxx 50 Index Sept 08 Goldman Sachs & Co 622,097 0.51
6 Euro-Bobl Sept 08 Lehman Brothers* (14,507) (0.01)
80 Euro-Bund Sept 08 Lehman Brothers* (189,364) (0.15)
(19) Euro-Bund Sept 08 Lehman Brothers* 58,295 0.05
3 Euro-Buxl 30yr, Bond Sept 08 Lehman Brothers* (3,128) —
19 Euro-Schatz Sept 08 Lehman Brothers* (18,143) (0.01)
97 FTSE 100 Index Sept 08 JP Morgan Securities Inc. (331,996) (0.27)
(14) FTSE 100 Index Sept 08 JP Morgan Securities Inc. 50,320 0.04
(9) Goldman Sachs Index July 08 Goldman Sachs & Co (68,409) (0.06)
36 Hang Seng Index July 08 Merrill Lynch (144,428) (0.12)
1,000 Japanese Government Bond 10yr. Mini Sept 08 Lehman Brothers* 8,064 0.01
(800) Japanese Government Bond 10yr. Mini Sept 08 Lehman Brothers* (7,350) (0.01)
300 Japanese Government Bond 10yr. Sept 08 Lehman Brothers* 29,321 0.02
1 U.K. Gilt Long Bond Sept 08 Lehman Brothers* (4,009) —
(9) U.K. Gilt Long Bond Sept 08 Lehman Brothers* 35,674 0.03
(62) MSCI EAFE E-Mini Sept 08 Citigroup Global Markets 221,096 0.18
(1) MSCI SING Index July 08 Citigroup Global Markets 1,070 —
(127) OMXS 30 Index July 08 Merrill Lynch 174,563 0.14
2 Russell 2000 Index Mini Sept 08 Citigroup Global Markets (7,694) (0.01)
(349) Russell 2000 Index Mini Sept 08 Citigroup Global Markets 1,350,225 1.10
1 S&P / MIB Index Sept 08 Merrill Lynch (9,563) (0.01)
Number of ContractsLong/(Short) Counterparty
Unrealised Appreciation/
(Depreciation)USD
% ofFund
Lehman Brothers Special Financing, Inc.*
$4,970,000 (F) 16/05/2017 2.72125% $127,232 0.10
5,000,000 09/05/2018 (2.805%) 78,750 0.06
1,870,000 18/06/2017 (2.88%) 22,328 0.02
6,000,000 (F) 05/07/2016 3.06% 6,000 —
1,100,000 06/02/2017 (2.72%) 46,717 0.04
700,000 (F) 16/11/2017 (2.89%) 12,250 0.01
87,629 01/02/2009 1,098,193 0.90
Net Unrealised Appreciation on Total Return Swap Contracts Outstanding $1,073,172 0.88
* Please refer to note 12 Subsequent events for more detail.
(F) Is valued at fair value following procedures approved by the Manager.
Lehman Brothers Commodity*Total Return Index Value
(US Treasury H15 Treasury Bill3 Month Auction Investment
Rate plus 25 bp)
US Consumer Price Index -Urban Consumers NSA
USA Non Revised Consumer Price Index- Urban (CPI-U)
USA Non Revised ConsumerPrice Index- Urban (CPI-U)
USA Non Revised ConsumerPrice Index- Urban (CPI-U)
USA Non Revised ConsumerPrice Index- Urban (CPI-U)
USA Non Revised ConsumerPrice Index- Urban (CPI-U)
TOTAL RETURN SWAP CONTRACTS OUTSTANDING (Continued)
Swap counterparty
Notional Amount
TerminationDate
Fixed payments received (paid)
by Fund per annum
Total returnreceived
by or paid by Fund
Unrealised Appreciation
USD% of
Fund

108
Putnam Total Return Fund
THE ACCOMPANYING NOTES ARE AN INTEGRAL PART OF THESE FINANCIAL STATEMENTS.
46 S&P 500 Index E-Mini Sept 08 Citigroup Global Markets $(167,712) (0.14)
(58) S&P 500 Index E-Mini Sept 08 Citigroup Global Markets 164,894 0.13
4 S&P Mid 400 E-Mini Sept 08 Deutsche Bank Securities (13,328) (0.01)
(34) S&P Mid 400 E-Mini Sept 08 Deutsche Bank Securities 113,152 0.09
4 S&P TSE 60 Index Sept 08 Goldman Sachs & Co (14,832) (0.01)
(18) SPI 200 Sept 08 Goldman Sachs & Co 78,001 0.06
(40) Tokyo Price Index Sept 08 Merrill Lynch 314,691 0.27
60 U.S. Government Long Bond Sept 08 Lehman Brothers* 62,103 0.05
(71) U.S. Treasury Note 10yr. Sept 08 Lehman Brothers* (11,016) (0.01)
75 U.S. Treasury Note 2yr. Sept 08 Lehman Brothers* 29,859 0.02
(147) U.S. Treasury Note 2yr. Sept 08 Lehman Brothers* (87,839) (0.07)
(34) U.S. Treasury Note 5yr. Sept 08 Lehman Brothers* 7,218 0.01
94 U.S. Treasury Note 10yr. Sept 08 Lehman Brothers* 101,229 0.08
Net Unrealised Appreciation on Futures Contracts $2,505,800 2.05
Variation margin settlement to date $2,133,339 1.74
Cumulate unrealised less variation margin settlement to date $372,461 0.30
* Please refer to note 12 Subsequent events for more detail.
FUTURES CONTRACTS (Continued)
Number of ContractsLong/(Short) Counterparty
Unrealised Appreciation/
(Depreciation)USD
% ofFund

109
Putnam Total Return Fund
THE ACCOMPANYING NOTES ARE AN INTEGRAL PART OF THESE FINANCIAL STATEMENTS.
FORWARD FOREIGN EXCHANGE CURRENCY CONTRACTS (1.09%)
17/09/2008 TRY 146,200 USD 112,992 ABN AMRO Bank $(2,782) —
17/09/2008 USD 68,973 PLN 152,300 ABN AMRO Bank 2,155 —
17/09/2008 HUF 14,942,300 USD 94,362 ABN AMRO Bank (4,522) —
17/09/2008 USD 2,548 CZK 39,500 ABN AMRO Bank 52 —
17/09/2008 USD 407,355 NOK 2,115,800 Bank of America Securities 5,378 —
17/09/2008 CHF 1,014,900 USD 969,915 Bank of America Securities (26,103) (0.02)
17/09/2008 SEK 8,194,400 USD 1,351,273 Bank of America Securities (4,527) —
17/09/2008 USD 391,795 GBP 201,900 Bank of America Securities 8,231 0.01
17/09/2008 USD 1,825 CZK 29,200 Bank of America Securities 97 —
17/09/2008 EUR 340,500 USD 530,182 Bank of America Securities (3,927) —
16/07/2008 USD 956,024 AUD 1,041,700 Bank of America Securities 40,459 0.03
20/08/2008 TWD 5,288,700 USD 172,695 Bank of America Securities (2,300) —
16/07/2008 USD 138,190 BRL 240,000 Bank of America Securities 12,180 0.01
16/07/2008 USD 217,727 MXN 2,282,900 Bank of America Securities 3,193 —
17/09/2008 EUR 146,392 USD 224,800 Citibank NA (4,850) —
17/09/2008 USD 2,143,500 EUR 1,386,033 Citibank NA 30,757 0.03
20/08/2008 USD 878,927 JPY 92,778,300 Citibank NA (1,381) —
20/08/2008 JPY 75,666,700 USD 722,049 Citibank NA 6,353 0.01
20/08/2008 SGD 267,500 USD 195,553 Citibank NA (1,667) —
16/07/2008 USD 110,682 BRL 194,800 Citibank NA 10,962 0.01
16/07/2008 CAD 854,400 USD 842,169 Citibank NA 2,536 —
16/07/2008 USD 128,127 ZAR 1,008,600 Citibank NA 643 —
16/07/2008 AUD 624,100 USD 594,730 Citibank NA (2,280) —
17/09/2008 USD 1,303,616 NOK 6,720,400 Citibank NA 7,346 0.01
17/09/2008 USD 534,440 CHF 557,100 Citibank NA 12,295 0.01
17/09/2008 USD 2,103,243 GBP 1,080,300 Citibank NA 37,166 0.03
17/09/2008 PLN 238,500 USD 108,696 Citibank NA (2,689) —
17/09/2008 USD 1,358,699 EUR 884,800 Citibank NA 29,200 0.02
17/09/2008 EUR 482,600 USD 743,661 Citibank NA (13,347) (0.01)
17/09/2008 SEK 6,340,300 USD 1,047,641 Citibank NA (1,389) —
17/09/2008 SEK 3,654,000 USD 608,231 Credit Suisse First Boston 3,661 —
17/09/2008 EUR 926,600 USD 1,436,410 Credit Suisse First Boston (17,057) (0.01)
17/09/2008 USD 4,445,800 EUR 2,874,810 Credit Suisse First Boston 63,888 0.05
17/09/2008 USD 2,109,758 NOK 10,918,000 Credit Suisse First Boston 20,038 0.01
17/09/2008 NOK 270,900 USD 52,348 Credit Suisse First Boston (497) —
17/09/2008 CHF 617,100 USD 605,421 Credit Suisse First Boston (198) —
17/09/2008 USD 1,126,113 GBP 574,000 Credit Suisse First Boston 11,158 0.01
20/08/2008 USD 590,774 JPY 63,424,900 Credit Suisse First Boston 9,132 0.01
16/07/2008 USD 87,139 ZAR 688,700 Credit Suisse First Boston 788 —
17/09/2008 USD 133,666 TRY 171,200 Credit Suisse First Boston 1,905 —
16/07/2008 USD 930,087 AUD 991,600 Credit Suisse First Boston 18,470 0.01
16/07/2008 CAD 1,281,000 USD 1,257,532 Credit Suisse First Boston (1,329) —
17/09/2008 USD 52,394 SEK 317,800 Deutsche Bank, London 187 —
17/09/2008 SEK 4,325,800 USD 713,169 Deutsche Bank, London (2,553) —
17/09/2008 USD 30,298 PLN 67,000 Deutsche Bank, London 993 —
17/09/2008 USD 27,200 GBP 14,023 Deutsche Bank, London 589 —
20/08/2008 USD 133,419 MYR 425,700 Deutsche Bank, London (2,999) —
16/07/2008 USD 348,246 AUD 386,200 Deutsche Bank, London 21,190 0.02
16/07/2008 AUD 251,500 USD 226,784 Deutsche Bank, London (13,799) (0.01)
16/07/2008 USD 52,547 MXN 560,200 Deutsche Bank, London 1,665 —
SettlementDates
CurrencySold
AmountSold
CurrencyBought
AmountBought Counterparty
Unrealised Appreciation/
(Depreciation)USD
% ofFund

FORWARD FOREIGN EXCHANGE CURRENCY CONTRACTS (Continued)
110
THE ACCOMPANYING NOTES ARE AN INTEGRAL PART OF THESE FINANCIAL STATEMENTS.
Putnam Total Return Fund
16/07/2008 USD 179,427 CAD 181,900 Deutsche Bank, London (671) —
17/09/2008 USD 4,173,363 EUR 2,694,700 Deutsche Bank, London 53,549 0.04
17/09/2008 EUR 2,174,400 USD 3,367,559 Deutsche Bank, London (43,209) (0.03)
17/09/2008 USD 382,772 GBP 197,300 Goldman Sachs International 8,140 0.01
20/08/2008 USD 1,970,448 JPY 207,298,600 Goldman Sachs International (9,708) (0.01)
20/08/2008 JPY 170,397,300 USD 1,623,653 Goldman Sachs International 11,945 0.01
16/07/2008 USD 447,688 AUD 475,000 Goldman Sachs International 6,694 0.01
17/07/2008 CLP 112,835,700 USD 237,339 Goldman Sachs International 22,437 0.02
17/09/2008 EUR 2,647 USD 4,100 HSBC Bank USA (53) —
17/09/2008 USD 9,836,500 EUR 6,351,313 HSBC Bank USA 126,688 0.10
17/09/2008 USD 879,167 NOK 4,550,300 HSBC Bank USA 8,469 0.01
17/09/2008 USD 1,132,365 GBP 578,000 HSBC Bank USA 12,832 0.01
17/09/2008 SEK 3,549,300 USD 585,316 HSBC Bank USA (1,931) —
16/07/2008 USD 530,089 AUD 590,300 HSBC Bank USA 34,588 0.03
16/07/2008 AUD 327,400 USD 294,005 HSBC Bank USA (19,184) (0.02)
17/09/2008 EUR 352,000 USD 549,419 HSBC Bank USA (2,729) —
20/08/2008 TWD 3,338,700 USD 110,663 HSBC Bank USA 190 —
20/08/2008 SGD 532,000 USD 388,321 HSBC Bank USA (3,907) —
16/07/2008 USD 61,372 NZD 79,300 HSBC Bank USA (1,134) —
16/07/2008 NZD 345,400 USD 261,304 HSBC Bank USA (1,068) —
17/09/2008 SEK 6,437,900 USD 1,059,472 JP Morgan Chase Bank (5,706) (0.01)
17/09/2008 USD 587,965 NOK 3,027,900 JP Morgan Chase Bank 2,694 —
17/09/2008 USD 539,777 CHF 560,500 JP Morgan Chase Bank 10,295 0.01
17/09/2008 USD 1,121,878 EUR 725,500 JP Morgan Chase Bank 16,143 0.01
17/09/2008 EUR 45,400 USD 71,157 JP Morgan Chase Bank (58) —
17/09/2008 USD 1,246,300 EUR 805,171 JP Morgan Chase Bank 16,760 0.01
17/09/2008 USD 77,637 TRY 99,600 JP Morgan Chase Bank 1,235 —
20/08/2008 SGD 499,300 USD 365,582 JP Morgan Chase Bank (2,537) —
20/08/2008 HKD 677,000 USD 87,035 JP Morgan Chase Bank 115 —
17/09/2008 USD 16,461 HUF 2,623,000 JP Morgan Chase Bank 897 —
16/07/2008 USD 879,581 AUD 963,400 JP Morgan Chase Bank 42,000 0.03
16/07/2008 AUD 234,600 USD 211,301 JP Morgan Chase Bank (13,116) —
16/07/2008 CAD 713,700 USD 703,354 JP Morgan Chase Bank 1,989 —
16/07/2008 USD 64,811 ZAR 517,400 JP Morgan Chase Bank 1,246 —
16/07/2008 USD 347,207 MXN 3,634,400 JP Morgan Chase Bank 4,500 —
20/08/2008 KRW 347,177,400 USD 333,120 JP Morgan Chase Bank 1,333 —
17/09/2008 USD 1,048,701 GBP 538,400 Lehman Brothers* 18,035 0.01
17/09/2008 USD 16,590,400 EUR 10,722,162 Lehman Brothers* 229,321 0.19
17/09/2008 USD 3,591,476 NOK 18,529,500 Lehman Brothers* 23,110 0.02
17/09/2008 NOK 737,900 USD 143,023 Lehman Brothers* (921) —
17/09/2008 SEK 3,392,500 USD 560,762 Lehman Brothers* (542) —
17/09/2008 CHF 1,159,600 USD 1,110,728 Lehman Brothers* (27,297) (0.02)
17/09/2008 EUR 341,800 USD 525,637 Lehman Brothers* (10,511) (0.01)
17/09/2008 USD 106,729 TRY 137,200 Lehman Brothers* 1,918 —
17/09/2008 HUF 3,273,400 USD 21,450 Lehman Brothers* (212) —
17/09/2008 USD 45 PLN 100 Lehman Brothers* 2 —
16/07/2008 USD 864,321 AUD 916,700 Lehman Brothers* 12,587 0.01
16/07/2008 CAD 1,524,700 USD 1,504,084 Lehman Brothers* 5,736 —
20/08/2008 TWD 739,900 USD 23,930 Lehman Brothers* (552) —
16/07/2008 USD 249,079 BRL 435,300 Lehman Brothers* 22,745 0.02
SettlementDates
CurrencySold
AmountSold
CurrencyBought
AmountBought Counterparty
Unrealised Appreciation/
(Depreciation)USD
% ofFund

111
THE ACCOMPANYING NOTES ARE AN INTEGRAL PART OF THESE FINANCIAL STATEMENTS.
FORWARD FOREIGN EXCHANGE CURRENCY CONTRACTS (Continued)
SettlementDates
CurrencySold
AmountSold
CurrencyBought
AmountBought Counterparty
Unrealised Appreciation/
(Depreciation)USD
% ofFund
Putnam Total Return Fund
20/08/2008 KRW 112,222,400 USD 107,812 Lehman Brothers * 564 —
17/09/2008 USD 930,400 NOK 4,796,400 Merrill Lynch 5,243 —
17/09/2008 GBP 14,100 USD 27,546 Merrill Lynch (390) —
17/09/2008 EUR 2,236,000 USD 3,463,047 Merrill Lynch (44,347) (0.04)
17/09/2008 EUR 9,244 USD 14,300 Merrill Lynch (201) —
17/09/2008 USD 12,874,100 EUR 8,321,978 Merrill Lynch 180,493 0.15
17/09/2008 USD 808,359 CHF 837,700 Merrill Lynch 13,755 0.01
17/09/2008 CHF 104,600 USD 100,244 Merrill Lynch (2,410) —
08/01/2009 USD 78,589 MYR 253,800 Merrill Lynch (855) —
08/01/2009 CNY 563,100 USD 84,357 Merrill Lynch (527) —
16/07/2008 USD 447,113 AUD 474,400 Merrill Lynch 6,695 0.01
16/07/2008 AUD 70,800 USD 67,189 Merrill Lynch (538) —
16/07/2008 USD 448,359 MXN 4,734,400 Merrill Lynch 9,797 0.01
17/09/2008 EUR 282,900 USD 438,143 State Street Bank & Trust (5,614) (0.01)
16/07/2008 USD 540,983 AUD 578,700 State Street Bank & Trust 12,597 0.01
20/08/2008 JPY 14,690,800 USD 138,987 State Street Bank & Trust 34 —
16/07/2008 CAD 1,289,500 USD 1,263,852 UBS AG (3,361) —
17/09/2008 CHF 738,600 USD 712,632 UBS AG (12,226) (0.01)
17/09/2008 USD 1,782,848 EUR 1,151,100 UBS AG 22,770 0.02
17/09/2008 EUR 2,733,900 USD 4,230,985 UBS AG (57,416) (0.05)
17/09/2008 USD 14,048,200 EUR 9,073,183 UBS AG 184,752 0.14
17/09/2008 GBP 300 USD 593 UBS AG (1) —
17/09/2008 USD 1,413,855 NOK 7,308,200 UBS AG 11,770 0.01
17/09/2008 SEK 3,549,300 USD 585,619 UBS AG (1,628) —
20/08/2008 USD 215,459 JPY 22,215,500 UBS AG (5,333) —
16/07/2008 USD 1,173,056 AUD 1,269,100 UBS AG 40,956 0.03
16/07/2008 USD 321,021 MXN 3,383,000 UBS AG 6,358 0.01
16/07/2008 NZD 73,200 USD 55,770 UBS AG 166 —
16/07/2008 USD 80,941 ZAR 649,000 UBS AG 1,917 —
17/09/2008 USD 6,194,800 EUR 4,003,477 Westpac Banking Group 85,405 0.07
16/07/2008 CAD 761,700 USD 754,053 Westpac Banking Group 5,518 —
17/09/2008 USD 2,160,245 GBP 1,112,100 Westpac Banking Group 43,169 0.03
17/09/2008 GBP 1,191,000 USD 2,313,547 Westpac Banking Group (46,192) (0.04)
17/09/2008 USD 541,200 EUR 278,761 Westpac Banking Group 11,178 —
16/07/2008 USD 1,543,900 AUD 1,678,900 Westpac Banking Group 62,123 0.05
16/07/2008 AUD 97,200 USD 90,426 Westpac Banking Group (2,555) —
16/07/2008 NZD 475,700 USD 368,846 Westpac Banking Group 7,494 0.01
Net Unrealised Appreciation on Forward Foreign Exchange Currency Contracts $1,334,777 1.09
Total Financial Assets at Fair Value through Profit or Loss $140,874,509 114.98
Total Financial Liabilities at Fair Value through Profit or Loss $(8,255,086) (6.73)
* Please refer to note 12 Subsequent events for more detail.
Analysis of Investments (Unaudited)
(a) Transferable securities admitted to official stock exchange listing 67.26
(b) Transferable securities dealt in on another regulated market —
(c) Transferable securities other than those admitted to official stock exchange listing or dealt in on another regulated market - repurchase agreement 10.61
(d) Collective Investment Schemes - mutual funds 3.40
(e) OTC financial derivative instruments - forwards/swaps 2.91
(f ) Exchange traded financial derivative instruments - futures/options 2.21
(g) Other assets 13.61
Total Investments 100.00
% ofTotal Assets

112
THE ACCOMPANYING NOTES ARE AN INTEGRAL PART OF THESE FINANCIAL STATEMENTS.
Putnam U.S. Liquid Assets Fund
Schedule of Investments
30 June 2008
$400,000 Atlantis One Funding Corporation 0.00 05/09/2008 $397,873 0.78
300,000 Atlantis One Funding Corporation 0.00 12/09/2008 298,285 0.58
300,000 Atlantis One Funding Corporation 0.00 11/09/2008 298,320 0.58
300,000 Atlantis One Funding Corporation 0.00 01/08/2008 299,284 0.58
250,000 Atlantis One Funding Corporation 0.00 03/07/2008 249,964 0.49
500,000 Barclays U.S. Funding Corporation 0.00 19/08/2008 498,026 0.97
500,000 Beagle Funding LLC 0.00 21/08/2008 498,052 0.97
1,000,000 Beagle Funding LLC 0.00 17/07/2008 998,811 1.95
400,000 BNP Paribas 0.00 14/07/2008 399,610 0.78
850,000 BNP Paribas 0.00 08/07/2008 849,580 1.66
317,000 Bryant Park Funding LLC 0.00 12/08/2008 316,001 0.62
500,000 Bryant Park Funding LLC 0.00 07/08/2008 498,638 0.97
288,000 Bryant Park Funding LLC 0.00 07/07/2008 287,868 0.56
400,000 Bryant Park Funding LLC 0.00 15/09/2008 397,627 0.77
300,000 Bryant Park Funding LLC 0.00 09/09/2008 298,367 0.58
325,000 Caisse Nationale des Caisses d’Epargne et de Prevoyance 0.00 20/08/2008 323,727 0.63
400,000 Citibank Credit Card Issuance Trust Dakota Notes 0.00 10/09/2008 397,752 0.78
320,000 Citigroup 0.00 21/08/2008 318,740 0.62
300,000 Citigroup Funding 0.00 25/09/2008 297,886 0.58
500,000 Danske Bank Corporation 0.00 11/07/2008 499,625 0.97
300,000 Danske Bank Corporation 0.00 04/08/2008 299,244 0.58
300,000 Danske Corporation 0.00 01/08/2008 299,290 0.58
400,000 Danske Corporation 0.00 14/07/2008 399,624 0.78
500,000 Dexia Delaware LLC 0.00 06/08/2008 498,700 0.97
400,000 Dexia Delaware LLC 0.00 10/07/2008 399,729 0.78
250,000 DnB NOR Bank ASA 0.00 29/12/2008 246,279 0.48
500,000 DnB NOR Bank ASA 0.00 27/10/2008 495,157 0.96
373,000 Enterprise Funding Co. LLC 0.00 25/07/2008 372,324 0.73
400,000 Enterprise Funding Co. LLC 0.00 03/07/2008 399,932 0.78
400,000 Gemini Securitization Corporation LLC 0.00 08/08/2008 398,860 0.78
250,000 Gemini Securitization Corporation LLC 0.00 07/08/2008 249,301 0.49
500,000 Gemini Securitization Corporation LLC 0.00 01/08/2008 498,859 0.97
400,000 Gemini Securitization Corporation LLC 0.00 23/09/2008 397,312 0.77
355,000 Gotham Funding 0.00 25/07/2008 354,285 0.69
400,000 Greenwich Capital Holdings 0.00 22/12/2008 394,181 0.77
350,000 ICICI Bank Limited 0.00 30/09/2008 347,302 0.68
200,000 ICICI Bank Limited 0.00 24/09/2008 198,583 0.39
433,000 ING (US) Funding LLC 0.00 01/07/2008 433,000 0.84
$500,000 International Lease Finance 0.00 08/07/2008 $499,703 0.97
300,000 LMA Americas LLC 0.00 07/08/2008 299,084 0.58
400,000 Old Line Funding 0.00 05/08/2008 398,946 0.78
320,000 Old Line Funding 0.00 10/07/2008 319,772 0.62
500,000 Old Line Funding 0.00 02/07/2008 499,964 0.97
400,000 Ranger Funding Co. LLC 0.00 11/07/2008 399,700 0.78
300,000 Royal Bank of Scotland Group 0.00 08/09/2008 298,373 0.58
500,000 Royal Bank of Scotland Group 0.00 21/07/2008 499,194 0.97
400,000 Royal Bank of Scotland Group 0.00 20/10/2008 396,460 0.77
400,000 Sheffield Receivables 0.00 31/07/2008 399,067 0.78
400,000 Sheffield Receivables 0.00 07/07/2008 399,818 0.78
400,000 Societe Generale 0.00 22/07/2008 399,253 0.78
500,000 Societe Generale 0.00 22/12/2008 500,000 0.97
500,000 Societe Generale 0.00 20/10/2008 495,298 0.97
400,000 Starbird Funding 0.00 14/08/2008 398,656 0.78
400,000 Starbird Funding 0.00 24/07/2008 399,246 0.78
500,000 Starbird Funding 0.00 23/07/2008 499,041 0.97
300,000 Starbird Funding 0.00 07/07/2008 299,843 0.58
400,000 Starbird Funding Corporation 0.00 29/09/2008 397,000 0.77
400,000 Swedbank Hypotek 0.00 10/07/2008 399,730 0.78
400,000 Swedbank Mortgage 0.00 16/07/2008 399,525 0.78
400,000 Three Pillars Funding 0.00 09/07/2008 399,760 0.78
375,000 Three Pillars Funding Corporation 0.00 15/09/2008 372,744 0.73
400,000 Three Pillars Funding Corporation 0.00 20/08/2008 398,544 0.78
400,000 Thunder Bay Funding 0.00 19/09/2008 397,458 0.77
500,000 Thunder Bay Funding 0.00 16/07/2008 499,448 0.97
500,000 Thunder Bay Funding 0.00 15/07/2008 499,502 0.97
400,000 Thunder Bay Funding Incorporated 0.00 21/07/2008 399,371 0.78
500,000 Tulip Funding 0.00 15/07/2008 499,465 0.97
500,000 UniCredito Italiano 0.00 21/08/2008 498,003 0.97
500,000 UniCredito Italiano 0.00 06/08/2008 498,585 0.97
400,000 Variable Funding Capital Co. LLC 0.00 14/07/2008 399,588 0.78
400,000 Victory Receivables Corporation 0.00 28/08/2008 398,273 0.78
400,000 Victory Receivables Corporation 0.00 11/07/2008 399,683 0.78
300,000 Westpac Banking 0.00 06/10/2008 297,818 0.58
500,000 Westpac Banking 0.00 08/10/2008 496,205 0.97
400,000 Windmill Funding 0.00 24/07/2008 399,343 0.78
500,000 Working Capital Management Co. 0.00 15/07/2008 499,456 0.97
799,000 Yorktown Capital LLC 0.00 02/07/2008 798,941 1.56
Total Commercial Paper $31.855,858 62.07
CORPORATE BONDS & NOTES (13.48%)
$500,000 Allstate Life Global Funding Trusts 3.06 20/03/2009 $500,000 0.98
700,000 Bank of America Corporation 2.72 11/08/2008 700,000 1.36
COMMERCIAL PAPER (62.07%) COMMERCIAL PAPER (Continued)
PrincipalAmounts
CouponRate %
MaturityDates
ValueUSD
% ofFund
PrincipalAmounts
CouponRate %
MaturityDates
ValueUSD
% ofFund
PrincipalAmounts
CouponRate %
MaturityDates
ValueUSD
% ofFund

113
CORPORATE BONDS & NOTES (Continued)
Putnam U.S. Liquid Assets Fund
$700,000 Citigroup Funding Incorporated 2.69 13/08/2008 $700,000 1.36
300,000 General Electric Capital Corporation 2.88 15/06/2009 300,148 0.59
310,000 ING USA Global Funding Trust 3.14 19/06/2009 310,000 0.60
600,000 Lehman Brothers*Holdings Incorporated 2.81 27/08/2008 600,000 1.17
1,150,000 Merrill Lynch & Co. Incorporated 2.64 15/08/2008 1,149,971 2.24
500,000 Principal Life Income Funding Trusts 3.04 09/04/2009 500,000 0.97
200,000 Royal Bank of Canada 2.52 09/10/2008 200,016 0.39
250,000 Toyota Motor Credit Corporation 2.49 19/06/2009 250,000 0.49
400,000 Toyota Motor Credit Corporation 2.21 18/03/2009 400,000 0.78
300,000 Toyota Motor Credit Corporation 2.36 26/06/2009 300,000 0.59
500,000 Wachovia Bank 2.91 04/02/2009 500,000 0.97
200,000 Wells Fargo & Company 2.51 02/10/2008 200,002 0.39
310,000 Wells Fargo Bank 2.63 28/05/2009 310,000 0.60
Total Corporate Bonds & Notes $6,920,137 13.48
CERTIFICATES OF DEPOSIT (12.86%)
$250,000 Abbey National Treasury Services 2.72 13/02/2009 $250,000 0.49
200,000 ABN Amro Bank 2.84 05/09/2008 200,050 0.39
500,000 Banco Santander 3.06 22/10/2008 500,015 0.97
500,000 Barclays Bank Plc 2.88 23/02/2009 500,000 0.97
300,000 Barclays Bank Plc 3.00 02/12/2008 300,006 0.58
300,000 Calyon 2.80 17/11/2008 300,000 0.59
500,000 Deutsche Bank 3.01 21/01/2009 500,000 0.97
500,000 Dexia Credit Local 2.95 18/07/2008 500,002 0.97
500,000 Natixis 3.10 22/07/2008 500,000 0.97
750,000 Nordea Bank Finland 2.42 29/07/2008 749,883 1.46
400,000 Royal Bank of Canada/New York 2.81 26/09/2008 400,010 0.78
500,000 Societe Generale North America 2.84 30/09/2008 500,000 0.98
400,000 Swedbank 2.42 08/09/2008 399,840 0.78
400,000 UniCredito Italiano 3.01 21/10/2008 400,012 0.78
300,000 UniCredito Italiano 3.26 24/12/2008 300,014 0.59
300,000 Wachovia Bank 2.69 27/01/2009 300,000 0.59
Total Certificates of Deposit $6,599,832 12.86
MUNICIPAL BONDS & NOTES (2.48%)
$885,000 Colorado Housing & Finance Authority & Co 3.15 01/11/2033 $885,000 1.73
385,000 Colorado Housing & Finance Authority & Co (Class I) 3.15 01/11/2032 385,000 0.75
Total Municipal Bonds & Notes $1,270,000 2.48
$400,000 Fannie Mae*FRN 07/09 2.75 28/07/2009 $399,878 0.78
300,000 Freddie Mac*FHLMCF FRN 09/09 2.46 21/09/2009 300,000 0.58
Total U.S. Government Agency Obligations $699,878 1.36
REPURCHASE AGREEMENTS (8.29%)
$4,253,000 Repurchase Agreement – Bank of America 2.25 01/07/2008 $4,253,000 8.29
Total Repurchase Agreements $4,253,000 8.29
Total Financial Assets at Fair Value through Profit or Loss $51,598,705 100.54
* Please refer to note 12 Subsequent events for more detail.
Analysis of Investments (Unaudited)
(a) Transferable securities admitted to official stock exchange listing —
(b) Transferable securities dealt in on another regulated market 91.64
(c) Transferable securities other than those admitted to official stock exchange listing or dealt in on another regulated market - repurchase agreement 8.23
(d) Collective Investment Schemes - mutual funds —
(e) OTC financial derivative instruments - forwards/swaps —
(f ) Exchange traded financial derivative instruments - futures/options —
(g) Other assets 0.13
Total Investments 100.00
% ofTotal Assets
PrincipalAmounts
CouponRate %
MaturityDates
ValueUSD
% ofFund
U.S. GOVERNMENT AGENCY OBLIGATIONS (1.36%)
PrincipalAmounts
CouponRate %
MaturityDates
ValueUSD
% ofFund
PrincipalAmount
CouponRate %
MaturityDate
ValueUSD
% ofFund
PrincipalAmounts
CouponRate %
MaturityDates
ValueUSD
% ofFund
PrincipalAmounts
CouponRate %
MaturityDates
ValueUSD
% ofFund
THE ACCOMPANYING NOTES ARE AN INTEGRAL PART OF THESE FINANCIAL STATEMENTS.

114
THE ACCOMPANYING NOTES ARE AN INTEGRAL PART OF THESE FINANCIAL STATEMENTS.
Putnam U.S. Small-Cap Value Equity Fund
Schedule of Investments
30 June 2008
U.S. EQUITIES (98.77%)
2,600 Advance America Cash Advance Centers Incorporated $13,182 0.09
13,100 Advanta Corporation (Class B) 82,399 0.54
2,300 Airgas Incorporated 133,906 0.88
5,500 Alon USA Energy Incorporated 65,615 0.43
5,000 American Axle & Manufacturing Holdings Incorporated 39,950 0.26
22,000 American Equity Investment Life Holding 179,300 1.17
1,800 Amerigroup Corporation 37,440 0.24
9,000 AMN Healthcare Services Incorporated 152,280 1.00
2,200 Andersons Incorporated 89,562 0.59
3,100 Applied Industrial Technologies Incorporated 74,927 0.49
6,400 Arbor Realty Trust Incorporated 57,216 0.37
10,600 Arctic Cat Incorporated 83,316 0.54
3,800 Arkansas Best Corporation 139,232 0.91
17,878 Arris Group Incorporated 151,248 0.99
8,500 ArvinMeritor Incorporated 105,655 0.69
3,485 Avnet Incorporated 94,827 0.62
3,800 Belden Incorporated 128,744 0.84
7,907 Benchmark Electronics Incorporated 129,200 0.84
3,000 Black Hills Corporation 96,150 0.63
11,635 Brightpoint Incorporated 84,936 0.56
7,100 Brown Shoe Co. Incorporated 96,205 0.63
2,400 Cabot Oil & Gas Corporation 162,264 1.06
4,360 Cache Incorporated 46,652 0.30
2,600 CACI International Incorporated 119,002 0.78
3,100 Capital Trust Incorporated 59,396 0.39
20,800 Centennial Communications Corporation 145,600 0.95
2,700 Chart Industries Incorporated 131,490 0.86
6,000 Chiquita Brands International Incorporated 90,960 0.59
21,200 Chordiant Software Incorporated 106,000 0.69
3,300 City Holding Company 134,541 0.88
5,300 Cohu Incorporated 77,804 0.51
8,820 Colonial Bancgroup Incorporated 38,896 0.25
3,700 Columbia Banking Systems Incorporated 71,521 0.47
8,720 Cutera Incorporated 78,393 0.51
1,700 Datascope Corporation 79,900 0.52
4,800 Delek US Holdings Incorporated 44,208 0.29
5,100 Deluxe Corporation 90,882 0.59
6,970 DiamondRock Hospitality Company 75,764 0.50
12,541 Earthlink Incorporated 108,480 0.71
3,800 East West Bancorp Incorporated 26,828 0.18
6,600 Emulex Corporation 76,890 0.50
2,600 Energen Corporation 202,540 1.32
11,200 Energy Partners Limited 167,104 1.09
3,700 EnerSys 126,540 0.83
7,300 Ennis Incorporated 113,807 0.74
2,200 EnPro Industries Incorporated 82,148 0.54
2,900 Entertainment Properties Trust 143,376 0.94
11,159 EZCORP Incorporated 142,277 0.93
3,913 FBL Financial Group Incorporated 77,790 0.51
3,900 Financial Federal Corporation 85,644 0.56
14,590 GateHouse Media Incorporated 35,891 0.23
2,083 General Cable Corporation 126,646 0.83
6,000 Getty Realty Corporation 86,340 0.56
18,385 Gevity HR Incorporated 98,911 0.65
5,300 Gramercy Capital Corporation 61,427 0.40
U.S. EQUITIES (Continued)
2,400 Grief Incorporated $153,672 1.00
2,900 GulfMark Offshore Incorporated 168,374 1.10
10,900 Hanmi Financial Corporation 56,789 0.37
1,700 Hanover Insurance Group Incorporated 72,250 0.47
9,400 Haverty Furniture Companies Incorporated 94,376 0.62
1,700 Haynes International Incorporated 97,835 0.64
11,960 Healthspring Incorporated 201,885 1.32
11,014 Hercules Technology Growth Capital Incorporated 98,575 0.64
10,900 Hersha Hospitality Trust 82,295 0.54
36,445 Hooper Holmes Incorporated 34,258 0.22
5,700 Iconix Brand Group Incorporated 68,742 0.45
4,300 Imation Corporation 98,427 0.64
2,800 Infinity Property & Casualty 116,088 0.76
8,930 Innovative Solutions & Support Incorporated 57,688 0.38
8,100 Interface Incorporated (Class A) 101,493 0.66
5,500 Jos. A. Bank Clothiers Incorporated 147,015 0.96
10,899 Journal Communications Incorporated 52,533 0.34
8,600 Knoll Incorporated 104,490 0.68
2,900 Laclede Group Incorporated 117,073 0.77
2,100 Landamerica Financial Group Incorporated 46,599 0.30
12,100 MCG Capital Corporation 48,158 0.32
3,700 M/I Schottenstein Homes Incorporated 58,201 0.38
19,670 MFA Mortgage Investments Incorporated 128,248 0.84
1,300 Middleby Corporation 57,044 0.37
8,880 Monotype Imaging Holdings Incorporated 108,158 0.71
3,700 Mueller Industries Incorporated 119,140 0.78
19,423 Nautilus Incorporated 98,475 0.64
2,200 Navigators Group Incorporated 118,778 0.78
6,900 Netgear Incorporated 95,634 0.62
7,994 NorthStar Realty Finance Corporation 66,510 0.43
13,300 Novatel Wireless Incorporated 148,029 0.97
2,800 OfficeMax Incorporated 38,920 0.25
6,200 Olin Corporation 162,316 1.06
20,400 Omnova Solutions Incorporated 56,508 0.37
9,600 Oplink Communications Incorporated 90,912 0.59
1,980 Owens & Minor Incorporated 90,466 0.59
4,900 Parametric Technology Corporation 81,683 0.53
4,794 Park Electrochemical Corporation 116,542 0.76
4,700 Pennsylvania Real Estate Investment Trust 108,711 0.71
4,800 Perry Ellis International Incorporated 101,952 0.67
2,700 Phillips-Van Heusen Corporation 98,874 0.65
11,300 Phoenix Companies Incorporated 85,993 0.56
25,000 Pier 1 Imports Incorporated 86,000 0.56
7,960 Presidential Life Corporation 122,743 0.80
10,341 Prestige Brands Holdings Incorporated 110,235 0.72
7,500 Provident Bankshares Corporation 47,850 0.31
5,600 PSS World Medical Incorporated 91,280 0.60
3,900 Quanex Building Products Corporation 57,954 0.38
6,126 Renasant Corporation 89,378 0.58
4,800 RPM Incorporated 98,880 0.65
15,200 Ruby Tuesday Incorporated 82,080 0.54
5,100 Ruddick Corporation 174,930 1.15
4,500 Safety Insurance Group Incorporated 160,425 1.05
7,400 Sciele Pharma Incorporated 143,338 0.94
7,730 Selective Insurance Group 145,015 0.95
Number of Shares
ValueUSD
% ofFund
Number of Shares
ValueUSD
% ofFund

115
U.S. EQUITIES (Continued)
5,700 Skechers U.S.A. Incorporated (Class A) $112,347 0.73
7,800 SkyWest Incorporated 98,670 0.64
22,500 Smart Modular Technologies WWH Incorporated 86,175 0.56
2,000 Snap-On Incorporated 104,000 0.68
5,800 Sonic Automotive Incorporated 74,762 0.49
5,300 Southwest Gas Corporation 157,569 1.03
9,477 Spartan Stores Incorporated 216,170 1.41
8,400 Spartech Corporation 79,212 0.52
4,500 St. Mary Land & Exploration Company 290,295 1.90
6,825 Stage Stores Incorporated 79,648 0.52
9,900 Stamps.com Incorporated 123,552 0.81
3,000 Steel Dynamics Incorporated 117,210 0.77
11,150 Sterling Bancshares Incorporated 101,354 0.66
5,200 Steven Madden Limited 95,680 0.63
3,600 Swift Energy Company 237,816 1.55
7,603 SWS Group Incorporated 126,210 0.82
6,100 Technitrol Incorporated 103,578 0.68
2,400 Teledyne Technologies Incorporated 117,096 0.77
3,400 Tidewater Incorporated 220,626 1.44
14,100 TradeStation Group Incorporated 143,115 0.94
9,400 TTM Technologies Incorporated 124,174 0.81
2,800 UIL Holdings Corporation 82,348 0.54
8,900 Ultra Clean Holdings 70,399 0.46
3,900 UniSource Energy Corporation 120,939 0.79
13,600 United Online Incorporated 135,728 0.89
3,300 Universal Forest Products Incorporated 98,868 0.65
16,920 USEC Incorporated 102,704 0.67
2,520 Vital Signs Incorporated 143,086 0.94
13,500 Wausau Paper Corporation 104,085 0.68
3,399 Webster Financial Corporation 63,221 0.41
3,400 Weiss Markets Incorporated 110,058 0.72
3,400 WESCO International Incorporated 135,796 0.89
5,900 Westar Energy Incorporated 126,909 0.83
2,500 Zenith National Insurance Corporation 87,900 0.57
9,500 Zoran Corporation 111,150 0.73
Total U.S. Equities $15,113,469 98.77
NON-U.S. EQUITIES (1.71%)
6,000 Assured Guaranty Limited $107,940 0.70
11,145 GSI Group Incorporated 86,485 0.57
5,000 Mellanox Technologies Limited 67,552 0.44
Total Non-U.S. Equities $261,977 1.71
Total Value of Investments $15,375,446 100.48
Putnam U.S. Small-Cap Value Equity Fund
THE ACCOMPANYING NOTES ARE AN INTEGRAL PART OF THESE FINANCIAL STATEMENTS.
Number of Shares
ValueUSD
% ofFund
Number of Shares
ValueUSD
% ofFund

116
Putnam U.S. Small-Cap Value Equity Fund
THE ACCOMPANYING NOTES ARE AN INTEGRAL PART OF THESE FINANCIAL STATEMENTS.
FORWARD FOREIGN EXCHANGE CURRENCY CONTRACTS (0.14%)
SettlementDates
CurrencySold
AmountSold
CurrencyBought
AmountBought Counterparty
Unrealised Appreciation/
(Depreciation)USD
% ofFund
17/09/2008 EUR 41,168 USD 63,700 Lehman Brothers* $(880) (0.01)
17/09/2008 USD 555,300 EUR 358,647 UBS AG 7,302 0.05
17/09/2008 USD 1,439,800 EUR 930,705 Merrill Lynch 20,186 0.14
17/09/2008 USD 87,700 EUR 56,681 Credit Suisse First Boston 1,215 —
17/09/2008 EUR 63,558 USD 97,600 Citibank NA (2,106) (0.01)
17/09/2008 USD 27,800 EUR 17,960 JP Morgan Chase Bank 373 —
17/09/2008 USD 232,600 EUR 359,400 HSBC Bank USA (4,629) (0.03)
Net Unrealised Appreciation on Forward Foreign Exchange Currency Contracts $21,461 0.14
Total Financial Assets at Fair Value through Profit or Loss $15,396,907 100.48
* Please refer to note 12 Subsequent events for more detail.
Analysis of Investments (Unaudited)
(a) Transferable securities admitted to official stock exchange listing 97.90
(b) Transferable securities dealt in on another regulated market —
(c) Transferable securities other than those admitted to official stock exchange listing or dealt in on another regulated market - repurchase agreement —
(d) Collective Investment Schemes - mutual funds —
(e) OTC financial derivative instruments - forwards/swaps 0.06
(f ) Exchange traded financial derivative instruments - futures/options —
(g) Other assets 2.04
Total Investments 100.00
% ofTotal Assets

117
THE ACCOMPANYING NOTES FORM AN INTEGRAL PART OF THESE FINANCIAL STATEMENTS.
PUTNAM WORLD TRUST
Profit and Loss AccountPutnam Putnam
American Government Emerging Information
Bond Fund* Sciences Fund
Year ended Year ended
30 June 2008 30 June 2007 30 June 2008 30 June 2007
USD USD USD USD
Operating Income
Interest Income . . . . . . . . . . . . . . . . . . . . . . . . . . . . . . . . . . . . . . . . . . . . . . . . . . $ 235,573 $ 431,515 $ 17,149 $ 39,865
Dividend Income . . . . . . . . . . . . . . . . . . . . . . . . . . . . . . . . . . . . . . . . . . . . . . . . . — — 34,386 49,572
Net Realised and Unrealised Gains/(Losses) on Financial Assets
and Liabilities at Fair Value through profit or loss . . . . . . . . . . . . . . . . . . . . . . 395,064 175,780 (5,151,691) 9,317,915
$ 630,637 $ 607,295 $ (5,100,156) $ 9,407,352
Operating Expenses
Management Fees (Note 7) . . . . . . . . . . . . . . . . . . . . . . . . . . . . . . . . . . . . . . . . 82,694 155,969 626,294 997,636
Custody and Trustee Fees . . . . . . . . . . . . . . . . . . . . . . . . . . . . . . . . . . . . . . . . . 4,437 11,224 12,059 62,927
Administrator and Transfer Agent Fees (Note 7) . . . . . . . . . . . . . . . . . . . . . . 12,969 32,210 122,939 143,784
Auditors’ Fees . . . . . . . . . . . . . . . . . . . . . . . . . . . . . . . . . . . . . . . . . . . . . . . . . . . 17,501 10,264 4,974 33,892
Professional Fees (Note 9) . . . . . . . . . . . . . . . . . . . . . . . . . . . . . . . . . . . . . . . . . 1,239 9,494 19,398 47,167
Other Expenses . . . . . . . . . . . . . . . . . . . . . . . . . . . . . . . . . . . . . . . . . . . . . . . . . 28,671 37,643 104,004 152,498
$ 147,511 $ 256,804 $ 889,668 $ 1,437,904
Operating Profit/(Loss) . . . . . . . . . . . . . . . . . . . . . . . . . . . . . . . . . . . . . . . . . $ 483,126 $ 350,491 $ (5,989,824) $ 7,969,448
Finance Costs
Distributions to holders of redeemable Units . . . . . . . . . . . . . . . . . . . . . . . . . (129,629) (234,354) — —
Interest expenses . . . . . . . . . . . . . . . . . . . . . . . . . . . . . . . . . . . . . . . . . . . . . . . . (1,064) (1,587) (120) (9)
Profit/(Loss) for the Financial Year . . . . . . . . . . . . . . . . . . . . . . . . . . . . . . $ 352,433 $ 114,550 $ (5,989,944) $ 7,969,439
Non-reclaimable withholding tax . . . . . . . . . . . . . . . . . . . . . . . . . . . . . . . . . — — (17,352) (15,784)
Adjustment from bid market price to last traded market price . . . . . . . . . . . — — (75,910) 9,688
Increase/(Decrease) in net assets attributable to redeemable
participating Unitholders . . . . . . . . . . . . . . . . . . . . . . . . . . . . . . . . . . . . $ 352,433 $ 114,550 $ (6,083,206) $ 7,963,343
There are no recognised gains or losses arising in the year other than the increase/(decrease) in Net Assets attributable to unitholders of the Trust. In arriving at the results forthe financial year, all amounts above relate to continuing operations.
* Putnam American Government Bond Fund terminated on 20 February 2008.

118
THE ACCOMPANYING NOTES FORM AN INTEGRAL PART OF THESE FINANCIAL STATEMENTS.
PUTNAM WORLD TRUST
Profit and Loss Account (Continued)Putnam Putnam
Emerging Markets Europe Equity
Debt Fund Fund
Year ended Year ended
30 June 2008 30 June 2007 30 June 2008 30 June 2007
USD USD USD USD
Operating Income
Interest Income . . . . . . . . . . . . . . . . . . . . . . . . . . . . . . . . . . . . . . . . . . . . . . . . . . $ 149,585 $ 185,339 $ 9,410 $ 18,893
Dividend Income . . . . . . . . . . . . . . . . . . . . . . . . . . . . . . . . . . . . . . . . . . . . . . . . . — — 474,832 482,497
Net Realised and Unrealised Gains/(Losses) on Financial Assets
and Liabilities at Fair Value through profit or loss . . . . . . . . . . . . . . . . . . . . . . 1,841 83,065 (2,507,721) 4,546,391
$ 151,426 $ 268,404 $ (2,023,479) $ 5,047,781
Operating Expenses
Management Fees (Note 7) . . . . . . . . . . . . . . . . . . . . . . . . . . . . . . . . . . . . . . . . 10,608 36,023 299,685 345,568
Custody and Trustee Fees . . . . . . . . . . . . . . . . . . . . . . . . . . . . . . . . . . . . . . . . . 2,058 1,989 52,770 138,354
Administrator and Transfer Agent Fees (Note 7) . . . . . . . . . . . . . . . . . . . . . . 16,622 10,170 55,807 42,794
Auditors’ Fees . . . . . . . . . . . . . . . . . . . . . . . . . . . . . . . . . . . . . . . . . . . . . . . . . . . 1,941 1,684 9,974 11,621
Professional Fees (Note 9) . . . . . . . . . . . . . . . . . . . . . . . . . . . . . . . . . . . . . . . . . 1,717 2,409 11,127 14,813
Other Expenses . . . . . . . . . . . . . . . . . . . . . . . . . . . . . . . . . . . . . . . . . . . . . . . . . 13,460 9,648 45,219 62,849
Expense Waiver (Note 7) . . . . . . . . . . . . . . . . . . . . . . . . . . . . . . . . . . . . . . . . . (3,079) (7,192) (33,296) (53,512)
$ 43,327 $ 54,731 $ 441,286 $ 562,487
Operating Profit/(Loss) . . . . . . . . . . . . . . . . . . . . . . . . . . . . . . . . . . . . . . . . . $ 108,099 $ 213,673 $ (2,464,765) $ 4,485,294
Finance Costs
Distributions to holders of redeemable Units . . . . . . . . . . . . . . . . . . . . . . . . . (113,601) (84,942) (111) (16,925)
Interest expenses . . . . . . . . . . . . . . . . . . . . . . . . . . . . . . . . . . . . . . . . . . . . . . . . — — (165) (142)
(Loss)/Profit for the Financial Year . . . . . . . . . . . . . . . . . . . . . . . . . . . . . . $ (5,502) $ 128,731 $ (2,465,041) $ 4,468,227
Non-reclaimable withholding tax . . . . . . . . . . . . . . . . . . . . . . . . . . . . . . . . . — — (77,572) (100,330)
Adjustment from bid market price to last traded market price . . . . . . . . . . . — (94) (3,936) (19,983)
(Decrease)/Increase in net assets attributable to redeemable
participating Unitholders . . . . . . . . . . . . . . . . . . . . . . . . . . . . . . . . . . . . $ (5,502) $ 128,637 $ (2,546,549) $ 4,347,914
There are no recognised gains or losses arising in the year other than the increase/(decrease) in Net Assets attributable to unitholders of the Trust. In arriving at the results forthe financial year, all amounts above relate to continuing operations.

119
THE ACCOMPANYING NOTES FORM AN INTEGRAL PART OF THESE FINANCIAL STATEMENTS.
PUTNAM WORLD TRUST
Profit and Loss Account (Continued)The George Putnam Putnam
(U.S. Equity and Bond) Global Equity Multi–Alpha
Fund* Fund
Year ended Year ended
30 June 2008 30 June 2007 30 June 2008 30 June 2007
USD USD USD USD
Operating Income
Interest Income . . . . . . . . . . . . . . . . . . . . . . . . . . . . . . . . . . . . . . . . . . . . . . . . . . $ 197,901 $ 281,375 $ — $ 9,571
Dividend Income . . . . . . . . . . . . . . . . . . . . . . . . . . . . . . . . . . . . . . . . . . . . . . . . . 97,312 166,630 573,882 449,529
Net Realised and Unrealised (Losses)/Gains on Financial Assets
and Liabilities at Fair Value through profit or loss . . . . . . . . . . . . . . . . . . . . . . (1,007,541) 1,657,151 (3,802,410) 4,491,644
$ (712,328) $ 2,105,156 $ (3,228,528) $ 4,950,744
Operating Expenses
Management Fees (Note 7) . . . . . . . . . . . . . . . . . . . . . . . . . . . . . . . . . . . . . . . . 171,006 314,825 221,657 290,353
Custody and Trustee Fees . . . . . . . . . . . . . . . . . . . . . . . . . . . . . . . . . . . . . . . . . 12,646 76,084 28,736 38,396
Administrator and Transfer Agent Fees (Note 7) . . . . . . . . . . . . . . . . . . . . . . 20,816 45,319 60,021 34,502
Auditors’ Fees . . . . . . . . . . . . . . . . . . . . . . . . . . . . . . . . . . . . . . . . . . . . . . . . . . . 25,714 13,035 21,806 13,484
Professional Fees (Note 9) . . . . . . . . . . . . . . . . . . . . . . . . . . . . . . . . . . . . . . . . . 1,744 14,924 28,728 10,111
Other Expenses . . . . . . . . . . . . . . . . . . . . . . . . . . . . . . . . . . . . . . . . . . . . . . . . . 39,865 61,038 85,495 162,217
Expense Waiver (Note 7) . . . . . . . . . . . . . . . . . . . . . . . . . . . . . . . . . . . . . . . . . (20,051) (39,257) — (113,427)
$ 251,740 $ 485,968 $ 446,443 $ 435,636
Operating (Loss)/Profit . . . . . . . . . . . . . . . . . . . . . . . . . . . . . . . . . . . . . . . . . $ (964,068) $ 1,619,188 $ (3,674,971) $ 4,515,108
Finance Costs
Distributions to holders of redeemable Units . . . . . . . . . . . . . . . . . . . . . . . . . (8,395) (14,331) — —
Interest expenses . . . . . . . . . . . . . . . . . . . . . . . . . . . . . . . . . . . . . . . . . . . . . . . . — (3) — (11,823)
(Loss)/Profit for the Financial Year . . . . . . . . . . . . . . . . . . . . . . . . . . . . . . $ (972,463) $ 1,604,854 $ (3,674,971) $ 4,503,285
Non-reclaimable withholding tax . . . . . . . . . . . . . . . . . . . . . . . . . . . . . . . . . (28,962) (49,037) (108,062) (91,105)
Adjustment from bid market price to last traded market price . . . . . . . . . . . (6,158) 1,467 (21,792) 26,669
(Decrease)/Increase in net assets attributable to redeemable
participating Unitholders . . . . . . . . . . . . . . . . . . . . . . . . . . . . . . . . . . . . $ (1,007,583) $ 1,557,284 $ (3,804,825) $ 4,438,849
There are no recognised gains or losses arising in the year other than the increase/(decrease) in Net Assets attributable to unitholders of the Trust. In arriving at the results forthe financial year, all amounts above relate to continuing operations.
* The George Putnam (U.S. Equity and Bond) Fund terminated on 20 February 2008.

120
THE ACCOMPANYING NOTES FORM AN INTEGRAL PART OF THESE FINANCIAL STATEMENTS.
PUTNAM WORLD TRUST
Profit and Loss Account (Continued)Putnam Putnam
Global Fixed Income Global Fixed Income
Alpha Fund S1* Alpha Fund S2**
Year ended Year ended
30 June 2008 30 June 2008
GBP GBP
Operating Income
Interest Income . . . . . . . . . . . . . . . . . . . . . . . . . . . . . . . . . . . . . . . . . . . . . . . . . . £ 6,149,471 £ 10,742,978
Dividend Income . . . . . . . . . . . . . . . . . . . . . . . . . . . . . . . . . . . . . . . . . . . . . . . . . — —
Net Realised and Unrealised (Losses) on Financial Assets
and Liabilities at Fair Value through profit or loss . . . . . . . . . . . . . . . . . . . . . . (85,620) (10,209,406)
£ 6,063,851 £ 533,572
Operating Expenses
Management Fees (Note 7) . . . . . . . . . . . . . . . . . . . . . . . . . . . . . . . . . . . . . . . . 283,545 353,933
Custody and Trustee Fees . . . . . . . . . . . . . . . . . . . . . . . . . . . . . . . . . . . . . . . . . 42,135 41,469
Administrator and Transfer Agent Fees (Note 7) . . . . . . . . . . . . . . . . . . . . . . 187,873 201,719
Auditors’ Fees . . . . . . . . . . . . . . . . . . . . . . . . . . . . . . . . . . . . . . . . . . . . . . . . . . . 106,719 112,664
Professional Fees (Note 9) . . . . . . . . . . . . . . . . . . . . . . . . . . . . . . . . . . . . . . . . . 26,878 16,536
Other Expenses . . . . . . . . . . . . . . . . . . . . . . . . . . . . . . . . . . . . . . . . . . . . . . . . . 69,309 56,908
£ 716,459 £ 783,229
Operating Profit/(Loss) £ 5,347,392 £ (249,657)
Finance Costs
Distributions to holders of redeemable Units . . . . . . . . . . . . . . . . . . . . . . . . . — —
Interest expenses . . . . . . . . . . . . . . . . . . . . . . . . . . . . . . . . . . . . . . . . . . . . . . . . — (550)
Profit/(Loss) for the Financial Year £ 5,347,392 £ (250,207)
Non-reclaimable withholding tax . . . . . . . . . . . . . . . . . . . . . . . . . . . . . . . . . — —
Adjustment from bid market price to last traded market price . . . . . . . . . . . — —
Increase/(Decrease) in net assets attributable to redeemable
participating Unitholders . . . . . . . . . . . . . . . . . . . . . . . . . . . . . . . . . . . . £ 5,347,392 £ (250,207)
There are no recognised gains or losses arising in the year other than the increase/(decrease) in Net Assets attributable to unitholders of the Trust. In arriving at the results forthe financial Period, all amounts above relate to continuing operations.
* Putnam Global Fixed Income Alpha Fund S1 launched on 21 February 2008.
** Putnam Global Fixed Income Alpha Fund S2 launched on 25 February 2008.
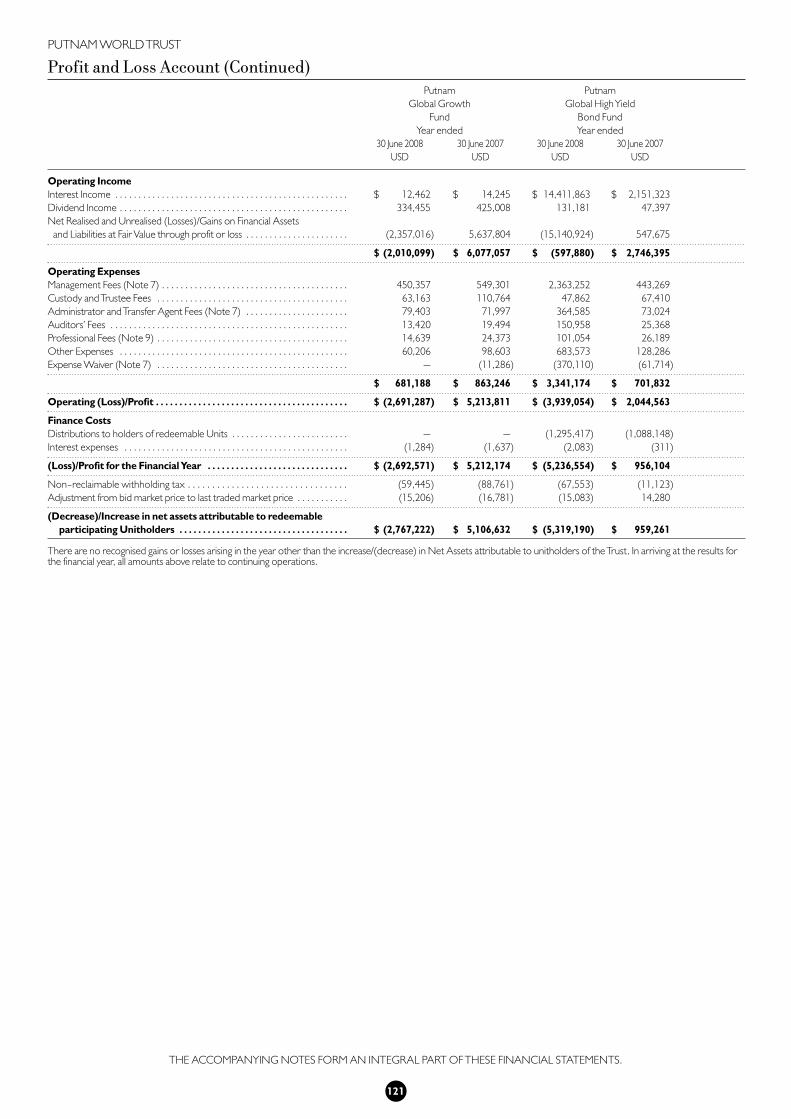
121
THE ACCOMPANYING NOTES FORM AN INTEGRAL PART OF THESE FINANCIAL STATEMENTS.
PUTNAM WORLD TRUST
Profit and Loss Account (Continued)Putnam Putnam
Global Growth Global High Yield
Fund Bond Fund
Year ended Year ended
30 June 2008 30 June 2007 30 June 2008 30 June 2007
USD USD USD USD
Operating Income
Interest Income . . . . . . . . . . . . . . . . . . . . . . . . . . . . . . . . . . . . . . . . . . . . . . . . . . $ 12,462 $ 14,245 $ 14,411,863 $ 2,151,323
Dividend Income . . . . . . . . . . . . . . . . . . . . . . . . . . . . . . . . . . . . . . . . . . . . . . . . . 334,455 425,008 131,181 47,397
Net Realised and Unrealised (Losses)/Gains on Financial Assets
and Liabilities at Fair Value through profit or loss . . . . . . . . . . . . . . . . . . . . . . (2,357,016) 5,637,804 (15,140,924) 547,675
$ (2,010,099) $ 6,077,057 $ (597,880) $ 2,746,395
Operating Expenses
Management Fees (Note 7) . . . . . . . . . . . . . . . . . . . . . . . . . . . . . . . . . . . . . . . . 450,357 549,301 2,363,252 443,269
Custody and Trustee Fees . . . . . . . . . . . . . . . . . . . . . . . . . . . . . . . . . . . . . . . . . 63,163 110,764 47,862 67,410
Administrator and Transfer Agent Fees (Note 7) . . . . . . . . . . . . . . . . . . . . . . 79,403 71,997 364,585 73,024
Auditors’ Fees . . . . . . . . . . . . . . . . . . . . . . . . . . . . . . . . . . . . . . . . . . . . . . . . . . . 13,420 19,494 150,958 25,368
Professional Fees (Note 9) . . . . . . . . . . . . . . . . . . . . . . . . . . . . . . . . . . . . . . . . . 14,639 24,373 101,054 26,189
Other Expenses . . . . . . . . . . . . . . . . . . . . . . . . . . . . . . . . . . . . . . . . . . . . . . . . . 60,206 98,603 683,573 128,286
Expense Waiver (Note 7) . . . . . . . . . . . . . . . . . . . . . . . . . . . . . . . . . . . . . . . . . — (11,286) (370,110) (61,714)
$ 681,188 $ 863,246 $ 3,341,174 $ 701,832
Operating (Loss)/Profit . . . . . . . . . . . . . . . . . . . . . . . . . . . . . . . . . . . . . . . . . $ (2,691,287) $ 5,213,811 $ (3,939,054) $ 2,044,563
Finance Costs
Distributions to holders of redeemable Units . . . . . . . . . . . . . . . . . . . . . . . . . — — (1,295,417) (1,088,148)
Interest expenses . . . . . . . . . . . . . . . . . . . . . . . . . . . . . . . . . . . . . . . . . . . . . . . . (1,284) (1,637) (2,083) (311)
(Loss)/Profit for the Financial Year . . . . . . . . . . . . . . . . . . . . . . . . . . . . . . $ (2,692,571) $ 5,212,174 $ (5,236,554) $ 956,104
Non-reclaimable withholding tax . . . . . . . . . . . . . . . . . . . . . . . . . . . . . . . . . (59,445) (88,761) (67,553) (11,123)
Adjustment from bid market price to last traded market price . . . . . . . . . . . (15,206) (16,781) (15,083) 14,280
(Decrease)/Increase in net assets attributable to redeemable
participating Unitholders . . . . . . . . . . . . . . . . . . . . . . . . . . . . . . . . . . . . $ (2,767,222) $ 5,106,632 $ (5,319,190) $ 959,261
There are no recognised gains or losses arising in the year other than the increase/(decrease) in Net Assets attributable to unitholders of the Trust. In arriving at the results forthe financial year, all amounts above relate to continuing operations.
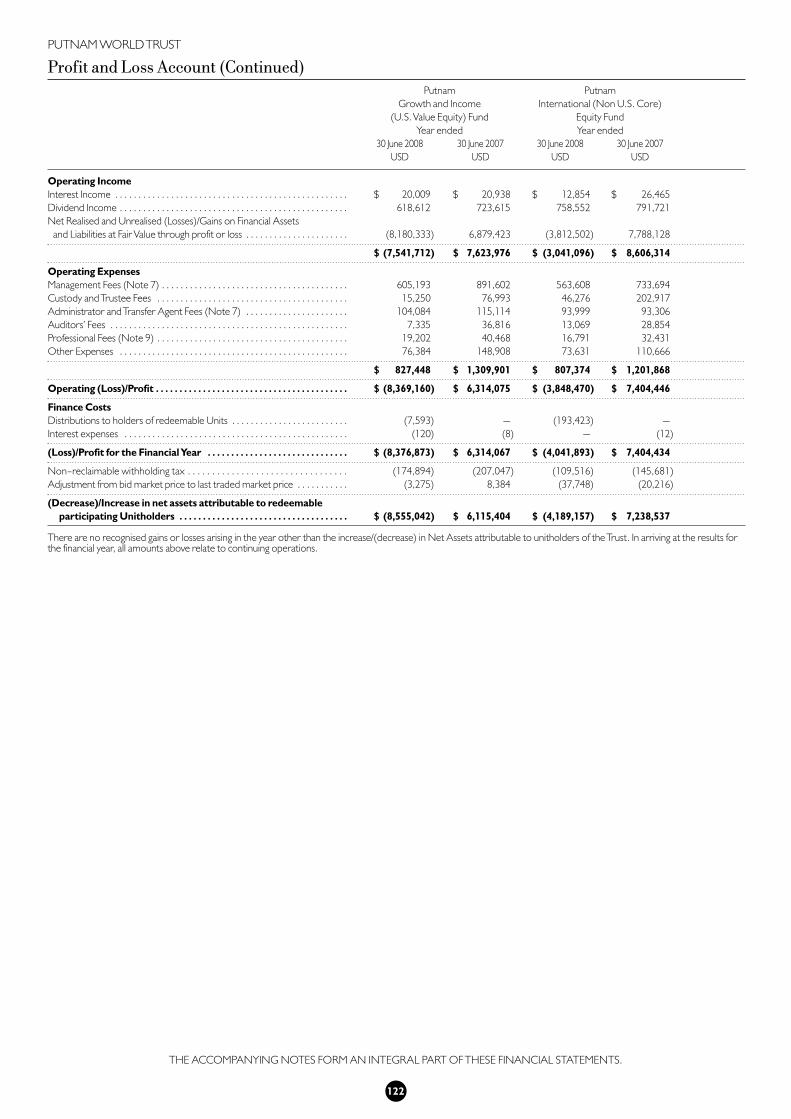
122
THE ACCOMPANYING NOTES FORM AN INTEGRAL PART OF THESE FINANCIAL STATEMENTS.
PUTNAM WORLD TRUST
Profit and Loss Account (Continued)Putnam Putnam
Growth and Income International (Non U.S. Core)
(U.S. Value Equity) Fund Equity Fund
Year ended Year ended
30 June 2008 30 June 2007 30 June 2008 30 June 2007
USD USD USD USD
Operating Income
Interest Income . . . . . . . . . . . . . . . . . . . . . . . . . . . . . . . . . . . . . . . . . . . . . . . . . . $ 20,009 $ 20,938 $ 12,854 $ 26,465
Dividend Income . . . . . . . . . . . . . . . . . . . . . . . . . . . . . . . . . . . . . . . . . . . . . . . . . 618,612 723,615 758,552 791,721
Net Realised and Unrealised (Losses)/Gains on Financial Assets
and Liabilities at Fair Value through profit or loss . . . . . . . . . . . . . . . . . . . . . . (8,180,333) 6,879,423 (3,812,502) 7,788,128
$ (7,541,712) $ 7,623,976 $ (3,041,096) $ 8,606,314
Operating Expenses
Management Fees (Note 7) . . . . . . . . . . . . . . . . . . . . . . . . . . . . . . . . . . . . . . . . 605,193 891,602 563,608 733,694
Custody and Trustee Fees . . . . . . . . . . . . . . . . . . . . . . . . . . . . . . . . . . . . . . . . . 15,250 76,993 46,276 202,917
Administrator and Transfer Agent Fees (Note 7) . . . . . . . . . . . . . . . . . . . . . . 104,084 115,114 93,999 93,306
Auditors’ Fees . . . . . . . . . . . . . . . . . . . . . . . . . . . . . . . . . . . . . . . . . . . . . . . . . . . 7,335 36,816 13,069 28,854
Professional Fees (Note 9) . . . . . . . . . . . . . . . . . . . . . . . . . . . . . . . . . . . . . . . . . 19,202 40,468 16,791 32,431
Other Expenses . . . . . . . . . . . . . . . . . . . . . . . . . . . . . . . . . . . . . . . . . . . . . . . . . 76,384 148,908 73,631 110,666
$ 827,448 $ 1,309,901 $ 807,374 $ 1,201,868
Operating (Loss)/Profit . . . . . . . . . . . . . . . . . . . . . . . . . . . . . . . . . . . . . . . . . $ (8,369,160) $ 6,314,075 $ (3,848,470) $ 7,404,446
Finance Costs
Distributions to holders of redeemable Units . . . . . . . . . . . . . . . . . . . . . . . . . (7,593) — (193,423) —
Interest expenses . . . . . . . . . . . . . . . . . . . . . . . . . . . . . . . . . . . . . . . . . . . . . . . . (120) (8) — (12)
(Loss)/Profit for the Financial Year . . . . . . . . . . . . . . . . . . . . . . . . . . . . . . $ (8,376,873) $ 6,314,067 $ (4,041,893) $ 7,404,434
Non-reclaimable withholding tax . . . . . . . . . . . . . . . . . . . . . . . . . . . . . . . . . (174,894) (207,047) (109,516) (145,681)
Adjustment from bid market price to last traded market price . . . . . . . . . . . (3,275) 8,384 (37,748) (20,216)
(Decrease)/Increase in net assets attributable to redeemable
participating Unitholders . . . . . . . . . . . . . . . . . . . . . . . . . . . . . . . . . . . . $ (8,555,042) $ 6,115,404 $ (4,189,157) $ 7,238,537
There are no recognised gains or losses arising in the year other than the increase/(decrease) in Net Assets attributable to unitholders of the Trust. In arriving at the results forthe financial year, all amounts above relate to continuing operations.

123
THE ACCOMPANYING NOTES FORM AN INTEGRAL PART OF THESE FINANCIAL STATEMENTS.
PUTNAM WORLD TRUST
Profit and Loss Account (Continued)Putnam Investors Putnam New Opportunities
(U.S. Core Equity) (U.S. Aggressive Growth Equity)
Fund Fund
Year ended Year ended
30 June 2008 30 June 2007 30 June 2008 30 June 2007
USD USD USD USD
Operating Income
Interest Income . . . . . . . . . . . . . . . . . . . . . . . . . . . . . . . . . . . . . . . . . . . . . . . . . . $ 8,295 $ 8,687 $ 10,231 $ 13,533
Dividend Income . . . . . . . . . . . . . . . . . . . . . . . . . . . . . . . . . . . . . . . . . . . . . . . . . 197,743 282,879 170,756 307,218
Net Realised and Unrealised (Losses)/Gains on Financial Assets
and Liabilities at Fair Value through profit or loss . . . . . . . . . . . . . . . . . . . . . . (4,535,133) 4,665,780 (5,423,991) 4,316,176
$ (4,329,095) $ 4,957,346 $ (5,243,004) $ 4,636,927
Operating Expenses
Management Fees (Note 7) . . . . . . . . . . . . . . . . . . . . . . . . . . . . . . . . . . . . . . . . 388,752 617,034 474,589 656,863
Custody and Trustee Fees . . . . . . . . . . . . . . . . . . . . . . . . . . . . . . . . . . . . . . . . . 14,176 57,715 17,512 57,148
Administrator and Transfer Agent Fees (Note 7) . . . . . . . . . . . . . . . . . . . . . . 84,449 89,976 88,189 110,842
Auditors’ Fees . . . . . . . . . . . . . . . . . . . . . . . . . . . . . . . . . . . . . . . . . . . . . . . . . . . 3,568 25,144 5,206 26,382
Professional Fees (Note 9) . . . . . . . . . . . . . . . . . . . . . . . . . . . . . . . . . . . . . . . . . 11,556 28,799 13,215 30,816
Other Expenses . . . . . . . . . . . . . . . . . . . . . . . . . . . . . . . . . . . . . . . . . . . . . . . . . 57,719 100,551 66,454 93,848
Expense Waiver (Note 7) . . . . . . . . . . . . . . . . . . . . . . . . . . . . . . . . . . . . . . . . . (109,513) (171,690) (16,138) (22,319)
$ 450,707 $ 747,529 $ 649,027 $ 953,580
Operating (Loss)/Profit . . . . . . . . . . . . . . . . . . . . . . . . . . . . . . . . . . . . . . . . . $ (4,779,802) $ 4,209,817 $ (5,892,031) $ 3,683,347
Finance Costs
Distributions to holders of redeemable Units . . . . . . . . . . . . . . . . . . . . . . . . . (6,716) — — —
Interest expenses . . . . . . . . . . . . . . . . . . . . . . . . . . . . . . . . . . . . . . . . . . . . . . . . (150) (6) (155) (6)
(Loss)/Profit for the Financial Year . . . . . . . . . . . . . . . . . . . . . . . . . . . . . . $ (4,786,668) $ 4,209,811 $ (5,892,186) $ 3,683,341
Non-reclaimable withholding tax . . . . . . . . . . . . . . . . . . . . . . . . . . . . . . . . . (60,886) (81,973) (39,071) (87,412)
Adjustment from bid market price to last traded market price . . . . . . . . . . . (2,206) 13,774 16,061 (53,113)
(Decrease)/Increase in net assets attributable to redeemable
participating Unitholders . . . . . . . . . . . . . . . . . . . . . . . . . . . . . . . . . . . . $ (4,849,760) $ 4,141,612 $ (5,915,196) $ 3,542,816
There are no recognised gains or losses arising in the year other than the increase/(decrease) in Net Assets attributable to unitholders of the Trust. In arriving at the results forthe financial year, all amounts above relate to continuing operations.

124
THE ACCOMPANYING NOTES FORM AN INTEGRAL PART OF THESE FINANCIAL STATEMENTS.
PUTNAM WORLD TRUST
Profit and Loss Account (Continued)Putnam Putnam
Opportunistic Value Total Return
Fund* Fund
Year ended Year ended
30 June 2008 30 June 2007 30 June 2008 30 June 2007
USD USD USD USD
Operating Income
Interest Income . . . . . . . . . . . . . . . . . . . . . . . . . . . . . . . . . . . . . . . . . . . . . . . . . . $ 2,457 $ 23,902 $ 1,100,832 $ 523,574
Dividend Income . . . . . . . . . . . . . . . . . . . . . . . . . . . . . . . . . . . . . . . . . . . . . . . . . 38,500 822,583 1,154,535 285,991
Net Realised and Unrealised (Losses)/Gains on Financial Assets
and Liabilities at Fair Value through profit or loss . . . . . . . . . . . . . . . . . . . . . . (560,922) 7,416,244 8,843,844 1,792,011
$ (519,965) $ 8,262,729 $ 11,099,211 $ 2,601,576
Operating Expenses
Management Fees (Note 7) . . . . . . . . . . . . . . . . . . . . . . . . . . . . . . . . . . . . . . . . 28,096 623,869 637,652 357,981
Custody and Trustee Fees . . . . . . . . . . . . . . . . . . . . . . . . . . . . . . . . . . . . . . . . . 3,447 38,185 73,870 179,159
Administrator and Transfer Agent Fees (Note 7) . . . . . . . . . . . . . . . . . . . . . . 27,402 68,842 151,560 41,782
Auditors’ Fees . . . . . . . . . . . . . . . . . . . . . . . . . . . . . . . . . . . . . . . . . . . . . . . . . . . — 23,414 55,972 16,807
Professional Fees (Note 9) . . . . . . . . . . . . . . . . . . . . . . . . . . . . . . . . . . . . . . . . . 3,461 35,914 53,955 12,761
Other Expenses . . . . . . . . . . . . . . . . . . . . . . . . . . . . . . . . . . . . . . . . . . . . . . . . . 5,495 135,470 264,943 159,709
Expense Waiver (Note 7) . . . . . . . . . . . . . . . . . . . . . . . . . . . . . . . . . . . . . . . . . (1,985) (57,159) (210) (356,494)
$ 65,916 $ 868,535 $ 1,237,747 $ 411,705
Operating (Loss)/Profit . . . . . . . . . . . . . . . . . . . . . . . . . . . . . . . . . . . . . . . . . $ (585,881) $ 7,394,194 $ 9,861,464 $ 2,189,871
Finance Costs
Distributions to holders of redeemable Units . . . . . . . . . . . . . . . . . . . . . . . . . (18,179) — — —
Interest expenses . . . . . . . . . . . . . . . . . . . . . . . . . . . . . . . . . . . . . . . . . . . . . . . . — — (3,380) (4,895)
(Loss)/Profit for the Financial Year . . . . . . . . . . . . . . . . . . . . . . . . . . . . . . $ (604,060) $ 7,394,194 $ 9,858,084 $ 2,184,976
Non-reclaimable withholding tax . . . . . . . . . . . . . . . . . . . . . . . . . . . . . . . . . (11,237) (236,644) (232,224) (59,330)
Adjustment from bid market price to last traded market price . . . . . . . . . . . (3,533) (13,642) (130,341) 82,526
(Decrease)/Increase in net assets attributable to redeemable
participating Unitholders . . . . . . . . . . . . . . . . . . . . . . . . . . . . . . . . . . . . $ (618,830) $ 7,143,908 $ 9,495,519 $ 2,208,172
There are no recognised gains or losses arising in the year other than the increase/(decrease) in Net Assets attributable to unitholders of the Trust. In arriving at the results forthe financial year, all amounts above relate to continuing operations.
* Putnam Opportunistic Value Fund terminated on 20 February 2008.

PUTNAM WORLD TRUST
Profit and Loss Account (Continued)Putnam Putnam
U.S. Liquid Assets U.S. Small–Cap Value
Fund Equity Fund
Year ended Year ended
30 June 2008 30 June 2007 30 June 2008 30 June 2007
USD USD USD USD
Operating Income
Interest Income . . . . . . . . . . . . . . . . . . . . . . . . . . . . . . . . . . . . . . . . . . . . . . . . . . $ 1,987,202 $ 1,139,359 $ 12,676 $ 64,681
Dividend Income . . . . . . . . . . . . . . . . . . . . . . . . . . . . . . . . . . . . . . . . . . . . . . . . . — — 1,452,963 2,097,593
Net Realised and Unrealised Gains/(Losses) on Financial Assets
and Liabilities at Fair Value through profit or loss . . . . . . . . . . . . . . . . . . . . . . 26,034 3,262 (27,077,890) 19,590,439
$ 2,013,236 $ 1,142,621 $(25,612,251) $ 21,752,713
Operating Expenses
Management Fees (Note 7) . . . . . . . . . . . . . . . . . . . . . . . . . . . . . . . . . . . . . . . . 260,532 57,271 923,360 1,664,837
Custody and Trustee Fees . . . . . . . . . . . . . . . . . . . . . . . . . . . . . . . . . . . . . . . . . 19,380 17,141 37,840 159,046
Administrator and Transfer Agent Fees (Note 7) . . . . . . . . . . . . . . . . . . . . . . 97,955 62,406 209,252 221,578
Auditors’ Fees . . . . . . . . . . . . . . . . . . . . . . . . . . . . . . . . . . . . . . . . . . . . . . . . . . . 25,753 18,815 18,483 95,001
Professional Fees (Note 9) . . . . . . . . . . . . . . . . . . . . . . . . . . . . . . . . . . . . . . . . . 29,485 14,860 48,345 97,128
Other Expenses . . . . . . . . . . . . . . . . . . . . . . . . . . . . . . . . . . . . . . . . . . . . . . . . . 154,413 104,134 143,623 465,049
Expense Waiver (Note 7) . . . . . . . . . . . . . . . . . . . . . . . . . . . . . . . . . . . . . . . . . (264,323) (99,447) (175,633) (359,724)
$ 323,195 $ 175,180 $ 1,205,270 $ 2,342,915
Operating Profit/(Loss) . . . . . . . . . . . . . . . . . . . . . . . . . . . . . . . . . . . . . . . . . $ 1,690,041 $ 967,441 $ (26,817,521) $ 19,409,798
Finance Costs
Distributions to holders of redeemable Units . . . . . . . . . . . . . . . . . . . . . . . . . (1,675,755) (952,799) (30,246) —
Interest expenses . . . . . . . . . . . . . . . . . . . . . . . . . . . . . . . . . . . . . . . . . . . . . . . . — — (184) (955)
Profit/(Loss) for the Financial Year . . . . . . . . . . . . . . . . . . . . . . . . . . . . . . $ 14,286 $ 14,642 $ (26,847,951) $ 19,408,843
Non-reclaimable withholding tax . . . . . . . . . . . . . . . . . . . . . . . . . . . . . . . . . — (11,380) (425,848) (626,673)
Adjustment from bid market price to last traded market price . . . . . . . . . . . (424) (3,262) (143,323) (256,927)
Increase/(Decrease) in net assets attributable to redeemable
participating Unitholders . . . . . . . . . . . . . . . . . . . . . . . . . . . . . . . . . . . . $ 13,862 $ — $ (27,417,122) $ 18,525,243
There are no recognised gains or losses arising in the year other than the increase in Net Assets attributable to unitholders of the Trust. In arriving at the results for the financialyear, all amounts above relate to continuing operations.
125
THE ACCOMPANYING NOTES FORM AN INTEGRAL PART OF THESE FINANCIAL STATEMENTS.
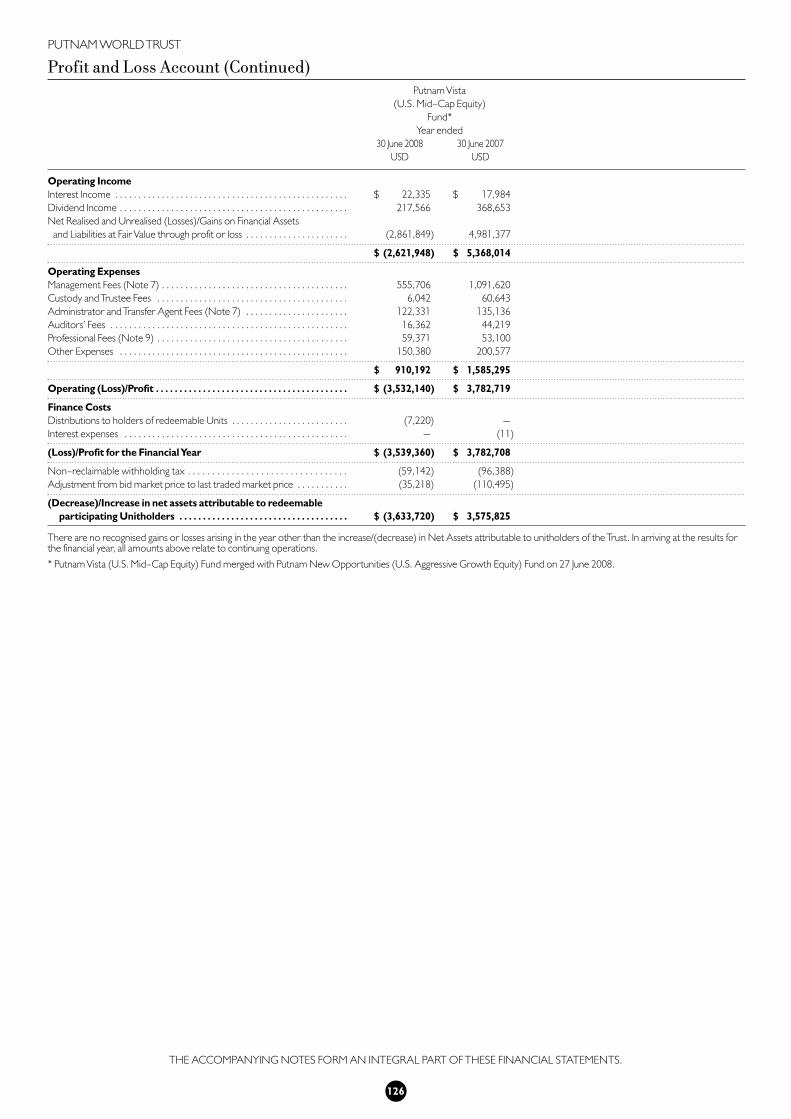
PUTNAM WORLD TRUST
Profit and Loss Account (Continued)Putnam Vista
(U.S. Mid–Cap Equity)
Fund*
Year ended
30 June 2008 30 June 2007
USD USD
Operating Income
Interest Income . . . . . . . . . . . . . . . . . . . . . . . . . . . . . . . . . . . . . . . . . . . . . . . . . . $ 22,335 $ 17,984
Dividend Income . . . . . . . . . . . . . . . . . . . . . . . . . . . . . . . . . . . . . . . . . . . . . . . . . 217,566 368,653
Net Realised and Unrealised (Losses)/Gains on Financial Assets
and Liabilities at Fair Value through profit or loss . . . . . . . . . . . . . . . . . . . . . . (2,861,849) 4,981,377
$ (2,621,948) $ 5,368,014
Operating Expenses
Management Fees (Note 7) . . . . . . . . . . . . . . . . . . . . . . . . . . . . . . . . . . . . . . . . 555,706 1,091,620
Custody and Trustee Fees . . . . . . . . . . . . . . . . . . . . . . . . . . . . . . . . . . . . . . . . . 6,042 60,643
Administrator and Transfer Agent Fees (Note 7) . . . . . . . . . . . . . . . . . . . . . . 122,331 135,136
Auditors’ Fees . . . . . . . . . . . . . . . . . . . . . . . . . . . . . . . . . . . . . . . . . . . . . . . . . . . 16,362 44,219
Professional Fees (Note 9) . . . . . . . . . . . . . . . . . . . . . . . . . . . . . . . . . . . . . . . . . 59,371 53,100
Other Expenses . . . . . . . . . . . . . . . . . . . . . . . . . . . . . . . . . . . . . . . . . . . . . . . . . 150,380 200,577
$ 910,192 $ 1,585,295
Operating (Loss)/Profit . . . . . . . . . . . . . . . . . . . . . . . . . . . . . . . . . . . . . . . . . $ (3,532,140) $ 3,782,719
Finance Costs
Distributions to holders of redeemable Units . . . . . . . . . . . . . . . . . . . . . . . . . (7,220) —
Interest expenses . . . . . . . . . . . . . . . . . . . . . . . . . . . . . . . . . . . . . . . . . . . . . . . . — (11)
(Loss)/Profit for the Financial Year $ (3,539,360) $ 3,782,708
Non-reclaimable withholding tax . . . . . . . . . . . . . . . . . . . . . . . . . . . . . . . . . (59,142) (96,388)
Adjustment from bid market price to last traded market price . . . . . . . . . . . (35,218) (110,495)
(Decrease)/Increase in net assets attributable to redeemable
participating Unitholders . . . . . . . . . . . . . . . . . . . . . . . . . . . . . . . . . . . . $ (3,633,720) $ 3,575,825
There are no recognised gains or losses arising in the year other than the increase/(decrease) in Net Assets attributable to unitholders of the Trust. In arriving at the results forthe financial year, all amounts above relate to continuing operations.
* Putnam Vista (U.S. Mid-Cap Equity) Fund merged with Putnam New Opportunities (U.S. Aggressive Growth Equity) Fund on 27 June 2008.
126
THE ACCOMPANYING NOTES FORM AN INTEGRAL PART OF THESE FINANCIAL STATEMENTS.

127
THE ACCOMPANYING NOTES FORM AN INTEGRAL PART OF THESE FINANCIAL STATEMENTS.
PUTNAM WORLD TRUST
Balance SheetPutnam Putnam
American Government Emerging Information
Bond Fund* Sciences Fund
30 June 2008 30 June 2007 30 June 2008 30 June 2007
USD USD USD USD
Current Assets
Financial Assets at Fair Value through Profit or Loss . . . . . . . . . . . . . . . . . . . . . $ — $ 8,501,630 $ 20,596,218 $ 34,832,141
Cash at Bank . . . . . . . . . . . . . . . . . . . . . . . . . . . . . . . . . . . . . . . . . . . . . . . . . . . . 27,963 74,360 27,835 85,678
Sales of Investments Awaiting Settlement . . . . . . . . . . . . . . . . . . . . . . . . . . . . — 8,932 225,489 349,193
Subscription of Units Awaiting Settlement . . . . . . . . . . . . . . . . . . . . . . . . . . . . — 1,826 — 17,145
Dividend Income Receivable . . . . . . . . . . . . . . . . . . . . . . . . . . . . . . . . . . . . . . . — — 1,838 154
Interest Income Receivable . . . . . . . . . . . . . . . . . . . . . . . . . . . . . . . . . . . . . . . . — 30,441 10 93
Other Debtors . . . . . . . . . . . . . . . . . . . . . . . . . . . . . . . . . . . . . . . . . . . . . . . . . . — — 811 21,414
Total Assets . . . . . . . . . . . . . . . . . . . . . . . . . . . . . . . . . . . . . . . . . . . . . . . . . . . $ 27,963 $ 8,617,189 $ 20,852,201 $ 35,305,818
Creditors
(amounts falling due within one Year)
Purchase of Investments Awaiting Settlement . . . . . . . . . . . . . . . . . . . . . . . . . — 593,770 — 428,150
Financial Liabilities at Fair Value through Profit and Loss . . . . . . . . . . . . . . . . . — 192,598 — 2,635
Redemption of Units Awaiting Settlement . . . . . . . . . . . . . . . . . . . . . . . . . . . . — — 33,530 22,625
Expenses Payable . . . . . . . . . . . . . . . . . . . . . . . . . . . . . . . . . . . . . . . . . . . . . . . . 27,963 56,384 127,052 290,764
Total Current Liabilities excluding net assets attributable
to participating Unitholders . . . . . . . . . . . . . . . . . . . . . . . . . . . . . . . . . . $ 27,963 $ 842,752 $ 160,582 $ 744,174
Net Assets attributable to redeemable participating
Unitholders at bid value . . . . . . . . . . . . . . . . . . . . . . . . . . . . . . . . . . . . . . $ — $ 7,774,437 $ 20,691,619 $ 34,561,644
Adjustments from bid market value to last traded market value . . . $ — $ — $ (6,448) $ 69,462
Net Assets attributable to redeemable participating
Unitholders . . . . . . . . . . . . . . . . . . . . . . . . . . . . . . . . . . . . . . . . . . . . . . . . . $ — $ 7,774,437 $ 20,685,171 $ 34,631,106
Class A
Units in Issue . . . . . . . . . . . . . . . . . . . . . . . . . . . . . . . . . . . . . . . . . . . . . . . . . . . . — 376,688 974,915 621,560
Net Assets . . . . . . . . . . . . . . . . . . . . . . . . . . . . . . . . . . . . . . . . . . . . . . . . . . . . . . — 3,263,246 10,238,903 8,135,339
Net Asset Value per Unit . . . . . . . . . . . . . . . . . . . . . . . . . . . . . . . . . . . . . . . . . . — 8.66 10.50 13.09
Class B
Units in Issue . . . . . . . . . . . . . . . . . . . . . . . . . . . . . . . . . . . . . . . . . . . . . . . . . . . . — 524,405 648,283 848,150
Net Assets . . . . . . . . . . . . . . . . . . . . . . . . . . . . . . . . . . . . . . . . . . . . . . . . . . . . . . — 4,476,854 7,950,460 13,028,376
Net Asset Value per Unit . . . . . . . . . . . . . . . . . . . . . . . . . . . . . . . . . . . . . . . . . . — 8.54 12.26 15.36
Class C
Units in Issue . . . . . . . . . . . . . . . . . . . . . . . . . . . . . . . . . . . . . . . . . . . . . . . . . . . . — 3,478 9,758 8,813
Net Assets . . . . . . . . . . . . . . . . . . . . . . . . . . . . . . . . . . . . . . . . . . . . . . . . . . . . . . — 27,321 84,784 95,668
Net Asset Value per Unit . . . . . . . . . . . . . . . . . . . . . . . . . . . . . . . . . . . . . . . . . . — 7.86 8.69 10.85
Class E
Units in Issue . . . . . . . . . . . . . . . . . . . . . . . . . . . . . . . . . . . . . . . . . . . . . . . . . . . . — — 106,883 396,575
Net Assets . . . . . . . . . . . . . . . . . . . . . . . . . . . . . . . . . . . . . . . . . . . . . . . . . . . . . . — — 1,045,855 4,151,261
Net Asset Value per Unit . . . . . . . . . . . . . . . . . . . . . . . . . . . . . . . . . . . . . . . . . . — — ¤ 6.21 ¤ 7.74
Class I
Units in Issue . . . . . . . . . . . . . . . . . . . . . . . . . . . . . . . . . . . . . . . . . . . . . . . . . . . . — 721 125,922 685,042
Net Assets . . . . . . . . . . . . . . . . . . . . . . . . . . . . . . . . . . . . . . . . . . . . . . . . . . . . . . — 7,016 1,365,169 9,220,462
Net Asset Value per Unit . . . . . . . . . . . . . . . . . . . . . . . . . . . . . . . . . . . . . . . . . . — 9.73 10.84 13.46
* Putnam American Government Bond Fund terminated on 20 February 2008.

128
THE ACCOMPANYING NOTES FORM AN INTEGRAL PART OF THESE FINANCIAL STATEMENTS.
PUTNAM WORLD TRUST
Balance Sheet (Continued)Putnam Putnam
Emerging Markets Europe Equity
Debt Fund Fund
30 June 2008 30 June 2007 30 June 2008 30 June 2007
USD USD USD USD
Current Assets
Financial Assets at Fair Value through Profit or Loss . . . . . . . . . . . . . . . . . . . . . $ 2,795,249 $ 2,695,683 $ 11,033,261 $ 16,294,931
Cash at Bank . . . . . . . . . . . . . . . . . . . . . . . . . . . . . . . . . . . . . . . . . . . . . . . . . . . . 28,126 — 359,386 87,388
Sales of Investments Awaiting Settlement . . . . . . . . . . . . . . . . . . . . . . . . . . . . 4,740 — 101,375 —
Subscription of Units Awaiting Settlement . . . . . . . . . . . . . . . . . . . . . . . . . . . . — — — —
Dividend Income Receivable . . . . . . . . . . . . . . . . . . . . . . . . . . . . . . . . . . . . . . . — — 58,146 9,724
Interest Income Receivable . . . . . . . . . . . . . . . . . . . . . . . . . . . . . . . . . . . . . . . . 32,446 39,902 — 255
Other Debtors . . . . . . . . . . . . . . . . . . . . . . . . . . . . . . . . . . . . . . . . . . . . . . . . . . 12,994 1,834 — 14,218
Total Assets . . . . . . . . . . . . . . . . . . . . . . . . . . . . . . . . . . . . . . . . . . . . . . . . . . . $ 2,873,555 $ 2,737,419 $ 11,552,168 $ 16,406,516
Creditors
(amounts falling due within one Year)
Purchase of Investments Awaiting Settlement . . . . . . . . . . . . . . . . . . . . . . . . . — — 179,486 33,911
Financial Liabilities at Fair Value through Profit and Loss . . . . . . . . . . . . . . . . . 32,568 1,145 — —
Redemption of Units Awaiting Settlement . . . . . . . . . . . . . . . . . . . . . . . . . . . . 8 — 99 25,000
Distributions Payable . . . . . . . . . . . . . . . . . . . . . . . . . . . . . . . . . . . . . . . . . . . . . — — — —
Expenses Payable . . . . . . . . . . . . . . . . . . . . . . . . . . . . . . . . . . . . . . . . . . . . . . . . — 13,664 61,702 127,444
Bank Overdraft . . . . . . . . . . . . . . . . . . . . . . . . . . . . . . . . . . . . . . . . . . . . . . . . . . — 2,345 — —
Total Current Liabilities . . . . . . . . . . . . . . . . . . . . . . . . . . . . . . . . . . . . . . . . $ 32,576 $ 17,154 $ 241,287 $ 186,355
Net Assets attributable to redeemable participating
Unitholders at bid value . . . . . . . . . . . . . . . . . . . . . . . . . . . . . . . . . . . . . . $ 2,840,979 $ 2,720,265 $ 11,310,881 $ 16,220,161
Adjustments from bid market value to last traded market value . . . $ — $ — $ (17,679) $ (13,743)
Net Assets attributable to redeemable participating
Unitholders . . . . . . . . . . . . . . . . . . . . . . . . . . . . . . . . . . . . . . . . . . . . . . . . . $ 2,840,979 $ 2,720,265 $ 11,293,202 $ 16,206,418
Class A
Units in Issue . . . . . . . . . . . . . . . . . . . . . . . . . . . . . . . . . . . . . . . . . . . . . . . . . . . . 41,078 37,513 341,950 372,573
Net Assets . . . . . . . . . . . . . . . . . . . . . . . . . . . . . . . . . . . . . . . . . . . . . . . . . . . . . . 371,965 341,114 5,605,571 7,350,794
Net Asset Value per Unit . . . . . . . . . . . . . . . . . . . . . . . . . . . . . . . . . . . . . . . . . . 9.06 9.09 16.39 19.73
Class B
Units in Issue . . . . . . . . . . . . . . . . . . . . . . . . . . . . . . . . . . . . . . . . . . . . . . . . . . . . 1,474 1,957 230,464 339,152
Net Assets . . . . . . . . . . . . . . . . . . . . . . . . . . . . . . . . . . . . . . . . . . . . . . . . . . . . . . 13,338 17,774 3,585,977 6,382,433
Net Asset Value per Unit . . . . . . . . . . . . . . . . . . . . . . . . . . . . . . . . . . . . . . . . . . 9.05 9.08 15.56 18.82
Class C
Units in Issue . . . . . . . . . . . . . . . . . . . . . . . . . . . . . . . . . . . . . . . . . . . . . . . . . . . . 336 323 924 4,520
Net Assets . . . . . . . . . . . . . . . . . . . . . . . . . . . . . . . . . . . . . . . . . . . . . . . . . . . . . . 3,038 2,935 10,443 61,760
Net Asset Value per Unit . . . . . . . . . . . . . . . . . . . . . . . . . . . . . . . . . . . . . . . . . . 9.05 9.10 11.30 13.66
Class E
Units in Issue . . . . . . . . . . . . . . . . . . . . . . . . . . . . . . . . . . . . . . . . . . . . . . . . . . . . — — 174,364 174,763
Net Assets . . . . . . . . . . . . . . . . . . . . . . . . . . . . . . . . . . . . . . . . . . . . . . . . . . . . . . — — 2,066,724 2,359,699
Net Asset Value per Unit . . . . . . . . . . . . . . . . . . . . . . . . . . . . . . . . . . . . . . . . . . — — ¤ 7.53 ¤ 9.98
Class I
Units in Issue . . . . . . . . . . . . . . . . . . . . . . . . . . . . . . . . . . . . . . . . . . . . . . . . . . . . 255,910 245,488 1,515 2,670
Net Assets . . . . . . . . . . . . . . . . . . . . . . . . . . . . . . . . . . . . . . . . . . . . . . . . . . . . . . 2,452,638 2,358,442 24,487 51,732
Net Asset Value per Unit . . . . . . . . . . . . . . . . . . . . . . . . . . . . . . . . . . . . . . . . . . 9.58 9.61 16.16 19.38

PUTNAM WORLD TRUST
Balance Sheet (Continued)The George Putnam Putnam
(U.S. Equity and Bond) Global Equity Multi-Alpha
Fund* Fund
30 June 2008 30 June 2007 30 June 2008 30 June 2007
USD USD USD USD
Current Assets
Financial Assets at Fair Value through Profit or Loss . . . . . . . . . . . . . . . . . . . . . $ — $ 13,111,661 $ 15,812,689 $ 27,148,947
Cash at Bank . . . . . . . . . . . . . . . . . . . . . . . . . . . . . . . . . . . . . . . . . . . . . . . . . . . . 51,177 10,773 360,533 581,029
Sales of Investments Awaiting Settlement . . . . . . . . . . . . . . . . . . . . . . . . . . . . — 579,953 10,136 402,900
Subscription of Units Awaiting Settlement . . . . . . . . . . . . . . . . . . . . . . . . . . . . — — — —
Dividend Income Receivable . . . . . . . . . . . . . . . . . . . . . . . . . . . . . . . . . . . . . . . — 7,446 44,981 17,591
Interest Income Receivable . . . . . . . . . . . . . . . . . . . . . . . . . . . . . . . . . . . . . . . . — 20,222 518 —
Other Debtors . . . . . . . . . . . . . . . . . . . . . . . . . . . . . . . . . . . . . . . . . . . . . . . . . . — 10,228 118,682 35,406
Total Assets . . . . . . . . . . . . . . . . . . . . . . . . . . . . . . . . . . . . . . . . . . . . . . . . . . . $ 51,177 $ 13,740,283 $ 16,347,539 $ 28,185,873
Creditors
(amounts falling due within one Year)
Purchase of Investments Awaiting Settlement . . . . . . . . . . . . . . . . . . . . . . . . . — 1,176,553 — 391,507
Financial Liabilities at Fair Value through Profit and Loss . . . . . . . . . . . . . . . . . — 80,604 — 56,913
Redemption of Units Awaiting Settlement . . . . . . . . . . . . . . . . . . . . . . . . . . . . — 10,197 — —
Expenses Payable . . . . . . . . . . . . . . . . . . . . . . . . . . . . . . . . . . . . . . . . . . . . . . . . 51,177 117,118 35,558 153,807
Total Current Liabilities excluding net assets attributable
to participating Unitholders . . . . . . . . . . . . . . . . . . . . . . . . . . . . . . . . . . $ 51,177 $ 1,384,472 $ 35,558 $ 602,227
Net Assets attributable to redeemable participating
Unitholders at bid value . . . . . . . . . . . . . . . . . . . . . . . . . . . . . . . . . . . . . . $ — $ 12,355,811 $ 16,311,981 $ 27,583,646
Adjustments from bid market value to last traded market value . . . $ — $ 6,158 $ 4,877 $ 26,669
Net Assets attributable to redeemable participating
Unitholders . . . . . . . . . . . . . . . . . . . . . . . . . . . . . . . . . . . . . . . . . . . . . . . . . $ — $ 12,361,969 $ 16,316,858 $ 27,610,315
Class A**
Units in Issue . . . . . . . . . . . . . . . . . . . . . . . . . . . . . . . . . . . . . . . . . . . . . . . . . . . . — 350,377 1,550,295 1,705,751
Net Assets . . . . . . . . . . . . . . . . . . . . . . . . . . . . . . . . . . . . . . . . . . . . . . . . . . . . . . — 4,657,333 14,527,493 18,328,287
Net Asset Value per Unit . . . . . . . . . . . . . . . . . . . . . . . . . . . . . . . . . . . . . . . . . . — 13.29 9.37 10.74
Class B
Units in Issue . . . . . . . . . . . . . . . . . . . . . . . . . . . . . . . . . . . . . . . . . . . . . . . . . . . . — 579,316 99,716 —
Net Assets . . . . . . . . . . . . . . . . . . . . . . . . . . . . . . . . . . . . . . . . . . . . . . . . . . . . . . — 7,628,087 715,596 —
Net Asset Value per Unit . . . . . . . . . . . . . . . . . . . . . . . . . . . . . . . . . . . . . . . . . . — 13.17 7.18 —
Class C
Units in Issue . . . . . . . . . . . . . . . . . . . . . . . . . . . . . . . . . . . . . . . . . . . . . . . . . . . . — 7,716 793 —
Net Assets . . . . . . . . . . . . . . . . . . . . . . . . . . . . . . . . . . . . . . . . . . . . . . . . . . . . . . — 76,477 5,705 —
Net Asset Value per Unit . . . . . . . . . . . . . . . . . . . . . . . . . . . . . . . . . . . . . . . . . . — 9.91 7.19 —
Class I
Units in Issue . . . . . . . . . . . . . . . . . . . . . . . . . . . . . . . . . . . . . . . . . . . . . . . . . . . . — 15 — —
Net Assets . . . . . . . . . . . . . . . . . . . . . . . . . . . . . . . . . . . . . . . . . . . . . . . . . . . . . . — 72 — —
Net Asset Value per Unit . . . . . . . . . . . . . . . . . . . . . . . . . . . . . . . . . . . . . . . . . . — 4.72 — —
Class J
Units in Issue . . . . . . . . . . . . . . . . . . . . . . . . . . . . . . . . . . . . . . . . . . . . . . . . . . . . — — 294 294
Net Assets . . . . . . . . . . . . . . . . . . . . . . . . . . . . . . . . . . . . . . . . . . . . . . . . . . . . . . — — 2,811 3,173
Net Asset Value per Unit . . . . . . . . . . . . . . . . . . . . . . . . . . . . . . . . . . . . . . . . . . — — 9.56 10.79
Class M
Units in Issue . . . . . . . . . . . . . . . . . . . . . . . . . . . . . . . . . . . . . . . . . . . . . . . . . . . . — — 113,576 866,344
Net Assets . . . . . . . . . . . . . . . . . . . . . . . . . . . . . . . . . . . . . . . . . . . . . . . . . . . . . . — — 1,062,761 9,276,023
Net Asset Value per Unit . . . . . . . . . . . . . . . . . . . . . . . . . . . . . . . . . . . . . . . . . . — — ¤ 5.94 ¤ 7.92
Class Q
Units in Issue . . . . . . . . . . . . . . . . . . . . . . . . . . . . . . . . . . . . . . . . . . . . . . . . . . . . — — 294 294
Net Assets . . . . . . . . . . . . . . . . . . . . . . . . . . . . . . . . . . . . . . . . . . . . . . . . . . . . . . — — 2,492 2,832
Net Asset Value per Unit . . . . . . . . . . . . . . . . . . . . . . . . . . . . . . . . . . . . . . . . . . — — 8.47 9.63
* The George Putnam (U.S. Equity and Bond) Fund terminated on 20 February 2008.
** Putnam Global Equity Multi-Alpha Fund Class I Units were redesignated as Class A Units on 11 July 2007.
129
THE ACCOMPANYING NOTES FORM AN INTEGRAL PART OF THESE FINANCIAL STATEMENTS.
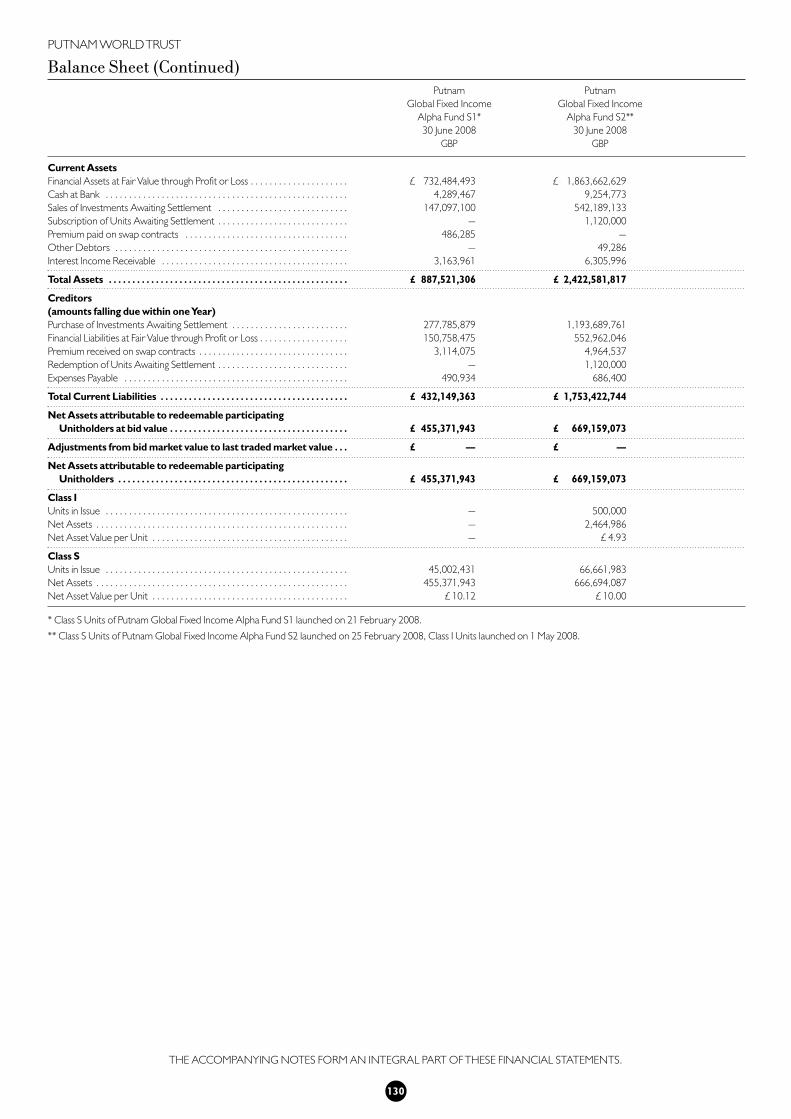
PUTNAM WORLD TRUST
Balance Sheet (Continued)Putnam Putnam
Global Fixed Income Global Fixed Income
Alpha Fund S1* Alpha Fund S2**
30 June 2008 30 June 2008
GBP GBP
Current Assets
Financial Assets at Fair Value through Profit or Loss . . . . . . . . . . . . . . . . . . . . . £ 732,484,493 £ 1,863,662,629
Cash at Bank . . . . . . . . . . . . . . . . . . . . . . . . . . . . . . . . . . . . . . . . . . . . . . . . . . . . 4,289,467 9,254,773
Sales of Investments Awaiting Settlement . . . . . . . . . . . . . . . . . . . . . . . . . . . . 147,097,100 542,189,133
Subscription of Units Awaiting Settlement . . . . . . . . . . . . . . . . . . . . . . . . . . . . — 1,120,000
Premium paid on swap contracts . . . . . . . . . . . . . . . . . . . . . . . . . . . . . . . . . . . 486,285 —
Other Debtors . . . . . . . . . . . . . . . . . . . . . . . . . . . . . . . . . . . . . . . . . . . . . . . . . . — 49,286
Interest Income Receivable . . . . . . . . . . . . . . . . . . . . . . . . . . . . . . . . . . . . . . . . 3,163,961 6,305,996
Total Assets . . . . . . . . . . . . . . . . . . . . . . . . . . . . . . . . . . . . . . . . . . . . . . . . . . . £ 887,521,306 £ 2,422,581,817
Creditors
(amounts falling due within one Year)
Purchase of Investments Awaiting Settlement . . . . . . . . . . . . . . . . . . . . . . . . . 277,785,879 1,193,689,761
Financial Liabilities at Fair Value through Profit or Loss . . . . . . . . . . . . . . . . . . . 150,758,475 552,962,046
Premium received on swap contracts . . . . . . . . . . . . . . . . . . . . . . . . . . . . . . . . 3,114,075 4,964,537
Redemption of Units Awaiting Settlement . . . . . . . . . . . . . . . . . . . . . . . . . . . . — 1,120,000
Expenses Payable . . . . . . . . . . . . . . . . . . . . . . . . . . . . . . . . . . . . . . . . . . . . . . . . 490,934 686,400
Total Current Liabilities . . . . . . . . . . . . . . . . . . . . . . . . . . . . . . . . . . . . . . . . £ 432,149,363 £ 1,753,422,744
Net Assets attributable to redeemable participating
Unitholders at bid value . . . . . . . . . . . . . . . . . . . . . . . . . . . . . . . . . . . . . . £ 455,371,943 £ 669,159,073
Adjustments from bid market value to last traded market value . . . £ — £ —
Net Assets attributable to redeemable participating
Unitholders . . . . . . . . . . . . . . . . . . . . . . . . . . . . . . . . . . . . . . . . . . . . . . . . . £ 455,371,943 £ 669,159,073
Class I
Units in Issue . . . . . . . . . . . . . . . . . . . . . . . . . . . . . . . . . . . . . . . . . . . . . . . . . . . . — 500,000
Net Assets . . . . . . . . . . . . . . . . . . . . . . . . . . . . . . . . . . . . . . . . . . . . . . . . . . . . . . — 2,464,986
Net Asset Value per Unit . . . . . . . . . . . . . . . . . . . . . . . . . . . . . . . . . . . . . . . . . . — £ 4.93
Class S
Units in Issue . . . . . . . . . . . . . . . . . . . . . . . . . . . . . . . . . . . . . . . . . . . . . . . . . . . . 45,002,431 66,661,983
Net Assets . . . . . . . . . . . . . . . . . . . . . . . . . . . . . . . . . . . . . . . . . . . . . . . . . . . . . . 455,371,943 666,694,087
Net Asset Value per Unit . . . . . . . . . . . . . . . . . . . . . . . . . . . . . . . . . . . . . . . . . . £ 10.12 £ 10.00
* Class S Units of Putnam Global Fixed Income Alpha Fund S1 launched on 21 February 2008.
** Class S Units of Putnam Global Fixed Income Alpha Fund S2 launched on 25 February 2008, Class I Units launched on 1 May 2008.
130
THE ACCOMPANYING NOTES FORM AN INTEGRAL PART OF THESE FINANCIAL STATEMENTS.

PUTNAM WORLD TRUST
Balance Sheet (Continued)Putnam Putnam
Global Growth Global High Yield
Fund Bond Fund
30 June 2008 30 June 2007 30 June 2008 30 June 2007
USD USD USD USD
Current Assets
Financial Assets at Fair Value through Profit or Loss . . . . . . . . . . . . . . . . . . . . . $ 14,497,909 $ 24,980,370 $ 276,517,076 $ 41,846,715
Cash at Bank . . . . . . . . . . . . . . . . . . . . . . . . . . . . . . . . . . . . . . . . . . . . . . . . . . . . 19,982 1,411 352,762 —
Sales of Investments Awaiting Settlement . . . . . . . . . . . . . . . . . . . . . . . . . . . . 138,184 100,060 404,128 217,310
Subscription of Units Awaiting Settlement . . . . . . . . . . . . . . . . . . . . . . . . . . . . 3,321 — 102,825 —
Dividend Income Receivable . . . . . . . . . . . . . . . . . . . . . . . . . . . . . . . . . . . . . . . 19,064 15,881 10,771 1,671
Interest Income Receivable . . . . . . . . . . . . . . . . . . . . . . . . . . . . . . . . . . . . . . . . — — 5,251,087 777,307
Other Debtors . . . . . . . . . . . . . . . . . . . . . . . . . . . . . . . . . . . . . . . . . . . . . . . . . . — 5,038 4,160 23,640
Total Assets . . . . . . . . . . . . . . . . . . . . . . . . . . . . . . . . . . . . . . . . . . . . . . . . . . . $ 14,678,460 $ 25,102,760 $ 282,642,809 $ 42,866,643
Creditors
(amounts falling due within one Year)
Purchase of Investments Awaiting Settlement . . . . . . . . . . . . . . . . . . . . . . . . . 219,336 80,626 858,879 —
Financial Liabilities at Fair Value through Profit and Loss . . . . . . . . . . . . . . . . . — — 528,904 —
Redemption of Units Awaiting Settlement . . . . . . . . . . . . . . . . . . . . . . . . . . . . 3,000 191,908 227,219 —
Expenses Payable . . . . . . . . . . . . . . . . . . . . . . . . . . . . . . . . . . . . . . . . . . . . . . . . 79,978 199,208 739,567 258,780
Bank Overdraft . . . . . . . . . . . . . . . . . . . . . . . . . . . . . . . . . . . . . . . . . . . . . . . . . . — — — 82,962
Total Current Liabilities excluding net assets attributable
to participating Unitholders . . . . . . . . . . . . . . . . . . . . . . . . . . . . . . . . . . $ 302,314 $ 471,742 $ 2,354,569 $ 341,742
Net Assets attributable to redeemable participating
Unitholders at bid value . . . . . . . . . . . . . . . . . . . . . . . . . . . . . . . . . . . . . . $ 14,376,146 $ 24,631,018 $ 280,288,240 $ 42,524,901
Adjustments from bid market value to last traded market value . . . $ 8,742 $ 23,948 $ — $ 15,083
Net Assets attributable to redeemable participating
Unitholders . . . . . . . . . . . . . . . . . . . . . . . . . . . . . . . . . . . . . . . . . . . . . . . . . $ 14,384,888 $ 24,654,966 $ 280,288,240 $ 42,539,984
Class A
Units in Issue . . . . . . . . . . . . . . . . . . . . . . . . . . . . . . . . . . . . . . . . . . . . . . . . . . . . 393,593 681,071 540,356 653,258
Net Assets . . . . . . . . . . . . . . . . . . . . . . . . . . . . . . . . . . . . . . . . . . . . . . . . . . . . . . 6,984,553 13,727,530 3,595,445 4,819,190
Net Asset Value per Unit . . . . . . . . . . . . . . . . . . . . . . . . . . . . . . . . . . . . . . . . . . 17.75 20.16 6.65 7.38
Class B
Units in Issue . . . . . . . . . . . . . . . . . . . . . . . . . . . . . . . . . . . . . . . . . . . . . . . . . . . . 450,940 585,395 1,003,663 1,417,602
Net Assets . . . . . . . . . . . . . . . . . . . . . . . . . . . . . . . . . . . . . . . . . . . . . . . . . . . . . . 7,348,272 10,887,966 6,602,635 10,345,118
Net Asset Value per Unit . . . . . . . . . . . . . . . . . . . . . . . . . . . . . . . . . . . . . . . . . . 16.30 18.60 6.58 7.30
Class C
Units in Issue . . . . . . . . . . . . . . . . . . . . . . . . . . . . . . . . . . . . . . . . . . . . . . . . . . . . — — 59,172 80,127
Net Assets . . . . . . . . . . . . . . . . . . . . . . . . . . . . . . . . . . . . . . . . . . . . . . . . . . . . . . — — 467,486 715,850
Net Asset Value per Unit . . . . . . . . . . . . . . . . . . . . . . . . . . . . . . . . . . . . . . . . . . — — 7.90 8.93
Class E
Units in Issue . . . . . . . . . . . . . . . . . . . . . . . . . . . . . . . . . . . . . . . . . . . . . . . . . . . . — — 76,706 74,157
Net Assets . . . . . . . . . . . . . . . . . . . . . . . . . . . . . . . . . . . . . . . . . . . . . . . . . . . . . . — — 919,489 855,901
Net Asset Value per Unit . . . . . . . . . . . . . . . . . . . . . . . . . . . . . . . . . . . . . . . . . . — — ¤ 7.61 ¤ 8.53
Class I
Units in Issue . . . . . . . . . . . . . . . . . . . . . . . . . . . . . . . . . . . . . . . . . . . . . . . . . . . . 2,840 1,903 103,430,646 9,252,282
Net Assets . . . . . . . . . . . . . . . . . . . . . . . . . . . . . . . . . . . . . . . . . . . . . . . . . . . . . . 52,063 39,470 268,013,558 25,035,608
Net Asset Value per Unit . . . . . . . . . . . . . . . . . . . . . . . . . . . . . . . . . . . . . . . . . . 18.33 20.74 2.59 2.71
Class S
Units in Issue . . . . . . . . . . . . . . . . . . . . . . . . . . . . . . . . . . . . . . . . . . . . . . . . . . . . — — 73,994 70,387
Net Assets . . . . . . . . . . . . . . . . . . . . . . . . . . . . . . . . . . . . . . . . . . . . . . . . . . . . . . — — 689,131 768,317
Net Asset Value per Unit . . . . . . . . . . . . . . . . . . . . . . . . . . . . . . . . . . . . . . . . . . — — £ 4.67 £ 5.44
Class T
Units in Issue . . . . . . . . . . . . . . . . . . . . . . . . . . . . . . . . . . . . . . . . . . . . . . . . . . . . — — 72 —
Net Assets . . . . . . . . . . . . . . . . . . . . . . . . . . . . . . . . . . . . . . . . . . . . . . . . . . . . . . — — 496 —
Net Asset Value per Unit . . . . . . . . . . . . . . . . . . . . . . . . . . . . . . . . . . . . . . . . . . — — 6.90 —
131
THE ACCOMPANYING NOTES FORM AN INTEGRAL PART OF THESE FINANCIAL STATEMENTS.
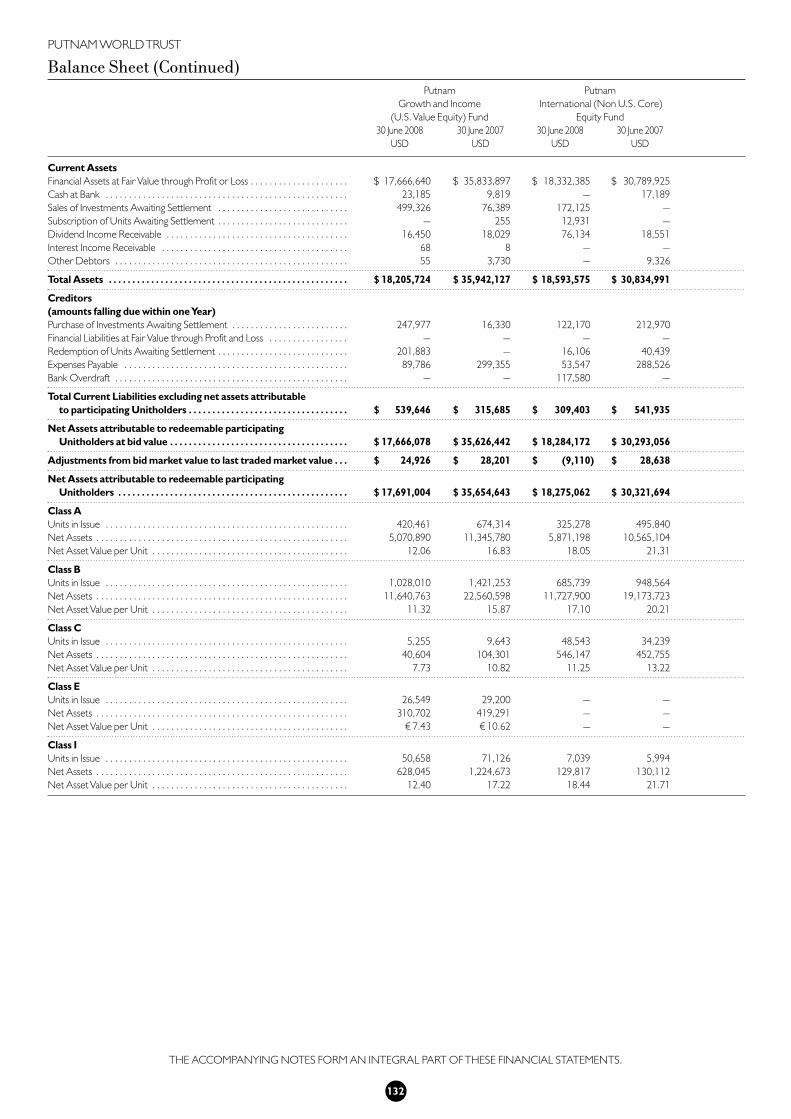
PUTNAM WORLD TRUST
Balance Sheet (Continued)Putnam Putnam
Growth and Income International (Non U.S. Core)
(U.S. Value Equity) Fund Equity Fund
30 June 2008 30 June 2007 30 June 2008 30 June 2007
USD USD USD USD
Current Assets
Financial Assets at Fair Value through Profit or Loss . . . . . . . . . . . . . . . . . . . . . $ 17,666,640 $ 35,833,897 $ 18,332,385 $ 30,789,925
Cash at Bank . . . . . . . . . . . . . . . . . . . . . . . . . . . . . . . . . . . . . . . . . . . . . . . . . . . . 23,185 9,819 — 17,189
Sales of Investments Awaiting Settlement . . . . . . . . . . . . . . . . . . . . . . . . . . . . 499,326 76,389 172,125 —
Subscription of Units Awaiting Settlement . . . . . . . . . . . . . . . . . . . . . . . . . . . . — 255 12,931 —
Dividend Income Receivable . . . . . . . . . . . . . . . . . . . . . . . . . . . . . . . . . . . . . . . 16,450 18,029 76,134 18,551
Interest Income Receivable . . . . . . . . . . . . . . . . . . . . . . . . . . . . . . . . . . . . . . . . 68 8 — —
Other Debtors . . . . . . . . . . . . . . . . . . . . . . . . . . . . . . . . . . . . . . . . . . . . . . . . . . 55 3,730 — 9,326
Total Assets . . . . . . . . . . . . . . . . . . . . . . . . . . . . . . . . . . . . . . . . . . . . . . . . . . . $ 18,205,724 $ 35,942,127 $ 18,593,575 $ 30,834,991
Creditors
(amounts falling due within one Year)
Purchase of Investments Awaiting Settlement . . . . . . . . . . . . . . . . . . . . . . . . . 247,977 16,330 122,170 212,970
Financial Liabilities at Fair Value through Profit and Loss . . . . . . . . . . . . . . . . . — — — —
Redemption of Units Awaiting Settlement . . . . . . . . . . . . . . . . . . . . . . . . . . . . 201,883 — 16,106 40,439
Expenses Payable . . . . . . . . . . . . . . . . . . . . . . . . . . . . . . . . . . . . . . . . . . . . . . . . 89,786 299,355 53,547 288,526
Bank Overdraft . . . . . . . . . . . . . . . . . . . . . . . . . . . . . . . . . . . . . . . . . . . . . . . . . . — — 117,580 —
Total Current Liabilities excluding net assets attributable
to participating Unitholders . . . . . . . . . . . . . . . . . . . . . . . . . . . . . . . . . . $ 539,646 $ 315,685 $ 309,403 $ 541,935
Net Assets attributable to redeemable participating
Unitholders at bid value . . . . . . . . . . . . . . . . . . . . . . . . . . . . . . . . . . . . . . $ 17,666,078 $ 35,626,442 $ 18,284,172 $ 30,293,056
Adjustments from bid market value to last traded market value . . . $ 24,926 $ 28,201 $ (9,110) $ 28,638
Net Assets attributable to redeemable participating
Unitholders . . . . . . . . . . . . . . . . . . . . . . . . . . . . . . . . . . . . . . . . . . . . . . . . . $ 17,691,004 $ 35,654,643 $ 18,275,062 $ 30,321,694
Class A
Units in Issue . . . . . . . . . . . . . . . . . . . . . . . . . . . . . . . . . . . . . . . . . . . . . . . . . . . . 420,461 674,314 325,278 495,840
Net Assets . . . . . . . . . . . . . . . . . . . . . . . . . . . . . . . . . . . . . . . . . . . . . . . . . . . . . . 5,070,890 11,345,780 5,871,198 10,565,104
Net Asset Value per Unit . . . . . . . . . . . . . . . . . . . . . . . . . . . . . . . . . . . . . . . . . . 12.06 16.83 18.05 21.31
Class B
Units in Issue . . . . . . . . . . . . . . . . . . . . . . . . . . . . . . . . . . . . . . . . . . . . . . . . . . . . 1,028,010 1,421,253 685,739 948,564
Net Assets . . . . . . . . . . . . . . . . . . . . . . . . . . . . . . . . . . . . . . . . . . . . . . . . . . . . . . 11,640,763 22,560,598 11,727,900 19,173,723
Net Asset Value per Unit . . . . . . . . . . . . . . . . . . . . . . . . . . . . . . . . . . . . . . . . . . 11.32 15.87 17.10 20.21
Class C
Units in Issue . . . . . . . . . . . . . . . . . . . . . . . . . . . . . . . . . . . . . . . . . . . . . . . . . . . . 5,255 9,643 48,543 34,239
Net Assets . . . . . . . . . . . . . . . . . . . . . . . . . . . . . . . . . . . . . . . . . . . . . . . . . . . . . . 40,604 104,301 546,147 452,755
Net Asset Value per Unit . . . . . . . . . . . . . . . . . . . . . . . . . . . . . . . . . . . . . . . . . . 7.73 10.82 11.25 13.22
Class E
Units in Issue . . . . . . . . . . . . . . . . . . . . . . . . . . . . . . . . . . . . . . . . . . . . . . . . . . . . 26,549 29,200 — —
Net Assets . . . . . . . . . . . . . . . . . . . . . . . . . . . . . . . . . . . . . . . . . . . . . . . . . . . . . . 310,702 419,291 — —
Net Asset Value per Unit . . . . . . . . . . . . . . . . . . . . . . . . . . . . . . . . . . . . . . . . . . ¤ 7.43 ¤ 10.62 — —
Class I
Units in Issue . . . . . . . . . . . . . . . . . . . . . . . . . . . . . . . . . . . . . . . . . . . . . . . . . . . . 50,658 71,126 7,039 5,994
Net Assets . . . . . . . . . . . . . . . . . . . . . . . . . . . . . . . . . . . . . . . . . . . . . . . . . . . . . . 628,045 1,224,673 129,817 130,112
Net Asset Value per Unit . . . . . . . . . . . . . . . . . . . . . . . . . . . . . . . . . . . . . . . . . . 12.40 17.22 18.44 21.71
132
THE ACCOMPANYING NOTES FORM AN INTEGRAL PART OF THESE FINANCIAL STATEMENTS.
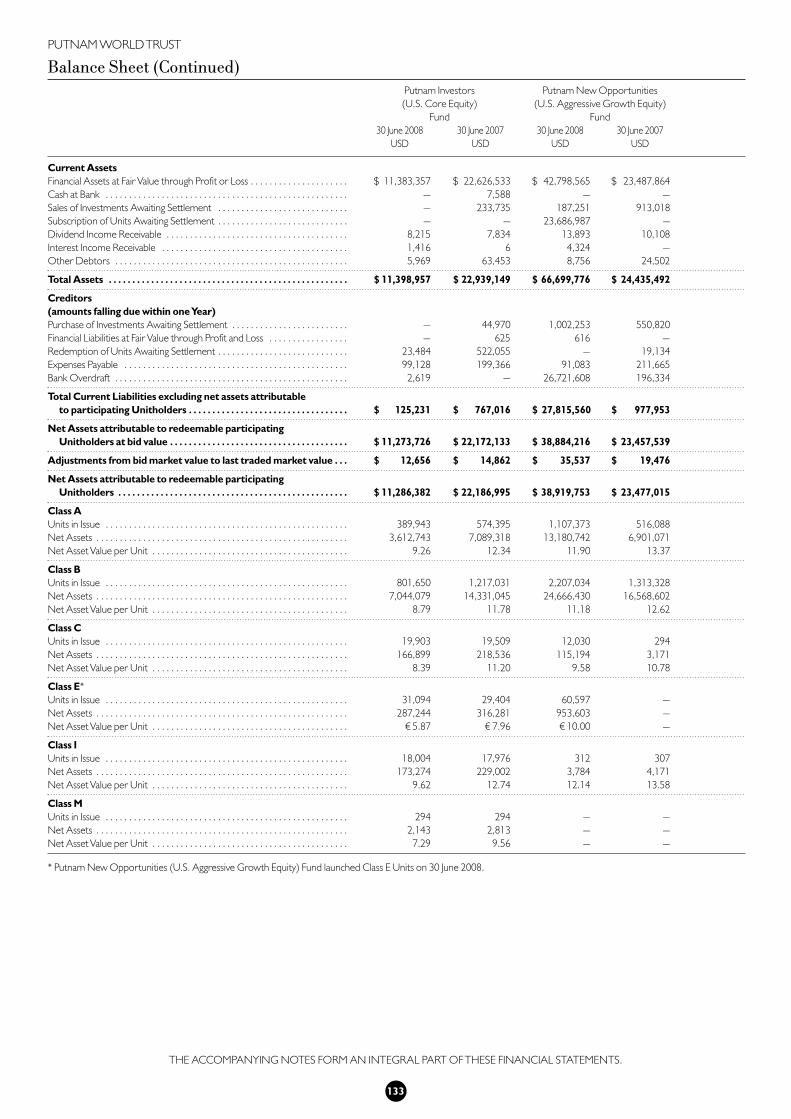
PUTNAM WORLD TRUST
Balance Sheet (Continued)Putnam Investors Putnam New Opportunities
(U.S. Core Equity) (U.S. Aggressive Growth Equity)
Fund Fund
30 June 2008 30 June 2007 30 June 2008 30 June 2007
USD USD USD USD
Current Assets
Financial Assets at Fair Value through Profit or Loss . . . . . . . . . . . . . . . . . . . . . $ 11,383,357 $ 22,626,533 $ 42,798,565 $ 23,487,864
Cash at Bank . . . . . . . . . . . . . . . . . . . . . . . . . . . . . . . . . . . . . . . . . . . . . . . . . . . . — 7,588 — —
Sales of Investments Awaiting Settlement . . . . . . . . . . . . . . . . . . . . . . . . . . . . — 233,735 187,251 913,018
Subscription of Units Awaiting Settlement . . . . . . . . . . . . . . . . . . . . . . . . . . . . — — 23,686,987 —
Dividend Income Receivable . . . . . . . . . . . . . . . . . . . . . . . . . . . . . . . . . . . . . . . 8,215 7,834 13,893 10,108
Interest Income Receivable . . . . . . . . . . . . . . . . . . . . . . . . . . . . . . . . . . . . . . . . 1,416 6 4,324 —
Other Debtors . . . . . . . . . . . . . . . . . . . . . . . . . . . . . . . . . . . . . . . . . . . . . . . . . . 5,969 63,453 8,756 24,502
Total Assets . . . . . . . . . . . . . . . . . . . . . . . . . . . . . . . . . . . . . . . . . . . . . . . . . . . $ 11,398,957 $ 22,939,149 $ 66,699,776 $ 24,435,492
Creditors
(amounts falling due within one Year)
Purchase of Investments Awaiting Settlement . . . . . . . . . . . . . . . . . . . . . . . . . — 44,970 1,002,253 550,820
Financial Liabilities at Fair Value through Profit and Loss . . . . . . . . . . . . . . . . . — 625 616 —
Redemption of Units Awaiting Settlement . . . . . . . . . . . . . . . . . . . . . . . . . . . . 23,484 522,055 — 19,134
Expenses Payable . . . . . . . . . . . . . . . . . . . . . . . . . . . . . . . . . . . . . . . . . . . . . . . . 99,128 199,366 91,083 211,665
Bank Overdraft . . . . . . . . . . . . . . . . . . . . . . . . . . . . . . . . . . . . . . . . . . . . . . . . . . 2,619 — 26,721,608 196,334
Total Current Liabilities excluding net assets attributable
to participating Unitholders . . . . . . . . . . . . . . . . . . . . . . . . . . . . . . . . . . $ 125,231 $ 767,016 $ 27,815,560 $ 977,953
Net Assets attributable to redeemable participating
Unitholders at bid value . . . . . . . . . . . . . . . . . . . . . . . . . . . . . . . . . . . . . . $ 11,273,726 $ 22,172,133 $ 38,884,216 $ 23,457,539
Adjustments from bid market value to last traded market value . . . $ 12,656 $ 14,862 $ 35,537 $ 19,476
Net Assets attributable to redeemable participating
Unitholders . . . . . . . . . . . . . . . . . . . . . . . . . . . . . . . . . . . . . . . . . . . . . . . . . $ 11,286,382 $ 22,186,995 $ 38,919,753 $ 23,477,015
Class A
Units in Issue . . . . . . . . . . . . . . . . . . . . . . . . . . . . . . . . . . . . . . . . . . . . . . . . . . . . 389,943 574,395 1,107,373 516,088
Net Assets . . . . . . . . . . . . . . . . . . . . . . . . . . . . . . . . . . . . . . . . . . . . . . . . . . . . . . 3,612,743 7,089,318 13,180,742 6,901,071
Net Asset Value per Unit . . . . . . . . . . . . . . . . . . . . . . . . . . . . . . . . . . . . . . . . . . 9.26 12.34 11.90 13.37
Class B
Units in Issue . . . . . . . . . . . . . . . . . . . . . . . . . . . . . . . . . . . . . . . . . . . . . . . . . . . . 801,650 1,217,031 2,207,034 1,313,328
Net Assets . . . . . . . . . . . . . . . . . . . . . . . . . . . . . . . . . . . . . . . . . . . . . . . . . . . . . . 7,044,079 14,331,045 24,666,430 16,568,602
Net Asset Value per Unit . . . . . . . . . . . . . . . . . . . . . . . . . . . . . . . . . . . . . . . . . . 8.79 11.78 11.18 12.62
Class C
Units in Issue . . . . . . . . . . . . . . . . . . . . . . . . . . . . . . . . . . . . . . . . . . . . . . . . . . . . 19,903 19,509 12,030 294
Net Assets . . . . . . . . . . . . . . . . . . . . . . . . . . . . . . . . . . . . . . . . . . . . . . . . . . . . . . 166,899 218,536 115,194 3,171
Net Asset Value per Unit . . . . . . . . . . . . . . . . . . . . . . . . . . . . . . . . . . . . . . . . . . 8.39 11.20 9.58 10.78
Class E*
Units in Issue . . . . . . . . . . . . . . . . . . . . . . . . . . . . . . . . . . . . . . . . . . . . . . . . . . . . 31,094 29,404 60,597 —
Net Assets . . . . . . . . . . . . . . . . . . . . . . . . . . . . . . . . . . . . . . . . . . . . . . . . . . . . . . 287,244 316,281 953,603 —
Net Asset Value per Unit . . . . . . . . . . . . . . . . . . . . . . . . . . . . . . . . . . . . . . . . . . ¤ 5.87 ¤ 7.96 ¤ 10.00 —
Class I
Units in Issue . . . . . . . . . . . . . . . . . . . . . . . . . . . . . . . . . . . . . . . . . . . . . . . . . . . . 18,004 17,976 312 307
Net Assets . . . . . . . . . . . . . . . . . . . . . . . . . . . . . . . . . . . . . . . . . . . . . . . . . . . . . . 173,274 229,002 3,784 4,171
Net Asset Value per Unit . . . . . . . . . . . . . . . . . . . . . . . . . . . . . . . . . . . . . . . . . . 9.62 12.74 12.14 13.58
Class M
Units in Issue . . . . . . . . . . . . . . . . . . . . . . . . . . . . . . . . . . . . . . . . . . . . . . . . . . . . 294 294 — —
Net Assets . . . . . . . . . . . . . . . . . . . . . . . . . . . . . . . . . . . . . . . . . . . . . . . . . . . . . . 2,143 2,813 — —
Net Asset Value per Unit . . . . . . . . . . . . . . . . . . . . . . . . . . . . . . . . . . . . . . . . . . 7.29 9.56 — —
* Putnam New Opportunities (U.S. Aggressive Growth Equity) Fund launched Class E Units on 30 June 2008.
133
THE ACCOMPANYING NOTES FORM AN INTEGRAL PART OF THESE FINANCIAL STATEMENTS.

PUTNAM WORLD TRUST
Balance Sheet (Continued)Putnam Putnam
Opportunistic Value Total Return
Fund* Fund
30 June 2008 30 June 2007 30 June 2008 30 June 2007
USD USD USD USD
Current Assets
Financial Assets at Fair Value through Profit or Loss . . . . . . . . . . . . . . . . . . . . . $ — $ 4,068,397 $ 140,874,509 $ 40,349,699
Cash at Bank . . . . . . . . . . . . . . . . . . . . . . . . . . . . . . . . . . . . . . . . . . . . . . . . . . . . (1,677) 52,989 1,043,608 590,918
Sales of Investments Awaiting Settlement . . . . . . . . . . . . . . . . . . . . . . . . . . . . — 2,275 8,092,699 1,086,339
Subscription of Units Awaiting Settlement . . . . . . . . . . . . . . . . . . . . . . . . . . . . — — 2,839,525 891,232
Dividend Income Receivable . . . . . . . . . . . . . . . . . . . . . . . . . . . . . . . . . . . . . . . — 2,703 133,170 23,703
Interest Income Receivable . . . . . . . . . . . . . . . . . . . . . . . . . . . . . . . . . . . . . . . . — — 551,787 188,727
Other Debtors . . . . . . . . . . . . . . . . . . . . . . . . . . . . . . . . . . . . . . . . . . . . . . . . . . — 16,775 322,835 102,645
Total Assets . . . . . . . . . . . . . . . . . . . . . . . . . . . . . . . . . . . . . . . . . . . . . . . . . . . $ (1,677) $ 4,143,139 $153,858,133 $ 43,233,263
Creditors
(amounts falling due within one Year)
Purchase of Investments Awaiting Settlement . . . . . . . . . . . . . . . . . . . . . . . . . — — 19,295,264 4,738,147
Financial Liabilities at Fair Value through Profit or Loss . . . . . . . . . . . . . . . . . . . — — 8,255,086 296,926
Premium received on swap contracts . . . . . . . . . . . . . . . . . . . . . . . . . . . . . . . . — — 1,828,164 —
Redemption of Units Awaiting Settlement . . . . . . . . . . . . . . . . . . . . . . . . . . . . — 2,480 1,685,823 —
Distributions Payable . . . . . . . . . . . . . . . . . . . . . . . . . . . . . . . . . . . . . . . . . . . . . — — — —
Expenses Payable . . . . . . . . . . . . . . . . . . . . . . . . . . . . . . . . . . . . . . . . . . . . . . . . (1,677) 94,768 224,425 257,815
Total Current Liabilities . . . . . . . . . . . . . . . . . . . . . . . . . . . . . . . . . . . . . . . . $ (1,677) $ 97,248 $ 31,288,762 $ 5,292,888
Net Assets attributable to redeemable participating
Unitholders at bid value . . . . . . . . . . . . . . . . . . . . . . . . . . . . . . . . . . . . . . $ — $ 4,045,891 $122,569,371 $ 37,940,375
Adjustments from bid market value to last traded market value . . . $ — $ 3,533 $ (47,815) $ 82,526
Net Assets attributable to redeemable participating
Unitholders . . . . . . . . . . . . . . . . . . . . . . . . . . . . . . . . . . . . . . . . . . . . . . . . . $ — $ 4,049,424 $122,521,556 $ 38,022,901
Class A**
Units in Issue . . . . . . . . . . . . . . . . . . . . . . . . . . . . . . . . . . . . . . . . . . . . . . . . . . . . — 114,352 4,717,394 2,267,866
Net Assets . . . . . . . . . . . . . . . . . . . . . . . . . . . . . . . . . . . . . . . . . . . . . . . . . . . . . . — 1,375,816 47,552,606 21,222,288
Net Asset Value per Unit . . . . . . . . . . . . . . . . . . . . . . . . . . . . . . . . . . . . . . . . . . — 12.03 10.08 9.36
Class B***
Units in Issue . . . . . . . . . . . . . . . . . . . . . . . . . . . . . . . . . . . . . . . . . . . . . . . . . . . . — 28,025 54,906 —
Net Assets . . . . . . . . . . . . . . . . . . . . . . . . . . . . . . . . . . . . . . . . . . . . . . . . . . . . . . — 332,121 495,147 —
Net Asset Value per Unit . . . . . . . . . . . . . . . . . . . . . . . . . . . . . . . . . . . . . . . . . . — 11.85 9.02 —
Class C***
Units in Issue . . . . . . . . . . . . . . . . . . . . . . . . . . . . . . . . . . . . . . . . . . . . . . . . . . . . — 2,202 311,282 —
Net Assets . . . . . . . . . . . . . . . . . . . . . . . . . . . . . . . . . . . . . . . . . . . . . . . . . . . . . . — 26,286 2,814,968 —
Net Asset Value per Unit . . . . . . . . . . . . . . . . . . . . . . . . . . . . . . . . . . . . . . . . . . — 11.94 9.04 —
Class E
Units in Issue . . . . . . . . . . . . . . . . . . . . . . . . . . . . . . . . . . . . . . . . . . . . . . . . . . . . — 81,810 600,927 58,779
Net Assets . . . . . . . . . . . . . . . . . . . . . . . . . . . . . . . . . . . . . . . . . . . . . . . . . . . . . . — 1,020,463 6,722,697 524,697
Net Asset Value per Unit . . . . . . . . . . . . . . . . . . . . . . . . . . . . . . . . . . . . . . . . . . — ¤ 9.22 ¤ 7.10 ¤ 6.60
Class I
Units in Issue . . . . . . . . . . . . . . . . . . . . . . . . . . . . . . . . . . . . . . . . . . . . . . . . . . . . — 107,505 — —
Net Assets . . . . . . . . . . . . . . . . . . . . . . . . . . . . . . . . . . . . . . . . . . . . . . . . . . . . . . — 1,294,738 — —
Net Asset Value per Unit . . . . . . . . . . . . . . . . . . . . . . . . . . . . . . . . . . . . . . . . . . — 12.04 — —
Class J
Units in Issue . . . . . . . . . . . . . . . . . . . . . . . . . . . . . . . . . . . . . . . . . . . . . . . . . . . . — — 294 294
Net Assets . . . . . . . . . . . . . . . . . . . . . . . . . . . . . . . . . . . . . . . . . . . . . . . . . . . . . . — — 3,000 2,785
Net Asset Value per Unit . . . . . . . . . . . . . . . . . . . . . . . . . . . . . . . . . . . . . . . . . . — — 10.20 9.47
Class M
Units in Issue . . . . . . . . . . . . . . . . . . . . . . . . . . . . . . . . . . . . . . . . . . . . . . . . . . . . — — 5,325,787 1,626,227
Net Assets . . . . . . . . . . . . . . . . . . . . . . . . . . . . . . . . . . . . . . . . . . . . . . . . . . . . . . — — 64,351,762 15,741,209
Net Asset Value per Unit . . . . . . . . . . . . . . . . . . . . . . . . . . . . . . . . . . . . . . . . . . — — ¤ 7.67 ¤ 7.16
Class Q
Units in Issue . . . . . . . . . . . . . . . . . . . . . . . . . . . . . . . . . . . . . . . . . . . . . . . . . . . . — — 294 294
Net Assets . . . . . . . . . . . . . . . . . . . . . . . . . . . . . . . . . . . . . . . . . . . . . . . . . . . . . . — — 2,819 2,596
Net Asset Value per Unit . . . . . . . . . . . . . . . . . . . . . . . . . . . . . . . . . . . . . . . . . . — — 9.58 8.83
Class S
Units in Issue . . . . . . . . . . . . . . . . . . . . . . . . . . . . . . . . . . . . . . . . . . . . . . . . . . . . — — 58,880 58,880
Net Assets . . . . . . . . . . . . . . . . . . . . . . . . . . . . . . . . . . . . . . . . . . . . . . . . . . . . . . — — 578,557 529,326
Net Asset Value per Unit . . . . . . . . . . . . . . . . . . . . . . . . . . . . . . . . . . . . . . . . . . — — £ 4.93 £ 4.48
* Putnam Opportunistic Value Fund terminated on 20 February 2008.
** Putnam Total Return Fund Class I Units were redesignated as Class A Units on 11 July 2007.
*** Putnam Total Return Fund launched Class B and Class C Units on 10 July 2007.
134
THE ACCOMPANYING NOTES FORM AN INTEGRAL PART OF THESE FINANCIAL STATEMENTS.

PUTNAM WORLD TRUST
Balance Sheet (Continued)Putnam Putnam
U.S. Liquid Assets U.S. Small-Cap Value
Fund Equity Fund
30 June 2008 30 June 2007 30 June 2008 30 June 2007
USD USD USD USD
Current Assets
Financial Assets at Fair Value through Profit or Loss . . . . . . . . . . . . . . . . . . . . . $ 51,598,705 $ 68,017,421 $ 15,396,907 $ 119,967,874
Cash at Bank . . . . . . . . . . . . . . . . . . . . . . . . . . . . . . . . . . . . . . . . . . . . . . . . . . . . — — — 103,427
Sales of Investments Awaiting Settlement . . . . . . . . . . . . . . . . . . . . . . . . . . . . — — 38,207 629,931
Subscription of Units Awaiting Settlement . . . . . . . . . . . . . . . . . . . . . . . . . . . . — — 450 28,378
Dividend Income Receivable . . . . . . . . . . . . . . . . . . . . . . . . . . . . . . . . . . . . . . . — 5,080 21,755 121,636
Interest Income Receivable . . . . . . . . . . . . . . . . . . . . . . . . . . . . . . . . . . . . . . . . 65,811 116,550 841 104
Other Debtors . . . . . . . . . . . . . . . . . . . . . . . . . . . . . . . . . . . . . . . . . . . . . . . . . . 49,466 76,811 1,448 88,005
Total Assets . . . . . . . . . . . . . . . . . . . . . . . . . . . . . . . . . . . . . . . . . . . . . . . . . . . $ 51,713,982 $ 68,215,862 $ 15,459,608 $120,939,355
Creditors
(amounts falling due within one Year)
Purchase of Investments Awaiting Settlement . . . . . . . . . . . . . . . . . . . . . . . . . 299,083 — 16,752 458,010
Redemption of Units Awaiting Settlement . . . . . . . . . . . . . . . . . . . . . . . . . . . . — — 12,218 7,623
Distributions Payable . . . . . . . . . . . . . . . . . . . . . . . . . . . . . . . . . . . . . . . . . . . . . 29,716 51,409 — —
Expenses Payable . . . . . . . . . . . . . . . . . . . . . . . . . . . . . . . . . . . . . . . . . . . . . . . . — 135,173 119,139 686,060
Bank Overdraft . . . . . . . . . . . . . . . . . . . . . . . . . . . . . . . . . . . . . . . . . . . . . . . . . . 64,512 4,578 23,128 —
Total Current Liabilities . . . . . . . . . . . . . . . . . . . . . . . . . . . . . . . . . . . . . . . . $ 393,311 $ 191,160 $ 171,237 $ 1,151,693
Net Assets attributable to redeemable participating
Unitholders at bid value . . . . . . . . . . . . . . . . . . . . . . . . . . . . . . . . . . . . . . $ 51,320,671 $ 68,024,702 $ 15,288,371 $ 119,787,662
Adjustments from bid market value to last traded market value . . . $ — $ 424 $ 14,337 $ 157,660
Net Assets attributable to redeemable participating
Unitholders . . . . . . . . . . . . . . . . . . . . . . . . . . . . . . . . . . . . . . . . . . . . . . . . . $ 51,320,671 $ 68,025,126 $ 15,302,708 $ 119,945,322
Class A
Units in Issue . . . . . . . . . . . . . . . . . . . . . . . . . . . . . . . . . . . . . . . . . . . . . . . . . . . . 4,268,711 3,249,362 817,661 1,548,593
Net Assets . . . . . . . . . . . . . . . . . . . . . . . . . . . . . . . . . . . . . . . . . . . . . . . . . . . . . . 4,271,556 3,249,362 9,918,033 27,673,582
Net Asset Value per Unit . . . . . . . . . . . . . . . . . . . . . . . . . . . . . . . . . . . . . . . . . . 1.00 1.00 12.13 17.87
Class B
Units in Issue . . . . . . . . . . . . . . . . . . . . . . . . . . . . . . . . . . . . . . . . . . . . . . . . . . . . 2,993,119 3,522,521 171,643 332,225
Net Assets . . . . . . . . . . . . . . . . . . . . . . . . . . . . . . . . . . . . . . . . . . . . . . . . . . . . . . 2,994,572 3,522,521 2,008,732 5,756,460
Net Asset Value per Unit . . . . . . . . . . . . . . . . . . . . . . . . . . . . . . . . . . . . . . . . . . 1.00 1.00 11.70 17.33
Class C
Units in Issue . . . . . . . . . . . . . . . . . . . . . . . . . . . . . . . . . . . . . . . . . . . . . . . . . . . . 3,294 3,189 65,697 50,811
Net Assets . . . . . . . . . . . . . . . . . . . . . . . . . . . . . . . . . . . . . . . . . . . . . . . . . . . . . . 3,297 3,189 549,506 628,138
Net Asset Value per Unit . . . . . . . . . . . . . . . . . . . . . . . . . . . . . . . . . . . . . . . . . . 1.00 1.00 8.36 12.36
Class E
Units in Issue . . . . . . . . . . . . . . . . . . . . . . . . . . . . . . . . . . . . . . . . . . . . . . . . . . . . — — 96,551 118,965
Net Assets . . . . . . . . . . . . . . . . . . . . . . . . . . . . . . . . . . . . . . . . . . . . . . . . . . . . . . — — 1,604,988 2,548,743
Net Asset Value per Unit . . . . . . . . . . . . . . . . . . . . . . . . . . . . . . . . . . . . . . . . . . — — ¤ 10.56 ¤ 15.84
Class I
Units in Issue . . . . . . . . . . . . . . . . . . . . . . . . . . . . . . . . . . . . . . . . . . . . . . . . . . . . 44,041,684 61,250,054 97,751 317,510
Net Assets . . . . . . . . . . . . . . . . . . . . . . . . . . . . . . . . . . . . . . . . . . . . . . . . . . . . . . 44,051,246 61,250,054 1,219,535 5,813,455
Net Asset Value per Unit . . . . . . . . . . . . . . . . . . . . . . . . . . . . . . . . . . . . . . . . . . 1.00 1.00 12.48 18.31
Class M
Units in Issue . . . . . . . . . . . . . . . . . . . . . . . . . . . . . . . . . . . . . . . . . . . . . . . . . . . . — — 294 8,205,502
Net Assets . . . . . . . . . . . . . . . . . . . . . . . . . . . . . . . . . . . . . . . . . . . . . . . . . . . . . . — — 1,914 77,524,944
Net Asset Value per Unit . . . . . . . . . . . . . . . . . . . . . . . . . . . . . . . . . . . . . . . . . . — — 6.51 9.45
135
THE ACCOMPANYING NOTES FORM AN INTEGRAL PART OF THESE FINANCIAL STATEMENTS.

PUTNAM WORLD TRUST
Balance Sheet (Continued)Putnam Vista
(U.S. Mid-Cap Equity)
Fund*
30 June 2008 30 June 2007
USD USD
Current Assets
Financial Assets at Fair Value through Profit or Loss . . . . . . . . . . . . . . . . . . . . . $ — $ 41,069,106
Cash at Bank . . . . . . . . . . . . . . . . . . . . . . . . . . . . . . . . . . . . . . . . . . . . . . . . . . . . 185,763 —
Sales of Investments Awaiting Settlement . . . . . . . . . . . . . . . . . . . . . . . . . . . . — 1,843,436
Dividend Income Receivable . . . . . . . . . . . . . . . . . . . . . . . . . . . . . . . . . . . . . . . — 12,534
Other Debtors . . . . . . . . . . . . . . . . . . . . . . . . . . . . . . . . . . . . . . . . . . . . . . . . . . — 14,327
Total Assets . . . . . . . . . . . . . . . . . . . . . . . . . . . . . . . . . . . . . . . . . . . . . . . . . . . $ 185,763 $ 42,939,403
Creditors
(amounts falling due within one Year)
Purchase of Investments Awaiting Settlement . . . . . . . . . . . . . . . . . . . . . . . . . — 1,484,544
Redemption of Units Awaiting Settlement . . . . . . . . . . . . . . . . . . . . . . . . . . . . — 205,726
Expenses Payable . . . . . . . . . . . . . . . . . . . . . . . . . . . . . . . . . . . . . . . . . . . . . . . . 185,763 344,646
Bank Overdraft . . . . . . . . . . . . . . . . . . . . . . . . . . . . . . . . . . . . . . . . . . . . . . . . . . — 415,578
Total Current Liabilities . . . . . . . . . . . . . . . . . . . . . . . . . . . . . . . . . . . . . . . . $ 185,763 $ 2,450,494
Net Assets attributable to redeemable participating
Unitholders at bid value . . . . . . . . . . . . . . . . . . . . . . . . . . . . . . . . . . . . . . $ — $ 40,488,909
Adjustments from bid market value to last traded market value . . . $ — $ 35,218
Net Assets attributable to redeemable participating
Unitholders . . . . . . . . . . . . . . . . . . . . . . . . . . . . . . . . . . . . . . . . . . . . . . . . . $ — $ 40,524,127
Class A
Units in Issue . . . . . . . . . . . . . . . . . . . . . . . . . . . . . . . . . . . . . . . . . . . . . . . . . . . . — 665,590
Net Assets . . . . . . . . . . . . . . . . . . . . . . . . . . . . . . . . . . . . . . . . . . . . . . . . . . . . . . — 16,974,434
Net Asset Value per Unit . . . . . . . . . . . . . . . . . . . . . . . . . . . . . . . . . . . . . . . . . . — 25.50
Class B
Units in Issue . . . . . . . . . . . . . . . . . . . . . . . . . . . . . . . . . . . . . . . . . . . . . . . . . . . . — 952,863
Net Assets . . . . . . . . . . . . . . . . . . . . . . . . . . . . . . . . . . . . . . . . . . . . . . . . . . . . . . — 22,451,513
Net Asset Value per Unit . . . . . . . . . . . . . . . . . . . . . . . . . . . . . . . . . . . . . . . . . . — 23.56
Class C
Units in Issue . . . . . . . . . . . . . . . . . . . . . . . . . . . . . . . . . . . . . . . . . . . . . . . . . . . . — 14,371
Net Assets . . . . . . . . . . . . . . . . . . . . . . . . . . . . . . . . . . . . . . . . . . . . . . . . . . . . . . — 161,791
Net Asset Value per Unit . . . . . . . . . . . . . . . . . . . . . . . . . . . . . . . . . . . . . . . . . . — 11.26
Class E
Units in Issue . . . . . . . . . . . . . . . . . . . . . . . . . . . . . . . . . . . . . . . . . . . . . . . . . . . . — 69,979
Net Assets . . . . . . . . . . . . . . . . . . . . . . . . . . . . . . . . . . . . . . . . . . . . . . . . . . . . . . — 936,328
Net Asset Value per Unit . . . . . . . . . . . . . . . . . . . . . . . . . . . . . . . . . . . . . . . . . . — ¤ 9.89
Class I
Units in Issue . . . . . . . . . . . . . . . . . . . . . . . . . . . . . . . . . . . . . . . . . . . . . . . . . . . . — 2
Net Assets . . . . . . . . . . . . . . . . . . . . . . . . . . . . . . . . . . . . . . . . . . . . . . . . . . . . . . — 61
Net Asset Value per Unit . . . . . . . . . . . . . . . . . . . . . . . . . . . . . . . . . . . . . . . . . . — 30.50
* Putnam Vista (U.S. Mid-Cap Equity) Fund merged with Putnam New Opportunities (U.S. Aggressive Growth Equity) Fund on 27 June 2008.
136
THE ACCOMPANYING NOTES FORM AN INTEGRAL PART OF THESE FINANCIAL STATEMENTS.
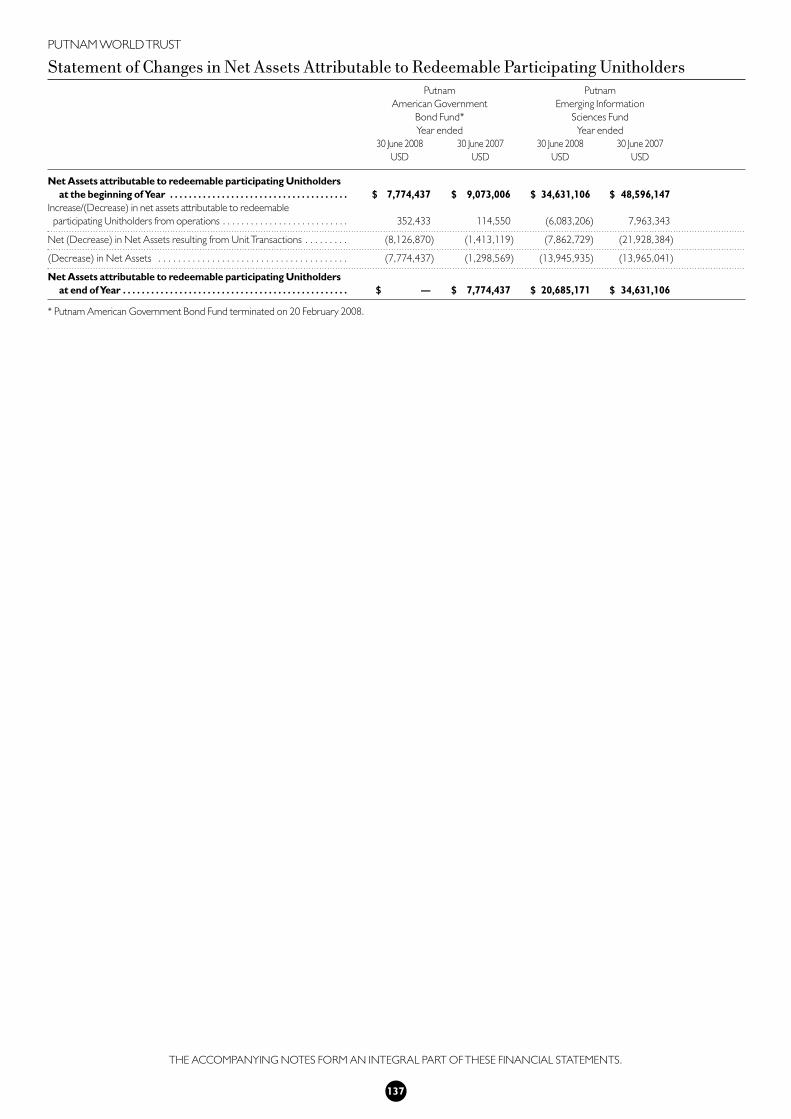
PUTNAM WORLD TRUST
Statement of Changes in Net Assets Attributable to Redeemable Participating UnitholdersPutnam Putnam
American Government Emerging Information
Bond Fund* Sciences Fund
Year ended Year ended
30 June 2008 30 June 2007 30 June 2008 30 June 2007
USD USD USD USD
Net Assets attributable to redeemable participating Unitholders
at the beginning of Year . . . . . . . . . . . . . . . . . . . . . . . . . . . . . . . . . . . . . . $ 7,774,437 $ 9,073,006 $ 34,631,106 $ 48,596,147
Increase/(Decrease) in net assets attributable to redeemable
participating Unitholders from operations . . . . . . . . . . . . . . . . . . . . . . . . . . . 352,433 114,550 (6,083,206) 7,963,343
Net (Decrease) in Net Assets resulting from Unit Transactions . . . . . . . . . (8,126,870) (1,413,119) (7,862,729) (21,928,384)
(Decrease) in Net Assets . . . . . . . . . . . . . . . . . . . . . . . . . . . . . . . . . . . . . . . (7,774,437) (1,298,569) (13,945,935) (13,965,041)
Net Assets attributable to redeemable participating Unitholders
at end of Year . . . . . . . . . . . . . . . . . . . . . . . . . . . . . . . . . . . . . . . . . . . . . . . . $ — $ 7,774,437 $ 20,685,171 $ 34,631,106
* Putnam American Government Bond Fund terminated on 20 February 2008.
137
THE ACCOMPANYING NOTES FORM AN INTEGRAL PART OF THESE FINANCIAL STATEMENTS.

PUTNAM WORLD TRUST
Statement of Changes in Net Assets Attributable to Redeemable Participating Unitholders(Continued)
Putnam Putnam
Emerging Markets Europe Equity
Debt Fund Fund
Year ended Year ended
30 June 2008 30 June 2007 30 June 2008 30 June 2007
USD USD USD USD
Net Assets attributable to redeemable participating Unitholders
at the beginning of Year . . . . . . . . . . . . . . . . . . . . . . . . . . . . . . . . . . . . . . $ 2,720,265 $ 2,479,753 $ 16,206,418 $ 13,754,175
(Decrease)/Increase in net assets attributable to redeemable
participating Unitholders from operations . . . . . . . . . . . . . . . . . . . . . . . . . . . (5,502) 128,637 (2,546,549) 4,347,914
Net Increase/(Decrease) in Net Assets resulting from Unit Transactions . 126,216 111,875 (2,366,667) (1,895,671)
Increase/(Decrease) in Net Assets . . . . . . . . . . . . . . . . . . . . . . . . . . . . . . . . 120,714 240,512 (4,913,216) 2,452,243
Net Assets attributable to redeemable participating Unitholders
at end of Year . . . . . . . . . . . . . . . . . . . . . . . . . . . . . . . . . . . . . . . . . . . . . . . . $ 2,840,979 $ 2,720,265 $ 11,293,202 $ 16,206,418
138
THE ACCOMPANYING NOTES FORM AN INTEGRAL PART OF THESE FINANCIAL STATEMENTS.

PUTNAM WORLD TRUST
Statement of Changes in Net Assets Attributable to Redeemable Participating Unitholders(Continued)
The George Putnam Putnam
(U.S. Equity and Bond) Global Equity Multi-Alpha
Fund* Fund
Year ended Year ended
30 June 2008 30 June 2007 30 June 2008 30 June 2007
USD USD USD USD
Net Assets attributable to redeemable participating Unitholders
at the beginning of Year . . . . . . . . . . . . . . . . . . . . . . . . . . . . . . . . . . . . . . $ 12,361,969 $ 14,477,567 $ 27,610,315 $ —
(Decrease)/Increase in net assets attributable to redeemable
participating Unitholders from operations . . . . . . . . . . . . . . . . . . . . . . . . . . . (1,007,583) 1,557,284 (3,804,825) 4,438,849
Net (Decrease)/Increase in Net Assets resulting from Unit Transactions . (11,354,386) (3,672,882) (7,488,632) 23,171,466
(Decrease)/Increase in Net Assets . . . . . . . . . . . . . . . . . . . . . . . . . . . . . . . . (12,361,969) (2,115,598) (11,293,457) 27,610,315
Net Assets attributable to redeemable participating Unitholders
at end of Year . . . . . . . . . . . . . . . . . . . . . . . . . . . . . . . . . . . . . . . . . . . . . . . . $ — $ 12,361,969 $ 16,316,858 $ 27,610,315
* The George Putnam (U.S. Equity and Bond) Fund terminated on 20 February 2008.
139
THE ACCOMPANYING NOTES FORM AN INTEGRAL PART OF THESE FINANCIAL STATEMENTS.

PUTNAM WORLD TRUST
Statement of Changes in Net Assets Attributable to Redeemable Participating Unitholders(Continued)
Putnam Putnam
Global Fixed Income Global Fixed Income
Alpha Fund S1* Alpha Fund S2**
Year ended Year ended
30 June 2008 30 June 2008
GBP GBP
Net Assets attributable to redeemable participating Unitholders
at the beginning of Year . . . . . . . . . . . . . . . . . . . . . . . . . . . . . . . . . . . . . . £ — £ —
Increase/(Decrease) in net assets attributable to redeemable
participating Unitholders from operations . . . . . . . . . . . . . . . . . . . . . . . . . . . 5,347,392 (250,207)
Net Increase in Net Assets resulting from Unit Transactions . . . . . . . . . . . 450,024,551 669,409,280
Increase in Net Assets . . . . . . . . . . . . . . . . . . . . . . . . . . . . . . . . . . . . . . . . . . 455,371,943 669,159,073
Net Assets attributable to redeemable participating Unitholders
at end of Year . . . . . . . . . . . . . . . . . . . . . . . . . . . . . . . . . . . . . . . . . . . . . . . . £ 455,371,943 £ 669,159,073
* Putnam Global Fixed Income Alpha Fund S1 launched on 21 February 2008.
** Putnam Global Fixed Income Alpha Fund S2 launched on 25 February 2008.
140
THE ACCOMPANYING NOTES FORM AN INTEGRAL PART OF THESE FINANCIAL STATEMENTS.

PUTNAM WORLD TRUST
Statement of Changes in Net Assets Attributable to Redeemable Participating Unitholders(Continued)
Putnam Putnam
Global Growth Global High Yield
Fund Bond Fund
Year ended Year ended
30 June 2008 30 June 2007 30 June 2008 30 June 2007
USD USD USD USD
Net Assets attributable to redeemable participating Unitholders
at the beginning of Year . . . . . . . . . . . . . . . . . . . . . . . . . . . . . . . . . . . . . . $ 24,654,966 $ 24,481,742 $ 42,539,984 $ 23,766,314
(Decrease)/Increase in net assets attributable to redeemable
participating Unitholders from operations . . . . . . . . . . . . . . . . . . . . . . . . . . . (2,767,222) 5,106,632 (5,319,190) 959,261
Net (Decrease)/Increase in Net Assets resulting from Unit Transactions . (7,502,856) (4,933,408) 243,067,446 17,814,409
(Decrease)/Increase in Net Assets . . . . . . . . . . . . . . . . . . . . . . . . . . . . . . . . (10,270,078) 173,224 237,748,256 18,773,670
Net Assets attributable to redeemable participating Unitholders
at end of Year . . . . . . . . . . . . . . . . . . . . . . . . . . . . . . . . . . . . . . . . . . . . . . . . $ 14,384,888 $ 24,654,966 $ 280,288,240 $ 42,539,984
141
THE ACCOMPANYING NOTES FORM AN INTEGRAL PART OF THESE FINANCIAL STATEMENTS.

PUTNAM WORLD TRUST
Statement of Changes in Net Assets Attributable to Redeemable Participating Unitholders(Continued)
Putnam Putnam
Growth and Income International (Non U.S. Core)
(U.S. Value Equity) Fund Equity Fund
Year ended Year ended
30 June 2008 30 June 2007 30 June 2008 30 June 2007
USD USD USD USD
Net Assets attributable to redeemable participating Unitholders
at the beginning of Year . . . . . . . . . . . . . . . . . . . . . . . . . . . . . . . . . . . . . . $ 35,654,643 $ 41,113,346 $ 30,321,694 $ 32,677,903
(Decrease)/Increase in net assets attributable to redeemable
participating Unitholders from operations . . . . . . . . . . . . . . . . . . . . . . . . . . . (8,555,042) 6,115,404 (4,189,157) 7,238,537
Net (Decrease) in Net Assets resulting from Unit Transactions . . . . . . . . . (9,408,597) (11,574,107) (7,857,475) (9,594,746)
(Decrease) in Net Assets . . . . . . . . . . . . . . . . . . . . . . . . . . . . . . . . . . . . . . . (17,963,639) (5,458,703) (12,046,632) (2,356,209)
Net Assets attributable to redeemable participating Unitholders
at end of Year . . . . . . . . . . . . . . . . . . . . . . . . . . . . . . . . . . . . . . . . . . . . . . . . $ 17,691,004 $ 35,654,643 $ 18,275,062 $ 30,321,694
142
THE ACCOMPANYING NOTES FORM AN INTEGRAL PART OF THESE FINANCIAL STATEMENTS.

PUTNAM WORLD TRUST
Statement of Changes in Net Assets Attributable to Redeemable Participating Unitholders(Continued)
Putnam Investors Putnam New Opportunities
(U.S. Core Equity) (U.S. Aggressive Growth Equity)
Fund Fund
Year ended Year ended
30 June 2008 30 June 2007 30 June 2008 30 June 2007
USD USD USD USD
Net Assets attributable to redeemable participating Unitholders
at the beginning of Year . . . . . . . . . . . . . . . . . . . . . . . . . . . . . . . . . . . . . . $ 22,186,995 $ 30,521,137 $ 23,477,015 $ 32,606,942
(Decrease)/Increase in net assets attributable to redeemable
participating Unitholders from operations . . . . . . . . . . . . . . . . . . . . . . . . . . . (4,849,760) 4,141,612 (5,915,196) 3,542,816
Net (Decrease)/Increase in Net Assets resulting from Unit Transactions . (6,050,853) (12,475,754) 21,357,934 (12,672,743)
(Decrease)/Increase in Net Assets . . . . . . . . . . . . . . . . . . . . . . . . . . . . . . . . (10,900,613) (8,334,142) 15,442,738 (9,129,927)
Net Assets attributable to redeemable participating Unitholders
at end of Year . . . . . . . . . . . . . . . . . . . . . . . . . . . . . . . . . . . . . . . . . . . . . . . . $ 11,286,382 $ 22,186,995 $ 38,919,753 $ 23,477,015
143
THE ACCOMPANYING NOTES FORM AN INTEGRAL PART OF THESE FINANCIAL STATEMENTS.

PUTNAM WORLD TRUST
Statement of Changes in Net Assets Attributable to Redeemable Participating Unitholders(Continued)
Putnam Putnam
Opportunistic Value Total Return
Fund* Fund
Year ended Year ended
30 June 2008 30 June 2007 30 June 2008 30 June 2007
USD USD USD USD
Net Assets attributable to redeemable participating Unitholders
at the beginning of Year . . . . . . . . . . . . . . . . . . . . . . . . . . . . . . . . . . . . . . $ 4,049,424 $ 34,926,182 $ 38,022,901 $ —
(Decrease)/Increase in net assets attributable to redeemable
participating Unitholders from operations . . . . . . . . . . . . . . . . . . . . . . . . . . . (618,830) 7,143,908 9,495,519 2,208,172
Net (Decrease)/Increase in Net Assets resulting from Unit Transactions . (3,430,594) (38,020,666) 75,003,136 35,814,729
(Decrease)/Increase in Net Assets . . . . . . . . . . . . . . . . . . . . . . . . . . . . . . . . (4,049,424) (30,876,758) 84,498,655 38,022,901
Net Assets attributable to redeemable participating Unitholders
at end of Year . . . . . . . . . . . . . . . . . . . . . . . . . . . . . . . . . . . . . . . . . . . . . . . . $ — $ 4,049,424 $ 122,521,556 $ 38,022,901
* Putnam Opportunistic Value Fund terminated on 20 February 2008.
144
THE ACCOMPANYING NOTES FORM AN INTEGRAL PART OF THESE FINANCIAL STATEMENTS.

PUTNAM WORLD TRUST
Statement of Changes in Net Assets Attributable to Redeemable Participating Unitholders(Continued)
Putnam Putnam
U.S. Liquid Assets U.S. Small-Cap Value
Fund Equity Fund
Year ended Year ended
30 June 2008 30 June 2007 30 June 2008 30 June 2007
USD USD USD USD
Net Assets attributable to redeemable participating Unitholders
at the beginning of Year . . . . . . . . . . . . . . . . . . . . . . . . . . . . . . . . . . . . . . $ 68,025,126 $ 7,824,369 $ 119,945,322 $ 117,114,407
Increase/(Decrease) in net assets attributable to redeemable
participating Unitholders from operations . . . . . . . . . . . . . . . . . . . . . . . . . . . 13,862 — (27,417,122) 18,525,243
Net (Decrease)/Increase in Net Assets resulting from Unit Transactions . (16,718,317) 60,200,757 (77,225,492) (15,694,328)
(Decrease)/Increase in Net Assets . . . . . . . . . . . . . . . . . . . . . . . . . . . . . . . . (16,704,455) 60,200,757 (104,642,614) 2,830,915
Net Assets attributable to redeemable participating Unitholders
at end of Year . . . . . . . . . . . . . . . . . . . . . . . . . . . . . . . . . . . . . . . . . . . . . . . . $ 51,320,671 $ 68,025,126 $ 15,302,708 $ 119,945,322
145
THE ACCOMPANYING NOTES FORM AN INTEGRAL PART OF THESE FINANCIAL STATEMENTS.

PUTNAM WORLD TRUST
Statement of Changes in Net Assets Attributable to Redeemable Participating Unitholders(Continued)
Putnam Vista
(U.S. Mid-Cap Equity)
Fund*
Year ended
30 June 2008 30 June 2007
USD USD
Net Assets attributable to redeemable participating Unitholders
at the beginning of Year . . . . . . . . . . . . . . . . . . . . . . . . . . . . . . . . . . . . . . $ 40,524,127 $ 56,738,075
(Decrease)/Increase in net assets attributable to redeemable
participating Unitholders from operations . . . . . . . . . . . . . . . . . . . . . . . . . . . (3,633,720) 3,575,825
Net (Decrease) in Net Assets resulting from Unit Transactions . . . . . . . . . (36,890,407) (19,789,773)
(Decrease) in Net Assets . . . . . . . . . . . . . . . . . . . . . . . . . . . . . . . . . . . . . . . (40,524,127) (16,213,948)
Net Assets attributable to redeemable participating Unitholders
at end of Year . . . . . . . . . . . . . . . . . . . . . . . . . . . . . . . . . . . . . . . . . . . . . . . . $ — $ 40,524,127
* Putnam Vista (U.S. Mid-Cap Equity) Fund merged with Putnam New Opportunities (U.S. Aggressive Growth Equity) Fund on 27 June 2008.
146
THE ACCOMPANYING NOTES FORM AN INTEGRAL PART OF THESE FINANCIAL STATEMENTS.

1. BASIS OF PRESENTATION
i) Basis of accounting
The financial statements have been prepared under the historical cost convention as modified to includeinvestments at valuation by the revaluation of financial assets and financial liabilities held at fair value throughprofit or loss. The financial statements of any Funds which terminated during the year or after the year end havebeen prepared on a termination basis.
The financial statements have been prepared in accordance with accounting standards generally accepted inIreland and in accordance with the European Communities (Undertakings for Collective Investment inTransferable Securities) Regulations 2003, (as amended). Accounting standards generally accepted in Ireland inpreparing financial statements giving a true and fair view are those issued by the Accounting Standards Boardand published by the Institute of Chartered Accountants in Ireland.
The Accounting Standards Board (“ASB”) has issued FRS 29 – Financial instruments; Disclosures (“FRS 29”).The objective of FRS 29 is to provide information about the Company’s exposure to material risks and how theCompany manages those risks. There is no impact on the classification and valuation of a Fund’s financialinstruments. FRS 29 is effective for accounting periods beginning on or after 1 January 2007.
The Fund has availed of the exemption available to open-ended investment funds under Financial ReportingStandard No. 1 (Revised) “Cash Flow Statement” not to prepare a cash flow statement.
ii) Critical accounting estimates and assumptions
Management makes estimates and assumptions concerning the future. The resulting accounting estimates will,by definition, seldom equal the related actual results. The estimates and assumptions that have a significant riskof causing a material adjustment to the carrying amounts of assets and liabilities within the next financial yearare outlined below.
Fair value of derivative financial instruments
The Trust may, from time to time, hold financial instruments that are not quoted in active markets, such as over-the-counter derivatives. Fair values of such instruments are determined by using valuation techniques.Where valuation techniques are used to determine fair value and they are validated and periodically reviewed byexperienced personnel at Putnam Investments (Ireland) Limited, or its affiliates, independent of the party thatcreated them. The prices used at the year end which have been sourced from a single broker source are the bestestimates of fair value as at the year end date. However, there is a degree of uncertainty in respect of these prices.It may not always be possible to close out the positions at the stated mark with the given counterparty. TheDirectors believe that the values arrived at are reasonable and prudent, however actual results may differ fromthese estimates and the differences could be material.
All the Trust’s financial assets and financial liabilities are held for the purpose of being traded.
147
Putnam World Trust————————————————————————————————————————————————————————————————————————————————————————————————————————————————————————————————————————————
Notes to the Financial Statements as at 30 June 2008

148
2. ACCOUNTING POLICIES
Significant accounting policies adopted by the Trust are as follows:
A) Investments
i) Valuation of Investments
Investments are reported at fair value. The fair value of financial instruments traded in active markets (such aspublicly traded derivatives and trading securities) is based on quoted bid prices for long positions and offerprices for short positions at the balance sheet date. Where any of the investments are not listed on RecognisedStock Exchanges such securities shall be valued at their probable realisation value as determined by theManager or its delegate, each of them being approved by the Trustee as a competent person for such purpose.
Classification
The Trust classifies its investments in debt and equity securities, and related derivatives, as financial assets orfinancial liabilities at the fair value through profit or loss. These financial assets and financial liabilities areclassified as held for trading or designated by the Trust’s Manager at fair value through profit or loss at inception.
Financial assets and financial liabilities designated at fair value through profit or loss at inception are those that aremanaged and their performance evaluated on a fair value basis in accordance with the Trust’s documented investmentstrategy. The Trust’s policy is for the Investment Advisor and the Board of Directors of the Manager to evaluate theinformation about these financial assets on a fair value basis together with other related financial information.
Fair value estimation
The fair value of financial instruments traded in active markets is based upon market prices at the balance sheetdate. The quoted market price used for financial assets held by the Trust is the current bid price; the appropriatequoted market price for financial liabilities is the current asking price. When the Trust holds derivatives withoffsetting market risks, it uses mid market prices as a basis for establishing fair values for the offsetting riskpositions and applies this mid price to the net open position, as appropriate.
The fair value of financial instruments that are not traded in an active market is determined by using valuationtechniques. The Trust uses a variety of methods and makes assumptions that are based on market conditionsexisting at each balance sheet date. Valuation techniques used include the use of comparable recent arm’s lengthtransactions, discounted cash flow analysis, option pricing models and other valuation techniques commonlyused by market participants.
Certain securities may be valued on the basis of a price provided by a single broker. Some Funds may invest insecurities with contractual cash flows, such as asset backed securities, collateralised mortgage obligations andcommercial mortgage backed securities, including securities backed by sub-prime mortgage loans. The value,liquidity and related income of these securities are sensitive to changes in economic conditions, including realestate values, delinquencies and/or defaults, and may be adversely affected by shifts in the market’s perceptionof the issuers and changes in interest rates.
Futures
Futures contracts are valued at the quoted daily settlement prices established by the exchange on which theytrade. The Fund and the broker agree to exchange an amount of cash equal to the daily fluctuation in the value ofthe futures contract. Such receipts or payments are known as “variation margin”. For open futures, changes inthe value of the contract are recognised as unrealised profits or losses by “marking-to-market” the value of thecontract at the Balance Sheet date. Gains or losses on open futures contracts are shown in the Schedule of
Putnam World Trust————————————————————————————————————————————————————————————————————————————————————————————————————————————————————————————————————————————
Notes to the Financial Statements as at 30 June 2008 (Continued)
149
Investments of each relevant Fund and as appropriate, on the Balance Sheet as part of Financial Assets at FairValue through Profit or Loss.
Swaptions
When the Funds enter into a swaption the amount of the premium paid or received is recorded as interestincome/expense in the Profit and Loss Account. Swaption agreements are fair valued on the date of valuationbased upon the underlying market value of the reference asset. Swaptions outstanding at the year end, if any, arelisted in the Fund’s Schedule of Investments.
When the Funds write a swaption, a premium is received by the Funds and the swaption is initially recognised asthe amount of the premium. The swaption is subsequently marked-to-market to reflect the fair value of theswaption written, which is reported as a liability on the Fund’s Balance Sheet. The difference between the premiumreceived and the fair value reported on the Balance Sheet gives rise to an unrealised gain/(loss). When a swaptionwhich the Fund has written is exercised, the amount of the premium originally received will offset the cost of theswap upon exercise of the option in arriving at the movement in unrealised gain or loss to be included in the Profitand Loss Account. Premiums received on swaptions written which expire unexercised are treated as realised gains.
When the Funds purchase a swaption, a premium is paid by the Funds and the swaption is initially recognised asthe amount of the premium. The swaption is subsequently marked-to-market to reflect the fair value of theswaption purchased, which is reported as an asset on the Fund’s Balance Sheet. When a swaption which the Fundholds is exercised, the amount of the premium originally paid will offset the cost of the swap upon exercise of theoption in arriving at the movement in unrealised gain or loss to be included in the Profit and Loss Account.Premiums paid from the purchase of swaptions which expire unexercised are treated as realised losses.
Options
The Funds may purchase and sell (write) call and put options on securities, securities indices and foreigncurrencies traded on a national securities exchange or in an over-the-counter market.
When the Funds write a covered call or a put option a premium is received by the Funds. An amount equal to thepremium is subsequently marked-to-market to reflect the fair value of the option written, which is reported as aliability on the Balance Sheet for each relevant Fund. The difference between the premium amount and the fairvalue reported on the Balance Sheet gives rise to an unrealised gain/(loss). When Funds purchases a call or a putoption a premium is paid by the Funds. The premium on purchased put options exercised is subtracted from theproceeds of the sale of the underlying security or foreign currency in determining the realised gain or loss. Thepremium on purchased call options exercised is included in determining initial fair value of the securities orforeign currency purchased. Premiums paid from the purchase of options which expire unexercised are treatedas realised losses. The option is subsequently marked-to-market to reflect the fair value of the option purchased,which is reported as an asset on the Balance Sheet for each relevant Fund.
The options are valued at close of business on the dealing day at the settlement price as provided by thecounterparty/broker and the values are independently verified, at a minimum, weekly. In the event of it beingimpossible or incorrect to carry out a valuation of a specific investment in accordance with the valuation rules,
Putnam World Trust————————————————————————————————————————————————————————————————————————————————————————————————————————————————————————————————————————————
Notes to the Financial Statements as at 30 June 2008 (Continued)
2. ACCOUNTING POLICIES (Continued)
A) Investments (Continued)
i) Valuation of Investments (Continued)
Futures (Continued)

Putnam World Trust————————————————————————————————————————————————————————————————————————————————————————————————————————————————————————————————————————————
Notes to the Financial Statements as at 30 June 2008 (Continued)
150
or if such valuation is not representative of a security’s fair market value, the Directors are entitled to use othergenerally recognised valuation methods in order to reach a proper valuation of that specific instrument,provided that such method of valuation has been approved by the Custodian and Trustee.
If an option which a Fund has written either expires on its stipulated expiration date or a Fund enters into a closingpurchase transaction, a Fund realises a gain (or loss, if the cost of a closing purchase transaction exceeds thepremium received when the option was sold) without regard to any unrealised gain or loss on the underlying security,and the liability related to such option is extinguished. If a call option which a Fund has written is exercised, a Fundrealises a capital gain or loss from the sale of the underlying security, and the proceeds from such sale are increasedby the premium originally received. When a put option which a Fund has written is exercised, the amount of thepremium originally received will reduce the cost of the security which a Fund purchases upon exercise of the option.
Total Return Swap Contracts
The Funds may enter into total return swap contracts, which are arrangements to exchange a market linkedreturn for a yearly payment, both based on a notional principal amount. To the extent that the total return of thesecurity, index or other financial measure underlying the transaction exceeds or falls short of the offsettinginterest rate obligation, the Fund will receive a payment from or make a payment to the counterpartyrespectively. Total return swap contracts are marked to market daily based upon quotations from marketmakers and the change, if any, is recorded as unrealised gain or loss. Payments received or made at the end of themeasurement year are recorded as realised gains or losses.
The Funds could be exposed to credit or market risk due to unfavourable changes in the fluctuation of interestrates or in the price of the underlying security or index, the possibility that there is no liquid market for theseagreements or that the counterparty may default on its obligation to perform. Total return swap contractsoutstanding at year end, if any, are listed in the Fund’s Schedule of Investments.
Interest Rate Swap Contracts
The Funds may enter into interest rate swap contracts, which are arrangements between two parties to exchangecash flows based on a notional principal amount, to manage the Fund’s exposure to interest rates. Interest rateswap contracts are marked to market daily based upon quotations from an independent pricing service or marketmakers and the change, if any, is recorded as unrealised gain or loss. Payments made or received are recorded aspart of realised gains or losses. The Funds could be exposed to credit or market risk due to unfavourable changes inthe fluctuation of interest rates or if the counterparty defaults on its obligation to perform. Interest rate swapcontracts outstanding at year end, if any, are listed in the Fund’s Schedule of Investments.
Credit Default Swap Contracts
The Funds may enter into credit default contracts where one party, the protection buyer, makes an upfront oryearly payment to a counter party, the protection seller, in exchange for the right to receive a contingentpayment. The maximum amount of the payment may equal the notional amount, at par, of the underlying indexor security as a result of a related credit event. Payments are made upon a credit default event of the disclosed
2. ACCOUNTING POLICIES (Continued)
A) Investments (Continued)
i) Valuation of Investments (Continued)
Options (Continued)

151
primary referenced obligation or all other equally ranked obligations of the reference entity. An upfrontpayment received by the Funds, as the protection seller, is recorded as a liability on the Funds’ books.An upfront payment made by the Funds, as the protection buyer, is recorded as an asset on the Funds’ books.Yearly payments received or paid by the Fund are recorded as realised gains or losses. The credit defaultcontracts are marked to market daily based upon quotations from an independent pricing service or marketmakers and the change, if any, is recorded as unrealised gain or loss. Payments received or made as a result of acredit event or termination of the contract are recognised, net of a proportional amount of the upfront payment,as realised gains or losses. In addition to bearing the risk that the credit event will occur, the Funds could beexposed to market risk due to unfavourable changes in interest rates or in the price of the underlying security orindex, the possibility that the Fund may be unable to close out its position at the same time or at the same priceas if it had purchased comparable publicly traded securities or that the counterparty may default on itsobligation to perform. Risks of loss may exceed amounts recognised on the Balance Sheet. Credit defaultcontracts outstanding at year end, if any, are listed in the Funds’ Schedule of Investments.
TBA Purchase Commitments (to be announced)
Certain Funds may enter into “TBA” (To Be Announced) purchase commitments to purchase securities for afixed unit price at a future date beyond customary settlement time. Although the unit price has beenestablished, the principal value has not been finalised.
The Funds hold, and maintain until settlement date, cash or high-grade debt obligations in an amount sufficientto meet the purchase price, or the Funds may enter into offsetting contracts for the forward sale of othersecurities they own.
Income on the securities will not be earned until settlement date. TBA purchase commitments may beconsidered securities in themselves, and involve a risk of loss if the value of the security to be purchased declinesprior to settlement date, which risk is in addition to the risk of decline in the value of the Funds’ other assets.
Unsettled TBA purchase commitments are valued at the current market value of the underlying securities,according to the procedures described under “Valuation of Investments” above.
Although the Funds may enter into TBA purchase commitments with the intention of acquiring securities fortheir portfolios or for delivery pursuant to options contracts they have entered into, the Funds may dispose of acommitment prior to settlement if the Investment Advisor deems it appropriate to do so.
The TBA is accounted for in line with the accounting policy for the underlying instruments.
TBA Sales Commitments
Certain Funds may enter into TBA sale commitments to hedge their portfolio positions or to sell mortgage-backed securities they own under delayed delivery arrangements. Proceeds of TBA sale commitments are notreceived until the contractual settlement date.
Putnam World Trust————————————————————————————————————————————————————————————————————————————————————————————————————————————————————————————————————————————
Notes to the Financial Statements as at 30 June 2008 (Continued)
2. ACCOUNTING POLICIES (Continued)
A) Investments (Continued)
i) Valuation of Investments (Continued)
Credit Default Swap Contracts (Continued)

Putnam World Trust————————————————————————————————————————————————————————————————————————————————————————————————————————————————————————————————————————————
Notes to the Financial Statements as at 30 June 2008 (Continued)
152
During the time a TBA sale commitment is outstanding, equivalent deliverable securities, or an offsetting TBApurchase commitment deliverable on or before the sale commitment date, are held as “cover” for the transaction.
Unsettled TBA sale commitments are valued at the current market value of the underlying securities, generallyaccording to the procedures described under the “Valuation of Investments” above. The contract is marked tomarket daily and the change in market value is recorded by the Fund as an unrealised gain or loss. If the TBAsale commitment is closed through the acquisition of an offsetting purchase commitment, the Funds realise again or loss. If the Funds deliver securities under the commitment, the Funds realise a gain or loss from the saleof the securities based upon the unit price established at the date the commitment was entered into.
Repurchase Agreements
Securities purchased under the agreements to resell are valued at Fair Value. Interest rates vary for eachrepurchase agreement and are set at the initiation of the agreement. Interest earned under such agreements isaccounted for on an accruals basis. It is the Fund’s policy to take custody of securities on a daily basis to protectthe Funds in the event the securities are not repurchased by the counterparty. The Funds will generally obtainadditional collateral if the market value of the underlying securities is less than the obligation to repurchaseagreement plus any accrued interest. In the event of default on the obligation to repurchase, the Funds have theright to liquidate the collateral and apply the proceeds in satisfaction of the obligation. In the event of default orbankruptcy by the counterparty to the agreement, realisation and or retention of the collateral or proceeds maybe subject to legal proceedings.
Counterparty
Goldman Sachs & Co. 610,000 15,065,535
Bank of America 35,783,000 21,130,027
Cash and Other Liquid Assets
Cash and other liquid assets will be valued at their face value with interest accrued, where applicable, at theclose of the regular trading session of the New York Stock Exchange (“NYSE”).
Accounting for Investments
Recognition/derecognition
Purchases and sales of investments are recognised on the day after the transaction takes place. Investments arederecognised when the rights to receive cash flows from the investments have expired or the Trust has transferredsubstantially all risks and rewards of ownership.
Measurement
Financial assets and financial liabilities at fair value through profit or loss are initially recognised at fair value.Transaction costs are expensed in the profit and loss account. Subsequent to initial recognition, all financialassets and financial liabilities at fair value though profit or loss are measured at fair value in accordance with thepolicies above. Gains and losses arising from changes in the fair value of the financial assets of liabilities at fairvalue through profit or loss category are presented in the profit and loss account in the period in which they arise.
Value
GBP
Value
US$
2. ACCOUNTING POLICIES (Continued)
A) Investments (Continued)
i) Valuation of Investments (Continued)
TBA Sales Commitments (Continued)

Net gains/(losses) on Investment Activities
In respect of each instrument type classified as financial instruments at fair value through profit or loss, themovement in unrealised gains/(losses) since the prior year end and realised gains/(losses) are included in netrealised and unrealised gains/(losses) on Financial Assets and Liabilities at fair value through profit or loss.
Realised gains and losses on investment transactions are calculated using the average cost method.
B) Income from Investments
i) Dividend Income
Dividend Income arising on the underlying equity investments of the Trust is recognised as income of the Truston the ex-dividend date.
ii) Bond Interest
Bond Interest is recognised as income of the Trust on an effective interest basis. The effective interest method isa method of calculating the amortised cost of a financial asset or financial liability and of allocating the interestincome or interest expense over the relevant period. The effective interest rate is the rate that exactly discountsestimated future cash payments or receipts throughout the expected life of the financial instrument, or a shorterperiod where appropriate, to the net carrying amount of the financial asset or financial liability. Whencalculating the effective interest rate, the Fund estimates cash flows considering all contractual terms of thefinancial instrument but does not consider future credit losses.
iii) Interest Income/Expense
Income arising on the underlying investments of the Trust is recognised as income of the Trust on an effectiveinterest basis.
Bank interest is recognised on an accruals basis.
Dividend and interest income are reported gross of non-reclaimable withholding tax and net of any tax credits.
C) Foreign Exchange Translation
i) Functional and Presentation Currency
Items included in the Trust’s financial statements are measured and reported using the currency of the primaryeconomic environment in which it operates (“the functional currency”). The Board of Directors of the Managerconsiders U.S. Dollars as the currency that most faithfully represents the economic effects of the underlyingtransactions, events and conditions. The U.S. Dollar is the currency in which the Trust measures itsperformance and reports its results, as well as the currency in which it receives subscriptions from its investors.
Assets and liabilities, including net assets attributable to holders of redeemable participating units, aretranslated at the closing rate at each balance sheet date. Exchange differences arising between the rate oftranslation of subscriptions and redemptions are also attributed to the holders of redeemable participating units.
Foreign currency transactions are translated into the functional currency using the exchange rates prevailing atthe dates of the transactions. Foreign exchange gains and losses resulting from the settlement of such
153
Putnam World Trust————————————————————————————————————————————————————————————————————————————————————————————————————————————————————————————————————————————
Notes to the Financial Statements as at 30 June 2008 (Continued)
2. ACCOUNTING POLICIES (Continued)
A) Investments (Continued)
i) Valuation of Investments (Continued)

transactions and from the translation at year-end exchange rates of monetary assets and liabilities denominatedin foreign currencies are recognised in the Profit and Loss Account.
ii) Forward Foreign Exchange Contracts
The Trust may enter into various types of forward currency contracts including Euro and Sterling Class levelhedging, foreign security hedging and security transaction level hedging. The unrealised gain or loss on openforward foreign exchange contracts is calculated by reference to the difference between the contracted rate and therate to close out the contract. Realised gains or losses include net gains on contracts, which have been settled oroffset by other contracts. For foreign security hedges and security transaction level hedges, realised and unrealisedgains and losses are allocated at the Fund level. For Euro and Sterling Class level hedges, these realised andunrealised gains and losses are allocated solely to the Euro and Sterling Unit Classes. While the Trust will attemptto hedge against the U.S. Dollar to Euro and Sterling currency exposure, there can be no guarantee that the value ofthe Euro and Sterling Classes will not be affected by the value of the Euro and Sterling relative to the U.S. Dollar.
D) Redeemable Participating Units
i) Redeemable participating units are redeemable at the Unitholder’s option and are classified as financial liabilities.
The participating unit can be put back to the Trust at any time for cash equal to a proportionate unit of theFund’s net asset value. The participating unit is carried at the redemption amount that is payable at the BalanceSheet date if the Unitholder exercised its right to put the unit back to the Trust.
ii) Distributions payable to holders of redeemable units
Proposed distributions to holders of redeemable units are recognised in the profit and loss account when theTrust incurs a legal or constructive obligation to pay such a distribution. The distribution on these redeemableshares is recognised in the profit and loss account as a finance cost. During the year, the Trust was grantedUK distributor status by HM Revenue & Customs for the year ending 30 June 2007. A similar application will bemade for the current year ended. There was no change in the nature of the Trust's business during the year.
E) Other Receivables and Payables
i) Receivables
Receivables are non-derivative financial assets with fixed or determinable payments that are not quoted in anactive market. Receivables are recognised initially at fair value plus transaction costs that are directlyattributable to their acquisition origination. They are subsequently measured at amortised cost.
ii) Payables
Payables are recognised initially at fair value and subsequently stated at amortised cost.
iii) Offsetting financial instruments
Financial assets and liabilities are offset and the net amount reported in the balance sheet when there is a legallyenforceable right to offset the recognised amounts and there is an intention to settle on a net basis, or realize theasset and settle the liability simultaneously.
154
Putnam World Trust————————————————————————————————————————————————————————————————————————————————————————————————————————————————————————————————————————————
Notes to the Financial Statements as at 30 June 2008 (Continued)
2. ACCOUNTING POLICIES (Continued)
C) Foreign Exchange Translation (Continued)
i) Functional and Presentation Currency (Continued)

3. NUMBER OF UNITS IN ISSUE AND NET ASSETS ATTRIBUTABLE TO REDEEMABLE PARTICIPATING
UNITHOLDERS
Each of the units entitles the holder to participate equally on a pro rata basis in the profits and dividends of the Fundsattributable to such units and to attend and vote at meetings of the Manager of the Trust represented by those units.No class of units confers on the holder thereof any preferential or pre-emptive rights or any rights to participate in theprofits and dividends of any other class of units or any voting rights in relation to matters relating solely to any otherclass of units. Each unit represents an undivided beneficial interest in the Funds. The return on an investment in theFunds will depend solely upon the investment performance of the assets in the Funds and the increase or decrease (asthe case may be) in the net asset value of the units. The amount payable to a unitholder in respect of each unit uponliquidation of the Funds will equal the net asset value per unit.
In accordance with the provisions of the Trust’s Trust Deed listed investments and investments with prices quoted inover-the-counter markets or by market makers are stated at the last traded price on the valuation day for the purpose ofdetermining net asset value per unit for subscriptions and redemptions and for various fee calculation. However, asstated in Note 2A(1), the accounting policy of the Funds for the purpose of compliance with FRS 26 and for reportingpurpose is to value its investments at the relevant bid or offer market prices on the Balance Sheet date.
As at 30 June 2008, the difference between the valuation stated in the financial statements of investments and thevaluation methodology indicated in the Trust’s Trust Deed, results in an increase in value of investments of US$20,023(2007: US$498,115). Net assets attributable to unitholders represent a liability on the Balance Sheet, carried at theredemption amount that would be payable at the Balance Sheet date if the unitholder exercised the right to redeem itsunits to the Trust. Consequently, the differences described above adjust the carrying amount of the net assetsattributable to unitholders and are recognised in the Profit and Loss Account. The amount expensed in the year ended30 June 2008 was US$633,767 (2007: US$445,723). The cumulative differences are included as “Adjustments from bidmarket prices to last traded market prices”on the Balance Sheet.
155
Putnam World Trust————————————————————————————————————————————————————————————————————————————————————————————————————————————————————————————————————————————
Notes to the Financial Statements as at 30 June 2008 (Continued)

Putnam World Trust————————————————————————————————————————————————————————————————————————————————————————————————————————————————————————————————————————————
Notes to the Financial Statements as at 30 June 2008 (Continued)
156
3. NUMBER OF UNITS IN ISSUE AND NET ASSETS ATTRIBUTABLE TO REDEEMABLE PARTICIPATING
UNITHOLDERS (Continued)
Number of Units (Issued and Fully Paid)PUTNAM PUTNAM
AMERICAN GOVERNMENT EMERGING INFORMATION
BOND FUND* SCIENCES FUND
30 JUNE 2008 30 JUNE 2007 30 JUNE 2008 30 JUNE 2007———————————————————————————————————————————————————————————————————————————————————————————————————————————————————————————————————
Class A Units
Balance at beginning of year 376,688 324,722 621,560 765,584
Issued during year 145,846 240,787 1,485,921 141,588
Reinvested during year 5,187 9,151 — —
Redeemed during year (527,721) (197,972) (1,132,566) (285,612)———————————————— ———————————————— ———————————————— ————————————————
Balance at end of year — 376,688 974,915 621,560 ———————————————— ———————————————— ———————————————— ———————————————————————————————— ———————————————— ———————————————— ————————————————
Class B Units
Balance at beginning of year 524,405 740,736 848,150 1,264,537
Issued during year 75,977 40,637 7,848 25,817
Reinvested during year 6,688 12,679 — —
Redeemed during year (607,070) (269,647) (207,715) (442,204)———————————————— ———————————————— ———————————————— ————————————————
Balance at end of year — 524,405 648,283 848,150 ———————————————— ———————————————— ———————————————— ———————————————————————————————— ———————————————— ———————————————— ————————————————
Class C Units
Balance at beginning of year 3,478 3,367 8,813 9,263
Issued during year 12,391 — 945 1,020
Reinvested during year 320 111 — —
Redeemed during year (16,189) — — (1,470)———————————————— ———————————————— ———————————————— ————————————————
Balance at end of year — 3,478 9,758 8,813 ———————————————— ———————————————— ———————————————— ———————————————————————————————— ———————————————— ———————————————— ————————————————
Class E Units
Balance at beginning of year — — 396,575 681,166
Issued during year — — 49,672 1,919,740
Reinvested during year — — — —
Redeemed during year — — (339,364) (2,204,331)———————————————— ———————————————— ———————————————— ————————————————
Balance at end of year — — 106,883 396,575 ———————————————— ———————————————— ———————————————— ———————————————————————————————— ———————————————— ———————————————— ————————————————
Class I Units
Balance at beginning of year 721 735 685,042 1,704,074
Issued during year — — 228 707,611
Reinvested during year — — — —
Redeemed during year (721) (14) (559,348) (1,726,643)———————————————— ———————————————— ———————————————— ————————————————
Balance at end of year — 721 125,922 685,042 ———————————————— ———————————————— ———————————————— ———————————————————————————————— ———————————————— ———————————————— ————————————————
Class T Units
Balance at beginning of year — — — —
Issued during year — — 636,326 —
Reinvested during year — — — —
Redeemed during year — — (636,326) ————————————————— ———————————————— ———————————————— ————————————————
Balance at end of year — — — — ———————————————— ———————————————— ———————————————— ———————————————————————————————— ———————————————— ———————————————— ————————————————
* Putnam American Government Bond Fund terminated on 20 February 2008.
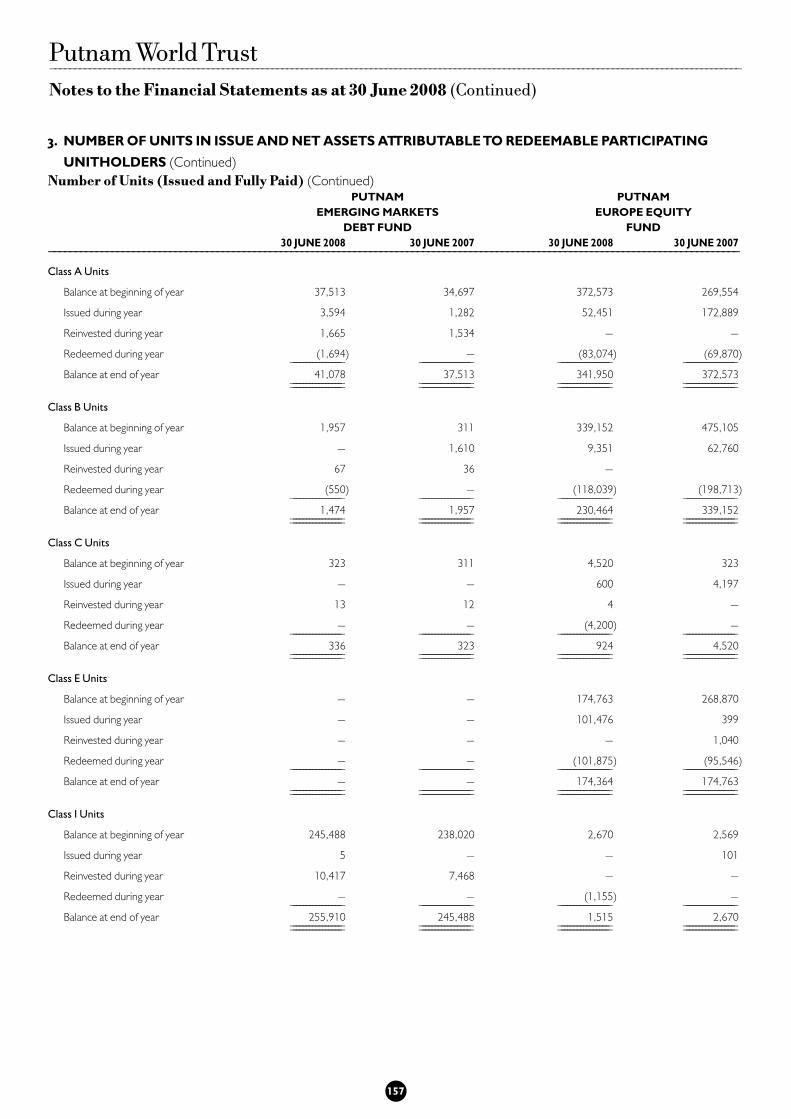
3. NUMBER OF UNITS IN ISSUE AND NET ASSETS ATTRIBUTABLE TO REDEEMABLE PARTICIPATING
UNITHOLDERS (Continued)
Number of Units (Issued and Fully Paid) (Continued)PUTNAM PUTNAM
EMERGING MARKETS EUROPE EQUITY
DEBT FUND FUND
30 JUNE 2008 30 JUNE 2007 30 JUNE 2008 30 JUNE 2007———————————————————————————————————————————————————————————————————————————————————————————————————————————————————————————————————
Class A Units
Balance at beginning of year 37,513 34,697 372,573 269,554
Issued during year 3,594 1,282 52,451 172,889
Reinvested during year 1,665 1,534 — —
Redeemed during year (1,694) — (83,074) (69,870)———————————————— ———————————————— ———————————————— ————————————————
Balance at end of year 41,078 37,513 341,950 372,573 ———————————————— ———————————————— ———————————————— ———————————————————————————————— ———————————————— ———————————————— ————————————————
Class B Units
Balance at beginning of year 1,957 311 339,152 475,105
Issued during year — 1,610 9,351 62,760
Reinvested during year 67 36 —
Redeemed during year (550) — (118,039) (198,713)———————————————— ———————————————— ———————————————— ————————————————
Balance at end of year 1,474 1,957 230,464 339,152 ———————————————— ———————————————— ———————————————— ———————————————————————————————— ———————————————— ———————————————— ————————————————
Class C Units
Balance at beginning of year 323 311 4,520 323
Issued during year — — 600 4,197
Reinvested during year 13 12 4 —
Redeemed during year — — (4,200) ————————————————— ———————————————— ———————————————— ————————————————
Balance at end of year 336 323 924 4,520 ———————————————— ———————————————— ———————————————— ———————————————————————————————— ———————————————— ———————————————— ————————————————
Class E Units
Balance at beginning of year — — 174,763 268,870
Issued during year — — 101,476 399
Reinvested during year — — — 1,040
Redeemed during year — — (101,875) (95,546)———————————————— ———————————————— ———————————————— ————————————————
Balance at end of year — — 174,364 174,763———————————————— ———————————————— ———————————————— ———————————————————————————————— ———————————————— ———————————————— ————————————————
Class I Units
Balance at beginning of year 245,488 238,020 2,670 2,569
Issued during year 5 — — 101
Reinvested during year 10,417 7,468 — —
Redeemed during year — — (1,155) ————————————————— ———————————————— ———————————————— ————————————————
Balance at end of year 255,910 245,488 1,515 2,670 ———————————————— ———————————————— ———————————————— ———————————————————————————————— ———————————————— ———————————————— ————————————————
157
Putnam World Trust————————————————————————————————————————————————————————————————————————————————————————————————————————————————————————————————————————————
Notes to the Financial Statements as at 30 June 2008 (Continued)

Putnam World Trust————————————————————————————————————————————————————————————————————————————————————————————————————————————————————————————————————————————
Notes to the Financial Statements as at 30 June 2008 (Continued)
158
3. NUMBER OF UNITS IN ISSUE AND NET ASSETS ATTRIBUTABLE TO REDEEMABLE PARTICIPATING
UNITHOLDERS (Continued)
Number of Units (Issued and Fully Paid) (Continued)THE GEORGE PUTNAM PUTNAM
(U.S. EQUITY AND BOND) GLOBAL EQUITY MULTI-ALPHA
FUND* FUND
30 JUNE 2008 30 JUNE 2007 30 JUNE 2008 30 JUNE 2007———————————————————————————————————————————————————————————————————————————————————————————————————————————————————————————————————
Class A Units**
Balance at beginning of year 350,377 368,688 — —
Issued during year 30,986 65,460 1,742,132 294
Reinvested during year 560 541 — —
Redeemed during year (381,923) (84,312) (191,837) (294)———————————————— ———————————————— ———————————————— ————————————————
Balance at end of year — 350,377 1,550,295 — ———————————————— ———————————————— ———————————————— ———————————————————————————————— ———————————————— ———————————————— ————————————————
Class B Units
Balance at beginning of year 579,316 853,021 — —
Issued during year 16,746 46,696 99,716 294
Reinvested during year 819 161 — —
Redeemed during year (596,881) (320,562) — (294)———————————————— ———————————————— ———————————————— ————————————————
Balance at end of year — 579,316 99,716 ————————————————— ———————————————— ———————————————— ———————————————————————————————— ———————————————— ———————————————— ————————————————
Class C Units
Balance at beginning of year 7,716 5,022 — —
Issued during year 4,758 5,203 793 294
Reinvested during year 32 22 — —
Redeemed during year (12,506) (2,531) — (294)———————————————— ———————————————— ———————————————— ————————————————
Balance at end of year — 7,716 793 ————————————————— ———————————————— ———————————————— ———————————————————————————————— ———————————————— ———————————————— ————————————————
Class E Units
Balance at beginning of year — — — —
Issued during year — — — 58,866
Reinvested during year — — — —
Redeemed during year — — — (58,866)———————————————— ———————————————— ———————————————— ————————————————
Balance at end of year — — — ————————————————— ———————————————— ———————————————— ———————————————————————————————— ———————————————— ———————————————— ————————————————
Class I Units
Balance at beginning of year 15 621 1,705,751 —
Issued during year 755 15 — 1,706,304
Reinvested during year 3 10 — —
Redeemed during year (733) (631) (1,705,751) (553)———————————————— ———————————————— ———————————————— ————————————————
Balance at end of year — 15 — 1,705,751———————————————— ———————————————— ———————————————— ———————————————————————————————— ———————————————— ———————————————— ————————————————
Class J Units
Balance at beginning of year — — 294 —
Issued during year — — — 294
Reinvested during year — — — —
Redeemed during year — — — ————————————————— ———————————————— ———————————————— ————————————————
Balance at end of year — — 294 294 ———————————————— ———————————————— ———————————————— ———————————————————————————————— ———————————————— ———————————————— ————————————————
* The George Putnam (U.S. Equity and Bond) Fund terminated on 20 February 2008.
** Putnam Global Equity Multi-Alpha Fund Class I Units were redesignated as Class A Units on 11 July 2007.

3. NUMBER OF UNITS IN ISSUE AND NET ASSETS ATTRIBUTABLE TO REDEEMABLE PARTICIPATING
UNITHOLDERS (Continued)
Number of Units (Issued and Fully Paid) (Continued)THE GEORGE PUTNAM PUTNAM
(U.S. EQUITY AND BOND) GLOBAL EQUITY MULTI-ALPHA
FUND* (Continued) FUND (Continued)
30 JUNE 2008 30 JUNE 2007 30 JUNE 2008 30 JUNE 2007———————————————————————————————————————————————————————————————————————————————————————————————————————————————————————————————————
Class M Units
Balance at beginning of year — — 866,344 —
Issued during year — — 627,057 866,344
Reinvested during year — — — —
Redeemed during year — — (1,379,825) ————————————————— ———————————————— ———————————————— ————————————————
Balance at end of year — — 113,576 866,344 ———————————————— ———————————————— ———————————————— ———————————————————————————————— ———————————————— ———————————————— ————————————————
Class Q Units
Balance at beginning of year — — 294 —
Issued during year — — — 294
Reinvested during year — — — —
Redeemed during year — — — ————————————————— ———————————————— ———————————————— ————————————————
Balance at end of year — — 294 294 ———————————————— ———————————————— ———————————————— ———————————————————————————————— ———————————————— ———————————————— ————————————————
Class S Units
Balance at beginning of year — — — —
Issued during year — — — 58,824
Reinvested during year — — — —
Redeemed during year — — — (58,824)———————————————— ———————————————— ———————————————— ————————————————
Balance at end of year — — — — ———————————————— ———————————————— ———————————————— ———————————————————————————————— ———————————————— ———————————————— ————————————————
* The George Putnam (U.S. Equtiy and Bond) Fund terminated on 20 February 2008.
PUTNAM PUTNAM
GLOBAL FIXED INCOME GLOBAL FIXED INCOME
ALPHA FUND S1* ALPHA FUND S2**
30 JUNE 2008 30 JUNE 2008———————————————————————————————————————————————————————————————————————————————————————————————————————————————————————————————————
Class I Units
Balance at beginning of year — —
Issued during year — 500,000
Reinvested during year — —
Redeemed during year — — ———————————————— ————————————————
Balance at end of year — 500,000———————————————— ———————————————————————————————— ————————————————
Class S Units
Balance at beginning of year — —
Issued during year 45,002,431 66,661,983
Reinvested during year — —
Redeemed during year — ————————————————— ————————————————
Balance at end of year 45,002,431 66,661,983 ———————————————— ———————————————————————————————— ————————————————
* Class S Units of Putnam Global Fixed Income Alpha Fund S1 launched on 21 February 2008.
** Class S Units of Putnam Global Fixed Income Alpha Fund S2 launched on 25 February 2008. Class I Units launched on 1 May 2008.
159
Putnam World Trust————————————————————————————————————————————————————————————————————————————————————————————————————————————————————————————————————————————
Notes to the Financial Statements as at 30 June 2008 (Continued)

Putnam World Trust————————————————————————————————————————————————————————————————————————————————————————————————————————————————————————————————————————————
Notes to the Financial Statements as at 30 June 2008 (Continued)
160
3. NUMBER OF UNITS IN ISSUE AND NET ASSETS ATTRIBUTABLE TO REDEEMABLE PARTICIPATING
UNITHOLDERS (Continued)
Number of Units (Issued and Fully Paid) (Continued)PUTNAM PUTNAM
GLOBAL GROWTH GLOBAL HIGH YIELD
FUND BOND FUND
30 JUNE 2008 30 JUNE 2007 30 JUNE 2008 30 JUNE 2007———————————————————————————————————————————————————————————————————————————————————————————————————————————————————————————————————
Class A Units
Balance at beginning of year 681,071 752,291 653,258 960,427
Issued during year 229,462 34,842 141,730 129,648
Reinvested during year — — 24,556 28,842
Redeemed during year (516,940) (106,062) (279,188) (465,659)———————————————— ———————————————— ———————————————— ————————————————
Balance at end of year 393,593 681,071 540,356 653,258 ———————————————— ———————————————— ———————————————— ———————————————————————————————— ———————————————— ———————————————— ————————————————
Class B Units
Balance at beginning of year 585,395 796,822 1,417,602 2,149,414
Issued during year 17,022 26,058 51,030 40,341
Reinvested during year — — 41,455 49,470
Redeemed during year (151,477) (237,485) (506,424) (821,623)———————————————— ———————————————— ———————————————— ————————————————
Balance at end of year 450,940 585,395 1,003,663 1,417,602 ———————————————— ———————————————— ———————————————— ———————————————————————————————— ———————————————— ———————————————— ————————————————
Class C Units
Balance at beginning of year — — 80,127 48,762
Issued during year — — 5,212 30,538
Reinvested during year — — 4,454 2,183
Redeemed during year — — (30,621) (1,356)———————————————— ———————————————— ———————————————— ————————————————
Balance at end of year — — 59,172 80,127 ———————————————— ———————————————— ———————————————— ———————————————————————————————— ———————————————— ———————————————— ————————————————
Class E Units
Balance at beginning of year — — 74,157 68,669
Issued during year — — 1,037 2,849
Reinvested during year — — 5,312 2,890
Redeemed during year — — (3,800) (251)———————————————— ———————————————— ———————————————— ————————————————
Balance at end of year — — 76,706 74,157 ———————————————— ———————————————— ———————————————— ———————————————————————————————— ———————————————— ———————————————— ————————————————
Class I Units
Balance at beginning of year 1,903 5,899 9,252,282 18,578
Issued during year 957 519 94,065,544 9,229,547
Reinvested during year — — 138,875 7,347
Redeemed during year (20) (4,515) (26,055) (3,190)———————————————— ———————————————— ———————————————— ————————————————
Balance at end of year 2,840 1,903 103,430,646 9,252,282 ———————————————— ———————————————— ———————————————— ———————————————————————————————— ———————————————— ———————————————— ————————————————
Class S Units
Balance at beginning of year — — 70,387 62,559
Issued during year — — — 11,660
Reinvested during year — — 8,837 2,598
Redeemed during year — — (5,230) (6,430)———————————————— ———————————————— ———————————————— ————————————————
Balance at end of year — — 73,994 70,387 ———————————————— ———————————————— ———————————————— ———————————————————————————————— ———————————————— ———————————————— ————————————————
Class T Units*
Balance at beginning of year — — — —
Issued during year — — 72 —
Reinvested during year — — — —
Redeemed during year — — — ————————————————— ———————————————— ———————————————— ————————————————
Balance at end of year — — 72 — ———————————————— ———————————————— ———————————————— ———————————————————————————————— ———————————————— ———————————————— ————————————————
* Putnam Global High Yield Bond Fund launched Class T Units on 26 November 2007.

161
Putnam World Trust————————————————————————————————————————————————————————————————————————————————————————————————————————————————————————————————————————————
Notes to the Financial Statements as at 30 June 2008 (Continued)
3. NUMBER OF UNITS IN ISSUE AND NET ASSETS ATTRIBUTABLE TO REDEEMABLE PARTICIPATING
UNITHOLDERS (Continued)
Number of Units (Issued and Fully Paid) (Continued)PUTNAM PUTNAM INTERNATIONAL
GROWTH AND INCOME (NON U.S. CORE) EQUITY
(U.S. VALUE EQUITY) FUND FUND
30 JUNE 2008 30 JUNE 2007 30 JUNE 2008 30 JUNE 2007———————————————————————————————————————————————————————————————————————————————————————————————————————————————————————————————————
Class A Units
Balance at beginning of year 674,314 853,211 495,840 666,026
Issued during year 22,258 53,426 51,355 89,420
Reinvested during year — — 4,095 —
Redeemed during year (276,111) (232,323) (226,012) (259,606)———————————————— ———————————————— ———————————————— ————————————————
Balance at end of year 420,461 674,314 325,278 495,840 ———————————————— ———————————————— ———————————————— ———————————————————————————————— ———————————————— ———————————————— ————————————————
Class B Units
Balance at beginning of year 1,421,253 2,016,691 948,564 1,322,675
Issued during year 17,271 46,408 42,817 135,369
Reinvested during year — — 3,774 —
Redeemed during year (410,454) (641,846) (309,416) (509,480)———————————————— ———————————————— ———————————————— ————————————————
Balance at end of year 1,028,010 1,421,253 685,739 948,564 ———————————————— ———————————————— ———————————————— ———————————————————————————————— ———————————————— ———————————————— ————————————————
Class C Units
Balance at beginning of year 9,643 294 34,239 323
Issued during year — 9,349 21,507 33,916
Reinvested during year — — 117 —
Redeemed during year (4,388) — (7,320) ————————————————— ———————————————— ———————————————— ————————————————
Balance at end of year 5,255 9,643 48,543 34,239 ———————————————— ———————————————— ———————————————— ———————————————————————————————— ———————————————— ———————————————— ————————————————
Class E Units
Balance at beginning of year 29,200 19,587 — —
Issued during year 5,533 13,002 — —
Reinvested during year 142 — — —
Redeemed during year (8,326) (3,389) — ————————————————— ———————————————— ———————————————— ————————————————
Balance at end of year 26,549 29,200 — ————————————————— ———————————————— ———————————————— ———————————————————————————————— ———————————————— ———————————————— ————————————————
Class I Units
Balance at beginning of year 71,126 81,653 5,994 7,024
Issued during year 7,011 32,926 2,185 26
Reinvested during year — — 71 —
Redeemed during year (27,479) (43,453) (1,211) (1,056)———————————————— ———————————————— ———————————————— ————————————————
Balance at end of year 50,658 71,126 7,039 5,994 ———————————————— ———————————————— ———————————————— ———————————————————————————————— ———————————————— ———————————————— ————————————————

162
3. NUMBER OF UNITS IN ISSUE AND NET ASSETS ATTRIBUTABLE TO REDEEMABLE PARTICIPATING
UNITHOLDERS (Continued)
Number of Units (Issued and Fully Paid) (Continued)PUTNAM INVESTORS PUTNAM NEW OPPORTUNITIES
(U.S. CORE EQUITY) (U.S. AGGRESSIVE GROWTH EQUITY)
FUND FUND
30 JUNE 2008 30 JUNE 2007 30 JUNE 2008 30 JUNE 2007———————————————————————————————————————————————————————————————————————————————————————————————————————————————————————————————————
Class A Units
Balance at beginning of year 574,395 982,335 516,088 861,914
Issued during year 130,217 107,753 807,078 97,310
Reinvested during year — — — —
Redeemed during year (314,669) (515,693) (215,793) (443,136)———————————————— ———————————————— ———————————————— ————————————————
Balance at end of year 389,943 574,395 1,107,373 516,088———————————————— ———————————————— ———————————————— ———————————————————————————————— ———————————————— ———————————————— ————————————————
Class B Units
Balance at beginning of year 1,217,031 1,939,412 1,313,328 2,018,948
Issued during year 76,986 116,767 1,242,250 14,297
Reinvested during year — — — —
Redeemed during year (492,367) (839,148) (348,544) (719,917)———————————————— ———————————————— ———————————————— ————————————————
Balance at end of year 801,650 1,217,031 2,207,034 1,313,328 ———————————————— ———————————————— ———————————————— ———————————————————————————————— ———————————————— ———————————————— ————————————————
Class C Units
Balance at beginning of year 19,509 31,232 294 1,560
Issued during year 2,859 1,581 11,736 —
Reinvested during year — — — —
Redeemed during year (2,465) (13,304) — (1,266)———————————————— ———————————————— ———————————————— ————————————————
Balance at end of year 19,903 19,509 12,030 294 ———————————————— ———————————————— ———————————————— ———————————————————————————————— ———————————————— ———————————————— ————————————————
Class E Units
Balance at beginning of year 29,404 — — —
Issued during year — 29,404 60,597 —
Reinvested during year 1,690 — — —
Redeemed during year — — — ————————————————— ———————————————— ———————————————— ————————————————
Balance at end of year 31,094 29,404 60,597 — ———————————————— ———————————————— ———————————————— ———————————————————————————————— ———————————————— ———————————————— ————————————————
Class I Units
Balance at beginning of year 17,976 17,976 307 301
Issued during year 512 40,420 5 6
Reinvested during year — — — —
Redeemed during year (484) (40,420) — ————————————————— ———————————————— ———————————————— ————————————————
Balance at end of year 18,004 17,976 312 307 ———————————————— ———————————————— ———————————————— ———————————————————————————————— ———————————————— ———————————————— ————————————————
Class M Units
Balance at beginning of year 294 294 — —
Issued during year — — — —
Reinvested during year — — — —
Redeemed during year — — — ————————————————— ———————————————— ———————————————— ————————————————
Balance at end of year 294 294 — — ———————————————— ———————————————— ———————————————— ———————————————————————————————— ———————————————— ———————————————— ————————————————
Putnam World Trust————————————————————————————————————————————————————————————————————————————————————————————————————————————————————————————————————————————
Notes to the Financial Statements as at 30 June 2008 (Continued)

163
Putnam World Trust————————————————————————————————————————————————————————————————————————————————————————————————————————————————————————————————————————————
Notes to the Financial Statements as at 30 June 2008 (Continued)
3. NUMBER OF UNITS IN ISSUE AND NET ASSETS ATTRIBUTABLE TO REDEEMABLE PARTICIPATING
UNITHOLDERS (Continued)
Number of Units (Issued and Fully Paid) (Continued)PUTNAM PUTNAM
OPPORTUNISTIC TOTAL RETURN
VALUE FUND* FUND
30 JUNE 2008 30 JUNE 2007 30 JUNE 2008 30 JUNE 2007———————————————————————————————————————————————————————————————————————————————————————————————————————————————————————————————————
Class A Units**
Balance at beginning of year 114,352 95,845 — —
Issued during year 10,231 51,037 4,960,316 294
Reinvested during year — — — —
Redeemed during year (124,583) (32,530) (242,922) (294)———————————————— ———————————————— ———————————————— ————————————————
Balance at end of year — 114,352 4,717,394 ————————————————— ———————————————— ———————————————— ———————————————————————————————— ———————————————— ———————————————— ————————————————
Class B Units***
Balance at beginning of year 28,025 19,969 — —
Issued during year 465 10,720 67,455 294
Reinvested during year — — — —
Redeemed during year (28,490) (2,664) (12,549) (294)———————————————— ———————————————— ———————————————— ————————————————
Balance at end of year — 28,025 54,906 ————————————————— ———————————————— ———————————————— ———————————————————————————————— ———————————————— ———————————————— ————————————————
Class C Units***
Balance at beginning of year 2,202 2,911 — —
Issued during year 935 466 407,750 294
Reinvested during year — — — —
Redeemed during year (3,137) (1,175) (96,468) (294)———————————————— ———————————————— ———————————————— ————————————————
Balance at end of year — 2,202 311,282 ————————————————— ———————————————— ———————————————— ———————————————————————————————— ———————————————— ———————————————— ————————————————
Class E Units
Balance at beginning of year 81,810 34,306 58,779 —
Issued during year — 49,508 542,148 117,645
Reinvested during year 1,591 — — —
Redeemed during year (83,401) (2,004) — (58,866)———————————————— ———————————————— ———————————————— ————————————————
Balance at end of year — 81,810 600,927 58,779———————————————— ———————————————— ———————————————— ———————————————————————————————— ———————————————— ———————————————— ————————————————
Class I Units
Balance at beginning of year 107,505 3,275,411 2,267,866 —
Issued during year — 2,246,181 — 2,616,856
Reinvested during year — — — —
Redeemed during year (107,505) (5,414,087) (2,267,866) (348,990)———————————————— ———————————————— ———————————————— ————————————————
Balance at end of year — 107,505 — 2,267,866———————————————— ———————————————— ———————————————— ———————————————————————————————— ———————————————— ———————————————— ————————————————
Class J Units
Balance at beginning of year — — 294 —
Issued during year — — — 294
Reinvested during year — — — —
Redeemed during year — — — ————————————————— ———————————————— ———————————————— ————————————————
Balance at end of year — — 294 294 ———————————————— ———————————————— ———————————————— ———————————————————————————————— ———————————————— ———————————————— ————————————————
* Putnam Opportunistic Value Fund terminated on 20 February 2008.
** Putnam Total Return Fund Class I Units were redesignated as Class A Units on 11 July 2007.
*** Putnam Total Return Fund Class B Units and Class C Units were launched on 10 July 2007.

3. NUMBER OF UNITS IN ISSUE AND NET ASSETS ATTRIBUTABLE TO REDEEMABLE PARTICIPATING
UNITHOLDERS (Continued)
Number of Units (Issued and Fully Paid) (Continued)PUTNAM PUTNAM
OPPORTUNISTIC TOTAL RETURN
VALUE FUND* (Continued) FUND (Continued)
30 JUNE 2008 30 JUNE 2007 30 JUNE 2008 30 JUNE 2007———————————————————————————————————————————————————————————————————————————————————————————————————————————————————————————————————
Class M Units
Balance at beginning of year — — 1,626,227 —
Issued during year — — 6,794,264 1,780,966
Reinvested during year — — — —
Redeemed during year — — (3,094,704) (154,739)———————————————— ———————————————— ———————————————— ————————————————
Balance at end of year — — 5,325,787 1,626,227 ———————————————— ———————————————— ———————————————— ———————————————————————————————— ———————————————— ———————————————— ————————————————
Class Q Units
Balance at beginning of year — — 294 —
Issued during year — — — 294
Reinvested during year — — — —
Redeemed during year — — — ————————————————— ———————————————— ———————————————— ————————————————
Balance at end of year — — 294 294 ———————————————— ———————————————— ———————————————— ———————————————————————————————— ———————————————— ———————————————— ————————————————
Class S Units
Balance at beginning of year — — 58,880 —
Issued during year — — — 117,704
Reinvested during year — — — —
Redeemed during year — — — (58,824)———————————————— ———————————————— ———————————————— ————————————————
Balance at end of year — — 58,880 58,880 ———————————————— ———————————————— ———————————————— ———————————————————————————————— ———————————————— ———————————————— ————————————————
* Putnam Opportunistic Value Fund terminated on 20 February 2008.
164
Putnam World Trust————————————————————————————————————————————————————————————————————————————————————————————————————————————————————————————————————————————
Notes to the Financial Statements as at 30 June 2008 (Continued)
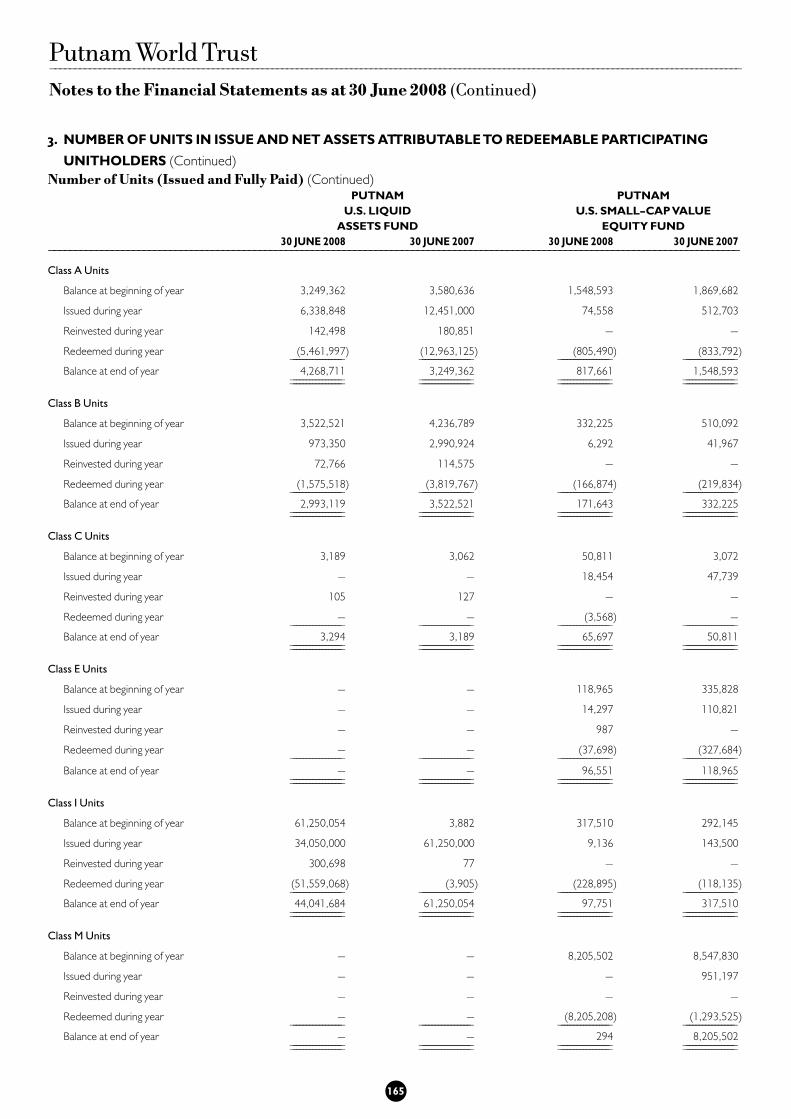
3. NUMBER OF UNITS IN ISSUE AND NET ASSETS ATTRIBUTABLE TO REDEEMABLE PARTICIPATING
UNITHOLDERS (Continued)
Number of Units (Issued and Fully Paid) (Continued)PUTNAM PUTNAM
U.S. LIQUID U.S. SMALL-CAP VALUE
ASSETS FUND EQUITY FUND
30 JUNE 2008 30 JUNE 2007 30 JUNE 2008 30 JUNE 2007———————————————————————————————————————————————————————————————————————————————————————————————————————————————————————————————————
Class A Units
Balance at beginning of year 3,249,362 3,580,636 1,548,593 1,869,682
Issued during year 6,338,848 12,451,000 74,558 512,703
Reinvested during year 142,498 180,851 — —
Redeemed during year (5,461,997) (12,963,125) (805,490) (833,792)———————————————— ———————————————— ———————————————— ————————————————
Balance at end of year 4,268,711 3,249,362 817,661 1,548,593 ———————————————— ———————————————— ———————————————— ———————————————————————————————— ———————————————— ———————————————— ————————————————
Class B Units
Balance at beginning of year 3,522,521 4,236,789 332,225 510,092
Issued during year 973,350 2,990,924 6,292 41,967
Reinvested during year 72,766 114,575 — —
Redeemed during year (1,575,518) (3,819,767) (166,874) (219,834)———————————————— ———————————————— ———————————————— ————————————————
Balance at end of year 2,993,119 3,522,521 171,643 332,225 ———————————————— ———————————————— ———————————————— ———————————————————————————————— ———————————————— ———————————————— ————————————————
Class C Units
Balance at beginning of year 3,189 3,062 50,811 3,072
Issued during year — — 18,454 47,739
Reinvested during year 105 127 — —
Redeemed during year — — (3,568) ————————————————— ———————————————— ———————————————— ————————————————
Balance at end of year 3,294 3,189 65,697 50,811 ———————————————— ———————————————— ———————————————— ———————————————————————————————— ———————————————— ———————————————— ————————————————
Class E Units
Balance at beginning of year — — 118,965 335,828
Issued during year — — 14,297 110,821
Reinvested during year — — 987 —
Redeemed during year — — (37,698) (327,684)———————————————— ———————————————— ———————————————— ————————————————
Balance at end of year — — 96,551 118,965———————————————— ———————————————— ———————————————— ———————————————————————————————— ———————————————— ———————————————— ————————————————
Class I Units
Balance at beginning of year 61,250,054 3,882 317,510 292,145
Issued during year 34,050,000 61,250,000 9,136 143,500
Reinvested during year 300,698 77 — —
Redeemed during year (51,559,068) (3,905) (228,895) (118,135)———————————————— ———————————————— ———————————————— ————————————————
Balance at end of year 44,041,684 61,250,054 97,751 317,510 ———————————————— ———————————————— ———————————————— ———————————————————————————————— ———————————————— ———————————————— ————————————————
Class M Units
Balance at beginning of year — — 8,205,502 8,547,830
Issued during year — — — 951,197
Reinvested during year — — — —
Redeemed during year — — (8,205,208) (1,293,525)———————————————— ———————————————— ———————————————— ————————————————
Balance at end of year — — 294 8,205,502 ———————————————— ———————————————— ———————————————— ———————————————————————————————— ———————————————— ———————————————— ————————————————
165
Putnam World Trust————————————————————————————————————————————————————————————————————————————————————————————————————————————————————————————————————————————
Notes to the Financial Statements as at 30 June 2008 (Continued)

166
3. NUMBER OF UNITS IN ISSUE AND NET ASSETS ATTRIBUTABLE TO REDEEMABLE PARTICIPATING
UNITHOLDERS (Continued)
Number of Units (Issued and Fully Paid) (Continued)PUTNAM VISTA
(U.S. MID-CAP EQUITY)
FUND*
30 JUNE 2008 30 JUNE 2007———————————————————————————————————————————————————————————————————————————————————————————————————————————————————————————————————
Class A Units
Balance at beginning of year 665,590 996,224
Issued during year 22,004 36,320
Reinvested during year — —
Redeemed during year (687,594) (366,954)———————————————— ————————————————
Balance at end of year — 665,590 ———————————————— ———————————————————————————————— ————————————————
Class B Units
Balance at beginning of year 952,863 1,476,301
Issued during year 13,070 34,002
Reinvested during year — —
Redeemed during year (965,933) (557,440)———————————————— ————————————————
Balance at end of year — 952,863 ———————————————— ———————————————————————————————— ————————————————
Class C Units
Balance at beginning of year 14,371 8,296
Issued during year 2,097 11,020
Reinvested during year — —
Redeemed during year (16,468) (4,945)———————————————— ————————————————
Balance at end of year — 14,371 ———————————————— ———————————————————————————————— ————————————————
Class E Units
Balance at beginning of year 69,979 87,897
Issued during year 115 3,633
Reinvested during year 530 —
Redeemed during year (70,624) (21,551)———————————————— ————————————————
Balance at end of year — 69,979 ———————————————— ———————————————————————————————— ————————————————
Class I Units
Balance at beginning of year 2 7
Issued during year — —
Reinvested during year — —
Redeemed during year (2) (5)———————————————— ————————————————
Balance at end of year — 2 ———————————————— ———————————————————————————————— ————————————————
* Putnam Vista (U.S. Mid-Cap Equity) Fund merged with Putnam New Opportunities (U.S. Aggressive Growth) Fund on 27 June 2008.
Putnam World Trust————————————————————————————————————————————————————————————————————————————————————————————————————————————————————————————————————————————
Notes to the Financial Statements as at 30 June 2008 (Continued)

Putnam World Trust————————————————————————————————————————————————————————————————————————————————————————————————————————————————————————————————————————————
Notes to the Financial Statements as at 30 June 2008 (Continued)
167
PUTNAM
AMERICAN GOVERNMENT BOND FUND*
30 JUNE 2008 30 JUNE 2007 30 JUNE 2006
USD USD USD
Total Net Asset Value $ — $ 7,774,437 $ 9,073,006
Class A
Units in Issue — 376,688 324,722
Net Asset Value per Unit — 8.66 8.57
Class B
Units in Issue — 524,405 740,736
Net Asset Value per Unit — 8.54 8.45
Class C
Units in Issue — 3,478 3,367
Net Asset Value per Unit — 7.86 7.81
Class I
Units in Issue — 721 735
Net Asset Value per Unit — 9.73 9.57
* Putnam American Government Bond Fund terminated 20 February 2008.
PUTNAM
EMERGING INFORMATION SCIENCES FUND
30 JUNE 2008 30 JUNE 2007 30 JUNE 2006
USD USD USD
Total Net Asset Value $ 20,685,171 $ 34,631,106 $ 48,596,147
Class A
Units in Issue 974,915 621,560 765,584
Net Asset Value per Unit 10.50 13.09 10.72
Class B
Units in Issue 648,283 848,150 1,264,537
Net Asset Value per Unit 12.26 15.36 12.64
Class C
Units in Issue 9,758 8,813 9,263
Net Asset Value per Unit 8.69 10.85 8.91
Class E
Units in Issue 106,883 396,575 681,166
Net Asset Value per Unit ¤ 6.21 ¤ 7.74 ¤ 6.45
Class I
Units in Issue 125,922 685,042 1,704,074
Net Asset Value per Unit 10.84 13.46 10.98
4. CURRENT AND PRIOR YEAR NAV DETAILS

168
Putnam World Trust————————————————————————————————————————————————————————————————————————————————————————————————————————————————————————————————————————————
Notes to the Financial Statements as at 30 June 2008 (Continued)
4. CURRENT AND PRIOR YEAR NAV DETAILS (Continued)
PUTNAM
EMERGING MARKETS DEBT FUND
30 JUNE 2008 30 JUNE 2007 30 JUNE 2006
USD USD USD
Total Net Asset Value $ 2,840,979 $ 2,720,265 $ 2,479,753
Class A
Units in Issue 41,078 37,513 34,697
Net Asset Value per Unit 9.06 9.09 8.74
Class B
Units in Issue 1,474 1,957 311
Net Asset Value per Unit 9.05 9.08 8.73
Class C
Units in Issue 336 323 311
Net Asset Value per Unit 9.05 9.10 8.74
Class I
Units in Issue 255,910 245,488 238,020
Net Asset Value per Unit 9.58 9.61 9.12
PUTNAM
EUROPE EQUITY FUND
30 JUNE 2008 30 JUNE 2007 30 JUNE 2006
USD USD USD
Total Net Asset Value $ 11,293,202 $ 16,206,418 $ 13,754,175
Class A
Units in Issue 341,950 372,573 269,554
Net Asset Value per Unit 16.39 19.73 15.08
Class B
Units in Issue 230,464 339,152 475,105
Net Asset Value per Unit 15.56 18.82 14.45
Class C
Units in Issue 924 4,520 323
Net Asset Value per Unit 11.30 13.66 10.46
Class E
Units in Issue 174,364 174,763 268,870
Net Asset Value per Unit ¤ 7.53 ¤ 9.98 ¤ 8.08
Class I
Units in Issue 1,514 2,670 2,569
Net Asset Value per Unit 16.16 19.38 15.31

Putnam World Trust————————————————————————————————————————————————————————————————————————————————————————————————————————————————————————————————————————————
Notes to the Financial Statements as at 30 June 2008 (Continued)
169
4. CURRENT AND PRIOR YEAR NAV DETAILS (Continued)
THE GEORGE PUTNAM
(U.S. EQUITY AND BOND) FUND*
30 JUNE 2008 30 JUNE 2007 30 JUNE 2006
USD USD USD
Total Net Asset Value $ — $ 12,361,969 $ 14,477,567
Class A
Units in Issue — 350,377 368,688
Net Asset Value per Unit — 13.29 11.86
Class B
Units in Issue — 579,316 853,021
Net Asset Value per Unit — 13.17 11.78
Class C
Units in Issue — 7,716 5,022
Net Asset Value per Unit — 9.91 8.87
Class I
Units in Issue — 15 621
Net Asset Value per Unit — 4.72 11.96
* The George Putnam (U.S. Equity and Bond) Fund terminated on 20 February 2008.
PUTNAM
GLOBAL EQUITY MULTI-ALPHA FUND
30 JUNE 2008 30 JUNE 2007
USD USD
Total Net Asset Value $ 16,316,858 $ 27,610,315
Class A*
Units in Issue 1,550,295 1,705,751
Net Asset Value per Unit 9.37 10.74
Class B**
Units in Issue 99,716 —
Net Asset Value per Unit 7.18 —
Class C**
Units in Issue 793 —
Net Asset Value per Unit 7.19 —
Class I
Units in Issue — —
Net Asset Value per Unit — —
Class J
Units in Issue 294 294
Net Asset Value per Unit 9.56 10.79
Class M
Units in Issue 113,576 866,344
Net Asset Value per Unit ¤ 5.94 ¤ 7.92
Class Q
Units in Issue 294 294
Net Asset Value per Unit 8.47 9.63
* Class I Units were redesignated as Class A Units on 11 July 2007.
** Class B Units and Class C Units were launched on 10 July 2007.

Putnam World Trust————————————————————————————————————————————————————————————————————————————————————————————————————————————————————————————————————————————
Notes to the Financial Statements as at 30 June 2008 (Continued)
170
4. CURRENT AND PRIOR YEAR NAV DETAILS (Continued)
PUTNAM
GLOBAL FIXED INCOME ALPHA FUND S1*
30 JUNE 2008
GBP
Total Net Asset Value £ 455,371,943
Class S
Units in Issue 45,002,431
Net Asset Value per Unit 10.12
* Putnam Global Fixed Income Alpha Fund S1 launched on 21 February 2008.
PUTNAM
GLOBAL FIXED INCOME ALPHA FUND S2*
30 JUNE 2008
GBP
Total Net Asset Value £ 669,159,073
Class I
Units in Issue 500,000
Net Asset Value per Unit 4.93
Class S
Units in Issue 66,661,983
Net Asset Value per Unit 10.00
* Putnam Global Fixed Income Alpha Fund S2 launched on 25 February 2008.
PUTNAM
GLOBAL GROWTH FUND
30 JUNE 2008 30 JUNE 2007 30 JUNE 2006
USD USD USD
Total Net Asset Value $ 14,384,888 $ 24,654,966 $ 24,481,742
Class A
Units in Issue 393,593 681,071 752,291
Net Asset Value per Unit 17.75 20.16 16.35
Class B
Units in Issue 450,940 585,395 796,822
Net Asset Value per Unit 16.30 18.60 15.16
Class I
Units in Issue 2,840 1,903 5,899
Net Asset Value per Unit 18.33 20.74 16.75

4. CURRENT AND PRIOR YEAR NAV DETAILS (Continued)
Putnam World Trust————————————————————————————————————————————————————————————————————————————————————————————————————————————————————————————————————————————
Notes to the Financial Statements as at 30 June 2008 (Continued)
171
PUTNAM
GLOBAL HIGH YIELD BOND FUND
30 JUNE 2008 30 JUNE 2007 30 JUNE 2006
USD USD USD
Total Net Asset Value $ 280,288,240 $ 42,539,984 $ 23,766,314
Class A
Units in Issue 540,356 653,258 960,427
Net Asset Value per Unit 6.65 7.38 7.11
Class B
Units in Issue 1,003,663 1,417,602 2,149,414
Net Asset Value per Unit 6.58 7.30 7.04
Class C
Units in Issue 59,172 80,127 48,762
Net Asset Value per Unit 7.90 8.93 8.51
Class E
Units in Issue 76,706 74,157 68,669
Net Asset Value per Unit ¤ 7.61 ¤ 8.53 ¤ 8.23
Class I
Units in Issue 103,430,646 9,252,282 18,578
Net Asset Value per Unit 2.59 2.71 3.40
Class S
Units in Issue 73,994 70,387 62,559
Net Asset Value per Unit £ 4.67 £ 5.44 £ 5.17
Class T*
Units in Issue 72 — —
Net Asset Value per Unit 6.90 — —
* Class T Units were launched on 26 November 2007.
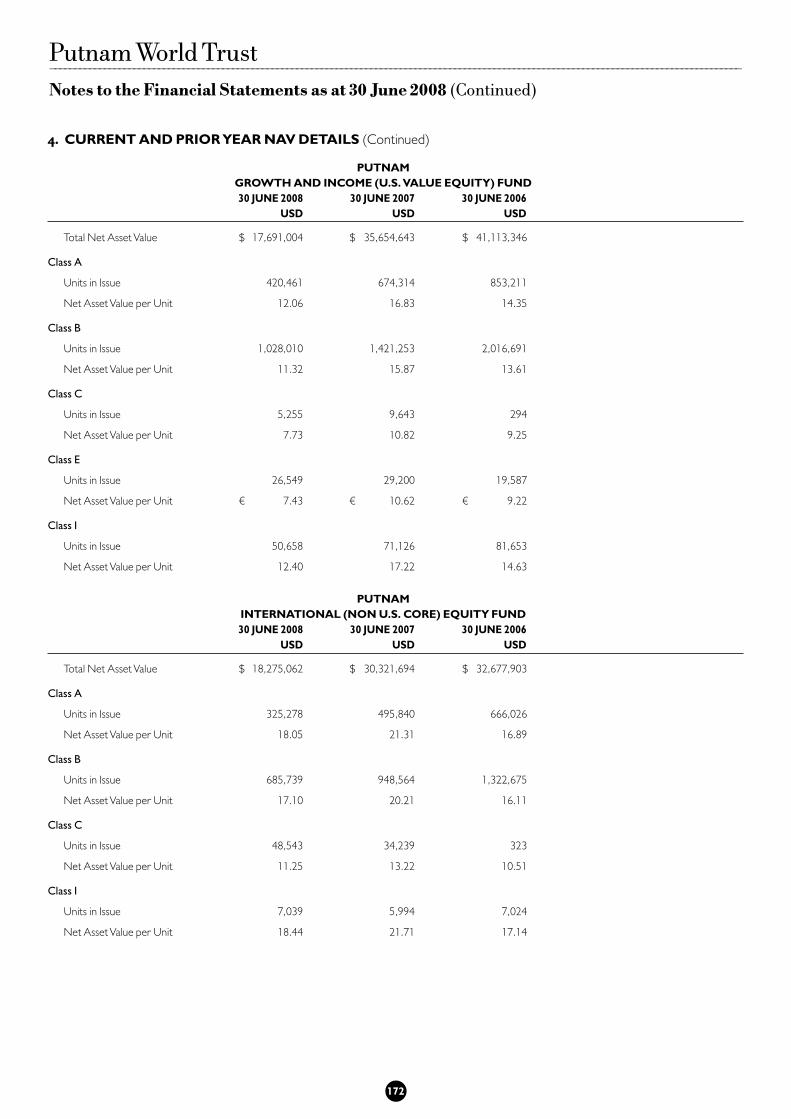
Putnam World Trust————————————————————————————————————————————————————————————————————————————————————————————————————————————————————————————————————————————
Notes to the Financial Statements as at 30 June 2008 (Continued)
172
4. CURRENT AND PRIOR YEAR NAV DETAILS (Continued)
PUTNAM
GROWTH AND INCOME (U.S. VALUE EQUITY) FUND
30 JUNE 2008 30 JUNE 2007 30 JUNE 2006
USD USD USD
Total Net Asset Value $ 17,691,004 $ 35,654,643 $ 41,113,346
Class A
Units in Issue 420,461 674,314 853,211
Net Asset Value per Unit 12.06 16.83 14.35
Class B
Units in Issue 1,028,010 1,421,253 2,016,691
Net Asset Value per Unit 11.32 15.87 13.61
Class C
Units in Issue 5,255 9,643 294
Net Asset Value per Unit 7.73 10.82 9.25
Class E
Units in Issue 26,549 29,200 19,587
Net Asset Value per Unit ¤ 7.43 ¤ 10.62 ¤ 9.22
Class I
Units in Issue 50,658 71,126 81,653
Net Asset Value per Unit 12.40 17.22 14.63
PUTNAM
INTERNATIONAL (NON U.S. CORE) EQUITY FUND
30 JUNE 2008 30 JUNE 2007 30 JUNE 2006
USD USD USD
Total Net Asset Value $ 18,275,062 $ 30,321,694 $ 32,677,903
Class A
Units in Issue 325,278 495,840 666,026
Net Asset Value per Unit 18.05 21.31 16.89
Class B
Units in Issue 685,739 948,564 1,322,675
Net Asset Value per Unit 17.10 20.21 16.11
Class C
Units in Issue 48,543 34,239 323
Net Asset Value per Unit 11.25 13.22 10.51
Class I
Units in Issue 7,039 5,994 7,024
Net Asset Value per Unit 18.44 21.71 17.14

4. CURRENT AND PRIOR YEAR NAV DETAILS (Continued)
Putnam World Trust————————————————————————————————————————————————————————————————————————————————————————————————————————————————————————————————————————————
Notes to the Financial Statements as at 30 June 2008 (Continued)
173
PUTNAM
INVESTORS (U.S. CORE EQUITY) FUND
30 JUNE 2008 30 JUNE 2007 30 JUNE 2006
USD USD USD
Total Net Asset Value $ 11,286,382 $ 22,186,995 $ 30,521,137
Class A
Units in Issue 389,943 574,395 982,335
Net Asset Value per Unit 9.26 12.34 10.56
Class B
Units in Issue 801,650 1,217,031 1,939,412
Net Asset Value per Unit 8.79 11.78 10.13
Class C
Units in Issue 19,903 19,509 31,232
Net Asset Value per Unit 8.39 11.20 9.61
Class E*
Units in Issue 31,094 29,404 —
Net Asset Value per Unit ¤ 5.87 ¤ 7.96 —
Class I
Units in Issue 18,004 17,976 17,976
Net Asset Value per Unit 9.62 12.74 10.86
Class M
Units in Issue 294 294 294
Net Asset Value per Unit 7.29 9.56 8.09
* Class E Units were launched on 14 August 2008.
PUTNAM
NEW OPPORTUNITIES
(U.S. AGGRESSIVE GROWTH EQUITY) FUND
30 JUNE 2008 30 JUNE 2007 30 JUNE 2006
USD USD USD
Total Net Asset Value $ 38,919,753 $ 23,477,015 $ 32,606,942
Class A
Units in Issue 1,107,373 516,088 861,914
Net Asset Value per Unit 11.90 13.37 11.74
Class B
Units in Issue 2,207,034 1,313,328 2,018,948
Net Asset Value per Unit 11.18 12.62 11.13
Class C
Units in Issue 12,030 294 1,560
Net Asset Value per Unit 9.58 10.78 9.49
Class E*
Units in Issue 60,597 — —
Net Asset Value per Unit ¤ 10.00 — —
Class I
Units in Issue 312 307 301
Net Asset Value per Unit 12.14 13.58 11.88
* Class E Units were launched on 30 June 2008.
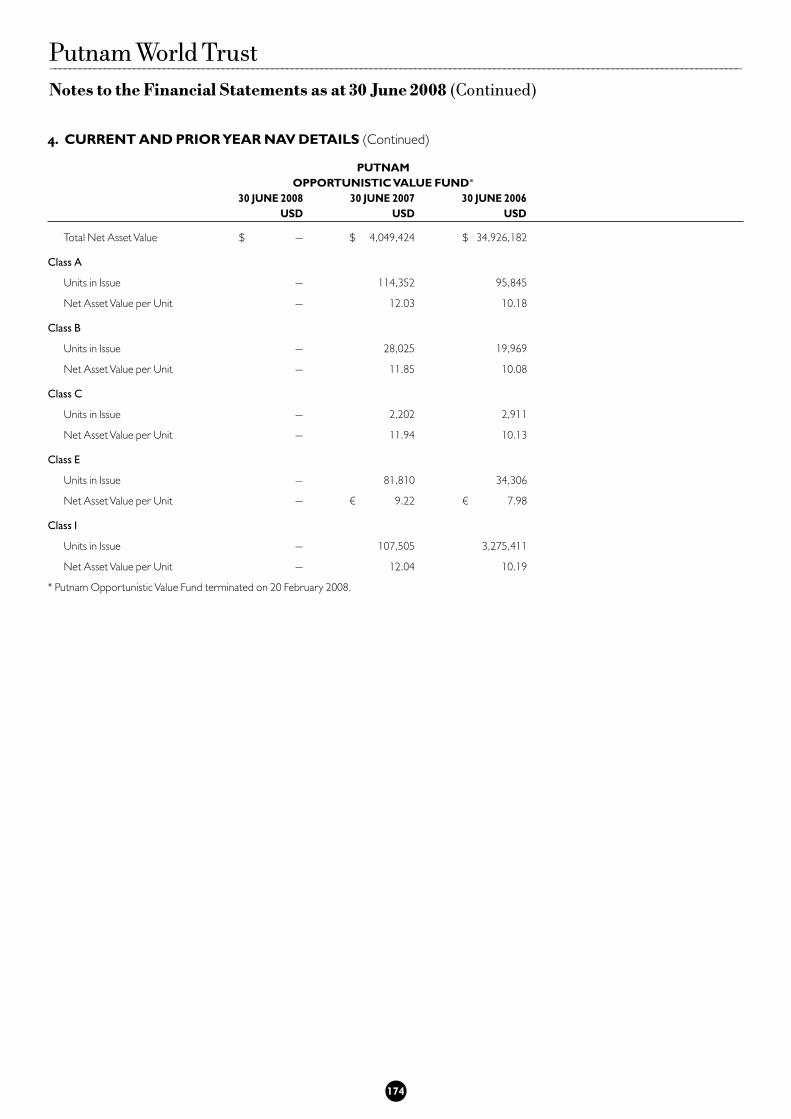
Putnam World Trust————————————————————————————————————————————————————————————————————————————————————————————————————————————————————————————————————————————
Notes to the Financial Statements as at 30 June 2008 (Continued)
174
4. CURRENT AND PRIOR YEAR NAV DETAILS (Continued)
PUTNAM
OPPORTUNISTIC VALUE FUND*
30 JUNE 2008 30 JUNE 2007 30 JUNE 2006
USD USD USD
Total Net Asset Value $ — $ 4,049,424 $ 34,926,182
Class A
Units in Issue — 114,352 95,845
Net Asset Value per Unit — 12.03 10.18
Class B
Units in Issue — 28,025 19,969
Net Asset Value per Unit — 11.85 10.08
Class C
Units in Issue — 2,202 2,911
Net Asset Value per Unit — 11.94 10.13
Class E
Units in Issue — 81,810 34,306
Net Asset Value per Unit — ¤ 9.22 ¤ 7.98
Class I
Units in Issue — 107,505 3,275,411
Net Asset Value per Unit — 12.04 10.19
* Putnam Opportunistic Value Fund terminated on 20 February 2008.

4. CURRENT AND PRIOR YEAR NAV DETAILS (Continued)
Putnam World Trust————————————————————————————————————————————————————————————————————————————————————————————————————————————————————————————————————————————
Notes to the Financial Statements as at 30 June 2008 (Continued)
175
PUTNAM
TOTAL RETURN FUND
30 JUNE 2008 30 JUNE 2007
USD USD
Total Net Asset Value $ 122,521,556 $ 38,022,901
Class A*
Units in Issue 4,717,394 2,667,866
Net Asset Value per Unit 10.08 9.36
Class B**
Units in Issue 54,906 —
Net Asset Value per Unit 9.02 —
Class C**
Units in Issue 311,282 —
Net Asset Value per Unit 9.04 —
Class E
Units in Issue 600,927 58,779
Net Asset Value per Unit ¤ 7.10 ¤ 6.60
Class J
Units in Issue 294 294
Net Asset Value per Unit 10.20 9.47
Class M
Units in Issue 5,325,787 1,626,227
Net Asset Value per Unit ¤ 7.67 ¤ 7.16
Class Q
Units in Issue 294 294
Net Asset Value per Unit 9.58 8.83
Class S
Units in Issue 58,880 58,880
Net Asset Value per Unit £ 4.93 £ 4.48
* Class I Units were redesignated as Class A Units on 11 July 2007.
** Class B Units and Class C Units were launched on 10 July 2007.

Putnam World Trust————————————————————————————————————————————————————————————————————————————————————————————————————————————————————————————————————————————
Notes to the Financial Statements as at 30 June 2008 (Continued)
176
4. CURRENT AND PRIOR YEAR NAV DETAILS (Continued)
PUTNAM
U.S. LIQUID ASSETS FUND
30 JUNE 2008 30 JUNE 2007 30 JUNE 2006
USD USD USD
Total Net Asset Value $ 51,320,671 $ 68,025,126 $ 7,824,369
Class A
Units in Issue 4,268,711 3,249,362 3,580,636
Net Asset Value per Unit 1.00 1.00 1.00
Class B
Units in Issue 2,993,119 3,522,521 4,236,789
Net Asset Value per Unit 1.00 1.00 1.00
Class C
Units in Issue 3,294 3,189 3,062
Net Asset Value per Unit 1.00 1.00 1.00
Class I
Units in Issue 44,041,684 61,250,054 3,882
Net Asset Value per Unit 1.00 1.00 1.00
PUTNAM
U.S. SMALL-CAP VALUE EQUITY FUND
30 JUNE 2008 30 JUNE 2007 30 JUNE 2006
USD USD USD
Total Net Asset Value $ 15,302,708 $ 119,945,322 $ 117,114,407
Class A
Units in Issue 817,661 1,548,593 1,869,682
Net Asset Value per Unit 12.13 17.87 15.60
Class B
Units in Issue 171,643 332,225 510,092
Net Asset Value per Unit 11.70 17.33 15.20
Class C
Units in Issue 65,697 50,811 3,072
Net Asset Value per Unit 8.36 12.36 10.81
Class E
Units in Issue 96,551 118,965 335,828
Net Asset Value per Unit ¤ 10.56 ¤ 15.84 ¤ 14.03
Class I
Units in Issue 97,751 317,510 292,145
Net Asset Value per Unit 12.48 18.31 15.91
Class M
Units in Issue 294 8,205,502 8,547,830
Net Asset Value per Unit 6.51 9.45 8.13

Putnam World Trust————————————————————————————————————————————————————————————————————————————————————————————————————————————————————————————————————————————
Notes to the Financial Statements as at 30 June 2008 (Continued)
177
4. CURRENT AND PRIOR YEAR NAV DETAILS (Continued)
PUTNAM
VISTA (U.S. MID-CAP EQUITY) FUND*
30 JUNE 2008 30 JUNE 2007 30 JUNE 2006
USD USD USD
Total Net Asset Value $ — $ 40,524,127 $ 56,738,075
Class A
Units in Issue — 665,590 996,224
Net Asset Value per Unit — 25.50 23.49
Class B
Units in Issue — 952,863 1,476,301
Net Asset Value per Unit — 23.56 21.82
Class C
Units in Issue — 14,371 8,296
Net Asset Value per Unit — 11.26 10.40
Class E
Units in Issue — 69,979 87,897
Net Asset Value per Unit — ¤ 9.89 ¤ 9.25
Class I
Units in Issue — 2 7
Net Asset Value per Unit — 30.50 24.39
* Putnam Vista (U.S. Mid-Cap Equity) Fund merged with Putnam New Opportunities (U.S. Aggressive Growth) Fund on 27 June 2008.
5. RISKS ASSOCIATED WITH FINANCIAL INSTRUMENTS
As defined in FRS 29 (IFRS 7) Financial Instruments, the reporting standard, risk can be separated into the followingcomponents: market risk (which includes market price risk, foreign currency risk, interest rate risk), liquidity riskand credit or default risk. The Trust’s risk management process consists of a multi-layered and cross functionalreview that provides a system of checks and balances. The Investment Advisor performs monthly reviews and agreeson policies for managing each of these risks and they are summarised below. The Board of Directors of the Manager ofthe Trust receives monthly reporting on risk matters and reviews the risk management process on an annual basis.These policies have remained substantially unchanged since the beginning of the period to which these financialstatements relate.
(a) Market price riskMarket price risk arises mainly from uncertainty about future prices of financial instruments held. It represents thepotential loss the Trust might suffer through holding market positions in the face of price movements caused byfactors specific to the individual investment or factors affecting all instruments traded in the market. TheInvestment Advisor considers the asset allocation of the portfolios in order to minimise the risk associated withparticular countries or industry sectors whilst continuing to follow the Trust’s investment objectives. The marketrisk exposure for each Fund as at 30 June 2008 is equivalent to the fair values of investments held, as reflected in theSchedule of Investments on pages 25-116.

The Investment Advisor measures both the Fund’s total risk as well as its risk of underperformance versus its statedbenchmark (also referred to as active risk or tracking error “TE”).
Aggregate Value at riskThe Manager considers the asset allocation of the portfolios in order to minimise the risk associated with particularcountries or industry sectors whilst continuing to follow the Trust’s investment objectives. The Value at Risk (VaR)risk measure estimates the potential loss in pre-taxation profit over a given holding period for a specified confidencelevel. The VaR methodology is a statistically defined, probability-based approach that takes into account marketvolatilities as well as risk diversification by recognising offsetting positions and correlations between products andmarkets. Risks can be measured consistently across all markets and products, and risk measures can be aggregatedto arrive at a single risk number.
Given the interdependencies between market variables, the Trust also estimates the VaR or threshold loss that is notexpected to be exceeded at the 99th percentile confidence level over a 1-day horizon. Putnam uses a proprietarymulti-factor model to estimate the active risk (also referred to as tracking error) from which VaR estimates can beanalytically derived. The VaR estimates presented below are point-in-time and vary over time as a function ofmarket and portfolio composition changes.
Given its reliance on historical data, VaR is most effective in estimating risk exposures in markets in which there areno sudden fundamental changes or sudden shifts in market conditions. An inherent limitation of VaR is that thedistribution of past changes in market risk factors may not produce accurate predictions of future risk. DifferentVaR methodologies and distributional assumptions could produce a materially different VaR. Moreover, VaRcalculated for a one-day time horizon does not fully capture the market risk of positions that cannot be liquidated oroffset with hedges within one day. Changes in VaR between reporting periods are generally due to changes in levels ofexposure, volatilities and/or correlations among asset classes.
The table below shows the VaR of the Funds, its stated benchmark as well as the ratio between the two measures(also referred to as relative VaR) for both start and end of the review period.
178
Putnam World Trust————————————————————————————————————————————————————————————————————————————————————————————————————————————————————————————————————————————
Notes to the Financial Statements as at 30 June 2008 (Continued)
5. RISKS ASSOCIATED WITH FINANCIAL INSTRUMENTS (Continued)
(a) Market price risk (Continued)

(b) Foreign currency riskCurrency risk is the risk that the fair value or future cash flows of a financial instrument will fluctuate due tochanges in foreign exchange rates. The risk arises on financial instruments that are denominated in a currency otherthan the functional currency in which they are measured. A substantial proportion of each Fund’s assets are held incurrencies other than the base currency with the result that the Funds’ Balance Sheets can be significantly affectedby currency movements.
179
5. RISKS ASSOCIATED WITH FINANCIAL INSTRUMENTS (Continued)
(a) Market price risk (Continued)
Putnam World Trust————————————————————————————————————————————————————————————————————————————————————————————————————————————————————————————————————————————
Notes to the Financial Statements as at 30 June 2008 (Continued)
Putnam Emerging Information Sciences Fund USD USD USDCanadian Dollar 1,482 — 1,482
Euro — 26,883 26,883
Total 1,482 26,883 28,365
Putnam Emerging Markets Debt Fund USD USD USDArgentine Peso — 5,707 5,707
Brazilian Cruzeiro 101,408 — 101,408
Egyptian Pound 63,993 21,855 85,848
Total 165,401 27,562 192,963
Putnam Europe Equity Fund USD USD USDBritish Pound 4,320,286 7,553 4,327,839
Swiss Franc 1,063,763 — 1,063,763
Norwegian Krone 858,947 — 858,947
Swedish Krona 78,081 — 78,081
Euro 4,862,050 191,948 5,053,998
Total 11,183,127 199,501 11,382,628
Putnam Global Equity Multi-Alpha Fund USD USD USDAustralian Dollar 281,099 (22,902) 258,197
British Pound 1,258,979 (21,944) 1,237,035
Canadian Dollar 719,187 (8,234) 710,953
Danish Krone 54,448 — 54,448
Euro 2,302,171 47,292 2,349,463
Hong Kong Dollar 208,849 (28,275) 180,574
Indonesian Rupiah 53,275 — 53,275
Israeli Shekel 27,267 — 27,267
Japanese Yen 1,342,623 (11,040) 1,331,583
Malaysian Ringgit 72,904 — 72,904
Norwegian Krone 102,873 (33,451) 69,422
Singapore Dollar 342,369 20,692 363,061
South African Rand 145,346 — 145,346
Swedish Krona 306,586 86,606 393,192
Swiss Franc 303,741 48,397 352,138
Taiwan Dollar 290,854 4,117 294,971
Total 7,812,571 81,258 7,893,829
Currency TotalMonetary
Assets
Non-Monetary
AssetsCurrency TotalMonetary
Assets
Non-Monetary
Assets
Fund VaR Portfolio Benchmark Ratio
Putnam Emerging Information Sciences Fund 30-June-08 2.91 3.33 0.87
30-June-07 2.98 2.84 1.05
Putnam Emerging Markets Debt Fund 30-June-08 1.00 1.21 0.82
30-June-07 0.68 0.96 0.71
Putnam Europe Equity Fund 30-June-08 2.24 2.28 0.98
30-June-07 1.93 1.94 1.00
Putnam Global Fixed Income Alpha Fund S1 30-June-08 1.20 1.29 0.93
30-June-07 N/A N/A N/A
Putnam Global Fixed Income Alpha Fund S2 30-June-08 1.31 1.29 1.02
30-June-07 N/A N/A N/A
Putnam Global Equity Multi-Alpha Fund 30-June-08 N/A N/A 3.10
30-June-07 N/A N/A 1.07
Putnam Global Growth Fund 30-June-08 2.31 2.12 1.09
30-June-07 2.17 1.81 1.20
Putnam Global High Yield Bond Fund 30-June-08 1.24 1.40 0.88
30-June-07 0.75 0.70 1.07
Putnam Growth and Income (U.S. Value Equity) Fund 30-June-08 1.99 2.08 0.96
30-June-07 1.58 1.53 1.03
Putnam International (Non U.S. Core) Equity Fund 30-June-08 2.03 1.98 1.02
30-June-07 2.07 1.98 1.05
Putnam Investors (U.S. Core Equity) Fund 30-June-08 2.24 1.96 1.14
30-June-07 1.69 1.54 1.10
Putnam New Opportunities 30-June-08 2.08 2.06 1.01
(U.S. Aggressive Growth Equity) Fund 30-June-07 1.89 1.76 1.08
Putnam Total Return Fund 30-June-08 0.89 0.01 83.82
30-June-07 0.94 0.01 95.35
Putnam U.S. Small-Cap Value Equity Fund 30-June-08 2.72 2.67 1.02
30-June-07 1.96 1.94 1.01
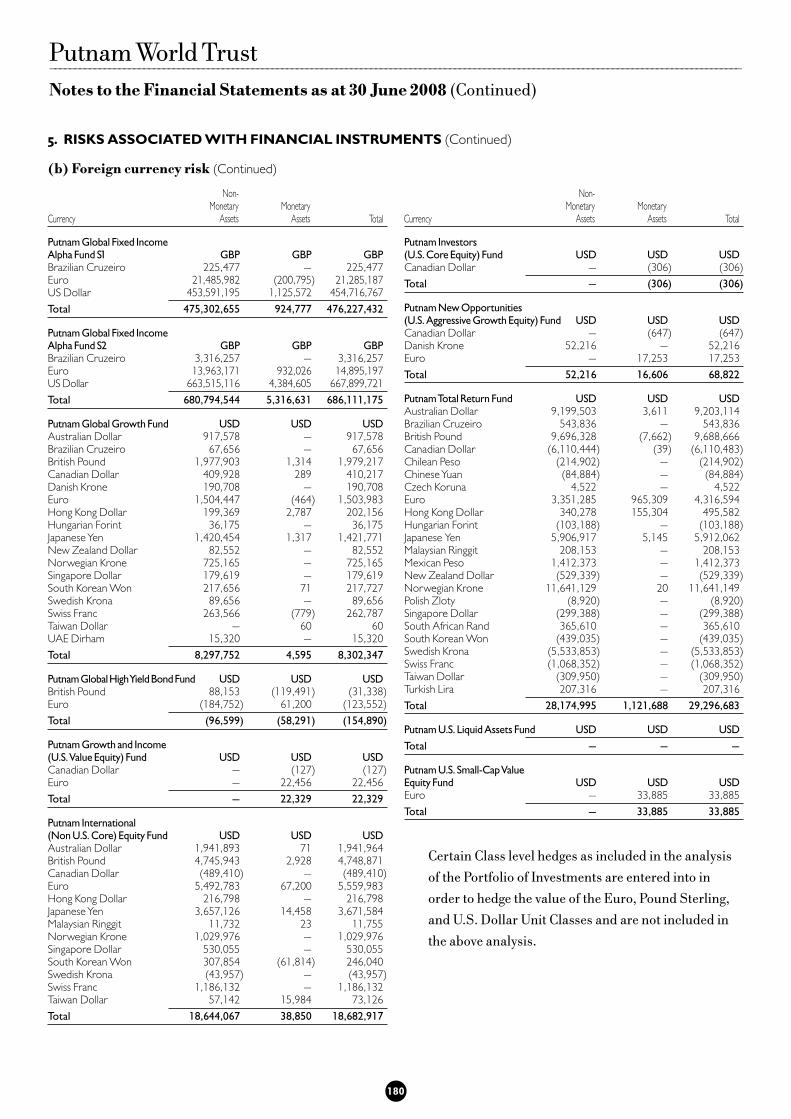
Putnam Global Fixed Income Alpha Fund S1 GBP GBP GBPBrazilian Cruzeiro 225,477 — 225,477
Euro 21,485,982 (200,795) 21,285,187
US Dollar 453,591,195 1,125,572 454,716,767
Total 475,302,655 924,777 476,227,432
Putnam Global Fixed Income Alpha Fund S2 GBP GBP GBPBrazilian Cruzeiro 3,316,257 — 3,316,257
Euro 13,963,171 932,026 14,895,197
US Dollar 663,515,116 4,384,605 667,899,721
Total 680,794,544 5,316,631 686,111,175
Putnam Global Growth Fund USD USD USDAustralian Dollar 917,578 — 917,578
Brazilian Cruzeiro 67,656 — 67,656
British Pound 1,977,903 1,314 1,979,217
Canadian Dollar 409,928 289 410,217
Danish Krone 190,708 — 190,708
Euro 1,504,447 (464) 1,503,983
Hong Kong Dollar 199,369 2,787 202,156
Hungarian Forint 36,175 — 36,175
Japanese Yen 1,420,454 1,317 1,421,771
New Zealand Dollar 82,552 — 82,552
Norwegian Krone 725,165 — 725,165
Singapore Dollar 179,619 — 179,619
South Korean Won 217,656 71 217,727
Swedish Krona 89,656 — 89,656
Swiss Franc 263,566 (779) 262,787
Taiwan Dollar — 60 60
UAE Dirham 15,320 — 15,320
Total 8,297,752 4,595 8,302,347
Putnam Global High Yield Bond Fund USD USD USDBritish Pound 88,153 (119,491) (31,338)
Euro (184,752) 61,200 (123,552)
Total (96,599) (58,291) (154,890)
Putnam Growth and Income (U.S. Value Equity) Fund USD USD USDCanadian Dollar — (127) (127)
Euro — 22,456 22,456
Total — 22,329 22,329
Putnam International (Non U.S. Core) Equity Fund USD USD USDAustralian Dollar 1,941,893 71 1,941,964
British Pound 4,745,943 2,928 4,748,871
Canadian Dollar (489,410) — (489,410)
Euro 5,492,783 67,200 5,559,983
Hong Kong Dollar 216,798 — 216,798
Japanese Yen 3,657,126 14,458 3,671,584
Malaysian Ringgit 11,732 23 11,755
Norwegian Krone 1,029,976 — 1,029,976
Singapore Dollar 530,055 — 530,055
South Korean Won 307,854 (61,814) 246,040
Swedish Krona (43,957) — (43,957)
Swiss Franc 1,186,132 — 1,186,132
Taiwan Dollar 57,142 15,984 73,126
Total 18,644,067 38,850 18,682,917
Putnam Investors (U.S. Core Equity) Fund USD USD USDCanadian Dollar — (306) (306)
Total — (306) (306)
Putnam New Opportunities(U.S. Aggressive Growth Equity) Fund USD USD USDCanadian Dollar — (647) (647)
Danish Krone 52,216 — 52,216
Euro — 17,253 17,253
Total 52,216 16,606 68,822
Putnam Total Return Fund USD USD USDAustralian Dollar 9,199,503 3,611 9,203,114
Brazilian Cruzeiro 543,836 — 543,836
British Pound 9,696,328 (7,662) 9,688,666
Canadian Dollar (6,110,444) (39) (6,110,483)
Chilean Peso (214,902) — (214,902)
Chinese Yuan (84,884) — (84,884)
Czech Koruna 4,522 — 4,522
Euro 3,351,285 965,309 4,316,594
Hong Kong Dollar 340,278 155,304 495,582
Hungarian Forint (103,188) — (103,188)
Japanese Yen 5,906,917 5,145 5,912,062
Malaysian Ringgit 208,153 — 208,153
Mexican Peso 1,412,373 — 1,412,373
New Zealand Dollar (529,339) — (529,339)
Norwegian Krone 11,641,129 20 11,641,149
Polish Zloty (8,920) — (8,920)
Singapore Dollar (299,388) — (299,388)
South African Rand 365,610 — 365,610
South Korean Won (439,035) — (439,035)
Swedish Krona (5,533,853) — (5,533,853)
Swiss Franc (1,068,352) — (1,068,352)
Taiwan Dollar (309,950) — (309,950)
Turkish Lira 207,316 — 207,316
Total 28,174,995 1,121,688 29,296,683
Putnam U.S. Liquid Assets Fund USD USD USD
Total — — —
Putnam U.S. Small-Cap Value Equity Fund USD USD USDEuro — 33,885 33,885
Total — 33,885 33,885
Certain Class level hedges as included in the analysisof the Portfolio of Investments are entered into inorder to hedge the value of the Euro, Pound Sterling,and U.S. Dollar Unit Classes and are not included inthe above analysis.
180
5. RISKS ASSOCIATED WITH FINANCIAL INSTRUMENTS (Continued)
(b) Foreign currency risk (Continued)
Putnam World Trust————————————————————————————————————————————————————————————————————————————————————————————————————————————————————————————————————————————
Notes to the Financial Statements as at 30 June 2008 (Continued)
Currency TotalMonetary
Assets
Non-Monetary
Assets Currency TotalMonetary
Assets
Non-Monetary
Assets

181
Putnam World Trust————————————————————————————————————————————————————————————————————————————————————————————————————————————————————————————————————————————
Notes to the Financial Statements as at 30 June 2008 (Continued)
(c) Interest rate risk Interest rate risk is defined as the risk that the fair value or future cash flows of a financial instrument will fluctuatebecause of changes in market interest rates. The risk arises on financial instruments whose fair value or future cashflows are affected by changes in interest rates. Short-term securities are less sensitive to interest rate changes thanlonger-term securities, but they also usually offer lower yields. Funds invest in both fixed rate and floating ratesecurities.
The interest rate profile of each Fund’s financial assets at 30 June 2008 are presented below:
Putnam Emerging Information Sciences Fund
1-5 years Total
Transferable Securities 158,000 — — 20,424,185 20,582,185
Financial Derivative Instruments — — — 14,033 14,033
Other assets — — — 228,148 228,148
Cash and bank balances 27,835 — — — 27,835———————————————— ———————————————— ———————————————— ———————————————— ————————————————
Total assets 185,835 — — 20,666,366 20,852,201———————————————— ———————————————— ———————————————— ———————————————— ———————————————————————————————— ———————————————— ———————————————— ———————————————— ————————————————
Other Liabilities — — — (160,582) (160,582)———————————————— ———————————————— ———————————————— ———————————————— ————————————————
Total Liabilities —— — — (160,582) (160,582)———————————————— ———————————————— ———————————————— ———————————————— ———————————————————————————————— ———————————————— ———————————————— ———————————————— ————————————————
Total 20,691,619————————————————————————————————
Putnam Emerging Markets Debt Fund
1-5 years Total
Transferable Securities 760,202 672,117 1,362,930 — 2,795,249
Other assets — — — 50,180 50,180
Cash and bank balances 28,126 — — — 28,126———————————————— ———————————————— ———————————————— ———————————————— ————————————————
Total assets 788,328 672,117 1,362,930 50,180 2,873,555———————————————— ———————————————— ———————————————— ———————————————— ———————————————————————————————— ———————————————— ———————————————— ———————————————— ————————————————
Financial Derivative Instruments — — — (32,568) (32,568)
Other Liabilities — — — (8) (8)———————————————— ———————————————— ———————————————— ———————————————— ————————————————
Total Liabilities —— — — (32,576) (32,576)———————————————— ———————————————— ———————————————— ———————————————— ———————————————————————————————— ———————————————— ———————————————— ———————————————— ————————————————
Total 2,840,979————————————————————————————————
Putnam Europe Equity Fund
1-5 years Total
Transferable Securities 9,970 — — 10,985,118 10,995,088
Financial Derivative Instruments — — — 38,173 38,173
Cash and bank balances 359,386 — — — 359,386
Other assets — — — 159,521 159,521———————————————— ———————————————— ———————————————— ———————————————— ————————————————
Total assets 369,356 — — 11,182,812 11,552,168———————————————— ———————————————— ———————————————— ———————————————— ———————————————————————————————— ———————————————— ———————————————— ———————————————— ————————————————
Other Liabilities — — — (241,287) (241,287)———————————————— ———————————————— ———————————————— ———————————————— ————————————————
Total Liabilities —— — — (241,287) (241,287)———————————————— ———————————————— ———————————————— ———————————————— ———————————————————————————————— ———————————————— ———————————————— ———————————————— ————————————————
Total 11,310,881————————————————————————————————
Non-Interest
bearingOver 5 years
Up to
1 year
Non-Interest
bearingOver 5 years
Up to
1 year
Non-Interest
bearingOver 5 years
Up to
1 year
5. RISKS ASSOCIATED WITH FINANCIAL INSTRUMENTS (Continued)

Putnam World Trust————————————————————————————————————————————————————————————————————————————————————————————————————————————————————————————————————————————
Notes to the Financial Statements as at 30 June 2008 (Continued)
182
Putnam Global Equity Multi-Alpha Fund
1-5 years Total
Transferable Securities 996,969 — — 14,778,045 15,775,014
Financial Derivatives Investments — — — 37,675 37,675
Other assets — — — 174,317 174,317
Cash and bank balances 360,533 — — — 360,533———————————————— ———————————————— ———————————————— ———————————————— ————————————————
Total assets 1,357,502 — — 14,990,037 16,347,539———————————————— ———————————————— ———————————————— ———————————————— ———————————————————————————————— ———————————————— ———————————————— ———————————————— ————————————————
Other Liabilities — — — (35,558) (35,558)———————————————— ———————————————— ———————————————— ———————————————— ————————————————
Total Liabilities — — — (35,558) (35,558)———————————————— ———————————————— ———————————————— ———————————————— ———————————————————————————————— ———————————————— ———————————————— ———————————————— ————————————————
Total 16,311,981————————————————————————————————
Putnam Global Fixed Income Alpha Fund S1
1-5 years Total
Transferable Securities 198,414,688 46,571,757 475,836,604 — 720,823,049
Financial Derivative Instruments — — — 11,661,444 11,661,444
Other assets — — — 150,747,346 150,747,346
Cash and bank balances 4,289,467 — — — 4,289,467———————————————— ———————————————— ———————————————— ———————————————— ————————————————
Total assets 202,704,155 46,571,757 475,836,604 162,408,790 887,521,306———————————————— ———————————————— ———————————————— ———————————————— ———————————————————————————————— ———————————————— ———————————————— ———————————————— ————————————————
Financial Derivative Instruments — — — (150,758,475) (150,758,475)
Other Liabilities — — — (281,390,888) (281,390,888)———————————————— ———————————————— ———————————————— ———————————————— ————————————————
Total Liabilities — — — (432,149,363) (432,149,363)———————————————— ———————————————— —————————— —————— ———————————————— ———————————————————————————————— ———————————————— ———————————————— ———————————————— ————————————————
Total 455,371,943————————————————————————————————
Putnam Global Fixed Income Alpha Fund S2
1-5 years Total
Transferable Securities 47,452,760 72,211,269 1,724,530,796 — 1,844,194,825
Financial Derivative Instruments — — — 19,467,804 19,467,804
Other assets — — — 549,664,415 549,664,415
Cash and bank balances 9,254,773 — — — 9,254,773———————————————— ———————————————— ———————————————— ———————————————— ————————————————
Total assets 56,707,533 72,211,269 1,724,530,796 569,132,219 2,422,581,817———————————————— ———————————————— ———————————————— ———————————————— ———————————————————————————————— ———————————————— ———————————————— ———————————————— ————————————————
Financial Derivative Instruments — — — (552,962,046) (552,962,046)
Other Liabilities — — — (1,200,460,698) (1,200,460,698)———————————————— ———————————————— ———————————————— ———————————————— ————————————————
Total Liabilities — — — (1,753,422,744) (1,753,422,744)———————————————— ———————————————— ———————————————— ———————————————— ———————————————————————————————— ———————————————— ———————————————— ———————————————— ————————————————
Total 669,159,073————————————————————————————————
Non-Interest
bearingOver 5 years
Up to
1 year
Non-Interest
bearingOver 5 years
Up to
1 year
Non-Interest
bearingOver 5 years
Up to
1 year
5. RISKS ASSOCIATED WITH FINANCIAL INSTRUMENTS (Continued)
(c) Interest rate risk (Continued)

Putnam Global High Yield Bond Fund
1-5 years Total
Cash and bank balances 352,762 — — — 352,762
Transferable Securities 12,234,025 72,088,403 186,035,481 6,159,167 276,517,076
Financial Derivative Instruments — — — — —
Other assets — — — 5,813,196 5,772,971———————————————— ———————————————— ———————————————— ———————————————— ————————————————
Total assets 17,099,806 72,088,403 186,035,481 11,972,363 282,642,809———————————————— ———————————————— ———————————————— ———————————————— ———————————————————————————————— ———————————————— ———————————————— ———————————————— ————————————————
Financial Derivative Instruments — — — (528,904) (528,904)
Other Liabilities — — — (1,825,665) (1,825,665)———————————————— ———————————————— ———————————————— ———————————————— ————————————————
Total Liabilities — — — (2,354,569) (2,354,569)———————————————— ———————————————— ———————————————— ———————————————— ———————————————————————————————— ———————————————— ———————————————— ———————————————— ————————————————
Total 280,288,240————————————————————————————————
Putnam Growth and Income
(U.S. Value Equity) Fund
1-5 years Total
Transferable Securities 138,000 — — 17,524,772 17,662,772
Financial Derivative Instruments — — — 3,868 3,868
Other assets — — — 515,899 515,899
Cash and bank balances 23,185 — — — 23,185———————————————— ———————————————— ———————————————— ———————————————— ————————————————
Total assets 161,185 — — 18,044,539 18,205,724———————————————— ———————————————— ———————————————— ———————————————— ———————————————————————————————— ———————————————— ———————————————— ———————————————— ————————————————
Other Liabilities — — — (539,646) (539,646)———————————————— ———————————————— ———————————————— ———————————————— ————————————————
Total Liabilities — — — (539,646) (539,646)———————————————— ———————————————— ———————————————— ———————————————— ———————————————————————————————— ———————————————— ———————————————— ———————————————— ————————————————
Total 17,666,078————————————————————————————————
Putnam Investors (U.S. Core Equity) Fund
1-5 years Total
Transferable Securities 147,000 — — 11,232,567 11,379,567
Financial Derivative Instruments — — — 3,790 3,790
Other assets — — — 15,600 15,600———————————————— ———————————————— ———————————————— ———————————————— ————————————————
Total assets 229,173 — — 11,398,957 11,398,957———————————————— ———————————————— ———————————————— ———————————————— ———————————————————————————————— ———————————————— ———————————————— ———————————————— ————————————————
Other Liabilities — — — (122,612) (122,612)
Cash and bank balances (2,619) — — — (2,619)———————————————— ———————————————— ———————————————— ———————————————— ————————————————
Total Liabilities (2,619) — — (122,612) (125,231)———————————————— ———————————————— ———————————————— ———————————————— ———————————————————————————————— ———————————————— ———————————————— ———————————————— ————————————————
Total 11,273,726————————————————————————————————
Non-Interest
bearingOver 5 years
Up to
1 year
Non-Interest
bearingOver 5 years
Up to
1 year
Non-Interest
bearingOver 5 years
Up to
1 year
183
5. RISKS ASSOCIATED WITH FINANCIAL INSTRUMENTS (Continued)
(c) Interest rate risk (Continued)
Putnam World Trust————————————————————————————————————————————————————————————————————————————————————————————————————————————————————————————————————————————
Notes to the Financial Statements as at 30 June 2008 (Continued)

Putnam New Opportunities
(U.S. Aggressive Growth Equity) Fund
1-5 years Total
Transferable Securities 3,829,000 — — 38,969,446 42,798,446
Financial Derivative Instruments — — — 119 119
Other assets — — — 23,901,211 23,901,211———————————————— ———————————————— ———————————————— ———————————————— ————————————————
Total assets 3,829,000 — — 62,870,776 66,699,776———————————————— ———————————————— ———————————————— ———————————————— ———————————————————————————————— ———————————————— ———————————————— ———————————————— ————————————————
Financial Derivative Instruments — — — (616) (616)
Other Liabilities — — — (1,093,336) (1,093,336)
Cash and bank balances (26,721,608) — — — (26,721,608)———————————————— ———————————————— ———————————————— ———————————————— ————————————————
Total Liabilities (26,721,608) — — (1,105,346) (27,815,560)———————————————— ———————————————— ———————————————— ———————————————— ———————————————————————————————— ———————————————— ———————————————— ———————————————— ————————————————
Total 38,884,216————————————————————————————————
Putnam Total Return Fund
1-5 years Total
Transferable Securities 30,255,097 2,536,688 23,818,500 80,737,171 137,347,453
Financial Derivative Instruments — — — 3,527,056 3,527,056
Other assets — — — 11,940,016 11,940,016
Cash and bank balances 1,043,608 — — — 1,043,608———————————————— ———————————————— ———————————————— ———————————————— ————————————————
Total assets 37,341,757 2,536,688 23,818,500 96,204,243 153,858,133———————————————— ———————————————— ———————————————— ———————————————— ———————————————————————————————— ———————————————— ———————————————— ———————————————— ————————————————
Financial Derivative Instruments — — — (8,255,086) (8,255,086)
Other Liabilities — — — (23,033,676) (23,033,676)———————————————— ———————————————— ———————————————— ———————————————— ————————————————
Total Liabilities — — — (31,288,762) (31,288,762)———————————————— ———————————————— ———————————————— ———————————————— ———————————————————————————————— ———————————————— ———————————————— ———————————————— ————————————————
Total 122,569,371————————————————————————————————
Putnam U.S. Liquid Assets Fund
1-5 years Total
Transferable Securities 49,628,827 699,878 1,270,000 — 51,598,705
Other assets — — — 115,277 115,277———————————————— ———————————————— ———————————————— ———————————————— ————————————————
Total assets 49,628,827 699,878 1,270,000 115,277 51,713,982———————————————— ———————————————— ———————————————— ———————————————— ———————————————————————————————— ———————————————— ———————————————— ———————————————— ————————————————
Other Liabilities — — — (328,799) (328,799)
Cash and bank balances (64,512) — — — (64,512)———————————————— ———————————————— ———————————————— ———————————————— ————————————————
Total Liabilities (64,512) — — (328,799) (393,311)———————————————— ———————————————— ———————————————— ———————————————— ———————————————————————————————— ———————————————— ———————————————— ———————————————— ————————————————
Total 51,320,671————————————————————————————————
Non-Interest
bearingOver 5 years
Up to
1 year
Non-Interest
bearingOver 5 years
Up to
1 year
Non-Interest
bearingOver 5 years
Up to
1 year
184
5. RISKS ASSOCIATED WITH FINANCIAL INSTRUMENTS (Continued)
(c) Interest rate risk (Continued)
Putnam World Trust————————————————————————————————————————————————————————————————————————————————————————————————————————————————————————————————————————————
Notes to the Financial Statements as at 30 June 2008 (Continued)

The interest rate profile of each of the Fund’s financial assets at 30 June 2007 are presented below:
The following Funds, Putnam Global Growth Fund, Putnam International (Non U.S. Core) Equity Fund and PutnamU.S. Small-Cap Value Equity Fund have no or very limited exposure to interest rate risk since the majority of eachFunds financial assets and liabilities are non-interest bearing. As a result, these Funds are not subject to significantamounts of risk due to fluctuations in the prevailing levels of market interest rates.
Putnam American Government Bond Fund
Currency USD USD USD % Years
Long-Term Investments USD 5,690,273 507,587 5,182,686 4.72 22.84
Short-Term Investments USD 51,656 — 51,656 4.15 0.15———————————————— ———————————————— ———————————————— ———————————————— ————————————————
Total 5,741,929 507,587 5,234,342 8.87 22.99———————————————— ———————————————— ———————————————— ———————————————— ———————————————————————————————— ———————————————— ———————————————— ———————————————— ————————————————
Putnam Emerging Markets Debt Fund
Currency USD USD USD % Years
Long-Term Investments USD 2,083,461 290,438 1,793,023 6.64 —
Short-Term Investments USD — — — — — ———————————————— ———————————————— ———————————————— ———————————————— ————————————————
Total 2,083,461 290,438 1,793,023 6.64 — ———————————————— ———————————————— ———————————————— ———————————————— ———————————————————————————————— ———————————————— ———————————————— ———————————————— ————————————————
The George Putnam (U.S. Equity and Bond) Fund
Currency USD USD USD % Years
Long-Term Investments USD 3,846,088 565,862 3,280,226 5.88 21.23
Short-Term Investments USD 10,000 10,000 — 6.31 0.05———————————————— ———————————————— ———————————————— ———————————————— ————————————————
Total 3,856,088 575,862 3,280,226 12.19 21.28———————————————— ———————————————— ———————————————— ———————————————— ———————————————————————————————— ———————————————— ———————————————— ———————————————— ————————————————
Fixed interest
rate weighted
average year
for which rate
is fixed
Fixed interest
rate weighted
average
interest rate
Fixed
interest rate
assets
Floating
interest rate
assets
Total
Assets
Fixed interest
rate weighted
average year
for which rate
is fixed
Fixed interest
rate weighted
average
interest rate
Fixed
interest rate
assets
Floating
interest rate
assets
Total
Assets
Fixed interest
rate weighted
average year
for which rate
is fixed
Fixed interest
rate weighted
average
interest rate
Fixed
interest rate
assets
Floating
interest rate
assets
Total
Assets
185
5. RISKS ASSOCIATED WITH FINANCIAL INSTRUMENTS (Continued)
(c) Interest rate risk (Continued)
Putnam World Trust————————————————————————————————————————————————————————————————————————————————————————————————————————————————————————————————————————————
Notes to the Financial Statements as at 30 June 2008 (Continued)

Putnam Global High Yield Bond Fund
Currency USD USD USD % Years
Long-Term Investments USD 33,646,494 2,727,712 30,918,782 8.07 7.55
Short-Term Investments USD — — — — — ———————————————— ———————————————— ———————————————— ———————————————— ————————————————
Total 33,646,494 2,727,712 30,918,782 8.07 7.55———————————————— ———————————————— ———————————————— ———————————————— ———————————————————————————————— ———————————————— ———————————————— ———————————————— ————————————————
Putnam U.S. Liquid Assets Fund
Currency USD USD USD % Years
Long-Term Investments USD 3,130,000 3,130,000 — — —
Short-Term Investments USD 64,887,774 12,428,232 52,459,542 4.86 0.15———————————————— ———————————————— ———————————————— ———————————————— ————————————————
Total 68,017,774 15,558,232 52,459,542 4.86 0.15———————————————— ———————————————— ———————————————— ———————————————— ———————————————————————————————— ———————————————— ———————————————— ———————————————— ————————————————
(d) Liquidity riskThis is the risk that the Trust will encounter difficulty in meeting obligations associated with financial liabilities.The Trust’s assets comprise mainly readily realisable securities. The main liability of the Trust is the redemption ofany units that investors wish to sell.
The Trust’s financial instruments that include investments in OTC derivative contracts, which are not traded in anorganised public market, may be illiquid. As a result, the Trust may not be able to promptly liquidate some of itsinvestments in these instruments at an amount close to its fair value in order to meet its liquidity requirements or to respondto specific events such as deterioration in the credit worthiness of any particular issuer. Market Value amounts arepresented in the Schedule of Investments to indicate the extent of the Trust’s involvement in such instruments.
The trading volumes of stocks and fixed income securities held by each Fund are generally sufficient to satisfyliquidity requirements when necessary. However, to minimise or mitigate the effect of liquidity risk where deemednecessary, the Manager would either reposition the portfolio or adjust the allocation to obtain a higher concentrationof more liquid securities.
The table below analyses the Trust’s financial liabilities into relevant maturity groupings based on the remainingperiod of the balance sheet date to the contractual maturity date. The amounts in the table are the contractualundiscounted cash flows.
Fixed interest
rate weighted
average year
for which rate
is fixed
Fixed interest
rate weighted
average
interest rate
Fixed
interest rate
assets
Floating
interest rate
assets
Total
Assets
Fixed interest
rate weighted
average year
for which rate
is fixed
Fixed interest
rate weighted
average
interest rate
Fixed
interest rate
assets
Floating
interest rate
assets
Total
Assets
186
5. RISKS ASSOCIATED WITH FINANCIAL INSTRUMENTS (Continued)
(c) Interest rate risk (Continued)
Putnam World Trust————————————————————————————————————————————————————————————————————————————————————————————————————————————————————————————————————————————
Notes to the Financial Statements as at 30 June 2008 (Continued)
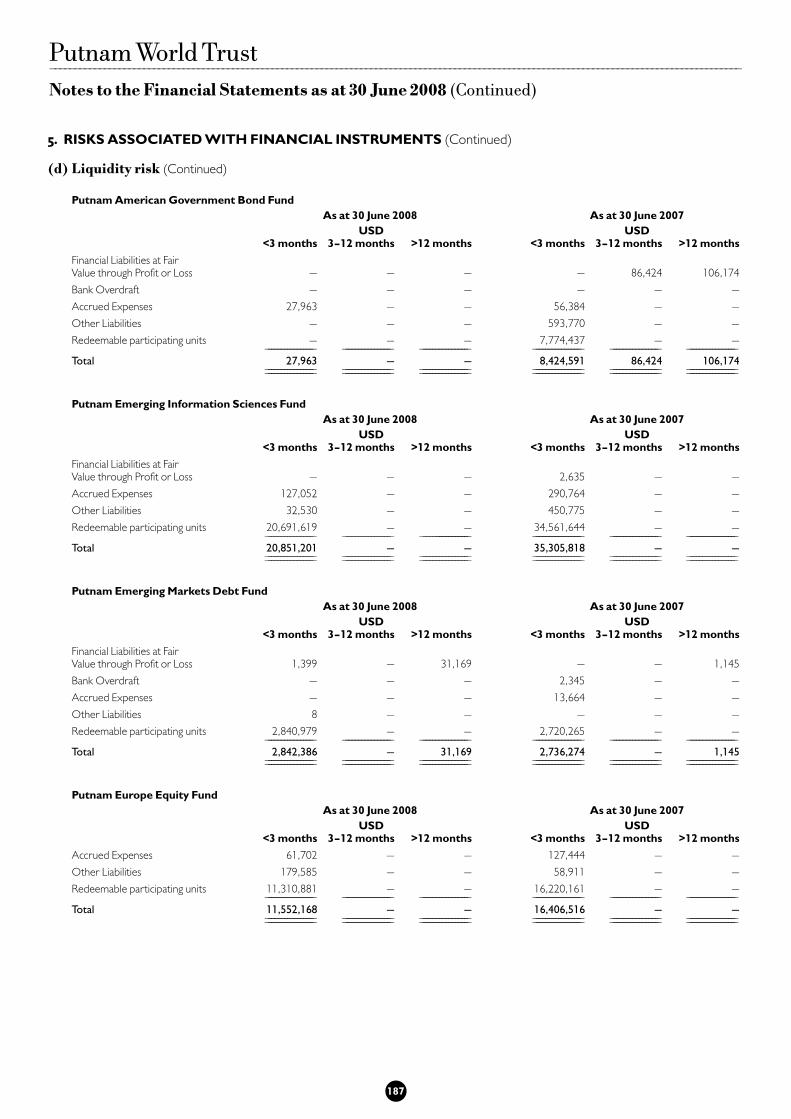
Putnam World Trust————————————————————————————————————————————————————————————————————————————————————————————————————————————————————————————————————————————
Notes to the Financial Statements as at 30 June 2008 (Continued)
187
Putnam American Government Bond Fund
As at 30 June 2008 As at 30 June 2007
USD USD
<3 months 3-12 months >12 months <3 months 3-12 months >12 months
Financial Liabilities at Fair
Value through Profit or Loss — — — — 86,424 106,174
Bank Overdraft — — — — — —
Accrued Expenses 27,963 — — 56,384 — —
Other Liabilities — — — 593,770 — —
Redeemable participating units — — — 7,774,437 — ———————————————— ——————————————— ——————————————— ——————————————— ——————————————— ———————————————
Total 27,963 — — 8,424,591 86,424 106,174 ——————————————— ——————————————— ——————————————— ——————————————— ——————————————— —————————————————————————————— ——————————————— ——————————————— ——————————————— ——————————————— ———————————————
Putnam Emerging Information Sciences Fund
As at 30 June 2008 As at 30 June 2007
USD USD
<3 months 3-12 months >12 months <3 months 3-12 months >12 months
Financial Liabilities at Fair
Value through Profit or Loss — — — 2,635 — —
Accrued Expenses 127,052 — — 290,764 — —
Other Liabilities 32,530 — — 450,775 — —
Redeemable participating units 20,691,619 — — 34,561,644 — ———————————————— ——————————————— ——————————————— ——————————————— ——————————————— ———————————————
Total 20,851,201 — — 35,305,818 — ———————————————— ——————————————— ——————————————— ——————————————— ——————————————— —————————————————————————————— ——————————————— ——————————————— ——————————————— ——————————————— ———————————————
Putnam Emerging Markets Debt Fund
As at 30 June 2008 As at 30 June 2007
USD USD
<3 months 3-12 months >12 months <3 months 3-12 months >12 months
Financial Liabilities at Fair
Value through Profit or Loss 1,399 — 31,169 — — 1,145
Bank Overdraft — — — 2,345 — —
Accrued Expenses — — — 13,664 — —
Other Liabilities 8 — — — — —
Redeemable participating units 2,840,979 — — 2,720,265 — ———————————————— ——————————————— ——————————————— ——————————————— ——————————————— ———————————————
Total 2,842,386 — 31,169 2,736,274 — 1,145 ——————————————— ——————————————— ——————————————— ——————————————— ——————————————— —————————————————————————————— ——————————————— ——————————————— ——————————————— ——————————————— ———————————————
Putnam Europe Equity Fund
As at 30 June 2008 As at 30 June 2007
USD USD
<3 months 3-12 months >12 months <3 months 3-12 months >12 months
Accrued Expenses 61,702 — — 127,444 — —
Other Liabilities 179,585 — — 58,911 — —
Redeemable participating units 11,310,881 — — 16,220,161 — ———————————————— ——————————————— ——————————————— ——————————————— ——————————————— ———————————————
Total 11,552,168 — — 16,406,516 — ———————————————— ——————————————— ——————————————— ——————————————— ——————————————— —————————————————————————————— ——————————————— ——————————————— ——————————————— ——————————————— ———————————————
5. RISKS ASSOCIATED WITH FINANCIAL INSTRUMENTS (Continued)
(d) Liquidity risk (Continued)

188
Putnam World Trust————————————————————————————————————————————————————————————————————————————————————————————————————————————————————————————————————————————
Notes to the Financial Statements as at 30 June 2008 (Continued)
The George Putnam (U.S. Equity and Bond) Fund
As at 30 June 2008 As at 30 June 2007
USD USD
<3 months 3-12 months >12 months <3 months 3-12 months >12 months
Financial Liabilities at Fair
Value through Profit or Loss — — — 11,685 5,752 63,167
Bank Overdraft — — — — — —
Accrued Expenses 51,177 — — 117,118 — —
Other Liabilities — — — 1,186,750 — —
Redeemable participating units — — — 12,355,811 — ———————————————— ——————————————— ——————————————— ——————————————— ——————————————— ———————————————
Total 51,177 — — 13,671,364 5,752 63,167 ——————————————— ——————————————— ——————————————— ——————————————— ——————————————— —————————————————————————————— ——————————————— ——————————————— ——————————————— ——————————————— ———————————————
Putnam Global Equity Multi-Alpha Fund
As at 30 June 2008 As at 30 June 2007
USD USD
<3 months 3-12 months >12 months <3 months 3-12 months >12 months
Financial Liabilities at Fair
Value through Profit or Loss — — — 56,913 — —
Accrued Expenses 35,558 — — 153,807 — —
Other Liabilities — — — 391,507 — —
Redeemable participating units 16,316,858 — — 27,583,646 — ———————————————— ——————————————— ——————————————— ——————————————— ——————————————— ———————————————
Total 16,352,416 — — 28,185,873 — ———————————————— ——————————————— ——————————————— ——————————————— ——————————————— —————————————————————————————— ——————————————— ——————————————— ——————————————— ——————————————— ———————————————
Putnam Global Fixed Income Alpha Fund S1*
As at 30 June 2008
GBP
<3 months 3-12 months >12 months
Financial Liabilities at Fair
Value through Profit or Loss 147,918,477 73,378 2,766,620
Accrued Expenses 490,934 — —
Other Liabilities 280,899,954 — —
Redeemable participating units 455,371,943 — —————————————————— ——————————————— ———————————————
Total 884,681,308 73,378 2,766,620 ————————————————— ——————————————— ———————————————————————————————— ——————————————— ———————————————
* Putnam Global Fixed Income Alpha Fund S1 launched on 21 February 2008.
Putnam Global Fixed Income Alpha Fund S2*
As at 30 June 2008
GBP
<3 months 3-12 months >12 months
Financial Liabilities at Fair
Value through Profit or Loss 532,693,844 629,945 19,638,257
Accrued Expenses 686,400 — —
Other Liabilities 1,199,774,298 — —
Redeemable participating units 669,159,073 — ———————————————————— ——————————————— ———————————————
Total 2,402,313,615 629,945 19,638,257 ——————————————————— ——————————————— —————————————————————————————————— ——————————————— ———————————————
* Putnam Global Fixed Income Alpha Fund S2 launched on 25 February 2008.
5. RISKS ASSOCIATED WITH FINANCIAL INSTRUMENTS (Continued)
(d) Liquidity risk (Continued)

189
Putnam World Trust————————————————————————————————————————————————————————————————————————————————————————————————————————————————————————————————————————————
Notes to the Financial Statements as at 30 June 2008 (Continued)
Putnam Global Growth Fund
As at 30 June 2008 As at 30 June 2007
USD USD
<3 months 3-12 months >12 months <3 months 3-12 months >12 months
Accrued Expenses 79,978 — — 272,534 — —
Other Liabilities 222,336 — — 199,208 — —
Redeemable participating units 14,376,146 — — 24,631,018 — ———————————————— ——————————————— ——————————————— ——————————————— ——————————————— ———————————————
Total 14,678,460 — — 25,102,760 — ———————————————— ——————————————— ——————————————— ——————————————— ——————————————— —————————————————————————————— ——————————————— ——————————————— ——————————————— ——————————————— ———————————————
Putnam Global High Yield Bond Fund
As at 30 June 2008 As at 30 June 2007
USD USD
<3 months 3-12 months >12 months <3 months 3-12 months >12 months
Financial Liabilities at Fair
Value through Profit or Loss 330,679 9,439 188,786 — — —
Bank Overdraft — — — 82,962 — —
Accrued Expenses 739,567 — — 258,780 — —
Other Liabilities 1,086,098 — — — — —
Redeemable participating units 280,288,240 — — 42,524,901 — —————————————————— ——————————————— ——————————————— ——————————————— ——————————————— ———————————————
Total 282,444,584 9,439 188,786 42,866,643 — —————————————————— ——————————————— ——————————————— ——————————————— ——————————————— ———————————————————————————————— ——————————————— ——————————————— ——————————————— ——————————————— ———————————————
Putnam Growth and Income (U.S. Value Equity) Fund
As at 30 June 2008 As at 30 June 2007
USD USD
<3 months 3-12 months >12 months <3 months 3-12 months >12 months
Accrued Expenses 89,786 — — 299,355 — —
Other Liabilities 449,860 — — 16,330 — —
Redeemable participating units 17,666,078 — — 35,626,442 — ———————————————— ——————————————— ——————————————— ——————————————— ——————————————— ———————————————
Total 18,205,724 — — 35,942,127 — ———————————————— ——————————————— ——————————————— ——————————————— ——————————————— —————————————————————————————— ——————————————— ——————————————— ——————————————— ——————————————— ———————————————
Putnam International (Non U.S. Core) Equity Fund
As at 30 June 2008 As at 30 June 2007
USD USD
<3 months 3-12 months >12 months <3 months 3-12 months >12 months
Bank Overdraft 117,580 — — — — —
Accrued Expenses 53,547 — — 288,526 — —
Other Liabilities 138,276 — — 253,409 — —
Redeemable participating units 18,284,172 — — 30,293,056 — ———————————————— ——————————————— ——————————————— ——————————————— ——————————————— ———————————————
Total 18,593,575 — — 30,834,991 — ———————————————— ——————————————— ——————————————— ——————————————— ——————————————— —————————————————————————————— ——————————————— ——————————————— ——————————————— ——————————————— ———————————————
Putnam Investors (U.S. Core Equity) Fund
As at 30 June 2008 As at 30 June 2007
USD USD
<3 months 3-12 months >12 months <3 months 3-12 months >12 months
Financial Liabilities at Fair
Value through Profit or Loss — — — 625 — —
Bank Overdraft 2,619 — — — — —
Accrued Expenses 99,128 — — 199,366 — —
Other Liabilities 23,484 — — 567,025 — —
Redeemable participating units 11,273,726 — — 22,172,133 — ———————————————— ——————————————— ——————————————— ——————————————— ——————————————— ———————————————
Total 11,398,957 — — 22,939,149 — ———————————————— ——————————————— ——————————————— ——————————————— ——————————————— —————————————————————————————— ——————————————— ——————————————— ——————————————— ——————————————— ———————————————
5. RISKS ASSOCIATED WITH FINANCIAL INSTRUMENTS (Continued)
(d) Liquidity risk (Continued)

Putnam New Opportunities (U.S. Aggressive Growth Equity) Fund
As at 30 June 2008 As at 30 June 2007
USD USD
<3 months 3-12 months >12 months <3 months 3-12 months >12 months
Financial Liabilities at Fair
Value through Profit or Loss 616 — — — — —
Bank Overdraft 26,721,608 — — 196,334 — —
Accrued Expenses 91,083 — — 211,665 — —
Other Liabilities 1,002,253 — — 569,954 — —
Redeemable participating units 38,884,216 — — 23,457,539 — ———————————————— ——————————————— ——————————————— ——————————————— ——————————————— ———————————————
Total 66,699,776 — — 24,435,492 — ———————————————— ——————————————— ——————————————— ——————————————— ——————————————— —————————————————————————————— ——————————————— ——————————————— ——————————————— ——————————————— ———————————————
Putnam Opportunistic Value Fund
As at 30 June 2008 As at 30 June 2007
USD USD
<3 months 3-12 months >12 months <3 months 3-12 months >12 months
Financial Liabilities at Fair
Value through Profit or Loss — — — — — —
Bank Overdraft — — — — — —
Accrued Expenses (1,677) — — 94,768 — —
Other Liabilities — — — 2,480 — —
Redeemable participating units — — — 4,045,891 — ———————————————— ——————————————— ——————————————— ——————————————— ——————————————— ———————————————
Total (1,677) — — 4,143,139 — ———————————————— ——————————————— ——————————————— ——————————————— ——————————————— —————————————————————————————— ——————————————— ——————————————— ——————————————— ——————————————— ———————————————
Putnam Total Return Fund
As at 30 June 2008 As at 30 June 2007
USD USD
<3 months 3-12 months >12 months <3 months 3-12 months >12 months
Financial Liabilities at Fair
Value through Profit or Loss 7,260,907 801,988 192,191 — 136,676 160,250
Accrued Expenses 224,425 — — 257,815 — —
Other Liabilities 22,809,251 — — 4,738,147 — —
Redeemable participating units 122,569,371 — — 37,940,375 — —————————————————— ——————————————— ——————————————— ——————————————— ——————————————— ———————————————
Total 152,863,954 801,988 192,191 42,936,337 136,676 160,250 ————————————————— ——————————————— ——————————————— ——————————————— ——————————————— ———————————————————————————————— ——————————————— ——————————————— ——————————————— ——————————————— ———————————————
Putnam U.S. Liquid Assets Fund
As at 30 June 2008 As at 30 June 2007
USD USD
<3 months 3-12 months >12 months <3 months 3-12 months >12 months
Financial Liabilities at Fair
Value through Profit or Loss — — — — — —
Bank Overdraft 64,512 — — 4,578 — —
Accrued Expenses — — — 135,173 — —
Other Liabilities 328,799 — — 51,409 — —
Redeemable participating units 51,320,671 — — 68,024,702 — ———————————————— ——————————————— ——————————————— ——————————————— ——————————————— ———————————————
Total 51,713,982 — — 68,215,862 — ———————————————— ——————————————— ——————————————— ——————————————— ——————————————— —————————————————————————————— ——————————————— ——————————————— ——————————————— ——————————————— ———————————————
190
Putnam World Trust————————————————————————————————————————————————————————————————————————————————————————————————————————————————————————————————————————————
Notes to the Financial Statements as at 30 June 2008 (Continued)
5. RISKS ASSOCIATED WITH FINANCIAL INSTRUMENTS (Continued)
(d) Liquidity risk (Continued)

Putnam U.S. Small-Cap Value Equity Fund
As at 30 June 2008 As at 30 June 2007
USD USD
<3 months 3-12 months >12 months <3 months 3-12 months >12 months
Bank Overdraft 23,128 — — — — —
Accrued Expenses 119,139 — — 686,060 — —
Other Liabilities 28,970 — — 465,633 — —
Redeemable participating units 15,288,371 — — 119,787,662 — ———————————————— ——————————————— ——————————————— ————————————————— ——————————————— ———————————————
Total 15,459,608 — — 120,939,355 — ———————————————— ——————————————— ——————————————— ————————————————— ——————————————— —————————————————————————————— ——————————————— ——————————————— ————————————————— ——————————————— ———————————————
Putnam Vista (U.S. Mid-Cap Equity) Fund
As at 30 June 2008 As at 30 June 2007
USD USD
<3 months 3-12 months >12 months <3 months 3-12 months >12 months
Financial Liabilities at Fair
Value through Profit or Loss — — — — — —
Bank Overdraft — — — 415,578 — —
Accrued Expenses 185,763 — — 344,646 — —
Other Liabilities — — — 1,690,270 — —
Redeemable participating units — — — 40,488,909 — ———————————————— ——————————————— ——————————————— ——————————————— ——————————————— ———————————————
Total 185,763 — — 42,939,403 — ———————————————— ——————————————— ——————————————— ——————————————— ——————————————— —————————————————————————————— ——————————————— ——————————————— ——————————————— ——————————————— ———————————————
(e) Credit riskThe Trust will be exposed to a credit risk on parties with whom it trades and will also bear the risk of settlementdefault. The Trust minimises concentration of credit risk by undertaking transactions with a large number ofcustomers and counterparties on recognised and reputable exchanges and over the counter.
Risks associated with derivative contracts involve the possibility that the counterparty to the contract may default onits obligation to perform. Market Value amounts are presented in the Schedule of Investments to indicate the extentof the Trust’s involvement in such instruments.
AS OF DATE RATING Putnam Putnam Putnam Putnam Putnam Putnam
Emerging Markets Global Fixed Income Global Fixed Income Global High Yield Total Return U.S. Liquid
Debt Fund Alpha Fund S1 Alpha Fund S2 Bond Fund Fund Assets Fund
30 June 2008 A-1+ — — — — — 70.04%
30 June 2008 A-1 — — — — — 26.56%
30 June 2008 AAA 33.83% 73.04% 71.77% 5.16% 30.74% —
30 June 2008 AA — 0.61% 1.14% — 0.29% —
30 June 2008 A 13.93% 4.09% 4.46% 0.31% 3.92% —
30 June 2008 BBB 16.97% 14.85% 12.10% 5.21% 17.42% —
30 June 2008 BB 16.66% 6.18% 9.97% 31.82% 3.17% —
30 June 2008 B 18.61% — — 45.54% 2.84% —
30 June 2008 CCC and below — — — 9.11% — —
30 June 2008 NR — 1.23% 0.56% 2.85% — 3.40%
Total 100.00% 100.00% 100.00% 100.00% 100.00% 100.00%
191
5. RISKS ASSOCIATED WITH FINANCIAL INSTRUMENTS (Continued)
(d) Liquidity risk (Continued)
Putnam World Trust————————————————————————————————————————————————————————————————————————————————————————————————————————————————————————————————————————————
Notes to the Financial Statements as at 30 June 2008 (Continued)

AS OF DATE RATING Putnam Putnam Putnam
Emerging Markets Global High Yield U.S. Liquid
Debt Fund Bond Fund Assets Fund
29 June 2007 A-1+ — — 76.89%
29 June 2007 A-1 — — 23.11%
29 June 2007 AAA 26.65% 3.80% —
29 June 2007 AA — 0.18% —
29 June 2007 A 7.37% 0.11% —
29 June 2007 BBB 22.91% 3.51% —
29 June 2007 BB 22.55% 23.84% —
29 June 2007 B 20.52% 53.91% —
29 June 2007 CCC and below — 11.82% —
29 June 2007 NR — 2.83% —
Total 100.00% 100.00% 100.00%
6. TAXATION
Under current law and practice Putnam World Trust qualifies as an investment undertaking as defined in Section 739Bof the Taxes Consolidation Act, 1997, as amended. On that basis, it is not chargeable to Irish tax on its income or capitalgains.
However, Irish tax may arise on the happening of a “chargeable event”. A chargeable event includes any distributionpayments to unitholders or any encashment, redemption or transfer of units. No tax will arise on the Trust in respect ofchargeable events in respect of:
(a) a unitholder who is neither Irish resident nor ordinarily resident in Ireland for tax purposes at the time of thechargeable event provided appropriate valid declarations, in accordance with the provisions of the TaxesConsolidation Act, 1997, as amended, are held by the Trust; and
(b) certain exempted Irish tax resident unitholders who have provided the Trust with the necessary signed statutorydeclarations.
Dividends, interest and capital gains (if any) received on investments made by the Trust may be subject to withholdingtaxes imposed by the country from which the investment income/gains are received and such taxes may not berecoverable by the Trust or its unitholders.
7. FEES
The fees of the Manager, the Administrator and the Trustee are borne individually by each of the Funds.
MANAGEMENT FEES At 30 June 2008 the Manager was entitled to receive an annual fee out of the assets of each Fund, the annual fee set withrespect to each Fund and class below (active and non-active), out of which the Manager will reimburse the InvestmentAdvisor its fee for the investment advisory services provided by the Investment Advisor. Such fees shall accrue daily andbe payable monthly in arrears for these Funds and classes which are active. Subsequent to the period-end, certain changeswere made to the unit classes and management fees for the Funds.
192
5. RISKS ASSOCIATED WITH FINANCIAL INSTRUMENTS (Continued)
(e) Credit risk (Continued)
Putnam World Trust————————————————————————————————————————————————————————————————————————————————————————————————————————————————————————————————————————————
Notes to the Financial Statements as at 30 June 2008 (Continued)

7. FEES (Continued)
MANAGEMENT FEES (Continued)
Management fee as of 30 June 2008 (as a % of net assets)
Unit Classes
Fund A B C E I J M Q S T Y————————————————————————————————————————————————————————————————————————————————————————————————————————————————————————————————————
Putnam Emerging Information Sciences Fund 2.25% 2.75% 2.50% 1.85% 1.85% 1.85% 1.85% N/A N/A 2.25% N/A
Putnam Emerging Markets Debt Fund 1.35%# 1.85%# 1.75%# 1.35% 1.35%# 1.50% 1.50% N/A N/A N/A N/A
Putnam Europe Equity Fund 2.00% 2.50% 2.25% 1.60% 1.60% 1.60% 1.60% N/A N/A N/A N/A
Putnam Global Equity Multi-Alpha Fund 1.50%# 2.00%# 1.75%# N/A N/A 0.00%# 1.50%# 0.80%# N/A N/A N/A
Putnam Global Fixed Income Alpha Fund S1+ N/A N/A N/A N/A 0.20%# N/A 0.20%# N/A 0.20%# N/A 0.20%#
Putnam Global Fixed Income Alpha Fund S2+ N/A N/A N/A N/A 0.25% N/A 0.25% 0.25% 0.25% N/A 0.25%
Putnam Global Growth Fund 2.00% 2.50% 2.25% 1.60% 1.60% 1.60% 1.60% N/A N/A N/A N/A
Putnam Global High Yield Bond Fund 1.35% 1.85% 1.75% 1.35% 1.35% 1.35% 1.35% N/A 1.35% 1.35% N/A
Putnam Growth and Income (U.S. Value Equity) Fund 2.00% 2.50% 2.25% 1.60% 1.60% 1.60% 1.60% N/A N/A N/A N/A
Putnam International (Non U.S. Core) Equity Fund 2.00% 2.50% 2.25% 1.60% 1.60% 1.60% 1.60% N/A N/A N/A N/A
Putnam Investors (U.S. Core Equity) Fund 2.00%# 2.50%# 2.25%# 1.60%# 1.60%# 1.60% 0.75%# N/A N/A N/A N/A
Putnam New Opportunities (U.S. Aggressive Growth Equity) Fund 2.00% 2.50% 2.25% 1.60% 1.60% 1.60% 1.60% N/A N/A N/A N/A
Putnam Total Return Fund 1.50%# 2.00%# 1.75%# 0.80%# N/A 0.00%# 1.50%# 0.80%# 0.80%# N/A N/A
Putnam U.S. Liquid Assets Fund 0.50%# 1.00%# 1.00%# N/A# 0.50%# 0.50% 0.50% N/A N/A N/A N/A
Putnam U.S. Small-Cap Value Equity Fund 2.00% 2.50% 2.25% 1.60% 1.60% 1.60% 1.00%*# N/A N/A N/A N/A
* The total expense ratio for Class M Units of Putnam U.S. Small-Cap Value Equity Fund was capped at 1.30% of net assets.
# Each of these Unit classes waived Management Fees during the period ended 30 June 2008.
+ A periodic performance fee will be payable to the Manager (the “Performance Fee”) in respect of each Class of Unitequal to 20% of the “Net Overperformance” (as defined below), if any, achieved by the respective Class of Units. If therespective Class of Units experiences net under performance in relation to the “Hurdle”, which shall be defined for allclasses of Units as LIBOR return in the currency of the Class of Units in question, following payment of the PerformanceFee in any previous period, the Manager will retain all Performance Fees previously paid for that Class of Units but nofurther Performance Fee will be charged until additional Net Overperformance is achieved by the relevant Class of Units.The calculation of the Performance Fee, if any, payable to the Manager in any period, shall be subject to the verificationof the Trustee. The Performance Fee shall accrue on each Dealing Day and accordingly the Net Asset Value will beadjusted to reflect such fee. Notwithstanding the foregoing, any accrued Performance Fee referable to Units repurchasedprior to the end of the relevant period shall be retained by the Manager following such repurchase. No performance feeswere earned during the year.
During the year ended 30 June 2008 the Investment Advisor waived the following of their Investment Advisor fee:30/06/2008 30/06/2007
Putnam American Government Bond Fund $— $—
Putnam Emerging Information Sciences Fund — —
Putnam Emerging Markets Debt Fund 3,079 7,192
Putnam Europe Equity Fund 33,296 54,332
The George Putnam (U.S. Equity and Bond) Fund 20,050 39,257
Putnam Global Equity Multi-Alpha Fund — 113,427
Putnam Global Fixed Income Alpha Fund S1 — —
Putnam Global Fixed Income Alpha Fund S2 — —
Putnam Global Growth Fund — 11,286
Putnam Global High Yield Bond Fund 370,110 61,714
Putnam International (Non U.S. Core) Equity Fund — —
Putnam Investors (U.S. Core Equity) Fund 109,514 171,690
Putnam New Opportunities (U.S. Aggressive Growth Equity) Fund 16,138 22,319
Putnam Opportunistic Value Fund 1,986 79,465
Putnam Total Return Fund 210 264,426
Putnam U.S. Liquid Assets Fund 264,323 99,447
Putnam U.S. Small-Cap Value Equity Fund 175,633 446,240
193
Putnam World Trust————————————————————————————————————————————————————————————————————————————————————————————————————————————————————————————————————————————
Notes to the Financial Statements as at 30 June 2008 (Continued)

7. FEES (Continued)
MANAGEMENT FEES (Continued)
Please refer to page 193 for details of fees waived of Unit class level during the period ended 30 June 2008.
TRUSTEE, TRANSFER AGENT AND ADMINISTRATOR FEESThe Administrator and the Trustee together are entitled to receive, out of the assets of each Fund, an annualadministration fee not to exceed 0.40% of the average Net Asset Value of each Fund calculated on the last Dealing Day ofeach month, (plus VAT if any thereon), subject to a minimum annual fee of US$70,000 per Fund. The Trustee shall beentitled to receive out of the assets of each Fund an annual safekeeping fee not to exceed 0.50% of the average Net AssetValue of each Fund. The Administrator and the Trustee shall also be entitled to be paid any transaction charges andexpenses and the Sub-Custodian fees which shall be at normal commercial rates.
The Administrator shall also be entitled to an annual fee of US$10,000 out of the assets of the Trust for generaladministration services. This shall be apportioned pro rata among the Funds. The “Average Net Asset Value” shall referto the average monthly Net Asset Value of each Fund.
The Administrator shall pay the fees of the Transfer Agent, Citi Fund Services (Ireland) Limited, out of its own fee andthe Transfer Agent shall not receive a fee out of the assets of the Trust.
SUB-INVESTMENT ADVISORThe Investment Advisor has entered into a sub-investment Advisory agreement with Putnam Investments Limited, anaffiliate of The Putnam Advisory Company, LLC. Putnam Investments Limited has its principal office at Cassini House,57-59 St. James’s Street, London SW1A 1WLD and is a company organized under the laws of England and Wales (the“Sub-investment advisor”). The Sub-investment advisor is licensed as an investment manager by the Financial ServicesAuthority of the United Kingdom and is registered under the United States Investment Advisers Act of 1940, asamended. The Sub-investment advisor is currently acting as sub-investment advisor for Putnam Europe Equity Fund,Putnam Global High Yield Bond Fund and Putnam International (Non U.S. Core) Equity Fund. The fees of the Sub-investment advisor are being paid out of the fees of the Investment Advisor. PanAgora Asset Management, Inc., also anaffiliate of the Investment Advisor, is currently acting as sub-investment advisor for Putnam Global Equity Multi-AlphaFund and is paid out of the fees of the Investment Advisor.
8. SOFT COMMISSION ARRANGEMENTS
During the year there were soft dollar transactions in the Funds. Soft dollar transactions occurred when the InvestmentAdvisor used certain investment research services which assisted in the management of the Funds’ portfolioinvestments, which were paid for by certain brokers.
These services could include, for example, research and analysis of the relative merits of individual units or markets orthe use of computer and other information facilities. In return, the Investment Advisor placed a proportion of businesswith these brokers including transactions relating to the Fund’s investments. The Investment Advisor has satisfied itselfthat it obtained best execution on behalf of the Funds and that these arrangements were to the benefit of the Funds.
9. RELATED PARTY TRANSACTIONS
In the opinion of the Trustee, the Manager and the Investment Advisor are related parties under FRS 8 “Related PartyTransactions”. The Investment Advisor is paid by the Manager. Fees charged by these parties and the amount due at theyear end are shown in the Profit and Loss Account and the Balance Sheet, respectively.
194
Putnam World Trust————————————————————————————————————————————————————————————————————————————————————————————————————————————————————————————————————————————
Notes to the Financial Statements as at 30 June 2008 (Continued)

9. RELATED PARTY TRANSACTIONS (Continued)
During the year the Trust incurred a fee of US$163,993 relating to legal fees provided by Dillon Eustace (2007: US$84,750).David Dillon as a director of the Manager had an interest in this fee in his capacity as a partner of Dillon Eustace. TheManager is not aware of any other transactions with connected persons during the year, other than those disclosed inthese financial statements.
10. FOREIGN EXCHANGE
The exchange rates ruling at 30 June 2008 were: The exchange rates ruling at 30 June 2007 were:
Currency Currency
Australian Dollar 1.04319 1.64292 2.07928 Australian Dollar 1.17869 1.59188
British Pound 0.50171 0.79014 1.00000 British Pound 0.49842 0.67314
Canadian Dollar 1.01740 1.60230 2.02788 Canadian Dollar 1.06375 1.43665
Euro 0.63496 1.00000 1.26560 Euro 0.74044 1.00000
Hong Kong Dollar 7.79690 12.27934 15.54078 Hong Kong Dollar 7.81790 10.55847
Indian Rupee 43.02000 67.75220 85.74746 Indian Rupee 40.72750 55.00453
Japanese Yen 106.02000 166.97090 211.31906 Japanese Yen 123.49500 166.78619
Korean Won 1,045.90000 1,647.18791 2,084.68788 Korean Won 923.90000 1,247.77328
New Zealand Dollar 1.31303 2.06788 2.61712 New Zealand Dollar 1.29441 1.74817
Norwegian Krone 5.08630 8.01041 10.13801 Norwegian Krone 5.90635 7.97682
Singapore Dollar 1.35960 2.14123 2.70995 Singapore Dollar 1.52945 2.06560
Swedish Krona 6.01820 9.47806 11.99548 Swedish Krona 6.85720 9.26099
Swiss Franc 1.01970 1.60593 2.03247 Swiss Franc 1.22560 1.65523
Taiwan Dollar 30.34900 47.79664 60.49163 Taiwan Dollar 32.86600 44.38718
United States Dollar 1.00000 1.57490 1.99320 United States Dollar 1.00000 1.35055
11. SIGNIFICANT EVENTS DURING THE YEAR
The following significant events occurred during the year:
— Effective 30 June 2007 the Administrator of the Trust was changed from J.P. Morgan Administration Services(Ireland) Limited to State Street Fund Services (Ireland) Limited.
— Effective 30 June 2007 the Trustee of the Trust was changed from J.P. Morgan Bank (Ireland) plc to State StreetCustodial Services (Ireland) Limited.
— Effective 21 February 2008 Putnam Global Fixed Income Alpha Fund S1 was launched.— Effective 25 February 2008 Putnam Global Fixed Income Alpha Fund S2 was launched.— Effective 20 February 2008 Putnam American Government Bond Fund, The George Putnam (U.S. Equity and
Bond) Fund and Putnam Opportunistic Value Fund were liquidated.— Effective 27 June 2008 Putnam Vista (U.S. Mid-Cap Equity) Fund merged into Putnam New Opportunities
(U.S. Aggressive Growth Equity) Fund.
Vs. EUR
Rate
Vs. USD
Rate
Vs. GBP
Rate
Vs. EUR
Rate
Vs. USD
Rate
195
Putnam World Trust————————————————————————————————————————————————————————————————————————————————————————————————————————————————————————————————————————————
Notes to the Financial Statements as at 30 June 2008 (Continued)

12. SUBSEQUENT EVENTS
The following subsequent events occurred since the year end.
Effective 2 September 2008, a number of changes were made to the Trust’s prospectus. Additional detail about thesechanges, which were communicated to all unitholders of the Trust, is available in the Trust’s prospectus and will beincluded in the semi-annual accounts.
• The Trust’s name changed from Putnam World Trust II to Putnam World Trust.
• The name of the Trust’s manager changed from Putnam Investments Limited to Putnam Investments (Ireland)Limited.
• A number of revisions were made to the various sub-funds’ distribution policies and classes of Units (including theinvestment minimums, management fees, class currencies, and sales charges for certain classes). In addition, thedealing days for some sub-funds were amended.
• Six additional sub-funds of the Trust, offering investment in a variety of asset classes, are expected to be launchedduring Autumn 2008.
• Putnam U.S. Liquid Assets Fund terminated on 19 September 2008.
• Recent events in the financial sector have resulted in an unusually high degree of volatility in the financial markets.The Funds’ investments in the financial sector, as reflected in each Fund’s schedule of investments, expose investorsto the negative performance resulting from these events.
Lehman Brothers Holdings, Inc. made a bankruptcy filing on 15 September 2008, subsequent to the reportingperiod. The reported values of each Fund’s positions as of 30 June 2008 in securities of Lehman or its affiliates andin derivatives to which Lehman or its affiliates is a counterparty do not reflect these developments or portfoliotransactions after 30 June 2008.
196
Putnam World Trust————————————————————————————————————————————————————————————————————————————————————————————————————————————————————————————————————————————
Notes to the Financial Statements as at 30 June 2008 (Continued)

197
PUTNAM AMERICAN GOVERNMENT BOND FUND
Schedule of Portfolio Changes (Unaudited)
for the year ended 30 June 2008
Largest Purchases
Principal Amount
3,000,000 Federal National Mortgage
Association (OTBA) 5.5% 01/03/2038 3,040,901
2,700,000 Federal National Mortgage
Association (TBA) 5.5% 01/11/2037 2,613,925
2,632,000 Federal National Mortgage
Association (TBA) 5.5% 01/11/2037 2,601,382
2,500,000 Federal National Mortgage
Association (OTBA) 5.5% 01/12/2037 2,470,795
2,000,000 Federal National Mortgage
Association (OTBA) 5.5% 01/03/2038 2,022,580
1,900,000 Federal National Mortgage
Association (TBA) 6.5% 01/08/2037 1,920,788
1,600,000 Federal National Mortgage 1,599,004
1,400,000 Federal National Mortgage
Association (TBA) 5.5% 01/09/2037 1,371,176
1,332,000 Federal National Mortgage
Association (TBA) 5.5% 01/10/2037 1,309,476
1,200,000 Federal Home Loan Discount Note
0.00% 08/02/2008 1,198,453
1,200,000 Freddie Mac 0.00% 04/04/2008 1,194,979
1,000,000 Federal National Mortgage
Association (OTBA) 5.5% 01/02/2038 1,009,493
1,000,000 Freddie Mac Discount Note
0.00% 26/12/2007 999,174
1,000,000 Federal Home Loan Banks
0.00% 02/01/2008 997,667
1,000,000 Freddie Mac 0.00% 23/01/2008 996,601
999,900 Federal National Mortgage
Association 5.5% 01/12/2037 991,894
1,000,000 Federal National Mortgage
Association (TBA) 5.5% 01/01/2038 984,705
999,999 Federal National Mortgage
Association 5.5% 01/11/2037 984,336
936,207 Federal National Mortgage
Association 6.5% 01/12/2036 946,450
889,291 Federal National Mortgage
Association 6.5% 01/12/2036 899,021
900,000 Federal Home Loan Banks 897,635
Largest Sales
No. of Shares
2,700,000 Federal National Mortgage
Association (TBA) 5.5% 01/08/2037 2,613,925
2,632,000 Federal National Mortgage
Association (TBA) 5.5% 01/11/2037 2,601,382
2,500,000 Federal National Mortgage
Association (OTBA) 5.5% 01/12/2037 2,470,936
1,900,000 Federal National Mortgage
Association (TBA) 6.5% 01/08/2037 1,920,788
1,400,000 Federal National Mortgage
Association (TBA) 5.5% 01/09/2037 1,371,176
332,000 Federal National Mortgage
Association (TBA) 5.5% 01/10/2037 1,309,476
999,900 Federal National Mortgage
Association 5.5% 01/12/2037 989,863
1,000,000 Federal National Mortgage
Association (TBA) 5.5% 01/01/2038 984,705
936,207 Federal National Mortgage
Association 6.5% 01/12/2036 946,597
889,251 Federal National Mortgage
Association 6.5% 01/12/2036 900,328
800,000 Federal National Mortgage
Association (TBA) 4.5% 01/09/2022 770,380
725,000 Treasury Bill 0.00% 27/09/2007 724,778
700,000 Federal National Mortgage
Association (TBA) 6% 01/09/2037 698,775
689,615 Federal National Mortgage
Association 5.5% 01/07/2037 665,286
671,024 Federal National Mortgage
Association 5.5% 01/01/2037 659,567
601,380 Federal National Mortgage
Association 5.5% 01/11/2037 586,656
600,000 Federal National Mortgage
Association (OTBA) 4.5% 01/11/2022 583,725
600,000 Federal National Mortgage
Association (TBA) 4.5% 01/10/2022 577,266
579,395 Federal National Mortgage
Association 4.5% 01/09/2020 559,713
547,935 Federal National Mortgage
Association 4.5% 02/01/2022 528,672
Proceeds
USD
Cost
USD

198
PUTNAM EMERGING INFORMATION
SCIENCES FUND
Schedule of Portfolio Changes (Unaudited)
for the year ended 30 June 2008
Largest Purchases
Principal Amount
31,100 F5 Networks 1,016,601
27,000 BMC Software Incorporated 853,712
42,100 Red Hat Incorporated 838,579
21,500 Trimble Navigation Ltd. 793,906
15,900 Belden Incorporated 765,880
38,800 Nuance Communications
Incorporated 699,693
14,800 Autodesk Incorporated 697,359
20,000 Nvidia Corporation 654,541
21,000 Sra International Incorporated 584,233
32,800 Quest Software 574,105
35,100 United Online Incorporated 572,799
2,900 First Solar Incorporated 568,221
16,900 Akamai Technologies 562,619
36,100 Mentor Graphics Corporation 559,302
11,500 Advent Software 549,679
19,900 Teradata Corporation 540,806
16,600 Neustar Incorporated 517,864
24,000 Electronics for Imaging Incorporated 516,214
21,200 Solera Holdings Incorporated 514,115
7,100 Flir Systems Incorporated 502,290
Largest Sales
No. of Shares
42,350 Microsemi Corporation 1,016,632
25,325 Diodes Incorporated 918,841
22,200 Si International Incorporated 689,319
39,200 Parametric Technology Corporated 687,056
50,150 Magma Design Automation 679,830
21,050 Heartland Payment Systems
Incorporated 640,425
45,775 Ultra Clean Holdings 628,515
17,250 Standard Microsy 618,757
31,000 Ingram Micro Incorporated 614,725
13,950 Digital River 580,916
46,300 Chordiant Software Incorporated 549,141
43,900 C-Cor Incorported 540,542
38,400 Arris Group Incorporated 520,496
29,700 NCI Incorporated 512,118
25,850 Xyratex Limited 490,540
16,650 Polycom Incorporated 476,833
39,200 Global Cash Access Incorporated 465,929
33,073 Cybersource Corporation 462,657
71,150 RF Micro Devices 443,563
31,250 QLogic Corporation 434,886
PUTNAM EMERGING MARKETS DEBT FUND
Schedule of Portfolio Changes (Unaudited)
for the year ended 30 June 2008
Largest Purchases
Principal Amount
20 US 10YR NOTE FUT JUN08
TYM8 Total 2,337,625
20 US 10YR NOTE FUT MAR08
TYH8 Total 2,294,969
20 US 10YR NOTE FUT DEC07
TYZ7 Total 2,241,125
18 US LONG BOND(CBT) JUN08
USM8 Total 2,117,531
6 US 2YR NOTE (CBT) JUN08
TUM8 Total 1,278,172
9 US LONG BOND(CBT) SEP08
USU8 Total 1,041,743
500,000 Federal Home Loan Bank 498,163
450,000 Egypt Treasury Bill 0.00% 03/06/2008 434,174
2 US 2YR NOTE (CBT) MAR08
TUH8 Total 423,641
2 US 2YR NOTE (CBT) DEC07
TUZ7 Total 417,734
335,000 Old Line Funding Corporation
16/11/2007 334,602
300,000 Federal Home Loan Bank 299,962
300,000 Federal Home Loan Bank 299,950
300,000 Federal Home Loan Bank 299,706
300,000 Federal Home Loan Bank 299,298
300,000 Federal Home Loan Bank 298,818
299,000 Federal Home Loan Bank 298,294
250,000 Liquid Assets CL l- Dublin Fund 250,000
250,000 Federal Home Loan Bank 249,971
250,000 Federal Home Loan Bank 249,489
Largest Sales
No. of Shares
335,000 Old Line Funding Corporation
0.00% 16/11/2007 334,648
250,000 Federal Home Loan Bank 249,909
99,300 Russian Federation 5.00% 31/03/2030 111,332
100,000 Ukraine Ministry of Finance
6.58% 21/11/2016 104,154
80,000 United Mexican States
6.625% 03/03/2015 86,880
63,853 Argentina (Republic of )
8.28% 31/12/2033 56,949
55,000 Argentina (Republic of )
10.50% 12/06/2012 15,138
Proceeds
USD
Cost
USD
Proceeds
USD
Cost
USD

199
PUTNAM EUROPE EQUITY FUND
Schedule of Portfolio Changes (Unaudited)
for the year ended 30 June 2008
Largest Purchases
Principal Amount
8,675 Novartis AG 556,195
4,388 Petroleum Geo-Services 549,103
6,204 DNB Holding ASA 489,160
1,010 Modern Times Group-B 405,613
4,790 BNP Paribas 366,275
24,590 Banco Santander SA 348,937
41,675 Enel SPA 329,038
10,775 ING Groep 323,057
16,342 Telefonica SA 285,606
8,777 Vivendi SA 258,954
15,987 Koninklijke KPN NV 186,735
16,203 Glaxosmithkline 181,697
343 Nestle PLC 179,219
18,367 Koninklijke Ahold NV 177,291
2,893 Rio Tinto PLC 156,866
25,048 BP PLC 149,466
20,964 Pridential PLC 148,562
2,292 Total SA 131,348
2,459 AKZO Nobel 128,598
2,644 Voestalpine AG 128,148
Largest Sales
No. of Shares
399 MOL Hungarian Oil & Gas 11,445,556
3,392 Hennes & Mauri Corporation 1,316,056
7,200 UBS AG 396,953
3,353 Electromagnetic Geoservices Ltd. 391,713
3,681 Siemans AG 332,364
18,056 Banco Bilbao Vizcaya Argenta 307,071
970 Nobel Biocare Holding AG 304,589
2,773 Credit Suisse Group 225,821
2,296 Schneider Electric 219,524
1,281 Petroleum Geo-Services 206,359
2,270 Continental AG 202,666
3,365 Thyssenkrupp AG 126,624
673 Societe Generale PLC 124,787
2,061 Inbev NV 117,025
4,273 EFG Eurobank Ergasias 106,274
14,146 Northern Rock Ltd. 101,681
15,626 Barclays PLC 94,008
3,953 Hellencic Telcom 93,894
17,583 Experian Group Limited 92,271
6,270 BHP Billiton PLC 90,386
Proceeds
USD
Cost
USD

THE GEORGE PUTNAM
(U.S. EQUITY AND BOND) FUND
Schedule of Portfolio Changes (Unaudited)
for the year ended 30 June 2008
Largest Purchases
Principal Amount
2,700,000 Federal Home Loan Discount Note
0.00% 20/02/2008 2,699,800
2,700,000 Federal National Mortgage 2,699,603
1,200,000 Federal National Mortgage
Association (OTBA) 5.5% 01/12/2037 1,182,735
1,000,000 Federal National Mortgage
Association (OTBA) 5.5% 01/03/2038 1,010,431
1,000,000 Federal National Mortgage
Association (OTBA) 5.5% 01/02/2038 1,009,493
1,000,000 Federal National Mortgage
Association (TBA) 5.5% 01/01/2038 984,705
750,000 Liquid Assets Cll-Dublin Fund 750,000
751,212 Federal National Mortgage
Association 5.5% 01/12/2037 739,446
700,000 Federal National Mortgage
Association (TBA) 6.5% 01/08/2037 707,870
600,000 Federal National Mortgage
Association (TBA) 6.5% 01/09/2037 609,363
598,409 Federal National Mortgage
Association 6.5% 01/11/2036 607,747
598,605 Federal National Mortgage
Association 6.5% 01/02/2037 605,154
560,348 Federal National Mortgage
Association 5.5% 01/01/2038 551,742
448,000 Federal National Mortgage
Association (TBA) 5.5% 01/11/2037 442,892
400,000 Federal National Mortgage
Association (TBA) 5.5% 01/08/2037 386,451
400,000 Federal National Mortgage
Association (TBA) 5.5% 01/11/2037 384,768
399,999 Federal National Mortgage
Association 4.5% 01/07/2022 380,376
400,000 Federal National Mortgage
Association 4.5% 01/08/2022 378,888
4,575 iShares S&P 500 Value Index Fund 348,875
300,000 General National Mortgage
Association TBA 6.5% 01/09/2037 307,334
Largest Sales
No. of Shares
1,200,000 Federal National Mortgage
Association (OTBA) 5.5% 01/12/2037 1,182,876
1,000,000 Federal National Mortgage
Association (TBA) 5.5% 01/01/2038 984,705
751,212 Federal National Mortgage
Association 5.5% 01/12/2037 739,739
700,000 Federal National Mortgage
Association (TBA) 6.5% 01/08/2037 708,190
600,000 Federal National Mortgage
Association (TBA) 6.5% 01/09/2037 609,363
598,605 Federal National Mortgage
Association 6.5% 01/02/2037 608,006
448,000 Federal National Mortgage
Association (TBA) 5.5% 01/11/2037 442,892
400,000 Federal National Mortgage
Association (TBA) 5.5% 01/08/2037 386,451
400,000 Federal National Mortgage
Association (TBA) 5% 01/11/2037 384,768
398,658 Federal National Mortgage
Association 4.5% 01/07/2022 383,242
400,000 Federal National Mortgage
Association (TBA) 4.5% 01/08/2022 380,024
400,000 Federal National Mortgage
Association (TBA) 4.5% 01/07/2023 378,738
300,000 General National Mortgage
Association 6.5% 01/09/2037 307,334
300,000 Federal National Mortgage
Association (TBA) 4.5% 01/09/2022 288,126
273,000 Federal National Mortgage
Association (TBA) 5.5% 01/10/2037 268,317
248,000 Federal National Mortgage
Association 5.5% 01/11/2037 243,766
240,000 Federal National Mortgage
Association (TBA) 5% 01/10/2037 229,899
200,000 Federal National Mortgage
Association (TBA) 6.5% 01/11/2037 204,152
195,000 Federal National Mortgage
Association (TBA) 6.5% 01/10/2037 199,366
200,001 Federal National Mortgage
Association 6% 01/11/2036 199,071
Proceeds
USD
Cost
USD
200

201
PUTNAM GLOBAL EQUITY MULTI-ALPHA FUND
Schedule of Portfolio Changes (Unaudited)
for the year ended 30 June 2008
Largest Purchases
Principal Amount
29,500 Astra International Incorporated 829,862,468
44,000 Nippon Oil Corporation 44,595,503
4,000 Toyota Motor Corporation 21,970,980
5,400 Honda Motor Company 17,677,834
33 NTT CCorporation 17,211,048
8,000 Ricoh Company Limited 12,903,448
5,100 Yamaha Motor Company Limited 10,412,803
219,000 China Steel Corporation 9,975,586
2,600 Suzuken Company Limited 9,735,447
5,100 Canon Marketing Japan Incorporated 9,522,358
3,000 Seiko Epson Corporation 9,332,027
1,400 TDK Corporation 9,027,511
1,900 Mitsubishi Corporation 6,591,294
6,000 Dainippon Pharmaceutical 5,241,619
3,000 Itochu Corporation 4,372,185
2,700 Alpa Electric Company Limited 3,627,112
45,587 Nan Ya Plastic Corporation 3,459,341
36,111 Formosa Chemicals & Fibre Corporation 2,835,241
4,000 Shimizu Corporation 2,615,307
16,607 SPDR Trust Series 1 2,459,046
Largest Sales
No. of Shares
13,167 Nissan Motor Company 15,096,222
787 OTP Bank PLC 7,312,914
4,371 Uniden Corporation 4,177,934
809 Family Mart Company Ltd 2,400,888
2,412 Taisei Corporation 1,454,760
15,541 iShares MSCI Eafe Index Fund 1,371,743
8,515 SPDR Trust Series 1 1,354,862
7,545 China Mobile Limited 904,379
2,636 Goldman Sachs Corporation 526,394
15,107 Safeway Incorporated 505,996
9,017 Computer Science 478,878
1,037 Hennes & Mauri Corporation 399,609
94 Suzuki Motor 331,654
5,643 Morgan Stanley 308,867
156 Toyo Suisan Kaisha Limited 292,666
2,804 Alcan Incorporated 282,178
12,814 Mattel Incorporated 269,545
7,854 Westar Energy Incorporated 200,640
6,567 Brinker International 190,566
160 Topdanmark 143,680
Proceeds
USD
Cost
USD

PUTNAM GLOBAL FIXED INCOME ALPHA FUND S1
Schedule of Portfolio Changes (Unaudited)
for the year ended 30 June 2008
Largest Purchases
Principal Amount
291,000,000 Federal Home Loan Banks 290,978,175
266,000,000 Federal Home Loan Banks 265,938,377
258,000,000 Federal National Mortgage
Association (TBA) 5.5% 01/07/2038 256,694,565
248,000,000 Federal National Mortgage
Association (TBA) 5.5% 01/06/2038 249,082,989
200,000,000 Federal Home Loan Banks 199,985,278
178,000,000 Freddie Mac 0.00% 14/03/2008 177,695,422
148,873,000 Federal Home Loan Discount
Note 0.00% 27/02/2008 148,862,455
141,000,000 Federal Home Loan Discount
Note 0.00% 05/03/2008 140,989,033
137,282,000 Federal Home Loan Banks 137,273,420
125,000,000 Federal National Mortgage 124,995,313
121,000,000 Federal National Mortgage
Association (TBA) 5.5% 01/07/2038 114,679,566
110,000,000 Federal Home Loan Discount
Note 0.00% 28/03/2008 109,996,792
100,000,000 Federal Home Loan Banks 99,842,333
86,000,000 Federal National Mortgage
Association (TBA) 5.5% 01/05/2038 86,307,979
84,000,000 Federal Home Loan Banks 83,993,700
83,000,000 Federal Home Loan Banks 82,995,043
83,000,000 Federal Home Loan Discount
Note 0.00% 31/03/2008 82,986,167
75,000,000 Federal Home Loan Banks 74,996,875
73,647,000 Federal Home Loan Banks 73,642,295
68,000,000 Federal Home Loan Banks 67,996,033
Largest Sales
No. of Shares
245,000,000 Federal National Mortgage
Association (TBA) 5.5% 01/06/2038 245,996,795
90,000,000 Federal National Mortgage
Association (TBA) 5.5% 01/05/2038 90,363,633
35,000,000 Atlantic Asset Securities Corporation
0.00% 08/04/2008 34,884,500
32,000,000 Federal National Mortgage
Association (TBA) 5.5% 01/04/2038 32,347,931
3,775,000 CSX Corporation 6.25% 01/04/2015 3,821,398
2,587,072 Federal National Mortgage
Association 5.5% 01/04/2037 2,567,166
2,527,425 Federal National Mortgage
Association 5.5% 01/10/2037 2,547,298
2,185,754 Federal National Mortgage
Association 5.5% 01/04/2037 2,162,788
2,076,380 Federal National Mortgage
Association 5.5% 01/05/2037 2,060,404
2,038,005 Federal National Mortgage
Association 5.5% 01/03/2037 2,016,592
1,999,999 Federal National Mortgage
Association 5.5% 01/09/2037 1,998,750
2,000,000 Federal National Mortgage
Association 5.5% 01/06/2038 1,997,993
1,999,998 Federal National Mortgage
Association 5.5% 01/01/2038 1,997,031
2,000,000 Federal National Mortgage
Association 5.5% 01/06/2038 1,982,597
1,952,278 Federal National Mortgage
Association 5.5% 01/06/2037 1,964,551
1,974,439 Federal National Mortgage
Association 5.5% 01/03/2037 1,959,246
1,970,829 Federal National Mortgage
Association 5.5% 01/02/2037 1,955,665
1,937,121 Federal National Mortgage
Association 5.5% 01/04/2037 1,935,912
1,946,730 Federal National Mortgage
Association 5.5% 01/07/2037 1,926,275
7,654,352 FNS 6.00% 25/03/2038 1,893,316
Proceeds
USD
Cost
USD
202

PUTNAM GLOBAL FIXED INCOME ALPHA FUND S2
Schedule of Portfolio Changes (Unaudited)
for the year ended 30 June 2008
Largest Purchases
Principal Amount
1,479,000,000 Federal National Mortgage
Association (TBA) 5.5% 01/07/2038 1,471,122,771
999,000,000 Federal National Mortgage
Association (TBA) 5.5% 01/06/2038 1,002,597,273
367,000,000 Federal National Mortgage
Association (TBA) 5.5% 01/05/2038 368,115,021
356,000,000 Federal National Mortgage
Association (TBA) 5.5% 01/07/2038 337,412,622
298,000,000 Federal National Mortgage
Association (TBA) 5.5% 01/08/2038 291,865,240
200,000,000 Federal Home Loan Banks 199,964,167
200,000,000 Federal National Mortgage 199,552,444
156,000,000 Federal National Mortgage
Association (TBA) 5% 01/08/2038 148,239,961
78,776,000 Federal Home Loan Banks 78,642,737
63,666,000 WBCMT 2007-C30
5.25% 15/12/2043 61,263,844
60,000,000 Federal Home Loan Banks 59,996,250
60,000,000 Federal Home Loan Banks 59,995,500
59,000,000 JPMCC 2007-LDPX A3S
5.3% 15/01/2049 56,033,911
55,000,000 Federal National Mortgage
Association (TBA) 5.5% 01/04/2038 55,386,072
52,000,000 Federal Home Loan Discount Note
0.00% 27/02/2008 51,996,317
52,000,000 Park Ave Receivables 21/04/2008 51,954,933
50,000,000 Freddie Mac 0.00% 05/03/2008 49,965,375
50,000,000 Federal Home Loan Banks 49,921,167
50,000,000 Ranger Funding Company
06/05/2008 49,920,667
50,000,000 Federal Home Loan Banks
13/06/2008 49,913,028
Largest Sales
No. of Shares
1,000,000,000 Federal National Mortgage
Association (TBA) 5.5% 01/06/2038 1,002,865,575
366,000,000 Federal National Mortgage
Association (TBA) 5.5% 01/05/2038 367,688,539
73,400,000 Federal Home Loan Discount Note
0.00% 11/06/2008 73,339,144
55,000,000 Federal National Mortgage
Association (TBA) 5.5% 01/04/2038 55,492,947
50,000,000 Three Pillars Funding
0.00% 12/06/2008 49,996,986
50,000,000 Federal Home Loan Bank System
0.00% 13/06/2008 49,955,000
40,000,000 Windmill Funding Corporation
0.00% 11/07/2008 39,945,789
35,571,000 Atlantic Asset Securities Corporation
0.00% 10/06/2008 35,557,246
25,500,000 Byrant Park Funding LLC
0.00% 13/06/2008 25,484,642
16,500,000 Old Line Funding Corporation
0.00% 02/07/2008 16,482,813
11,000,000 Thunder Bay Funding Incorporated
0.00% 15/07/2008 10,978,931
10,000,000 Windmill Funding Corporation
0.00% 17/07/2008 9,978,169
36,205,169 FNS 5.5% 25/05/2037 9,626,584
35,476,239 FNS 6.5% 01/07/2036 8,078,451
8,000,000 Byrant Park Funding LLC
0.00% 06/06/2008 7,996,080
6,505,000 Genworth Financial Incorporated
6.515% 22/05/2018 6,124,131
4,333,970 Federal National Mortgage
Association 5.5% 01/02/2038 4,317,957
4,322,322 Federal National Mortgage
Association 5.5% 01/05/2037 4,300,833
4,000,000 Federal National Mortgage
Association 5.5% 01/02/2038 3,995,800
15,932,660 FNS 6% 25/03/2038 3,940,969
Proceeds
USD
Cost
USD
203

204
PUTNAM GLOBAL GROWTH FUND
Schedule of Portfolio Changes (Unaudited)
for the year ended 30 June 2008
Largest Purchases
Principal Amount
437 Samsung Electronics
Company Limited 245,832,345
1,020 Hyundai Department Store
Company Limited 110,182,963
420 Hyundai Mipo PLC 108,263,820
220 Posco Ltd. 104,241,480
3,220 Daewoo Securities Company 93,634,264
240 Honam Petrochemical Corporation 38,066,230
990 LG Petrochemical 35,796,569
3,800 Daiichi Sankyo Company Limited 12,716,355
24 Sony Financial Holdings Incorporated 9,943,170
400 Orix Corporation 9,872,132
2,800 Glory Limited 9,626,118
2,900 Micronics Japan Company Ltd 9,111,059
2,500 Komatsu Limited 8,855,310
1,700 Astellas Pharma Incorporated 8,673,335
7,000 NSK Limited 8,283,140
8,000 Toshiba Corporation 8,182,523
4,000 Sharp Corporation 7,712,388
3,000 Mitsui & Company Limited 7,234,338
5,000 Mitsui O.S.K Lines 6,998,143
800 Alfresa Holdings Corporation 6,821,922
Largest Sales
No. of Shares
840 Hyundai Mipo PLC 198,677,268
1,090 Hyundai Department Store
Company Limited 116,601,730
2,380 Daewoo Securities Company 76,587,963
11,800 Daiichi Sankyo Company Limited 40,895,515
1,090 LG Petrochemical 40,499,234
5,000 Trend Micro Incorporated 22,982,948
3,400 Daito Trust 17,871,821
1,500 Alfresa Holdings Corporation 10,618,045
21 NTT Data Corporation 10,552,214
1,400 Ono Pharmaceutical 9,044,758
40 Posco Corporation 9,015,414
1,600 Sony Corporation 8,446,178
4,500 Nippon Electric Glass Co Ltd 8,128,751
1,700 Terumo Corporation 8,053,971
7,000 Amada Company Limited 7,259,295
1,500 Mitsumi Electric Company 6,445,696
6 Mitsubishi UFJ Financial Group 6,056,970
9 Mizuho Fianancial 5,741,192
850 Token Corporation 4,366,815
20 Honam Petrochem 3,189,760
PUTNAM GLOBAL HIGH YIELD BOND FUND
Schedule of Portfolio Changes (Unaudited)
for the year ended 30 June 2008
Largest Purchases
Principal Amount
13,000,000 Federal Home Loan Banks 12,998,357
5,000,000 Victory Receivables Corporation 4,990,986
5,000,000 Old Line Funding Corporation 4,982,625
4,500,000 Liquid Assets Fund Class I 4,500,000
3,373,000 Federal Home Loan Banks 3,372,410
3,235,000 Ford Motor Credit Company 3,255,624
2,850,000 HCA Incorporated 3,037,467
2,955,000 GMAC Mortgage LLC 2,851,708
2,400,000 Freeport-McMoran
Copper & Gold Incorporated 2,621,235
2,500,000 Qwest Communications
International Incorporated 2,541,002
2,620,000 General Motors Corporation 2,515,136
2,430,000 Trains HY-1-2006 2,429,538
2,255,000 Echostar DBS Corporation 2,258,142
2,040,000 Peabody Energy Corporation 2,088,138
2,270,000 Freescale Semiconductor
Incorporated 2,061,268
2,020,000 TXU Energy Corporation 2,021,722
1,965,000 NRG Energy Incorporated 1,976,947
2,100,000 Tenet Healthcare Corporation 1,951,254
1,780,000 Chesapeake Corporation 1,857,507
1,915,000 CCH II LLC/Capital Corporation 1,802,681
Largest Sales
No. of Shares
1,495,000 Nielsan Finance Company 1,598,404
985,000 DRS technologhy 1,276,992
1,240,000 General Motors Corporation 1,077,257
995,000 Domtar Corporation 1,028,592
1,010,000 L-3 Communications Corporation 1,004,284
960,000 Echostar DBS Corporation 959,240
810,000 Hellas Telecommunication 639,377
580,000 Mediacom LLC 587,661
585,000 Nortek Incorporated 579,881
545,000 Standard Pacific Corporation 551,033
560,000 RBS Global & Rexford Corporation 549,226
530,000 Alliant Techsystems Incorporated 531,275
565,000 Greenbrier Companies Incorpoarted 530,557
540,000 Qwest Communications 526,613
11,700 Chesapeake Corporation 523,144
6,332 Northrop Grumman Corporation 499,094
510,000 Canwest Media Incorporated 495,918
500,000 Impress Holdings 490,944
510,000 Rental Service Corporation 472,016
445,000 JSG Funding PLC 423,612
Proceeds
USD
Cost
USD
Proceeds
USD
Cost
USD

PUTNAM GROWTH AND INCOME
(U.S. VALUE EQUITY) FUND
Schedule of Portfolio Changes (Unaudited)
for the year ended 30 June 2008
Largest Purchases
Principal Amount
6,200 iShares Russell 2000 Growth Index Fund 518,652
7,850 Lehman Brothers Holding 468,977
10,800 JP Morgan Chase & Company 459,411
3,450 Exxon Mobil Corporation 306,101
10,100 Microsoft Corporation 292,918
3,450 Total SA ADR 277,826
2,700 Chevron Corporation 273,600
2,200 Occidental Petroleum Corporation 195,240
9,000 Intel Corporation 186,523
8,000 Staples Incorpotrated 177,302
5,450 Nexen Incorporation 170,194
7,700 Countrywide Financial Corporation 164,151
3,100 Allstate Corporation 155,938
1,500 Noble Drilling 154,350
2,900 JC Penny Company Incorporated 152,837
4,300 General Electric Company 146,567
6,000 Global Industries Limited 145,547
2,900 Wal-Mart Stores 137,513
1,700 Devon Energy Company 135,539
5,100 Cisco Systems Incorporated 127,615
Largest Sales
No. of Shares
5,800 iShares Russell 2000 Growth Index Fund 494,450
9,400 Commerce Bancorp Incorprated 360,621
2,100 Bear Stearns Companies Incorporated 306,352
2,500 Freeport – MC Company 237,901
3,100 Valero Energy Corporation 220,971
2,500 Dominion Resources Incorporated 213,774
3,000 Procter & Gamble 213,578
5,300 Macy’s Incorporated 178,015
1,900 Medco Health Solutions Incorporated 165,443
1,850 Exxon Mobil Corporation 163,467
400 Bank of America Corporation 160,367
4,600 Cisco Systems Incorporated 158,428
7,700 Oracle Corpoartion 153,860
2,900 Noble Drilling 144,630
5,800 BJ Services 143,255
2,600 Express Scripts 139,260
1,250 L-3 Communications Holdings
Incorporated 137,031
3,050 Wells Fargo & Company 135,576
1,250 International Business Machines 135,213
3,350 Pepsi Bottling 127,479
PUTNAM INTERNATIONAL
(NON U.S. CORE) EQUITY FUND
Schedule of Portfolio Changes (Unaudited)
for the year ended 30 June 2008
Largest Purchases
Principal Amount
4,591 Shinhan Financial Corporation 251,473,519
409 Samsung Electronics Company Ltd. 247,972,445
4,170 Hyundai Steel Company 215,817,516
1,350 LG Chemistry Ltd. 106,967,237
44,000 Tokyo Gas Company 23,125,864
3,900 JFE Holdings Incorporated 22,484,856
300 Nintendo Company Ltd 17,676,946
5,400 Mitubishi Corporation 16,439,729
24 KDDI Corporation 16,372,489
60 Hyundai MIPO Corporation 15,466,260
14,000 NSK Ltd. 14,065,513
5,000 Mitsui & Company Ltd 12,657,814
2,200 Astellus Pharmaceuticals Incorporated 11,684,315
6,000 Chiyoda Corporation 11,038,709
8,000 Onward Holdings Corporation 11,030,709
3,300 Daiichi Sankyo Corporation 11,018,014
4,300 Credit Saison Company 10,015,289
10 East Japan Railway Company 8,803,917
4,000 Toyo Suisan Kaishsa Ltd 8,795,963
7 Mizuho Financial Corporation 5,805,196
Largest Sales
No. of Shares
7,760 Hyundai Steel Company 445,986,545
4,310 Shinhan Financial Corporation 235,690,446
13,800 Daiichi Sankyo Corporation 46,121,723
6,900 Fuji Photo Film Company Limited 37,064,163
6,300 Denso Corporation 29,724,444
120 Hyundai MIPO Corporation 29,388,139
59,000 Osaka Gas Company Limited 25,102,354
801 MOL Hungarian Oil & Gas PLC 22,977,168
3,300 ONO Pharmaceuticals 20,266,014
1,500 Trend Micro Incorporated 10,674,841
1,700 Lawson Incorporated 6,627,328
7 Japan Tobacco Incorporated 4,750,117
2,000 Sompo Japan Insurance Incorporated 2,882,597
400 Canon Incorporated 2,530,481
3,000 Sumitomo TR & BK 2,448,474
61,000 Compal Electronics 2,219,718
1,000 Toyo Suisan Kaishsa Ltd 2,024,052
1,000 Konica Minolta Holdings Incorporated 2,010,363
2,000 Asahi Kasei Corporation 1,697,884
100 SMC Corporation 1,535,700
Proceeds
USD
Cost
USD
Proceeds
USD
Cost
USD
205

206
PUTNAM INVESTORS (U.S. CORE EQUITY) FUND
Schedule of Portfolio Changes (Unaudited)
for the year ended 30 June 2008
Largest Purchases
Principal Amount
10,300 SPDR Trust Series 1 1,509,680
13,700 Microsoft Corporation 443,118
8,352 Lehman Brothers Holdings 440,729
10,583 AT&T Incorporated 425,093
13,307 Radian Group Incorporated 419,883
8,539 Ambac Financial Group 370,711
14,382 PMI Group Incorporated 361,424
5,000 Johnson & Johnson Company 330,905
10,000 Wells Fargo & Company 311,303
6,197 Medtronic Incorporated 301,400
8,412 Freddie Mac 281,837
4,600 Mc Graw – Hill Company 276,376
9,939 Genworth Financial Incorporated 272,129
6,066 Fannie Mae 248,640
5,800 Adobe Systems Incorporated 246,819
4,838 Moody Corporation 226,855
2,089 Suncor Energy 219,352
11,500 Countrywide Financial Corporation 219,298
4,870 Bank of America Corporation 209,658
4,400 American International Group Ltd 209,241
Largest Sales
No. of Shares
3,400 SPDR Trust Series 1 599,283
12,456 Commerce Bancorp Incorporated 440,385
15,350 Microsoft Corporation 427,187
3,642 American International Group Ltd. 301,193
9,800 Home Depot Incorporated 299,187
8,300 Wells Fargo & Company 298,073
2,656 Bear Stearns Company 290,771
4,850 Johnson & Johnson Company 289,694
4,550 Proctor & Gamble Corporated 284,311
4,869 Bank of America Corporation 252,767
4,200 Morgan Stanley 229,112
5,800 Walt Disney Company 199,138
3,300 Ace Ltd. 197,843
8,800 Applied Materials Incorporated 184,717
3,900 Trane Incorporated 178,706
2,750 Clorox Company 171,973
3,200 Cigna Corporation 170,301
6,100 Starbucks Corporation 163,747
11,500 E*Trade Financial Corporation 153,680
27 Radian Group Incorporated 144,680
PUTNAM NEW OPPORTUNITIES
(U.S. AGGRESSIVE GROWTH EQUITY) FUND
Schedule of Portfolio Changes (Unaudited)
for the year ended 30 June 2008
Largest Purchases
Principal Amount
19,000 Cisco Systems Incorporated 588,264
15,600 Intel Corporation 395,099
12,000 Microsoft Corporation 377,340
4,400 Exxon Mobil Corporation 374,413
4,000 Proctor & Gamble Company 282,938
2,700 Schlumberger Ltd. 253,067
4,900 Aetna Incorporated 246,933
3,500 Altria Group Incorporated 239,728
4,600 Nvidia Corporation 212,827
3,100 CF Industries Holdings Incorporated 212,243
2,700 PepsiCo Incorporated 200,479
5,200 Gilead Sciences Corporation 194,152
3,900 Hewlett-Packard PLC 190,635
300 Google Incorporated 188,109
3,700 Omnicom Group 184,194
2,700 Johnson & Johnson Company 175,586
8,400 Symantec Corporation 160,993
5,400 CB Richard Ellis Group Incorporated 158,313
5,100 Terra Industries Ltd. 158,227
5,400 TJX Company Incorporated 156,201
Largest Sales
No. of Shares
5,100 Cleveland-Cliffs Incorporated 432,662
9,240 Qualcomm Incorporated 360,841
6,560 United Health Group Incorporated 322,674
4,500 Humana Incorporated 304,988
4,390 Colgate-Palmolive Company 293,303
3,200 CF Industries Holdings Incorporated 291,342
6,700 Nvidia Corporation 279,180
10,968 American Eagle Outfitters 278,032
1,900 Apple Incorporated 254,221
3,200 WellCare Health Plans Incorporated 251,173
4,400 Manitowoc Company Incorporated 245,507
4,300 Kla-Tencor Corporation 244,275
7,450 Dollar Tree Store 242,086
33,400 Brocade Communications System 239,392
4,300 Baxter International Incorporated 238,338
4,420 Coca-Cola Company 236,603
2,300 National Oilwell Varco Incorporated 236,301
2,900 Becton Dickinson & Company 232,411
3,800 Raytheon Company 229,863
1,300 Goldman Sachs Group Incorporated 228,506
Proceeds
USD
Cost
USD
Proceeds
USD
Cost
USD

PUTNAM OPPORTUNISTIC VALUE FUND
Schedule of Portfolio Changes (Unaudited)
for the year ended 30 June 2008
Largest Purchases
Principal Amount
1,413,000 Federal National Mortgage Association 1,412,460
435,000 Fed Home Loan Discount 434,948
1,189 Morgan Stanley 75,797
7,384 Ford Motor Company 62,530
943 Nocor Corporation 52,139
822 Clorox Company 50,695
1,342 Home Depot Incorporated 46,103
1,193 Ambac financial Group 44,919
738 United Health Group Ltd 38,948
1,554 Staples Incorporated 34,995
466 Merrill Lynch & Company Incorporated 34,693
757 Wesco International 34,252
683 Harley-Davidson Incorporated 33,656
1,999 Countrywide Financial Corporation 30,051
817 Fannie Mae 29,883
1,133 Radian Group Incorporated 29,441
842 Genworth Financial Incorporated 23,625
446 Allstate Corporation 22,878
224 Bear Stearns Companies Incorporated 21,629
363 Capone Final 21,114
Largest Sales
No. of Shares
48 Berkshire Hath Company 208,368
6,054 Intel Corporation 154,465
2,028 Du Pont EI 96,742
610 PNC Financial SE 45,434
1,476 Bank of America Corporation 84,771
840 Boeing Company 83,380
1,600 Hewlett-Packard Corporation 83,019
2,338 Kraft Foods Incorporated 76,609
1,920 Donnelley & Sons 72,821
606 International Business Machines 65,991
748 Textron Incorporated 64,998
4,032 Southwest Air 62,103
319 Freeport – MC Company 30,613
466 Merrill Lynch & Company Incorporated 30,369
862 Officemax Incorporated 29,487
302 Parker Hannifin 28,390
291 Freeport – MC Company 28,079
239 Molson Coors Brewing Company 27,315
352 PNC Financial SE 26,959
727 Officemax Incorporated 24,870
Proceeds
USD
Cost
USD
207
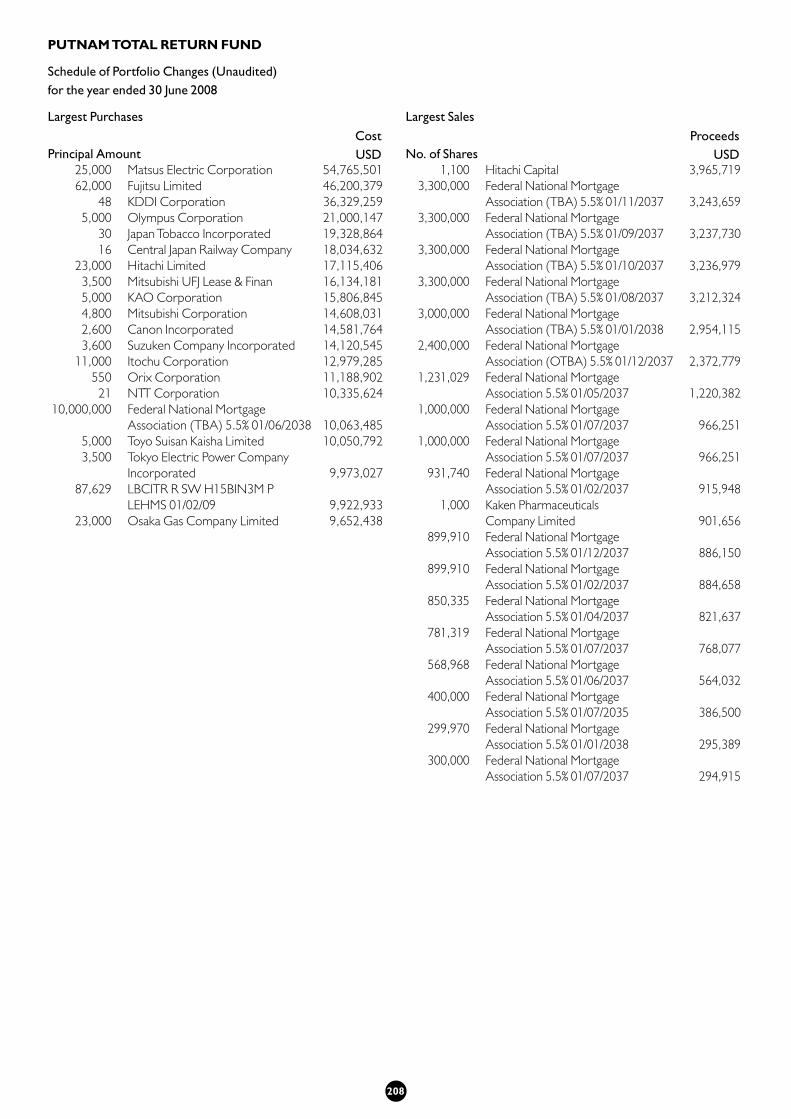
PUTNAM TOTAL RETURN FUND
Schedule of Portfolio Changes (Unaudited)
for the year ended 30 June 2008
Largest Purchases
Principal Amount
25,000 Matsus Electric Corporation 54,765,501
62,000 Fujitsu Limited 46,200,379
48 KDDI Corporation 36,329,259
5,000 Olympus Corporation 21,000,147
30 Japan Tobacco Incorporated 19,328,864
16 Central Japan Railway Company 18,034,632
23,000 Hitachi Limited 17,115,406
3,500 Mitsubishi UFJ Lease & Finan 16,134,181
5,000 KAO Corporation 15,806,845
4,800 Mitsubishi Corporation 14,608,031
2,600 Canon Incorporated 14,581,764
3,600 Suzuken Company Incorporated 14,120,545
11,000 Itochu Corporation 12,979,285
550 Orix Corporation 11,188,902
21 NTT Corporation 10,335,624
10,000,000 Federal National Mortgage
Association (TBA) 5.5% 01/06/2038 10,063,485
5,000 Toyo Suisan Kaisha Limited 10,050,792
3,500 Tokyo Electric Power Company
Incorporated 9,973,027
87,629 LBCITR R SW H15BIN3M P
LEHMS 01/02/09 9,922,933
23,000 Osaka Gas Company Limited 9,652,438
Largest Sales
No. of Shares
1,100 Hitachi Capital 3,965,719
3,300,000 Federal National Mortgage
Association (TBA) 5.5% 01/11/2037 3,243,659
3,300,000 Federal National Mortgage
Association (TBA) 5.5% 01/09/2037 3,237,730
3,300,000 Federal National Mortgage
Association (TBA) 5.5% 01/10/2037 3,236,979
3,300,000 Federal National Mortgage
Association (TBA) 5.5% 01/08/2037 3,212,324
3,000,000 Federal National Mortgage
Association (TBA) 5.5% 01/01/2038 2,954,115
2,400,000 Federal National Mortgage
Association (OTBA) 5.5% 01/12/2037 2,372,779
1,231,029 Federal National Mortgage
Association 5.5% 01/05/2037 1,220,382
1,000,000 Federal National Mortgage
Association 5.5% 01/07/2037 966,251
1,000,000 Federal National Mortgage
Association 5.5% 01/07/2037 966,251
931,740 Federal National Mortgage
Association 5.5% 01/02/2037 915,948
1,000 Kaken Pharmaceuticals
Company Limited 901,656
899,910 Federal National Mortgage
Association 5.5% 01/12/2037 886,150
899,910 Federal National Mortgage
Association 5.5% 01/02/2037 884,658
850,335 Federal National Mortgage
Association 5.5% 01/04/2037 821,637
781,319 Federal National Mortgage
Association 5.5% 01/07/2037 768,077
568,968 Federal National Mortgage
Association 5.5% 01/06/2037 564,032
400,000 Federal National Mortgage
Association 5.5% 01/07/2035 386,500
299,970 Federal National Mortgage
Association 5.5% 01/01/2038 295,389
300,000 Federal National Mortgage
Association 5.5% 01/07/2037 294,915
Proceeds
USD
Cost
USD
208

PUTNAM U.S. LIQUID ASSETS FUND
Schedule of Portfolio Changes (Unaudited)
for the year ended 30 June 2008
Largest Purchases
Principal Amount
1,519,000 Amstel Funding Corporation 1,500,619
1,490,000 Sheffield Received Corporation 1,485,753
1,463,000 Natixis Corporation 1,462,782
1,455,000 Charta LLC 1,454,783
1,400,000 Fortis Bank NY 1,401,308
1,300,000 Bank of Ireland PLC 1,285,542
1,250,000 Bank of America Corporation 1,240,487
1,165,000 Windmill Funding Corporation 1,164,442
1,028,000 Barton Capital Corporation 1,027,847
1,000,000 Stratford Recreation Company LLc 999,851
1,000,000 Sheffield Received Corporation 999,847
1,000,000 Federal Home Loan Banks 996,702
1,000,000 Beagle Funding LLc 995,807
900,000 CO HSG-ADJ-TXB-SFM-B1 913,456
900,000 Ba Credit Card Trust Emerald 888,593
850,000 BNP Paribas Finace Incorporated 846,927
805,000 Gotham Funding Corporation 804,779
800,000 Danske Corporation 795,678
799,000 Yorktown Capital LLC 794,984
800,000 Atlantic Asset Securities Corporation 794,703
Largest Sales
No. of Shares
1,300,000 Bank of Ireland PLC 1,295,135
900,000 CO HSG-ADJ-TXB-SFM-B1 918,980
800,000 Atlantic Asset Securities Corporation 797,530
700,000 Charta LLC 699,811
700,000 Barton Capital Corporation 699,480
658,000 Yorktown Capital LLC 656,934
650,000 Bank of America Corporation 649,336
600,000 Old Line Funding Corporation 599,919
600,000 Barton Capital Corporation 599,833
600,000 HBOS Treasury Services PLC 599,388
600,000 Aegon Funding Corporation 599,277
600,000 Unicredito International Bank 599,175
600,000 Westpac Banking Corporation 598,875
600,000 Swedbank Mortgage Corporation 598,693
600,000 UBS Finance Incorporated 598,675
600,000 Barclays U.S. Funding Corporation 598,663
600,000 CRC Funding LLC 598,240
600,000 Societe Generale 597,280
600,000 ICICI Bank Ltd 592,518
600,000 Grampian Funding LLC 588,110
PUTNAM U.S. SMALL-CAP VALUE EQUITY FUND
Schedule of Portfolio Changes (Unaudited)
for the year ended 30 June 2008
Largest Purchases
Principal Amount
36,920 Cutera Incorporated 808,071
86,300 Centennial Communications Ltd. 803,682
68,041 Prestige Brands Holdings Incorporated 748,956
26,800 Geoeye Incorporated 702,301
8,300 Haynes International Incorporated 692,385
23,800 Southwest Gas Corporation 683,108
31,100 Ennis Incorporated 656,734
23,900 Technitrol Incorporated 640,924
21,700 Amerigroup Incorporated 633,185
46,000 Phoenix Corporation 631,470
15,800 Enpro Industries Ltd. 624,303
11,700 DRS Technologies Ltd. 621,592
16,900 Drew Industrial Incorporated 613,730
39,400 Mentor Graphics Corporation 604,837
49,980 Monotype Imaging Holdings Incorporated 602,073
41,159 Ezcorp Incorporated 529,510
16,000 UIL Holdings Corpoartion 527,481
51,645 GSI Group Incorporated 517,042
8,700 Grief Incorporated 513,357
16,700 Unisource Energy 512,366
Largest Sales
No. of Shares
28,670 UAP Holding Corporation 990,941
39,900 Goodman Global Incorporated 964,720
21,522 Tennant Company 956,168
27,300 Commerce Group Incorporated 935,026
29,381 Lamson & Session Company 767,785
18,682 Gardner Denver Incorporated 709,305
13,652 Reliance Steel & Aluminium Company 687,372
41,717 Citizens Republic Bancorp Incorporated 673,206
30,600 Alpharma Incorporated 664,594
23,300 Landry S Restaurant Incorporated 648,253
36,700 Consolidated Communications
Incorporated 638,989
99,115 RF Micro Devices Ltd. 608,215
50,315 IKON Office Solutions Incorporated 591,714
23,769 Sonic Automotive 585,905
14,600 Landstar System Company 582,699
48,170 Kforce Incorporated 567,926
14,800 Nash Finch Company 555,548
13,920 Unifirst Corporated 526,390
29,100 Midas Incorporated 523,157
11,200 Edwards Life 521,738
Proceeds
USD
Cost
USD
Proceeds
USD
Cost
USD
209

PUTNAM VISTA (U.S. MID-CAP EQUITY) FUND
Schedule of Portfolio Changes (Unaudited)
for the year ended 30 June 2008
Largest Purchases
Principal Amount
10,800 iShares Russell Midcap Growth 1,182,314
21,500 Nvidia Corporation 724,818
16,800 TJX Cos Incorporated 487,233
8,900 Mc Dermot International 478,201
12,300 Mirant Corporation 477,945
18,100 Seagate Technology 438,399
2,500 Apple Incorporated 437,601
14,500 CB Richards Ellis Group Incorporated-A 403,361
1,900 Blackrock Incorporated 395,739
3,700 Foster Wheeler Ltd. 386,361
14,500 NCR Corporation 370,233
6,100 Agco Corporation 366,594
2,900 Fluor Corporation 366,097
48,400 Novell Incorporated 365,726
4,800 Boeing Company 360,551
14,400 Cisco Systems 355,396
2,100 Intercontinental Exchange Incorporated 355,094
12,600 Microsoft Corporation 350,732
8,800 Darden Restaurants Incorporated 340,557
5,700 FMC Technologies 337,883
Largest Sales
No. of Shares
5,360 Unibanco-GDR 781,631
13,100 KLA-Tencor Corporation 758,969
29,800 American Eagle Outfitters 737,990
9,500 MEMC Electric Materials Incorporated 631,994
28,929 Mattel Incorporated 617,542
25,264 Amer Greetings PLC 615,159
83,070 Brocade Communications System 603,206
18,206 Tempur-Pedic International 582,391
18,780 Continental Air Corporation 573,238
25,120 Big Lots Incorporated 552,622
8,180 WellCare Health Plans Incorporated 538,430
42,060 Teradyne Incorporated 535,250
30,154 Emulex Corporation 533,756
11,741 Mentor Corporation 513,278
8,070 Lubrizol Corporation 501,060
12,300 Mirant Corporation 491,877
9,400 Taubman Centers 490,837
3,400 Carpenter Technology 475,101
17,892 Covanta Holding Corporation 469,550
12,428 Axis Capital Holdings Ltd. 453,967
Proceeds
USD
Cost
USD
210

PutnamWorld Trust Organisation
Putnam Investments (Ireland) Limited®
Citi Fund Services (Ireland), Limited1 North Wall QuayDublin 1Ireland
David Dillon (Ireland)F. Peter Ferrelli (U.S.)Mitchell B. Fishman (U.S.) (resigned 31 December 2007)Gordon M. Forrester (U.K.)Jeffrey F. Peters (U.S.) (resigned 31 August 2007)Joseph T. Phoenix (U.S.)Wyndham Williams (Ireland)Christopher T. Thompson (U.S.) (approved 10 October 2007)Paul T. Quistberg (U.S.) (resigned 22 February 2008)
The Putnam Advisory Company, LLCOne Post Office SquareBoston, Massachusetts 02109United States of America
State Street Custodial Services (Ireland) LimitedGuild HouseGuild StreetInternational Financial Services CentreDublin 1Ireland
State Street Fund Services (Ireland) LimitedGuild HouseGuild StreetInternational Financial Services CentreDublin 1Ireland
Citi Fund Services (Ireland), Limited1 North Wall QuayDublin 1Ireland
PricewaterhouseCoopersChartered Accountants and Registered AuditorsOne Spencer DockNorth Wall QuayDublin 1Ireland
Dillon Eustace33 Sir John Rogerson’s QuayDublin 2Ireland
Manager:
Registered Office of the Manager:
Directors of the Manager:
Investment Advisor:
Trustee:
Administrator:
Transfer Agent:
Independent Auditors:
Legal Advisors:
211

Fortis Foreign Fund Services AGRennweg 57, Postfach8021 Zürich, Switzerland
Fortis Banque (Suisse) S.A., Zurich branch Rennweg 57, Postfach8021 Zürich, Switzerland
Administratiekantoor van De Twentsche Trust Maatschappij B.V.“Atrium” 7th FloorStrawinskylaan 3105, 1077 ZX, AmsterdamP.O. Box 71744, 1008 DE, AmsterdamThe Netherlands
Erste Bank der Oesterreichischen Sparkassen AG Graben 21A-1010 WienAustria
J.P. Morgan AGJunghofstrasse 1460311 Frankfurt am MainGermany
SKANDINAVISKA ENSKILDA BANKEN ABSEB Merchant BankingSecurities ServicesGlobal Funds, RA6Rissenleden 110SE-106 40 StockholmSweden
Representative in Switzerland*
Paying Agent in Switzerland
Information Agentin The Netherlands
Paying and Information Agent in Austria
Paying and Information Agentin Germany*
Paying and Information Agent in Sweden
PutnamWorld Trust Organisation (Continued)
* The management regulations, the prospectus, the simplified prospectus, the unaudited semiannual reports, as well as the auditedannual reports, can be obtained free of charge from the paying agent and information office in Germany and from the Representativein Switzerland. A copy of the list of changes in the portfolio during the reference period may be obtained free of charge at the custodianor paying agents, at the paying and information agent in Germany, and at the Representative in Switzerland.
212

THIS PAGE LEFT BLANK INTENTIONALLY

EU025 252799 10/08
Putnam Investments (Ireland) Limited®1 North Wall Quay
Dublin 1
Ireland
www.putnam.com
Authorised and regulated by the
Financial Regulator.
Putnam Investments Limited®Cassini House
57-59 St. James’s Street
London SW1A1LD
United Kingdom
Tel: +44 (0)20-7907-8200
Authorised and regulated by the
Financial Services Authority.
Putnam Investments Limited®Niederlassung Deutschland
Siemensstrasse 8
D-63263 Neu-Isenburg
Germany
Tel: +49 (0)6102 56059-0
What makes Putnam different?A time-honoured tradition in money management
A prudent approach to investing
Funds for every investment goal
A commitment to doing what’s right for investors
Industry-leading service