pv value® user manual v. 1 - sandia...
TRANSCRIPT

PV Value®
User Manual v. 1.1
Jamie L. Johnson – Energy Sense Finance
Geoffrey T. Klise – Sandia National Laboratories
9/1/2012
SAND2012-7306P
Sandia National Laboratories is a multi-program laboratory managed and operated by Sandia Corporation, a wholly owned subsidiary of Lockheed Martin Corporation, for the U.S. Department of Energy's National Nuclear Security
Administration under contract DE-AC04-94AL85000.

September 1, 2012
PV VALUE® USER MANUAL V. 1.1
i
Executive Summary
This user manual describes the methods used to develop a model for appraising the value of a
photovoltaic (PV) system installed on residential and commercial properties. This model follows
the Income Capitalization Approach used by appraisers to determine the value of a PV system as
a function of the potential energy produced over the system’s lifetime. Instructions on how to
properly input values into the spreadsheet tool are presented along with a detailed description of
each parameter. PV Value® is intended for use by real estate appraisers, mortgage underwriters,
credit analysts, real property assessors, insurance claims adjusters, and PV industry sales staff.
This user manual references version 1.1 of the “Photovoltaic Energy Valuation Model,” (PV
Value®) with a copyright date of August 31, 2012. The original version 1.0 was released on
January 31, 2012, and has now expired. Version 1.1 has updates that were requested by users,
most importantly an Excel® 2011 version for Mac OS X. This user manual has been changed to
reflect the additional features in the model. Check back to www.pvvalue.com or
http://pv.sandia.gov/pvvalue for newer versions of the spreadsheet tool. A new release is
anticipated on or before December 20, 2013. Any questions or comments can be directed to
Geoff Klise and Jamie Johnson at [email protected]. PV Value® is a registered trademarked
by Jamie Johnson with Energy Sense Finance.
This project represents the results of a collaborative effort between Energy Sense Finance and
Sandia National Laboratories that was made possible through funding provided by the U.S.
Department of Energy’s Office of Energy Efficiency and Renewable Energy. This valuation tool
will reduce non balance-of-system (BOS) market barriers to PV by reducing uncertainty about
the value of a PV system. Acceptance and use of this tool by the real estate industry will
contribute to the overall penetration of PV systems across the U.S.

September 1, 2012
PV VALUE® USER MANUAL V. 1.1
ii
Contents
1. SUMMARY OF VERSION 1.1 UPDATES ............................................................................. 1
2. ABBREVIATIONS & DEFINITIONS ..................................................................................... 1
3. VALUATION ISSUES FACING DISTRIBUTED PV .................................................................. 1
3.1 APPRAISAL VALUATION METHODS ............................................................................................... 2
3.2 SALES COMPARISON APPROACH .................................................................................................. 2
3.3 COST APPROACH ........................................................................................................................... 2
3.4 INCOME CAPITALIZATION APPROACH .......................................................................................... 2
4. CALCULATING THE FUTURE ENERGY PRODUCTION .......................................................... 3
4.1 GRID-TIED SOLAR ELECTRIC (PV) SYSTEM BASICS ......................................................................... 3
4.2 DIFFERENT TYPES OF SOLAR ......................................................................................................... 3
4.3 TILT & ORIENTATION FACTOR ....................................................................................................... 4
4.4 SHADING ....................................................................................................................................... 4
4.5 DESIGN, PERMITTING & INSTALLATION ........................................................................................ 5
4.6 CALCULATING FUTURE ENERGY PRODUCTION ............................................................................. 5
4.7 MODULE DEGRADATION ............................................................................................................... 6
4.8 UTILITY RATE ESCALATION PERCENT ............................................................................................ 7
4.9 DISCOUNT RATE ............................................................................................................................ 7
4.10 OPERATION & MAINTENANCE EXPENSES ..................................................................................... 8
4.11 SALVAGE VALUE ............................................................................................................................ 9
4.12 VALUATION MODEL FOR THE INCOME APPROACH ...................................................................... 9
5. EXCEL® SPREADSHEET INSTRUCTIONS ............................................................................. 9
5.1 ANALYSIS TAB ................................................................................................................................ 9
5.2 RESOURCES & REFERENCES ........................................................................................................ 12
APPENDIX............................................................................................................................ 13
OTHER FINANCIAL ANALYSIS METHODS USED FOR SOLAR PV ............................................................... 14
INTERNAL REVENUE CODE SECTIONS RELATING TO SOLAR ................................................................... 18

September 1, 2012 PV VALUE® USER MANUAL V. 1.1
1
1. SUMMARY OF VERSION 1.1 UPDATES
Mac Excel® 2011
The main update for version 1.1 was to re-do the spreadsheet
and code to allow for use on a Mac running Excel® 2011.
Because of these changes, this version can be used
interchangeably between a PC with Excel® 2007 and 2010,
and a Mac with excel® 2011. PV Value® will not work in other
versions of excel for a PC or a Mac. PV Value® will not work
in any other spreadsheet software, including OpenOffice Calc,
Numbers, etc.
The best resolution to view the spreadsheet is 100%, due to
the required use of Form Controls to make PV Value® work
on both operating systems. Form controls are limiting as list
box and combo box text cannot be re-sized, therefore some
text will be difficult to read at zoom levels less than 100%.
Property Type Choice
In this version, we added a ‘Property Type’ choice which will
toggle certain features for both residential and commercial
appraisals.
Utility Escalation Rate
The utility escalation rate is now tied to the remaining system
lifetime, where a new system would use the most recent 21
years of data from the EIA (currently back to 1990) to
calculate the statewide average escalation rate. For example,
a system that has 10 years remaining of warranty lifetime
would use the last 10 years to make that calculation. This
differs from version 1.0 as it calculated an escalation rate for
all remaining energy lifetimes using a 21-year spread (1990-
2011).
Module Warranty
A 20-year module warranty was added. Version 1.0 only had
25 or 30 year module warranty options.
Net Present Value
The ability to calculate Net Present Value was added to allow
users an additional financial metric for comparing their net
cost after incentives to the calculated present value of the
energy production.
2. ABBREVIATIONS & DEFINITIONS
Solar Nomenclature
Watt A unit of power defined as (voltage x current) kW Kilowatt 1000 watts kWh Kilowatt hour 1000 watts for an hour PV Photovoltaic AC Alternating Current DC Direct Current TOF Tilt and Orientation Factor STC Standard Test Condition
Financial Nomenclature
CAGR Compound annual growth rate DR Discount rate IRR Internal rate of return MIRR Modified internal rate of return MPB Modified payback NPV Net present value SPB Simple payback WACC Weighted average cost of capital
3. VALUATION ISSUES FACING DISTRIBUTED PV
Assigning a reasonable valuation for an existing installed Solar
Electric / Photovoltaic (PV) System is important for the
distributed PV industry as it continues its transition from the
innovation stage through early adoption and eventually to
mainstream use.
Rogers bell curve showing the adoption rate for technological innovations.
Distributed PV in the US is currently believed to be in the Innovators stage.
(Image Credit – Wikipedia.org/diffusion of innovations)

September 1, 2012 PV VALUE® USER MANUAL V. 1.1
2
With the consequences of the recent over valuation issue in
the real estate market still making headlines, mortgage
lenders and appraisers have begun to question the valuation
of PV systems and the potential value of the annual energy
that can be generated. There are also concerns that if
separate financing is obtained by the home or commercial
building owner to pay for a PV installation, the monthly loan
payment may exceed the monthly energy savings, thereby
creating a potential negative effect on the value of a
residential or commercial building that the system is installed
upon.
Often relying on the system owner’s estimate of annual
energy savings is difficult at best for various reasons. The
system owner’s expectations of annual energy production
can be higher than the actual energy production measured at
the point of use. This can be due to improper installation
techniques or poor equipment selection by the installing
contractor, sub-optimal location, current and future shading,
over-estimating potential kWh production by the PV
salesperson, and not the least of which can be due to overall
system reliability.
3.1 APPRAISAL VALUATION METHODS
Typical metrics used for an appraisal valuation are usually
based on either the sales comparison (comparable), cost or
income capitalization approaches.
3.2 SALES COMPARISON APPROACH
As a general rule, a purchaser of residential or commercial
property will not pay more for a given property than what a
similar property can be purchased for. There is often a lack of
comparable sales data on existing residential and commercial
buildings with installed PV systems in the various regional
multiple listing service (MLS) databases, and in some cases
there may not even be a search option for renewable energy
technology. It can be difficult for an appraiser to determine a
value for a PV system using the principle of substitution with
the sales comparison approach.
This should improve once the various MLS database providers
add search options for renewable technologies such as PV,
and more residential and commercial buildings with PV
systems are put on the market and close escrow. Some
examples of solar features added to MLS data entry fields can
be found at the Green MLS Tool Kit.
http://greenthemls.org/index.cfm
3.3 COST APPROACH
It is also often difficult when using the cost approach to
calculate the replacement cost of the PV system due to the
following reasons: the installed cost quoted by competing
solar companies can vary by 20 – 30% or more, the incentives
that are used to bring down the installed net cost may also
vary from time to time although generally they have been
declining, and the beneficial effect of tax credits (and
accelerated/bonus depreciation for commercial systems) can
vary from one system owner to another due to differing
effective federal tax rates.
The replacement cost is often relied on by insurance
companies in order to determine a replacement value. If the
PV installation is recent, then the replacement cost can
sometimes be higher than the original PV installation net
cost, which could be due to the ending of a PV rebate
program, a decline in the rebate amount, or the PV system
owner qualifying for a rebate on the original PV system (due
to incentive program rules, they may not be able to qualify
for a second rebate on a replacement PV system).
It is also important to note that in many cases PV installations
are done before the end of the year in order for the
prospective PV system owner to lighten their tax burden
through the use of the 30% federal tax credit, state tax
credits (and accelerated/bonus depreciation for commercial
systems). If a replacement PV system is needed, the PV
system owner may no longer be in the same tax situation and
may not be able to utilize the tax write off.
3.4 INCOME CAPITALIZATION APPROACH
The income approach is based on the idea that the value of a
property is equal to the capitalized value of the net income
stream generated by that property. Applying this approach
to PV looks at what one may be willing to pay today for the
opportunity to receive future cash flows using a discounted
cash flow model. This model needs to adequately consider
the present value of projected future energy production
along with estimated operation and maintenance costs that
are anticipated to occur during the solar module power
production warranty timeframe.

September 1, 2012 PV VALUE® USER MANUAL V. 1.1
3
The residential or commercial building owner or purchaser’s
weighted average cost of capital (WACC) is used along with a
risk premium spread to determine a discount rate for the
present value calculation. For residential properties, the
purchaser’s WACC is then calculated based off of a readably
available benchmark interest rate such as the Fannie Mae or
Freddie Mac 30-year fixed rate 60-day commitment (if the
purchaser is using a 30-year fixed rate purchase mortgage).
Regardless of the benchmark chosen, for the purpose of this
model it should closely mirror the cost of borrowing for the
purchaser of the income stream.
Note: Although some states have eliminated real property
taxes on renewable energy systems, as accurate valuations
become necessary for PV systems due to lending
requirements, it might be easier to assign a value to the PV
system if the Standard Test Condition (STC) kW size, along
with the month and year of the installation is listed on the
respective real property assessors website, just like other
pertinent data which may be useful for appraisal purposes.
Using the income approach, a reasonable valuation can be
arrived at through the observation of visible installed
components and a review of the latest system performance
test and installation documentation, including a digital
shading analysis. This information should have been
provided by the installing contractor to the original system
owner after the system was successfully commissioned.
If a system performance test has not been performed within
the past 12 months, and/or a digital shading analysis is not
available, and the value of the system is critical, both should
be performed by a trained and certified solar PV installer who
works for a properly licensed contractor.
Currently there are two organizations that certify installers:
The North American Board of Certified Energy Practitioners
(NABCEP) has over 2100 certified solar PV installers
nationwide. NOTE: NABCEP currently has 2 different
certifications for the PV industry, Solar PV Installer™ and PV
Technical Sales Professional™. www.nabcep.org
Underwriters Laboratory (UL), which certifies electricians
through their UL University personal certification program.
www.uluniversity.us
4. CALCULATING THE FUTURE ENERGY
PRODUCTION
4.1 GRID-TIED SOLAR ELECTRIC (PV) SYSTEM BASICS
First a word of caution – PV Systems can operate at lethal
voltages approaching 600 volts or more and should only be
accessed by qualified personnel such as a trained and
certified solar PV installer who works for a properly licensed
contractor.
A grid-tied PV system (without battery backup) usually
consists of one or more modules which may be wired
together in series or parallel to form an array which is then
connected to an inverter. The modules convert sunlight
energy into DC voltage, which must then be converted by a
power conditioning unit (inverter) to the same AC voltage
that is required at the point of use.
Solar PV systems are most often found mounted on a rooftop
and may also occasionally be mounted on a ground rack or
solar canopy. They are installed so that ideally the modules
are tilted near the local latitude and if in the northern
hemisphere oriented towards true south. To achieve the
maximum potential annual energy production the modules
also need to have unshaded access to the sun during the peak
solar insolation (or peak sun hours) time of 9am to 3pm solar
time.
It is important to note that two otherwise similar solar PV
systems of equal size and cost that are installed at a different
tilt and orientation from each other and which also have
different amounts of shading, will not necessarily produce
equal amounts of energy, and in some cases may have
dramatically different annual energy production figures.
4.2 DIFFERENT TYPES OF SOLAR
The two photographs shown here outline some of the
differences between solar PV and solar thermal. Typically a
home will have either one or the other, though sometimes
both solar PV and solar thermal will be present.
September 1, 2012 PV VALUE® USER MANUAL V. 1.1
4
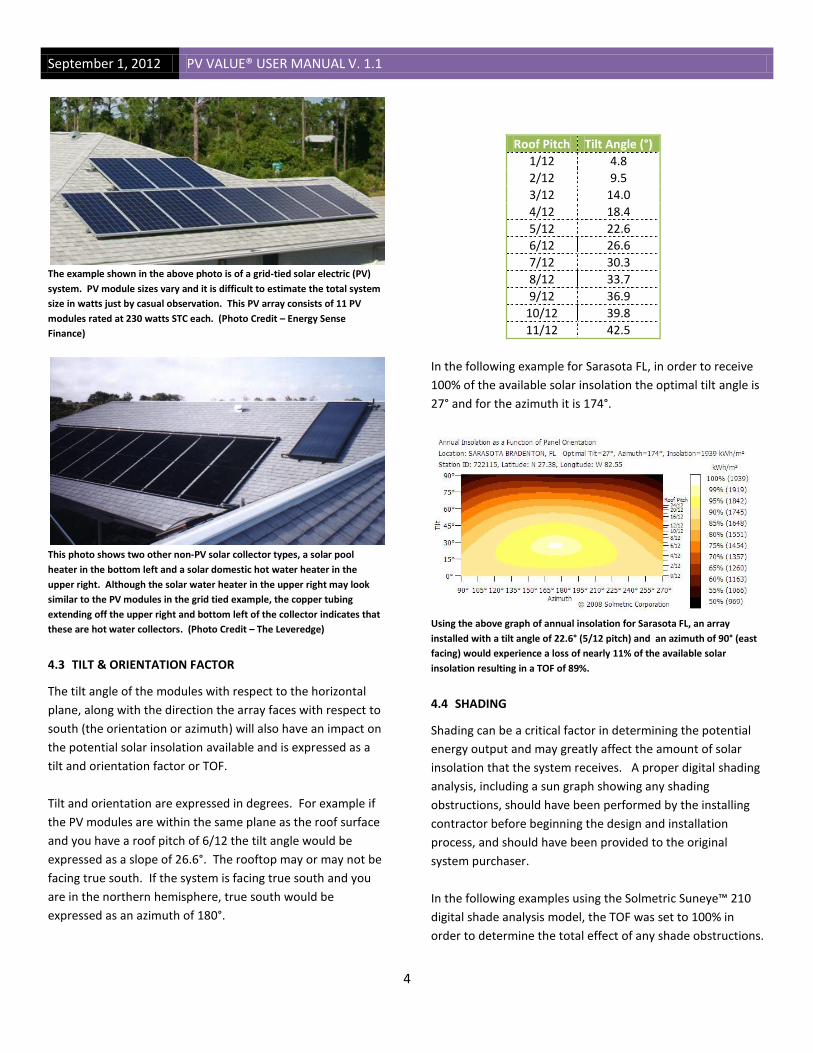
The example shown in the above photo is of a grid-tied solar electric (PV)
system. PV module sizes vary and it is difficult to estimate the total system
size in watts just by casual observation. This PV array consists of 11 PV
modules rated at 230 watts STC each. (Photo Credit – Energy Sense
Finance)
This photo shows two other non-PV solar collector types, a solar pool
heater in the bottom left and a solar domestic hot water heater in the
upper right. Although the solar water heater in the upper right may look
similar to the PV modules in the grid tied example, the copper tubing
extending off the upper right and bottom left of the collector indicates that
these are hot water collectors. (Photo Credit – The Leveredge)
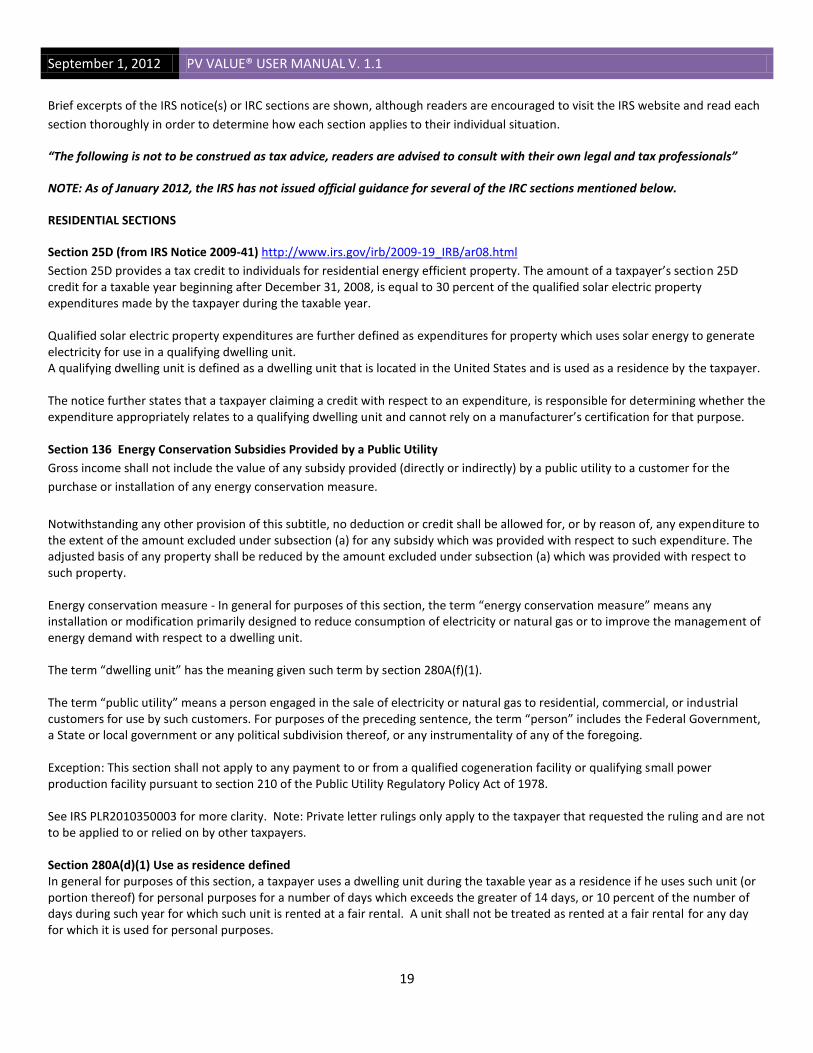
4.3 TILT & ORIENTATION FACTOR
The tilt angle of the modules with respect to the horizontal
plane, along with the direction the array faces with respect to
south (the orientation or azimuth) will also have an impact on
the potential solar insolation available and is expressed as a
tilt and orientation factor or TOF.
Tilt and orientation are expressed in degrees. For example if
the PV modules are within the same plane as the roof surface
and you have a roof pitch of 6/12 the tilt angle would be
expressed as a slope of 26.6°. The rooftop may or may not be
facing true south. If the system is facing true south and you
are in the northern hemisphere, true south would be
expressed as an azimuth of 180°.
Roof Pitch Tilt Angle (°)
1/12 4.8
2/12 9.5
3/12 14.0
4/12 18.4
5/12 22.6
6/12 26.6
7/12 30.3
8/12 33.7
9/12 36.9
10/12 39.8
11/12 42.5
In the following example for Sarasota FL, in order to receive
100% of the available solar insolation the optimal tilt angle is
27° and for the azimuth it is 174°.
Using the above graph of annual insolation for Sarasota FL, an array
installed with a tilt angle of 22.6° (5/12 pitch) and an azimuth of 90° (east
facing) would experience a loss of nearly 11% of the available solar
insolation resulting in a TOF of 89%.
4.4 SHADING
Shading can be a critical factor in determining the potential
energy output and may greatly affect the amount of solar
insolation that the system receives. A proper digital shading
analysis, including a sun graph showing any shading
obstructions, should have been performed by the installing
contractor before beginning the design and installation
process, and should have been provided to the original
system purchaser.
In the following examples using the Solmetric Suneye™ 210
digital shade analysis model, the TOF was set to 100% in
order to determine the total effect of any shade obstructions.

September 1, 2012 PV VALUE® USER MANUAL V. 1.1
5
Shading is referenced as a percent of total solar insolation
available, so if 5% shading is observed then the percent of the
total solar insolation available would be 95%.
Solar Access Graph with minimal visible shading (3%) right at sunrise and
sunset. Most of the shading in this photo is due to mature trees which
were not on the surveyed property. The graphs are relatively easy to read
with only half the months shown due to the overlapping nature of the
spring and fall equinox. This photo was taken in December just after 12pm
solar time. (Photo Credit – Energy Sense Finance)
Solar Access Graph with shade starting at 1:30pm in the summer and 2pm
in the winter and continuing through the rest of the day. The potential
solar insolation in this example is reduced by nearly 30%. This will have a
major impact on the potential energy production and must be accounted
for in the valuation model. This photo was taken in March just after
8:00am solar time. (Photo Credit – Energy Sense Finance)
Solar Access Graph with minor shade in the winter months until 8:30am
and again in the early afternoon between 3:30 and 4:00pm solar time. This
is a panoramic shade graph taken with the Wiley Asset Shade Tool. (Photo
Credit – Energy Sense Finance)
4.5 DESIGN, PERMITTING & INSTALLATION
The proper design, legal permitting, code compliant
installation, and commissioning of a PV system by a properly
trained, licensed and certified contractor and a final
inspection by a local electrical inspector all play a key role in
the long term success of the PV system and can have an
impact on the future energy production.
Designing and installing a PV system can involve varying
degrees of complexity depending on the size, local site
limitations or other factors. However, determining if the PV
system is designed or installed correctly is beyond the intent
of this article.
A study commissioned by NYSERDA (McRae et al., 2008)
found that, “The initial program PV installations of NABCEP-
certified installers had fewer problems than those of non-
certified installers.”
Legal permitting and the inspection of PV systems is usually
required and performed by the local municipality or Authority
Having Jurisdiction (AHJ). It is important to verify that a
permit has been issued and also that a final inspection has
been passed before attempting to assign a value to an
existing PV installation.
If a completed PV system is encountered that has not been
properly permitted (if required by the AHJ) or was permitted
but the final inspection has not been passed, the value may
be suspect and/or difficult to determine - similar to any other
unpermitted or unfinished major construction improvement
project.
4.6 CALCULATING FUTURE ENERGY PRODUCTION
Although there are many reasons that one may choose for
installing PV, the primary reason that most PV systems are
installed is for the current value of the future solar energy
kWh production.
That production can be accurately estimated using an
equation that takes into account:
1) The average hourly solar radiation received at a
specific location which is based on up to 30 years of
measured data.

September 1, 2012 PV VALUE® USER MANUAL V. 1.1
6
2) The hourly measured temperature for the same
location.
3) The tilt and orientation factor (TOF) with respect to
optimal.
4) Shading factor expressed as a fraction of total solar
resource, ie. 95% would be shown as 0.95.
5) And normal losses experienced in the conversion of
DC to AC which are expressed as a derate factor.
There is a web based program called PVWatts™ that can
estimate the future solar energy production using a similar
analysis model. The algorithm was initially developed by
Sandia National Laboratories as PVFORM (Menicucci, 1985)
and is now maintained by the National Renewable Energy
Laboratory (NREL) and available online in two different
versions:
Version 1 provides data from major cities throughout the U.S.
to calculate the estimated energy production.1 Simply select
the closest city to the location of the solar PV system. For
example, In Punta Gorda, FL the closest city available would
be Tampa.
Version 2 flex viewer uses satellite radiation data, and
provides solar radiation estimates down to individual 40 by
40 kilometer cells.2 Simply enter the zip code that the solar
electric system is located in and click “go,” then click on
“Send to PVWatts™” and it will pass the solar radiation data
into the PVWatts™ calculator for determining the first year
energy production. This version improves accuracy compared
to Version 1 due to its ability to provide data which is
measured closer to location of the array.
A third version of PVWatts™ is available within NREL’s System
Advisor Model (SAM) and is used in the valuation model
spreadsheet. The main difference in this version is the use of
the Perez et al. (2002) 10 kilometer satellite data, which can
be accessed from NREL’s Solar Power Prospector.3 In order to
call PVWatts™ within a spreadsheet, NREL’s Developer
Network web service is used to pass input values from the
spreadsheet and return outputs such as first year energy
production and electricity rates. Currently, PV Value® only
1 http://rredc.nrel.gov/solar/calculators/PVWATTS/version1/
2 http://www.nrel.gov/rredc/pvwatts/version2.html
3 http://maps.nrel.gov/node/10/
uses PVWatts™ with the 10 kilometer satellite data through
the web service.
The results from PVWatts™ are considered for the purposes
of this valuation tool a fairly accurate estimate for crystalline
silicon modules, which currently make up the majority of
installed residential and commercial solar electric systems.
For systems using thin film modules, which have a different
temperature coefficient factor, a calculation would need to
be made to account for the difference between the standard
temperature coefficient used in PVWatts™ of -0.05%/C° and
the lower temperature coefficient of the specific thin film
module. If the thin film modules are flush mounted, then a
separate calculation for increased module temperatures
would also need to be made. Currently, there is no standard
way to do this with the version of PVWatts™ accessed
through PV Value®.
Net metering is worth mentioning though it is not included in
the valuation tool. If the utility offers net metering and the
customer has a signed net metering agreement in place, then
any excess energy which is produced but not used at the time
can be distributed to the utility for later use. When
production is lower than the customer’s usage or non-
existent, such as at night, the excess energy previously
distributed to the utility is used first and credit is given on a
kWh per kWh basis.
4.7 MODULE DEGRADATION
It is well known within the solar industry that modules
degrade with age starting from the first day of production.
Although improvements have been made in the
manufacturing process over the years, recent research by
NREL (Jordan and Kurtz, 2011; Osterwald et al., 2006)
demonstrate that the energy output of higher quality
crystalline silicon modules degrade at rates of 0.1% to 0.9%
per year, and currently for some thin film modules the rate of
yearly degradation can be 1% or more.
Although this may not have a large effect on the first year of
energy production, when calculated over the module
warranty timeframe the cumulative effect of module
degradation on lifetime energy production will be significant
and needs to be factored into the valuation model.

September 1, 2012 PV VALUE® USER MANUAL V. 1.1
7
Until more research data is available which justifies a lower
annual degradation rate, a conservative valuation may factor
in an annual degradation rate of 0.5% (Osterwald et al., 2006)
for crystalline silicon and 1% for thin film modules. The
calculation is cumulative so that for a crystalline silicon
module during year 10, the module could be expected to
produce at 95% of its rated capacity. This is one area that a
certified PV installer can assist the appraiser through a review
of the system’s condition at the time of appraisal compared
with data provided from the original commissioning report.
4.8 UTILITY RATE ESCALATION PERCENT
In most areas of the country the retail rate charged by the
local utility has been increasing steadily over much of the
past decade. The rate of escalation in any location in the U.S.
can be determined by obtaining at least the 20 year history
from the Energy Information Agency’s (EIA) “Average Price by
State Provider, 1990-2010” and “Average Retail Price of
Electricity to Ultimate Customers by End-Use Sector, by State
– Table 5.6.B.”4 The history file lists the yearly residential,
commercial and Industrial rates for each state in nominal
terms.
YEAR Residential Commercial 1990 7.77 6.66
1991 7.91 6.77
1992 7.75 6.58
1993 7.99 6.69
1994 7.78 6.35
1995 7.82 6.39
1996 7.99 6.63
1997 8.08 6.62
1998 7.89 6.38
1999 7.73 6.22
2000 7.77 6.25
2001 8.59 7.08
2002 8.16 6.64
2003 8.55 7.13
2004 8.99 7.61
2005 9.62 8.16
2006 11.33 9.91
2007 11.22 9.75
2008 11.65 10.14
4 http://www.eia.doe.gov/cneaf/electricity/epa/average_price_state.xls
http://www.eia.gov/electricity/monthly/excel/epmxlfile5_6_b.xls
2009 12.30 10.86
2010 11.52 9.80
Average retail rates of electricity for FL from the EIA website shown in
¢/kWh. Rates shown are through 2010.
Timeframe Residential Commercial
20 YR CAGR 10 YR CAGR 5 YR CAGR
1.99% 4.01% 3.67%
1.95% 4.60% 3.73%
20, 10 & 5 year compound annual growth rate (CAGR) or escalation rate of
retail rates in FL, calculated from the EIA website data.
As shown in the previous table, electric utility rates for this
location in Florida have risen more over the past 5 to 10
years, and knowing that the percent of rate escalation will
have a measurable impact on the present value of the future
energy production (since we are performing a valuation
based on 20, 25 or 30 years of future energy production) it is
generally not an acceptable practice to take the shorter term
averages and extrapolate out for the long term for newer PV
systems For an older PV system, version 1.1 has been
changed to allow for an escalation rate calculation that
matches the remaining PV module warranty lifetime.
In the valuation tool, the 1990 state average electricity rate
and the most recent electricity rate as reported by the EIA are
used in determining the Compound Annual Growth Rate
(CAGR). For example, the escalation rate for a valuation
performed now would use the time period of 1990 to 2011
(21 years) along with the CAGR equation as shown below.
Version 1.1 of the tool has been modified so the CAGR
calculation matches the remaining PV module warranty
lifetime. For example, if the PV system being appraised today
has 5 years of remaining warranty lifetime, the escalation
rate is calculated between 2011 (the most recent EIA data
from the time of this publication) and 2006.
4.9 DISCOUNT RATE
The discount rate chosen will have an impact on the present
value calculation and is based on the PV system purchasers
WACC. The WACC for appraising a residential property can
be calculated by using the Fannie Mae or Freddie Mac 15 or

September 1, 2012 PV VALUE® USER MANUAL V. 1.1
8
30 year fixed rate 60 day commitment and the purchaser’s
basic investment rate of return during the estimated life of
the project. This is to compensate for risk associated with
owning the PV system, and is expressed as a basis point
spread which is added to the debt interest rate. A custom
discount rate can be entered for systems that are not tied to
the Fannie Mae or Freddie Mac rates. For appraising
commercial PV systems, the custom option is the only option
available.
An important note about other instruments: Treasury yields
are currently AAA rated by some rating agencies and assume
no risk other than a rare catastrophic event. They are not
used in this example to calculate a discount rate assumption
on PV projects as they do not accurately reflect an available
borrowing rate which is accessible to the PV system
purchaser.
Risk spreads should be utilized in a way that accurately takes
into account an acceptable investment rate of return along
with adequate compensation for unforeseen risks associated
with an investment in a PV system. Unforeseen risks can
include accidental module breakage, windstorm damage,
corrosion of or damage to electrical components requiring
replacement, roof replacement requiring the PV system
owner pay for removal and reinstallation of a roof mounted
PV system. A range of 50 to 200 basis points is the default
setting for this valuation tool to compensate for risk, with the
average being 125 basis points. Once more data becomes
available a detailed analysis will be performed to improve on
this range.
4.10 OPERATION & MAINTENANCE EXPENSES
PV systems require periodic maintenance that ranges from
washing the dirt off of the modules during periods of minimal
rain, to replacing the inverter if it fails after the warranty has
expired. Although modern crystalline silicon modules have a
standard 20, 25 or 30 year power warranties and sufficient
data exists indicating continued performance over that
timeframe, grid-tied inverters usually only have a 10 or 15
year warranty (though some are now offered at 25 years) and
the potential for replacing the inverter after the warranty
term has ended must be accounted for. Although the
inverter rarely fails the day after the warranty expires, and
some inverter models based on existing designs have data
showing they can last up to 20+ years if installed and
maintained properly, using a 15 year replacement cycle for
the inverter and including labor charges in the cost can also
be used to conservatively estimate the operation and
maintenance expenses for residential and small commercial
systems.
Note: some inverters with promising new designs have been
introduced in recent years with warranty terms of 20 or even
25 years. It is currently unknown due to lack of manufacturer
and inverter operating history if the inverter will last for the
longer warranty period or if the manufacturers will still be in
business to cover the longer warranty in the event of a failure
during the warranty timeframe. Until more data becomes
available a conservative approach entails taking the existing
data with a 15 year timeframe for the replacement cycle on
these newer inverters with a 20 or 25 year warranty.
O&M expenses are usually figured on a cost per watt basis,
with small PV systems (under 5kW) and PV systems with
micro-inverters or DC optimizers having a higher O&M cost
per watt than a medium sized residential or commercial PV
system. Commercial PV systems larger than 100kW that
utilize central inverters can have an even lower replacement
cost per watt.
System Size In kW
15 year O&M cost per watt
< 5kW and Microinverter 75¢+ 5 kW to 25 kW 55¢ 25 kW to 100kW 50¢ >100 kW 35¢
Estimated O&M expenses for small to medium size systems based on
current 2011 inverter and labor cost data from solar electric projects in FL.
O&M expenses are figured using a present value calculation
on a 15 year replacement cycle in year 16, so that the O&M
expense in year 16 on a 10kW system would be $5,500.00 for
the replacement cycle, before the present value calculation is
performed. Since the cost is incurred later and will be paid
for with inflated dollars, the future O&M expenses may be
discounted using the chosen discount rate.
The model is built to use the range of O&M costs expressed in
cents per watt in the above table. If the user has other
information on these costs, there is an option to override the
default values.

September 1, 2012 PV VALUE® USER MANUAL V. 1.1
9
Note: Current estimates for O&M expenses are expected to
drop in the next few years as the Department of Energy’s
SunShot goals are met, with a goal of reducing the installed
cost of solar energy systems by about 75%.
4.11 SALVAGE VALUE
The value of the components at the end of 20, 25 or 30 years
(the standard module warranty period) is similar to other
rapidly advancing technologies which have reached the end
of their warranty period, and although the PV system may
continue to produce energy at a reduced rate for 40+ years (a
bonus for the system owner at that time), electrical codes,
efficiencies and manufacturing practices will have changed
over the years. These factors combined with an expired
warranty could render the technology obsolete. Currently
there is no existing, reliable secondary market in place that
can assign a value to mass produced 25+ year old modules
and inverters. In its absence, a scrap value of the
components (metals) could be used. Since a present value
calculation over20, 25 or 30 years must also be used against
the scrap value, the end result adds very little to the
valuation and therefore is not included in the model.
4.12 VALUATION MODEL FOR THE INCOME APPROACH
(© 2010 Energy Sense Finance LLC) The method of valuation for the income approach uses the
present value of the future energy production from
PVWatts™. This is accomplished using the following formula
for each year over the remaining life of the project:
& 16
EkWh – Annual Energy Output (kWh) Degrate – Module Degradation rate (%) Urate – Current Utility Rate (¢/kWh) UEscrate – Utility Escalation Rate (%) Discrate – Discount Rate (%) O&Myr16 – O&M Expenses for year 16 (¢)
The degradation rate is calculated starting in the first year,
the utility rate escalation % and the discount rate are
calculated starting in the first month of year 2, and the O&M
expenses are calculated for year 16 only. If the appraisal is
made in year 15 and beyond, an option comes up asking the
user whether the inverter has been replaced. If it has been
replaced before the 15-year warranty period, the appraisal
range of value estimate will be higher. If it has not been
replaced within the 15-year warranty period, the O&M
amount will then be discounted for the remaining warranty
lifetime of the panels, which will result in a lower appraisal
range of value estimate.
For example, if the solar electric system is 3 years old and the
module warranty is for 25 years, the present value of the
future energy production would be calculated for years 4
through year 25 to determine the total remaining value of
future energy production, remembering to account for the
first 3 years of module degradation in the calculation. If a
recent custom derate factor is available which accounts for
actual module degradation up to the current time frame,
then in this example the first 3 years of module degradation
would not need to be factored in.
5. EXCEL® SPREADSHEET INSTRUCTIONS
PV Value® – Photovoltaic Energy Valuation Tool v. 1.1
An Excel® spreadsheet has been created to perform the
calculations used in the valuation model. Version 1.1 has the
ability to be used in both Excel® 2011 for Mac and Excel®
2007 and 2010 for Windows. No other spreadsheet programs
or earlier versions of excel have been tested and therefore
may not allow the spreadsheet to open or work property. A
link for downloading the spreadsheet is provided in the
resources section.
Note: due to the rounding of values in the spreadsheet, if you
are checking the end result with a financial calculator you
may experience a difference of a few cents per year.
You must have macros enabled, data connections allowed
and internet access in order for the spreadsheet to function
properly. User input cells are yellow, calculated value cells
are green and user defined cells used to override calculated
data are orange.
5.1 ANALYSIS TAB
Introduced in version 1.1 is the ability to state what type of
PV system is being appraised, either residential or

September 1, 2012 PV VALUE® USER MANUAL V. 1.1
10
commercial. Making this choice will give the user the ability
to select what type of residential or commercial property is
being appraised (only for record-keeping) and certain
features will change to ensure the proper inputs are available
and used in the estimate of value.
Selecting Residential allows the user to choose between the
FNM 15- and 30-year 60-day commitment rates and a custom
rate. The utility rate and escalation rate default to the
residential calculations, which the user can override with a
custom rate option.
Selecting Commercial gives the user only a custom rate
option. The utility rate and escalation rate default to the
commercial calculations, which the user can override with a
custom rate option.
The choice between ‘residential’ and ‘commercial’ also
impacts what can be seen for the net present value (NPV)
calculation, which is described in more detail below.
Starting out with the solar resource calculation, you will see
seven user input cells that will need to be defined in order to
calculate the number of kWh’s produced per year. The inputs
are as follows:
Zip code – Where the PV system is located.
System size in watts – This is calculated at STC. A 5.06kW
array would be input as 5060 watts.
Derate Factor – The model defaults to 0.77, which is the same
as the PVWatts™ standard derate. However if direct shading
is observed or if the value is critical, then it is recommended
that a custom derate factor with a digital shading analysis be
performed by a certified PV installer who is properly licensed.
There is a space in the spreadsheet that allows entry of a
Commissioning Report number, which will change the derate
factor to a user input override cell. Entering this number into
the spreadsheet verifies that a certified PV installer inspected
the system to provide a custom derate factor.
Module degradation rate – This is defaulted to 0.5 and
reflects a 0.5% annual degradation rate more common for
crystalline systems. For thin-film PV, see the above section
on appropriate degradation rates.
Array type – The choices are: fixed, 1-axis or 2-axis. Most PV
installations are fixed and will not track the sun. If a tracker is
encountered then the number of axis will need to be
selected. 1-axis is typically east to west with the tilt angle
fixed. 2-axis tracks east to west and also changes the tilt
angle to where the direct component of the solar irradiance is
perpendicular to the array at all times.
Array tilt – if left unchecked this will be calculated as the local
latitude. The default setting is to have the box checked,
however the user must check the box and input the actual
module tilt to get an accurate calculation if the module tilt is
known. If the module is mounted flat with no tilt, check the
box and make sure the array tilt is set to 0.0.
Array azimuth – this is defaulted to 180° or true south. Input
the azimuth angle that the array faces. In some cases, the
module will be a few degrees off of south so knowing the
azimuth angle is important.
Click outside of the yellow cells and then on the button “Click
to Calculate PV Production.” This will call PVWatts™ using the
Perez (2002) model through the SAM interface as available at
developer.nrel.gov You should now see kWh Produced/Year
for the PV system.
NOTE: If any of these parameters are changed, don’t forget to
click the”Click to Calculate PV Production” button to ensure
the energy production estimate is correct.
Discount rate – For residential properties, the discount rate
calculation allows for either the current 15- or 30-year fixed
rate 60-day commitment from Fannie Mae as the WACC
along with a basis point calculation that accounts for an
investment rate of return for the risk that is assumed through
purchasing the income stream. If the magenta cell states
“rate is out of date” click on “update FNM rate” and the
discount rate will be automatically updated. The rates are
not updated by Fannie Mae on the weekends and so an
estimate on Saturday or Sunday will reflect the rate posted
on the previous Friday. A custom rate option is also available
for residential properties.
For estimating value for a commercial property, the FNM
rates are hidden and only a custom option is available.

September 1, 2012 PV VALUE® USER MANUAL V. 1.1
11
Utility rates – Under remaining inputs, the electricity rate
data needs to be accounted for. This is done automatically by
selecting either the residential or commercial averages as
reported within PVWatts™ and clicking on the “Current Utility
Reported Electricity Rate.” The current utility rate in ¢/kWh
for the state the PV system is located in will be updated. The
residential and commercial utility escalation rates can also be
selected, and are calculated using the CAGR equation. As
there are over 3200 electric utilities nationwide and rates
vary within each state, there is a user defined inputs option
for ¢/kWh and utility escalation rates that will override the
PVWatts™ and EIA specific data if the rate is not current. If a
user defined utility escalation rate is used, it is important to
make that calculation as a CAGR before using as input to the
model and not as an average annual growth rate. It is
recommended to use the default escalation rate calculation.
A source of information that can be used to determine
current average utility rates is OpenEI.
O&M expenses – The O&M expenses are automatically
calculated based on the PV system size in watts using inverter
& labor pricing data. If a different value is anticipated, then a
user defined input is available. Select the checkbox and input
the new value in whole cents per watt (¢/W) and this will
override the automatic calculation.
Added in version 1.1 is an option for a 20 year module
warranty. Most module warranty terms will be for 25 years.
However there are some manufacturers that offer 20 or 30
year terms. Select the term of the module warranty from the
drop down box and input the PV system age in years.
If the age of the system is 15 years or greater, there is an
option to select if the inverter has been replaced. If it has
not been replaced then the eventual inverter replacement
expense must be accounted for in the calculation.
Lease to purchase – There is an option to look at a Lease to
Purchase, where the value can be calculated for the
remaining energy in years after the lease is bought out, based
on the module warranty period. This option does not
currently account for the purchase price of the PV system. It
is anticipated that a future version will have a more robust
calculation for this scenario.
After all of the user defined data cells have been input
correctly the present value of the expected lifetime energy
production will be calculated as the “Appraisal Range of Value
Estimate.”
Average Net Present Value (Version 1.1)
On line 58, there is now an option to calculate the average
net present value (NPV) for residential and commercial
systems.
The NPV is the sum of all positive and negative cash flows
which are discounted to the present value.
For the netting effect the negative initial cash flow is based
on the prospective PV system purchaser’s true cost once all
tax credits, treasury grant, rebates, depreciation, bonus
depreciation, taxes on rebate and loss of utility energy bill tax
deductions (for commercial businesses) are factored in.
In order to calculate the initial cost, a basic understanding of
Internal Revenue Code sections 25D, 48, and other sections
that directly relate is necessary. Excerpts from the Internal
Revenue Code as related to solar are presented in the
appendix.
When the Residential radio button is selected, the user will
see three boxes, the first having inputs for showing both the
gross cost of the system and any applied rebates before
determining the net cost using the current 30% investment
tax credit. There are two methods shown for determining the
average NPV, where essentially either state or federal income
taxes are either paid or not paid on the rebate amount. If
there is no rebate available, then the net cost will be the
same. See excerpts from the Internal Revenue Code section
136 in the Appendix for more detail on IRS treatment of
subsidies.
When the commercial radio button is selected, the user will
see the input for showing both the gross cost of the system
and any applied rebates as well as two other boxes that are
not in the residential analysis area. These include the MARCS
Half Year depreciation schedule; Also, there is a calculation of
the average NPV based on the system cost inputs, tax rates,
energy deduction loss and a DCF analysis of the depreciation
schedule. The Energy Deduction Loss is based on IRC section
162(a) which allows a business to deduct the electricity

September 1, 2012 PV VALUE® USER MANUAL V. 1.1
12
expense as a write off, though if they are generating that
energy instead of purchasing it from the utility, the
corresponding amount can no longer be treated as a write
off.
About the Authors:
Jamie L. Johnson is the Managing Member of Energy Sense
Finance, LLC. He holds both NABCEP Certifications for Solar
PV Installation Professional™ and PV Technical Sales
Professional™. Mr. Johnson has over 15 years of experience
in the financial services sector beginning his career with the
IRS, and then spending over a decade working in the
mortgage banking and asset management industries.
Geoffrey T. Klise is a staff member at Sandia National
Laboratories in the Earth Systems Analysis Department. His
research area involves providing system level analysis
techniques to manage technical and policy related issues in
solar energy technologies, biofuels, climate change and
energy-water interactions.
5.2 RESOURCES & REFERENCES
Dunlop J. (2007) Photovoltaic Systems. American Technical Publishers, Inc. www.jimdunlopsolar.com EIA Average Retail Price of Electricity to Ultimate Customers by End-Use Sector, by State, Year-to-Date. http://www.eia.doe.gov/cneaf/electricity/epa/average_price_state.xls EIA Average Price by State by Provider, 1990-2010 http://www.eia.gov/electricity/monthly/excel/epmxlfile5_6_b.xls Fannie Mae 15 year fixed rate 60 day commitment https://www.fanniemae.com/content/datagrid/hist_net_yields/cur15.html Fannie Mae 30 year fixed rate 60 day commitment https://www.fanniemae.com/content/datagrid/hist_net_yields/cur30.html Green MLS Tool Kit - http://greenthemls.org/index.cfm Internal Revenue Service (IRS) Website - www.irs.gov Internal Revenue Code Website http://www.law.cornell.edu/uscode/usc_sup_01_26.html Jordan D.C. and S.R. Kurtz (2011) Photovoltaic Degradation Rates – an Analytical Review. Prog. Photovolt: Res. Appl. DOI: 10.1002/pip.1182. McRae, M., D. Moran, J.S. Peters, C. Nemore, P. Gonzales and A Ferranti (2008) PV Workforce Development and the Market for Customer-Sited PV. Presented at ASES Solar 2008. San Diego, CA, May 3-8, 2008. Menicucci, D.F. (1985) PVFORM – A New Approach to Photovoltaic System Performance Modeling, 18th IEEE PVSC, Las Vegas, NV, October 21-25, 1985. North American Board of Certified Energy Practitioners (NABCEP)
www.nabcep.org NREL’s Renewable Energy Project Finance Tracking Initiative (REFTI) by Michael Mendelsohn SFA. https://financere.nrel.gov/finance/REFTI NREL Solar Prospector - http://maps.nrel.gov/node/10/ OpenEI Utilities Gateway - http://en.openei.org/wiki/Gateway:Utilities Osterwald C.R., J. Adelstein, J.A. del Cueto, B. Kroposki, D. Trudell and T. Moriarty (2006) Comparison of Degradation Rates of Individual Modules Held at Maximum Power. Report number NREL/PR-520-39844. Presented at the 2006 IEEE 4th World Conference on Photovoltaic Energy Conversion, May 7-12, Waikoloa, HI. Perez, R., P Ineichen, K. Moore, M Kmiecik, C Chain, R. George and F. Vignola (2002) A new operational model for satellite-derived irradiances: description and validation. Solar Energy, 73:307-317. PV Value® – Photovoltaic Energy Valuation Model v. 1.1 http://pv.sandia.gov/pvvalue http://pvvalue.com PVWatts™ Version 1 http://rredc.nrel.gov/solar/calculators/PVWATTS/version1 PVWatts™ Version 2 http://mapserve3.nrel.gov/PVWatts_Viewer/index.html Solmetric Suneye™ 210 Users Guide 2010 by Solmetric Corporation www.solmetric.com Tilt & Orientation Factor Graph by Solmetric Corporation http://www.solmetric.com/annualinsolation-us.html Underwriters Laboratory UL University - www.uluniversity.us Wiley ASSET Shade Tool - www.we-llc.com Wikipedia – Financial references - www.wikipedia.org

September 1, 2012 PV VALUE® USER MANUAL V. 1.1
13
APPENDIX

September 1, 2012 PV VALUE® USER MANUAL V. 1.1
14
OTHER FINANCIAL ANALYSIS METHODS USED FOR SOLAR PV

September 1, 2012 PV VALUE® USER MANUAL V. 1.1
15
INTERNAL RATE OF RETURN
An internal rate of return (IRR) calculation is related to the NPV calculation where the NPV equals zero and the discount rate at that
point becomes the IRR. In general it is assumed that when comparing projects of equal duration and risk the project with the
highest IRR should be chosen.
Caution should be used with comparing a PV project to other investment opportunities based solely on the IRR as a project with a
large initial negative cash flow in the first year may produce a lower IRR compared to a project with a small initial negative cash flow.
However, the project with the large initial negative cash flow may have a higher NPV upon reaching the end of its life cycle, and
therefore a higher return in the number of dollars on capital invested.
There are issues associated with using IRR with a PV project. IRR assumes that the positive cash flow will be reinvested immediately
at the IRR. This is often not the case since there is rarely another project with a comparable IRR waiting to be started on a monthly
or annual basis.
Another issue is that with multiple negative cash flows during a project life such as with an inverter replacement cost during year 16,
the IRR may return multiple values based on the negative and positive cash flows.
Due to this a modified internal rate of return might be a better approach for PV projects.
If a high IRR is the sole reason for choosing to invest in a PV project compared to investment vehicles with a low rate of return such
as a certificate of deposit, then another look at the other financial analysis methods mentioned here may be warranted.
MODIFIED INTERNAL RATE OF RETURN
The modified internal rate of return (MIRR) is just that, a modified version of the IRR which resolves two of the issues mentioned
previously regarding the IRR as it relates to PV projects. The first assumption is the potential for multiple rates of return due to
multiple positive and negative cash flows, and second is the assumption that all positive cash flows will be reinvested at the stated
IRR.
For example, in the case of a business that has a PV system installed with net metering, the positive cash flows may be in the form of
a lowered utility bill which frees up cash flow to invest within the business. Rarely is the cash flow reinvested at the same rate of
return as the IRR and in some cases the cash flow may simply be paid out to the business owner as a return of capital and reinvested
in low risk, low rate of return investments.
In the modified version it is assumed that positive cash flows will be reinvested at a chosen fixed rate of return which is less than the
MIRR, and negative cash flows are discounted to present value using the WACC, thereby producing a single rate of return which may
more closely resemble purchaser’s financial situation.
SIMPLE PAYBACK
The simple payback (SPB) is often used within the PV sales industry to calculate the time it takes for the purchaser of a PV system to
recoup their original investment. This method of analysis has limitations that must be understood before being relied upon.
Simple payback is just that, it does not include a discounted cash flow model, nor does not take into account risk, lost opportunity
costs, O&M expenses, or module degradation. The assumed electricity cost per kWh is fixed during the payback period.

September 1, 2012 PV VALUE® USER MANUAL V. 1.1
16
It is simply the initial upfront non-discounted net cost of the PV project divided by the annual fixed non-discounted cash flow
(annual kWh times the fixed utility rate). The end result is displayed in years or fractional years.
Caution is warranted when using only a simple payback analysis on a PV project as the PV system owners actual payback in years will
often take longer once all of the other financial considerations are taken into account.
MODIFIED PAYBACK
A case can be made for a modified payback analysis which would allow a prospective PV system purchaser to determine when they
would recoup their original investment.
This modified payback or MPB would take into account many of the financial considerations that are excluded from the SPB model.
The MPB is fairly easy to calculate from the present value and NPV analysis results, it is the time in years it takes for the negative
cash flow (as determined in the NPV and PV calculations) to be equaled by the present value of the positive cash flow.
This may produce multiple payback timeframes, since the initial investment may be recouped before the inverter is scheduled to be
replaced. If this is the case, once the inverter is replaced a new investment cycle is started with a new payback timeframe
determined. If the initial investment is not recouped before the inverter is replaced, then a single payback timeframe would be
produced.
The MPB timeframe will often be considerably longer than the SPB timeframe. However, it should be a more accurate presentation
of the prospective PV system purchaser’s recoupment of their actual investment.
Prospective PV system purchasers may find that the cost to replace an old technology inverter near the end of the PV systems life
cycle in a small number of cases may not make sense, and in fact it may make more sense financially to upgrade the entire PV
system at that time using current technology as it is likely that efficiencies will have improved, costs will have come down and life
cycle timeframes will most likely have been extended.
RETURN ON INVESTMENT
Return on investment or ROI is a return calculated in percentage terms on the total investment. It can be calculated over a single
annual period or annualized over multiple years.
Sometimes it is also used in a more unconventional sense to show the total return over an investment timeframe. This
unconventional use can be somewhat meaningless to an investor. For example if the total ROI is 50% that may sound like a great
investment. However, if that total return is over a 30 year timeframe and has not been annualized, then that may not be considered
by some as a great ROI.
ROI calculations are difficult to perform accurately when multiple positive or negative cash flows are involved during an annual time
period. In the scenario where multiple positive or negative cash flows are involved then the MIRR may be more appropriate.
FINANCIAL MODEL SUMMARY
Some things simply can’t be quantified into a financial model, such as when a business owner chooses to install a PV system so they
can advertise that they are a green business and most or all of their electricity needs are met with PV, or when a homeowner installs
a PV system in order to be the first home on their street to generate electricity from the sun.

September 1, 2012 PV VALUE® USER MANUAL V. 1.1
17
There are other considerations such as what happens if the utility rates go up faster than the long term growth rates. If this happens
then several of the financial models presented may underestimate the value or financial return to the PV system owner.
No financial model is perfect, and each model presented here does contain flaws. However when presented together, a more
accurate picture will emerge and allow a prospective PV system purchaser to make better informed decisions.

September 1, 2012 PV VALUE® USER MANUAL V. 1.1
18
INTERNAL REVENUE CODE SECTIONS RELATING TO SOLAR
September 1, 2012 PV VALUE® USER MANUAL V. 1.1
19
Brief excerpts of the IRS notice(s) or IRC sections are shown, although readers are encouraged to visit the IRS website and read each
section thoroughly in order to determine how each section applies to their individual situation.
“The following is not to be construed as tax advice, readers are advised to consult with their own legal and tax professionals”
NOTE: As of January 2012, the IRS has not issued official guidance for several of the IRC sections mentioned below.
RESIDENTIAL SECTIONS
Section 25D (from IRS Notice 2009-41) http://www.irs.gov/irb/2009-19_IRB/ar08.html
Section 25D provides a tax credit to individuals for residential energy efficient property. The amount of a taxpayer’s section 25D credit for a taxable year beginning after December 31, 2008, is equal to 30 percent of the qualified solar electric property expenditures made by the taxpayer during the taxable year. Qualified solar electric property expenditures are further defined as expenditures for property which uses solar energy to generate electricity for use in a qualifying dwelling unit. A qualifying dwelling unit is defined as a dwelling unit that is located in the United States and is used as a residence by the taxpayer. The notice further states that a taxpayer claiming a credit with respect to an expenditure, is responsible for determining whether the expenditure appropriately relates to a qualifying dwelling unit and cannot rely on a manufacturer’s certification for that purpose. Section 136 Energy Conservation Subsidies Provided by a Public Utility
Gross income shall not include the value of any subsidy provided (directly or indirectly) by a public utility to a customer for the
purchase or installation of any energy conservation measure.
Notwithstanding any other provision of this subtitle, no deduction or credit shall be allowed for, or by reason of, any expenditure to the extent of the amount excluded under subsection (a) for any subsidy which was provided with respect to such expenditure. The adjusted basis of any property shall be reduced by the amount excluded under subsection (a) which was provided with respect to such property. Energy conservation measure - In general for purposes of this section, the term “energy conservation measure” means any installation or modification primarily designed to reduce consumption of electricity or natural gas or to improve the management of energy demand with respect to a dwelling unit. The term “dwelling unit” has the meaning given such term by section 280A(f)(1). The term “public utility” means a person engaged in the sale of electricity or natural gas to residential, commercial, or industrial customers for use by such customers. For purposes of the preceding sentence, the term “person” includes the Federal Government, a State or local government or any political subdivision thereof, or any instrumentality of any of the foregoing. Exception: This section shall not apply to any payment to or from a qualified cogeneration facility or qualifying small power production facility pursuant to section 210 of the Public Utility Regulatory Policy Act of 1978. See IRS PLR2010350003 for more clarity. Note: Private letter rulings only apply to the taxpayer that requested the ruling and are not to be applied to or relied on by other taxpayers. Section 280A(d)(1) Use as residence defined In general for purposes of this section, a taxpayer uses a dwelling unit during the taxable year as a residence if he uses such unit (or portion thereof) for personal purposes for a number of days which exceeds the greater of 14 days, or 10 percent of the number of days during such year for which such unit is rented at a fair rental. A unit shall not be treated as rented at a fair rental for any day for which it is used for personal purposes.

September 1, 2012 PV VALUE® USER MANUAL V. 1.1
20
Section 280A(d)(2) Personal use defined For purposes of this section, the taxpayer shall be deemed to have used a dwelling unit for personal purposes for a day if, for any part of such day, the unit is used— For personal purposes by the taxpayer or any other person who has an interest in such unit, or by any member of the family (as defined in section 267(c)(4)) of the taxpayer or such other person;
By any individual who uses the unit under an arrangement which enables the taxpayer to use some other dwelling unit (whether or not a rental is charged for the use of such other unit); or By any individual (other than an employee with respect to whose use section 119 applies), unless for such day the dwelling unit is rented for a rental which, under the facts and circumstances, is fair rental. Section 280A(f)(1) Dwelling unit defined
For purposes of this section, In general the term “dwelling unit” includes a house, apartment, condominium, mobile home, boat, or similar property, and all structures or other property appurtenant to such dwelling unit. Exception the term “dwelling unit” does not include that portion of a unit which is used exclusively as a hotel, motel, inn, or similar establishment. COMMERCIAL SECTIONS Section 48(a) Business Investment Tax Credit (Energy Credit)
The energy credit for any taxable year is the energy percentage of the basis of each energy property placed in service during such taxable year. The energy percentage is 30 percent in the case of energy property but only with respect to periods ending before January 1, 2017. The term “energy property” means any property which is equipment which uses solar energy to generate electricity. The construction, reconstruction, or erection of which is completed by the taxpayer, or which is acquired by the taxpayer if the original use of such property commences with the taxpayer, with respect to which depreciation (or amortization in lieu of depreciation) is allowable. In the case of any property with respect to which the Secretary makes a grant under section 1603 of the American Recovery and Reinvestment Tax Act of 2009. No credit shall be determined under section 45 with respect to such property for the taxable year in which such grant is made or any subsequent taxable year. Any such grant shall not be includible in the gross income of the taxpayer, but shall be taken into account in determining the basis of the property to which such grant relates, except that the basis of such property shall be reduced under section 50 (c) in the same manner as a credit allowed under subsection (a). Section 50(c)(1) and (3)(a) Reduction in basis for credits and grants. If a credit is determined under this subpart with respect to any property, the basis of such property shall be reduced by the amount of the credit so determined. Special rule - In the case of any energy credit—only 50 percent of such credit shall be taken into account. Section 168 Accelerated Cost Recovery System (5 Year Accelerated Depreciation)(100% and 50% Bonus Depreciation) Section 162(a) Trade or business expenses
In general there shall be allowed as a deduction all the ordinary and necessary expenses paid or incurred during the taxable year in carrying on any trade or business.