value chain analysis of the solar pv market in pakistan · value chain analysis of the solar pv...
TRANSCRIPT

Value Chain Analysis of the Solar PV Market in Pakistan – 1
Value Chain Analysis of the Solar PVMarket in Pakistan
Implemented by
Implemented by

2 – Value Chain Analysis of the Solar PV Market in Pakistan
Imprint
Published by
Deutsche Gesellschaft für
Internationale Zusammenarbeit (GIZ) GmbH
Registered offices
Bonn and Eschborn, Germany
GIZ Pakistan – Country Office
House 23, Street 55, F-7/4, 44000 Islamabad - Pakistan
T: +92 51 8351102, 8358913-14
F: +92 51 8351103
Email: [email protected]
Internet: www.giz.de/pakistan
Person responsible for content under §55 paragraph 2 RStV
Jörg Mayer (BSW-Solar)
Authors
Saad Malik
VARIEGATE Consult
House 11-B, Street 50, Sector F-8/4, Islamabad
T: +92 300 522 9360
Email: smalik(at)variegateconsult.com
&
Jörg Mayer
Luz Alicia Aguilar
German Solar Association – BSW-Solar / Bundesverband Solarwirtschaft e.V.
Lietzenburger Straße 53
10719 Berlin
Email: info(at)bsw-solar.de
T: +49 30 2977788-0
F: +49 30 2977788-99
www.solarwirtschaft.de
Designed by Anna Landskron
Place and date of publication
Berlin, December 2016

Value Chain Analysis of the Solar PV Market in Pakistan – 3
Contents
i Summary .......................................................................................................................................... 6
1 Introduction ...................................................................................................................................... 8
1.1 Background ....................................................................................................................................... 8
1.2 Objective ........................................................................................................................................... 8
1.3 Methodology of the Value Chain Analysis ........................................................................................ 8
1.4 Introducing Pakistan ....................................................................................................................... 10
2 Key Stakeholders for Power Sector Development in Pakistan .......................................................... 12
2.1 Government Institutions ................................................................................................................. 12
2.2 Renewable Energy Associations ...................................................................................................... 15
2.3 International Organizations ............................................................................................................ 15
2.4 Scientific/Academic Organizations .................................................................................................. 15
3 PV Sector in Pakistan ....................................................................................................................... 16
3.1 Power Sector Status in Pakistan ...................................................................................................... 16
3.2 Legal Framework for PV Development ........................................................................................... 17
3.3 PV Market Potential ........................................................................................................................ 18
3.4 Updates on Net Metering ............................................................................................................... 19
4 Results of the Value Chain Analysis ................................................................................................. 20
4.1 Proportion of Revenue from Solar Components ............................................................................. 20
4.2 Importers/Wholesalers ................................................................................................................... 20
4.3 Manufacturers/Assemblers ............................................................................................................ 21
4.4 Suppliers/Installers ......................................................................................................................... 21
4.5 Solar PV Product and Service Range in the Pakistani Market ......................................................... 21
4.6 Imported Products .......................................................................................................................... 23
4.7 Analysis of Products Fulfilling Norm and Quality Standards ........................................................... 27
4.8 Availability Analysis of High-Quality Products and Services ........................................................... 29
4.9 Potential Areas for Solar PV Products ............................................................................................. 29
4.10 Market Segments Using Different Product Qualities ...................................................................... 30
4.11 Customer Segmentation Product Preferences ................................................................................ 31
4.12 Quality Perceptions of Key PV Target Groups ................................................................................. 32
4.13 Payback Time Expectations of Each Customer Segment ................................................................. 33
5 Business Environment for German PV Businesses ............................................................................ 34
5.1 Challenges and Opportunities for German PV Businesses .............................................................. 34
5.2 Target Segments for German Products in Pakistan ......................................................................... 35
5.3 Proposed Modality for Engagement of German Products in Pakistan ............................................ 36
5.4 Business Conditions for PV Companies ........................................................................................... 36
Annexes ................................................................................................................................................ 37
Annex A ................................................................................................................................................... 37
Annex B ................................................................................................................................................... 38
Annex C ................................................................................................................................................... 45
Annex D .................................................................................................................................................. 49

4 – Value Chain Analysis of the Solar PV Market in Pakistan
Figures
Figure 1: Methodology of the value chain analysis ................................................................................... 8
Figure 2: PV Value Chain Actors ................................................................................................................. 9
Figure 3: Map of Solar Irradiation Levels in Pakistan ............................................................................... 11
Figure 4: Institutional Setup of the Power Sector in the Country............................................................ 14
Figure 5: Power Supply and Demand Scenario in Pakistan ..................................................................... 16
Figure 6: Share of Renewables in Power Sector Landscape of Pakistan .................................................. 16
Figure 7: Electricity Consumption Trend by Sector .................................................................................. 17
Figure 8: Revenue Generated From Different PV Components ............................................................... 20
Figure 9: Landscape of PV Panels in Pakistan .......................................................................................... 21
Figure 10: Landscape of Batteries for Use with PV Systems in Pakistan .................................................... 22
Figure 11: Import Trend for PV Panels in Pakistan..................................................................................... 23
Figure 12: Import Trend For Deep Cycle Batteries in Pakistan .................................................................. 24
Figure 13: Import Trend for Inverters in Pakistan ...................................................................................... 25
Figure 14: Import Trend for Charge Controllers in Pakistan ..................................................................... 26
Figure 15: Proportion of Certified Products in the Local Market............................................................... 27
Figure 16: Imported PV Brands in Pakistan .............................................................................................. 28
Figure 17: Price Versus Quality Preferences .............................................................................................. 30
Figure 18: Customer Awareness Landscape of PV Quality Products ......................................................... 31
Figure 19: Preferences of the PV Market Segments in Pakistan ................................................................ 32
Figure 20: Payback Expectations of Each Customer Segment .................................................................. 33
Figure 21: Challenges and Opportunities ................................................................................................. 34
Figure 22: Target Segments for German PV Products and Services .......................................................... 35
Value Chain Analysis of the Solar PV Market in Pakistan – 5
Acronyms
GIZ Deutsche Gesellschaft für Internationale Zusammenarbeit
REEE Renewable energy and energy efficiency
BSW-Solar Bundesverband Solarwirtschaft e.V. (German Solar Association)
MoWP Ministry of Water and Power
AEDB Alternative Energy Development Board
FBR Federal Board of Revenue
PSQCA Pakistan Standards and Quality Control Authority
NEPRA National Electric Power Regulatory Authority
NTDC National Transmission and Despatch Company Limited
DISCO Distribution company
MFI Microfinance institutions
CPPA Central Power Purchasing Agency (Guarantee) Limited
PCRET Pakistan Council for Renewable Energy Technologies
PSA Pakistan Solar Association
REAP Renewable Energy Association of Pakistan
ADB Asian Development Bank
JICA Japan International Cooperation Agency
UNDP United Nations Development Programme
USAID United States Agency for International Development
KfW Kreditanstalt für Wiederaufbau
EU European Commission
UET University of Engineering and Technology
NUST National University of Science and Technology
RE Renewable energy
PV Photovoltaic
PKR Pakistani rupee

6 – Value Chain Analysis of the Solar PV Market in Pakistan
i. Executive Summary
Pakistan is a federal parliamentary republic and the
sixth most populous country in the world, with a
present population of over 190 million.1 Recent eco-
nomic developments in the country have been posi-
tive, with a GDP growth of 4.2 percent in FY 2015
compared to 4 percent in FY 2014 and a growth of
4.5 percent forecasted for 2016.2 The country has
been facing a significant energy deficit in the past
decade with power shortfalls of approx. 5 GW3 and
load shedding across the country varying between
5 to 12 hours a day in rural areas that bear the main
brunt of the load shedding.
The Government of Pakistan (GoP) has taken a con-
siderable number of incentives in its energy strategy
to overcome the energy deficit through the promo-
tion of both large-scale grid-connected PV projects
as well as smaller-scale projects. The introduction of
the net metering scheme in September 2015 has
been an encouraging sign. Further steps are being
taken to reduce bureaucratic procedures (i.e. ‘red
tape’) n the processing of applications for issuance
of net metering licenses. The GoP has also encouraged
‘large-scale’ grid-connected PV projects through the
introduction of a feed-in tariff (FiT), increasing the
interest of investors.
Currently the PV market is dominated by Chinese
products: 95.6 percent (975.3 MW) of PV panels,
71.5 percent (1328.8 MW) of inverters and 85.1
percent (24,970 tons) of deep cycle batteries have
been imported from China into Pakistan between
October 2015 and September 2016. The dominance
of Chinese products is attributed to price competitive-
ness with similar products from other countries,
extensive customer outreach through dealership
networks and the large variation in product quality/
1 data.un.org 2 data.worldbank.org/country/Pakistan3 NEPRA et al 2015 “State of Industry Report’’4 Please see the methodology in chapter 1
pricing that caters to different economic classes of
customers.
However, sub-standard/low-quality PV products pro-
liferate in Pakistan and awareness concerning the
benefits of quality PV is lacking.
According to the survey conducted with the selected
stakeholders from the solar value chain for the de-
velopment of this analysis4, the level of customer
awareness regarding quality PV is low: The value
chain players perceive the share of ‘certified’ PV
components related to the total PV components in
the market to be only 20 percent for PV panels, 14
percent for inverters and 9 percent for batteries.
Amongst the different PV customer segments in the
Pakistan market, the residential sector remains the
most price-sensitive, although a niche market does
exist for high-quality products, particularly batteries
and inverters. The industrial sector claims to prefer
European products, since they are bankable and
more reliable. However, currently they are mostly
purchasing Chinese products (PV panels and inver-
ters) due to the higher costs of European products
and the limited offer of after-sales services in com-
parison to Chinese products.
Grid-tied systems, particularly ‘inverters’, are expec-
ted to remain the prime market segment for German
PV companies targeting the Pakistani market for use
in medium-scale (100 kW-1 MW) and large-scale
(>1 MW) grid-connected projects which are usually
set up by the industrial and commercial sectors.
How ever, price competitiveness with comparable
products from other countries will be critical. Batte-
ries as backup systems (AGM) for the residential sector,

Value Chain Analysis of the Solar PV Market in Pakistan – 7
for off-grid systems and for the commercial sector
also hold considerable potential, with price competi-
tiveness being the main aspect to be focused on by
European manufacturers. There is also potential for
European PV testing and monitoring equipment such
as battery testers, PV panel testers, etc.
In terms of provision of services, there is consider-
able potential for technical consulting services such
as conducting techno-economic feasibility studies,
maintenance and operation of medium and large-
scale projects, monitoring of installed projects, etc.
European EPC companies interested in developing
commercial sector (kW scale) and large-scale (over
1 MW) grid-connected projects in the country, also
have a large market potential, since there are not
many EPC services available.
Payback expectations from the different customer
segments vary between 3.5 to 5 years. The commer-
cial sector expects the shortest payback period with
3.5 years, followed by the industrial sector with 4.5
years.
The GoP will soon implement ‘import quality stan-
dards for PV equipment’ and will curb the import of
uncertified and sub-standard equipment into the
country. Once these standards have been implemen-
ted, there will be greater standardization, both in
terms of pricing and quality of products available in
the market. This will encourage leading solar compa-
nies to increase their participation in Pakistan’s
emerging solar market.
In order to increase the ‘access to finance’ for PV, the
GoP has also taken steps with the State Bank of
Pakistan, announcing the ‘Financing scheme for
5 http://www.sbp.org.pk/smefd/circulars/2016/C3.htm
renewable energy’ in June 2016, with loans being
offered at 6 percent interest rate for PV projects up
to 50 MW.5
Pakistan has a huge PV potential and all the neces-
sary conditions for its implementation: high radiation
yield, a regulatory framework and financing instru-
ments that support its development. However, the
level of awareness of quality of PV is very low and
customers are still not aware of the benefits of
high-quality products. The implementation and dis-
semination of quality standards for PV are expected
to lead to a reduction of price sensitivity and increase
the procurement of high-quality PV products.

8 – Value Chain Analysis of the Solar PV Market in Pakistan
1 Introduction
1.1 Background The Deutsche Gesellschaft für Internationale Zusam-
menarbeit (GIZ) GmbH’s Renewable Energy & Energy
Efficiency (RE-EE) project in Pakistan was initiated in
2005, with a focus on promoting renewable energy
(RE) and industrial energy efficiency (EE). The main
counterpart to the project on behalf of the Govern-
ment of Pakistan is the Alternative Energy Develop-
ment Board (AEDB), Ministry of Water and Power
(MoWP).
On December 17, 2015, under the framework agree-
ment of the Pakistan-Germany Renewable Energy
Forum (PGREF), the German Solar Association
(BSW-Solar) and the Pakistan Solar Association (PSA)
signed a memorandum of understanding (MoU)
declaring mutual support for awareness, quality as-
surance and business networking to promote high-
quality solar photovoltaic (PV) products and services
in Pakistan.
In order to create wide-ranging business opportuni-
ties for the private sector of both countries and to
engage German solar companies that can offer
top-quality components, this value chain analysis
was agreed to be developed under the framework
of the project ‘Pakistan Solar Quality Potential: Mea-
sures to Increase the Market Demand for Quality’,
coordinated by BSW-Solar.
1.2 ObjectiveThe objective of this report is to analyze the value
chain of PV in Pakistan and to describe the existing
and required supply structure and customer seg-
mentation. This will allow the identification of the
market potential for high-quality German manufac-
turers and the needs of local stakeholders and to
develop policy recommendations to improve the
quality demand of the Pakistani PV market.
1.3 Methodology of the Value Chain AnalysisThe methodology of the study includes:
a) The analysis of available market data on the PV
market in Pakistan. The main sources of information
were the Alternative Energy Development Board
(AEDB), the National Electric Power Regulatory
Authority (NEPRA) and the customs authorities.
b) Carrying out a survey with selected actors in the
PV value chain. This information was analyzed and
backed up with previously published literature to
develop a landscape of the existing PV value chain in
the country. The gradual approach adopted for this
activity is provided in the Figure 1 below.
Figure 1: Methodology of the value chain analysis
Review and compilation of published data/statistics on PV
Identification of the key value chain actors
Development of the questionnaire
Carrying out interviews with selected PV value chain actors
Results based on interviews and complemented with statistics and available market data

Value Chain Analysis of the Solar PV Market in Pakistan – 9
The customized questionnaire is provided in Annex B.
The interviews were conducted with different value
chain actors (importers, installers, retailers, etc.) to
identify Pakistan’s perception of quality and their
willingness to pay for quality PV products, including
the assessment of customer awareness and interests
based on the respective merchant’s perceptions. The
results were complemented with statistics and avai-
lable market data, despite limited availability of the
latter. The obtained results were identified and sum-
marized for the identification of the potential for
quality PV products.
1.3.1 PV Value Chain Actors
The PV value chain actors in the country are provided
in Figure 2 below. A total of twenty-six small, medium
and large PV companies and businesses were inter-
viewed in order to obtain their feedback regarding
existing and future PV market dynamics. Their names
and contact details are provided in Annex C.
It was ensured that the value chain actors interviewed
included market leaders as well as medium-sized
firms and start-ups, in order to get a holistic picture
of the entire PV landscape.
Figure 2: PV Value Chain Actors
PRIVATE INVESTORS
IMPORTERS
EPCsFINANCIAL
INSTITUTIONSPROJECT
DEVELOPERS
SYSTEM MAINTENANCE
MANUFACTURERS ASSEMBLERS
SYSTEM MONITORING
WHOLESALERS
CONSULTANTS
SUPPLIERS INSTALLERS

10 – Value Chain Analysis of the Solar PV Market in Pakistan
1.3.2 Types of PV Companies/Businesses Consulted
96 percent of the PV businesses surveyed for this
activity are directly importing PV equipment into the
country and are increasing their profit margins in
comparison to PV businesses that procure equip-
ment locally.
Only 38 percent of the firms are acting as ‘wholesa-
lers’ and selling equipment directly to other business
entities in the market, while 4 percent of the firms
are engaged in the monitoring of the PV systems.
It needs to be mentioned that ‘monitoring’ of PV
systems is currently in its infancy and holds consider-
able potential. Most of the firms are focused on
obtaining business with little emphasis put on moni-
toring system performance, unless the client high-
lights an issue.
1.4 Introducing Pakistan
1.4.1 General Description
Pakistan is a federal parliamentary republic. It has
four provinces (Khyber Pakhtunkhwa, Balochistan,
Punjab and Sindh), one capital territory (Islamabad
Capital Territory), two autonomous and disputed
territories (Azad Jammu & Kashmir and Gilgit Baltis-
tan) and the Federally Administered Tribal Areas
(FATA). It is the sixth most populous country in the
world, with a population of over 190 million.6
Recent economic developments in the country have
been positive, with a GDP growth of 4.2 percent in
FY15 compared to 4 percent in FY14, and growth of
4.5 percent forecasted for 2016.7
6 data.un.org7 data.worldbank.org/country/Pakistan8 NEPRA et al 2015 “State of Industry Report’’
1.4.2 Energy Situation & Rationale for Development
of Solar PV in Pakistan
The country has been facing a significant energy de-
ficit for the past decade, with power shortfalls stan-
ding at 5 GW8 and load shedding across the country
varying between 5 to 12 hours a day, with rural areas
bearing the brunt of load shedding. Solar PV could
be a viable and cost-effective long-term solution to
meet Pakistan’s energy needs. The country has a
large potential, being one of the sunbelt countries
with solar irradiation of 6-7 kWh/m2/day in the areas
identified for PV development, as shown in Figure 3.
The Punjab and Sindh provinces are considered the
focal points for both kW and MW-scale PV develop-
ment in the country, due to their high population
density, as well as the high level of infrastructure and
industry.

Value Chain Analysis of the Solar PV Market in Pakistan – 11
9 US.Department of Energy (DOE)/NREL/ALLIANCE
Figure 3: Map of Solar Irradiati on Levels in Pakistan9
Pakistan
Direct Normal
Solar Radiati on
Annual
August 2006
kWh/m2/day
> 9
8,5–9,0
8,0–8,5
7,5–8,0
7,0–7,5
6,5–7,0
6,0–6,5
5,5–6,0
5,0–5,5
4,5–5,0
4,0–4,5
3,5–4,0
3,0–3,5
2,5–3,0
2,0–2,5
< 2
400200
Kilometers
1000

12 – Value Chain Analysis of the Solar PV Market in Pakistan
2.1 Government Institutions11
2.1.1 MoWP (Ministry of Water and Power)
The Federal Ministry of Water and Power is the
GoP’s executive arm for all issues relating to electri-
city generation, transmission and distribution, pri-
cing, regulation, and consumption in the country,
and it exercises this function through its various
agencies as well as relevant autonomous bodies. It
also serves to coordinate and plan the nation’s power
sector, formulate policy and specific incentives and
liaise with provincial governments on all related
issues.
2.1.2 AEDB (Alternative Energy Development Board)
The AEDB was established as an autonomous body
with the aim of promoting and facilitating the ex-
ploitation of renewable energy projects in Pakistan.
It has been designated as a ‘one-window’ facilitator
at federal level for processing solar projects of all
sizes. The AEDB can issue a letter of intent (LOI),
which is the first contract that a solar developer
enters into with the AEDB. The AEDB has also deve-
loped a standard power purchase agreement (known
as the Energy Purchase Agreement (EPA) and a
government support agreement (implementation
agreement (IA).
2.1.3 NEPRA (National Electric Power Regulatory Au-
thority)
Under the 1997 Regulation of Generation, Transmis-
sion and Distribution of Electric Power Act, NEPRA
was appointed as the sole regulator in the power
sector. NEPRA was established to ensure a transpa-
rent, competitive and commercially-oriented power
market in Pakistan. NEPRA issues generation licen-
ses, establishes and enforces standards, approves
investment and power acquisition programs of the
10 The contact information of the stakeholder is provided in Annex A. 11 The contact information of the stakeholder is provided in Annex A.12 http://www.ntdc.com.pk
utility companies and determines investment tariffs
for bulk generation and transmission and retail dis-
tribution of electric power.
2.1.4 CPPA (Central Power Purchasing Agency Gua-
rantee Limited)
The CPPA is a non-profit independent company es-
tablished under the 1984 Companies Ordinance and
is solely responsible for implementing and adminis-
tering the “Single Buyer Plus” market mechanism, i.e.
awarding of exclusive rights by the government to
the transmission and dispatch company, the single
buyer, to purchase electricity from generators and
sell it to distributors (ultimately leading to competi-
tive market operations). Under this mechanism, since
the risk is borne by a single entity, i.e. the buyer, the
generators are expected to accept lower tariffs since
they assume a lower risk.
2.1.5 NTDC (National Transmission and Despatch
Company Limited)
The National Transmission & Despatch Company
Limited (NTDC) commenced commercial operations
on 24 December, 1998. It was organized to take over
all the properties, rights and assets, obligations and
liabilities of 220 KV and 500 KV grid stations and
transmission lines/network owned by Pakistan
Water and Power Development Authority (WAPDA).
NTDC operates and maintains 12 500-KV and 29
220-KV Grid Stations, 5077 km of 500-KV transmis-
sion line and 7359 km of 220-KV transmission line in
Pakistan.12
2.1.6 DISCOs (Distribution Companies)
There are a total of 11 DISCOs in the country, tasked
with ensuring a smooth and uninterrupted delivery
of power to residential, commercial and industrial
customers.
2 Key Stakeholders for Power Sector Development in Pakistan10

Value Chain Analysis of the Solar PV Market in Pakistan – 13
They are the following: IESCO (Islamabad Electric
Supply Company), QESCO (Quetta Electric Supply
Company), PESCO (Peshawar Electric Supply Compa-
ny), HESCO (Hyderabad Electric Supply Company),
GEPCO (Gujranwala Electric Power Company), K-Elec-
tric, LESCO (Lahore Electric Supply Company), MEP-
CO (Multan Electric Power Company), TESCO (Tribal
Electric Supply Company), FESCO (Faisalabad Electric
Supply Company) and SEPCO (Sukkur Electric Power
Company).
2.1.7 PCRET (Pakistan Council of Renewable Energy
Technologies)
PCRET was, according to its mandate, developed for
coordinating R&D and promotional activities in dif-
ferent renewable energy technologies. However, it
is a largely inactive organization, with no noteworthy
role relating to solar technology promotion in the
country.
2.1.8 FBR (Federal Board of Revenue)
The FBR has the responsibility for formulating and
administering fiscal policies, levying and collecting
federal taxes and conducting quasi-judicial hearings
of appeals. In the context of the solar sector of the
country, FBR’s role is key in ensuring that all impor-
ted solar equipment into the country complies with
the recently approved quality import standards for
Solar PV equipment.
2.1.9 PNAC (Pakistan National Accreditation Council)
The Pakistan National Accreditation Council (PNAC)
was established under the administrative control of
the Government of Pakistan’s Ministry of Science
and Technology as the national apex agency to ac-
credit conformity assessment bodies such as labora-
tories and certification bodies. PNAC was established
in 1998 after Pakistan joined the WTO in 1995. The
accreditation services of PNAC were launched during
the year 2001.
PNAC achieved a milestone in the form of a mutual
recognition arrangement (MRA) with the Internatio-
nal Laboratory Accreditation Cooperation (ILAC) and
the Asia Pacific Laboratory Accreditation Cooperati-
on (APLAC) in 2009, and MLA status in 2013. Now
Pakistan is included in the list of countries having
equivalent status for accreditation of testing and
calibration laboratories and certification bodies for
QMS & EMS all over the world.
2.1.10 PSQCA (Pakistan Standards and Quality Cont-
rol Authority)
The PSQCA is the national standardization body. Its
main function is to foster and promote standards
and conformity assessment as a means of advancing
the national economy, promoting industrial efficien-
cy and development, ensuring the health and safety
of the public, protecting consumers, facilitating do-
mestic and international trade and furthering inter-
national cooperation in relation to standards and
conformity assessment.
2.1.11 Provincial Energy Departments
The energy departments based in each province of
the country act as the focal points for all energy-re-
lated matters for the respective province. Their key
functions consist of attracting private-sector invest-
ment, providing an enabling environment and pro-
moting energy efficiency and conservation.
The most active provincial energy department is the
Punjab Energy Department (PED), with a key focus
on exploiting the province’s energy resources and
exploiting power projects in the private and public
sectors. PED has also played a key role in ensuring

14 – Value Chain Analysis of the Solar PV Market in Pakistan
that the concept of the Quaid-e-Azam solar park was
realized.
Similarly, the Pakhtunkhwa Energy Development Or-
ganization (PEDO) is also active in promoting solar as
well as micro- and mini-scale hydropower projects
in the province.
The energy department of Sindh has been suppor-
ting the considerable wind energy installations in the
province, while the Gilgit Baltistan energy depart-
ment remains focused primarily on micro- and mini-
scale hydropower projects.
2.1.12 Cabinet Committee on Energy (CCE)
The Prime Minister of Pakistan chairs the CCE with
the ministers of Finance, Water and Power, Petroleum
and Natural Resources and Chief Minister of Punjab
as its members. The CCE was developed to conduct
bi-weekly meetings and take decisions on matters
relating to entire power chain including generation
and distribution.
A graphic summarizing the inter-relationships of the
key power sector actors in the country is presented
in Figure 4.
Figure 4: Institutional Setup of the Power Sector in the Country
CABINET COMMITTEE ON ENERGY
MINISTRY OF WATER & POWERMOWP
PROVINCIAL DoEsDEPARTMENT OF ENERGY
PROVINCIAL RE PROJECTS RE PROJECTSEXCLUDING HYDEL > 50 MW & THERMAL IPPs
11 DISCOsDISTRIBUTION COMPANIES
BULK CONTRACTS
NEPRANATIONAL ELECTRIC
POWER REGULATORY AUTHORITY
AEDBALTERNATE ENERGY DEVELOPMENT BOARD
NTDCNATIONAL TRANSMISSION &
DESPATCH COMPANY
CPPACENTRAL POWER
PURCHASING AGENCY
NEPRAis sole regulator in
power sector which issues generation
licenses determines tariffs for generation
etc.
CCoE is chaired by PM of Pakistan and takes decisions on fortnightly basis on entire power chain.
MoWP is Federal Ministry and GoP’s body for all issues relating to energy generation, transmission and distribution, policy formulation etc.
AEDB is autonomous body and ’one window‘ facilitator at federal level for processing solar projects of all sizes and issues LOls and issues tax exemption certificates.
Provincial DoEs are focal points for all energy related issues in the province.
NTDC operates and maintains 500 kV and 220 kV grid stations and transmission lines.
CPPA responsible for implementing and administering ’Single Buyer Plus‘ market mechanism leading to competitive market operations.

Value Chain Analysis of the Solar PV Market in Pakistan – 15
2.2 Renewable Energy Associations
2.2.1 PSA & REAP
The Pakistan Solar Association (PSA) and the Renew-
able Energy Association of Pakistan (REAP) are the
only major associations/platforms representing the
interests of private-sector firms/companies working
in renewables in the country. REAP presently has
over 400 members consisting of both small and large
private-sector entities as well as individual business
entities. On the other hand, PSA presently has over
100 members, primarily large and medium-sized en-
tities and individual business entities.
While REAP was the first association to be established
in the country, PSA was founded to focus primarily
on solar energy-based ventures and to provide a
forum for firms/companies working specifically on
solar. Both associations are still at a very early stage
of development.
2.3 International Organizations
The international organizations actively working in
the country and playing a key role in the energy sec-
tor are USAID, JICA, ADB, KfW, EU, GIZ and UNDP.
Amongst these institutions, the GIZ RE-EE project is
the only one dedicated to the promotion of renewa-
ble energy and energy efficiency in Pakistan.
The United States Agency for International Develop-
ment (USAID), together with the government-owned
DISCOs, have been playing a key role through its
three-year program aimed to improve the perfor-
mance of DISCOs through reduction of losses as well
as improvement of revenues and customer services.
2.4 Scientific/Academic OrganizationsAlthough there is a high level of interest from all sec-
tors, there are no focused academic institutions wor-
king solely on solar PV, since the market is still at an
early stage. Certain reputed universities such as Na-
tional University of Science and Technology (NUST)
with campuses in both Rawalpindi/Islamabad and
Karachi have developed a dedicated ‘U.S. Center for
Advanced Studies in Energy’ (USPCAS-E)13 in order
to focus on renewable technologies such as solar and
biomass. Similarly, the University of Engineering and
Technology (UET) in Lahore presently has an accre-
dited laboratory for conducting flash tests in order
to assess panel efficiency.
In the recent years, USAID has extended considerable
financial support to NUST for the establishment of
the Center for Energy Studies.
The PCRET, mentioned in Section 2.1.7, is a public-
sector research organization focused on conducting
research and development (R&D) in different renew-
able energy technologies, with one of the focal areas
being solar PV.
13 http://www.nust.edu.pk/INSTITUTIONS/Centers/CES/Pages/default.aspx

16 – Value Chain Analysis of the Solar PV Market in Pakistan
3.1 Power Sector Status in Pakistan
3.1.1 Existing and Projected Supply and Demand
Scenario
The power deficit in the country currently stands
near 5 GW, with the supply and demand scenario
shown in Figure 5. However, multi ple power genera-
ti on projects from various sources are currently in
the pipeline and are envisaged to eliminate the po-
wer defi cit by 2019, provided that expected projects
are completed on ti me. PV projects can play a key
role in the eliminati on of the power defi cit, parti cu-
larly in the industrial and residenti al sectors.
14 MoWP15 CPPA, NEPRA and AEDB
The share of renewables in Pakistan has been steadily
increasing each year, with 1136 MW of renewables
having been installed by 2016 (primarily PV, biogas
and wind projects). During the last year, i.e. 2015-16,
there has been a promising increase in the share of
renewables, with 728 MW of renewables added. The
increase in renewables to the overall power sector
landscape of Pakistan is provided in the Figure 6
below.
3 PV Sector in Pakistan
Figure 5: Power Supply and Demand Scenario in Pakistan14
Figure 6: Share of Renewables in Power Sector Landscape of Pakistan15
Capacity
Availability
Demand
Jun
16
Au
g 16
Oct
16
De
c 16
Feb
17
Ap
r 17
Jun
17
Au
g 17
Oct
17
De
c 17
Feb
18
Ap
r 1
8
Jun
18
23 107
19 917
17 107
24 26218 738
21 096
14 121
17 500
18 262
25 961
26 590
21 599
25 08027 600
30 938
Thermal
Nuclear
RE
MW
Hydro
16.814
1.127
1.136
2016
26.197
7.121
16.963
787
408
2015
25.255
7.097
16.963
787
106
2014
24.953
7.097
15.852
787
50
2013
23.617
6.928
15.888
787
-
2012
23.302
6.627
15.753
787
-
2011
23.167
6.627
14.240
462
-
2010
21.527
6.555

Value Chain Analysis of the Solar PV Market in Pakistan – 17
The trend in electricity consumption is provided in
the Figure 7 below.
An overall growth in demand of 11,000 GWh in over-
all electricity consumption has taken place over the
past five years, with both the domestic and industrial
sectors displaying an increase in electricity consump-
tion. The overall growth in demand over this period
was approximately 7300 MW.
3.2 Legal Framework for PV Development16
The GoP has also taken a considerable number of
incentives in its strategy to overcome the energy
deficit through the promotion of both large-scale
grid-connected PV projects as well as smaller-scale
projects. The first step in this regard was its 2006
‘Policy for development of renewable energy for
power generation,’ which intends to increase the
deployment of renewable energy technologies in
Pakistan to 9700 MW by the year 2030, according to
the Medium Term Development Framework (MTDF).17
16 IFC et al 2016. Solar Developer’s Guide to Pakistan17 GoP, et al 2006: Policy for Development of Renewable Energy for Power Generation
This was followed by the introduction of net mete-
ring in September 2015, with further steps being
taken to reduce bureaucratic ‘red tape’ in the pro-
cess of applications for issuance of net metering
licenses.
Additionally, the ‘import quality standards for PV
equipment’ by the GoP is expected to be adopted
soon and aims to curb the import of uncertified and
sub-standard equipment into the country. Once these
standards are implemented, there will be greater
standardization, both in terms of pricing as well as
the quality of products available in the market, and
the leading international solar companies will be en-
couraged to increase their stakes in this emerging
solar market. These approved standards are detailed
in Annex D.
Figure 7: Electricity Consumption Trend by Sector
2009–10 2014–15
Total: 74.348 GWh Total: 85.818 GWh
Domestic 48,3 %Domestic 46,1 %
St. Light, Traction & Oth. 0,6 %St. Light, Traction & Oth. 0,7 %Commercial 7,5 % Commercial 7,6 %
Agriculture 13,0 % Agriculture 9,4 %
Bulk Supplies 5,0 %
Industrial 26,7 % Industrial 29,1 %
Bulk Supplies 5,9 %

18 – Value Chain Analysis of the Solar PV Market in Pakistan
The GoP has also taken some very promising steps
with its focal public-sector financial institution, the
State Bank of Pakistan, announcing a ‘financing
scheme for renewable energy’ in June 2016 with
loans being offered at 6 percent for PV projects of 4
kW up to 50 MW.18
At the same time, the government has also taken
steps to encourage ‘large-scale’ grid-connected PV
projects through the introduction of a feed-in tariff
(FiT) mechanism, which has proved a much needed
catalyst to induce investor interest and considerably
speed up the project development cycle.
In the off-grid sector, approximately 40,000 villages
across Pakistan are presently un-electrified. This sec-
tor has a large potential, with only a small amount of
companies being active. Microf inancing for
small-scale solar has considerable potential if it is
implemented successfully.
According to the last statistic available, the import
of PV products was at 260 MW19 in 2014. The volume
of PV commercial and residential installations has
been steadily increasing, with a total of 33.68 MW
of PV installed by 2013 and 49.97 MW installed by
2014.20 As a result of the commissioning of the 100-
MW PV project at the Quaid-e-Azam Solar Park in
May 2015, the total installed capacity of PV in 2016
stands close to 400 MW; this is only the contribution
from large-scale grid-connected installations and
does not include off-grid and small-scale installations
(data is not available).
18 http://www.sbp.org.pk/smefd/circulars/2016/C3.htm 19 GIZ REEE Project et al 2014. Updating of Renewable Energy Installations Database 20 GIZ REEE Project et al 2014. Updating of Renewable Energy Installations Database
3.3 PV Market Potential
The Alternative Energy Development Board (AEDB)
reports that 35 renewable energy projects including
solar, wind and other technologies with a capacity of
1.1 GW are under development within the frame-
work of the AEDB policies and procedures. FiTs (or
upfront tariffs as they are known in Pakistan) have
been approved for 10 developers, and of those,
three projects of 100 MW each have signed a power
purchase agreement with the public off-taker.
Apollo Solar Pakistan, Crest Energy Pakistan, and
Best Green Energy Pakistan are each working on a
100-MW PV project. These projects are expected to
be commissioned by the end of this year.
Six other developers have been issued letters of sup-
port for the development of projects with a cumula-
tive capacity of 48 MW. The AEDB has also issued
letters of intent for the development of 25 projects
with a combined generation capacity of 660 MW.
These projects are expected to be operational by
2018.
Additionally, the government of the Punjab province
has issued letters of intent for projects with a total
capacity of 1519 MW.
The recent introduction of net metering is expected
to catalyze the local solar industry with the residen-
tial, commercial and industrial sectors being key
beneficiaries, with high levels of interest being ex-
pressed for installing systems to reap the benefits of
this mechanism. The process of obtaining the license
for utilization of net metering has also been fine-
tuned by the respective power utilities to minimize
the time period for obtaining such a license.

Value Chain Analysis of the Solar PV Market in Pakistan – 19
Apart from the many residential users of solar sys-
tems who are planning to obtain a net metering
license, a significant number of commercial entities
such as hospitals, educational facilities (such as
school, colleges and universities) as well as public
and private-sector office buildings and premises are
planning to install installations up to 1 MW to bene-
fit from the cost savings expected through this sup-
port scheme. If different types of industry can be
convinced, based on the potential of additional in-
come through net metering, to switch to solar PV as
an electricity source, this could lead to a significant
pipeline of PV projects. It is expected that in the next
three to four years, between 3000 and 4000 MW of
solar PV will be installed across the country through
net metering.
3.4 Updates on Net Metering
The introduction of net metering is generating high
levels of interest and expectations across all seg-
ments of the PV market.
The NEPRA’s ‘Distributed Generation and Net Mete-
ring Regulations’ were announced/approved on 1
September 2015, while the first net metering gene-
ration license of 1 MW at the parliament building
was issued on 28 January 2016 after a period of 4
months and 28 days.
While NEPRA is the authority that issues the genera-
tion licenses, the DISCOs sign the ‘Distributed Gene-
ration Interconnection Agreement’ with the prosu-
mers and forward the prosumers’ application for
electricity generation license to NEPRA.
Currently, the processing time for issuance of net
metering licenses has been reduced to one month.
About seventeen net metering license applications
are being processed with IESCO, with nine connec-
tions in Islamabad. The installed capacity through
net metering stands at 1.6 MW for IESCO, while a
135-kW system has been recently installed at an in-
dustrial unit under the distribution company LESCO.
This is a most encouraging sign, since the LESCO mar-
ket for net metering-based installations is much lar-
ger compared to the market size for IESCO systems.
The origin (local/foreign) of electricity meters for net
metering installations is not mentioned in NEPRA
regulations. Currently, local companies that fulfill the
specification from the authorities produce energy
meters.
.

20 – Value Chain Analysis of the Solar PV Market in Pakistan
4.1 Proportion of Revenue from Solar Components
The revenue generated from sale of the different
solar components by the firms surveyed is provided
in Figure 8.
As displayed in the figure above, 37 percent of re-
venue is generated from panels, 35 percent from the
sale of inverters and 28 percent from the sale of bat-
teries. Since the cost of PV panels is lower in compa-
rison to the two other components in a solar system,
a large number of businesses are generating consi-
derable revenue from their sale. In contrast, even
though inverters are a much costlier item, the sale
of a smaller proportion of this component leads to
greater profit margins. Batteries were generally ob-
served to be the item contributing the least to the
revenue generation of the solar businesses interviewed
as a part of this activity.
4.2 Importers/Wholesalers
As mentioned above, 96 percent of the companies
consulted import equipment themselves in order to
maximize profit margins. At present the emphasis
remains on importing equipment from China since it
is the most readily accessible market with a large
range of products varying in both price and quality.
For the most part, companies either import an entire
container of goods or share a container with another
interested business entity for importing the required
solar components.
The entities involved in importing solar components
themselves were observed to possess a project
pipeline as well as the financial strength to develop
a sizeable inventory and thus bear the risk of market
turbulence and diminished demand. The importers
that were consulted expressed the hope that the
adoption of net metering will provide greater stabi-
lity to the local PV market through a stable demand
of PV systems and will reduce the risk of holding a
large inventory.
On the other hand, 38 percent of businesses inter-
viewed are involved in wholesale activities, with
their business models focused on importing and
then selling their products to other business entities.
The types of firms that are currently involved in the
wholesale sector tend to be prosperous business
entities, often active in other business fields, with
the required financial muscle to import large quan-
tities of inventory and hold onto it during lean peri-
ods as well as during periods of uncertainty.
4 Results of the Value Chain Analysis
Figure 8: Revenue Generated From Different PV Components
Inverter
Battery
Panel
35 %37 %
28 %

Value Chain Analysis of the Solar PV Market in Pakistan – 21
4.3 Manufacturers/Assemblers
The assembly of silicon wafers is currently carried
out by five different companies in the country. These
are:
Ikram Solar
Akhtar Solar
Saba Solar
Tesla PV
PV Silicon
However, the imported panels manufactured by
reputed brands are currently preferred, due to the
higher reliability and trust enjoyed by the foreign
brands.
4.4 Suppliers/Installers
Most of the PV businesses interviewed import solar
PV components in large quantities, capitalizing on
the larger profit margins and at times selling the solar
solutions as wholesalers to other smaller business
entities. These businesses deal directly with clients,
irrespective of which sector they might belong to –
i.e. residential, industrial or commercial – and they
also install the systems and offer customized solutions.
21 The figures provided with regards to proportion of PV panel market shares are rough estimates based on feedback collected during surveys and market research. Detailed surveys are necessary to determine more accurate statistics regarding the PV panel landscape in Pakistan.
Additionally, there is limited expertise in the market
related to system designing and installation. Most
installers working in the PV field are electricians with
no specific training related to solar PV, and are, as a
result, ‘learning by doing.’
4.5 Solar PV Product and Service Range in the Pakistani Market
4.5.1 Locally Produced Products
Apart from minor accessories such as wiring and
panel mounting structures, 80 percent of PV compo-
nents are currently being imported into the country.
4.5.2 PV Panels
Currently, five companies in Pakistan are conducting
the local ‘assembly’ of panels. However, imported
panels are preferred. The PV panel landscape in the
country is provided in Figure 9 below.
Figure 9: Landscape of PV Panels in Pakistan21
Import of PV panels High quality panels (reputed brands)
(≈ 30 %)
Limited volumes andquestionable quality
Local assembly
YesNo
Local manufacturing
Low quality panels (low cost brands & smuggled)
(≈ 70 %)
Customers NOT satisfied withperformance of local panels
(efficiency versus price)

22 – Value Chain Analysis of the Solar PV Market in Pakistan
4.5.3 Batteries
Locally manufactured and low-quality flooded lead
acid batteries are being widely used wherever bat-
tery backup is necessary, particularly in hybrid solar
systems in the residential and commercial sectors as
well as in the off-grid systems in rural parts of the
country.
These batteries are used both in cars and also in ho-
mes for utilization with the UPS hybrid inverters as
well as with solar PV systems. Needless to say, these
batteries are not developed for use with solar sys-
tems and thus do not provide a long life; there have
also been frequent cases of malfunctioning.
Considering the significant opportunity with regards
to the demand for these batteries, there is a high
proportion of instances where the batteries are
refurbished and sold as new.
22 The figures provided with regards to proportion of battery market shares are rough estimates based on feedback collected during interviews and market research. Detailed surveys are necessary to determine more accurate statistics regarding the battery landscape in Pakistan.
The manufacturing of AGM batteries is expected to
commence soon in the country, with the following
industrial groups setting up factories in the southern
Pakistani city of Karachi:
Daewoo (Korea)
Treet (Korea)
Eco star (DWP Group, GREE Group) – China
Homage (China)
The landscape and dynamics of battery usage for
solar PV systems in Pakistan is illustrated in Figure
10 below.
Figure 10: Landscape of Batteries for Use with PV Systems in Pakistan22
Imported battery (≈ 30 %)
Local battery (≈ 60 %)
Landscape of batteries for PV systems in Pakistan
High quality (≈ 30 %)(European,
American, Chinese)
Sub-standard (≈ 30 %)(Low grade Chinese)
Sub-standard (≈ 100 %)(Lead acid car batteries)
High quality(0 %)
Value Chain Analysis of the Solar PV Market in Pakistan – 23
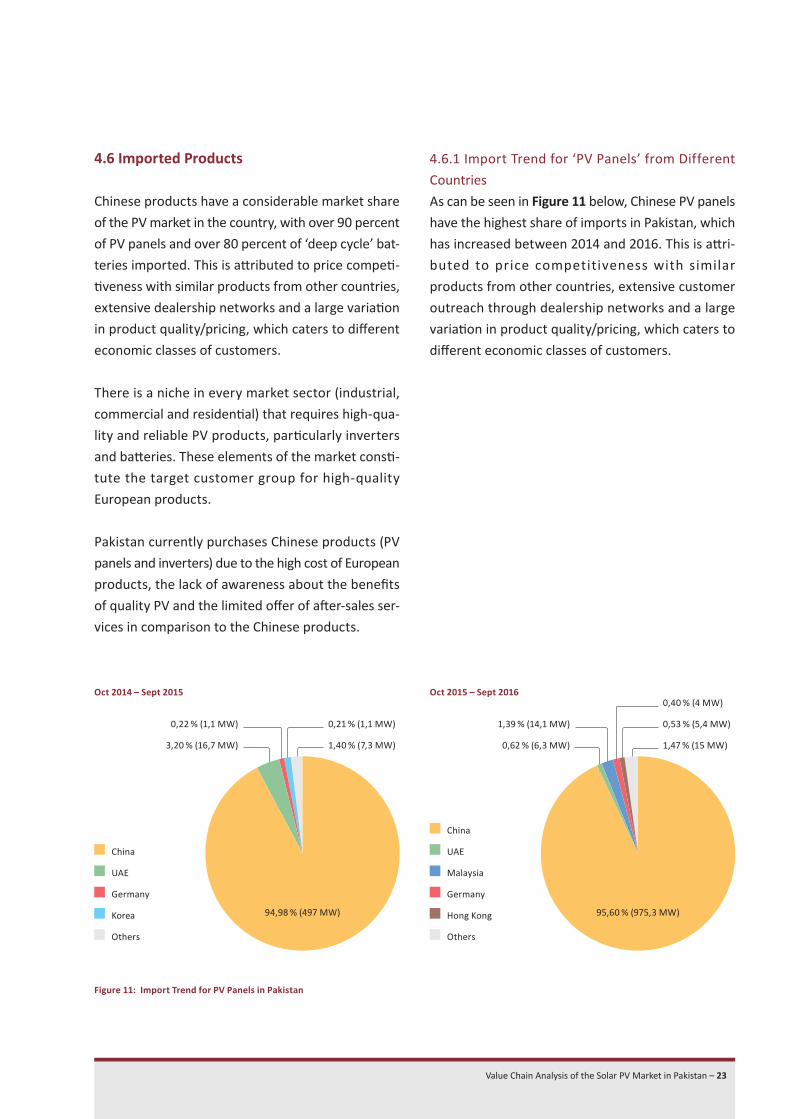
4.6 Imported Products
Chinese products have a considerable market share
of the PV market in the country, with over 90 percent
of PV panels and over 80 percent of ‘deep cycle’ bat-
teries imported. This is attributed to price competi-
tiveness with similar products from other countries,
extensive dealership networks and a large variation
in product quality/pricing, which caters to different
economic classes of customers.
There is a niche in every market sector (industrial,
commercial and residential) that requires high-qua-
lity and reliable PV products, particularly inverters
and batteries. These elements of the market consti-
tute the target customer group for high-quality
European products.
Pakistan currently purchases Chinese products (PV
panels and inverters) due to the high cost of European
products, the lack of awareness about the benefits
of quality PV and the limited offer of after-sales ser-
vices in comparison to the Chinese products.
4.6.1 Import Trend for ‘PV Panels’ from Different
Countries
As can be seen in Figure 11 below, Chinese PV panels
have the highest share of imports in Pakistan, which
has increased between 2014 and 2016. This is attri-
buted to price competitiveness with similar
products from other countries, extensive customer
outreach through dealership networks and a large
variation in product quality/pricing, which caters to
different economic classes of customers.
Figure 11: Import Trend for PV Panels in Pakistan
Oct 2014 – Sept 2015
94,98 % (497 MW)
3,20 % (16,7 MW)
0,22 % (1,1 MW) 0,21 % (1,1 MW)
1,40 % (7,3 MW)
China
UAE
Germany
Korea
Others
Oct 2015 – Sept 2016
95,60 % (975,3 MW)
0,62 % (6,3 MW)
1,39 % (14,1 MW)
0,40 % (4 MW)
0,53 % (5,4 MW)
1,47 % (15 MW)
China
UAE
Malaysia
Germany
Hong Kong
Others

24 – Value Chain Analysis of the Solar PV Market in Pakistan
4.6.2 Import Trend for Deep Cycle Batteries from
Different Countries
A high proportion of Chinese ‘deep cycle’ batteries
are being imported into the country, with the same
reasons behind this dynamic as those already cited
above for PV panels. The overall volume of batteries
imported from Germany has increased over the last
year (October 2015 to September 2016), although
there has been a minor decrease in the market share
as can be seen in Figure 12 below.
Figure 12: Import Trend For Deep Cycle Batteries in Pakistan
China
USA
Vietnam
France
Korea
UK
Germany
Others
82,44 % (19.900 tonnes)
5,17 % (1.249 t)
2,62 % (634,3 t)
1,97 % (475,2 t)
2,57 % (621,3 t)
1,03 % (247,9 t)
0,49 % (117,4 t)
3,71 % (899,8 t)
Oct 2014 – Sept 2015
China
Vietnam
USA
Korea
Singapore
Other EU States
Germany
Others
85,13 % (24.970 tonnes)
3,24 % (950,0 t)
3,03 % (888,1 t)
3,70 % (1.086,6 t)
1,81 % (530,6 t)
0,98 % (286,4 t)
0,47 % (137 t)
1,65 % (483,2 t)
Oct 2015 – Sept 2016

Value Chain Analysis of the Solar PV Market in Pakistan – 25
4.6.3 Import Trend for Inverters from Different
Countries
Chinese inverters have the highest share of imports
in Pakistan, which has increased between 2014
and 2016, as can be seen in Figure 13 below. The
reasons behind this dynamic are the same as in the
case of import of the other PV components, i.e. price
competitiveness with similar products from other
countries, extensive dealership networks and a large
variation in product quality/pricing, which caters to
different economic classes of customers.
Figure 13: Import Trend for Inverters in Pakistan
Oct 2015 – Sept 2016
71,54 % (1.328,8 MW)
6,93 % (128,8 MW)
4,21 % (78,3 MW)
3,17 % (58,9 MW)
2,16 % (40,1 MW)2,58 % (47,9 MW)
2,13 % (39,5 MW)
7,28 % (135,1 MW)
China
Germany
Finland
UAE
Other EU States
UK
Italy
Others
Oct 2014 – Sept 2015
65,01 % (1.007,4 MW)
3,11 % (48,1 MW)
2,86 % (44,3 MW)
6,01 % (93,2 MW)
2,55 % (39,5 MW)
20,46 % (317,1 MW) China
UAE
UK
Germany
Finland
Others

26 – Value Chain Analysis of the Solar PV Market in Pakistan
4.6.4 Import Trend for Charge Controllers from
Different Countries
A high proportion of Chinese charge controllers are
being imported into the country, with the same rea-
sons behind this dynamic as those already cited
above for the other PV components. The overall
volume of charge controllers imported from Germany
has increased by 0.92% over the last year (October
2015-September 2016), although there has been a
minor decrease in the market share as can be seen
in Figure 14 below.
Figure 14: Import Trend for Charge Controllers in Pakistan
Oct 2014 – Sept 2015 Oct 2015 – Sept 2016
36,03 % (211,1 MW)
25,86 % (151,5 MW)
23,58 % (138,1 MW)
4,47 % (26,2 MW)
3,35 % (19,6 MW)
6,72 % (39,4 MW)
38,78 % (237,7 MW)
21,98 % (159,4 MW)
19,37 % (140,5 MW)
7,02 % (50,9 MW)
5,96 % (43,2 MW)
2,60 % (18,9 MW)
2,41 % (17,5 MW)
2,04 % (14,8 MW)
5,83 % (42,3 MW)
China
Germany
USA
Singapore
Italy
Others
China
Germany
USA
Italy
Other EU States
UAE
Turkey
Sweden
Others

Value Chain Analysis of the Solar PV Market in Pakistan – 27
4.7 Analysis of Products Fulfilling Norm and Quality Standards
Based on the feedback obtained from the different
value chain actors, the proportion of certified pro-
ducts in the local market is provided in Figure 15. As
can be observed, only 14 percent of inverters in the
local market are perceived as quality products,
which fulfill local and international norms and quali-
ty standards. This seems a reasonable perception,
since a large proportion of ‘copies’ of high-quality
Chinese inverters are available in the market, which
are similar in price and are very difficult to differen-
tiate from the original product.
Similarly, only 9 percent of batteries in the local mar-
ket are perceived to be quality or certified products;
this is due to the predominant use of sub-standard
flooded lead acid car batteries for use with PV sys-
tems. This trend can be largely attributed to the
smuggling or importing of used and sub-standard
flooded and maintenance-free batteries, which often
malfunction after only a few months of use.
In comparison to inverters and batteries, 20 percent
of PV panels in the local market are perceived as
quality products. This is primarily due to sub-stan-
dard Chinese panels flooding the market.
Figure 15: Proportion of Certified Products in the Local Market23
23 Results based on interviews with PV key value chain actors (wholesalers, importers, installers, retailers etc.)
18
16
20
14
12
10
8
6
4
2
0
14 %
9 %
20 %
Inverter Battery Panel
Solar system components
Prop
ortio
n of
Cer
tified
Com
pone
nts
in P
ak M
arke
t

28 – Value Chain Analysis of the Solar PV Market in Pakistan
The different imported brands observed in the
market are listed in Figure 16 below.
The harm to both customer confidence and the dif-
ficulties in choosing certified products is evident
considering that ‘certified’ solar PV panels are sold
for up to 1 USD per Watt and last for 20 years, while
an ‘uncertified’ panel costs 0.5 USD per Watt and
lasts for 2 years.
The adoption of the “import quality standards for PV
products” that is to be implemented in the near
future is expected to pave the way for a reduction in
the quantity of sub-standard and uncertified equip-
ment present in the market. Based on the feedback
received from the value chain actors, it is generally
felt that a short to medium-term improvement of 35
percent in the volume of certified equipment available
in the local market can be expected, with stricter
implementation of these standards expected to in-
crease the proportion of high-quality products.
Figure 16: Imported PV Brands in Pakistan24
24 Results based on interviews with PV key value chain actors (wholesalers, importers, installers, retailers etc.) and on market research. The list is not exhaustive and may not include all available brands. The component brands are listed in no particular order. Considering the scope of this study, it was not possible to assess the specific market share of each respective brand mentioned here. Classification of equipment into ‘tiers’ is currently not possible due to the lack of quality standards in Pakistan.
Yingli (China)Kyocera (Japan)Rene Sola (Korea)JA Solar (China)Canadian Solar (China)Alfa Solar (Germany)Hitek (UK)Jinko Solar (China)GH (Belgium)Trina Solar (China)Solar World Germany)Phono (China)Beyond PV (Taiwan)Eurener (Spain)Hanergy (China)Shanghai Solar (China)
PV Panels
Voltronic (Taiwan)Schneider Electric (France)Sacred Sun (China)SMA (Germany)ABB (Sweden-Switz.)Outback (USA)Nedap (Holland)Sungrow (China)Baykee (China)Studer (Switzerland)TBB Power (China)Fronius (Austria)Victron (Holland)I-Energy (Taiwan)Kaco New Energy (Germany)
Inverters
Long (Vietnam)Hoppeke (Germany)Powersonic (China)Trojan (USA)Narada (China)Baykee (China)JTE (China)CSB (Taiwan)Huawei (China)Sunny Power (China)Inti Power (China)
Batteries

Value Chain Analysis of the Solar PV Market in Pakistan – 29
4.8 Availability Analysis of High-Quality Products and Services
The availability of high-quality products and services
is limited to a handful of companies working in the
country’s PV market. There are certain local PV com-
panies with dealerships of reputed brands that use
this advantage as the sole selling point for that par-
ticular product in the country. Also, in many cases,
the local seller’s product knowledge is limited and
the inventory maintained by the dealer is restricted
to a few high-selling products in order to minimize
the risks of maintaining large inventories and thus to
ensure a high cash flow.
Reputed quality brands from Europe, USA and Asia
are available in limited quantities, with the specific
component directly imported in case of large-scale
project interventions. In periods of high demand,
equipment shortages are common due to insufficient
inventories maintained by the local dealers. The only
solution in such instances is a waiting period of at
least one month until the required shipment is ordered
and reaches the port of Karachi in the south of the
country.
It should be mentioned that high-quality spare parts
are rarely available, as is the expertise for repairing
these products; in most cases, a defective compo-
nent is sent back to the manufacturer, who is often
based in Europe, resulting in a considerable time lag
until the client receives the repaired equipment.
4.9 Potential Areas for Solar PV Products
There is considerable potential for marketing and
deploying solar products throughout the country. In
the case of residential installations, significant
demand exists in the urban hubs, e.g. the cities of
Karachi, Lahore, Rawalpindi/Islamabad and Multan,
with the onset of net metering posing a massive
opportunity for the development of the solar PV
landscape in the country. The commercial sector in
these urban hubs also holds high potential, since
hospitals, hotels, educational institutions (universi-
ties, colleges, schools etc.) are planning to install
solar PV and utilize net metering.
In areas where industry is concentrated, such as the
textile industry in and around Faisalabad and Lahore,
as well as the sports industry in Sialkot, there is a
high potential for the deployment of solar PV pro-
ducts.
Also, there is enormous potential for solar pumping
in the agricultural sector, with the Punjab and Sindh
provinces being the two largest agricultural regions
with the greatest potential demand.
In addition, the off-grid areas in the country also pos-
sess high potential, with over 40,000 villages across
the country that are presently un-electrified.

30 – Value Chain Analysis of the Solar PV Market in Pakistan
4.10 Market Segments Using Different Product Qualities
The different market segments and their preferences
in terms of cost versus quality while choosing PV
products are provided in Figure 17 below.
4.10.1 Commercial
In the commercial sector, price is weighted 56
percent compared to quality with 44 percent. Due
to the high electricity demand diesel generators are
needed. Hence, if PV projects are implemented the
payback period would be short (around 3-4 years).
While the focus from this sector might be more on
price, commercial entities always prefer to procure
products of reasonable quality to avoid possible mal-
functions and problems during equipment operation.
4.10.2 Residential
In the residential sector, the mindset is heavily skewed
towards price (82%) in comparison to quality (18%),
with the residential customers being highly price-
sensitive and for the most part preferring chea per
and lower-quality products due to a lack of aware-
ness of the long-term impacts of procuring cheap
and sub-standard equipment.
Figure 17: Price Versus Quality Preferences25
25 Results based on interviews with PV key value chain actors (wholesalers, importers, installers, retailers etc.)
90 %
80 %
70 %
60 %
50 %
40 %
30 %
20 %
10 %
0 %
56 %
44 %
82 %
18 %
58 %
42 %
70 %
30 %
Price Price Price PriceQualitiy
Commercial Residential Industrial Govt Buildings
Qualitiy Qualitiy Qualitiy
Value Chain Analysis of the Solar PV Market in Pakistan – 31
4.10.3 Industrial
The industry sector is the most promising market
segment for high-quality PV products. While econo-
mic aspects can never be neglected and do weigh in
at a higher level compared to quality, to ensure pro-
fitability of the project and obtain financing for a
project, a majority of industries prefer to pay an ex-
tra amount to procure high-quality products. Euro-
pean inverters, for example, are popular across the
different industrial set-ups across the country due to
their reliability and high level of efficiency.
4.10.4 Public Sector (government schools, district
administration officers etc.)
This particular segment focuses heavily on cost in
comparison to quality, with a 70 percent of weigh-
ting placed on cost and the remaining 30 percent on
quality. Keeping in view the tendering procedures
commonly used in the public sector, the lowest bid
is mostly awarded the bid, while quality checks of
the proposed equipment hardly factor into the deci-
sion-making process; in the long term, this can pose
serious issues.
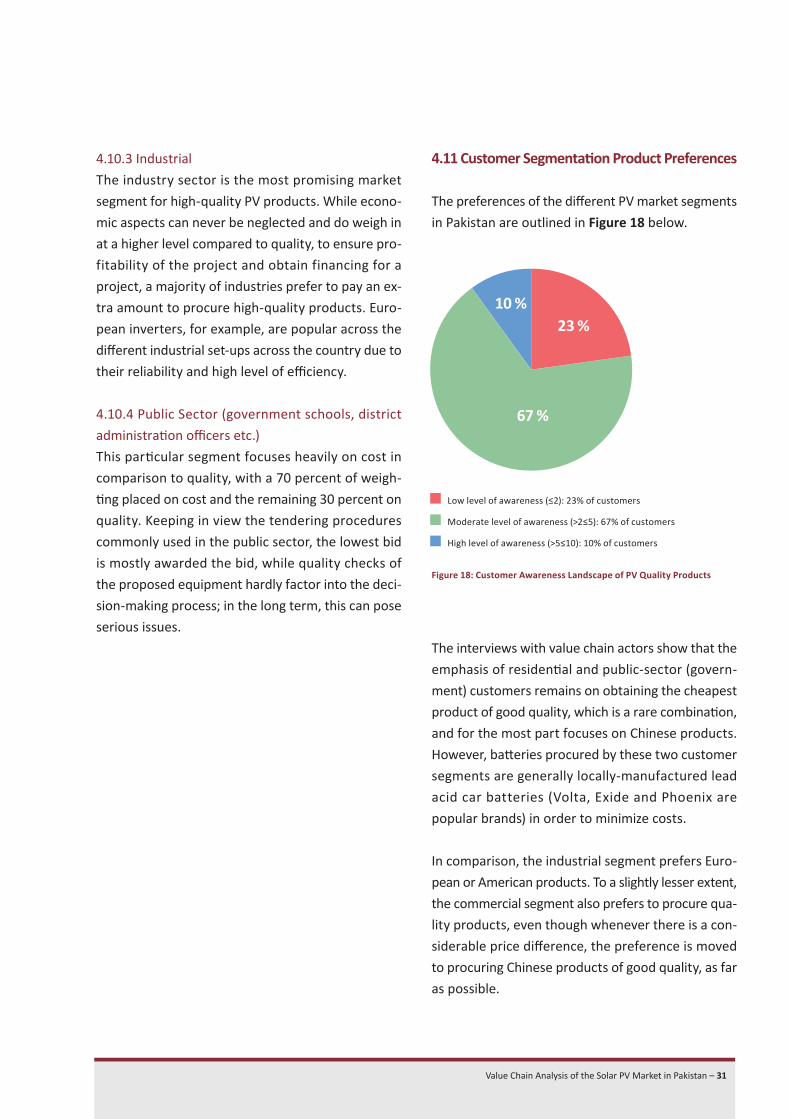
4.11 Customer Segmentation Product Preferences
The preferences of the different PV market segments
in Pakistan are outlined in Figure 18 below.
The interviews with value chain actors show that the
emphasis of residential and public-sector (govern-
ment) customers remains on obtaining the cheapest
product of good quality, which is a rare combination,
and for the most part focuses on Chinese products.
However, batteries procured by these two customer
segments are generally locally-manufactured lead
acid car batteries (Volta, Exide and Phoenix are
popular brands) in order to minimize costs.
In comparison, the industrial segment prefers Euro-
pean or American products. To a slightly lesser extent,
the commercial segment also prefers to procure qua-
lity products, even though whenever there is a con-
siderable price difference, the preference is moved
to procuring Chinese products of good quality, as far
as possible.
Figure 18: Customer Awareness Landscape of PV Quality Products
23 %
67 %
10 %
Low level of awareness (≤2): 23% of customers
Moderate level of awareness (>2≤5): 67% of customers
High level of awareness (>5≤10): 10% of customers

32 – Value Chain Analysis of the Solar PV Market in Pakistan
4.12 Quality Perceptions of Key PV Target Groups
The lack of import regulations in the country per-
taining to solar products has led to a considerable
influx of cheap and sub-standard Chinese products,
dealing a considerable blow to consumer confidence
across all target groups. The frequent malfunctioning
and limited lifespan of inverters and batteries, com-
bined with low-efficiency panels, has not helped to
foster strong confidence amongst consumers.
In the last decade, a large number of businessmen
and vendors, with no specific knowledge or expertise
relating to PV, have felt there is a significant oppor-
tunity in this sector, with large profits to be made.
Unfortunately, with the primary focus on profit-ma-
king, sub-standard equipment has been imported
from a few Asian countries, primarily China.
Once the consumers have purchased sub-standard
systems due to lack of product and technology
knowledge, the perception is eventually established
that PV technology itself is unreliable.
In terms of awareness of the different product ran-
ges and associated qualities and certifications, the
general awareness scenario on a scale of 1 to 10 is
presented in Figure 19 below.
Figure 19: Preferences of the PV Market Segments in Pakistan
Typical installation size1 MW – 10 MW
High-potential industries & locations (i) Textile (spread across Punjab province)(ii) Sports (focused in Sialkot city)(iii) Food industry (across the country)(iv) Pharmaceutical industry (Karachi)
Possible project financing models(i) Financing through recently announced scheme for RE project financing by State Bank of Pakistan. Loans offered at 6 percent for solar PV projects up to 50 MW.
(ii) Conventional financing through lending from bank along with equity from project developer
Product preferencesBased on past trends, industry prefers to install reliable and high-quality components to ensure project bankability.
SMA, Schneider and ABB quite popular in terms of reliability compared to Chinese products
Industrial
Typical installation size50 kW – 200 kW
High-potential segments & locations (i) Public hospitals & health facilities(ii) Government educational institutions (across the country)(iii) Public parks and recreation facilities (across the country)(iv) Public offices (across the country) Possible project financing models(i) Public financing from national approved budget as per PC-1 document(ii) Grant aid from international donor agencies
Product preferencesTendency remains to maximize project size within allocated budget. Also, open tenders bidding mechanism based on awarding project to lowest bidder results in high-quality and durable products losing out to competitors offering lower-quality products.
Public sector (government-funded)
Typical installation size100 kW – 1 MW
High-potential industries & locations (i) Hospitals (across the country)(ii) Private educational institutions(iii) Hotels & restaurants (across the country)(iv) General provision stores (across the country)
Possible project financing models(i) Financing through recently- announced scheme for RE project financing by State Bank of Pakistan. Loans offered at 6 percent for solar PV projects up to 50 MW.
(ii) Conventional financing through lending from bank along with equity from project developer
(iii) Equity
Product preferencesIn the past, tendency was to install cheaper and less reliable quality Chinese brands.However, slowly trend moving towards increasing awareness leading to installation of SMA, Schneider and ABB due to high level of reliability
Commercial
Typical installation size1 kW – 20 kW
High-potential locations (i) Urban centers (Karachi, Lahore, Islamabad, Rawalpindi, Faisalabad, Multan, Hyderabad)(ii) 40,000 un-electrified off-grid villages across the country (iii) Agricultural areas across Punjab, Sindh and KPK provinces owned by farmers with land holdings of different sizes Possible project financing models(i) Financing through recently- announced scheme for RE project financing by State Bank of Pakistan. Loans offered at 6 percent for solar PV projects up to 50 MW.
(ii) Equity
(iii) Funding through donor projects in off-grid areas
Product preferencesHigh price sensitivity exists with niche market for high quality and certified products. Large proportion of clients in this sector opting for Chinese products, although increasing interest in certified high-quality products as result of ‘lessons learnt’
Residential

Value Chain Analysis of the Solar PV Market in Pakistan – 33
4.13 Payback Time Expectations of Each Customer Segment
The payback expectations from the different custo-
mer segments are shown in Figure 20 below. As can
be observed, for residential and public-sector (go-
vernment) buildings, there are expectations of a pay-
back period of five years. In comparison, the indust-
rial sector has an expectation of payback of the
investment in 4.5 years, while the commercial sector
has the highest payback expectation of 3.5 years.
Figure 20: Payback Expectations of Each Customer Segment
3,5
Target Sector for Solar PV Products
Payb
ack
Tim
e (y
ears
)
3,0
4,0
4,5
5,0
2,5
2,0
1,5
0,5
0 ,0Commercial
3,5 years
5 years
4,5 years
5 years
Residential Industrial Govt Buildings

34 – Value Chain Analysis of the Solar PV Market in Pakistan
5.1 Challenges and Opportunities for German PV Businesses
Figure 21: Challenges and Opportunities
5 Business Environment for German PV Businesses
Challenges Opportunities
Customer awareness needs to be increased to reduce price sensitivity amongst the different customer segments and disseminate the long-term benefits of investing in high quality certified equipment.
Net metering regime introduced by NEPRA in Sept 2015.This regime will incentivize commercial units, industry and household consumers to install PV and generate revenue by feeding back into the grid. Issuance of licenses for net metering has commenced.
High price sensitivity for European products. In the residential sector, customers are willing to pay approxima-tely 20% higher cost for European products compared to products from non-European brands. Industrial sector customers are willing to pay 30 to 40% higher cost while the Commercial sector is willing to pay 10-15% higher cost for European products compared to non-European products. On the other hand, the public sector always opts for the most cost-competitive product.
Lack of after-sales support network / in-country repair facilities weakens the sales strategy for such high-quality and expensive products and does not reassure the customer regarding after-sales support.
Limited technical expertise and product knowledge on complex yet highly efficient solar PV components leads to issues during commissioning for system configuration and also during operation.
Offering solar system components for Pakistan that are not ‘over-engineered’ but cater to the needs of the customers while remaining user friendly and are also cost competitive
Financing through recently announced Scheme for RE project financing by State Bank of Pakistan. Loans being offered at 6 percent for solar PV projects up to 50 MW (http://www.sbp.org.pk/smefd/circulars/2016/C3.htm)
Implementation of Import Quality Standards is expected to commence very soon. As a result, it will ensure reduction in uncertified solar PV components in the market and help promote quality certified products
German-made products enjoy high level of trust and reliability in all customer segments of the Pakistani solar PV market. Grid-tied systems are prime targets for German products.
The focus should be on large industry (textile, sports, pharmaceutical etc.) due to high interest in installing bankable certified high-quality reliable equipment with the textile and sports industries being the mainstays of the Pakistani economy generating a high annual profit.
Solar pumping applications also possess considerable potential for projects in the pipeline from the public sector in Sindh and Baluchistan provinces.

Value Chain Analysis of the Solar PV Market in Pakistan – 35
5.2 Target Segments for German Products in Pakistan
The high-potential target segments for German pro-
ducts and services are provided in Figure 22 below.
The different value chain actors were consulted re-
garding the most effective strategy to be adopted by
German companies for engaging the solar PV market
in Pakistan.
Figure 22: Target Segments for German PV Products and Services
Products Services
Grid-tied inverters
For use in medium-scale (100 kW-1 MW) and large-scale (>1 MW) grid-connected projects set up by industrial and commercial sectors.
Price competitiveness with comparable products from other countries will be critical.
Technical consulting services
(techno-economic feasibility studies, grid connection studies, support in project tendering process, monitoring of commissioned projects, maintenance and operation of large scale grid-connected & medium-scale PV projects)
Batteries (flooded or AGM)
For residential sector and off-grid systems as well as commercial sector installations requiring battery backup. Installed system sizes are expected to scale up to utilize the economic benefits of net metering and will require larger battery banks.
Potential for high-quality batteries exists but price competitiveness with other comparable products will be critical.
PV testing & monitoring equipment (battery testers, PV panel testers, PV analysts, PV panel flash test equipment etc.)
EPC Companies
For developing both commercial sector (kW scale) and large scale (>1 MW) grid-connected projects
High-quality EPC contracting companies with a strong profile of developing large-scale projects are in high demand.

36 – Value Chain Analysis of the Solar PV Market in Pakistan
5.3 Proposed Modality for Engagement of German Products in Pakistan
Based on the discussions conducted with the stake-
holders of the PV value chain, some of the key as-
pects to be focused on by the German PV companies
for engaging the Pakistan market are as follows:
Large Inventory/storehouse of high-quality PV
products components must be available in the
country to instantly replace any malfunctioning
items that require replacement or repair.
After-sales services of high-quality manufacturers
should be available in Pakistan.
Join forces with existing sales channels of other
high-quality products from Germany such as the
automotive industry (for residential) or equipment
manufacturers (for industrial customers).
High-quality manufacturing firms should to provide
product information to the consumers to inform
them about the added value of their product.
Place advertising in very specialized magazines for
specific industrial target groups.
5.4 Business Conditions for PV Companies
Based on the SRO 263(I)/2011 issued by the Federal
Board of Revenue, Government of Pakistan (GoP) on
19 March, 2011, the import of PV equipment (panels,
inverters, batteries, charge controllers) into the
country is exempt from all duties.
However, the local battery industry is very powerful
and influential and has managed to convince the GoP
through the relevant departments (Engineering De-
velopment Board and Federal Board of Revenue) to
add a duty on the import of all types of battery into
the country. Nevertheless, the payment of the duty
on import batteries depends on the custom officials,
since they cannot judge whether a battery that arri-
ves at the port for evaluation of duties has been ma-
nufactured in Pakistan or not.
Generally, the import of PV panels, solar inverters
and charge controllers can be imported with the
least amount of hassle in terms of obtaining the tax
exemption. However, the import of batteries, even
when imported as part of a PV system design, can
be quite challenging, and the securing of the tax ex-
emption can never be guaranteed.

Value Chain Analysis of the Solar PV Market in Pakistan – 37
Annex A
Information on Key Energy Stakeholders in Pakistan
Annexes
S/NO NAME OF STAKEHOLDER CONTACT INFORMATION
1 Ministry of Water & Power (MoWP) http://www.mowp.gov.pk
2 Alternative Energy Development Board (AEDB) http://www.aedb.org
3 National Electric Power Regulatory Authority (NEPRA) http://www.nepra.org.pk
4 Central Power Purchasing Authority (CPPA) http://www.cppa.pk
5 National Transmission and Despatch Company (NTDC) http://www.ntdc.com.pk
6 Lahore Electric Supply Company (LESCO) http://lesco.gov.pk
7 Karachi Electric Supply Company (KESC) http://www.kesc.com.pk
8 Faisalabad Electric Supply Company (FESCO) http://www.fesco.com.pk
9 Multan Electric Power Company (MEPCO) http://www.mepco.com.pk
10 Islamabad Electric Supply Company (IESCO) http://www.iesco.com.pk
11 Gujranwala Electric Power Company (GEPCO) http://www.gepco.com.pk
12 Hyderabad Electric Supply Company (HESCO) http://www.hesco.gov.pk
13 Quetta Electric Supply Company (QESCO) http://www.qesco.com.pk
14 Peshawar Electric Supply Company (PESCO) http://pesco.gov.pk
15 Tribal Electric Supply Company (TESCO) Sukkur Electric Power Company (SEPCO) http://tesco.gov.pk
16 Sukkur Electric Power Company (SEPCO) http://www.sepco.com.pk
17 Pakistan Council for Renewable Energy Technologies (PCRET) Federal Board of Revenue (FBR) http://www.pcret.gov.pk
18 Federal Board of Revenue (FBR) http://www.fbr.gov.pk
19 Pakistan National Accreditation Council (PNAC) http://www.pnac.org.pk
20 Pakistan Standards & Quality Control Authority (PSQCA) http://www.psqca.com.pk
21 Punjab Energy Department http://www.energy.punjab.gov.pk
22 Sindh Energy Department http://www.sindhenergy.gov.pk
23 Pakhtunkhwa Energy Department http://www.kpkep.gov.pk
24 Gilgit Baltistan Energy Department http://www.gilgitbaltistan.gov.pk
25 PSA http://www.pakistansolarassociation.org
26 REAP http://www.reap.org.pk
27 USAID http://www.usaid.gov/pakistan
28 JICA http://www.jica.go.jp
29 ADB http://www.adb.org/countries/pakistan
30 KfW http://www.kfw-entwicklungsbank.de
31 EU http://www.ec/europa/eu
32 GIZ http://www.giz.de
33 UNDP http://www.pk.undp.org/
34 NUST (USPCAS-E) http://www.nust.edu.pk/CES
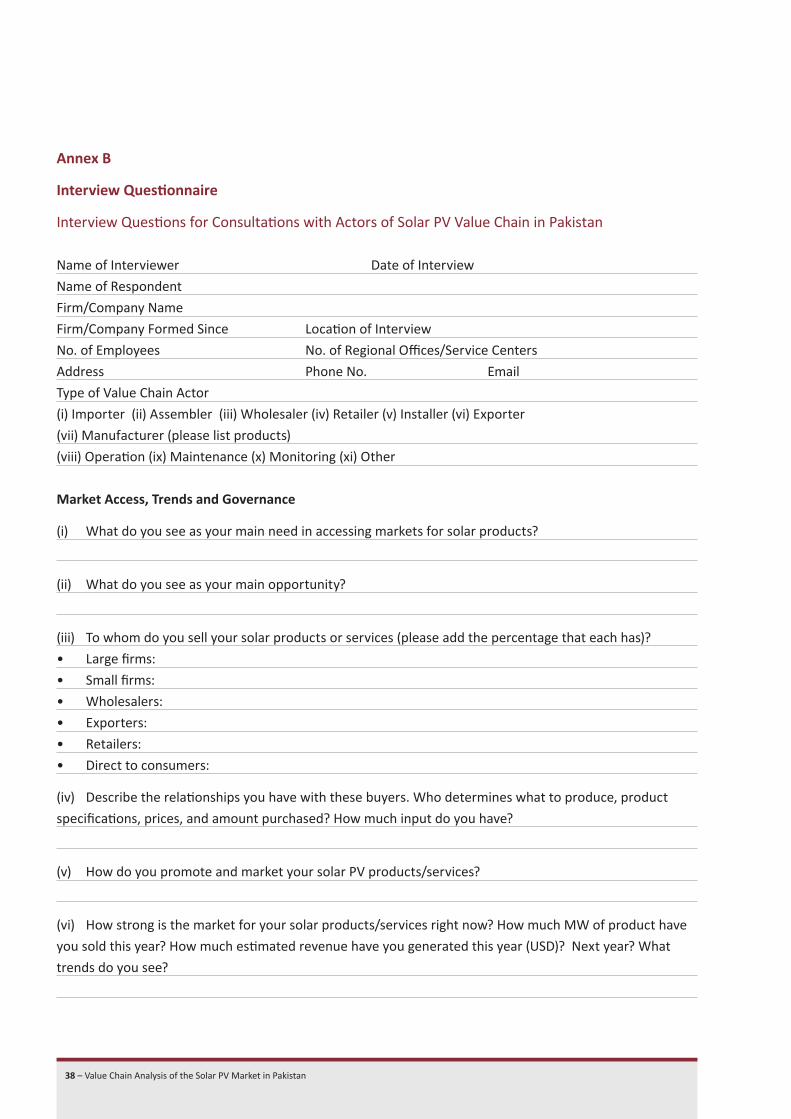
38 – Value Chain Analysis of the Solar PV Market in Pakistan
Annex B Interview Questionnaire Interview Questions for Consultations with Actors of Solar PV Value Chain in Pakistan
Name of Interviewer Date of Interview
Name of Respondent
Firm/Company Name
Firm/Company Formed Since Location of Interview
No. of Employees No. of Regional Offices/Service Centers
Address Phone No. Email
Type of Value Chain Actor
(i) Importer (ii) Assembler (iii) Wholesaler (iv) Retailer (v) Installer (vi) Exporter
(vii) Manufacturer (please list products)
(viii) Operation (ix) Maintenance (x) Monitoring (xi) Other
Market Access, Trends and Governance
(i) What do you see as your main need in accessing markets for solar products?
(ii) What do you see as your main opportunity?
(iii) To whom do you sell your solar products or services (please add the percentage that each has)?
• Large firms:
• Small firms:
• Wholesalers:
• Exporters:
• Retailers:
• Direct to consumers:
(iv) Describe the relationships you have with these buyers. Who determines what to produce, product
specifications, prices, and amount purchased? How much input do you have?
(v) How do you promote and market your solar PV products/services?
(vi) How strong is the market for your solar products/services right now? How much MW of product have
you sold this year? How much estimated revenue have you generated this year (USD)? Next year? What
trends do you see?

Value Chain Analysis of the Solar PV Market in Pakistan – 39
(vii) Are some customer groups better than others in terms of sales and revenue growth? If so, which ones?
(viii) How would you rank the quality awareness level of your customers on a scale of 1 to 10?
(1 being totally unaware and 10 being highly aware)
(ix) Are there any specific system components for which the customers demand quality?
If so, which components are they?
(x) Who are your major competitors?
Quality Awareness of Target Groups
(i) Which high-quality solar products do you see being popular and being sold in high volumes in Pakistan?
(ii) How much more, in percent, do you think the Pakistani population would be being willing to pay for
high-quality products compared to existing products available in the market?
(iii) What do you see as the crucial components for durable solar systems in Pakistan?
(iv) What proportion of the present solar components in the local market would you say are high-quality?
Which higher-quality components are generally locally available at present?
(v) What is your perspective regarding cost versus quality of local versus imported? What is the general
opinion of the consumers in this regard?
Standards and Certifications
(i) What standards or certification requirements do your solar products fulfill voluntarily?
(ii) Do your customers ever request you to provide details of certifications?
(iii) Are you in favor of complying with the soon-to-be-introduced quality import standards?
(iv) Once the standards are implemented, what proportion of the solar products available in the local
market do you expect to comply with these standards?

40 – Value Chain Analysis of the Solar PV Market in Pakistan
Technology / Product Development
(i) What are your major needs in product design and manufacturing (or service delivery)?
(ii) What are your major opportunities in product design and manufacturing (or service delivery)?
(iii) What percentage does each solar product represent in terms of your gross revenue?
(iv) What have you done recently to improve your solar products or services?
(v) Is your current equipment or machinery an impediment to growth? Explain. If so, what kind of equipment
or machinery could improve your business?
(vi) Is the current level of your workers’ training holding back growth? If so, what additional training do
they need?
Management/Organization
(i) In the area of organization and management, what are your major needs/opportunities?
(ii) Who has the operational responsibility for the following?
Please specify if this is a) the owner; b) employees or c) external:
a. General management/supervision:
b. Product design:
d. Production:
g. Marketing:
h. After-sales services:
i. Repairs
(iii) Do you presently or would you consider collaborating with other firms to produce and deliver custo-
mer orders? If so, what possible types of synergies do you envision?
(iv) Which aspects of your business do you intend to change in the next 2 years (machinery, equipment,
computers, new products, marketing strategy, quality control, management system, worker skills, etc.)?
(v) What management skills would you like to strengthen in order to grow your business?

Value Chain Analysis of the Solar PV Market in Pakistan – 41
Input Supply
(i) What are your major needs in the areas of input cost, quality, and availability?
(ii) What are your major opportunities in the areas of input cost, quality, and availability?
(iii) Who are your most important suppliers and what do you buy from each?
(iv) Are there problems in obtaining some important inputs? Explain.
(v) Have you ever purchased inputs jointly with other business? Explain.
Imported Items
(i) Please specify the country from where the following products are imported?
PV panels:
Inverters:
Batteries:
Charge controllers:
Wiring:
Others (mention here):
(ii) Why are you importing products?
a. Products are not locally produced:
b. Products have better quality:
c. Other:
(iii) What specific criteria are being used to select the products to be imported? (price, quality, proximity
etc.?)
(iv) What are the key obstacles/barriers faced by your business relating to the import of solar PV equip-
ment into the country?
(v) What possible suggestions do you see to remove these obstacles/barriers?

42 – Value Chain Analysis of the Solar PV Market in Pakistan
Finance
(i) Where do you go when you need money for your business?
(ii) Do you get credit from input suppliers? What are the terms?
(iii) Do you get production financing from your buyers? What are the terms?
(iv) Do you have a need for additional financing at the moment? If so, what would it be used for?
(v) What sources (formal or informal) have you approached for loans, and what have been the key problems,
if any?
(vi) Other (repayment rates in the sector, risk management insurance, etc.)
Policy/Regulation
(i) What government policies/regulations benefit your business (registrations, inspections, subsidies,
incentives, etc.)?
(ii) What government policies/regulations are obstacles to growing your business?
Infrastructure
(i) What are the most important infrastructure constraints affecting your business’ growth and profitabili-
ty (road/transport conditions, telephone service, electric supply, crime/corruption, storage, etc.)?
(ii) What is your industry doing about these problems?

Value Chain Analysis of the Solar PV Market in Pakistan – 43
Business Membership Organizations
(i) Is your solar PV sector represented by national or local business associations?
If so, please name them.
(ii) Are you a member? If not, why?
(iii) What are the primary functions and benefits of these associations?
(iv) What additional services should they provide?
Open-ended Questions
(i) Which are the high-potential areas for solar PV products in Pakistan?
(ii) What are the preferences of the different customer segments regarding product qualities?
Commercial
Residential
Industrial
Govt. buildings (schools, district administration offices etc.)
(iii) Payback time expectations of each customer segment
Commercial
Residential
Industrial
Govt. buildings (schools, district administration offices etc.)
44 – Value Chain Analysis of the Solar PV Market in Pakistan
(iv) How do you see the business environment in the country for solar businesses?
(v) What are the major incentives you have for investing in / promoting change in the solar PV value chain?
(vi) What risks or constraints do you face in making these investments?
(vii) What do you think are the strengths of the solar PV industry, locally and/or internationally?
(viii) What are the main weaknesses of the solar PV industry in Pakistan?
(ix) What do you think is the greatest challenge facing the solar PV industry today in Pakistan?
(x) Can you name some business owners in the solar PV industry who are leaders – in terms of technology,
product design, quality, or marketing, for example?
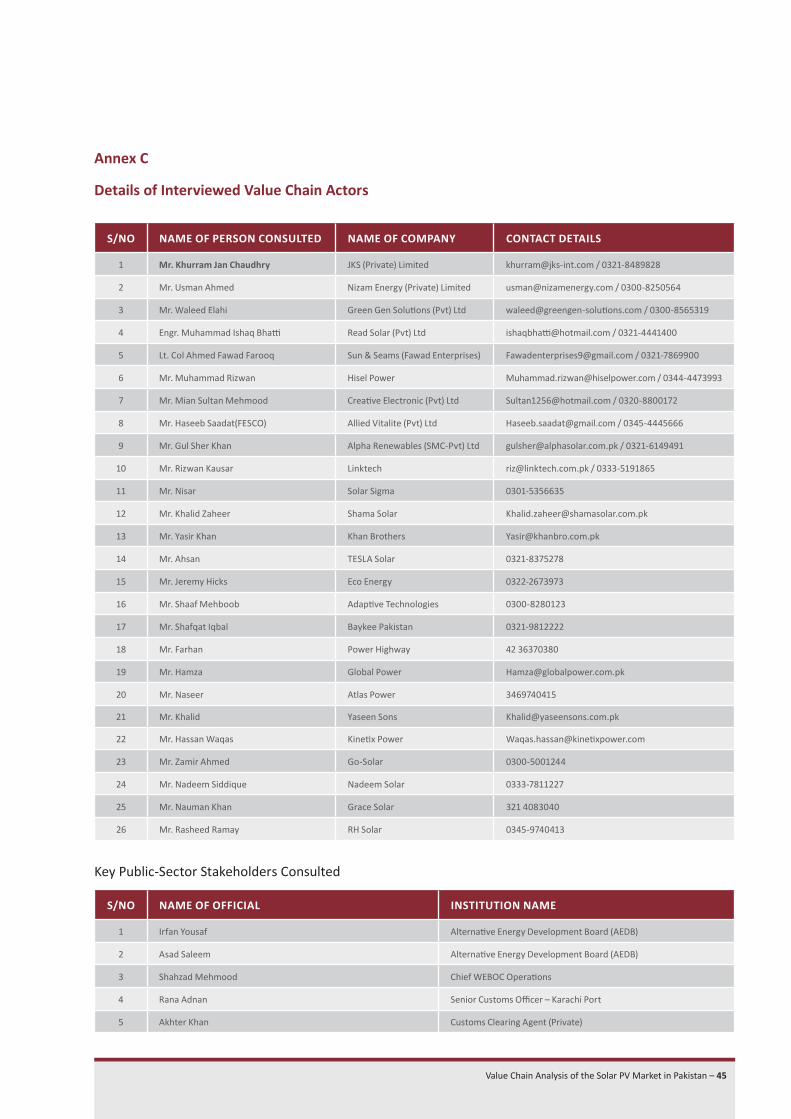
Value Chain Analysis of the Solar PV Market in Pakistan – 45
Annex C
Details of Interviewed Value Chain Actors
Key Public-Sector Stakeholders Consulted
S/NO NAME OF PERSON CONSULTED NAME OF COMPANY CONTACT DETAILS
1 Mr. Khurram Jan Chaudhry JKS (Private) Limited [email protected] / 0321-8489828
2 Mr. Usman Ahmed Nizam Energy (Private) Limited [email protected] / 0300-8250564
3 Mr. Waleed Elahi Green Gen Solutions (Pvt) Ltd [email protected] / 0300-8565319
4 Engr. Muhammad Ishaq Bhatti Read Solar (Pvt) Ltd [email protected] / 0321-4441400
5 Lt. Col Ahmed Fawad Farooq Sun & Seams (Fawad Enterprises) [email protected] / 0321-7869900
6 Mr. Muhammad Rizwan Hisel Power [email protected] / 0344-4473993
7 Mr. Mian Sultan Mehmood Creative Electronic (Pvt) Ltd [email protected] / 0320-8800172
8 Mr. Haseeb Saadat(FESCO) Allied Vitalite (Pvt) Ltd [email protected] / 0345-4445666
9 Mr. Gul Sher Khan Alpha Renewables (SMC-Pvt) Ltd [email protected] / 0321-6149491
10 Mr. Rizwan Kausar Linktech [email protected] / 0333-5191865
11 Mr. Nisar Solar Sigma 0301-5356635
12 Mr. Khalid Zaheer Shama Solar [email protected]
13 Mr. Yasir Khan Khan Brothers [email protected]
14 Mr. Ahsan TESLA Solar 0321-8375278
15 Mr. Jeremy Hicks Eco Energy 0322-2673973
16 Mr. Shaaf Mehboob Adaptive Technologies 0300-8280123
17 Mr. Shafqat Iqbal Baykee Pakistan 0321-9812222
18 Mr. Farhan Power Highway 42 36370380
19 Mr. Hamza Global Power [email protected]
20 Mr. Naseer Atlas Power 3469740415
21 Mr. Khalid Yaseen Sons [email protected]
22 Mr. Hassan Waqas Kinetix Power [email protected]
23 Mr. Zamir Ahmed Go-Solar 0300-5001244
24 Mr. Nadeem Siddique Nadeem Solar 0333-7811227
25 Mr. Nauman Khan Grace Solar 321 4083040
26 Mr. Rasheed Ramay RH Solar 0345-9740413
S/NO NAME OF OFFICIAL INSTITUTION NAME
1 Irfan Yousaf Alternative Energy Development Board (AEDB)
2 Asad Saleem Alternative Energy Development Board (AEDB)
3 Shahzad Mehmood Chief WEBOC Operations
4 Rana Adnan Senior Customs Officer – Karachi Port
5 Akhter Khan Customs Clearing Agent (Private)
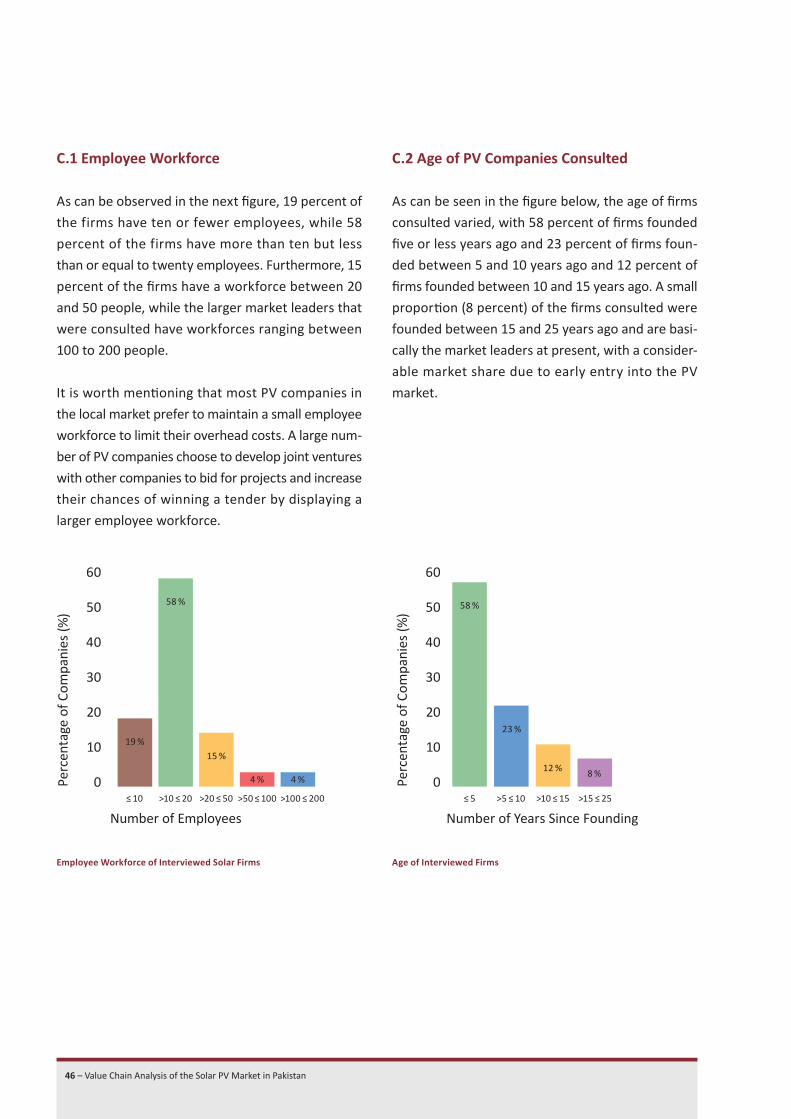
46 – Value Chain Analysis of the Solar PV Market in Pakistan
C.1 Employee Workforce
As can be observed in the next figure, 19 percent of
the firms have ten or fewer employees, while 58
percent of the firms have more than ten but less
than or equal to twenty employees. Furthermore, 15
percent of the firms have a workforce between 20
and 50 people, while the larger market leaders that
were consulted have workforces ranging between
100 to 200 people.
It is worth mentioning that most PV companies in
the local market prefer to maintain a small employee
workforce to limit their overhead costs. A large num-
ber of PV companies choose to develop joint ventures
with other companies to bid for projects and increase
their chances of winning a tender by displaying a
larger employee workforce.
C.2 Age of PV Companies Consulted
As can be seen in the figure below, the age of firms
consulted varied, with 58 percent of firms founded
five or less years ago and 23 percent of firms foun-
ded between 5 and 10 years ago and 12 percent of
firms founded between 10 and 15 years ago. A small
proportion (8 percent) of the firms consulted were
founded between 15 and 25 years ago and are basi-
cally the market leaders at present, with a consider-
able market share due to early entry into the PV
market.
Employee Workforce of Interviewed Solar Firms Age of Interviewed Firms
60
Number of Years Since Founding
Perc
enta
ge o
f Com
pani
es (%
) 50
40
30
20
10
0 ≤ 5
58 %
23 %
12 % 8 %
>5 ≤ 10 >10 ≤ 15 >15 ≤ 25
60
Perc
enta
ge o
f Com
pani
es (%
)
Number of Employees
50
40
30
20
10
0 ≤ 10
19 %
15 %
4 % 4 %
58 %
>10 ≤ 20 >20 ≤ 50 >50 ≤ 100 >100 ≤ 200

Value Chain Analysis of the Solar PV Market in Pakistan – 47
C.3 Annual Turnover of Companies Consulted
The distribution of annual turnover of the PV busi-
nesses consulted is depicted in the figure below.
Considering the market turbulence in the local mar-
ket due to the reduction in oil prices and the general
slowing of business in the past year, 63 percent of
the businesses reported turnovers of less than 1 mil-
lion USD. By comparison, 13 percent of the busines-
ses reported turnovers between 1 and 5 million USD
with 19 percent of the solar businesses having a
turn over of between 5 and 10 million USD.
Only 5 percent of businesses mentioned turnovers
of over 10 million USD.
C.4 Types of PV Businesses/Companies Consulted
The breakdown of the type of PV businesses and
companies consulted is shown in the next figure:
Annual Turnover of Companies Consulted Types of PV Businesses Consulted
100
90
80
70
60
Type of Value Chain Actors Consulted
Perc
enta
ge o
f Com
pani
es (%
)
50
40
30
20
10
0 8 %
96 %
38 %
77 %
100 %
4 %
Assembler Importer Wholesaker Retailer Installer Monitoring
70
Million USD
Perc
enta
ge o
f Com
pani
es (%
) 60
50
40
30
20
10
0
63 %
13 %19 %
5 %
≤ 1 > 1 ≤ 5 > 5 ≤ 10 > 10

48 – Value Chain Analysis of the Solar PV Market in Pakistan
C.5 Allocation of Management Tasks
The allocation of different management tasks based
on the solar businesses consulted is provided in the
figure below. As can be observed, the general trends
observed consist of the general management con-
ducted by the owners of the businesses themselves.
The responses obtained showed that ‘product de-
sign’ is conducted either solely by the owner (37.5
percent) or the employee (63 percent) and also joint-
ly by both the owner and employee (36 percent).
Similarly, with regards to ‘purchasing’, 25 percent of
the firms mentioned use their employees for this
part of their business, while the 37.5 percent of the
firms interviewed stated that ‘owner and employee’
jointly conduct this particular task. It was observed
that ‘Shipping’ is taken care of by the employee in
the majority of the responses received, while routine
tasks such as ‘accounting’ are also conducted com-
pletely by the employees. ‘Marketing’ is managed
jointly by the ‘owner and employee,’ while ‘after-
sales service’ is also conducted jointly.
Allocation of Management Tasks
100 %
90 %
80 %
70 %
60 %
50 %
40 %
30 %
20 %
10 %
0 %
100 %
63 %
37 % 37,5 %
25 %
37,5 %
88 %
100 %
12 % 12 %
38 %
50 %
63 %
37 %
Owner
Employee
Owner & Employee
Product Design Purchasing Shipping Accounting Marketing Aftersales serviceGen Management

Value Chain Analysis of the Solar PV Market in Pakistan – 49
Annex D
Import Quality Standards for Solar PV in Pakistan26
IEC Quality Standards
26 To be implemented soon.
S/NO IEC STANDARDS TITLE
1 IEC 61646:2008 Thin-film terrestrial photovoltaic (PV) modules design qualification and type approval
2 IEC 61439-1:2011 Low-voltage switchgear and control gear assemblies – Part 1: General rules
3 IEC 60947-3:2008+A1:2012 Low voltage switchgear and control gear – Part 3: switches, disconnections, switch disconnections and fuse combination units
4 IEC: 62103:2003 Electronic equipment for use in power installations (e.g. EN 50178:1998)
5 IEC: 62930 Electric cables for photovoltaic systems (BT(DE/NOT)258) (e.g. EN 50618)
6 IEC 62103 (2003-07) Ed.1.0 Electronic equipment for use in power installations
7 IEC 61701:2011 Salt mist corrosion testing of photovoltaic (PV) modules
8 IEC 62116:2014 Protection against islanding of grid (utility-interconnected photo-voltaic inverters – test procedure of islanding prevention measures)
9 IEC 61683: 1999 Photovoltaic systems – Power conditioners – Procedure for measuring efficiency
10 IEC 62509:2010 Battery charge controllers for photovoltaic systems – Performance and functioning
11 IEC 62093:2005 Balance-of-system components for photovoltaic systems – natural environments
12 IEC 62124: 2004 Photovoltaic (PV) stand-alone systems – Design verification
13 IEC 62253: 2011 Photovoltaic pumping systems – Design qualification and performance measurements
14 IEC 62257 (2013)Recommendations for small renewable energy and hybrid systems for rural electrification – Part 1: General introduction to IEC 62257 series and rural electrification
15 IEC/TS 62257-9-5: 2013 (E)Recommendations for small renewable energy and hybrid systems for rural electrification – Part 9-5: Integrated system – Selection of stand-alone lighting kits for rural electrification

50 – Value Chain Analysis of the Solar PV Market in Pakistan
IEC Safety Standards
IEC Environmental Standards
The following standards have already been adopted:
IEC: 61215 for crystalline silicon terrestrial photovoltaic (PV) modules - design qualification and type approval.
IEC: 60529 for degrees of protection provided by enclosures (IP Code).
S/NO IEC STANDARDS TITLE
1 IEC 62109-1:2010 Safety of power converters for use in photovoltaic power systems – Part 1: General requirements
2 IEC 62109-2:2011 Safety of power converters for use in photovoltaic power systems – Part 2: Particular requirements for inverters
3 IEC 61730-1:2004 Photovoltaic (PV) module safety qualification – Part 1: Requirements for construction
4 IEC 61730-2:2004 Photovoltaic (PV) module safety qualification – Part 2: Requirements for testing
5 IEC 61439-1: 2011 Low-voltage switchgear and Control gear assemblies – Part 1: General rules

Value Chain Analysis of the Solar PV Market in Pakistan – 51

Deutsche Gesellschaft für
Internationale Zusammenarbeit (GIZ) GmbH
GIZ Pakistan – Country Office
House 23, Street 55, F-7/4, 44000 Islamabad - Pakistan
Tel: +92 51 8351102, 8358913-14
Fax: +92 51 8351103
Email: [email protected]
Internet: www.giz.de/pakistan