· py 2009 py 2010 py 2011 py 2012 4/1/13-3/31/14 total exiters, all programs 1,730,082 1,809,291...
TRANSCRIPT

1333 Broadway, Suite 301 Oakland, CA 94612
Tel: (510) 763-1499
Fax: (510) 763-1599 www.spra.com
• • • • • • • • • • • • • • • • • • • • • • • • • • • • • • • • • • • • • • • • • • • • • • • • • • • • • • • • • • • • • • • • • • • • • • • • • •
S O C I A L P O L I C Y R E S E A R C H A S S O C I A T E S
Prepared for:
Office of Performance and Technology Employment and Training Administration US Department of Labor 200 Constitution Ave. NW Washington DC 20210
Contract Number: GS10F0281S Order Number: DOLF091A20934
Project No. 1252
PY 2013 WIA Trends Over Time March 16, 2015
Prepared by:
Social Policy Research Associates


Social Policy Research Associates 3
Part I Summary Comparisons Across Programs

Social Policy Research Associates
4
Table I-1
Trends in the Number of Exiters, by Program of Participation (Derived from PY 2013Q4 WIASRD Records)
PY 2009 PY 2010 PY 2011 PY 2012 4/1/13-3/31/14
Total exiters, all programs 1,730,082 1,809,291 1,734,957 1,694,924 1,555,221 Local programs 1,571,202 1,636,882 1,648,042 1,670,198 1,537,520 Statewide programs 57,893 94,964 62,721 33,339 21,699 NEG programs 23,768 24,987 31,274 27,302 22,281
Total adults 1,187,450 1,252,411 1,218,275 1,200,782 1,076,347 Local programs 1,167,070 1,216,901 1,203,039 1,193,273 1,071,905 Statewide programs 26,754 50,490 28,093 10,927 6,090
Total dislocated workers 581,985 760,853 754,108 705,589 669,117 Local programs 561,923 745,155 732,560 686,766 654,050 Statewide programs 20,462 28,730 28,337 17,541 12,685 NEG programs 23,768 24,987 31,274 27,302 22,281
Disaster Relief 3,020 2,665 3,082 1,363 838 Other 20,748 22,322 28,192 25,939 21,443
Total youth 133,564 139,323 122,642 109,695 102,971 Local programs 5,785 7,150 65,250 108,074 102,515 Statewide programs 11,142 16,351 6,915 5,047 3,030
Total younger youth 91,878 95,401 81,581 70,207 66,348 Local programs 4,538 5,725 42,518 68,731 65,947 Statewide programs 8,847 13,204 5,077 3,891 2,130
Total older youth 41,686 43,922 41,061 39,488 36,623 Local programs 1,247 1,425 22,732 39,343 36,568 Statewide programs 2,295 3,147 1,838 1,156 900

Social Policy Research Associates 5
Table I-2 Number of Exiters from April 2013 to March 2014, by State and Program of Participation
(Derived from PY 2013Q4 WIASRD Records)
Total, All Programs
Adult
Dislocated Worker
Younger Youth
Older Youth
Nation 1,555,221 1,076,347 669,117 66,348 36,623 Alabama 5,869 2,517 1,391 1,038 985 Alaska 438 198 101 88 60 Arizona 5,715 2,884 1,427 869 557 Arkansas 1,735 618 407 578 138 California 66,118 29,956 23,287 8,534 5,906 Colorado 4,386 1,957 1,067 767 611 Connecticut 3,025 973 1,576 264 226 Delaware 811 290 304 168 52 District of Columbia 586 362 71 85 86 Florida 27,561 14,566 8,098 3,038 2,287 Georgia 10,634 4,567 3,027 2,165 1,031 Hawaii 627 224 261 125 38 Idaho 1,727 404 719 413 218 Illinois 12,270 3,659 5,411 1,819 1,419 Indiana 41,367 38,733 6,358 2,006 890 Iowa 30,335 29,227 9,932 304 236 Kansas 6,135 4,904 995 407 315 Kentucky 6,970 2,642 2,464 1,323 601 Louisiana 62,175 59,643 3,096 422 438 Maine 1,420 562 503 211 169 Maryland 4,335 1,741 2,156 697 319 Massachusetts 6,255 1,441 3,478 1,016 446 Michigan 15,518 7,524 3,797 3,319 880 Minnesota 5,112 1,042 2,568 1,123 394 Mississippi 11,187 4,929 4,292 1,368 644 Missouri 232,182 230,997 136,738 1,261 821 Montana 966 367 464 157 57 Nebraska 882 382 210 115 188 Nevada 6,553 2,659 1,501 1,844 593 New Hampshire 1,210 346 693 141 30 New Jersey 10,070 3,437 4,639 1,801 510 New Mexico 2,081 1,109 355 456 178 New York 533,596 264,713 276,808 2,684 1,898 North Carolina 23,476 17,760 3,167 1,555 1,059 North Dakota 437 233 54 98 63 Ohio 13,976 7,626 4,149 1,889 814

Social Policy Research Associates
6
Total, All Programs
Adult
Dislocated Worker
Younger Youth
Older Youth
Oklahoma 46,675 44,736 2,152 482 382 Oregon 143,813 142,587 114,935 933 375 Pennsylvania 20,480 8,218 8,017 3,355 1,741 Puerto Rico 14,976 5,644 1,586 5,932 1,944 Rhode Island 1,500 452 625 315 119 South Carolina 9,541 5,566 2,037 1,030 1,020 South Dakota 1,096 607 228 114 153 Tennessee 11,484 4,561 4,045 2,167 1,038 Texas 33,945 23,519 6,473 2,997 2,353 Utah 86,342 85,791 1,042 762 410 Vermont 660 269 112 240 42 Virgin Islands 930 202 629 52 53 Virginia 6,611 2,698 2,420 1,038 514 Washington 9,531 3,332 3,984 1,491 791 West Virginia 1,764 470 909 287 135 Wisconsin 7,476 2,224 4,287 759 324 Wyoming 657 279 72 246 72

Social Policy Research Associates 7
Table I-3 Number of Exiters from April 2013 to March 2014, by Selected Characteristics
(Derived from PY 2013Q4 WIASRD Records)
Total, All Programs
Adult
Dislocated Worker
Younger Youth
Older Youth
Number of exiters 1,555,221 1,076,347 669,117 66,348 36,623 Age categories
14 to 17 43,241 490 139 43,026 18 to 21 156,701 91,474 19,235 23,322 36,623 22 to 29 322,739 256,449 118,694 30 to 44 483,087 355,367 224,958 45 to 54 309,663 214,468 164,533 55 and over 239,771 158,081 141,552 Not reported 19 18 6
Gender Female 755,959 517,079 324,022 35,571 19,964 Male 774,806 546,133 334,132 30,383 15,934 Not reported 24,456 13,135 10,963 394 725
Disability status Without disabilities 1,391,363 969,640 615,257 54,900 32,714 With disabilities 77,843 51,758 23,148 10,134 3,265 Not reported 86,015 54,949 30,712 1,314 644
Race and ethnicity Hispanic 212,051 116,537 85,179 19,309 9,430 Not Hispanic 1,261,417 912,508 542,058 44,694 25,716 American Indian or Alaskan Native (only)
19,539 16,017 4,722 1,052 569
Asian (only) 35,999 19,597 19,100 1,333 483 Black or African American (only)
360,246 250,301 121,364 20,454 12,940
Hawaiian or other Pacific Islander (only)
5,179 4,137 1,747 191 91
White (only) 804,009 595,237 380,226 20,128 10,747 More than one race 36,445 27,219 14,899 1,536 886 Not reported 81,753 47,302 41,880 2,345 1,477
Veteran status Veteran 101,065 77,068 47,964 75 108 Nonveteran 1,451,314 998,929 620,975 63,953 36,514 Not reported 2,842 350 178 2,320 1
Employed at participation Employed 221,507 185,033 61,804 3,959 4,536 Not employed or received layoff notice
1,333,714 891,314 607,313 62,389 32,087
Not reported

Social Policy Research Associates
8
Table I-4 Trends Over Time in the Number of Adult Exiters, by State
(Derived from PY 2013Q4 WIASRD Records)
PY 2009 PY 2010 PY 2011 PY 2012 4/1/13-3/31/14
Nation 1,187,450 1,252,411 1,218,275 1,200,782 1,076,347 Alabama 3,245 2,759 3,045 2,964 2,517 Alaska 476 343 267 193 198 Arizona 3,198 2,953 3,161 3,436 2,884 Arkansas 1,416 1,124 749 668 618 California 82,706 69,714 45,883 38,421 29,956 Colorado 2,245 2,215 2,034 1,960 1,957 Connecticut 793 1,346 1,122 863 973 Delaware 520 505 271 296 290 District of Columbia 867 1,179 994 680 362 Florida 18,692 19,333 14,230 14,591 14,566 Georgia 3,453 4,409 4,210 4,847 4,567 Hawaii 375 452 264 231 224 Idaho 643 519 566 610 404 Illinois 7,606 5,927 5,776 5,203 3,659 Indiana 132,813 114,618 43,045 34,751 38,733 Iowa 6,300 12,913 23,436 28,496 29,227 Kansas 11,371 7,236 5,399 5,756 4,904 Kentucky 4,114 3,862 2,650 2,901 2,642 Louisiana 121,194 85,551 63,370 61,821 59,643 Maine 399 477 437 622 562 Maryland 1,800 2,018 2,293 1,936 1,741 Massachusetts 2,468 4,001 1,878 1,787 1,441 Michigan 13,790 15,649 8,956 7,683 7,524 Minnesota 1,915 1,855 1,150 1,228 1,042 Mississippi 30,091 16,812 15,470 6,237 4,929 Missouri 4,031 197,029 265,214 258,192 230,997 Montana 378 14,663 23,563 352 367 Nebraska 553 484 442 395 382 Nevada 1,856 3,120 2,040 2,448 2,659 New Hampshire 540 457 269 302 346 New Jersey 3,327 4,427 4,164 4,180 3,437 New Mexico 2,564 1,428 1,832 1,183 1,109 New York 334,721 274,068 259,645 265,851 264,713 North Carolina 5,285 4,576 3,244 3,142 17,760 North Dakota 717 539 255 191 233 Ohio 12,983 10,103 10,636 8,651 7,626 Oklahoma 57,431 54,181 54,306 60,340 44,736

Social Policy Research Associates 9
PY 2009 PY 2010 PY 2011 PY 2012 4/1/13-3/31/14 Oregon 149,275 192,304 204,878 164,101 142,587 Pennsylvania 4,659 7,199 7,258 6,610 8,218 Puerto Rico 7,543 8,609 8,312 5,773 5,644 Rhode Island 891 1,167 644 436 452 South Carolina 12,355 9,207 5,984 5,736 5,566 South Dakota 642 648 665 736 607 Tennessee 8,931 8,811 4,455 4,578 4,561 Texas 21,413 20,535 11,366 25,894 23,519 Utah 94,902 49,777 89,638 144,072 85,791 Vermont 483 315 113 263 269 Virgin Islands 515 501 54 121 202 Virginia 2,106 3,095 2,698 2,882 2,698 Washington 3,155 3,295 2,585 2,792 3,332 West Virginia 1,073 1,135 832 579 470 Wisconsin 2,219 2,561 2,220 2,522 2,224 Wyoming 412 407 307 279 279

Social Policy Research Associates
10
Table I-5 Trends Over Time in the Number of Dislocated Worker Exiters from Local and Statewide Programs,
by State (Derived from PY 2013Q4 WIASRD Records)
PY 2009 PY 2010 PY 2011 PY 2012 4/1/13-3/31/14
Nation 570,144 752,705 741,623 693,634 658,970 Alabama 1,999 2,070 2,357 1,652 1,338 Alaska 383 226 166 108 101 Arizona 2,697 2,787 2,422 1,960 1,419 Arkansas 582 683 467 265 271 California 42,980 45,940 26,591 25,274 22,545 Colorado 725 1,223 1,050 1,062 1,067 Connecticut 923 2,332 1,914 1,400 1,576 Delaware 535 653 329 305 271 District of Columbia 211 392 339 214 71 Florida 4,517 8,818 8,724 7,884 6,628 Georgia 3,126 5,554 4,099 4,203 2,942 Hawaii 419 358 331 324 260 Idaho 716 823 758 721 583 Illinois 8,349 9,208 10,073 7,356 5,357 Indiana 26,532 24,894 11,556 8,206 6,352 Iowa 1,955 1,411 5,916 9,163 9,920 Kansas 2,052 1,877 1,384 1,402 983 Kentucky 2,532 4,090 3,383 2,382 1,868 Louisiana 7,091 3,570 1,779 2,495 2,614 Maine 707 684 641 572 459 Maryland 1,730 1,875 2,100 2,308 2,156 Massachusetts 4,694 4,911 3,961 3,487 2,855 Michigan 8,482 9,910 7,223 5,046 3,532 Minnesota 4,709 5,120 3,841 2,628 2,539 Mississippi 25,957 18,411 12,688 4,214 3,909 Missouri 4,219 104,854 144,564 143,934 136,625 Montana 543 922 850 537 464 Nebraska 508 491 454 284 206 Nevada 1,465 2,646 1,645 1,371 1,501 New Hampshire 920 856 674 662 689 New Jersey 5,005 6,962 5,679 4,749 3,865 New Mexico 288 421 501 481 349 New York 213,532 219,038 242,030 266,298 276,470 North Carolina 5,749 6,684 4,095 3,060 3,161 North Dakota 238 236 116 92 54 Ohio 9,962 10,301 8,217 5,272 4,082

Social Policy Research Associates 11
PY 2009 PY 2010 PY 2011 PY 2012 4/1/13-3/31/14 Oklahoma 20,335 15,631 4,412 894 645 Oregon 101,626 169,889 167,645 132,089 114,930 Pennsylvania 8,966 11,567 11,155 8,465 7,812 Puerto Rico 4,099 4,165 4,202 2,029 1,540 Rhode Island 1,774 1,650 1,131 753 552 South Carolina 8,034 6,036 3,408 2,585 2,036 South Dakota 533 532 448 385 228 Tennessee 4,215 4,989 3,880 4,250 3,727 Texas 9,820 9,957 7,280 7,126 6,303 Utah 961 889 798 1,413 1,042 Vermont 393 209 65 135 100 Virgin Islands 223 232 72 81 187 Virginia 3,153 4,486 4,412 3,665 2,419 Washington 3,333 3,937 3,492 3,144 3,476 West Virginia 1,615 1,709 1,472 977 888 Wisconsin 3,984 5,507 4,754 4,201 3,931 Wyoming 48 89 80 71 72

Social Policy Research Associates
12
Table I-6 Trends Over Time in the Number of Exiters from NEG Projects, by State
(Derived from PY 2013Q4 WIASRD Records)
PY 2009 PY 2010 PY 2011 PY 2012 4/1/13-3/31/14
Nation 23,768 24,987 31,274 27,302 22,281 Alabama 2,212 83 382 218 117 Alaska 4 1 51 53 29 Arizona 49 127 79 31 Arkansas 202 126 379 30 136 California 772 1,209 2,166 4,213 2,893 Colorado 2 60 52 61 Connecticut 152 335 169 115 102 Delaware 74 359 138 98 56 District of Columbia 72 46 58 88 27 Florida 444 542 1,088 1,509 1,789 Georgia 148 75 497 212 99 Hawaii 425 135 52 36 9 Idaho 435 603 386 260 184 Illinois 845 890 519 294 134 Indiana 389 298 310 73 123 Iowa 1,424 739 1,206 603 310 Kansas 148 383 381 366 217 Kentucky 176 136 530 337 740 Louisiana 1,623 642 1,061 1,044 769 Maine 615 676 722 197 59 Maryland 1 130 600 674 Massachusetts 783 938 1,309 1,482 1,189 Michigan 1,066 2,677 2,408 1,618 912 Minnesota 385 1,031 804 238 388 Mississippi 2,916 883 1,012 519 427 Missouri 1,108 1,766 2,466 1,538 1,096 Montana 61 73 56 45 52 Nebraska 53 21 4 Nevada 5 New Hampshire 77 70 134 102 92 New Jersey 123 67 783 624 858 New Mexico 7 18 5 8 New York 426 622 570 1,139 929 North Carolina 1,248 317 426 86 14 North Dakota Ohio 845 1,485 1,246 539 274 Oklahoma 6 10 109 357 1,527

Social Policy Research Associates 13
PY 2009 PY 2010 PY 2011 PY 2012 4/1/13-3/31/14 Oregon 1,379 1,855 1,380 490 301 Pennsylvania 724 1,015 807 853 522 Puerto Rico 799 935 908 67 Rhode Island 7 68 84 South Carolina 3 8 89 140 42 South Dakota 8 80 70 32 Tennessee 8 714 1,116 1,621 1,378 Texas 1,526 1,340 2,559 1,005 611 Utah 3 26 28 Vermont 4 46 111 13 Virgin Islands 1 92 456 Virginia 150 371 288 339 92 Washington 118 53 337 1,079 935 West Virginia 50 32 22 127 168 Wisconsin 595 1,487 1,780 1,609 1,246 Wyoming

Social Policy Research Associates
14
Table I-7 Trends Over Time in the Number of Youth Exiters, by State
(Derived from PY 2013Q4 WIASRD Records)
PY 2009 PY 2010 PY 2011 PY 2012 4/1/13-3/31/14
Nation 133,564 139,323 122,642 109,695 102,971 Alabama 888 1,019 1,109 1,481 2,023 Alaska 639 562 351 220 148 Arizona 1,576 2,090 1,646 1,890 1,426 Arkansas 1,066 1,213 834 760 716 California 14,817 19,240 15,562 16,608 14,440 Colorado 1,423 1,460 1,348 1,404 1,378 Connecticut 583 715 731 451 490 Delaware 148 359 214 277 220 District of Columbia 153 168 252 232 171 Florida 5,715 7,286 5,757 5,851 5,325 Georgia 2,459 3,214 3,327 3,333 3,196 Hawaii 274 202 239 162 163 Idaho 475 494 458 572 631 Illinois 6,163 3,885 4,817 4,678 3,238 Indiana 3,590 4,373 3,011 3,037 2,896 Iowa 565 628 654 501 540 Kansas 694 653 581 661 722 Kentucky 1,690 2,631 2,087 2,215 1,924 Louisiana 1,330 1,065 1,312 1,022 860 Maine 348 416 467 408 380 Maryland 789 844 1,154 1,022 1,016 Massachusetts 2,020 1,966 1,653 1,578 1,462 Michigan 6,792 7,123 5,749 4,495 4,199 Minnesota 1,919 2,040 2,034 1,649 1,517 Mississippi 4,088 3,656 2,709 2,070 2,012 Missouri 1,877 2,300 2,387 2,679 2,082 Montana 200 327 224 166 214 Nebraska 401 439 332 279 303 Nevada 232 610 570 1,264 2,437 New Hampshire 425 334 214 216 171 New Jersey 1,816 2,144 2,794 2,606 2,311 New Mexico 900 885 898 746 634 New York 8,273 9,826 5,249 5,335 4,582 North Carolina 1,828 2,232 2,339 2,163 2,614 North Dakota 420 411 184 217 161 Ohio 6,057 5,507 5,896 3,255 2,703 Oklahoma 743 793 717 826 864

Social Policy Research Associates 15
PY 2009 PY 2010 PY 2011 PY 2012 4/1/13-3/31/14 Oregon 1,636 1,649 1,598 1,198 1,308 Pennsylvania 4,004 4,365 4,905 4,540 5,096 Puerto Rico 15,967 17,707 16,079 8,994 7,876 Rhode Island 718 968 572 340 434 South Carolina 3,358 2,742 2,280 2,006 2,050 South Dakota 166 124 251 242 267 Tennessee 5,805 5,493 3,900 2,991 3,205 Texas 11,006 6,780 6,486 6,321 5,350 Utah 416 406 736 1,126 1,172 Vermont 998 468 251 358 282 Virgin Islands 176 282 123 121 105 Virginia 1,687 1,357 1,542 1,448 1,552 Washington 2,193 1,896 1,841 2,010 2,282 West Virginia 566 449 588 350 422 Wisconsin 1,174 1,050 1,287 1,015 1,083 Wyoming 318 477 343 306 318


Social Policy Research Associates 17
Part II Adult Exiters

Social Policy Research Associates
18
Table II-1 Characteristics of Adult Exiters, Trends Over Time
(Derived from PY 2013Q4 WIASRD Records)
PY 2009 PY 2010 PY 2011 PY 2012 4/1/13-3/31/14
Number of exiters 1,187,450 1,252,411 1,218,275 1,200,782 1,076,347 Statewide programs 26,754 50,490 28,093 10,927 6,090 Local programs 1,167,070 1,216,901 1,203,039 1,193,273 1,071,905
Characteristics of All Exiters
Age categories
18 to 21 10.5 10.6 10.0 9.0 8.5 22 to 29 24.7 24.0 24.3 23.9 23.8 30 to 44 33.5 33.1 33.1 33.4 33.0 45 to 54 19.8 20.0 19.9 19.9 19.9 55 and over 11.5 12.2 12.7 13.8 14.7
Gender
Female 45.8 46.3 46.9 47.2 48.6 Male 54.2 53.7 53.1 52.8 51.4
Individual with a disability 4.3 4.1 4.2 4.6 5.1
Race and ethnicity
Hispanic 13.8 12.1 11.1 10.7 11.3 Not Hispanic American Indian or Alaskan Native (only)
1.6 1.6 1.8 1.7 1.6
Asian (only) 2.3 1.9 1.8 1.8 1.9 Black or African American (only)
21.8 21.6 21.4 22.4 24.3
Hawaiian or other Pacific Islander (only)
0.4 0.3 0.4 0.5 0.4
White (only) 58.1 60.2 61.0 60.3 57.8 More than one race 1.9 2.3 2.5 2.6 2.6
Veteran status Veteran 7.5 7.1 7.6 8.2 7.2 Disabled veteran 1.0 1.0 1.1 1.2 1.1 Campaign veteran 1.6 1.9 2.2 2.6 2.2 Recently separated veteran 0.9 0.9 1.0 1.1 1.1 Other eligible person 0.2 0.2 0.2 0.2 0.2

Social Policy Research Associates 19
PY 2009 PY 2010 PY 2011 PY 2012 4/1/13-3/31/14
Number of exiters 1,187,450 1,252,411 1,218,275 1,200,782 1,076,347
Employed at participation
Employed 16.3 16.9 16.5 16.0 16.5 Not employed or received layoff notice
83.7 83.1 83.5 84.0 83.5
Average preprogram quarterly earnings
$6,571 $5,866 $5,939 $6,176 $6,234
None 27.2 32.9 29.9 26.7 24.8 $1 to $2,499 18.7 19.2 19.1 18.7 18.5 $2,500 to $4,999 18.5 18.1 19.4 20.0 20.7 $5,000 to $7,499 13.6 12.3 13.2 14.2 14.8 $7,500 to $9,999 8.5 7.2 7.7 8.4 8.8 $10,000 or more 13.5 10.3 10.7 12.1 12.4
UI claimant (all exiters)1 40.1 44.0 45.0
UI claimant referred by WPRS
8.4 10.7 10.2
UI exhaustee 2.1 1.8 1.7
Characteristics of Exiters who Received Intensive or Training Services
UI claimant 33.8 34.0 37.5 38.1 37.6 UI claimant referred by WPRS
9.6 8.2 8.3 9.0 8.1
UI exhaustee 2.5 3.3 2.7 2.7 2.5
Limited English-language (excludes Puerto Rico)
1.8 1.6 1.4 1.5 1.5
Single parent 12.1 12.2 11.5 14.2 14.2
Low income 48.3 52.7 49.7 51.0 48.7
Public assistance recipient 22.3 25.9 26.7 28.1 27.5 TANF recipient 3.4 3.7 3.4 4.0 3.8 Other public assistance including SNAP and SSI
21.7 25.2 26.2 27.5 26.9
Homeless 1.9 2.3 2.2 2.3 2.2
Offender 7.1 7.9 7.9 8.9 8.6
1 UI claimant percentages for all exiters in WIA PY2011 are based on only 6 months of exiters.

Social Policy Research Associates
20
PY 2009 PY 2010 PY 2011 PY 2012 4/1/13-3/31/14
Number of exiters 1,187,450 1,252,411 1,218,275 1,200,782 1,076,347
Highest grade completed (avg.) 12.6 12.6 12.8 12.8 12.8 8th or less 2.5 2.6 2.1 1.6 1.5 Some high school 11.1 11.1 10.8 10.3 9.5 High school graduate 38.9 38.0 35.7 37.4 37.7 High school equivalency 9.0 9.0 8.2 7.7 7.7 Some postsecondary 26.2 26.7 29.0 30.4 30.8 College graduate (4-year) 12.2 12.5 14.2 12.5 12.8
Social Policy Research Associates 21
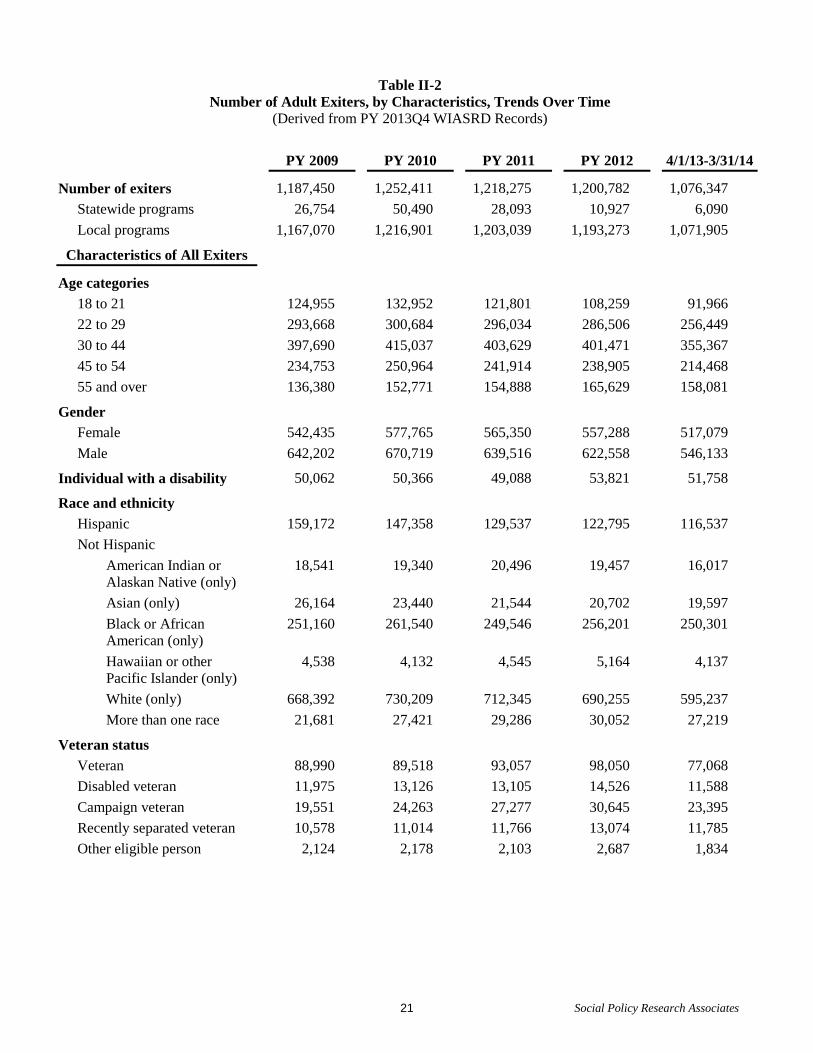
Table II-2 Number of Adult Exiters, by Characteristics, Trends Over Time
(Derived from PY 2013Q4 WIASRD Records)
PY 2009 PY 2010 PY 2011 PY 2012 4/1/13-3/31/14
Number of exiters 1,187,450 1,252,411 1,218,275 1,200,782 1,076,347 Statewide programs 26,754 50,490 28,093 10,927 6,090 Local programs 1,167,070 1,216,901 1,203,039 1,193,273 1,071,905
Characteristics of All Exiters
Age categories
18 to 21 124,955 132,952 121,801 108,259 91,966 22 to 29 293,668 300,684 296,034 286,506 256,449 30 to 44 397,690 415,037 403,629 401,471 355,367 45 to 54 234,753 250,964 241,914 238,905 214,468 55 and over 136,380 152,771 154,888 165,629 158,081
Gender
Female 542,435 577,765 565,350 557,288 517,079 Male 642,202 670,719 639,516 622,558 546,133
Individual with a disability 50,062 50,366 49,088 53,821 51,758
Race and ethnicity
Hispanic 159,172 147,358 129,537 122,795 116,537 Not Hispanic American Indian or Alaskan Native (only)
18,541 19,340 20,496 19,457 16,017
Asian (only) 26,164 23,440 21,544 20,702 19,597 Black or African American (only)
251,160 261,540 249,546 256,201 250,301
Hawaiian or other Pacific Islander (only)
4,538 4,132 4,545 5,164 4,137
White (only) 668,392 730,209 712,345 690,255 595,237 More than one race 21,681 27,421 29,286 30,052 27,219
Veteran status Veteran 88,990 89,518 93,057 98,050 77,068 Disabled veteran 11,975 13,126 13,105 14,526 11,588 Campaign veteran 19,551 24,263 27,277 30,645 23,395 Recently separated veteran 10,578 11,014 11,766 13,074 11,785 Other eligible person 2,124 2,178 2,103 2,687 1,834

Social Policy Research Associates
22
PY 2009 PY 2010 PY 2011 PY 2012 4/1/13-3/31/14
Number of exiters 1,187,450 1,252,411 1,218,275 1,200,782 1,076,347
Employed at participation
Employed 193,190 212,001 201,492 192,717 177,560 Not employed or received layoff notice
994,255 1,040,408 1,016,781 1,008,065 898,787
Average preprogram quarterly earnings
None 322,148 411,820 363,589 320,663 249,190 $1 to $2,499 221,148 239,983 232,774 224,294 185,572 $2,500 to $4,999 219,176 226,883 236,183 240,090 208,196 $5,000 to $7,499 161,112 153,367 161,236 169,991 148,838 $7,500 to $9,999 100,921 89,807 93,721 100,907 87,985 $10,000 or more 160,438 129,359 130,180 144,837 124,046
UI claimant (all exiters)2 301,426 433,951 388,200 UI Claimant referred by WPRS
63,087 105,870 88,410
UI exhaustee 15,657 18,085 14,675
Characteristics of Exiters who Received Intensive or Training Services
UI claimant 170,595 169,612 139,895 112,409 103,493 UI claimant referred by WPRS
48,608 41,025 30,955 26,608 22,407
UI exhaustee 12,501 16,614 10,121 7,976 6,926
Limited English-language (excludes Puerto Rico)
8,856 7,940 5,059 4,289 3,958
Single parent 59,404 59,467 42,034 40,420 37,478
Low income 242,098 260,160 183,789 149,454 132,405
Public assistance recipient 111,948 128,529 99,515 83,032 75,754 TANF recipient 17,043 18,235 12,459 11,624 10,490 Other public assistance including SNAP and SSI
109,084 124,934 97,517 81,183 74,002
Homeless 9,680 11,088 7,964 6,668 6,183
Offender 35,291 38,136 29,309 26,420 23,717
2 UI claimant percentages for all exiters in PY 2011 are based on only 6 months of exiters.

Social Policy Research Associates 23
PY 2009 PY 2010 PY 2011 PY 2012 4/1/13-3/31/14
Number of exiters 1,187,450 1,252,411 1,218,275 1,200,782 1,076,347
Highest grade completed 8th or less 12,363 12,907 7,971 4,675 4,160 Some high school 55,250 55,010 40,259 30,513 25,970 High school graduate 194,052 187,965 132,381 110,331 103,360 High school equivalency 44,881 44,460 30,311 22,854 21,112 Some postsecondary 130,745 132,118 107,696 89,859 84,348 College graduate (4-year) 61,002 61,772 52,632 36,972 34,978

Social Policy Research Associates
24
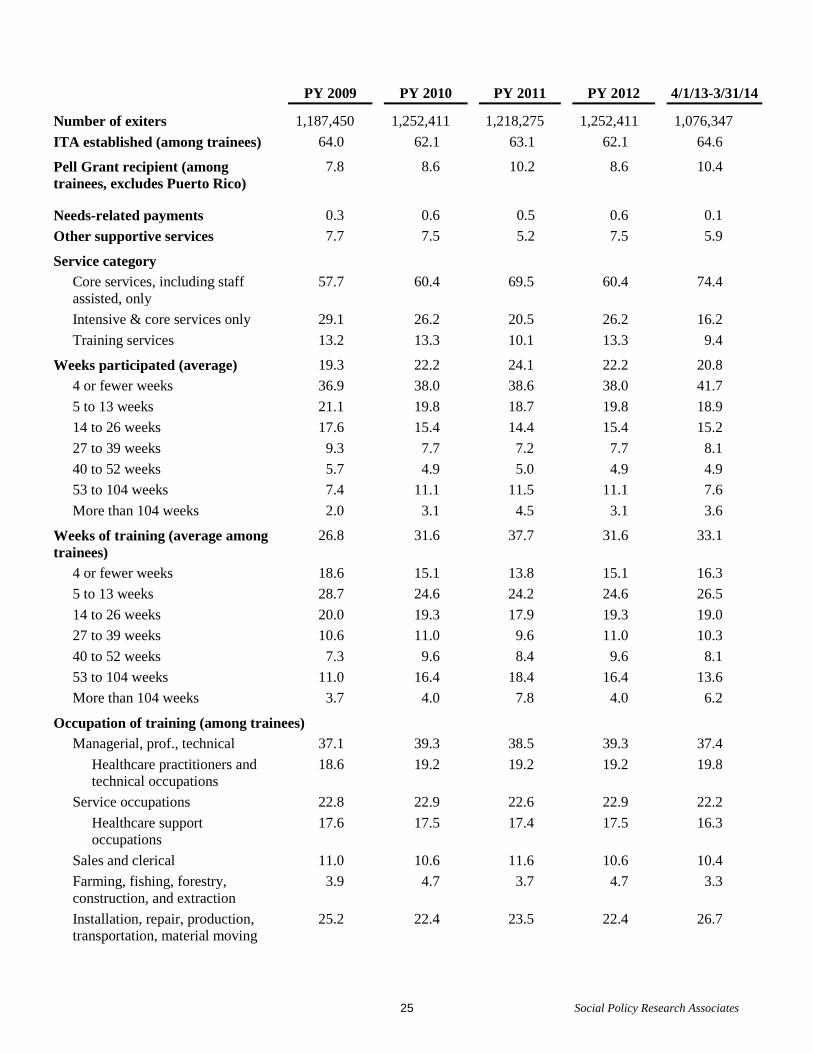
Table II-14 Services Received by Adult Exiters, Trends Over Time
(Derived from PY 2013Q4 WIASRD Records)
PY 2009 PY 2010 PY 2011 PY 2012 4/1/13-3/31/14
Number of exiters 1,187,450 1,252,411 1,218,275 1,252,411 1,076,347
Coenrollment
WIA dislocated worker 14.1 26.8 29.1 26.8 26.9 WIA youth 0.5 0.6 0.4 0.6 0.4 Partner program 87.4 89.7 91.5 89.7 87.8
Wagner-Peyser 86.6 89.1 90.9 89.1 87.2 TAA 0.8 0.8 0.5 0.8 0.3 National Farmworker Jobs 0.0 0.0 0.0 0.0 0.0 Veterans programs 2.5 2.1 1.9 2.1 2.2 Vocational Education 0.1 0.1 0.1 0.1 0.0 Adult Education 0.1 0.1 0.1 0.1 0.1 Title V Older Worker 0.0 0.0 0.0 0.0 0.0 Other partner programs 2.2 2.2 2.0 2.2 2.0
Services received Core self-service and informational activities
63.1 71.0 68.9 71.0 61.2
Staff-assisted core services 100.0 100.0 100.0 100.0 100.0 Intensive services 42.3 39.6 30.5 39.6 25.6
Prevocational activities 5.6 5.0 4.2 5.0 3.8 Training services 13.2 13.3 10.1 13.3 9.4 Type of training (among trainees)
On-the-job training 7.4 8.9 11.2 8.9 12.4 Skill upgrading 14.5 13.1 13.0 13.1 9.9 Entrepreneurial training 0.1 0.3 0.3 0.3 0.2 ABE or ESL in combination with training (non-TAA)
2.9 4.3 3.3 4.3 1.6
Customized training 7.5 6.8 5.9 6.8 6.7 Apprenticeship training 0.0 0.3 Other occupational skills training
70.7 71.0 70.4 71.0 70.6
Remedial training (ABE/ESL TAA only)
0.0 0.5
Prerequisite training 0.0 0.0 Completed any trianing (among trainees)
0.0 70.0
Social Policy Research Associates 25
PY 2009 PY 2010 PY 2011 PY 2012 4/1/13-3/31/14
Number of exiters 1,187,450 1,252,411 1,218,275 1,252,411 1,076,347 ITA established (among trainees) 64.0 62.1 63.1 62.1 64.6
Pell Grant recipient (among trainees, excludes Puerto Rico)
7.8 8.6 10.2 8.6 10.4
Needs-related payments 0.3 0.6 0.5 0.6 0.1 Other supportive services 7.7 7.5 5.2 7.5 5.9
Service category
Core services, including staff assisted, only
57.7 60.4 69.5 60.4 74.4
Intensive & core services only 29.1 26.2 20.5 26.2 16.2 Training services 13.2 13.3 10.1 13.3 9.4
Weeks participated (average) 19.3 22.2 24.1 22.2 20.8 4 or fewer weeks 36.9 38.0 38.6 38.0 41.7 5 to 13 weeks 21.1 19.8 18.7 19.8 18.9 14 to 26 weeks 17.6 15.4 14.4 15.4 15.2 27 to 39 weeks 9.3 7.7 7.2 7.7 8.1 40 to 52 weeks 5.7 4.9 5.0 4.9 4.9 53 to 104 weeks 7.4 11.1 11.5 11.1 7.6 More than 104 weeks 2.0 3.1 4.5 3.1 3.6
Weeks of training (average among trainees)
26.8 31.6 37.7 31.6 33.1
4 or fewer weeks 18.6 15.1 13.8 15.1 16.3 5 to 13 weeks 28.7 24.6 24.2 24.6 26.5 14 to 26 weeks 20.0 19.3 17.9 19.3 19.0 27 to 39 weeks 10.6 11.0 9.6 11.0 10.3 40 to 52 weeks 7.3 9.6 8.4 9.6 8.1 53 to 104 weeks 11.0 16.4 18.4 16.4 13.6 More than 104 weeks 3.7 4.0 7.8 4.0 6.2
Occupation of training (among trainees)
Managerial, prof., technical 37.1 39.3 38.5 39.3 37.4 Healthcare practitioners and technical occupations
18.6 19.2 19.2 19.2 19.8
Service occupations 22.8 22.9 22.6 22.9 22.2 Healthcare support occupations
17.6 17.5 17.4 17.5 16.3
Sales and clerical 11.0 10.6 11.6 10.6 10.4 Farming, fishing, forestry, construction, and extraction
3.9 4.7 3.7 4.7 3.3
Installation, repair, production, transportation, material moving
25.2 22.4 23.5 22.4 26.7

Social Policy Research Associates
26
PY 2009 PY 2010 PY 2011 PY 2012 4/1/13-3/31/14
Number of exiters 1,187,450 1,252,411 1,218,275 1,252,411 1,076,347
Reason for exit Institutionalized 0.1 0.1 0.1 0.1 0.1 Health/medical 0.2 0.2 0.2 0.2 0.2 Deceased 0.0 0.0 0.0 0.0 0.0 Family care 0.1 0.1 0.1 0.1 0.1 Reserve called to active duty 0.0 0.0 0.0 0.0 0.0 Retirement 0.0 0.0 0.0 0.0 0.0

Social Policy Research Associates 27
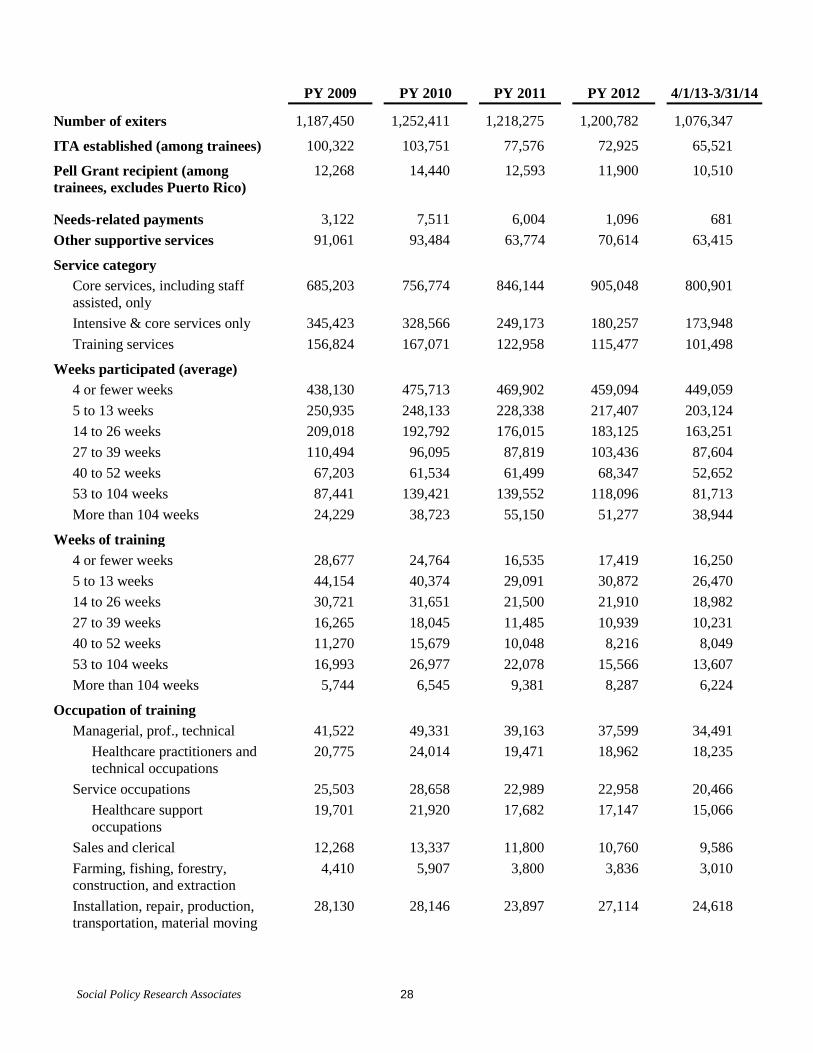
Table II-15 Number of Adults Exiters, by Services Received, Trends Over Time
(Derived from PY 2013Q4 WIASRD Records)
PY 2009 PY 2010 PY 2011 PY 2012 4/1/13-3/31/14
Number of exiters 1,187,450 1,252,411 1,218,275 1,200,782 1,076,347
Coenrollment
WIA dislocated worker 167,201 336,093 354,836 316,620 289,028 WIA youth 5,540 7,042 5,089 4,415 4,115 Partner program 1,037,258 1,123,381 1,115,172 1,088,952 945,478
Wagner-Peyser 1,028,068 1,115,444 1,107,810 1,082,273 938,396 TAA 9,982 9,551 6,213 4,005 3,299 National Farmworker Jobs 269 100 49 53 58 Veterans programs 29,360 25,747 23,579 34,305 23,977 Vocational Education 733 1,079 959 483 286 Adult Education 1,574 1,677 1,283 657 542 Title V Older Worker 260 221 97 57 60 Other partner programs 26,454 27,192 24,238 23,882 21,893
Services received Core self-service and informational activities
748,741 889,045 839,312 759,074 658,669
Staff-assisted core services 1,187,450 1,252,411 1,218,275 1,200,782 1,076,347 Intensive Services 502,247 495,637 372,131 295,734 275,446
Prevocational activities 62,482 50,903 43,660 41,113 Training services 156,824 167,071 122,958 115,477 101,498
On-the-job training 11,635 14,889 13,773 15,105 12,616 Skill upgrading & retraining 22,665 21,968 15,961 13,134 10,043 Entrepreneurial training 202 546 357 184 153 ABE or ESL in combination with training (non-TAA)
4,624 7,115 4,092 2,106 1,598
Customized training 11,702 11,278 7,304 6,713 6,807 Apprenticeship training 258 259 Other occupational skills training
110,938 118,602 86,585 80,109 71,615
Remedial training (ABE/ESL TAA only)
532 503
Prerequisite training 41 43 Completed any training (among trainees)
81,374 71,025
Social Policy Research Associates
28
PY 2009 PY 2010 PY 2011 PY 2012 4/1/13-3/31/14
Number of exiters 1,187,450 1,252,411 1,218,275 1,200,782 1,076,347
ITA established (among trainees) 100,322 103,751 77,576 72,925 65,521
Pell Grant recipient (among trainees, excludes Puerto Rico)
12,268 14,440 12,593 11,900 10,510
Needs-related payments 3,122 7,511 6,004 1,096 681 Other supportive services 91,061 93,484 63,774 70,614 63,415
Service category
Core services, including staff assisted, only
685,203 756,774 846,144 905,048 800,901
Intensive & core services only 345,423 328,566 249,173 180,257 173,948 Training services 156,824 167,071 122,958 115,477 101,498
Weeks participated (average) 4 or fewer weeks 438,130 475,713 469,902 459,094 449,059 5 to 13 weeks 250,935 248,133 228,338 217,407 203,124 14 to 26 weeks 209,018 192,792 176,015 183,125 163,251 27 to 39 weeks 110,494 96,095 87,819 103,436 87,604 40 to 52 weeks 67,203 61,534 61,499 68,347 52,652 53 to 104 weeks 87,441 139,421 139,552 118,096 81,713 More than 104 weeks 24,229 38,723 55,150 51,277 38,944
Weeks of training 4 or fewer weeks 28,677 24,764 16,535 17,419 16,250 5 to 13 weeks 44,154 40,374 29,091 30,872 26,470 14 to 26 weeks 30,721 31,651 21,500 21,910 18,982 27 to 39 weeks 16,265 18,045 11,485 10,939 10,231 40 to 52 weeks 11,270 15,679 10,048 8,216 8,049 53 to 104 weeks 16,993 26,977 22,078 15,566 13,607 More than 104 weeks 5,744 6,545 9,381 8,287 6,224
Occupation of training
Managerial, prof., technical 41,522 49,331 39,163 37,599 34,491 Healthcare practitioners and technical occupations
20,775 24,014 19,471 18,962 18,235
Service occupations 25,503 28,658 22,989 22,958 20,466 Healthcare support occupations
19,701 21,920 17,682 17,147 15,066
Sales and clerical 12,268 13,337 11,800 10,760 9,586 Farming, fishing, forestry, construction, and extraction
4,410 5,907 3,800 3,836 3,010
Installation, repair, production, transportation, material moving
28,130 28,146 23,897 27,114 24,618
Social Policy Research Associates 29
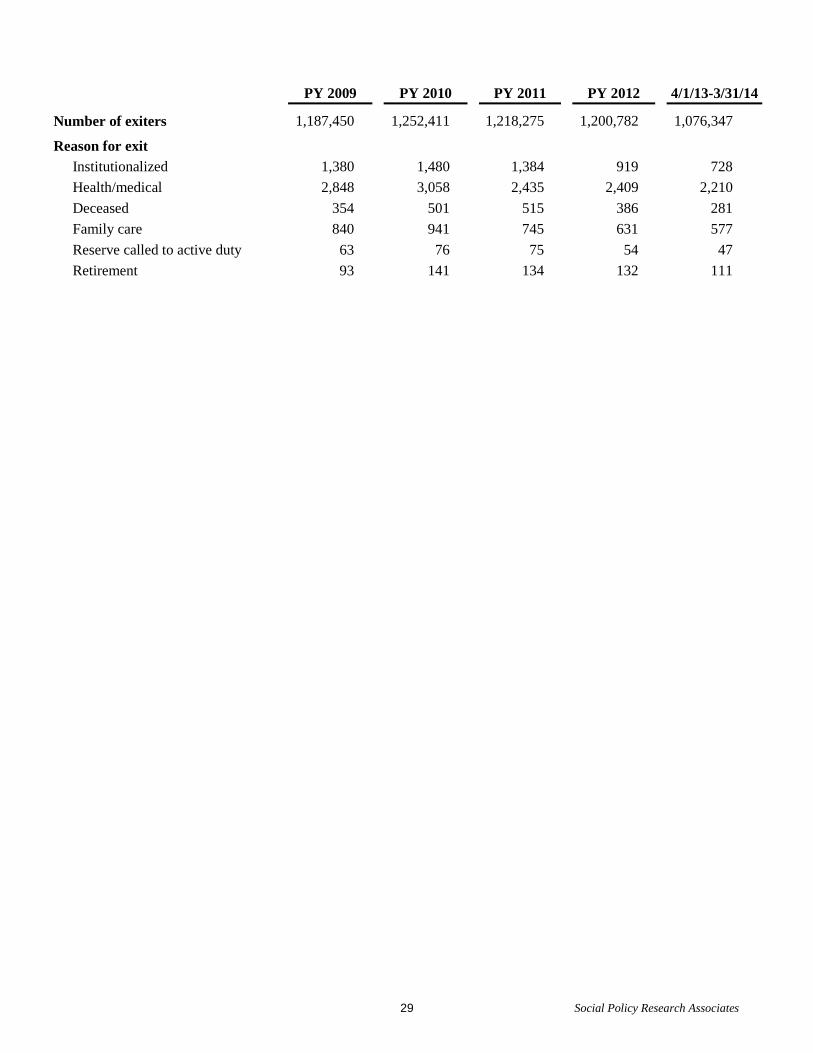
PY 2009 PY 2010 PY 2011 PY 2012 4/1/13-3/31/14
Number of exiters 1,187,450 1,252,411 1,218,275 1,200,782 1,076,347
Reason for exit Institutionalized 1,380 1,480 1,384 919 728 Health/medical 2,848 3,058 2,435 2,409 2,210 Deceased 354 501 515 386 281 Family care 840 941 745 631 577 Reserve called to active duty 63 76 75 54 47 Retirement 93 141 134 132 111

Social Policy Research Associates
30
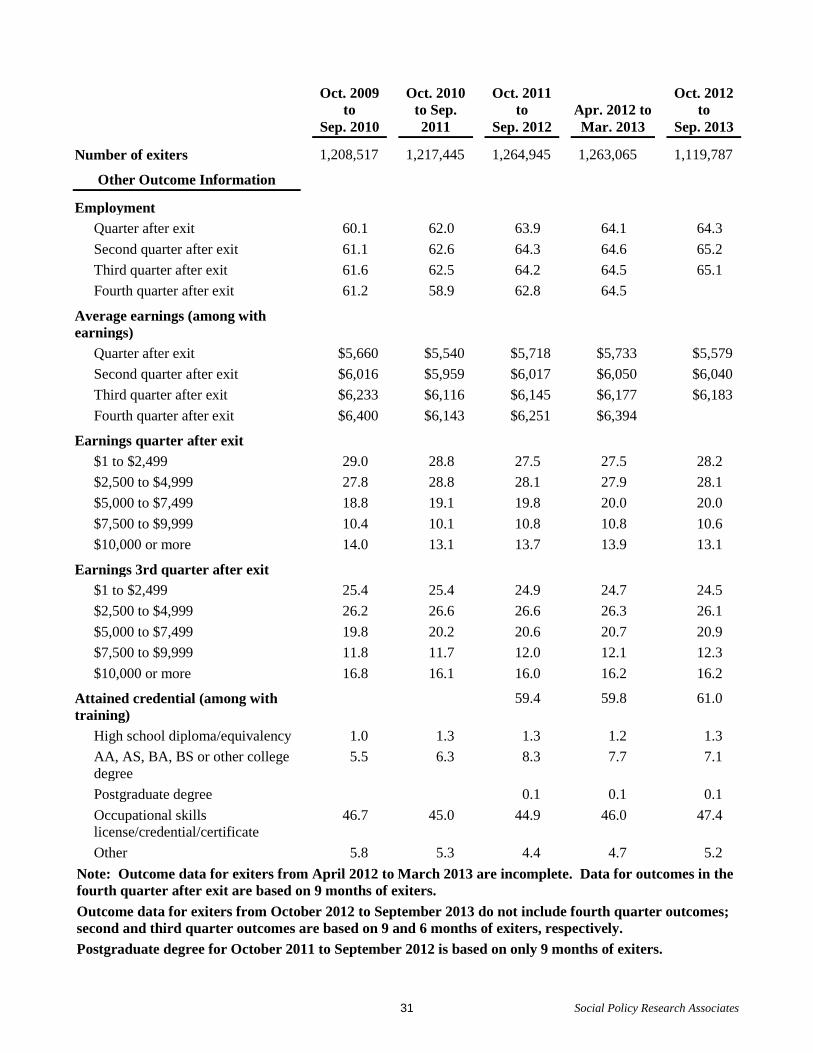
Table II-27 Outcomes of Adult Exiters, Trends Over Time
(Derived from PY 2013Q4 WIASRD Records)
Oct. 2009 to
Sep. 2010
Oct. 2010 to Sep. 2011
Oct. 2011 to
Sep. 2012 Apr. 2012 to Mar. 2013
Oct. 2012 to
Sep. 2013
Number of exiters 1,208,517 1,217,445 1,264,945 1,263,065 1,119,787
Common Measures Entered employment (quarter after exit) (excludes employed at entry)
55.7 57.7 60.0 60.2 60.5
Retention in 2nd and 3rd quarters 81.1 81.6 82.3 82.4 83.1 Average earnings in 2nd & 3rd qtrs. quarters
$13,717 $13,432 $13,466 $13,542 $13,567
Other WIA Performance and 12-Month Outcomes
Retained employment 3rd quarter after exit
84.4 84.7 85.3 85.5 86.1
Retained employment 4th quarter after exit
80.9 77.1 81.1 83.4
Earnings change 2nd and 3rd quarters after exit $1,649 $2,422 $1,955 $1,797 $1,803 3rd and 4th quarters after exit $1,503 $1,826 $1,635 $1,790 Credential and employment rate 48.5 47.2 49.0 50.1 51.4
Information about Employment in Quarter after exit
Occupation of employment Managerial, professional, & technical
26.4 27.7 23.8 23.6 24.1
Healthcare practitioners and technical occupations
13.2 12.0 10.0 9.7 10.0
Service occupations 24.3 22.9 23.3 22.9 22.8 Healthcare support occupations 11.3 10.3 9.5 9.2 8.8
Sales and clerical 19.3 19.9 21.0 21.8 21.2 Farming, fishing, forestry, construction and extraction
4.6 5.4 5.6 5.4 5.0
Installation, repair, production, transportation, and material moving
25.4 24.1 26.3 26.2 26.9
Nontraditional employment 2.3 2.1 1.9 2.0 2.0 Males 1.9 2.0 1.9 2.0 1.9 Females 2.6 2.3 2.0 1.9 2.0
Social Policy Research Associates 31
Oct. 2009 to
Sep. 2010
Oct. 2010 to Sep. 2011
Oct. 2011 to
Sep. 2012 Apr. 2012 to Mar. 2013
Oct. 2012 to
Sep. 2013
Number of exiters 1,208,517 1,217,445 1,264,945 1,263,065 1,119,787
Other Outcome Information
Employment
Quarter after exit 60.1 62.0 63.9 64.1 64.3 Second quarter after exit 61.1 62.6 64.3 64.6 65.2 Third quarter after exit 61.6 62.5 64.2 64.5 65.1 Fourth quarter after exit 61.2 58.9 62.8 64.5
Average earnings (among with earnings)
Quarter after exit $5,660 $5,540 $5,718 $5,733 $5,579 Second quarter after exit $6,016 $5,959 $6,017 $6,050 $6,040 Third quarter after exit $6,233 $6,116 $6,145 $6,177 $6,183 Fourth quarter after exit $6,400 $6,143 $6,251 $6,394
Earnings quarter after exit $1 to $2,499 29.0 28.8 27.5 27.5 28.2 $2,500 to $4,999 27.8 28.8 28.1 27.9 28.1 $5,000 to $7,499 18.8 19.1 19.8 20.0 20.0 $7,500 to $9,999 10.4 10.1 10.8 10.8 10.6 $10,000 or more 14.0 13.1 13.7 13.9 13.1
Earnings 3rd quarter after exit $1 to $2,499 25.4 25.4 24.9 24.7 24.5 $2,500 to $4,999 26.2 26.6 26.6 26.3 26.1 $5,000 to $7,499 19.8 20.2 20.6 20.7 20.9 $7,500 to $9,999 11.8 11.7 12.0 12.1 12.3 $10,000 or more 16.8 16.1 16.0 16.2 16.2
Attained credential (among with training)
59.4 59.8 61.0
High school diploma/equivalency 1.0 1.3 1.3 1.2 1.3 AA, AS, BA, BS or other college degree
5.5 6.3 8.3 7.7 7.1
Postgraduate degree 0.1 0.1 0.1 Occupational skills license/credential/certificate
46.7 45.0 44.9 46.0 47.4
Other 5.8 5.3 4.4 4.7 5.2 Note: Outcome data for exiters from April 2012 to March 2013 are incomplete. Data for outcomes in the fourth quarter after exit are based on 9 months of exiters. Outcome data for exiters from October 2012 to September 2013 do not include fourth quarter outcomes; second and third quarter outcomes are based on 9 and 6 months of exiters, respectively. Postgraduate degree for October 2011 to September 2012 is based on only 9 months of exiters.


Social Policy Research Associates 33
Part III Dislocated Worker Exiters

Social Policy Research Associates 34
Table III-1 Characteristics of Dislocated Worker Exiters, by Characteristics, Trends Over Time
(Derived from PY 2013Q4 WIASRD Records)
PY 2009 PY 2010 PY 2011 PY 2012 4/1/13-3/31/14
Number of exiters 581,985 760,853 754,108 705,589 669,117 Statewide programs 20,462 28,730 28,337 17,541 12,685 Local programs 561,923 745,155 732,560 686,766 654,050 National Emergency Grants 23,768 24,987 31,274 27,302 22,281
Disaster Relief 3,020 2,665 4,358 4,054 3,022 Other 20,748 22,322 26,916 23,248 19,259
Characteristics of All Exiters
Age categories
Under 22 3.9 4.1 3.6 3.1 2.9 22 to 29 17.7 18.4 18.4 18.0 17.7 30 to 44 35.7 35.0 34.6 34.1 33.6 45 to 54 26.2 25.6 25.1 24.9 24.6 55 and over 16.6 16.9 18.2 19.9 21.2
Gender Female 44.7 45.8 47.6 48.6 49.2 Male 55.3 54.2 52.4 51.4 50.8
Individual with a disability 2.8 2.9 2.9 3.2 3.6
Race and ethnicity Hispanic 15.4 13.4 13.0 13.4 13.6 Not Hispanic American Indian or Alaskan Native (only)
1.1 1.0 0.8 0.8 0.8
Asian (only) 3.8 2.9 2.9 3.0 3.0 Black or African American (only)
18.0 16.1 17.1 18.5 19.3
Hawaiian or other Pacific Islander (only)
0.3 0.3 0.3 0.3 0.3
White (only) 59.6 64.2 63.6 61.7 60.6 More than one race 1.9 2.2 2.3 2.3 2.4
Veteran status Veteran 7.8 7.5 7.9 7.5 7.2 Disabled veteran 0.9 1.0 0.9 0.9 1.0 Campaign veteran 1.8 2.2 2.3 2.1 2.1 Recently separated veteran 1.0 1.0 0.9 0.8 0.9 Other eligible person 0.2 0.2 0.1 0.1 0.1

Social Policy Research Associates 35
PY 2009 PY 2010 PY 2011 PY 2012 4/1/13-3/31/14
Number of exiters 581,985 760,853 754,108 705,589 669,117
Employed at participation
Employed 5.0 6.8 7.4 6.6 6.8 Not employed or received layoff notice
95.0 93.2 92.6 93.4 93.2
Average preprogram quarterly earnings
$9,291 $8,209 $8,266 $8,706 $9,056
None 16.7 20.0 15.7 13.7 10.9 $1 to $2,499 11.8 13.5 13.6 13.2 12.6 $2,500 to $4,999 16.8 18.6 20.3 20.4 20.8 $5,000 to $7,499 16.3 15.9 17.1 17.4 18.1 $7,500 to $9,999 12.7 11.3 11.9 12.1 12.6 $10,000 or more 25.7 20.7 21.4 23.2 25.0
Displaced homemaker 4.7 6.4 3.3 1.8 1.9
Time of participation Before layoff 7.9 21.1 30.4 28.4 12.4 Within 8 weeks of layoff 37.8 32.5 31.4 35.4 48.4 Over 8 weeks after layoff 54.3 46.4 38.1 36.1 39.1
UI claimant (all exiters)1 76.8 79.3 79.3 UI claimant referred by WPRS
22.3 19.6 20.3
UI exhaustee 4.4 3.6 3.6
Characteristics of Exiters who Received Intensive or Training Services
UI claimant 68.0 70.3 74.4 77.3 78.3 UI claimant referred by WPRS
24.3 23.0 30.3 35.5 38.7
UI exhaustee 6.2 5.4 5.5 5.4 5.4
Limited English-language (excludes Puerto Rico)
2.3 1.7 1.6 1.7 1.6
Single parent 8.0 8.3 7.9 8.8 8.8
Low income 30.9 30.0
1 UI claimant percentages for all exiters in PY2011 are based on only 6 months of exiters.

Social Policy Research Associates
36
PY 2009 PY 2010 PY 2011 PY 2012 4/1/13-3/31/14
Number of exiters 581,985 760,853 754,108 705,589 669,117
Highest grade completed (avg.) 12.8 12.9 13.0 13.2 13.2 8th or less 2.7 2.7 2.1 1.5 1.5 Some high school 8.4 7.5 6.9 5.8 5.5 High school graduate 38.8 37.6 35.6 35.7 34.5 High school equivalency 6.9 7.4 6.5 5.6 5.2 Some postsecondary 26.4 27.5 29.8 31.3 32.1 College graduate (4-year) 16.7 17.3 19.0 20.0 21.3

Social Policy Research Associates 37
Table III-2 Number of Dislocated Worker Exiters, Trends Over Time
(Derived from PY 2013Q4 WIASRD Records)
PY 2009 PY 2010 PY 2011 PY 2012 4/1/13-3/31/14
Number of exiters 581,985 760,853 754,108 705,589 669,117 Statewide programs 20,462 28,730 28,337 17,541 12,685 Local programs 561,923 745,155 732,560 686,766 654,050 National Emergency Grants 23,768 24,987 31,274 27,302 22,281
Disaster Relief 3,020 2,665 4,358 4,054 3,022 Other 20,748 22,322 26,916 23,248 19,259
Characteristics of All Exiters
Age categories
Under 22 22,589 30,961 27,461 21,850 19,374 22 to 29 102,785 140,141 138,743 126,721 118,694 30 to 44 207,624 266,645 261,249 240,912 224,958 45 to 54 152,449 194,743 189,617 175,528 164,533 55 and over 96,536 128,362 137,034 140,576 141,552
Gender Female 259,891 348,365 354,834 335,245 324,022 Male 321,656 411,451 390,607 354,176 334,132
Individual with a disability 16,004 21,474 21,424 21,668 23,148
Race and ethnicity Hispanic 86,200 98,030 93,445 88,649 85,179 Not Hispanic American Indian or Alaskan Native (only)
5,954 7,266 5,659 5,055 4,722
Asian (only) 21,426 21,570 20,987 19,869 19,100 Black or African American (only)
100,421 117,852 122,540 122,413 121,364
Hawaiian or other Pacific Islander (only)
1,631 2,134 2,031 1,918 1,747
White (only) 333,028 470,875 456,697 408,551 380,226 More than one race 10,546 15,982 16,223 15,388 14,899
Veteran status Veteran 45,280 57,345 59,268 52,585 47,964 Disabled veteran 4,964 7,232 7,045 6,682 6,559 Campaign veteran 10,425 16,452 17,232 15,144 13,950 Recently separated veteran 5,808 7,668 7,151 5,296 5,837 Other eligible person 1,040 1,149 834 685 683

Social Policy Research Associates
38
PY 2009 PY 2010 PY 2011 PY 2012 4/1/13-3/31/14
Number of exiters 581,985 760,853 754,108 705,589 669,117
Employed at participation
Employed 29,162 51,454 55,468 46,385 45,427 Not employed or received layoff notice
552,821 709,397 698,640 659,204 623,690
Average preprogram quarterly earnings
None 97,108 151,749 118,407 96,825 72,516 $1 to $2,499 68,488 102,837 102,534 93,127 83,908 $2,500 to $4,999 97,672 141,188 153,224 144,222 138,169 $5,000 to $7,499 94,876 121,049 128,986 122,425 120,017 $7,500 to $9,999 73,686 86,236 89,448 85,138 84,008 $10,000 or more 149,144 157,449 161,368 163,852 165,945
Displaced homemaker 27,255 48,394 24,748 12,894 12,624
Time of participation Before layoff 29,026 111,394 153,052 126,613 51,542 Within 8 weeks of layoff 139,394 171,926 158,202 157,840 200,693 Over 8 weeks after layoff 200,327 244,873 191,898 160,803 162,233
UI claimant (all exiters) 390,553 355,493 UI claimant referred by WPRS
96,392 90,997
UI exhaustee 17,898 15,994
Characteristics of Exiters who Received Intensive or Training Services
UI claimant 213,261 260,679 224,006 167,335 148,864 UI claimant referred by WPRS
76,322 85,305 91,371 76,889 73,558
UI exhaustee 19,573 19,900 16,576 11,779 10,225
Limited English-language (excludes Puerto Rico)
7,014 6,047 4,701 3,617 3,014
Single parent 24,812 30,188 23,333 18,815 16,468
Low income 37,544 59,886 56,993 48,902 38,927

Social Policy Research Associates 39
PY 2009 PY 2010 PY 2011 PY 2012 4/1/13-3/31/14
Number of exiters 581,985 760,853 754,108 705,589 669,117
Highest grade completed (avg.) 8th or less 8,461 9,960 6,444 3,350 2,917 Some high school 26,066 27,878 20,790 12,644 10,366 High school graduate 120,486 138,812 107,219 77,611 65,579 High school equivalency 21,543 27,396 19,658 12,262 9,828 Some postsecondary 81,819 101,579 89,604 68,028 60,931 College graduate (4-year) 51,863 63,984 57,307 43,347 40,457

Social Policy Research Associates
40
Table III-15
Services Received by Dislocated Worker Exiters, Trends Over Time
(Derived from PY 2013Q4 WIASRD Records)
PY 2009 PY 2010 PY 2011 PY 2012 4/1/13-3/31/14
Number of exiters 581,985 760,853 754,108 705,589 669,117
Coenrollment
WIA adult 28.7 44.2 47.1 44.9 43.2 WIA youth 0.1 0.1 0.1 0.0 0.0 Partner program 85.7 89.9 92.4 93.6 90.8
Wagner-Peyser 84.1 88.7 91.4 92.9 89.9 TAA 4.8 4.2 3.4 2.4 2.0 National Farmworker Jobs 0.0 0.0 0.0 0.1 0.1 Veterans programs 3.0 2.5 2.4 2.5 2.7 Vocational Education 0.0 0.1 0.1 0.0 0.0 Adult Education 0.2 0.1 0.1 0.1 0.0 Title V Older Worker 0.0 0.0 0.0 0.0 0.0 Other partner programs 1.1 1.2 1.3 1.0 0.8
Services Received
Rapid Response 3.5 4.2 4.7 4.6 4.4 Disaster Relief 0.5 0.4 0.6 0.6 0.5 Core self-service and informational activities
56.1 65.8 63.8 55.5 50.5
Staff-assisted core services 100.0 100.0 100.0 100.0 100.0 Intensive services 53.9 48.7 40.0 30.8 28.5
Prevocational activities 7.9 6.5 6.3 5.8 5.5 Training services 19.2 18.2 15.6 13.8 12.0 Type of training (among trainees)
On-the-job training 5.9 6.8 10.2 11.8 11.7 Skill upgrading & retraining 16.3 14.6 14.8 12.7 12.9 Entrepreneurial training 0.3 0.3 0.4 0.3 0.4 ABE or ESL in combination with training (non-TAA)
2.3 1.8 1.5 1.0 1.0
Customized training 1.4 1.3 1.3 1.2 1.4 Apprenticeship training 0.0 0.1 Other occupational skills training
76.4 78.2 75.0 75.3 74.7
Remedial training (ABE/ESL TAA only)
1.6 1.6
Prerequisite training 0.2 0.3 Completed any training (among trainees)
72.5 70.8

Social Policy Research Associates 41
PY 2009 PY 2010 PY 2011 PY 2012 4/1/13-3/31/14
Number of exiters 581,985 760,853 754,108 705,589 669,117
ITA established (among trainees) 76.9 78.4 72.8 69.8 69.5
Pell Grant recipient (among trainees, excludes Puerto Rico)
5.1 6.2 7.7 7.7 7.1
Needs-related payments 0.2 0.3 0.4 0.1 0.1 Other supportive services 9.9 9.2 7.2 6.5 5.9
Service category
Core services, including staff assisted, only
46.1 51.3 60.0 69.2 71.5
Intensive & core services only 34.7 30.6 24.4 17.0 16.5 Training services 19.2 18.2 15.6 13.8 12.0
Weeks participated (average) 23.8 29.6 35.6 30.8 26.0 4 or fewer weeks 34.7 29.2 26.8 33.9 34.8 5 to 13 weeks 20.2 20.4 18.6 17.6 19.2 14 to 26 weeks 14.8 14.6 13.3 12.8 15.6 27 to 39 weeks 9.5 8.4 8.2 8.3 9.5 40 to 52 weeks 7.1 6.0 6.7 6.5 6.0 53 to 104 weeks 10.2 16.1 17.8 13.7 9.6 More than 104 weeks 3.6 5.2 8.6 7.3 5.3
Weeks of training (average) 30.0 38.0 47.1 46.3 42.8 4 or fewer weeks 14.4 9.7 8.6 10.0 11.8 5 to 13 weeks 27.9 21.1 19.4 22.3 23.4 14 to 26 weeks 20.6 18.4 17.1 17.8 18.0 27 to 39 weeks 11.5 12.2 10.2 10.1 10.5 40 to 52 weeks 8.6 11.2 8.9 7.8 8.1 53 to 104 weeks 12.3 22.6 25.0 19.7 17.5 More than 104 weeks 4.6 4.8 10.8 12.3 10.7
Occupation of training
Managerial, prof., technical 34.8 40.0 42.4 40.8 41.7 Healthcare practitioners and technical occupations
10.0 11.9 12.9 12.1 12.6
Service occupations 15.8 16.5 14.9 14.7 13.9 Healthcare support occupations
12.3 12.8 11.1 10.8 10.0
Sales and clerical 12.0 11.8 13.4 13.9 14.2 Farming, fishing, forestry, construction, and extraction
3.5 3.6 3.4 3.0 2.7
Installation, repair, production, transportation, material moving
33.9 28.1 26.0 27.6 27.6

Social Policy Research Associates
42
PY 2009 PY 2010 PY 2011 PY 2012 4/1/13-3/31/14
Number of exiters 581,985 760,853 754,108 705,589 669,117
Reason for exit Institutionalized 0.0 0.0 0.0 0.0 0.0 Health/medical 0.4 0.4 0.3 0.3 0.3 Deceased 0.1 0.1 0.1 0.0 0.0 Family care 0.1 0.1 0.1 0.1 0.1 Reserve called to active duty 0.0 0.0 0.0 0.0 0.0 Retirement 0.1 0.1 0.1 0.1 0.1

Social Policy Research Associates 43
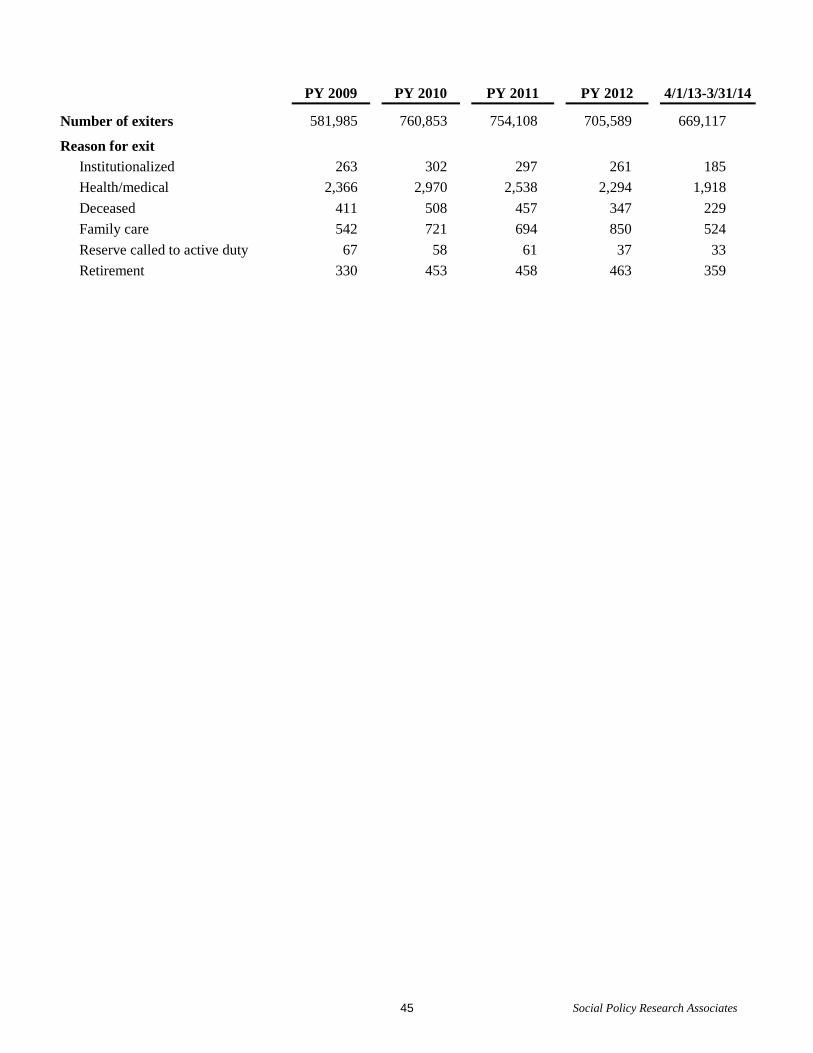
Table III-16
Number of Dislocated Worker Exiters, by Services Received, Trends Over Time
(Derived from PY 2013Q4 WIASRD Records)
PY 2009 PY 2010 PY 2011 PY 2012 4/1/13-3/31/14
Number of exiters 581,985 760,853 754,108 705,589 669,117
Coenrollment
WIA adult 167,201 336,093 354,836 316,620 289,028 WIA youth 323 516 450 331 256 Partner program 499,005 683,975 696,523 660,703 607,703
Wagner-Peyser 489,184 674,723 689,321 655,655 601,709 TAA 28,066 32,162 25,345 17,253 13,356 National Farmworker Jobs 163 82 230 369 450 Veterans programs 17,255 18,924 18,172 17,927 18,305 Vocational Education 279 487 473 285 133 Adult Education 895 868 803 372 242 Title V Older Worker 48 45 39 25 21 Other partner programs 6,259 8,784 9,911 6,897 5,419
Services received
Rapid Response 20,473 31,838 35,452 32,807 29,512 Disaster Relief 3,020 2,665 4,358 4,054 3,022 Core self-service and informational activities
326,683 500,452 481,111 391,433 337,930
Staff-assisted core services 581,985 760,853 754,108 705,589 669,117 Intensive Services 313,457 370,610 301,656 217,431 190,824
Prevocational activities 45,873 49,744 47,427 40,577 36,690 Training services 111,485 138,141 117,442 97,257 80,589 Type of Training (among trainees)
On-the-job training 6,597 9,373 11,959 11,469 9,440 Skill upgrading & retraining 18,146 20,210 17,437 12,322 10,374 Entrepreneurial training 336 365 414 336 322 ABE or ESL in combination with training
2,530 2,483 1,751 931 768
Customized training 1,608 1,832 1,505 1,206 1,143 Apprenticsehip training 18 42 Other occupational skills training
85,170 108,006 88,063 73,202 60,194
Remedial training (ABE/ESL TAA only) training
1,597 1,297
Prerequisite training 157 204 Completed any training (among trainees)
70,480 57,018

Social Policy Research Associates
44
PY 2009 PY 2010 PY 2011 PY 2012 4/1/13-3/31/14
Number of exiters 581,985 760,853 754,108 705,589 669,117
ITA established (among trainees) 85,705 108,371 85,547 67,893 55,970
Pell Grant recipient (among trainees, excludes Puerto Rico)
5,707 8,531 9,038 7,536 5,697
Needs-related payments 1,445 2,452 3,063 627 345 Other supportive services 57,820 69,623 54,373 45,849 39,149
Service category
Core services, including staff assisted, only
268,528 390,243 452,452 488,158 478,293
Intensive & core services only 201,972 232,469 184,214 120,174 110,235 Training services 111,485 138,141 117,442 97,257 80,589
Weeks participated (average) 4 or fewer weeks 201,898 222,034 201,770 239,075 232,736 5 to 13 weeks 117,304 155,509 140,402 124,299 128,157 14 to 26 weeks 85,894 111,385 100,361 89,994 104,261 27 to 39 weeks 55,242 63,975 61,788 58,294 63,711 40 to 52 weeks 41,283 45,494 50,200 45,865 40,336 53 to 104 weeks 59,236 122,681 134,588 96,476 64,518 More than 104 weeks 21,128 39,775 64,999 51,586 35,398
Weeks of training (average) 4 or fewer weeks 15,860 13,323 10,029 9,648 9,454 5 to 13 weeks 30,697 28,858 22,567 21,507 18,732 14 to 26 weeks 22,679 25,175 19,844 17,145 14,396 27 to 39 weeks 12,682 16,751 11,906 9,706 8,359 40 to 52 weeks 9,430 15,307 10,313 7,543 6,442 52 to 104 weeks 13,586 30,900 29,045 18,999 13,955 More than 104 weeks 5,078 6,584 12,578 11,897 8,549
Occupation of training
Managerial, prof., technical 27,342 43,553 42,824 35,433 30,321 Healthcare practitioners and technical occupations
7,847 12,994 13,021 10,560 9,131
Service occupations 12,418 17,932 15,019 12,795 10,098 Healthcare support occupations
9,703 13,929 11,177 9,387 7,265
Sales and clerical 9,425 12,888 13,515 12,051 10,323 Farming, fishing, forestry, construction, and extraction
2,730 3,897 3,395 2,649 1,947
Installation, repair, production, transportation, material moving
26,669 30,590 26,282 23,993 20,047
Social Policy Research Associates 45
PY 2009 PY 2010 PY 2011 PY 2012 4/1/13-3/31/14
Number of exiters 581,985 760,853 754,108 705,589 669,117
Reason for exit Institutionalized 263 302 297 261 185 Health/medical 2,366 2,970 2,538 2,294 1,918 Deceased 411 508 457 347 229 Family care 542 721 694 850 524 Reserve called to active duty 67 58 61 37 33 Retirement 330 453 458 463 359

Social Policy Research Associates
46
Table III-29 Outcomes of Dislocated Worker Exiters, Trends Over Time
(Derived from PY 2013Q4 WIASRD Records)
Oct. 2009 to
Sep. 2010 Oct. 2010 to
Sep. 2011 Oct. 2011 to
Sep. 2012 Apr. 2012 to Mar. 2013
Oct. 2012 to Sep. 2013
Number of exiters 631,209 771,507 749,900 718,305 678,895 Common Measures
Entered employment (quarter after exit) (excludes employed at entry)
57.9 61.5 60.4 59.9 60.0
Retention in 2nd and 3rd quarters 83.8 84.6 84.1 83.9 84.8 Average earnings in 2nd & 3rd qtrs. $16,977 $16,199 $15,966 $16,040 $16,200
Other WIA Performance and 12-Month Outcomes
Retained employment 3rd quarter after exit
86.6 87.1 86.8 86.6 87.6
Retained employment 4th quarter after exit
83.2 79.6 82.5 84.5
Earnings replacement rate 97.0 104.7 97.1 95.4 96.0 Earnings Change
2nd and 3rd quarters after exit $-455 $627 $-417 $-670 $-587 3rd and 4th quarters after exit $-561 $-36 $-835 $-898 Credential and employment rate
49.7 52.3 50.9 51.0 50.7
Information about Employment in Quarter after exit
Occupation of employment Managerial, professional, & technical
24.8 27.6 28.8 29.3 29.3
Healthcare practitioners and technical occupations
4.8 5.9 6.1 6.0 5.8
Service occupations 14.4 14.7 14.3 14.4 14.1 Healthcare support occupations
6.9 7.0 6.5 6.4 6.2
Sales and clerical 19.5 21.2 22.2 22.5 23.0 Farming, fishing, forestry, construction and extraction
5.1 4.4 4.1 4.1 4.2
Installation, repair, production, transportation, and material moving
36.2 32.2 30.5 29.8 29.4
Nontraditional employment 2.5 2.1 1.7 1.8 1.8 Males 2.1 2.0 1.7 1.8 1.7 Females `2.9 2.3 1.8 1.9 1.8

Social Policy Research Associates 47
Oct. 2009 to
Sep. 2010 Oct. 2010 to
Sep. 2011 Oct. 2011 to
Sep. 2012 Apr. 2012 to Mar. 2013
Oct. 2012 to Sep. 2013
Number of exiters 631,209 771,507 749,900 718,305 678,895 Other Outcome Information
Employment Quarter after exit 58.8 62.8 61.9 61.3 61.5 Second quarter after exit 60.6 64.0 63.3 62.9 63.4 Third quarter after exit 61.7 64.1 63.8 63.5 64.4 Fourth quarter after exit 61.8 60.7 62.8 63.9
Average earnings (among with earnings)
Quarter after exit $7,205 $6,856 $6,850 $6,862 $6,986 Second quarter after exit $7,597 $7,367 $7,256 $7,267 $7,391 Third quarter after exit $7,893 $7,533 $7,419 $7,438 $7,478 Fourth quarter after exit $8,087 $7,608 $7,514 $7,532
Earnings quarter after exit $1 to $2,499 22.4 21.9 22.6 22.9 23.0 $2,500 to $4,999 23.5 25.1 25.3 25.1 24.6 $5,000 to $7,499 20.1 21.0 20.9 20.9 20.5 $7,500 to $9,999 13.0 12.8 12.6 12.5 12.5 $10,000 or more 21.0 19.3 18.6 18.6 19.4
Earnings 3rd quarter after exit $1 to $2,499 19.0 19.2 20.1 20.2 20.1 $2,500 to $4,999 21.4 22.5 23.1 23.0 22.4 $5,000 to $7,499 20.4 20.8 20.9 20.8 20.8 $7,500 to $9,999 14.3 14.2 13.8 13.8 14.0 $10,000 or more 24.9 23.2 22.0 22.2 22.7
Attained credential (among trainees) 59.9 60.2 60.0
High school diploma/equivalency
0.6 0.6 0.5 0.4 0.5
AA, AS, BA, BS or other college degree
5.5 9.0 12.3 11.9 10.1
Postgraduate degree 0.1 0.2 0.2 Occupational skills license/credential/certificate
51.5 48.3 43.0 43.3 44.9
Other 4.2 4.6 4.3 4.3 4.4

Social Policy Research Associates
48
Note: Outcome data for exiters from April 2012 to March 2013 are incomplete. Data for outcomes in the fourth quarter after exit are based on 9 months of exiters.
Outcome data for exiters from October 2012 to September 2013 do not include fourth quarter outcomes; Second and third quarter outcomes are based on 9 and 6 months of exiters, respectively.
Postgradue degree for October 2011 to September 2012 is based on only 9 months of exiters.

Social Policy Research Associates 49
Part IV Youth Exiters

Social Policy Research Associates 50
Table IV-1 Characteristics of Youth Exiters, Trends Over Time
(Derived from PY 2013Q4 WIASRD Records)
PY 2009 PY 2010 PY 2011 PY 2012 4/1/13-3/31/14
Number of exiters 133,564 139,323 122,642 109,695 102,971 Statewide programs 11,142 16,351 6,953 5,111 3,088 Local programs 128,207 130,122 119,843 108,074 102,515
Age categories
14 to 15 10.2 8.5 7.5 5.6 5.2 16 to 17 38.0 39.1 37.4 36.0 36.6 18 20.6 20.8 21.7 22.3 22.6 19 to 21 31.2 31.5 33.5 36.0 35.6
Gender
Female 54.6 54.4 54.3 54.6 54.5 Male 45.4 45.6 45.7 45.4 45.5
Individual with a disability 12.8 12.1 12.8 13.1 13.3
Race and ethnicity
Hispanic 31.2 33.0 33.2 30.0 29.0 Not Hispanic American Indian or Alaskan Native (only)
1.1 1.2 1.4 1.7 1.6
Asian (only) 1.7 1.7 1.6 1.8 1.8 Black or African American (only)
33.7 32.7 33.0 32.7 33.7
Hawaiian or other Pacific Islander (only)
0.3 0.3 0.2 0.3 0.3
White (only) 30.2 29.5 28.7 31.3 31.1 More than one race 1.7 1.7 1.9 2.2 2.4
Veteran (among age 19 to 21) 0.1 0.1 0.2 0.2 0.2
Employed at participation
Employed 8.8 7.4 7.4 7.7 8.1 Not employed or received layoff notice
91.2 92.6 92.6 92.3 91.9
Homeless or runaway youth 4.0 4.5 3.8 4.4 4.5
Offender 9.4 10.8 9.0 8.5 8.3
Pregnant or parenting youth 14.9 18.5 18.2 14.2 13.5
Basic literacy skills deficient 55.5 59.5 60.4 58.7 58.4
Ever in foster care 4.5 5.8 3.9 3.4 3.4

Appendix B: Definitions
Social Policy Research Associates 51
PY 2009 PY 2010 PY 2011 PY 2012 4/1/13-3/31/14
Number of exiters 133,564 139,323 122,642 109,695 102,971
Youth who needs additional assistance
59.0 59.9 61.1 61.4 62.2
Average preprogram quarterly earnings (among age 19 to 21)
$1,864 $1,794 $1,799 $1,845 $1,870
None 49.2 57.8 60.0 58.6 58.5 $1 to $1,499 26.0 22.2 21.2 21.4 21.4 $1,500 to $2,999 15.3 12.9 12.0 12.4 12.6 $3,000 to $4,999 7.3 5.6 5.3 5.9 5.8 $5,000 or more 2.3 1.5 1.6 1.7 1.7
Limited English-language (excludes Puerto Rico)
2.1 2.0 2.1 2.0 2.2
Single parent 10.9 14.6 14.0 9.7 9.2 UI claimant 2.6 2.3 1.7 1.6 1.4
UI claimant referred by WPRS 0.5 0.4 0.4 0.4 0.4 UI exhaustee 0.2 0.3 0.2 0.2 0.3
Low income 95.4 96.3 97.2 96.1 94.8
Public assistance recipient 35.8 42.8 43.2 42.6 42.1 TANF recipient 7.6 7.8 6.4 6.5 5.7 Other public assistance including SNAP and SSI
34.0 40.6 41.5 41.0 40.6
Highest grade completed (avg.) 10.5 10.6 10.6 10.7 10.8 8th or less 9.4 8.0 7.5 6.2 5.8 Some high school 65.9 67.3 66.3 64.8 65.8 High school graduate 18.4 18.5 19.9 22.2 22.0 High school equivalency 2.6 2.5 2.5 2.6 2.5 Some postsecondary 3.6 3.7 3.9 4.2 3.9 College graduate (4-year) 0.1 0.1 0.0 0.0 0.0
Attending school at participation 53.8 54.6 52.4 49.7 49.6 High school or below 47.2 47.5 45.3 42.2 42.4 Alternative school 3.2 3.0 3.2 3.2 Postsecondary 4.1 3.9 4.1 4.4 4.1
Not attending school at participation
46.2 45.4 47.6 50.3 50.4
High school dropout 25.6 24.6 25.5 25.7 26.2 High school graduate/equiv. 20.6 20.8 22.1 24.6 24.3

Social Policy Research Associates 52
Table IV-2 Number of Youth Exiters, by Characteristics, Trends Over Time
(Derived from PY 2013Q4 WIASRD Records)
PY 2009 PY 2010 PY 2011 PY 2012 4/1/13-3/31/14
Number of exiters 133,564 139,323 122,642 109,695 102,971 Statewide programs 11,142 16,351 6,953 5,111 3,088 Local programs 128,207 130,122 119,843 108,074 102,515
Age categories
14 to 15 13,634 11,911 9,156 6,184 5,313 16 to 17 50,781 54,496 45,809 39,519 37,713 18 27,463 28,994 26,616 24,504 23,322 19 to 21 41,686 43,922 41,061 39,488 36,623
Gender
Female 72,893 75,633 65,842 58,918 55,535 Male 60,513 63,451 55,331 49,063 46,317
Individual with a disability 16,727 16,521 15,397 14,095 13,399
Race and ethnicity
Hispanic 40,876 44,943 39,309 31,574 28,739 Not Hispanic American Indian or Alaskan Native (only)
1,472 1,567 1,684 1,779 1,621
Asian (only) 2,281 2,335 1,898 1,849 1,816 Black or African American (only)
44,233 44,543 39,065 34,347 33,394
Hawaiian or other Pacific Islander (only)
374 346 294 285 282
White (only) 39,558 40,127 34,012 32,938 30,875 More than one race 2,270 2,361 2,294 2,319 2,422
Veteran (among age 19 to 21) 129 112 187 215 183
Employed at participation
Employed 11,708 10,335 9,127 8,463 8,318 Not employed or received layoff notice
121,856 128,988 113,515 101,232 94,653
Homeless or runaway youth 5,385 5,750 4,363 4,865 4,628
Offender 12,217 13,722 10,411 9,308 8,524
Pregnant or parenting youth 19,945 25,766 22,323 15,559 13,902
Basic literacy skills deficient 74,018 82,874 73,768 63,849 59,570
Ever in foster care 6,017 7,656 4,541 3,718 3,501

Appendix B: Definitions
Social Policy Research Associates 53
PY 2009 PY 2010 PY 2011 PY 2012 4/1/13-3/31/14
Number of exiters 133,564 139,323 122,642 109,695 102,971
Youth who needs additional assistance
78,814 83,488 74,906 67,237 63,915
Average preprogram quarterly earnings (among age 19 to 21)
None 20,245 25,178 24,511 23,147 20,967 $1 to $1,499 10,713 9,683 8,673 8,437 7,670 $1,500 to $2,999 6,280 5,613 4,899 4,893 4,514 $3,000 to $4,999 2,987 2,425 2,156 2,341 2,060 $5,000 or more 930 659 640 670 611
Limited English-language (excludes Puerto Rico)
2,408 2,399 2,229 1,960 2,066
Single parent 14,458 20,005 16,841 10,445 9,364 UI Claimant 3,480 3,164 2,104 1,793 1,447
UI claimant referred by WPRS 658 609 520 464 369 UI Exhaustee 308 375 292 263 260
Low income 126,777 133,354 118,382 105,086 97,475
Public assistance recipient 47,861 59,648 53,007 46,708 43,364 TANF recipient 10,139 10,434 7,874 7,108 5,879 Other public assistance including SNAP and SSI
45,369 56,516 50,931 44,931 41,839
Highest grade completed (avg.)
8th or less 12,489 11,098 9,165 6,763 6,002 Some high school 88,018 93,644 81,262 71,041 67,635 High school graduate 24,600 25,773 24,379 24,321 22,572 High school equivalency 3,506 3,445 3,006 2,857 2,564 Some postsecondary 4,866 5,169 4,724 4,614 4,012 College graduate (4-year) 74 99 43 18 20
Attending school at participation 71,858 76,000 64,254 54,502 51,059 High school or below 63,063 66,140 55,509 46,249 43,615 Alternative school 4,407 3,708 3,465 3,264 Postsecondary 5,444 5,453 5,037 4,788 4,180
Not attending school at participation
61,629 63,176 58,375 55,155 51,893
High school dropout 34,107 34,249 31,277 28,189 26,923 High school graduate/equiv. 27,522 28,927 27,098 26,966 24,970

Social Policy Research Associates 54
Table IV-13 Services Received by Youth Exiters, Trends Over Time
(Derived from PY 2013Q4 WIASRD Records)
PY 2009 PY 2010 PY 2011 PY 2012 4/1/13-3/31/14
Number of exiters 133,564 139,323 122,642 109,695 102,971
Coenrollment
WIA adult 4.1 5.1 4.1 4.0 4.0 WIA dislocated worker 0.2 0.4 0.4 0.3 0.2 Partner program 44.0 45.8 43.0 45.4 46.1
Wagner-Peyser 39.1 41.4 39.7 41.9 42.5 TAA 0.0 0.0 0.0 0.0 0.0 National Farmworker Jobs 0.0 0.0 0.0 0.0 0.0 Veterans programs 0.2 0.1 0.0 0.0 0.0 Vocational Education 0.4 0.2 0.1 0.1 0.1 Adult Education 0.5 0.4 0.5 0.4 0.5 Other partner programs 6.9 5.9 4.8 5.4 5.8
Weeks participated (average) 58.0 58.9 60.4 59.4 57.6 26 or fewer weeks 35.9 33.4 31.7 30.7 30.4 26 to 52 weeks 26.5 26.5 25.8 28.8 30.0 52 to 78 weeks 13.5 14.6 15.2 15.4 15.8 More than 78 weeks 24.1 25.5 27.3 25.1 23.8
Supportive services 37.1 38.2 43.8 46.2 46.0
Youth activities (among with activities)1 Educational achievement services 50.2 51.8 Alternative school 5.9 5.9 Summer employment 18.7 17.2 Work experience 33.8 33.6 Leadership development 27.6 28.4 Adult mentoring 8.5 9.5 Career guidance/counseling 32.9 33.7 Basic skills training 12.1 11.6 Occupational skills training 22.0 20.5
1 Some states reported that many youth did not receive any youth activities.

Appendix B: Definitions
Social Policy Research Associates 55
PY 2009 PY 2010 PY 2011 PY 2012 4/1/13-3/31/14
Number of exiters 133,564 139,323 122,642 109,695 102,971
Youth pre-PY2013 activities (among with activities) Educational achievement services 52.3 59.7 60.7 57.6 59.0 Employment services 56.9 64.9 56.9 48.6 47.9 Summer youth employment 31.1 32.5 28.6 18.7 17.2 Leadership development 28.1 37.3 36.4 27.6 28.4 Additional support for youth services 52.1 53.6 45.6 36.6 37.8
Enrolled in education 79.2 79.9 80.5 80.6 80.3
Pell Grant recipient (among trainees, excludes Puerto Rico)
9.0 8.0 7.2 6.9 6.5

Social Policy Research Associates 56
Table IV-14 Number of Youth Exiters, by Services Received, Trends Over Time
(Derived from PY 2013Q4 WIASRD Records)
PY 2009 PY 2010 PY 2011 PY 2012 4/1/13-3/31/14
Number of exiters 133,564 139,323 122,642 109,695 102,971
Coenrollment
WIA adult 5,540 7,042 5,089 4,415 4,115 WIA dislocated worker 323 516 450 331 256 Partner program 58,710 63,845 52,777 49,773 47,458
Wagner-Peyser 52,193 57,647 48,713 46,011 43,771 TAA 6 10 8 2 5 National Farmworker Jobs 9 20 51 21 26 Veterans programs 201 195 61 11 6 Vocational Education 474 292 156 116 95 Adult Education 650 526 615 481 513 Other partner programs 9,214 8,285 5,913 5,876 6,005
Weeks participated
26 or fewer weeks 47,991 46,591 38,880 33,724 31,307 26 to 52 weeks 35,390 36,852 31,619 31,599 30,915 52 to 78 weeks 17,989 20,395 18,668 16,888 16,226 More than 78 weeks 32,194 35,485 33,475 27,484 24,523
Supportive services 49,507 53,252 53,701 50,665 47,400 Youth activities (among with activities)1
Educational achievement services 47,303 45,741 Alternative school 5,552 5,192 Summer employment 17,585 15,174 Work experience 31,858 29,667 Leadership development 26,017 25,061 Adult mentoring 8,015 8,399 Career guidance/counseling 31,003 29,731 Basic skills training 11,408 10,231 Occupational skills training 20,775 18,110
1 Some states reported that many youth did not receive any youth activities.

Appendix B: Definitions
Social Policy Research Associates 57
PY 2009 PY 2010 PY 2011 PY 2012 4/1/13-3/31/14 Number of exiters 133,564 139,323 122,642 109,695 102,971
Youth pre-PY2013 activities (among with activities)
Educational achievement services 63,868 77,500 67,762 54,345 52,155 Employment services 69,461 84,211 63,515 45,862 42,327 Summer youth employment 38,025 42,174 31,919 17,585 15,174 Leadership development 34,332 48,424 40,696 26,017 25,061 Additional support for youth services
63,616 69,547 50,934 34,537 33,348
Enrolled in education 105,722 111,277 98,776 88,371 82,709
Pell Grant recipient (among trainees, excludes Puerto Rico)
1,171 1,104 1,027 983 821

Social Policy Research Associates 58
Table IV-25 Outcomes of Youth Exiters, Trends Over Time
(Derived from PY 2013Q4 WIASRD Records)
Oct. 2010 to
Sep. 2011 Oct. 2011 to
Sep. 2012 Apr. 2012 to Mar. 2013
Oct. 2012 to Sep. 2013
Apr. 2013 to Mar. 2014
Number of exiters 134,254 114,824 116,175 108,389 102,971
Youth Common Measures
Placement in employment or education
60.5 65.2 64.9 65.4 66.4
Employment 45.7 50.5 50.6 52.9 51.8 Education 14.8 14.7 14.3 12.4 14.6
Attainment of degree or certificate
57.6 64.0 64.5 66.3 67.5
Secondary school diploma 34.9 36.5 36.1 36.4 41.9 GED or equivalency 10.0 10.9 10.6 11.7 10.5 Certificate or postsecondary degree
12.8 16.6 17.9 18.2 15.1
PY 2009 PY 2010 PY 2011 PY 2012 PY 2013
Literacy and numeracy gains (not based on exiters)
43.2 44.7 49.0 53.7 53.3
Outcomes for All Youth Oct. 2010 to
Sep. 2011 Oct. 2011 to
Sep. 2012 Apr. 2012 to Mar. 2013
Oct. 2012 to Sep. 2013
Apr. 2013 to Mar. 2014
Attending secondary school at exit
20.5 16.6 17.1 16.1 15.4
Placement (quarter after exit) 31.0 36.9 35.8 38.0 41.0 Retention (3rd quarter after exit)
32.6 39.5 39.4 44.4
Not attending secondary school at exit 79.5 83.4 82.9 83.9 84.6
Placement (quarter after exit) 72.4 74.5 74.4 74.2 75.2 Postsecondary education 16.1 15.2 15.0 12.8 14.9 Advanced training 1.3 1.0 0.9 0.8 0.9 Apprenticeships 0.0 0.0 0.0 0.0 0.0 Military service 0.2 0.2 0.2 0.2 0.2 Employment 54.8 58.1 58.2 60.3 59.1
Retention (3rd quarter after exit)
67.3 67.3 67.3 67.7
Postsecondary education 11.8 9.8 9.7 5.1 Advanced training 1.0 0.8 0.7 0.5 Apprenticeships 0.0 0.0 0.0 0.0 Military service 0.2 0.2 0.2 0.1 Employment 54.3 56.5 56.7 62.0

Appendix B: Definitions
Social Policy Research Associates 59
Oct. 2010 to
Sep. 2011 Oct. 2011 to
Sep. 2012 Apr. 2012 to Mar. 2013
Oct. 2012 to Sep. 2013
Apr. 2013 to Mar. 2014
Outcomes for All Youth
Nontraditional employment (quarter after exit)
7.3 4.6 3.9 4.0 4.0
Males 9.5 7.2 6.2 6.0 6.0 Females 5.6 2.8 2.2 2.5 2.6
Earnings of employed in quarter after exit (average)
$2,611 $2,707 $2,703 $2,703 $2,663
$1 - $2,499 57.0 55.3 55.4 55.2 56.3 $2,500 - $4,999 31.4 32.2 32.0 32.1 31.3 $5,000 - $7,499 8.2 8.8 8.8 9.1 8.9 $7,500 or more 3.4 3.7 3.8 3.6 3.5
Earnings of employed in 3rd quarter after exit (average)
$2,901 $2,996 $2,993 $3,138
$1 - $2,499 51.8 50.3 50.5 47.3 $2,500 - $4,999 33.6 34.0 33.5 34.4 $5,000 - $7,499 10.2 10.8 11.0 12.8 $7,500 or more 4.5 4.9 4.9 5.5
Older Youth Performance and 12-Month Outcomes
Entered employment (qtr. after exit, excludes employed at entry)
63.9 67.6 67.6 68.2 67.8
Retained employment 3rd quarter after exit
81.4 82.3 82.6 83.6
Retained employment 4th quarter after exit
74.7 77.0 77.4 78.1
Earnings change 2nd and 3rd quarters after exit $4,274 $4,434 $4,485 $4,620 3rd and 4th quarters after exit $4,193 $4,434 $4,499 $4,573
Credential rate 38.3 40.4 39.9 39.3 39.6
Younger Youth Performance Outcomes
Youth retention 65.1 65.1 64.9 64.3 Diploma attainment rate 70.6 74.1 74.3 74.9 73.6 Skill attainment rate 82.7 85.0 84.8 82.9 82.0
Note: Outcome data for exiters from October 2012 to September 2013 are incomplete. Retention outcomes are based on 6 months of exiters.
Outcome data for exiters from April 2013 to March 2014 do not include retention outcomes. Placement outcomes are based on 6 months of exiters.