q1'09 results - conference call
DESCRIPTION
ÂTRANSCRIPT
Q1 09 Results conference call
May 15
Conf call Q109 results May 15 2009 1
Q1 09 highlights●
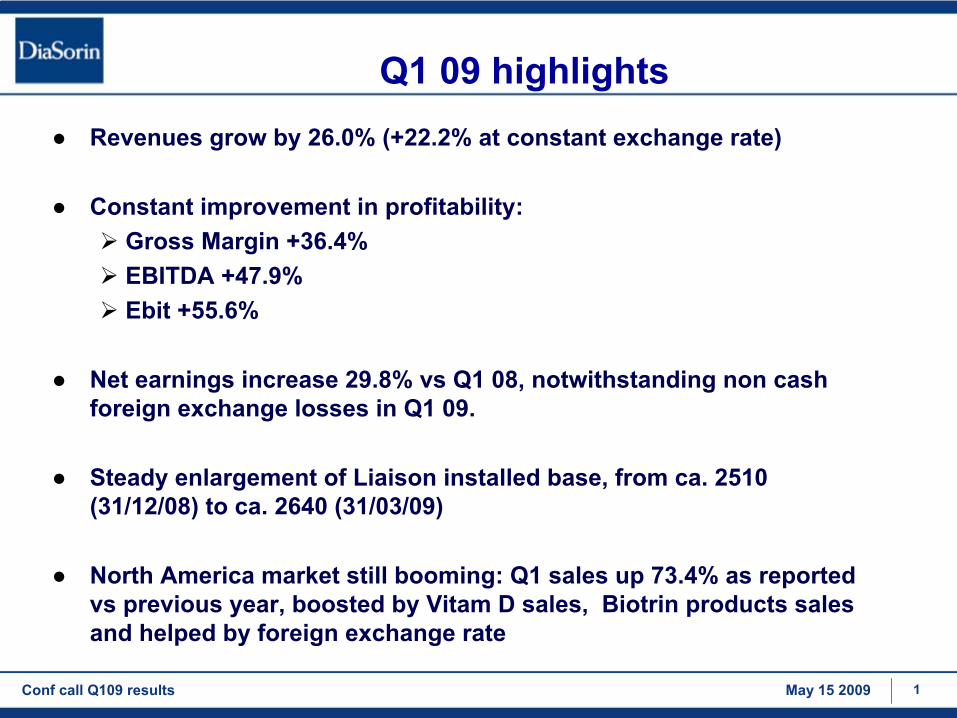
Revenues grow by 26.0% (+22.2% at constant exchange rate)
●
Constant improvement in profitability: Gross Margin +36.4%EBITDA +47.9%Ebit +55.6%
●
Net earnings increase 29.8% vs
Q1 08, notwithstanding non cash foreign exchange losses in Q1 09.
●
Steady enlargement of Liaison installed base, from ca. 2510 (31/12/08) to ca. 2640 (31/03/09)
●
North America market still booming: Q1 sales up 73.4% as reported vs
previous year, boosted by Vitam
D sales, Biotrin
products sales
and helped by foreign exchange rate

Conf call Q109 results May 15 2009 2
Q1 09 Results: income statementmillions € Q1
2009 Q1
2008 Δ
Net Revenues 71.4 56.6 26.0%Gross
profit 49.9 36.6 36.4%Margin 69.9% 64.6%
G&A (7.8) (6.4)
R&D (3.8) (3.1)
S&M (13.5) (11.3)
Total Operating Expenses (25.1) (20.7)% on sales (35.1%) (36.6%)
Other operating Income/(Expenses) (0.4) (0.2)
Ebit 24.4 15.7 55.6%Margin 34.2% 27.7%
Net Financial Expense (3.6) 0.6
Tax (7.6) (6.1)
Net Result 13.2 10.1 29.8%Ebitda 28.4 19.2 47.9%Margin 39.8% 33.9%

Conf call Q109 results May 15 2009 3
Revenues break down Q1: by technology
RIA10.2%
ELISA21.8%
CLIA56.6%
Instruments 11.4%
Q1
08 Q1
09
ELISA sales grew by 29.7%, thanks mainly to Biotrin
products (ca 24.1% contribution) but CLIA sales keep growing at higher rate than other technologies
+34.8% Q1 09 vs. Q1 08
Revenues mix by technology improved towards CLIA kits, from 56.6% in Q1 08 to 60.6% in Q1 09 of total sales
RIA8.5%
ELISA22.4%
CLIA60.6%
Instruments 8.5%
Conf call Q109 results May 15 2009 4
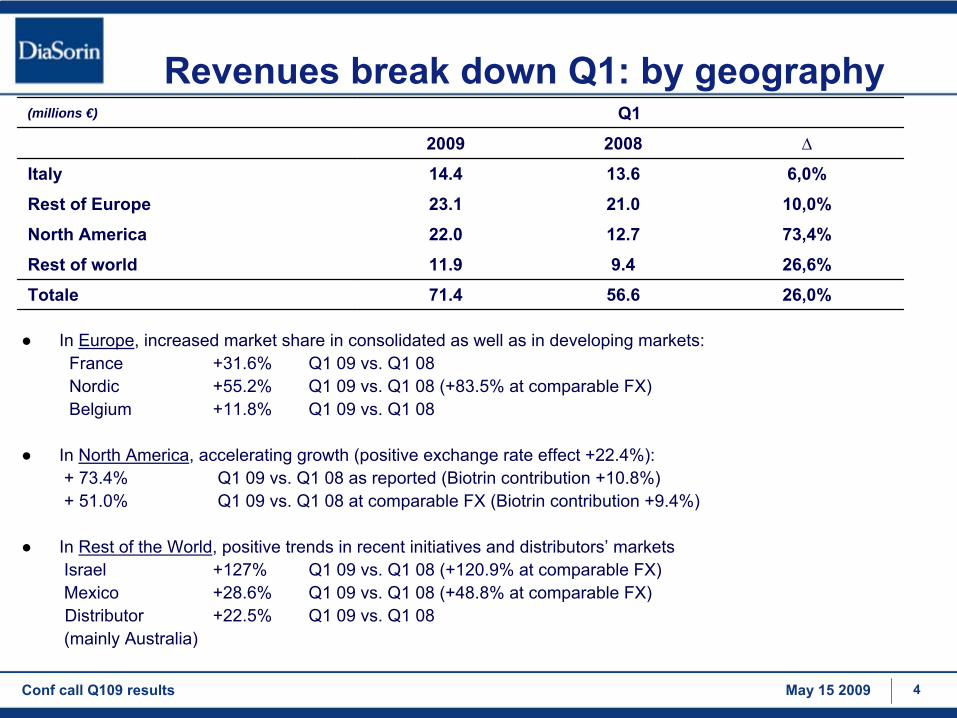
Revenues break down Q1: by geography
●
In Europe, increased market share in consolidated as well as in developing markets:France
+31.6%
Q1 09 vs. Q1 08Nordic
+55.2%
Q1 09 vs. Q1 08 (+83.5% at comparable FX)Belgium
+11.8%
Q1 09 vs. Q1 08
●
In North America, accelerating growth (positive exchange rate effect +22.4%):+ 73.4%
Q1 09 vs. Q1 08
as reported (Biotrin
contribution +10.8%)+ 51.0%
Q1 09 vs. Q1 08
at comparable FX (Biotrin
contribution +9.4%)
●
In Rest of the World, positive trends in recent initiatives and distributors’
markets Israel
+127%
Q1 09 vs. Q1 08 (+120.9% at comparable FX)Mexico
+28.6%
Q1 09 vs. Q1 08 (+48.8% at comparable FX) Distributor
+22.5%
Q1 09 vs. Q1 08(mainly Australia)
(millions €) Q1
2009 2008 ∆
Italy 14.4 13.6 6,0%
Rest
of
Europe 23.1 21.0 10,0%
North America 22.0 12.7 73,4%
Rest
of
world 11.9 9.4 26,6%
Totale 71.4 56.6 26,0%

Conf call Q109 results May 15 2009 5
Profitability still growingExtraordinary growth in profitability:
Gross Margins +36.4% Q1 09 vs. Q1 08
from 64.6% to 69.9% of tot salesEBITDA +47.9% Q1 09 vs. Q1 08
from 33.9% to 39.8% of tot salesEBIT +55.6% Q1 09 vs. Q1 08
from 27.7% to 34.2% of tot sales
Thanks to:●
Improved technology mix: CLIA revenues represents 60.6% in Q1 09
vs. 56.6% in Q1 08●
Extraordinary Vitamin D test revenue growth●
Lower incidence of instrument depreciation and operational expenses on total sales
●
Lower incidence of instruments revenue
●
Lower incidence of OPEX
●
Positive exchange rate effect
●
Biotrin
contribution
Net Result
+29.8% Q1 09 vs. Q1 08
from 17.9% to 18.4% of tot sales
Despite of net financial costs in Q1 09 of 3.6 MM €
of which 2.8 MM €
are non cash items related to the evaluation of group NFI in US dollars

Conf call Q109 results May 15 2009 6
Q1 results: balance sheet & cash flowmillions € 31/03/2009 31/12/2008
Total tangible
asset 37.2 35.4
Total intangible
asset 96.9 93.3
Other
non-current
asset 10.3 10.1
Net Working
Capital 61.0 57.7
Other
non-current
liabilities (23.4) (22.9)
Net Capital Employed 182.0 173.9
Net Debt (12.1) (19.8)
Total shareholder’s’
equity (169.9) (154.1)
Q1
09 Q1
08
Net change
in cash
and cash
equivalents 8.4 4.7
Cash
and equivalents
at the end of
the period 25.2 13.1

Conf call Q109 results May 15 2009 7
Solid financial structure
●
Operating cash flow €
18.1 MM (before capex
of €
8.8MM) in Q1 09 vs.
€
8.2 MM in Q1 08 (before capex
of €
2.7MM);
●
Net debt of €
12.1 MM at 31.03.09 vs. €
19.8 MM at year end 08.
●
Cash and equivalents at the end of Q1 09 amount to €
25.2 MM
Conf call Q109 results May 15 2009 8
Forthcoming events
6th Annual Pan European Bank of America -
Merrill Lynch
MedTech
Conference
19th –
21st May 2009
London
European Midcap Forum
28th -
29th May 2009
New York