q2 2016-researchand forecastreport-surabaya
TRANSCRIPT

Surabaya Property Market Report
Research & Forecast Report
H1 2016
Accelerating success.

2 Half Year Report | H1 2016 | Surabaya | Colliers International
Office SectorPakuwon Center and MNC Tower became newly operating of-fice buildings in H1 2016, contributing 27,260 sq m and bringing the total office space in Surabaya to 296,512 sq m. This influx brought the occupancy down to 81.1% as of H1 2016. Neverthe-less, asking base rent grew by 28% compared to last semester and was recorded at an average of IDR140,082/sq m/month. This is because the two newly opened buildings with higher rental tariffs drove the overall increase in rents.
Apartment SectorThe completion of three new apartment projects during H1 2016 resulted in additional supply of 2,872 units, a 10.6% increase when compared to the last semester of 2015. As of H1 2016 the total stock of strata-title apartments in Surabaya amounted to 26,463 units. Sales activity came to a standstill during the period with relatively stable take-up compared to the previous semes-ter. Most of the transactions which occurred were concluded in the middle to lower class projects that have prices ranging from IDR400 million to IDR650 million per unit. The asking price of an apartment in Surabaya continued to increase modestly by 2% HoH and reached IDR19.4 million/sq m.
HighlightRetail SectorMarvel City Shopping Mall (15,000 sq m net area) became a new-ly operating shopping centre during H1 2016. Conversely, Golden City has ceased operation since early 2016 for renovation thus reducing the cumulative supply of shopping center space in Sura-baya by around 18,000 sq m to 967,808 sq m. The newly operat-ing Tunjungan Plaza V and Marvel City that began operation in the last one year brought more vacant retail space onto the mar-ket and pressured occupancy rates down by 1.7% YoY to 82.4%. The average asking base rent was recorded at IDR439,770/sq m/month which confirmed that rates have been relatively flat over the last semester.
Hotel SectorDuring H1 2016, there were four new star-rated hotels which started operating as well as one existing hotel which expanded. The total number of star-rated hotel rooms in Surabaya added to 11,079 rooms from 66 hotel projects. AOR decreased by 1.5% over the previous semester bringing it to 54.14%. ADR was down to USD47.04 or 4% lower when compared to the previous se-mester.

OFFICE FOR LEASE
SupplyPakuwon Center and MNC Tower became newly operating of-fice buildings in Surabaya. These office buildings contribute 27,260 sq m of new office spaces to become a total of 296,512 sq m in H1 2016. Pakuwon Center is an office building that is part of mega development by Pakuwon in Surabaya namely Tunjungan City. Another office building that is currently under construction will also be available in the Tunjungan City.
During 2015, Surabaya office market recorded zero supply but in 2016 the market is anticipating the completion of several new office buildings including Skyline, Samator Skysuites SOHO and AMG Tower. These three office buildings are expected to begin operational in H2 2016. Entering 2017, supply of office space will be very limited, however during 2016 – 2018 supply will grow by an average of around 30% per annum with most of the supply will be stacked up in 2018. Given that most of the future projects scheduled for completion in 2018 are still in the planning stage, supply projection is likely changeable.
Source: Colliers International Indonesia - Research
Cumulative Office Supply
SupplyThere will be three office buildings providing 72,821 sq m in the second semester of 2016. Further, we anticipate the Surabaya office market will record an additional 238,592 sq m of office space during 2017 – 2018.
DemandInfrastructure-related companies including those building roads and power plants are becoming more common tenants while insurance, bank and other finance-related companies remain active in search-ing for space.
OccupancyThe occupancy rate will potentially drop by a further 5% by the end of 2016 because of the influx of new office buildings.
RentThe average asking rental rate has already gone up by 25% HoH due to the influx of expensive buildings during the H1 2016. With the already high rental rate, the overall increase for the next semester is pro-jected to be only around 3%.
Office Sector
Forecast at a glance
0
100,000
200,000
300,000
400,000
500,000
600,000
700,000
2010
2011
2012
2013
2014
2015
2016
YTD
2016
F
2017
F
2018
F
sq m
Existing Supply Annual Supply

4 Half Year Report | H1 2016 | Surabaya | Colliers International
Source: Colliers International Indonesia - Research
Cumulative Office Supply based on marketing Scheme
Of the total 28 operating office buildings in Surabaya, only four are strata-title buildings offered for sale and that accounts for cumulative supply of 61,060 sq m as of H1 2016. Pakuwon Cen-ter is the most current strata-title office building in Surabaya after the Spazio which began operation in 2011. The strata-title office market is expected to further grow in Surabaya with at least seven office buildings in the pipeline that will provide more office space for sale up to 2018. In addition to Pakuwon Center; two office buildings: Skyline and Samator Skysuites are strata-title office buildings that will likely be ready for occupation in H2 2016.
The centre of business gravity in Surabaya has been concentrat-ed in Central Surabaya but along with land scarcity, it provides opportunity for other areas to grow, particularly East Surabaya. Starting as residential areas, East Surabaya has transformed into a matured location with developing infrastructure such as MERR (Middle East Ring Road); in-planning MRT (connecting south – north area); and LRT (connecting east – west area) that will benefit East Surabaya in becoming a growing commercial area. At least three large scale projects will be located near MERR; namely Puncak Dharmahusada, One Galaxy and Sama-tor Kedung Baruk. Puncak Dharmahusada and One Galaxy are in the planning stages and are expected to meet their comple-tion in 2018 and 2019. By 2018, the cumulative office supply in East Surabaya is expected to reach around 100,000 sq m.
Another fully-fledged corridor comprising three main roads is MayJend Sungkono – HR Muhammad – Darmo connects West and South Surabaya. It is an established corridor with potential growth for high-rise commercial buildings. At least five future office buildings will contribute around 128,000 sq m of office spaces or 73% of total future supply in West and South Sura-baya during 2016 – 2018. Most of these office building are still in the planning stages as of H1 2016. West and South Surabaya are expected to see more new office buildings after 2018.
In extending the use of plot ratio in becoming-scarce land stock condition, there will be more mixed-use development projects planned to be built in Surabaya. Around 16 of 20 future office buildings up to 2020 will be part of mixed-use development projects. The latest is the joint venture of Waskita Karya and Darmo Permai in cooperation with Rigel Technology (Singapore) to develop 88 Avenue. Overall, only a few of those projects have begun construction works including Tunjungan City, Samator and Ciputra World. In addition to the Ciputra World project, Cipu-tra Group (the owner) also plans to develop an office building within their huge land bank in West Surabaya.
Source: Colliers International Indonesia - Research
Existing Supply and Future Office Distribution in Several Regions in Surabaya
0
50,000
100,000
150,000
200,000
250,000
300,000
350,000
400,00020
10
2011
2012
2013
2014
2015
2016
YTD
2016
F
2017
F
2018
F
sq m
For Lease For Sale
0 50,000 100,000 150,000 200,000 250,000
Central Surabaya
South Surabaya
East Surabaya
West Surabaya
sq m
Projected Additional Supply in 2016F - 2018F Existing Supply 2016YTD

5 Half Year Report | H1 2016 | Surabaya | Colliers International
New Supply PipelineOFFiCE builDingS
pROjECt namE lOCatiOn DEvElOpER Sga (Sq m) maRkEting SChEmE
2016
Skyline Office Tower Mayjend Sungkono Menara Bumi Sejahtera 38,821 For Lease & Sale
AMG Tower Dukuh Menanggal 1A, Gayungan Saraswanti Graha Indah 12,000 For Lease & Sale
The Samator Skysuites SOHO Kedung Baruk Samator Land 22,000 For Sale
2017
Ciputra World Surabaya Skyloft SOHO
Mayjend Sungkono Ciputra Group 16,745 For Sale
2018
The Frontage Ahmad Yani Trikarya Graaha Utama 30,000 For Sale
Marvel City Ngagel PT Assa Land 12,000 For Lease
Spazio Tower Darmo Boulevard Intiland Development 20,000 For Sale
Tunjungan Plaza VI Basuki Rahmat Pakuwon Jati 39,740 For Lease
Praxis Office Panglima Sudirman Intiland Development 25,000 For Lease
Voza Office Tower HR Muhammad Avia Avian 32,833 For Sale
Puncak Dharmahusada MERR, Mulyorejo Surya Bumimegah Sejahtera 40,000 For Lease
Satoria Tower HR Muhammad Satoria Group 34,000 For Lease
2019
Grand Sungkono Lagoon Abdul Wahab Siamin PP Property 45,000 For Lease
Capital Square HR Muhammad Greenwood 30,000 For Lease
One Galaxy Dharmahusada Sinar Galaxy Group 40,000 For Lease
Puncak Bukit Golf Square Darmo Boulevard Surya Bumimegah Sejahtera 30000 For Lease
Puncak CBD Jajar Tunggal Jajar Tunggal Surya Bumimegah Sejahtera 30,000 For Lease
Ciputra World SOHO Mayjend Sungkono Ciputra Group 37,400 For Sale
Signature Gallery Gubeng AKR Land 40,000 For Lease
2019
The SOHO 88 Avenue Darmo Permai Darmo Permai 22,100 For Sale
The Infinity 88 Avenue Darmo Permai Darmo Permai 21,250 For Lease
Source: Colliers International Indonesia - Research
PerformanceOccupancy Rates
Despite average occupancy rates there has been moderate growth during 2010 - 2015. Only the influx of newly operating office buildings brought the occupancy down to 81.1% as of H1 2016. Thanks to ‘tenants by group’ owners who occupied these newly operating office buildings, the average occupancy level was maintained at above 80% in Surabaya.
The occupancy rates in Central Surabaya have significantly dropped since last year, particularly due to the operation of new office buildings that brought the occupancy down 9% in one semester. Albeit insignificant, office demand was seen to still grow in Central Surabaya with several existing office buildings securing tenants (mainly related to finance industry) acquiring spaces of between 200 and 300 sq m HoH.

6 Half Year Report | H1 2016 | Surabaya | Colliers International
Source: Colliers International Indonesia - Research
Occupancy Rates
While Central Surabaya underwent a steep drop in occupancy, some other areas showed relatively flat occupancy rates dur-ing a semester. However, the upcoming future office buildings planned are expected to meet completion in H2 2016 and would seemingly bring occupancy down in Surabaya, particularly in East and South Surabaya. Should the forthcoming office build-ings be completed, Surabaya will have around 100,000 sq m of total additional space during 2016. Thus far, the relatively low commitment level at these new spaces available in both newly operating and future office buildings will be a challenging situa-tion for the office market in Surabaya going forward.
Source: Colliers International Indonesia - Research
Space absorbed at Future Office buildings
In general, the growth of office demand is historically in line with the country’s Gross Domestic Product (GDP) growth. Bank Indonesia (The Central Bank) forecast that GDP will grow at between 5.0% and 5.5% in 2016. Using this assumption, the average annual absorption in 2016 – 2018 is expected to be around 14,000 sq m, way below the average annual supply that will reach 110,000 sq m in the same period. This will give much pressure to the occupancy performance particularly in 2018 when the amount of new office supply is huge. As of H1 2016, the pre-commitment level of the future office buildings slated to become new supply during 2016-2018 was recorded at only 12% which is a real challenging situation for office market in Surabaya.
0%
10%
20%
30%
40%
50%
60%
70%
80%
90%
100%
2010 2011 2012 2013 2014 2015 2016YTD
Source: Colliers International Indonesia - Research
Occupancy Rates in Different Regions of Surabaya
0%
10%
20%
30%
40%
50%
60%
70%
80%
90%
100%
Central Surabaya
South Surabaya
East Surabaya
West Surabaya
H1 2015 H2 2015 H1 2016
0 50,000 100,000 150,000 200,000 250,000
2016F
2017F
2018F
sq mAbsorbed Unabsorbed
Asking Base Rent Asking base rent for general office spaces in Surabaya was re-corded at an average of IDR140,082/sq m/month as of H1 2016, reflecting a growth by 28% compared to last semester. While the existing office buildings generally maintain the rental tariff (only one building introduced slightly higher rent), the overall increase was mainly driven by two newly operating buildings with higher rental tariff, i.e. MNC Tower and Pakuwon Center. Both buildings are located in the central business area in Sura-baya and offer modern design buildings and thus capture higher rents above the current average market. Benefiting from the location within mixed-use projects, some future office build-ings will seemingly be offered at higher rates which would push rents further up in Surabaya.

7 Half Year Report | H1 2016 | Surabaya | Colliers International
Source: Colliers International Indonesia - Research
average asking Rents
Source: Colliers International Indonesia - Research
the YoY average Rental Rate (/sq m/month) in Surabaya
Source: Colliers International Indonesia - Research
average Service Charge
IDR0
IDR30,000
IDR60,000
IDR90,000
IDR120,000
IDR150,000
2010
2011
2012
2013
2014
2015
2016
YTD
IDR0
IDR50,000
IDR100,000
IDR150,000
IDR200,000
IDR250,000
Central Surabaya
South Surabaya
East Surabaya
West Surabaya
H1 2015 H2 2016
Service ChargeThe average service charge was recorded at IDR69,768/sq m/month as of H1 2016, showing an increase albeit very modestly HoH. On average, service charge grew by 10% to 11% per an-num since 2013 in Surabaya. Most office buildings reviewed the service charges every two years.
Service charges were offered at between IDR25,000 and IDR95,000/sq m/month with the majority of buildings quote the tariff in the range of IDR50,000 to IDR80,000/sq m/month. Plaza BRI, Intiland Tower, Gedung Bumi Mandiri and Wisma BII are office buildings that recorded service charges at above IDR80,000/sq m/month as of H1 2016.
IDR0
IDR15,000
IDR30,000
IDR45,000
IDR60,000
IDR75,000
2010
2011
2012
2013
2014
2015
2016
YTD

8 Half Year Report | H1 2016 | Surabaya | Colliers International
OFFICE FOR SALE/STRATA-TITLESince Pakuwon Center began in operation, Surabaya expects to see around 185,000 sq m of strata-title office space up to 2018, of which 65% (around 120,000 sq m) have been offi-cially offered. Thus far the pre-committed level (sales rate) has achieved around 60% as of H1 2016. About 21,000 sq m of were absorbed per annum during 2013 – 2016YTD. Only since 2015 demand for strata-title office decreased. Number of office spaces sold in the first semester of 2016 was lower in the same period last year.
By achieving more than 50% take-up commitment, the average asking price of future office buildings for sale was recorded at IDR27.4 million/sq m which reflected an increase by 3.3% over the last semester. Meanwhile, the average asking price of exist-ing strata-title office buildings was relatively flat YoY and was registered at IDR29.5 million/sq m as of H1 2016.
Source: Colliers International Indonesia - Research
asking prices Source: Colliers International Indonesia - Research
annual Space absorbed for Future Office building
0
10,000
20,000
30,000
40,000
2013 2014 2015 2016YTD
IDR
0
IDR
10,0
00,0
00
IDR
20,0
00,0
00
IDR
30,0
00,0
00
IDR
40,0
00,0
00
Existing
Future

APARTMENT FOR STRATA-TITLE
SupplyFollowing the completion of three new apartment projects dur-ing H1 2016, Surabaya apartment market registered additional supply by 2,872 units, a 10.6% increase compared to last se-mester of 2015. These newly completed projects are mostly dominated by the middle to low segment (90.5%)- from Gu-nawangsa MERR (Tower B) and Puncak Bukit Golf, while the upper class contribution comes from The Peak Residence. As of H1 2016 the total stock of strata-title apartment in Sura-baya amounted to 26,463 units, mainly concentrated in West Surabaya (46%) and East Surabaya (43%) followed by South Surabaya (7%) and Central Surabaya (4%).
Despite the lackadaisical economic condition which brings fur-ther downward pressure to sales performance, some develop-ers nonetheless still hold high expectation over the market. The confidence continues with new projects being introduced or launched during H1 2016. Five projects introduced this quar-ter are mostly brand new projects including Klaska Residence, Tamansari Emerald and Belleview Manyar, while Cornell and Denver Apartment are the extension of Universitas Ciputra Apartment, Berkeley Tower. These projects are targeting the middle-lower segment to cater to the demand from college students, staff and teachers, as well as workers from the sur-rounding universities and office buildings.
Klaska Residence is part of the first mixed-use development by Sinar Mas Land in Surabaya, located on a 3.1 hectares land at Jagir Wonokromo, Central Surabaya. This apartment proj-ect will consist of three towers equipped with supporting fa-cilities, such as retail and shop houses (mainly F&B retailers). Belleview Manyar, located in East Surabaya, is a single tower apartment offering 1-BR to 3-BR type of unit. The three proj-ects located in West Surabaya including Tamansari Emerald, Cornell Apartment and Denver Apartment, will target mainly college students and teachers from surrounding universities, such as Ciputra University (UC) and State University of Sura-baya (UNESA – Universitas Negeri Surabaya).
Apartment SectorForecast at a glance
SupplyBy end of 2019, Surabaya anticipates another 28,142 new apartment units scattered mainly in East Sura-baya (47%) and West Surabaya (32%).
DemandSales activity remains stable compared to last se-mester. Developers have been maintaining sales level by lengthening cash installments by up to 100 months. The absorption rate is predicted to hover between 80% and 83%.
PriceIn this challenging market, developers will be reluc-tant to introduce higher prices so we predict prices will remain relatively stable through the end of 2016. We expect a 6% to 8% price growth YoY.
RentWe do not believe rental rates will change in H2 2016.

10 Half Year Report | H1 2016 | Surabaya | Colliers International
Source: Colliers International Indonesia - Research
the location of Future apartment units During 2016 - 2019
Completed Apartment Projects During H1 2016
namE OF DEvElOpmEnt lOCatiOn REgiOn DEvElOpER nO. OF unitS
The Peak Residence Jl. Basuki Rahmat Central Surabaya Pakuwon Group 272
Puncak Bukit Golf Jl. Raya Bukit Darmo Boulevard I West Surabaya Puncak Group 2,000
Gunawangsa MERR (Tower B) Jl. Kedung Baruk East Surabaya Gunawangsa Group 600
Total 2,872
Source: Colliers International Indonesia - Research
Newly Introduced/Launched in H1 2016
apaRtmEnt lOCatiOn REgiOn nO. OF unitS
ExpECtED COmplEtiOn timE
aSking pRiCE/Sq m* (iDR milliOn)
Klaska Residence Jagir Wonokromo Central Surabaya 1,000 2019 17.5
Tamansari Emerald Citraraya housing complex West Surabaya TBA** 2019 17.5
Belleview Manyar Manyar Kertoajo East Surabaya 460 2019 16.75
Cornell Apartment Citraland West Surabaya 416 2020 14
Denver Apartment Citraland West Surabaya 450 2020 14.25Notes:*Price excludes 10% VAT**TBA: to be announcedSource: Colliers International Indonesia - Research
Surabaya is one of the most densely populated cities as well as one of Indonesia’s main trading hubs in the eastern region. As the city grows with the development of more residential and commercial buildings, and with more motorcycles in the road, the burden of the city is becoming heavier. As a result, roads (both toll and main road) are very crowded with traffic, espe-cially during the rush hour. Surabaya is intensively developing transportation infrastructure in an attempt to minimise conges-tion. Tri Rismaharini who is now Mayor of Surabaya City for a second term has committed to continue the on-going infra-structure projects including the construction of the Eastern and Western Outer Ring Roads and the Frontage Road at Jl. Ahmad Yani.
The development pipeline from now to 2019 consists of 28,142 apartment units where the majority will be located in the two most developing areas i.e. East Surabaya area and West Sura-baya. Under the current circumstances, we anticipate seeing a delay in delivery schedules of some projects, particularly given the slow construction progress.
Central Surabaya
13%
West Surabaya
32%East
Surabaya47%
South Surabaya
8%

11 Half Year Report | H1 2016 | Surabaya | Colliers International
DemandSales activity came to a standstill during H1 2016, with relatively stable take-up rate compared to the previous semester. Demand for apartments started to show a little improvement, however newly launched apartment projects put downward pressure on the overall take-up rate as such projects provide more new un-sold units in the market. Most of the transactions are concluded in the middle to lower projects which have prices ranging from IDR400 million to IDR650 million per unit.
Source: Colliers International Indonesia - Research
Average Take-up Rates for Operating and Under- Construction Projects
H1 2015 H2 2015 H1 2016 HoH YoY
Existing projects 98.20% 97.00% 97.00% 0.00% -1.20%
Under-construction projects
71.60% 70.30% 68.30% -2.00% -3.30%
Overall 80.90% 81.10% 81.00% -0.10% 0.10%
There are several factors that determine sales performance. For example, apartment projects located within an academic community like universities and provide mainly studio type of units are in most cases quite successful in the sales. Along with shifting lifestyle, university students opt to live in an affordable apartment instead of choosing traditional dormitory or rented house/room so they can secure more facilities like gym, swim-ming pool, retail shop and dedicated study room.
Source: Colliers International Indonesia - Research
Average Take-up Rates in Different Regions in SurabayaH1 2015 H2 2015 H1 2016 HoH YoY
West Surabaya 88.50% 86.00% 86.60% 0.60% -1.90%
East Surabaya 74.90% 79.80% 80.80% 1.10% 6.00%
South Surabaya 90.40% 66.30% 68.70% 2.40% -21.70%
Central Surabaya 70.50% 79.90% 63.70% -16.20% -6.90%
East Surabaya has consistently made headway in the apart-ment sales performance, better than other areas in Surabaya. On the contrary, a massive influx of new apartment units from middle-lower projects located in Central Surabaya during two consecutive semesters has brought this area to record the low-est absorption rate. In West Surabaya, demand for apartments remains high despite the influx of new projects launching, re-flected by the stable take-up rate for the last two consecutive semesters. In South Surabaya, the absence of new supply dur-ing this period, made the area post the highest increase in the take-up rate by 2.4% compared to previous period.
Asking PriceThe asking price of apartments in Surabaya continued to in-crease in H1 2016 and reached IDR19.4 million/sq m, up mod-estly by 2% HoH and 6% YoY. However, the figure below showed that the pace of price increment continued to slow down, evi-denced by the current annual growth that is lower than the av-erage growth in the last three years (CAGR – Compound Annual Growth Rate of 9.7%).
Overall, price adjustments during the reviewed period are driv-en by continuing construction progress as well as by some well absorbed projects which increased the price as high as 10% to 16.5% compared to previous period. Nonetheless, market now is competitively challenging, affirmed with softening demand and tighter competition among the under-construction projects. Developers have become more cautious to adjust prices and thus resulted in further limitations on price growth in all regions of Surabaya.
Source: Colliers International Indonesia - Research
Cumulative Supply More in-house financing has been the common phenomenon in the apartment market. In order to boost sales amid weakening purchasing power, developers are more willing to give “extra incentives” to attract potential buyers with longer installment schemes. The longer cash installment facilitated by developers was up to 60 months but recently we witness that developers can provide cash installment schemes for100 months.
0
5,000
10,000
15,000
20,000
25,000
30,000
35,000
40,000
45,00020
08
2009
2010
2011
2012
2013
2014
2015
2016
YTD
2016
F
2017
F
2018
F
sq m
Existing Supply Annual Supply

12 Half Year Report | H1 2016 | Surabaya | Colliers International
Source: Colliers International Indonesia - Research
price growth of apartment in Surabaya
Source: Colliers International Indonesia - Research
Price Changes in Different Location in SurabayaH1 2015 H2 2015 H1 2016 HoH YoY
West Surabaya 18,608,260 20,196,674 20,489,526 1.50% 10.10%
East Surabaya 14,169,000 14,471,972 15,096,816 4.30% 6.50%
South Surabaya 17,543,433 17,534,063 17,840,790 1.70% 1.70%
Central Surabaya 28,703,804 28,739,518 29,537,109 2.80% 2.90%
The vibrant development activities in West Surabaya has trig-gered more competition in the market and led to a downward pressure on price growth HoH, only increased moderately by 1.5% to IDR20.5 million/sq m. The average apartment price in East Surabaya is the lowest but experienced the highest growth over the last semester. South Surabaya recorded only 1.7% increment due to relatively quiet market, evidenced by lim-ited number of new future supply as well as slow construction progress in the under-construction projects, such as Frontage and The City Square. Due to limited newly introduced/launched apartment projects in Central Surabaya, developers opted to focus on selling the unsold units, thus the price increment is driven by continuing construction progress.
mapping of Summary apartment for Strata-title in Surabaya
Source: Colliers International Indonesia - Research
IDR0
IDR5,000,000
IDR10,000,000
IDR15,000,000
IDR20,000,000
IDR25,000,000
H1 2013 H1 2014 H1 2015 H1 2016

13 Half Year Report | H1 2016 | Surabaya | Colliers International
APARTMENT FOR LEASE
SupplySurabaya has neither additional supply nor any newly launched apartments for lease, both serviced and non-serviced, during the first half of 2016. Total units of apartment for lease in Sura-baya remains at 773. The majority of these apartments are lo-cated in West Surabaya. Two apartments including Citadines Marvell Surabaya and Oakwood Serviced Apartment (totaling 432 units) are slated to complete in 2017. Both Citadines Mar-vell Surabaya and Oakwood Apartment Surabaya are located in East Surabaya and are part of mixed-use development.
Citadines Marvell Apartment will become the third property managed by The Ascott Limited (Ascott), after Somerset Sura-baya and Ascott Waterplace Surabaya which started operating in 2001 and 2015, respectively. Located in Ngagel area, close to Rungkut Industrial area, the serviced apartment is targeting the corporate market and travellers. Meanwhile, Oakwood Apart-ment Surabaya will be the first Oakwood Worldwide property in Surabaya. Unlike the Oakwood Premier brand in Jakarta, the Oakwood Apartment provides fully-equipped units with limited service.
Source: Colliers International Indonesia - Research
Supply Distribution of apartment units for lease in Surabaya
Source: Colliers International Indonesia - Research
Supply Pipeline of Serviced Apartments in SurabayanamE OF DEvElOpmEnt lOCatiOn REgiOn YEaR OF OpERatiOn nO. OF unitS
Citadines Marvell Surabaya Jl. Ngagel East Surabaya 2017 288
Oakwood at One East Residence Jl. Raya Kertajaya Indah No. 79 East Surabaya 2017 144
OccupancyThe market of apartment for lease in Surabaya remained stable with a modest increase in the overall occupancy rate. As of H1 2016, the average occupancy rate increased by 1.3% from the previous period, bringing the occupancy rate to 61.1%.
The various national holidays and Surabaya food festival, as well as Surabaya Fair, adds further interest in the city, particu-larly from domestic travellers. In addition, many governmental events and exhibitions held in Surabaya have resulted in high occupancy level, especially serviced apartment located in Cen-tral Surabaya. In other words, the increase of average occu-pancy level is helped by short-term occupiers during H1 2016. On the other hand, leasing inquiries from expatriates were seen to surface during the first half of 2016, mainly from industrial estate and infrastructure projects which Surabaya is currently heavily involved in here.
Source: Colliers International Indonesia - Research
Occupancy
Central Surabaya
10%
West Surabaya
77%
East Surabaya
9%
South Surabaya
4%
0%
10%
20%
30%
40%
50%
60%
70%
80%
90%
100%
H1 2
013
H2
2013
H1 2
014
H2
2014
H1 2
015
H2
2015
H1 2
016

14 Half Year Report | H1 2016 | Surabaya | Colliers International
Overall, in this environment where there are a combination fac-tors, such as slower incoming of expatriates, reduced rental budgets, and increasing competition from individual-owned strata-title apartments, landlords of apartments for lease will have to excogitate to draw in tenants. Despite the lack of de-mand from expatriates, short-term tenants come mostly from individual business travellers and weekend family holiday mak-ers who continue to be the main contributors to keep the overall occupancy rate stable.
Rental RateOverall, the serviced apartment market in Surabaya experi-enced a slight rental increase of 1.5% HoH and 7.8% YoY to IDR226,376/sq m/month. The rental increment occurred only in the particular project which achieves good performance dur-ing previous year. However, in general, sluggish demand and head-to-head market competition with individual-owned stra-ta-title apartment left no room for rentals to grow significantly.
Most serviced apartment operators are in the position to main-tain the existing rates but are also offering various rental con-cessions to entice prospective tenants, both from individual and corporate tenants. It should be noted that only Ascott Water-place Surabaya increased the rental tariff by 12% compared to previous semester due to their offer of better quality buildings, equipped with better facilities and modern furnishing as well as good performance during the reviewed period. On the other hand, as the only non-serviced apartment in Surabaya, Pun-cak Marina has maintained their rental rate of IDR96,537/sq m/month for the last two years.
Currently, a typical one bedroom serviced apartment in Sura-baya is offered at around IDR18.5 million/unit/month, while two and three bedroom are offered at around IDR19.6 million/unit/month and IDR22.2 million/unit/month.
average Rental Rate of Serviced apartments in Surabaya
Source: Colliers International Indonesia - Research
IDR0
IDR25,000
IDR50,000
IDR75,000
IDR100,000
IDR125,000
IDR150,000
IDR175,000
IDR200,000
IDR225,000
IDR250,000
H1 2
013
H2
2013
H1 2
014
H2
2014
H1 2
015
H2
2015
H1 2
016

Half Year Report
SURABAYA | OFFICEFirst Half 2016 Accelerating success.
SupplyAfter the beginning of operation of Tunjungan Plaza V last year, Marvel City Shopping Mall became a newly operating shopping centre during H1 2016. This shopping centre is located in a mixed-use development project and provides around 15,000 sq m of net lettable area (NLA). Conversely, Golden City which is located at Jalan Wahab Siamin (South Surabaya) stopped op-eration early 2016 for renovation. By reducing around 18,000 sq m, cumulative supply of shopping centre space in Surabaya was recorded at 967,808 sq m as of H1 2016.
There are 30 operating shopping centres in Surabaya since the opening of Pasar Atum in 1976 which means that the aver-age annual supply until now is around 23,000 sq m. The retail market is expecting a huge additional retail of around 300,000 sq m from now up to the end of 2018. However, based on development status, most of these shopping centres ares in the planning stage which might be uncertain in the completion schedule. Three of the future shopping centres are already in the under construction stage, namely Supermal Pakuwon 2, Tunjungan Plaza VI and The Central Gunawangsa. These three shopping centres have been under construction since 2014 – 2015.
Most future shopping centres in Surabaya will be part of mixed-use development or as an expansion plan of the operating project. The developers aim at maximising the use of the land amidst land scarcity in most commercial areas in Surabaya. The mixed-use concept has been quite successful in Suraba-ya and this will be imitated in the future projects like Ciputra World Surabaya Mall 2, Supermal Pakuwon 2, Tunjungan Plaza VI and One Galaxy Mall (third stage of the whole development).
Another future shopping centre will likely come from a gov-ernment project. Recently, the government of Surabaya City confirmed to terminate lease agreement with the management of Hi-Tech Mall in North Surabaya and that will end in 2019. The major issue arose mainly because the land value in the contract is lower than the current Tax Office Appraised Value (NJOP). The projects will be taken over by the government af-ter the end of the contract and the city government will initiate a search for investors to re-develop that commercial area.
Retail SectorForecast at a glance
SupplySurabaya will see additional retail space of 40,000 sq m by end 2016 and will further receive 263,750 sq m during 2017 – 2018.
DemandWe anticipate more fashion and food retailers in Surabaya.
OccupancyOccupancy should slightly drop by 1% by end of 2016 owing to the commitment level of tenants in the new shopping centres.
RentThe operation of new shopping centres, and their higher asking rates, will likely result in overall rent increases of 3% to 5%.

16 Half Year Report | H1 2016 | Surabaya | Colliers International
Source: Colliers International Indonesia - Research
Cumulative Supply of Retail Centers in Surabaya
When Supermal Pakuwon 2 gets to completion time, the cumu-lative retail supply will be circa one million sq m in Surabaya as of 2016. Of the overall retail space stock in Surabaya, around 36% is marketed as retail space for sale (strata-title). This pro-portion will decrease in line with the absence of additional stra-ta-title shopping centres up to 2018. Total retail space for sale is expected to contribute only 29% of the total supply in 2018.
Source: Colliers International Indonesia - Research
Cumulative Supply of Retail Centers based on marketing Scheme
All regions in Surabaya will actively contribute additional new retail spaces. Central and South Surabaya will share around 160,000 sq m or 52% of total projected additional supply by 2018. South Surabaya itself will become the most active region in providing future additional retail supply. As of H1 2016, four shopping centres which are located in A. Yani – Mayjend Sung-kono corridor are expected to meet completion time in 2017 – 2018. These four future shopping centres will bring 91,000 sq m of additional supply by 2018.
Source: Colliers International Indonesia - Research
total Existing and projected Retail Space in Several Regions in Surabaya
0
200,000
400,000
600,000
800,000
1,000,000
1,200,000
1,400,000
2010
2011
2012
2013
2014
2015
2016
F
2017
F
2018
F
sq m
Existing Supply Additional Supply Additional YTD Future Supply
0
100,000
200,000
300,000
400,000
500,000
600,000
700,000
800,000
900,000
1,000,000
2010
2011
2012
2013
2014
2015
2016
YTD
2016
F
2017
F
2018
F
sq m
For Lease For Sale
0 90,000 180,000 270,000 360,000 450,000
Central Surabaya
South Surabaya
North Surabaya
East Surabaya
West Surabaya
sq mExisting Supply Future Supply
17 Half Year Report | H1 2016 | Surabaya | Colliers International
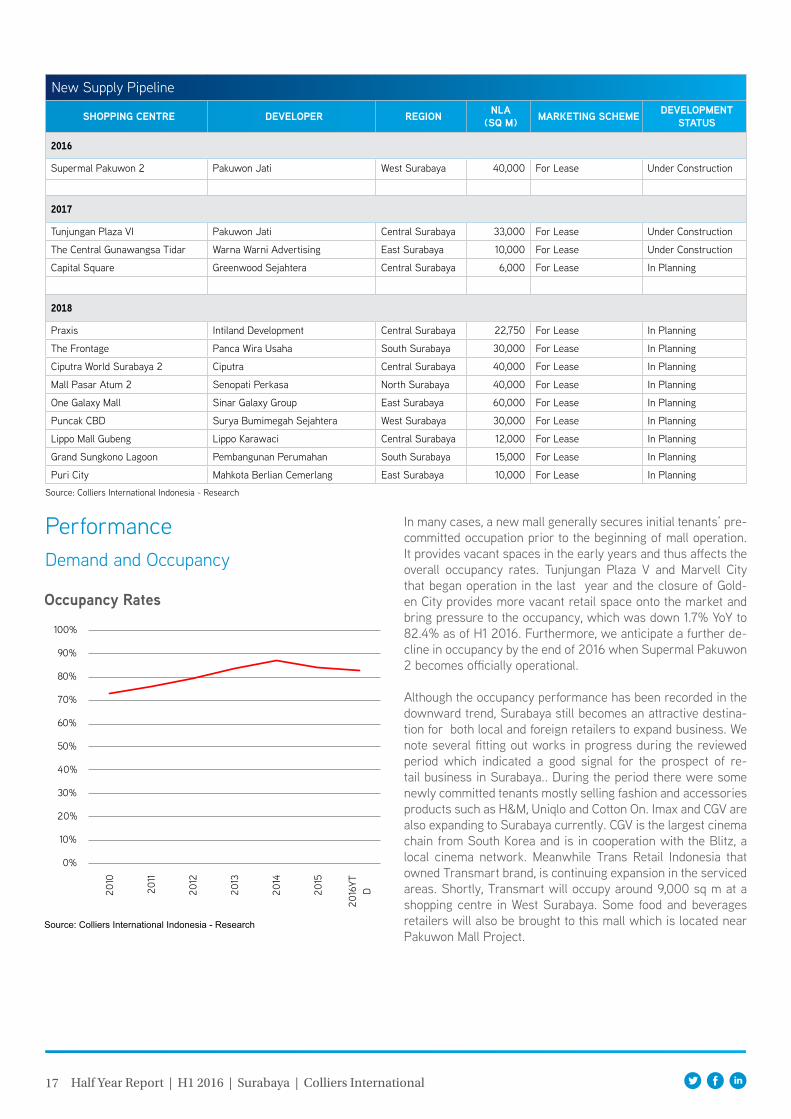
New Supply Pipeline
ShOpping CEntRE DEvElOpER REgiOn nla (Sq m) maRkEting SChEmE DEvElOpmEnt
StatuS
2016
Supermal Pakuwon 2 Pakuwon Jati West Surabaya 40,000 For Lease Under Construction
2017
Tunjungan Plaza VI Pakuwon Jati Central Surabaya 33,000 For Lease Under Construction
The Central Gunawangsa Tidar Warna Warni Advertising East Surabaya 10,000 For Lease Under Construction
Capital Square Greenwood Sejahtera Central Surabaya 6,000 For Lease In Planning
2018
Praxis Intiland Development Central Surabaya 22,750 For Lease In Planning
The Frontage Panca Wira Usaha South Surabaya 30,000 For Lease In Planning
Ciputra World Surabaya 2 Ciputra Central Surabaya 40,000 For Lease In Planning
Mall Pasar Atum 2 Senopati Perkasa North Surabaya 40,000 For Lease In Planning
One Galaxy Mall Sinar Galaxy Group East Surabaya 60,000 For Lease In Planning
Puncak CBD Surya Bumimegah Sejahtera West Surabaya 30,000 For Lease In Planning
Lippo Mall Gubeng Lippo Karawaci Central Surabaya 12,000 For Lease In Planning
Grand Sungkono Lagoon Pembangunan Perumahan South Surabaya 15,000 For Lease In Planning
Puri City Mahkota Berlian Cemerlang East Surabaya 10,000 For Lease In Planning
Source: Colliers International Indonesia - Research
PerformanceDemand and Occupancy
Source: Colliers International Indonesia - Research
Occupancy Rates
In many cases, a new mall generally secures initial tenants’ pre-committed occupation prior to the beginning of mall operation. It provides vacant spaces in the early years and thus affects the overall occupancy rates. Tunjungan Plaza V and Marvell City that began operation in the last year and the closure of Gold-en City provides more vacant retail space onto the market and bring pressure to the occupancy, which was down 1.7% YoY to 82.4% as of H1 2016. Furthermore, we anticipate a further de-cline in occupancy by the end of 2016 when Supermal Pakuwon 2 becomes officially operational.
Although the occupancy performance has been recorded in the downward trend, Surabaya still becomes an attractive destina-tion for both local and foreign retailers to expand business. We note several fitting out works in progress during the reviewed period which indicated a good signal for the prospect of re-tail business in Surabaya.. During the period there were some newly committed tenants mostly selling fashion and accessories products such as H&M, Uniqlo and Cotton On. Imax and CGV are also expanding to Surabaya currently. CGV is the largest cinema chain from South Korea and is in cooperation with the Blitz, a local cinema network. Meanwhile Trans Retail Indonesia that owned Transmart brand, is continuing expansion in the serviced areas. Shortly, Transmart will occupy around 9,000 sq m at a shopping centre in West Surabaya. Some food and beverages retailers will also be brought to this mall which is located near Pakuwon Mall Project.
0%
10%
20%
30%
40%
50%
60%
70%
80%
90%
100%
2010
2011
2012
2013
2014
2015
2016
YTD

18 Half Year Report | H1 2016 | Surabaya | Colliers International
The retail occupancy performance in three regions in Sura-baya including East, South and West Surabaya has gradually decreased. A relatively low tenants’ commitment that opened at Marvell City brought the occupancy down 10.6% in East Sura-baya over the previous semester. As mentioned above, a tem-porary closure of Golden City Mall also caused the decreasing occupancy by 6% in South Surabaya, but it was still below the occupancy drop in East Surabaya by around 10%. A number of middle-upper class retailers in Supermal Pakuwon Indah 1 closed the stores particularly in anticipation of moving to the higher class Supermal Pakuwon Indah 2 which is now ap-proaching the finishing works. As such, the occupancy level in West Surabaya was down 2.5% HoH because of this.
Source: Colliers International Indonesia - Research
Occupancy Rates of Shopping Centers in Different Regions in Surabaya
Tenants’ Commitment at New and Future Shopping Centres in Surabaya
ShOpping CEntRE Marvell City Supermall Pakuwon Indah Extension The Central Gunawangsa Tunjungan Plaza V
COmmittED tEnant
CGV Blitz, LotteMart, Electronic Solution, Fun World
H & M, Sogo, Zara, Stradivarius, Mango, Pull & Bear, Sephora, Cotton On, Bershka, Mark & Spencer, Miss Selfridge, Guess, Forever New, Bonia, Fossil, Lacoste, Pedro, Aldo, Lottemart, Charles & Keith, Bath & Body Works, Quik Silver, Ripcurl, Burger King, Toys Kingdom, Chipmunks, Braun Buffel, Uniq-lo, Swaroski
Hari Hari, My Gym, Nang Kara-oke
Imax, Inul Vizta, Braun Buffel, Geox, Ecco, Bucheri, Nike, Ma-dame Lie, Sushi Tei, Fish & Co, Duck King, Marks Spencer, Kidz Station, Mothercare, Tree House, Gingersnaps, Chipmunks, Burb-erry, Louis Vuitton, Ermenegildo Zegna, BOSS, Balenciaga, Yves Saint Laurent, Toni Dress, The Premiere, XXI, Cotton On, Aero-postale, American Eagle, Paul Frank
Source: Colliers International Indonesia - Research
Rental RatesAsking base rents was recorded at IDR439,770/sq m/month which implied that the rates have been relatively flat over the last semester. The only region with rental adjustment was East Surabaya, albeit moderate. Marvel City as newly operating shopping centre located not far from the downtown of Surabaya offers higher asking rents than the exiting shopping centres in the East Surabaya. Still in the East, one established shopping centre in Jalan Dharmahusada adjusted the rents, particularly on the ground floor area due to continued inquiries for retail space. These two shopping centres helped bring the average asking rent in East Surabaya to record IDR381,049/sq m/month.
Nonetheless, the average asking rents in East Surabaya was still lower than in West and Central Surabaya. Central Surabaya continued to maintain the highest asking rents among all re-gions in Surabaya by recording IDR579,866/sq m/month. This figure was 70% more expensive than the lowest average asking rents in South Surabaya as of H1 2016. Most shopping cen-tres in South Surabaya are categorised as middle lower class shopping centres. The majority of shopping centres in south still charge rents in the range of IDR200,000 to IDR400,000/sq m/month. Overall, the average asking rent in South Surabaya was slightly up by 5.2% to IDR341,814 this semester particularly subsequent to the cessation of Golden City (which quoted lower rent than the market average). In South area, Ciputra World Surabaya Shopping Mall registered the highest rents which was around 50% higher compared to other shopping centres in East Surabaya.
50%
55%
60%
65%
70%
75%
80%
85%
90%
95%
100%
2011 2012 2013 2014 2015 2016YTD
Central Surabaya South Surabaya North Surabaya
East Surabaya West Surabaya

19 Half Year Report | H1 2016 | Surabaya | Colliers International
Source: Colliers International Indonesia - Research
average asking base Rental Rates in Different Regions
The already-high rent in Central Surabaya had been relatively flat over the last semester as the majority of landlords attempt to maintain tenants to keep occupancy high. Notwithstanding the forthcoming competitive market, we still foresee that the asking rent would increase albeit moderately. The high occupancy at the middle upper class malls would lead to the limited vacant spaces. In 2017, we are expecting another shopping centre that will be located in Tunjungan City and judging from its prime location the asking rents is anticipated to be higher than other existing shopping centres in Surabaya and thus would bring the average rental rate to climb going forward.
Source: Colliers International Indonesia - Research
the Range of asking base Rent in Different Regions
Service Charge
Source: Colliers International Indonesia - Research
average Service Charge in Different Regions
Source: Colliers International Indonesia - Research
the Range of Service Charge in Different Regions
IDR0
IDR100,000
IDR200,000
IDR300,000
IDR400,000
IDR500,000
IDR600,00020
11
2012
2013
2014
2015
2016
YTD
Central Surabaya South Surabaya North Surabaya
East Surabaya West Surabaya
IDR0
IDR100,000
IDR200,000
IDR300,000
IDR400,000
IDR500,000
IDR600,000
IDR700,000
IDR800,000
IDR900,000
Central Surabaya
South Surabaya
North Surabaya
East Surabaya
West Surabaya
IDR0
IDR20,000
IDR40,000
IDR60,000
IDR80,000
IDR100,000
IDR120,000
2011
2012
2013
2014
2015
2016
YTD
Central Surabaya South Surabaya North Surabaya
East Surabaya West Surabaya
IDR0
IDR20,000
IDR40,000
IDR60,000
IDR80,000
IDR100,000
IDR120,000
IDR140,000
Central Surabaya
South Surabaya
North Surabaya
East Surabaya
West Surabaya
The average service charge hovered at IDR99,385/sq m/month as of H1 2016, relatively unchanged compared to the previous semester. Central Surabaya shows a wider range in the service charge as the area is not only the place of upper class malls but there is also one operating old mall in the downtown, and a trade centre that quote relatively low service charge. Most of upper class shopping centres in South and Central Surabaya re-corded the highest service charge at around IDR130,000/sq m/month. Currently around 10 (out of total 30) shopping centres in Surabaya quote for maintenance fee between IDR100,000 and IDR130,000/sq m/month. Some of the old shopping cen-tres and strata-title centres still charge maintenance cost be-low IDR100,000/sq m/month.

Hotel Supply
Starred Hotel The construction progress of the impending hotel development in Surabaya was slow. Several on-going projects even delayed construction activities. During H1 2016, there were fournew star-rated hotels starting to operate and one existing hotel in-troduced the opening of new additional rooms.
Swiss-Belhotel International began to operate their third hotel in Surabaya i.e. Swiss-Belinn Tunjungan, a 3-star hotel that provides 190 rooms. Another newly operat-ing hotel is Premier Inn Hotel, a new hotel chain in Indo-nesia and the first hotel brand in Surabaya. They provide 129 rooms. Aria Centra added 173 rooms. By 2016 YTD, Surabaya recorded a total of 5,305 rooms of the 3-star category.
In 4-star class, Mercure hotel Surabaya added another 133 new rooms to the market while Starwood Hotels & Resorts started to operate their second hotel in Surabaya under Four Points brand and this provides 293 rooms. Up to the second half 2016, there were a total of 3,550 rooms in the 4-star hotel category.
Thus far there are no new hotel developments in the 5-star category in Surabaya. Cumulative hotel rooms in this segment remained at 2,224. Total number of rooms of the star-rated hotels in Surabaya as of H1 2016 accounted for 11,079 rooms from 66 hotel projects. Going forward, Surabaya is expecting a total of 17,681 rooms from 102 hotel projects by end of 2019.
Hotel SectorForecast at a glance
SupplyA total of 1,920 new hotel rooms will be available during H2 2016: 5-star hotels (550 rooms); 4-star hotels (829 rooms); and 3-star hotels (541 rooms).
DemandForeign visitors to Surabaya through Juanda airport have continued to decline in number since 2014.
PerformanceThe continued inflow of hotel development would heighten competition among hotels likely resulting in a decline in the AOR and ADR.

21 Half Year Report | H1 2016 | Surabaya | Colliers International
Source: Colliers International Indonesia - Research
Cumulative Supply of Starred hotel projects in Surabaya
Source: Colliers International Indonesia - Research
Cumulative Supply of Starred hotel Rooms in Surabaya
0
1,000
2,000
3,000
4,000
5,000
6,000
7,000
8,000
2010
2011
2012
2013
2014
2015
H1 2
016
2016
F
2017
F
2018
F
2019
F
3-star 4-star 5-star
0
10
20
30
40
50
60
2010
2011
2012
2013
2014
2015
H1 2
016
2016
F
2017
F
2018
F
2019
F
3-star 4-star 5-star
New Pipeline
hOtEl namE StaRRED Rating
StR Chain SCalE RatE lOCatiOn REgiOn ROOmS pROjECt
StatuS
pROjECtED COmplEtiOn
timE
Yello - Embong Sawo 3-star Not define yet Embong Sawo Central Surabaya
171 Under construction
H2 2016
One Galaxy Hotel 3-star Not define yet MERR II C East Surabaya 110 Under construction
H2 2016
Ayola Hotel Surabaya 3-star Not define yet Nginden East Surabaya 110 Under construction
2016
Darmo Permai Hotel 3-star Not define yet Darmo Permai South Surabaya
150 Deferred 2016
Citadines @Marvell City 3-star Upper Midscale Class
Ngagel South Surabaya
280 Under construction
H1 2017
Grandika Ngagel 3-star Not define yet Ngagel South Surabaya
150 Permit Process
2017
Santika Gramedia - Surabaya 3-star Upper Upscale Class
Basuki Rahmat Central Surabaya
100 Permit Process
2017
The Frontage 3-star Not define yet Ahmad Yani East Surabaya 82 Under construction
2017
I&M Hotel 3-star Not define yet Argopuro, Sawahan South Surabaya
142 Under construction
2017
Goldvitel Hotel 3-star Not define yet Basuki Rahmat Central Surabaya
120 Under construction
2017
Prime Biz Hotel 3-star Not define yet Gayung Kebonsari South Surabaya
162 Under construction
2017
Namira Syariah 3-star Not define yet Jl Wisam Pagesangan
South Surabaya
142 Under construction
2017
Grandika Injoko Hotel 3-star Not define yet Gayung Kebonsari South Surabaya
150 Permit Process
2018
Puncak Dharmahusada 3-star Not define yet MERR II C East Surabaya 400 Under construction
2018
Ketintang Hotel 3-star Not define yet Ketintang South Surabaya
120 Concept Stage 2018
continued

22 Half Year Report | H1 2016 | Surabaya | Colliers International
New Pipeline
hOtEl namE StaRRED Rating
StR Chain SCalE RatE lOCatiOn REgiOn ROOmS pROjECt
StatuS
pROjECtED COmplEtiOn
timE
continuation
Continent My Tower - Rungkut 3-star Not define yet Rungkut East Surabaya 134 Under construction
2018
Puncak CBD Hotel 3-star Not define yet Wiyung South Surabaya
180 Under construction
2018
Total 3-star hotel rooms 2,703
Ara Hotel 4-star Not define yet Undaan Kulon Central Surabaya
170 Post Tender 2016
Kila Widodaren Aerowisata Surabaya
4-star Not define yet Jl Widodaren Central Surabaya
167 Deferred 2016
Platinum Hotel 4-star Not define yet Tunjungan Central Surabaya
200 Permit Process
H2 2017
Great Hotel 4-star Not define yet Diponegoro Central Surabaya
90 Post Tender 2017
Mercure @Praxis 4-star Upscale Class Embong Sonokembang
East Surabaya 288 Under construction
2017
Grand Dafam Kayon 4-star Midscale Class Kayon East Surabaya 169 Under construction
2017
Swiss-Belhotel Darmo Surabaya 4-star Upscale Class Darmo South Surabaya
140 Under construction
2017
Howard Johnson 4-star Economy Class Ahmad Yani South Surabaya
170 Under construction
2016
Aryaduta 4-star Upscale Class Gubeng East Surabaya 180 Permit Process
H1 2018
Trend Z-VJ Hotel 4-star Not define yet Embong Sawo Central Surabaya
163 Design Stage 2018
Harris Hotel Karang Menjangan 4-star Upscale Class Karang Menjangan East Surabaya 100 Under Planning
H1 2019
DoubleTree Tunjungan 4-star Upscale Class Jl Tunjungan Central Surabaya
320 Under construction
Total 4-star hotel rooms 2,157
Vasa Luxury Hotel 5-star Not define yet HR Muhammad West Surabaya 550 Under construction
2016
Courtyard Marriot Surabaya 5-star Upscale Class Jl Pemuda Central Surabaya
180 Under construction
2017
Signature Gallery - Hilton Hotel 5-star Not define yet Gubeng East Surabaya 200 Permit Process
2018
Total 5-star hotel rooms 930
Total starred hotel rooms 5,790
Source: Colliers International Indonesia - Research
Budget HotelThere are three new budget hotels being added as a new supply in Surabaya. Evora Hotel has 83 rooms. POP! Hotel Diponegoro began operation with 116 rooms while Favehotel Rungkut added 176 rooms. During H1 2016, there were 375 new hotel rooms in Surabaya which brought total room supply in Surabaya to 3,018.

23 Half Year Report | H1 2016 | Surabaya | Colliers International
Cumulative Supply of budget hotel (Economy Class) projects in Surabaya
Source: Colliers International Indonesia - Research
Cumulative Supply of budget hotel (Economy Class) Rooms in Surabaya
Source: Colliers International Indonesia - Research
0
10
20
30
40
50
2010
2011
2012
2013
2014
2015
H1 2
016
2016
F
2017
F
2018
F
2019
F0
1,000
2,000
3,000
4,000
5,000
2010
2011
2012
2013
2014
2015
H1 2
016
2016
F
2017
F
2018
F
2019
F
Future Budget Hotel Development in Pipeline
hOtEl namE StR Chain SCalE RatE lOCatiOn REgiOn nO. OF
ROOmS pROjECt StatuSpROjECtED COmplEtiOn
timE
Grand Citihub Alimar Not define yet MERR II C East Surabaya 110 Under construction H2 2016
MaxOne Dharmahusada Not define yet Dharmahusada East Surabaya 84 Under construction 2016
Moxy Hotel Economy Class Mayjend Sungkono South Surabaya 110 Under construction 2016
Amaris - Margorejo Economy Class Margorejo South Surabaya 146 Under construction 2016
MaxOne Hotel - Bukit Darmo Not define yet Bukit Darmo South Surabaya 90 Permit Process 2017
Batiqa Hotel Not define yet Darmo Kali South Surabaya 140 Under construction 2017
Surabaya River View (SRV) Not define yet Genteng Central Surabaya 110 Under construction 2017
Amaris Hotel Surabaya - Bintoro
Economy Class Bintoro Central Surabaya 120 Under construction 2017
Griyadi Budget Hotel Not define yet Gubeng East Surabaya 110 Deferred 2017
Favehotel Ketintang Economy Class Jl Ketintang East Surabaya 100 Deferred 2017
Ibis Budget Surabaya Economy Class Jl Raya Diponegoro South Surabaya 153 Design 2018
Kaza City Hotel Not define yet Jl Kapuas Krampung Central Surabaya 150 Deferred 2018
Fame Hotel Not define yet Jl Gubeng Kertajaya East Surabaya 144 Deferred 2018
Total budget hotel rooms 1,567
Source: Colliers International Indonesia - Research, STR Global
Market OverviewBased on the Ministry of Tourism Indonesia data, by April 2016; 66,796 visitors landed in Juanda reflecting an 8.1% YoY in-crease. The existence of industrial areas outside Surabaya helps fuel hotel performance in several areas. Some of the hotels provide living accommodation for long stay guests of the corporate mar-ket while the government market also started coming to hotels in Surabaya.
Surabaya development has created congestion in several busi-ness spots. This has become a new issue for the hotel market in Surabaya. Hotel guests start to review the location to stay, preferably in less-congested areas. In order to attract the cus-tomer to stay, hoteliers provide additional facilities like shuttle transportation to cope with congestion issues.
Referring to the Ministry of Tourism data, Singapore and Ma-laysia have been consistently dominating the number of foreign visitors to Surabaya. Other active countries having a growing number of visitors are China and India.

24 Half Year Report | H1 2016 | Surabaya | Colliers International
number of Foreign passengers through juanda airports
Source: Statistics Bureau Indonesia
0
50,000
100,000
150,000
200,000
250,00020
05
2006
2007
2008
2009
2010
2011
2012
2013
2014
2015
2016
YTD
Composition of Foreign guests based on Country of Origin
Source: Statistics Bureau Indonesia
number of Foreign guests based on Country of Origin
Source: Statistics Bureau Indonesia
Malaysia24%
Singapore10%
China8%
Taiwan5%Japan
3%
Others50%
0
10,000
20,000
30,000
40,000
50,000
60,000
70,000
80,000
90,000
Sing
apor
e
Mal
aysi
a
Japa
n
Sout
h Ko
rea
Taiw
an
Chin
a
Indi
a
Phili
ppin
es
Hon
gKon
g
Thai
land
Aus
tral
ia
USA U
K
Net
herl
ands
Germ
any
Oth
ers
2010 2011 2012 2013 2014 2015 YTD 2016
PerformanceLooking at the information from STR, the Average Occupancy Rate (AOR) of Surabaya hotels experienced a 3.5% decrease to previous semester. This brought the H1 2016 AOR to 54.14%. Although government activities started to fill the Surabaya hotel market, the unstable economic condition made the corporate market decrease due to those economic factors.
average Occupancy Rate (aOR)
Source: STR Global
0%
10%
20%
30%
40%
50%
60%
70%
80%
90%
100%
2013 2014 2015 2016YTD
25 Half Year Report | H1 2016 | Surabaya | Colliers International
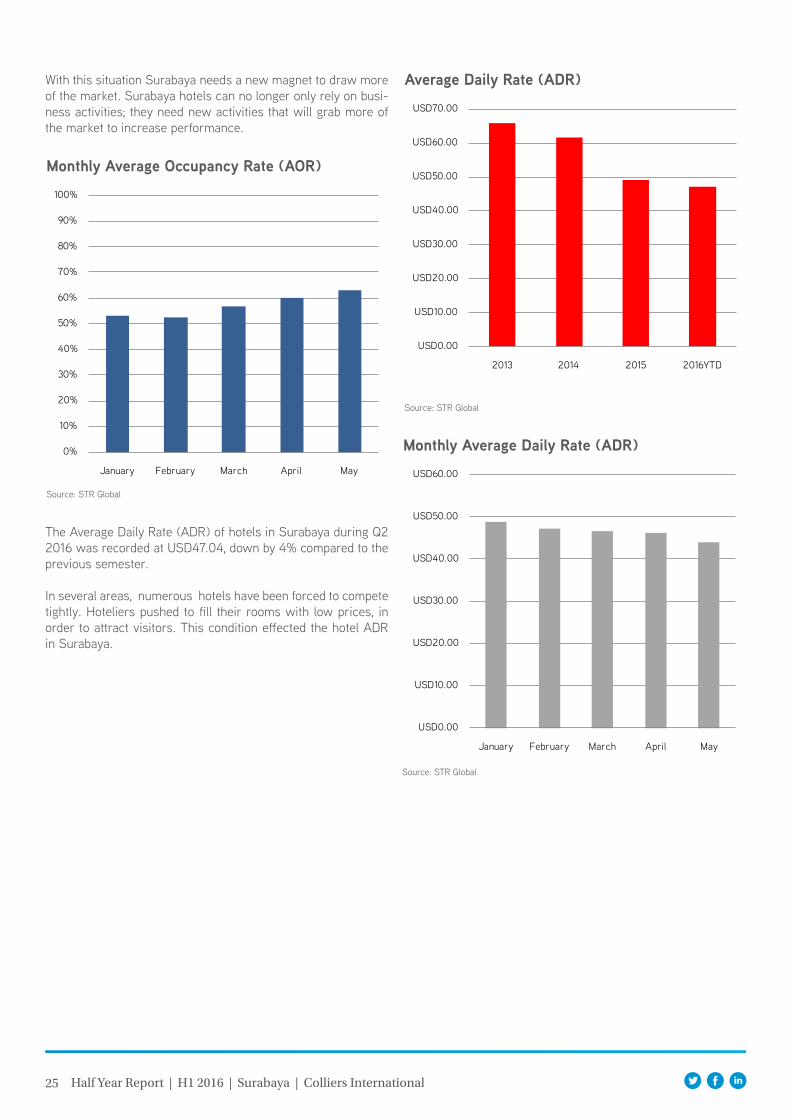
monthly average Occupancy Rate (aOR)
Source: STR Global
The Average Daily Rate (ADR) of hotels in Surabaya during Q2 2016 was recorded at USD47.04, down by 4% compared to the previous semester.
In several areas, numerous hotels have been forced to compete tightly. Hoteliers pushed to fill their rooms with low prices, in order to attract visitors. This condition effected the hotel ADR in Surabaya.
0%
10%
20%
30%
40%
50%
60%
70%
80%
90%
100%
January February March April May
monthly average Daily Rate (aDR)
Source: STR Global
USD0.00
USD10.00
USD20.00
USD30.00
USD40.00
USD50.00
USD60.00
January February March April May
With this situation Surabaya needs a new magnet to draw more of the market. Surabaya hotels can no longer only rely on busi-ness activities; they need new activities that will grab more of the market to increase performance.
average Daily Rate (aDR)
Source: STR Global
USD0.00
USD10.00
USD20.00
USD30.00
USD40.00
USD50.00
USD60.00
USD70.00
2013 2014 2015 2016YTD

Copyright © 2016 Colliers International.
The information contained herein has been obtained from sources deemed reliable. While every reasonable effort has been made to ensure its accuracy, we cannot guarantee it. No responsibility is assumed for any inaccuracies. Readers are encouraged to consult their professional advisors prior to acting on any of the material contained in this report.
Accelerating success.
For more information:Ferry SalantoSenior Asociate Director | Research+62 21 3043 [email protected]
Contributors:Eko ArfiantoManager | Research
Hern Rizal GobiAssistant Manager | Research
Nurul SorayaSenior Research Executive | Research
Due to the festive season that falls during H1 2016, many cor-porate and even government organisations push forward their activities. In early H1 2016, the performance of the hotel sec-tor was quite good. Meanwhile during the festive season the number of business travellers decreases especially in meet-ings, incentive, conference, events (MICE) activities. This is the indicator of the down turn moment for hotel performance. On the other hand, the hotel F&B performance will increase as a lot of people will manage to do breakfasting (buka puasa bersama).
Recently, hotels in Surabaya considered over supply. This hap-pens because Surabaya is the second tier business city in Indo-nesia and makes for competition in the Surabaya hotel market to become very tight. The competition is not only between the same class of hotel but also with other classes (upper or lower class). The result is that the market condition is getting tighter. Price becomes the biggest concern for guests. The guests are looking for the lowest price with the most complete facility, but on the other side hoteliers have their own targets to achieve. This situation has created a decreasing trend of hotel perfor-mance in Surabaya.
Furthermore, there was an issue that may give a significant impact in the hotel sector. Related to some changes of the Draft Government State Budget indicators, the government will amend its expenditure. One aspect is the operational expendi-ture which includes business trips and meeting packages. This will have an impact in the hotel sector, especially in the MICE area.
The same situation happened by the end of 2014, when the government issued a regulation to ban government meetings in hotels; this action brought the hotel performance down signifi-cantly. Hoteliers should prepare for the downturn situation if the government amends the budget.