q2 2020 august 2020 - investor cloud
TRANSCRIPT
1
CORPORATEPRESENTATION
AUGUST 2020
Q2 2020
22
SAFE HARBOR STATEMENT
This presentation has been prepared by Grupo Cementos
de Chihuahua, S.A.B. de C.V. (together with its subsidiaries,
“GCC”). Nothing in this presentation is intended to be taken
by any person as investment advice, a recommendation to
buy, hold or sell any security, or an offer to sell or a solicitation
of offers to purchase any security.
Information related with the market and the competitive
position of GCC was obtained from public sources that
GCC believes to be reliable; however, GCC does not make
any representation as to its accuracy, validity, timeliness
or completeness. GCC is not responsible for errors and/
or omissions with respect to the information contained
herein. Due to rounding, numbers presented throughout this
presentation may not add up precisely to the totals provided
and percentages may not precisely reflect the absolute
figures.
Forward Looking Statements
This presentation includes forward looking statements or
information. These forward-looking statements may relate
to GCC’s financial condition, results of operations, plans,
objectives, future performance and business. All statements
that are not clearly historical in nature are forward-looking,
and the words “anticipate,” “believe,” “expect,” “estimate,”
“intend,” “project” and similar expressions are generally
intended to identify forward-looking statements. The
information in this presentation, including but not limited to
forward-looking statements, applies only as of the date of
this presentation. GCC expressly disclaims any obligation or
undertaking to update or revise the information, including
any financial data and forward-looking statements, as well
as those related to the impact of COVID-19 on our business,
supliers, consumers, customers and employees; disruptions
or inefficiencies in the supply chain, including any impact of
COVID-19.
Any projections have been prepared based on GCC’s views
as of the date of this presentation and include estimates and
assumptions about future events which may prove to be
incorrect or may change over time. The projections have been
prepared for illustrative purposes only, and do not constitute a
forecast. While the projections are based on assumptions that
GCC believes are reasonable, they are subject to uncertainties,
changes in economic, operational, political, legal or public health
crises including COVID-19, and other circumstances and other
risks, including, but not limited to, broad trends in business
and finance, legislation affecting our securities, exchange
rates, interest rates, inflation, foreign trade restrictions, and
market conditions, which may cause the actual financial
and other results to be materially different from the results
expressed or implied by such projections.
EBITDA
We define EBITDA as consolidated net income after adding
back or subtracting, as the case may be: (1) depreciation
and amortization; (2) net financing expense; (3) other non-
operating expenses; (4) taxes; and (5) share of earnings in
associates. In managing our business, we rely on EBITDA
as a means of assessing our operating performance.
We believe that EBITDA enhances the understanding
of our financial performance and our ability to satisfy
principal and interest obligations with respect to our
indebtedness as well as to fund capital expenditures and
working capital requirements. We also believe EBITDA is
a useful basis of comparing our results with those of other
companies because it presents results of operations on a
basis unaffected by capital structure and taxes. EBITDA,
however, is not a measure of financial performance
under IFRS or U.S. GAAP and should not be considered
as an alternative to net income as a measure of operating
performance or to cash flows from operating activities as a
measure of liquidity. Our calculation of EBITDA may not be
comparable to other companies’ calculation of similarly titled
measures.
Currency translations / physical volumes
All monetary amounts in this presentation are expressed
in U.S. Dollars ($ or US$). Currency translations from pesos
into U.S. dollars use the average monthly exchange rates
published by Banco de México.
These translations do not purport to reflect the actual
exchange rates at which cross-currency transactions
occurred or could have occurred.
The average exchange rates (Pesos per U.S. dollar) used
for recent periods are:
Q2-20: 23.35 - Q2-19: 19.12
H1-20: 21.63 - H1-19: 19.17
Physical volumes are stated in metric tons (mt), millions of
metric tons (mmt), cubic meters (m3), or millions of cubic
meters (mm3).
3
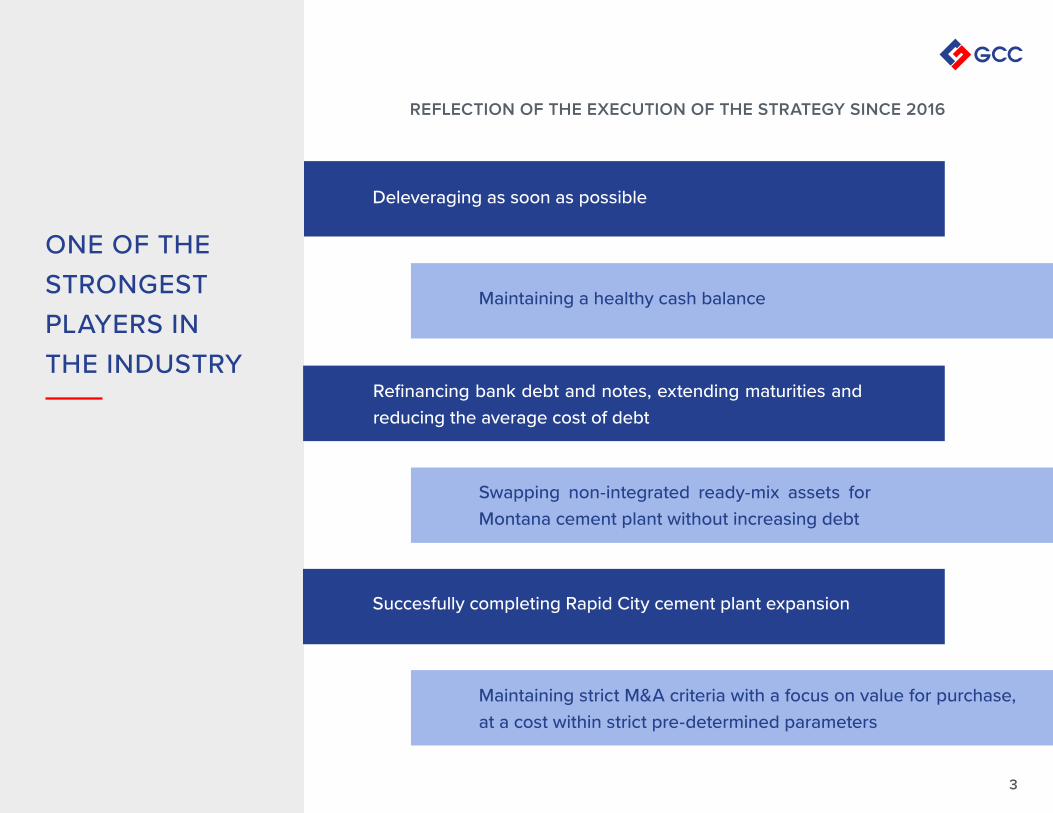
ONE OF THESTRONGESTPLAYERS INTHE INDUSTRY
REFLECTION OF THE EXECUTION OF THE STRATEGY SINCE 2016
Deleveraging as soon as possible
Refinancing bank debt and notes, extending maturities and reducing the average cost of debt
Succesfully completing Rapid City cement plant expansion
Maintaining a healthy cash balance
Swapping non-integrated ready-mix assets for Montana cement plant without increasing debt
Maintaining strict M&A criteria with a focus on value for purchase, at a cost within strict pre-determined parameters
44
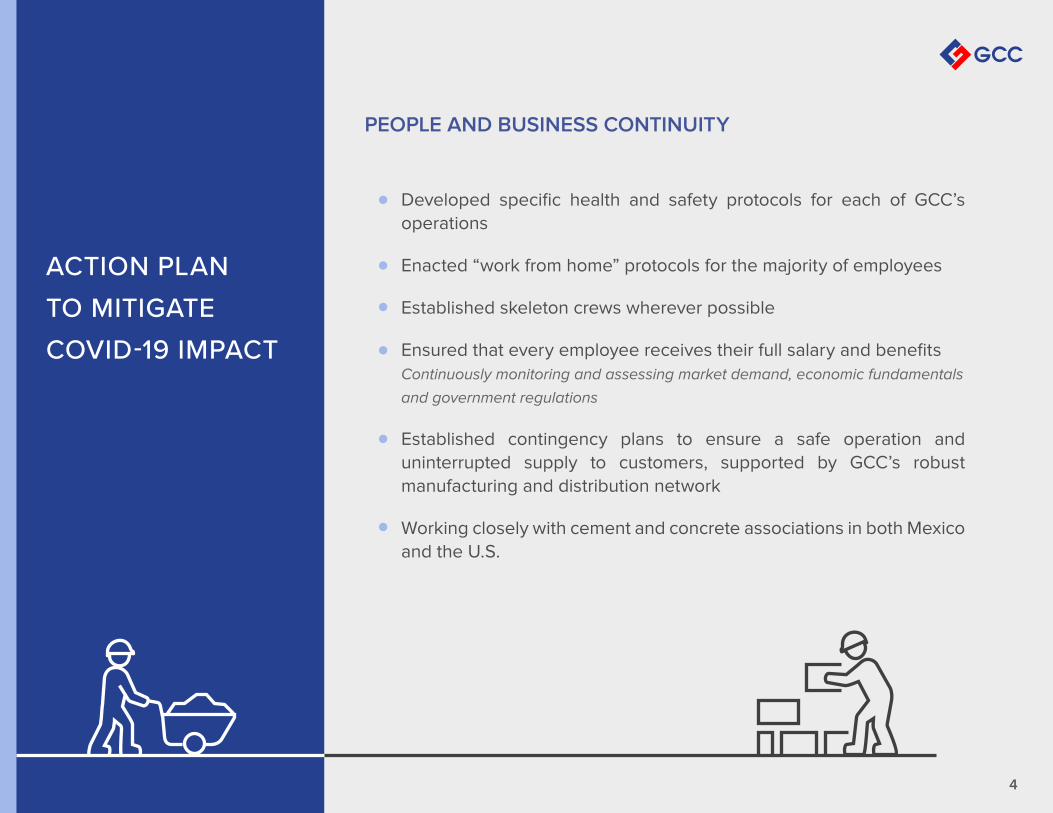
ACTION PLANTO MITIGATE COVID-19 IMPACT
Developed specific health and safety protocols for each of GCC’s
operations
Enacted “work from home” protocols for the majority of employees
Established skeleton crews wherever possible
Ensured that every employee receives their full salary and benefits
Continuously monitoring and assessing market demand, economic fundamentals
and government regulations
Established contingency plans to ensure a safe operation and
uninterrupted supply to customers, supported by GCC’s robust
manufacturing and distribution network
Working closely with cement and concrete associations in both Mexico
and the U.S.
PEOPLE AND BUSINESS CONTINUITY
55
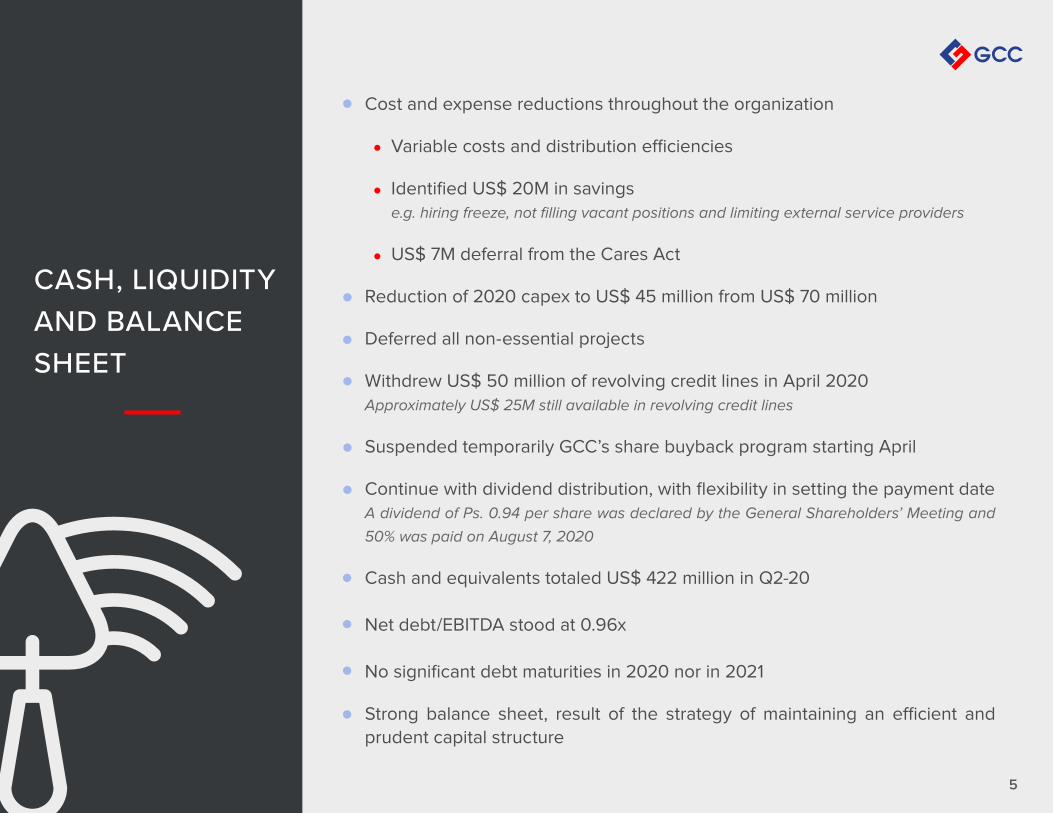
Cost and expense reductions throughout the organization
Variable costs and distribution efficiencies
Identified US$ 20M in savings
e.g. hiring freeze, not filling vacant positions and limiting external service providers
US$ 7M deferral from the Cares Act
Reduction of 2020 capex to US$ 45 million from US$ 70 million
Deferred all non-essential projects
Withdrew US$ 50 million of revolving credit lines in April 2020
Approximately US$ 25M still available in revolving credit lines
Suspended temporarily GCC’s share buyback program starting April
Continue with dividend distribution, with flexibility in setting the payment date
A dividend of Ps. 0.94 per share was declared by the General Shareholders’ Meeting and
50% was paid on August 7, 2020
Cash and equivalents totaled US$ 422 million in Q2-20
Net debt/EBITDA stood at 0.96x
No significant debt maturities in 2020 nor in 2021
Strong balance sheet, result of the strategy of maintaining an efficient and
prudent capital structure
CASH, LIQUIDITY AND BALANCE SHEET
66
INVESTMENT HIGHLIGHTSTICKER: BMV: GCC
Leading position in attractive U.S. regional markets
and in Chihuahua, Mexico
Mexico operations also provide a strong base, and
add operational flexibility with export capacity
Vertically integrated, with state of the art production
facilities and logistics
Increased free float and liquidity
Healthy balance sheet and strong free cash flow drive
value creation
1
2
3
4
5
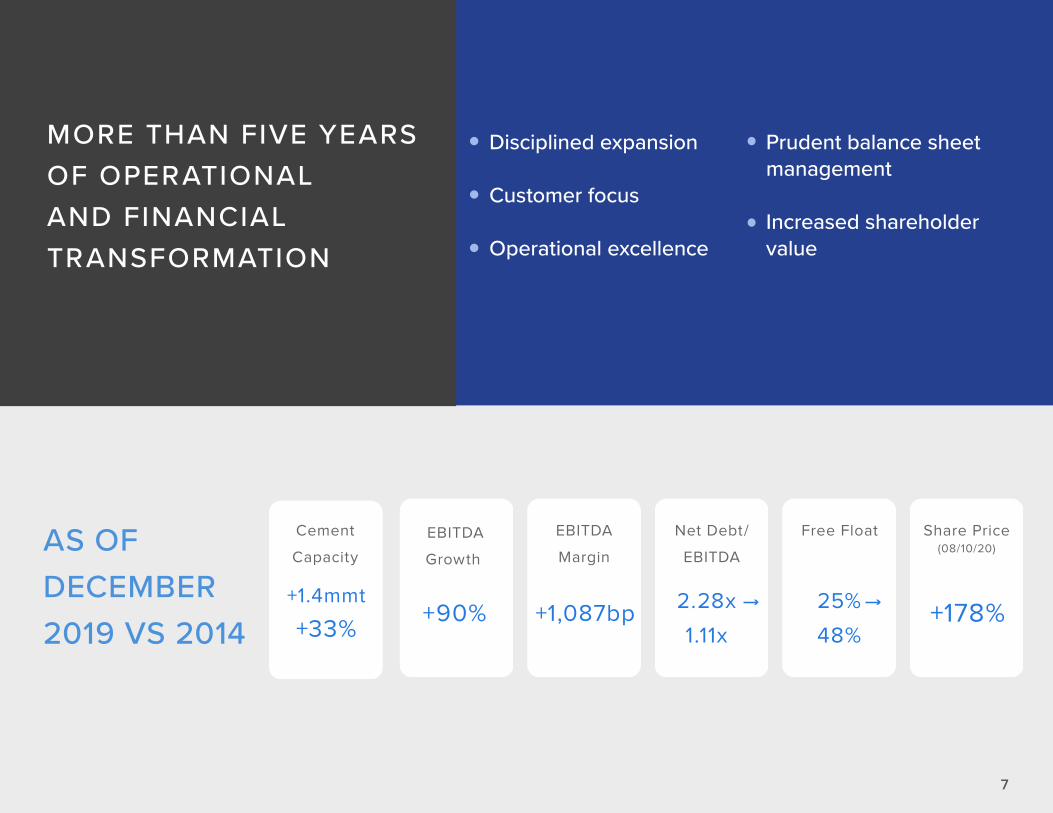
MORE THAN FIVE YEARS OF OPERATIONAL AND FINANCIAL TRANSFORMATION
Disciplined expansion
Customer focus
Operational excellence
Prudent balance sheet management
Increased shareholder value
AS OF DECEMBER 2019 VS 2014
Cement
Capacity
EBITDA
Growth
EBITDA
Margin
Net Debt/
EBITDA
Share Price(08/10/20)
Free Float
+1.4mmt
+33%+90% +1,087bp +178%
2.28x
1.11x
25%
48%
7
88
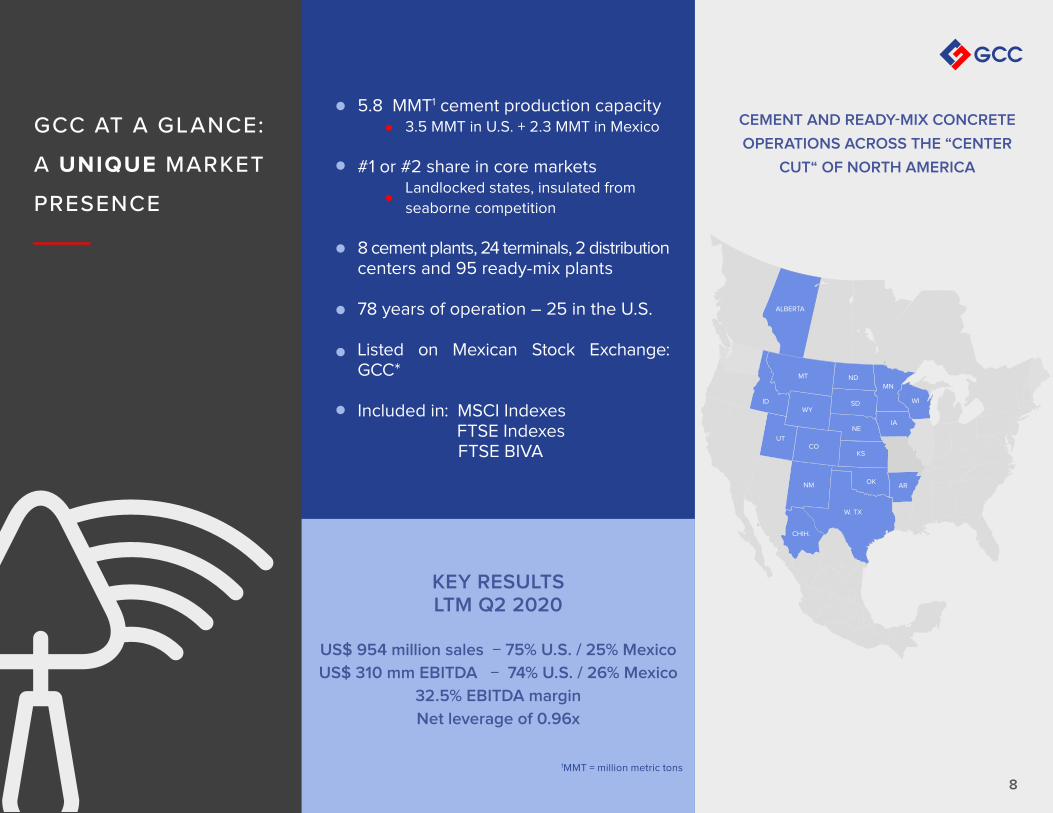
GCC AT A GLANCE:
A UNIQUE MARKET
PRESENCE
5.8 MMT1 cement production capacity 3.5 MMT in U.S. + 2.3 MMT in Mexico
#1 or #2 share in core markets Landlocked states, insulated from
seaborne competition
8 cement plants, 24 terminals, 2 distribution centers and 95 ready-mix plants
78 years of operation – 25 in the U.S.
Listed on Mexican Stock Exchange: GCC*
Included in: MSCI Indexes FTSE Indexes FTSE BIVA
ND MT
MN
WI ID WY
CO
NM
W. TX
SD
CHIH.
KS
NE IA
OK AR
ALBERTA
UT
CEMENT AND READY-MIX CONCRETE
OPERATIONS ACROSS THE “CENTER
CUT“ OF NORTH AMERICA
KEY RESULTSLTM Q2 2020
US$ 954 million sales − 75% U.S. / 25% Mexico
US$ 310 mm EBITDA − 74% U.S. / 26% Mexico
32.5% EBITDA margin
Net leverage of 0.96x
1MMT = million metric tons
9
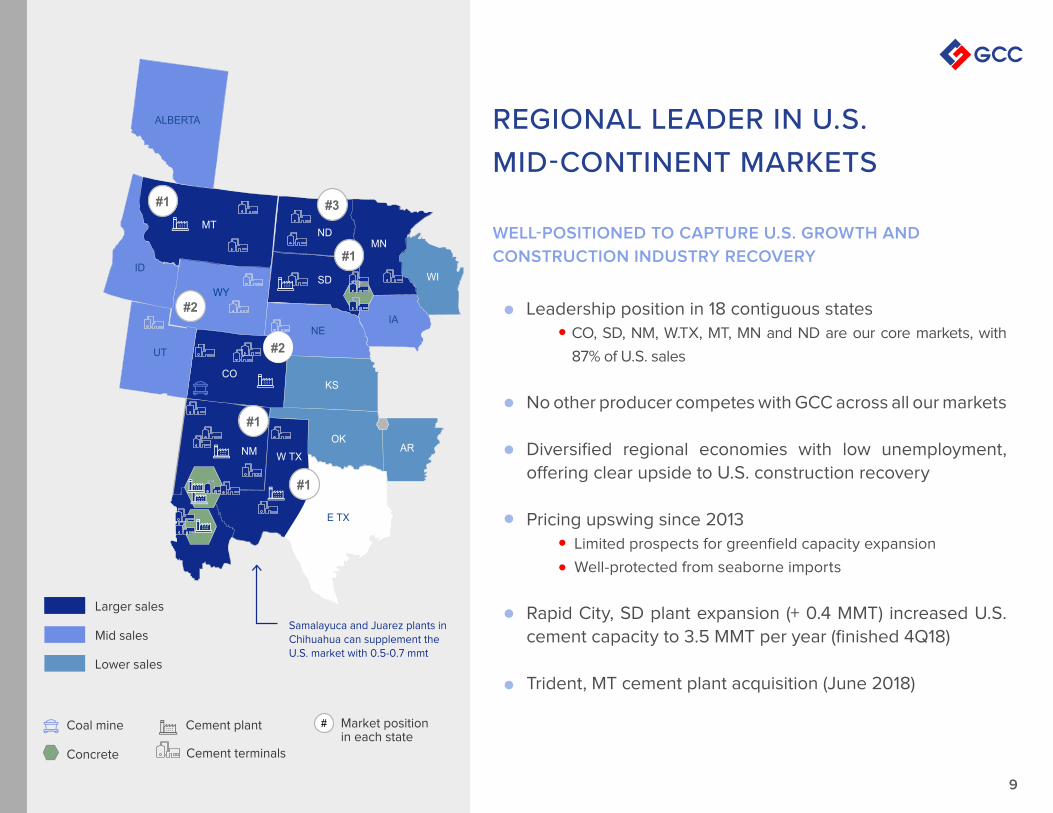
Larger sales
Mid sales
Lower sales
Cement plant # Market positionin each state
Coal mine
Concrete Cement terminals
Samalayuca and Juarez plants in Chihuahua can supplement the U.S. market with 0.5-0.7 mmt
T
#1
MT
E TX
WI
AR
IA NE
KS
OK
WY
ND
SD
CO
NM W TX
MN
#1
#1
#2
#3
UT
#1
ALBERTA
ID
#2
REGIONAL LEADER IN U.S. MID-CONTINENT MARKETS
WELL-POSITIONED TO CAPTURE U.S. GROWTH AND
CONSTRUCTION INDUSTRY RECOVERY
Leadership position in 18 contiguous states
CO, SD, NM, W.TX, MT, MN and ND are our core markets, with
87% of U.S. sales
No other producer competes with GCC across all our markets
Diversified regional economies with low unemployment,
offering clear upside to U.S. construction recovery
Pricing upswing since 2013
Limited prospects for greenfield capacity expansion
Well-protected from seaborne imports
Rapid City, SD plant expansion (+ 0.4 MMT) increased U.S.
cement capacity to 3.5 MMT per year (finished 4Q18)
Trident, MT cement plant acquisition (June 2018)
1010
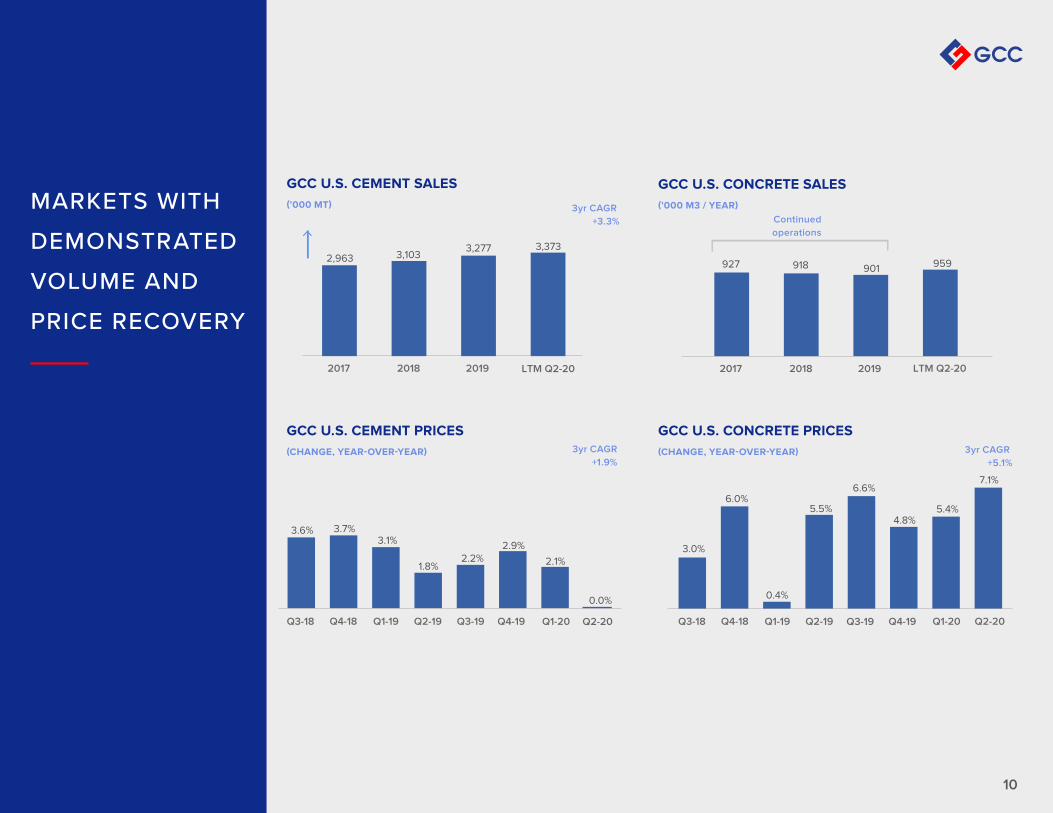
MARKETS WITH
DEMONSTRATED
VOLUME AND
PRICE RECOVERY
GCC U.S. CEMENT SALES
(’000 MT)
GCC U.S. CONCRETE SALES
(’000 M3 / YEAR)
GCC U.S. CEMENT PRICES
(CHANGE, YEAR-OVER-YEAR)
GCC U.S. CONCRETE PRICES
(CHANGE, YEAR-OVER-YEAR)
3,373 2,963 3,103
3,277
2017 2018 2019
3yr CAGR
+3.3%
3yr CAGR
+1.9%
3yr CAGR
+5.1%
2.1%
2.9%
3.6% 3.7% 3.1%
6.6%
5.4%
7.1%
3.0%
6.0%
0.4%
959927 918 901
2017 2018 2019
1.8%
5.5%
Continued
operations
Q1-20 Q3-18 Q4-18 Q1-19 Q2-19 Q3-19
2.2%
4.8%
Q3-18 Q4-18 Q1-19 Q2-19 Q3-19 Q4-19 Q4-19
LTM Q2-20
Q1-20
LTM Q2-20
0.0%
Q2-20 Q2-20
11
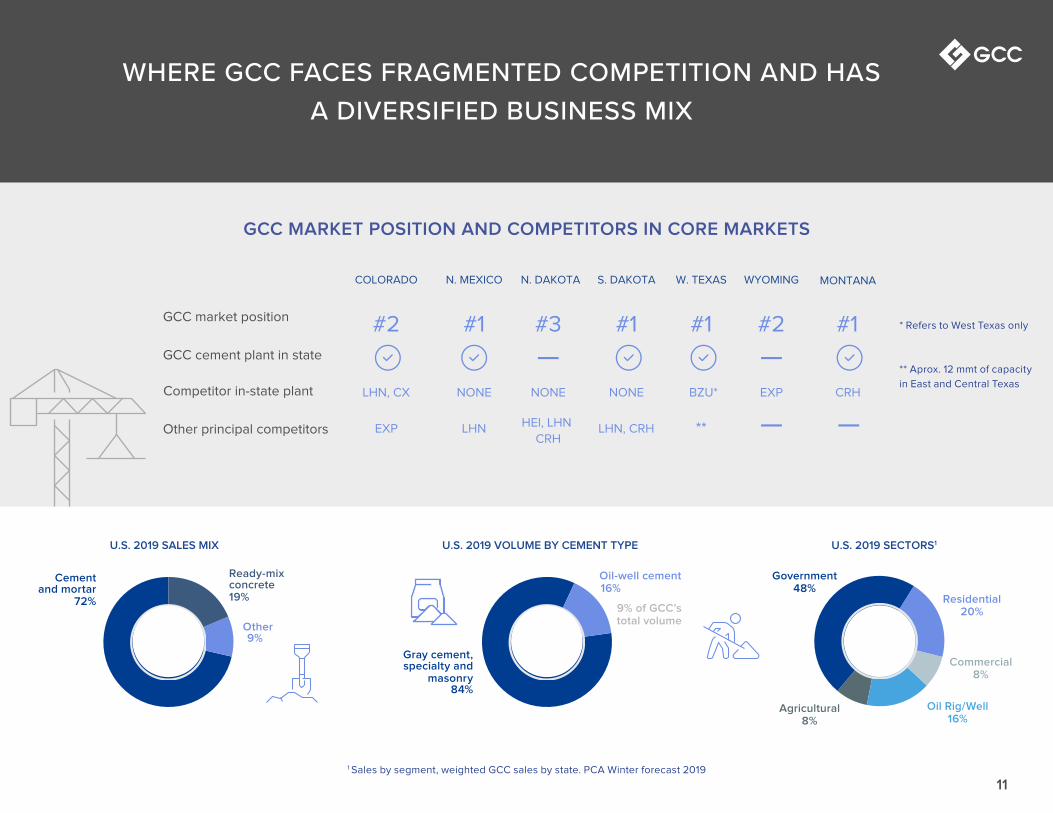
WHERE GCC FACES FRAGMENTED COMPETITION AND HAS A DIVERSIFIED BUSINESS MIX
GCC MARKET POSITION AND COMPETITORS IN CORE MARKETS
* Refers to West Texas only
** Aprox. 12 mmt of capacity
in East and Central Texas
1 Sales by segment, weighted GCC sales by state. PCA Winter forecast 2019
#2 #3
COLORADO W. TEXASS. DAKOTAN. MEXICO N. DAKOTA
GCC market position #1 #1 #1GCC cement plant in state —
Competitor in-state plant NONE NONE NONE BZU*LHN, CX
Other principal competitors LHN, CRH LHN HEI, LHN
CRH ** EXP
WYOMING
#2
EXP
—
—
MONTANA
#1
CRH
—
U.S. 2019 SALES MIX
Other 9%
Cement and mortar
72%
Ready-mix concrete 19%
U.S. 2019 VOLUME BY CEMENT TYPE
Gray cement, specialty and
Government48%
Agricultural8%
Residential20%
Commercial8%masonry
84%
Oil-well cement 16%
U.S. 2019 SECTORS1
Oil Rig/Well16%
9% of GCC’s total volume
1212
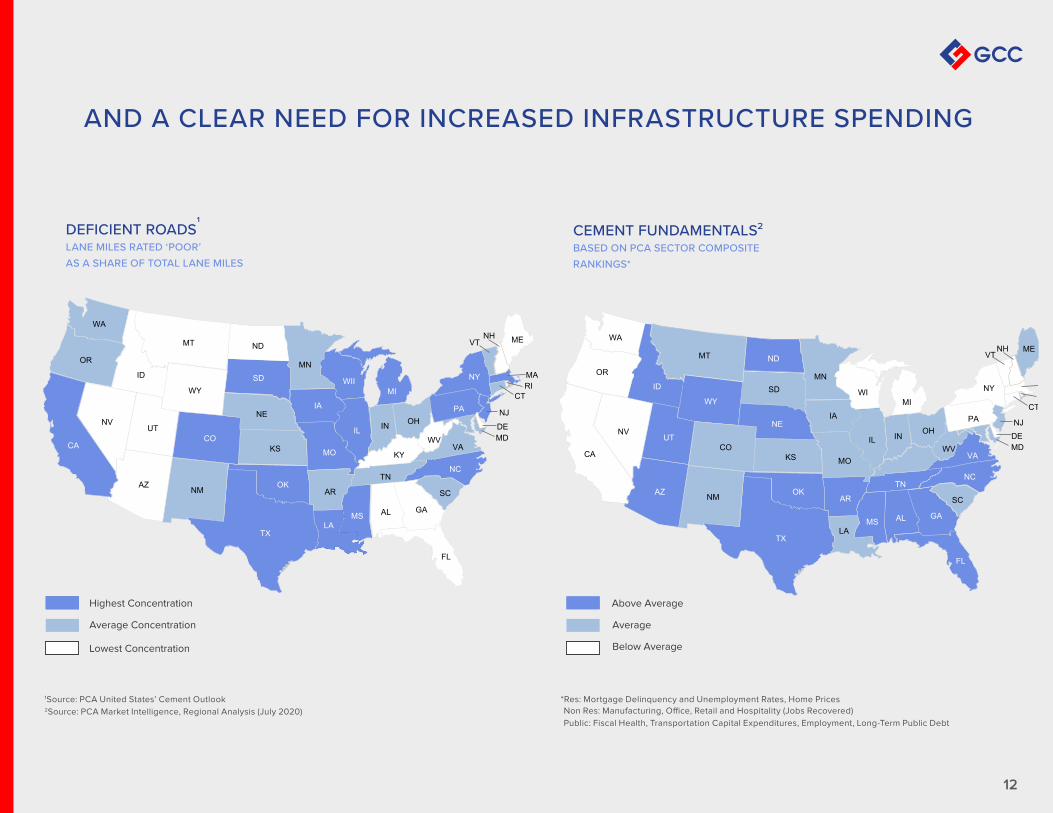
AND A CLEAR NEED FOR INCREASED INFRASTRUCTURE SPENDING
ME
RI MA VT NH
AL GA SC
TN
FL
MS LA
TX
OK NM
KS
MN
IA
MO AR
WY
CO
ND SD NE
WA
ID MT
OR
NV UT
AZ CA
WII
IL IN MI
OH WV
VA NC
MD DE PA
NY CT
NJ
KY
ME
RI MA VT NH
AL GA SC TN
FL MS
LA TX
OKNM KS
MN IA
MO
AR
WY
CO
ND SD NE
WA
ID MT
OR
NV UT
AZ CA
WI
IL IN MI
OH WV
VA NC
MD DE PA
NY CT
NJ
Above Average
Average
Below Average
Highest Concentration
Average Concentration
Lowest Concentration
*Res: Mortgage Delinquency and Unemployment Rates, Home Prices1Source: PCA United States’ Cement Outlook2Source: PCA Market Intelligence, Regional Analysis (July 2020)
ME
RI MA VT NH
AL GA SC
TN
FL
MS LA
TX
OK NM
KS
MN
IA
MO AR
WY
CO
ND SD NE
WA
ID MT
OR
NV UT
AZ CA
WII
IL IN MI
OH WV
VA NC
MD DE PA
NY CT
NJ
KY
ME
RI MA VT NH
AL GA SC TN
FL MS
LA TX
OKNM KS
MN IA
MO
AR
WY
CO
ND SD NE
WA
ID MT
OR
NV UT
AZ CA
WI
IL IN MI
OH WV
VA NC
MD DE PA
NY CT
NJ
Above Average
Average
Below Average
Highest Concentration
Average Concentration
Lowest Concentration
Non Res: Manufacturing, Office, Retail and Hospitality (Jobs Recovered)
Public: Fiscal Health, Transportation Capital Expenditures, Employment, Long-Term Public Debt
1313
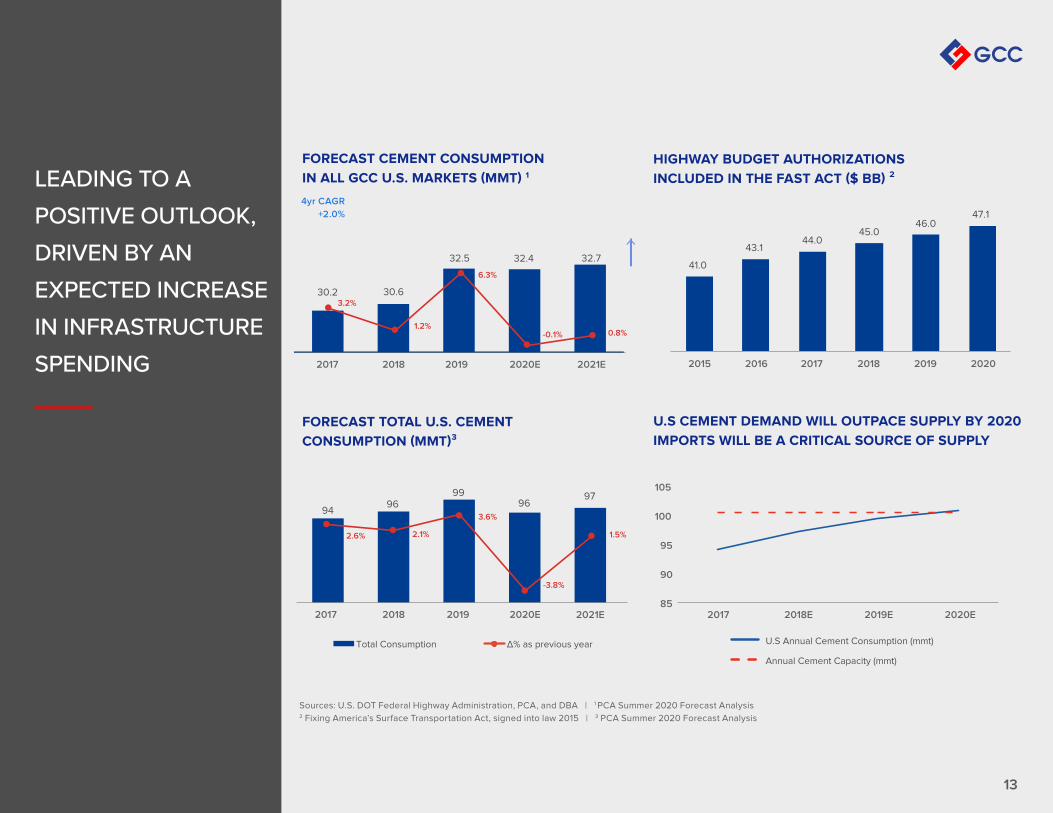
LEADING TO A POSITIVE OUTLOOK, DRIVEN BY AN EXPECTED INCREASE IN INFRASTRUCTURE SPENDING
Sources: U.S. DOT Federal Highway Administration, PCA, and DBA | 1 PCA Summer 2020 Forecast Analysis2 Fixing America’s Surface Transportation Act, signed into law 2015 | 3 PCA Summer 2020 Forecast Analysis
FORECAST CEMENT CONSUMPTION
IN ALL GCC U.S. MARKETS (MMT) 1
FORECAST TOTAL U.S. CEMENT
CONSUMPTION (MMT)³
U.S CEMENT DEMAND WILL OUTPACE SUPPLY BY 2020
IMPORTS WILL BE A CRITICAL SOURCE OF SUPPLY
HIGHWAY BUDGET AUTHORIZATIONS
INCLUDED IN THE FAST ACT ($ BB) ²
30.2 30.6
32.4 32.7
3.2%
1.2%
6.3%
-0.1% 0.8%
2017 2018 2019 2020E 2021E
41.0
43.1 44.0
45.0 46.0
47.1
2015 2016 2017 2018 2019 2020
9496
9996
97
2.6% 2.1%
3.6%
-3.8%
1.5%
2017 2018 2019 2020E 2021E
Total Consumption ∆% as previous year
85
90
95
100
105
2017 2018E 2019E 2020E
U.S Annual Cement Consumption (mmt)
Annual Cement Capacity (mmt)
4yr CAGR
+2.0%
32.5
1414
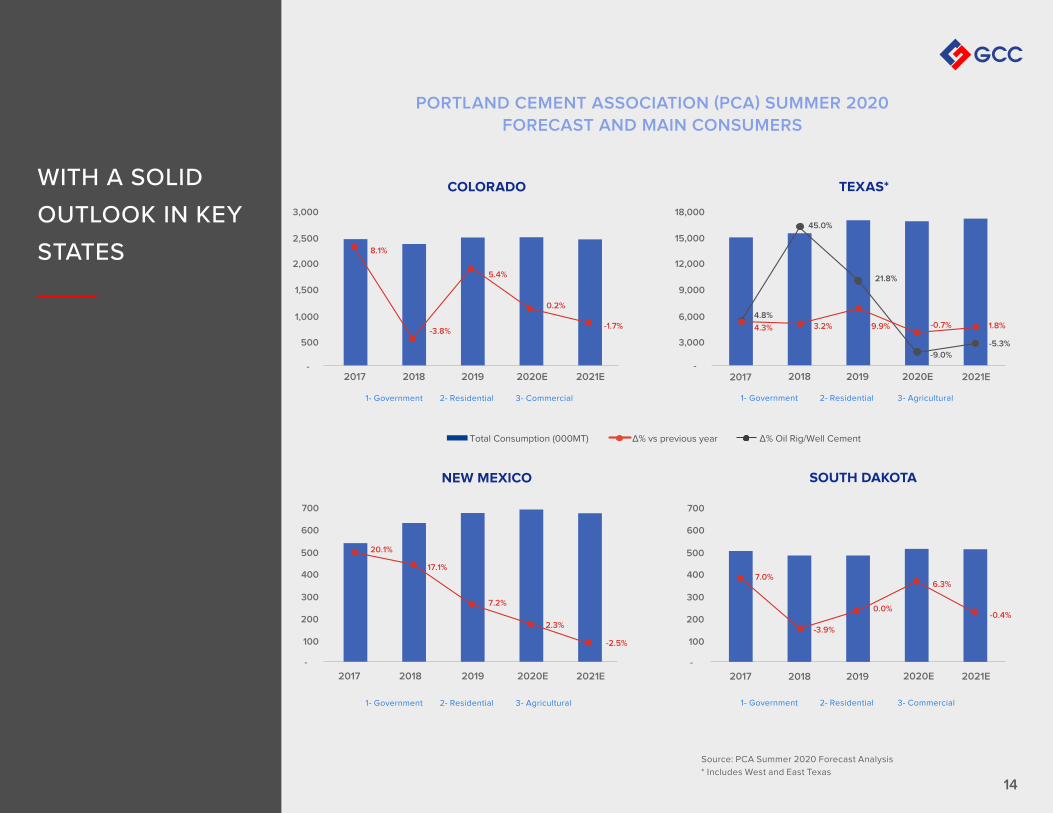
Source: PCA Summer 2020 Forecast Analysis
* Includes West and East Texas
PORTLAND CEMENT ASSOCIATION (PCA) SUMMER 2020
FORECAST AND MAIN CONSUMERS
WITH A SOLIDOUTLOOK IN KEYSTATES
COLORADO TEXAS*
NEW MEXICO SOUTH DAKOTA
Total Consumption (000MT) ∆% vs previous year
1- Government 2- Residential 3- Commercial
1- Government 2- Residential 3- Agricultural 1- Government 2- Residential 3- Commercial
1- Government 2- Residential 3- Agricultural
8.1%
-3.8%
5.4%
0.2%
-1.7%
-
500
1,000
1,500
2,000
2,500
3,000
2017 2018 2019 2020E 2021E
4.8%
45.0%
21.8%
-9.0%
-5.3%
-
3,000
6,000
9,000
12,000
15,000
18,000
2017 2018 2019 2020E 2021E
20.1%
17.1%
7.2%
2.3%
-2.5%
-
100
200
300
400
500
600
700
2017 2018 2019 2020E 2021E
7.0%
-3.9%
0.0%-0.4%
6.3%
2017 2018 2019 2020E 2021E
4.3% 3.2% 9.9% -0.7% 1.8%
∆% Oil Rig/Well Cement
-
100
200
300
400
500
600
700
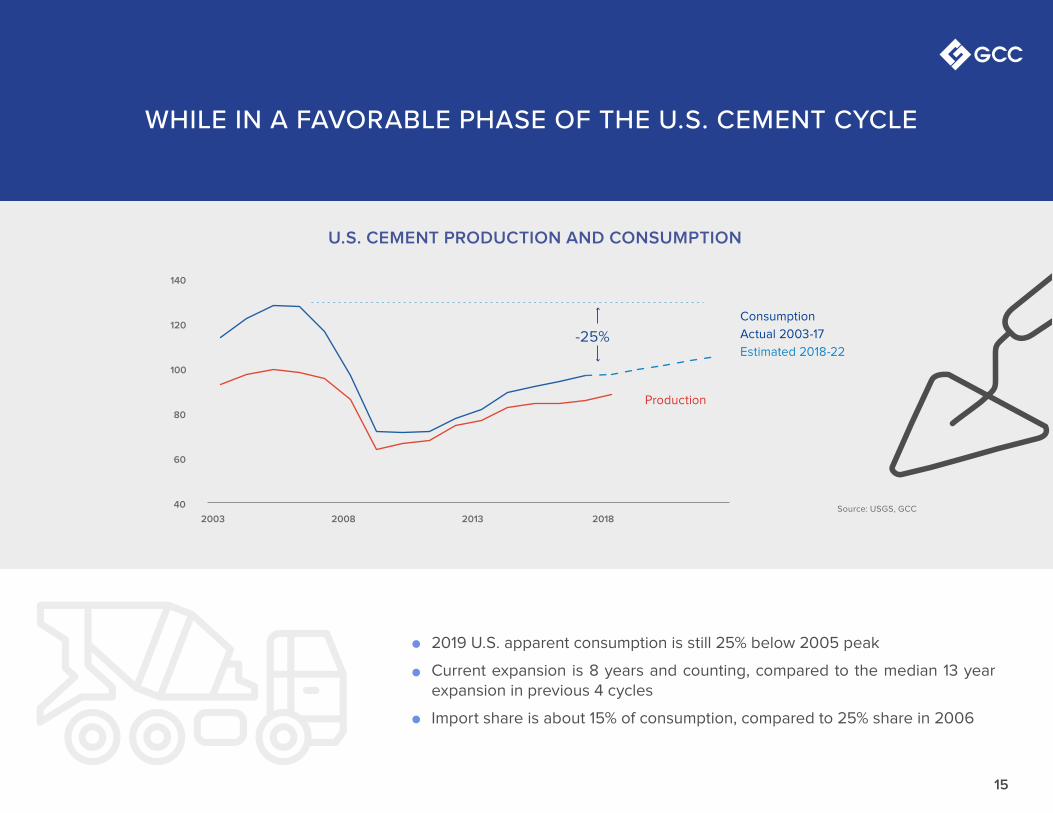
WHILE IN A FAVORABLE PHASE OF THE U.S. CEMENT CYCLE
2019 U.S. apparent consumption is still 25% below 2005 peak
Current expansion is 8 years and counting, compared to the median 13 year expansion in previous 4 cycles
Import share is about 15% of consumption, compared to 25% share in 2006
U.S. CEMENT PRODUCTION AND CONSUMPTION
40
60
80
100
120
140
2003 2008 2013 2018
-25%
Consumption
Actual 2003-17
Estimated 2018-22
Production
Source: USGS, GCC
15
16
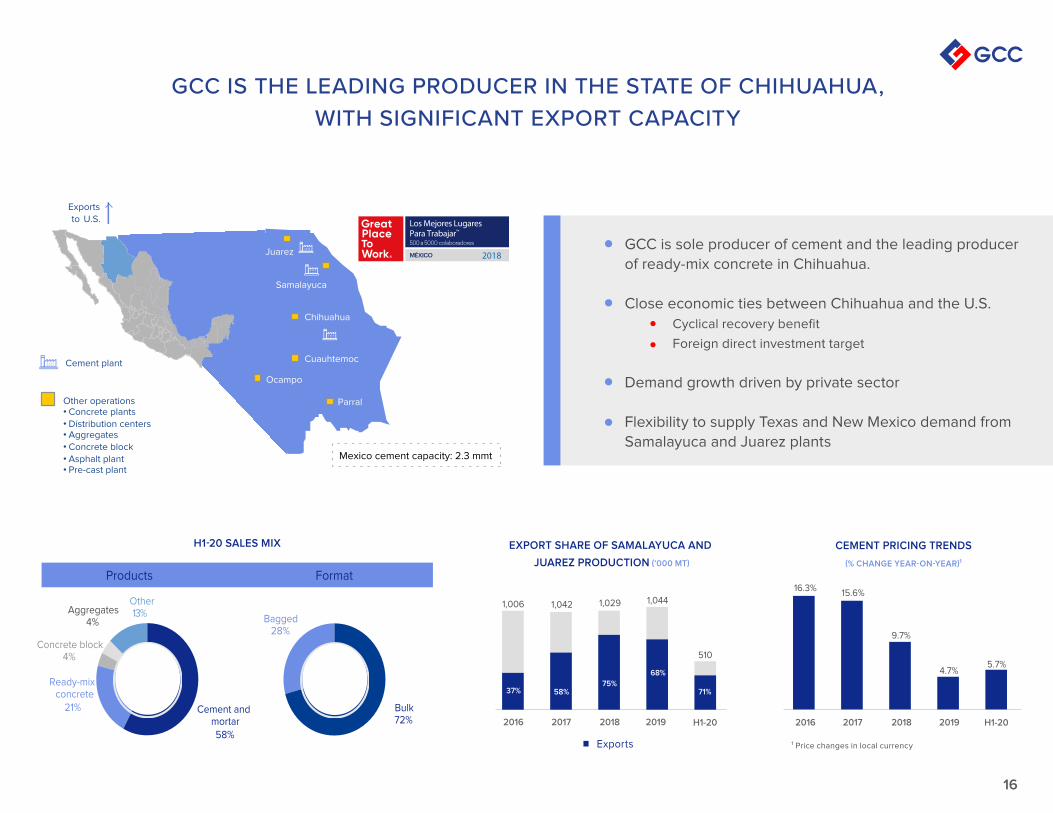
GCC IS THE LEADING PRODUCER IN THE STATE OF CHIHUAHUA, WITH SIGNIFICANT EXPORT CAPACITY
GCC is sole producer of cement and the leading producer
of ready-mix concrete in Chihuahua.
Close economic ties between Chihuahua and the U.S.
Cyclical recovery benefit
Foreign direct investment target
Demand growth driven by private sector
Flexibility to supply Texas and New Mexico demand from
Samalayuca and Juarez plants
H1-20 SALES MIX
Cement and mortar 58%
Ready-mix concrete
21%
Other 13%
Concrete block 4%
Aggregates 4% Bagged
28%
Bulk 72%
Format Products
EXPORT SHARE OF SAMALAYUCA AND
JUAREZ PRODUCTION (’000 MT)
CEMENT PRICING TRENDS
(% CHANGE YEAR-ON-YEAR)¹
1,006
2016 2017 2018 2019
Exports
5.7%
16.3% 15.6%
9.7%
4.7%
H1-202016 2017 2018 2019
1,042 1,0441,029
510
37% 58% 75%
68%
71%
H1-20
¹ Price changes in local currency
Exports
to U.S.
Other operations • Concrete plants
• Distribution centers • Aggregates
• Concrete block
• Asphalt plant • Pre-cast plant
Cement plant
Juarez
Samalayuca
Chihuahua
Cuauhtemoc
Ocampo
Parral
17
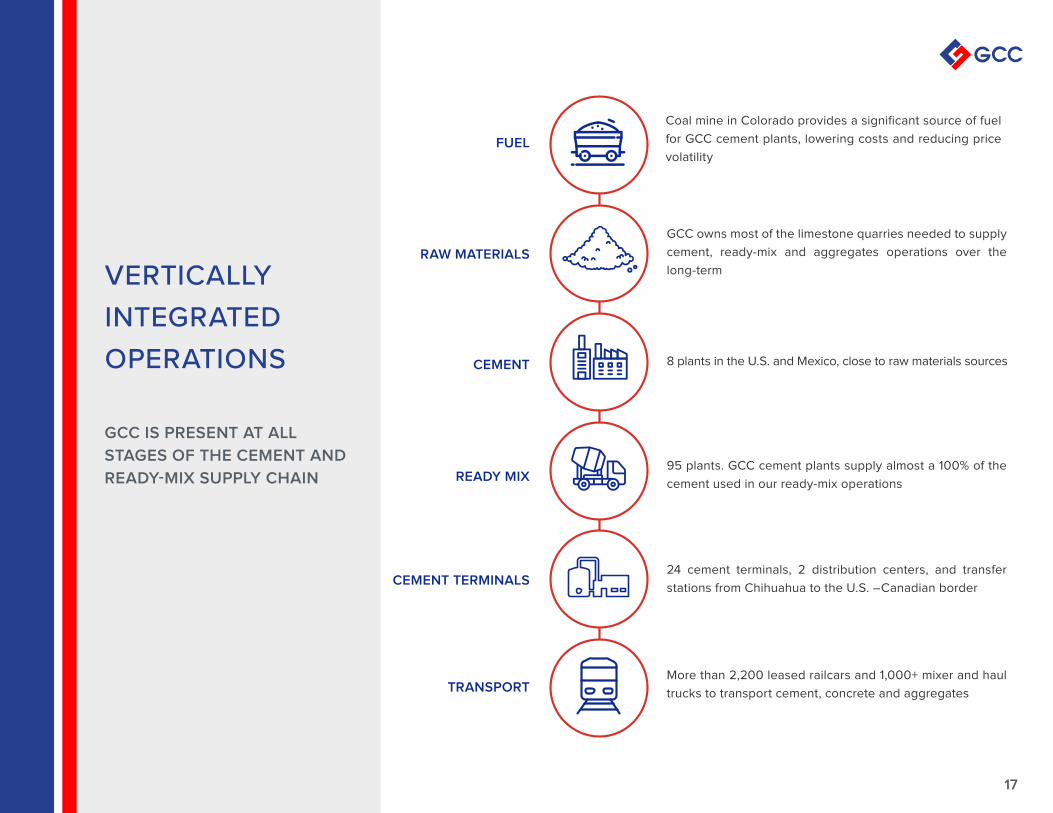
VERTICALLYINTEGRATEDOPERATIONS
GCC IS PRESENT AT ALL
STAGES OF THE CEMENT AND
READY-MIX SUPPLY CHAIN
Coal mine in Colorado provides a significant source of fuel
for GCC cement plants, lowering costs and reducing price
volatility
GCC owns most of the limestone quarries needed to supply
cement, ready-mix and aggregates operations over the
long-term
8 plants in the U.S. and Mexico, close to raw materials sources
95 plants. GCC cement plants supply almost a 100% of the
cement used in our ready-mix operations
24 cement terminals, 2 distribution centers, and transfer
stations from Chihuahua to the U.S. –Canadian border
More than 2,200 leased railcars and 1,000+ mixer and haul
trucks to transport cement, concrete and aggregates
FUEL
RAW MATERIALS
CEMENT
READY MIX
CEMENT TERMINALS
TRANSPORT
1818
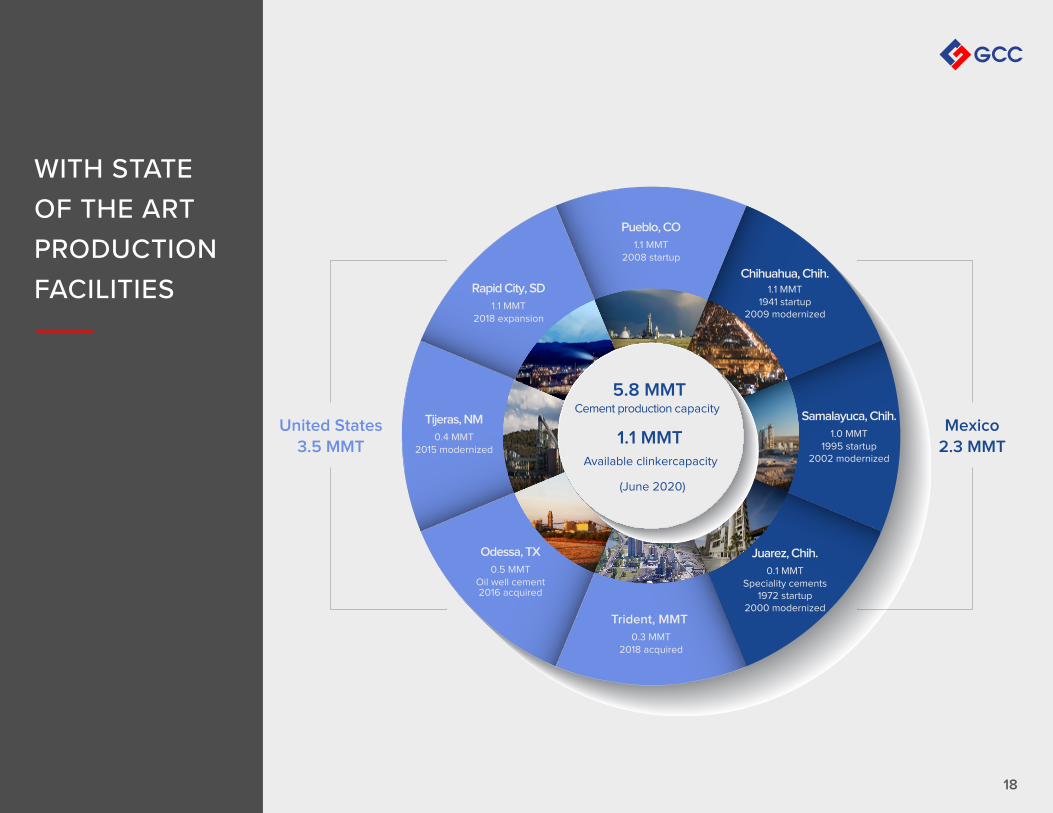
WITH STATE OF THE ART PRODUCTION FACILITIES
Trident, MMT
0.3 MMT2018 acquired
Juarez, Chih.
0.1 MMTSpeciality cements
1972 startup2000 modernized
Chihuahua, Chih.1.1 MMT
1941 startup2009 modernized
Rapid City, SD
1.1 MMT2018 expansion
Odessa, TX
0.5 MMTOil well cement2016 acquired
Tijeras, NM
0.4 MMT2015 modernized
Samalayuca, Chih.
1.0 MMT1995 startup
2002 modernized
Pueblo, CO
1.1 MMT2008 startup
1.1 MMT Available clinkercapacity
(June 2020)
2.3 MMTMexico
3.5 MMTUnited States
5.8 MMT Cement production capacity
19
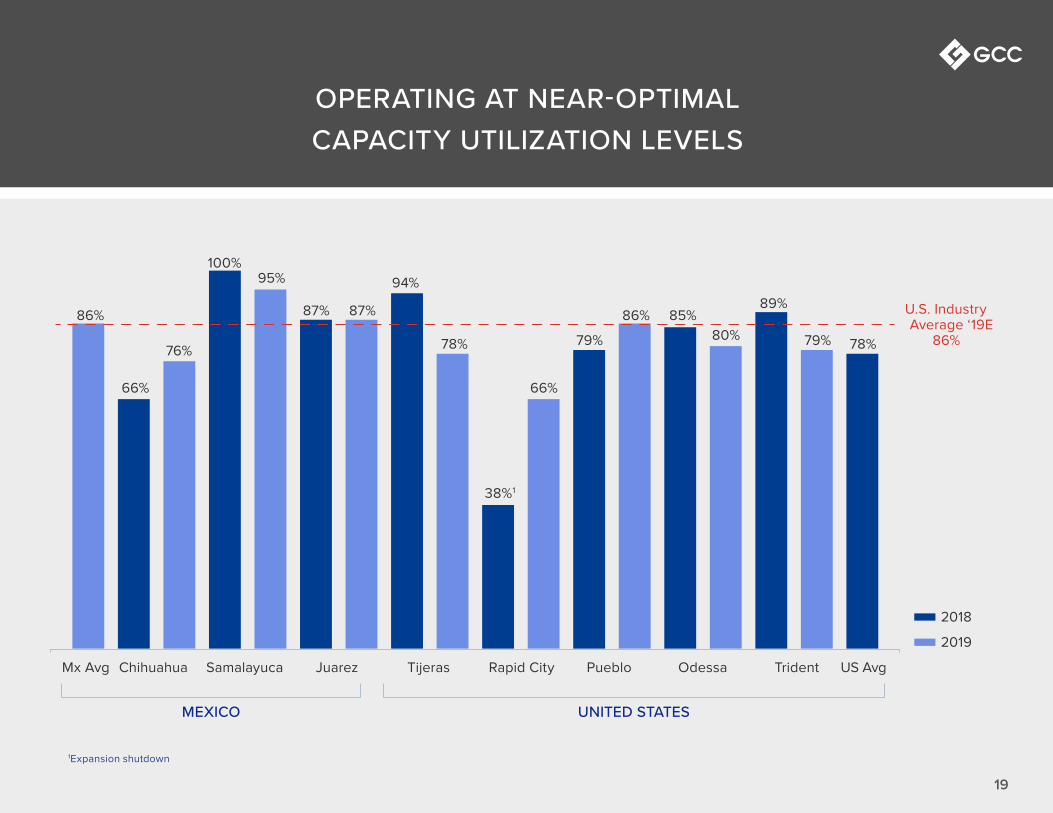
OPERATING AT NEAR-OPTIMAL CAPACITY UTILIZATION LEVELS
19
1Expansion shutdown
76%
95%
86% 87%
79%
66%
86%
80%
66%
78%
87%
94%
38%1
79%
85% 89%
Chihuahua Mx Avg Samalayuca
MEXICO UNITED STATES
Juarez Tijeras Rapid City Pueblo Odessa Trident US Avg
2018
2019
U.S. Industry Average ‘19E
86%
100%
78%
2020
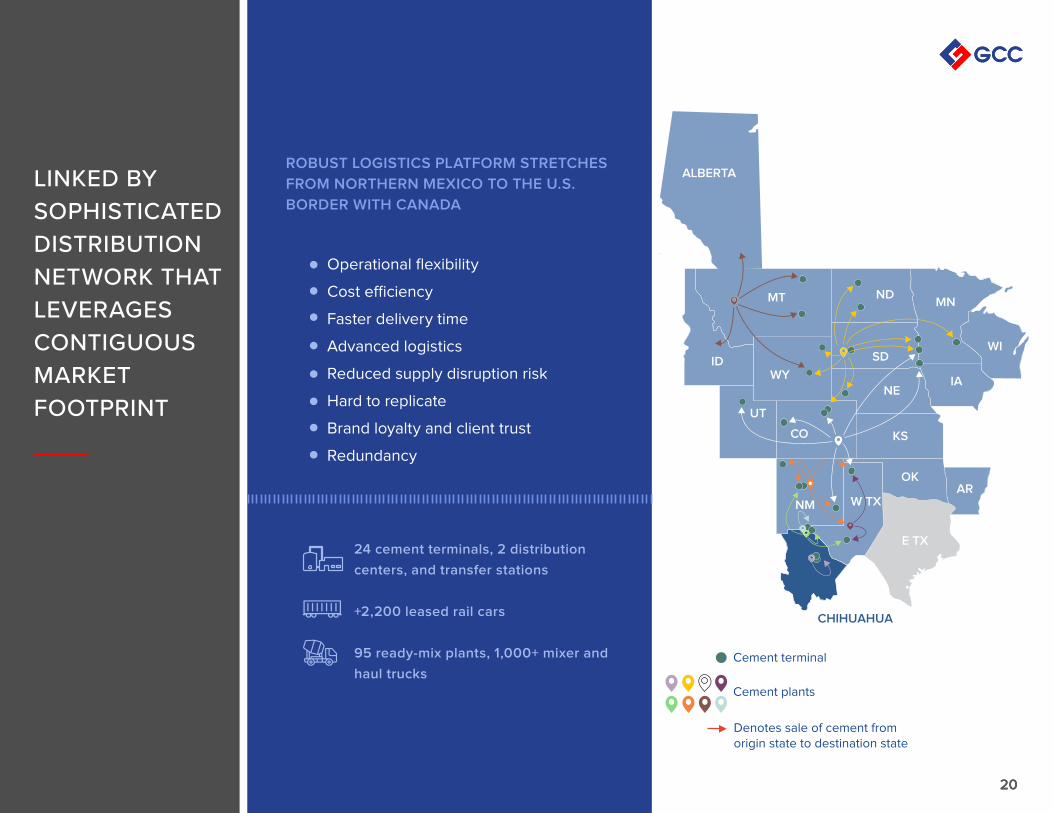
LINKED BY SOPHISTICATED DISTRIBUTION NETWORK THAT LEVERAGES CONTIGUOUS MARKET FOOTPRINT
ROBUST LOGISTICS PLATFORM STRETCHES
FROM NORTHERN MEXICO TO THE U.S.
BORDER WITH CANADA
Operational flexibility
Cost efficiency
Faster delivery time
Advanced logistics
Reduced supply disruption risk
Hard to replicate
Brand loyalty and client trust
Redundancy
24 cement terminals, 2 distribution
centers, and transfer stations
+2,200 leased rail cars
95 ready-mix plants, 1,000+ mixer and
haul trucks
Denotes sale of cement from origin state to destination state
Cement terminal
Cement plants
WI ID
MT NDMN
WI
IA
AROK
NE
SD
KS
W TXNM
CO
UT
WY
E TX
CHIHUAHUA
ALBERTA
ID
21
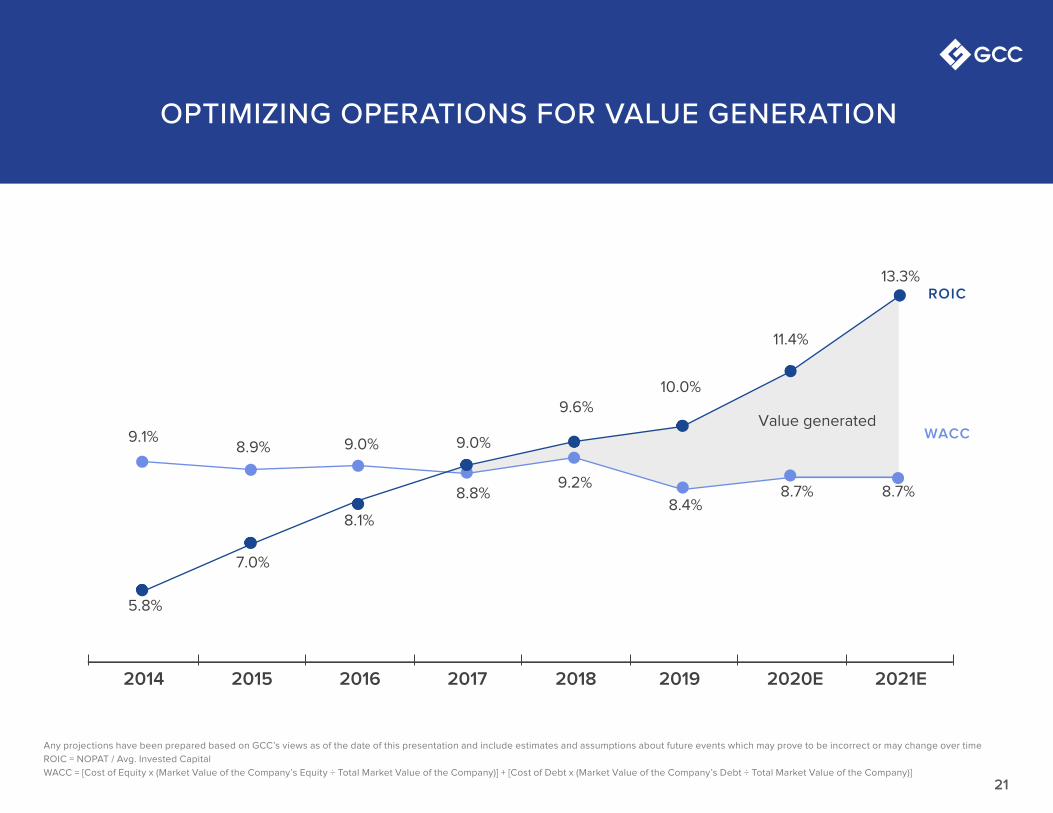
5.8%
7.0%
8.1%
9.0%
9.6%
10.0%
11.4%
13.3%
9.1% 8.9% 9.0%
8.8% 9.2%
8.4%8.7% 8.7%
2014 2015 2016 2017 2018 2019 2020E 2021E
ROIC
WACC Value generated
OPTIMIZING OPERATIONS FOR VALUE GENERATION
Any projections have been prepared based on GCC’s views as of the date of this presentation and include estimates and assumptions about future events which may prove to be incorrect or may change over time
ROIC = NOPAT / Avg. Invested Capital
WACC = [Cost of Equity x (Market Value of the Company’s Equity ÷ Total Market Value of the Company)] + [Cost of Debt x (Market Value of the Company’s Debt ÷ Total Market Value of the Company)]
21
22
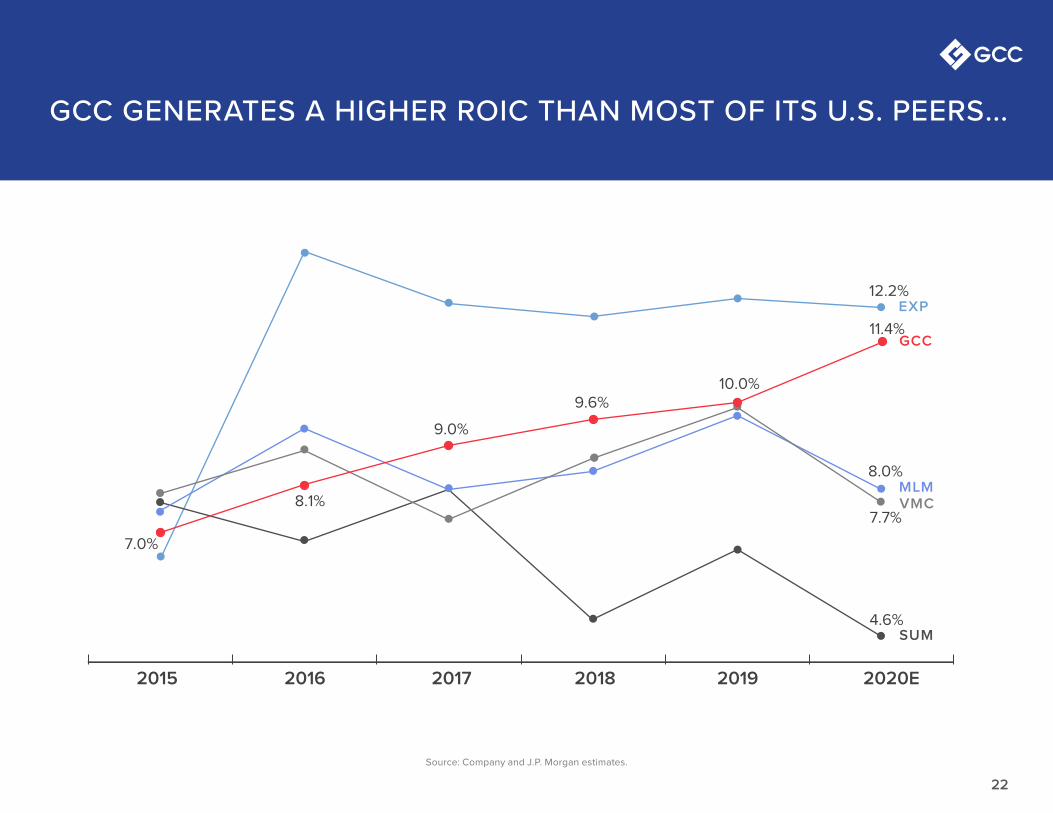
GCC GENERATES A HIGHER ROIC THAN MOST OF ITS U.S. PEERS...
Source: Company and J.P. Morgan estimates.
7.0%
8.1%
9.0%
9.6% 10.0%
11.4%
2015 2016 2017 2018 2019 2020E
GCC
MLM
SUM
VMC
4.6%
7.7%
EXP12.2%
8.0%
22
23
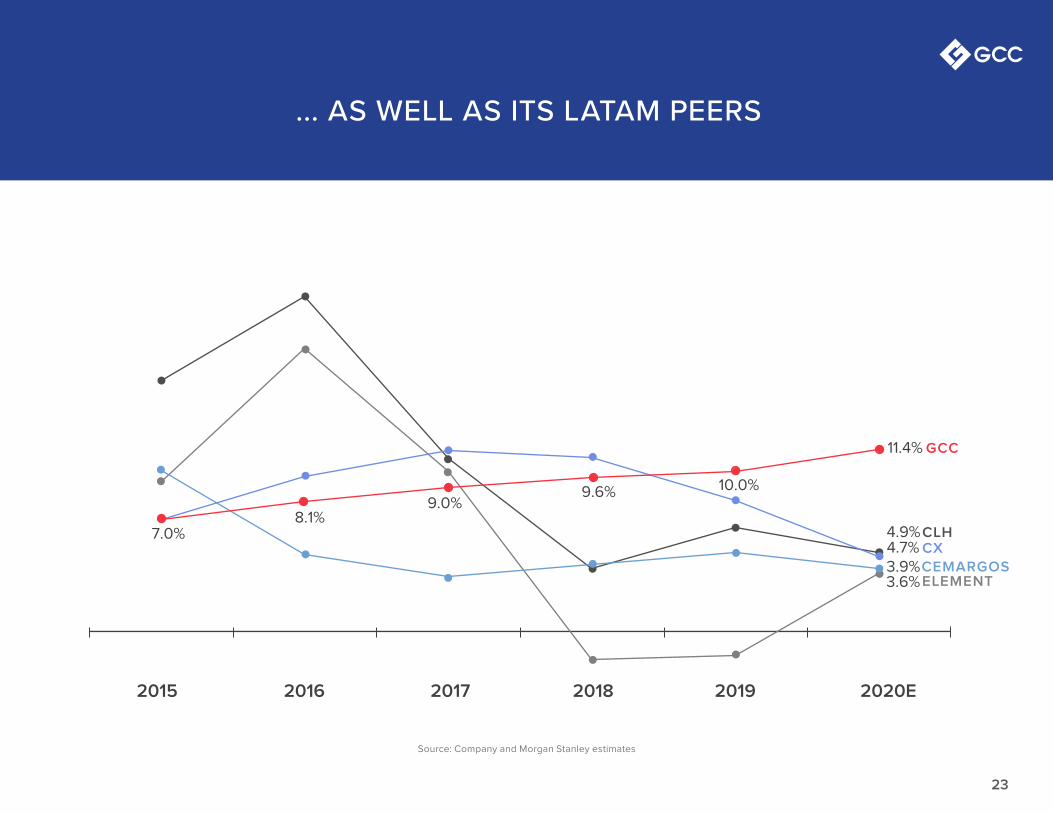
... AS WELL AS ITS LATAM PEERS
Source: Company and Morgan Stanley estimates
7.0% 8.1%
9.0% 9.6% 10.0%
11.4%
2015 2016 2017 2018 2019 2020E
GCC
CXCLH
ELEMENTCEMARGOS
4.7% 3.9%
4.9%
3.6%
23
24
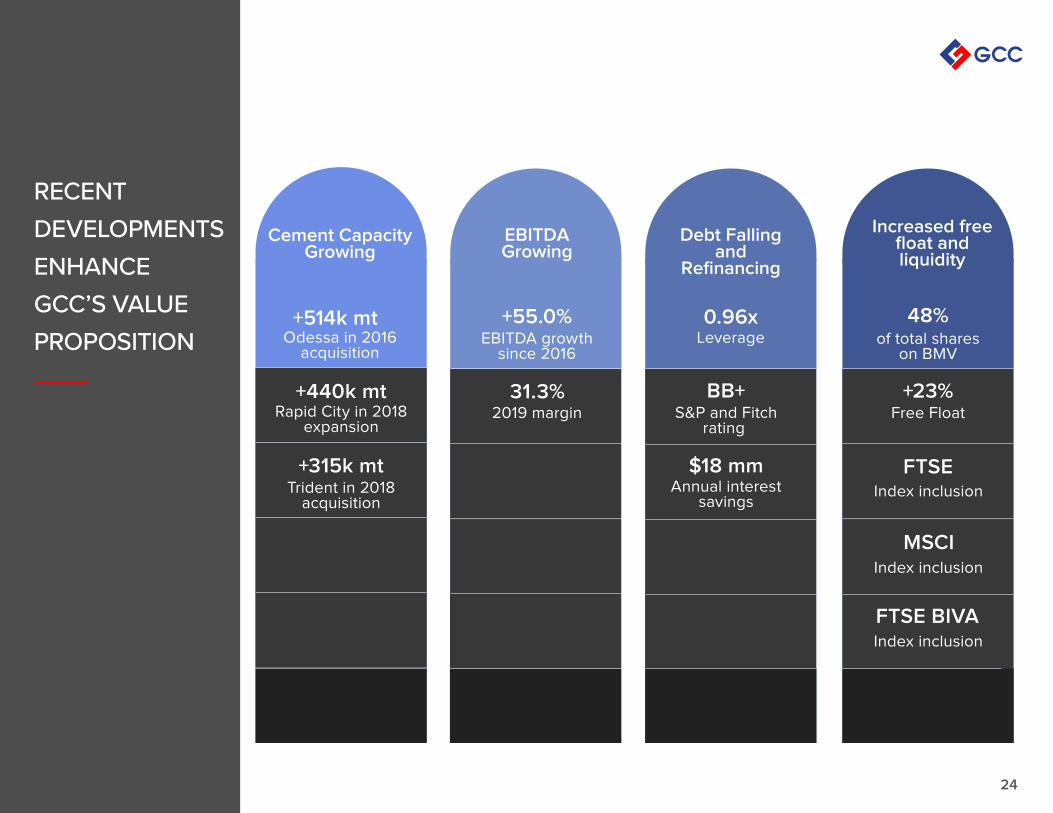
RECENT DEVELOPMENTS ENHANCE GCC’S VALUE PROPOSITION EBITDA growth
since 2016
+55.0%
2019 margin31.3%
EBITDAGrowing
Leverage0.96x
S&P and Fitchrating
BB+
Annual interestsavings
$18 mm
Debt Fallingand
Refinancing
Odessa in 2016acquisition
+514k mt
Rapid City in 2018expansion
+440k mt
Trident in 2018acquisition
+315k mt
Cement CapacityGrowing
Free Float+23%
Index inclusion
MSCI
Increased freefloat andliquidity
of total shareson BMV
48%
Index inclusion
FTSE
FTSE BIVAIndex inclusion
25
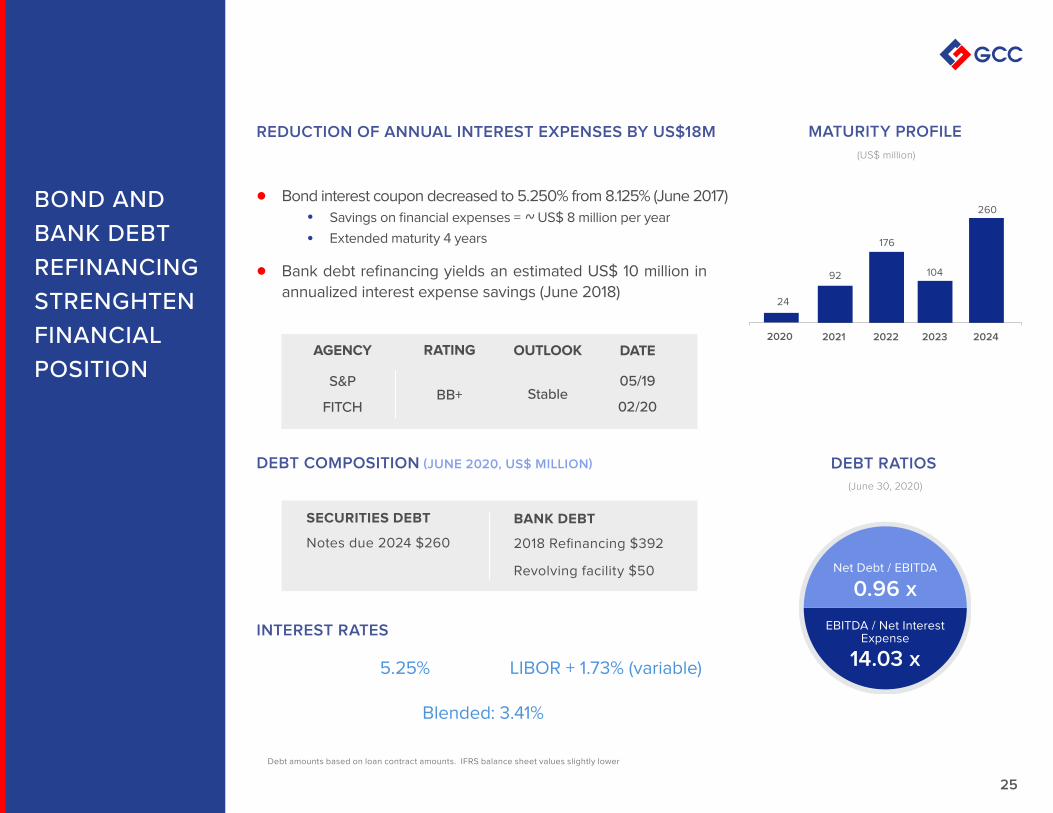
REDUCTION OF ANNUAL INTEREST EXPENSES BY US$18M
DEBT COMPOSITION (JUNE 2020, US$ MILLION)
Bank debt refinancing yields an estimated US$ 10 million in
annualized interest expense savings (June 2018)
BOND AND BANK DEBT REFINANCINGSTRENGHTEN FINANCIAL POSITION
Debt amounts based on loan contract amounts. IFRS balance sheet values slightly lower
INTEREST RATES
LIBOR + 1.73% (variable)5.25%
SECURITIES DEBT BANK DEBT
Notes due 2024 $260
Blended: 3.41%
MATURITY PROFILE(US$ million)
DEBT RATIOS(June 30, 2020)
0.96 xNet Debt / EBITDA
14.03 x
EBITDA / Net InterestExpense
24
92
176
104
260
2020 2021 2022 2023 2024
Bond interest coupon decreased to 5.250% from 8.125% (June 2017)
Savings on financial expenses = US$ 8 million per year
Extended maturity 4 years~
AGENCY RATING OUTLOOK DATE
S&P
FITCHBB+ Stable
05/19
02/20
2018 Refinancing $392
MATURITY PROFILE(US$ million)
DEBT RATIOS(June 30, 2020)
0.96 xNet Debt / EBITDA
14.03 x
EBITDA / Net InterestExpense
24
92
176
104
260
2020 2021 2022 2023 2024
MATURITY PROFILE
DEBT RATIOS
Revolving facility $50
26
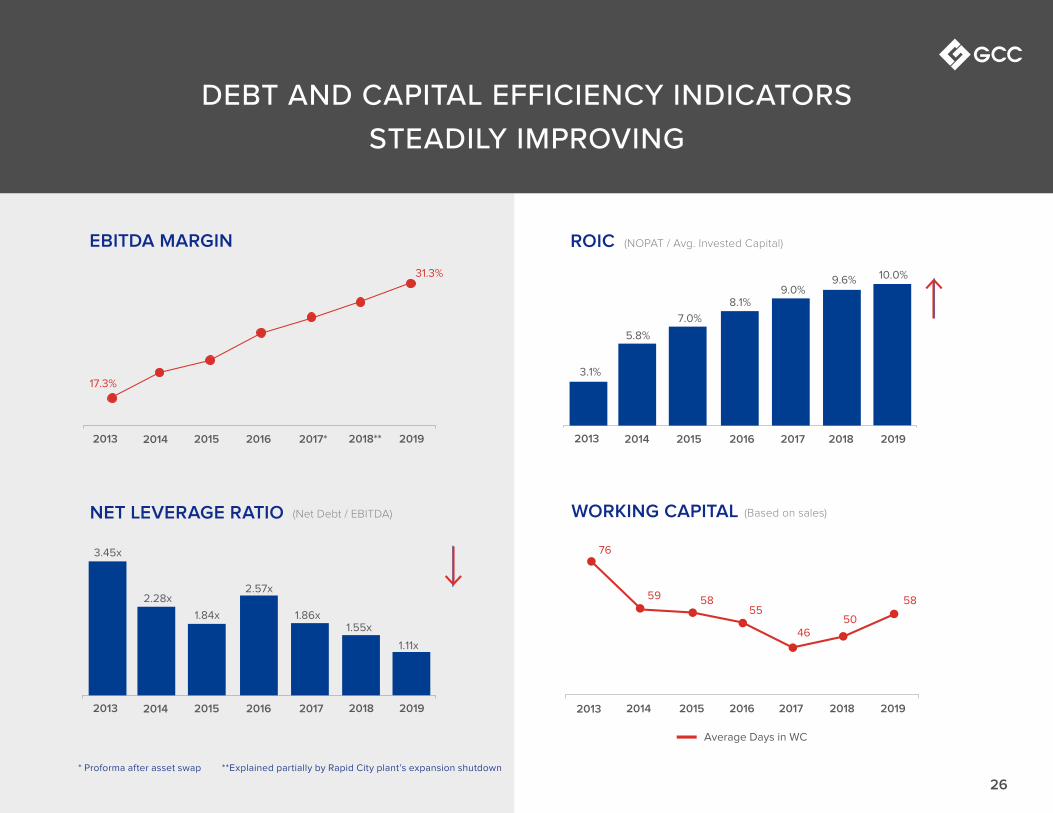
DEBT AND CAPITAL EFFICIENCY INDICATORS STEADILY IMPROVING
* Proforma after asset swap **Explained partially by Rapid City plant’s expansion shutdown
2013 2014 2015 2016 2017 2018
WORKING CAPITAL
EBITDA MARGIN ROIC (NOPAT / Avg. Invested Capital)
NET LEVERAGE RATIO (Net Debt / EBITDA)
17.3%
31.3%
3.1%
5.8%
7.0%
8.1%9.0%
9.6%
2013 2014 2015 2016 2017 2018
3.45x
2.28x
1.84x
2.57x
1.86x1.55x
Average Days in WC
59 5855
4650
76
58
2019
2019
(Based on sales)
1.11x
2013 2014 2015 2016 2017 2018 2019
10.0%
2013 2014 2015 2016 2017* 2018** 2019
27
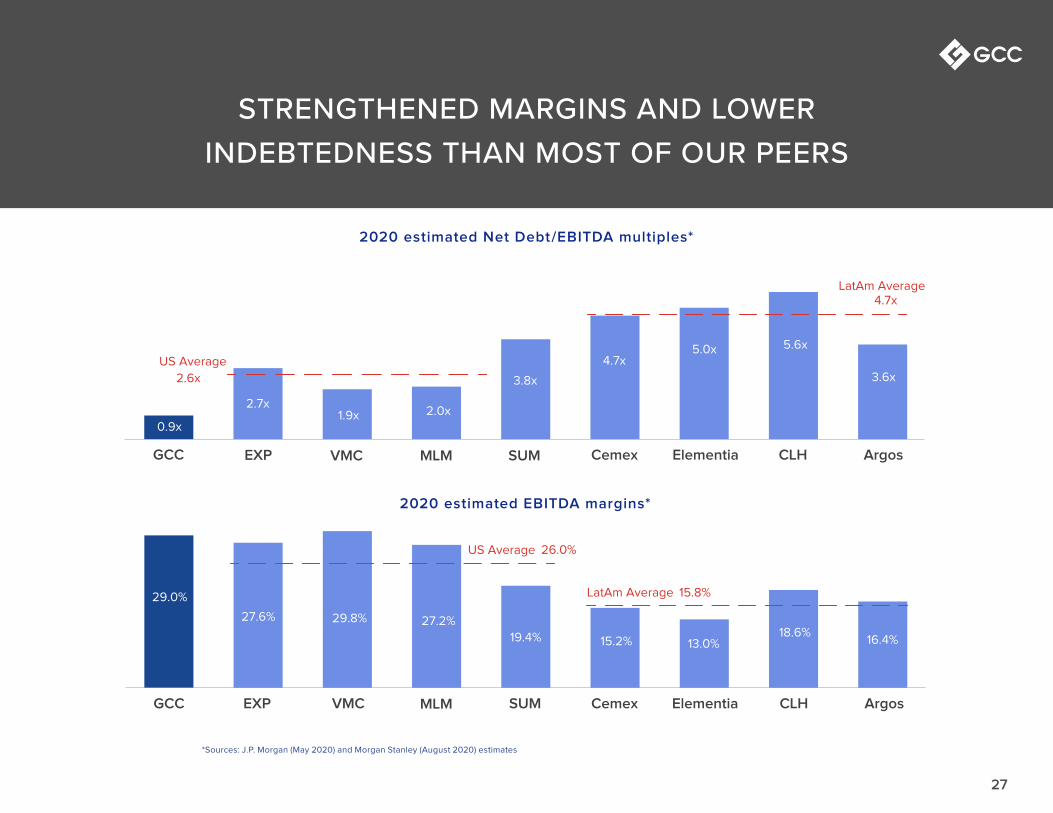
STRENGTHENED MARGINS AND LOWER INDEBTEDNESS THAN MOST OF OUR PEERS
*Sources: J.P. Morgan (May 2020) and Morgan Stanley (August 2020) estimates
0.9x 1.9x 2.0x
3.8x
4.7x
5.1x
5.0x 5.6x
3.6x
LatAm Average
LatAm Average
US Average
US Average
2.6x
GCC VMC MLM SUM Cemex Elementia CLH Argos
2020 estimated Net Debt/EBITDA multiples*
2020 estimated EBITDA margins*
29.0%
29.8% 27.2%
19.4% 15.2% 13.0% 18.6%
16.4%
15.8%
26.0%
EXP VMC MLM SUM Cemex Elementia CLH Argos
2.7x
EXP
27.6%
GCC
4.7x
28
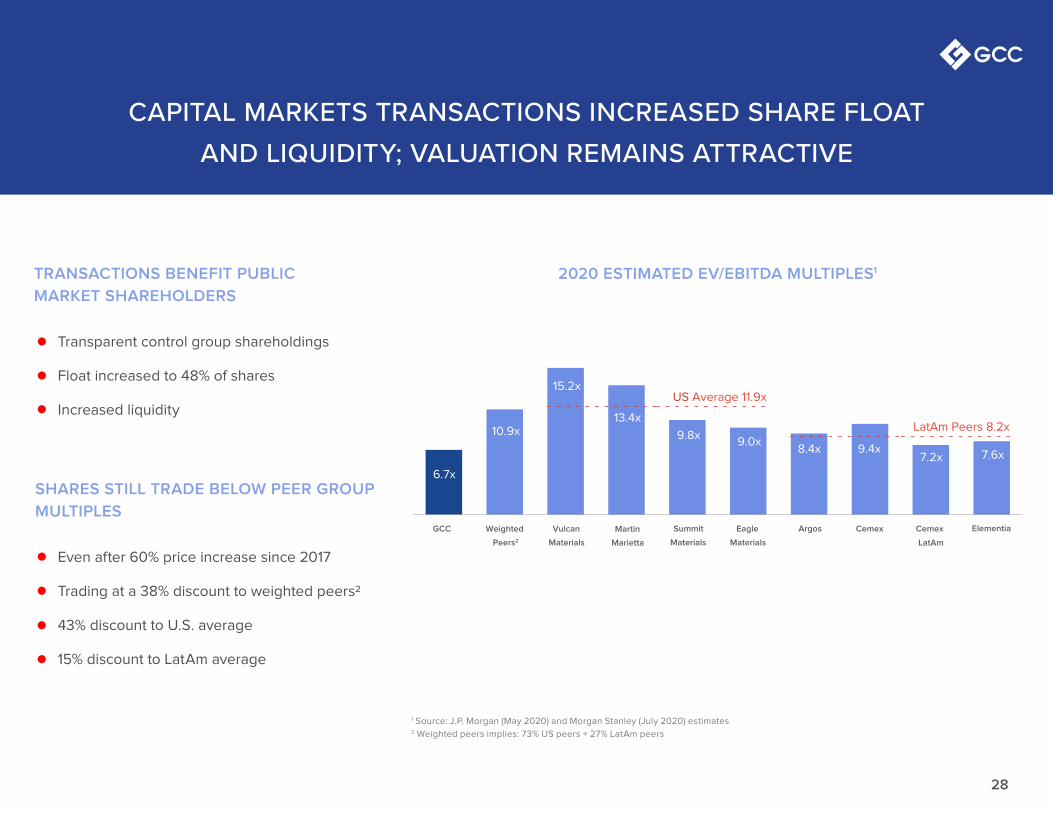
CAPITAL MARKETS TRANSACTIONS INCREASED SHARE FLOAT AND LIQUIDITY; VALUATION REMAINS ATTRACTIVE
1 Source: J.P. Morgan (May 2020) and Morgan Stanley (July 2020) estimates2 Weighted peers implies: 73% US peers + 27% LatAm peers
TRANSACTIONS BENEFIT PUBLIC
MARKET SHAREHOLDERS
2020 ESTIMATED EV/EBITDA MULTIPLES1
SHARES STILL TRADE BELOW PEER GROUP
MULTIPLES
Transparent control group shareholdings
Float increased to 48% of shares
Increased liquidity
Even after 60% price increase since 2017
Trading at a 38% discount to weighted peers2
43% discount to U.S. average
15% discount to LatAm average
6.7x
10.9x
15.2x
13.4x
9.8x 9.0x
9.4x 7.2x 7.6x
GCC Weighted
Peers2
Vulcan
Materials
Martin
Marietta
Eagle
Materials
Argos Cemex
US Average 11.9x
LatAm Peers 8.2x
Summit
Materials
8.4x
LatAm
Cemex Elementia
28
29
LIQUIDITY ENHANCING EVENTS
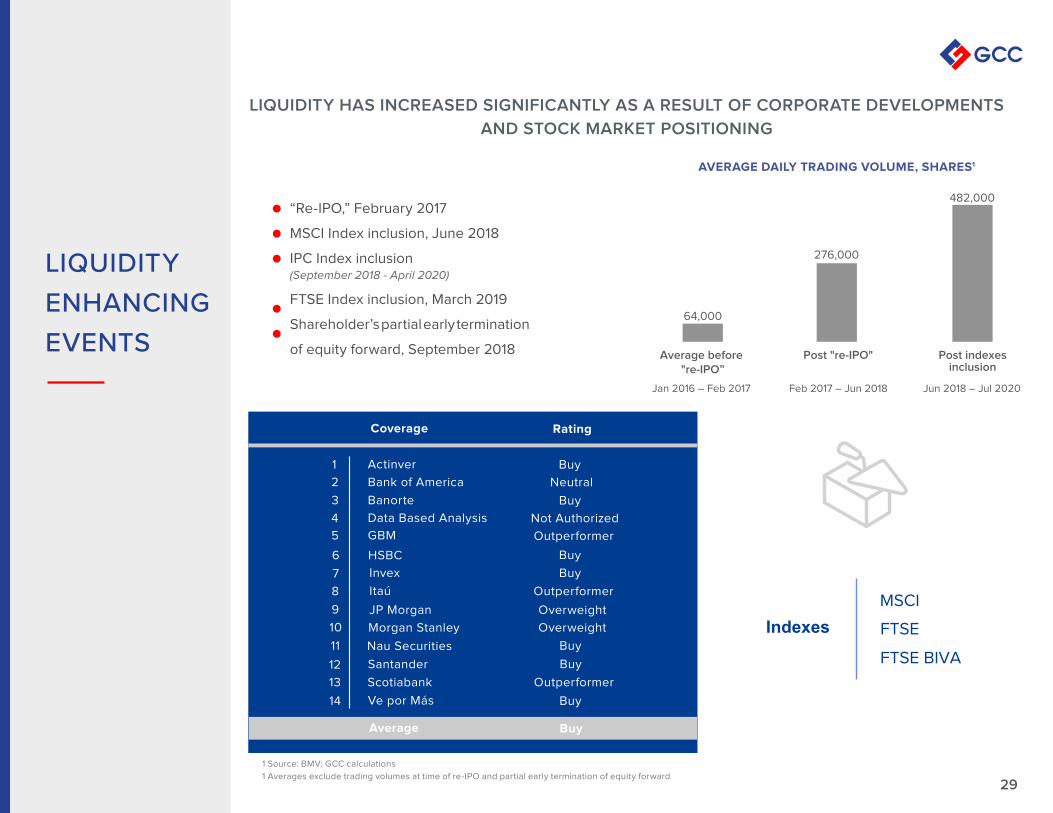
LIQUIDITY HAS INCREASED SIGNIFICANTLY AS A RESULT OF CORPORATE DEVELOPMENTS
AND STOCK MARKET POSITIONING
“Re-IPO,” February 2017
MSCI Index inclusion, June 2018
IPC Index inclusion (September 2018 - April 2020)
FTSE Index inclusion, March 2019
Shareholder’s partial early termination
of equity forward, September 2018
Coverage Rating
1 Buy
2 Neutral
3 Buy
4
5
Not Authorized
6
Outperformer
7
Buy
8
Outperformer
9 Overweight
10
Buy 11
Buy
Outperformer
Buy
Actinver
Bank of America
Banorte
Data Based Analysis
GBM
Invex
Itaú
JP Morgan
Nau Securities
Santander
Scotiabank
Average
HSBC
12
Buy
13
14
Morgan Stanley Overweight
Buy Ve por Más
AVERAGE DAILY TRADING VOLUME, SHARES1
1 Source: BMV; GCC calculations
1 Averages exclude trading volumes at time of re-IPO and partial early termination of equity forward
IndexesMSCI
FTSE
FTSE BIVA
64,000
276,000
482,000
Average before "re-IPO”
Post "re-IPO" Post indexes inclusion
Jan 2016 – Feb 2017 Feb 2017 – Jun 2018 Jun 2018 – Jul 2020
30
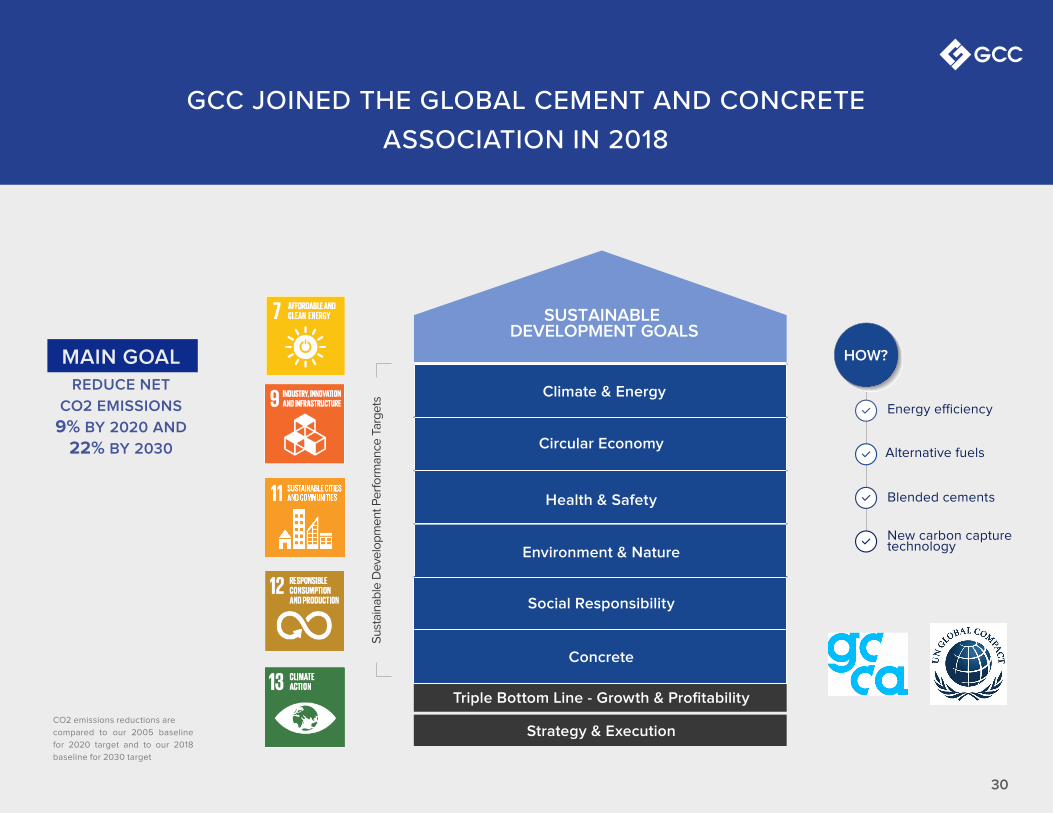
GCC JOINED THE GLOBAL CEMENT AND CONCRETE ASSOCIATION IN 2018
CO2 emissions reductions are
compared to our 2005 baseline
for 2020 target and to our 2018
baseline for 2030 target
MAIN GOALREDUCE NET
CO2 EMISSIONS
9% BY 2020 AND
22% BY 2030
30
Su
stai
nab
le D
eve
lop
me
nt P
erf
orm
ance
Tar
ge
ts
Circular Economy
Health & Safety
Environment & Nature
Social Responsibility
Concrete
SUSTAINABLE DEVELOPMENT GOALS
HOW?
Triple Bottom Line - Growth & Profitability
Strategy & Execution
Energy e�ciency
Alternative fuels
Blended cements
New carbon capturetechnology
Climate & Energy
31
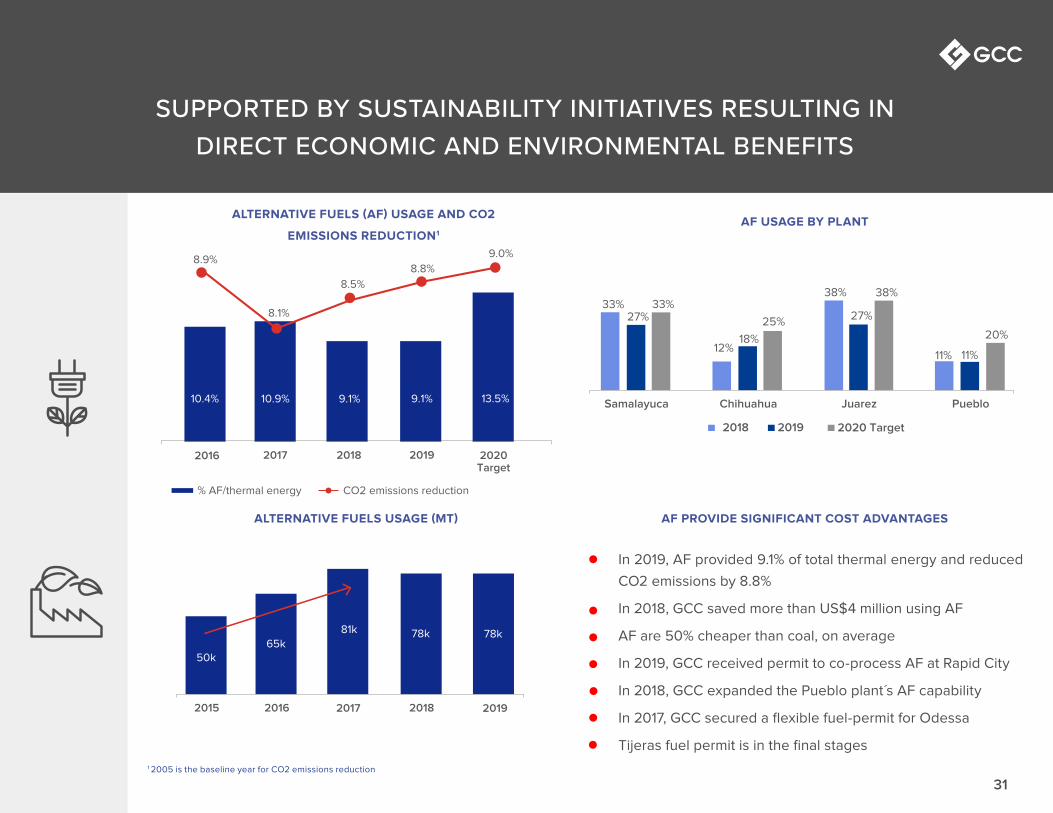
SUPPORTED BY SUSTAINABILITY INITIATIVES RESULTING IN DIRECT ECONOMIC AND ENVIRONMENTAL BENEFITS
1 2005 is the baseline year for CO2 emissions reduction
10.4% 10.9% 9.1% 13.5%
8.9%
8.1%
8.5%
9.0%
2016 2017 2018 2020 Target
50k 65k
81k 78k 78k
2015 2016 2017 2018
% AF/thermal energy CO2 emissions reduction
2019
8.8%
2019
9.1%
ALTERNATIVE FUELS (AF) USAGE AND CO2
EMISSIONS REDUCTION1
ALTERNATIVE FUELS USAGE (MT) AF PROVIDE SIGNIFICANT COST ADVANTAGES
AF USAGE BY PLANT
27%
18%
33%
12%
38%
11%
33%
25% 20%
Samalayuca Chihuahua Juarez Pueblo
2018 2019 2020 Target
27%
38%
11%
In 2019, AF provided 9.1% of total thermal energy and reduced
CO2 emissions by 8.8%
In 2018, GCC saved more than US$4 million using AF
AF are 50% cheaper than coal, on average
In 2019, GCC received permit to co-process AF at Rapid City
In 2018, GCC expanded the Pueblo plant´s AF capability
In 2017, GCC secured a flexible fuel-permit for Odessa
Tijeras fuel permit is in the final stages
32
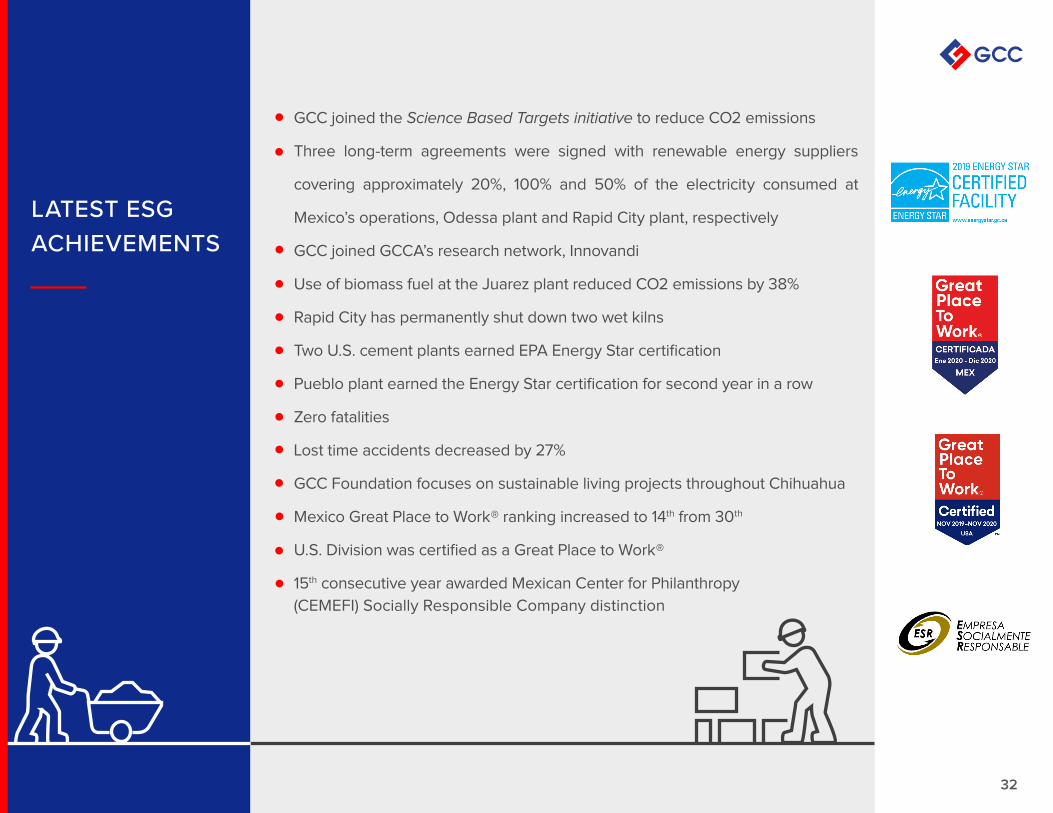
GCC joined the Science Based Targets initiative to reduce CO2 emissions
Three long-term agreements were signed with renewable energy suppliers
covering approximately 20%, 100% and 50% of the electricity consumed at
Mexico’s operations, Odessa plant and Rapid City plant, respectively
GCC joined GCCA’s research network, Innovandi
Use of biomass fuel at the Juarez plant reduced CO2 emissions by 38%
Rapid City has permanently shut down two wet kilns
Two U.S. cement plants earned EPA Energy Star certification
Pueblo plant earned the Energy Star certification for second year in a row
Zero fatalities
Lost time accidents decreased by 27%
GCC Foundation focuses on sustainable living projects throughout Chihuahua
Mexico Great Place to Work® ranking increased to 14th from 30th
U.S. Division was certified as a Great Place to Work®
15th consecutive year awarded Mexican Center for Philanthropy
(CEMEFI) Socially Responsible Company distinction
LATEST ESG ACHIEVEMENTS
3333
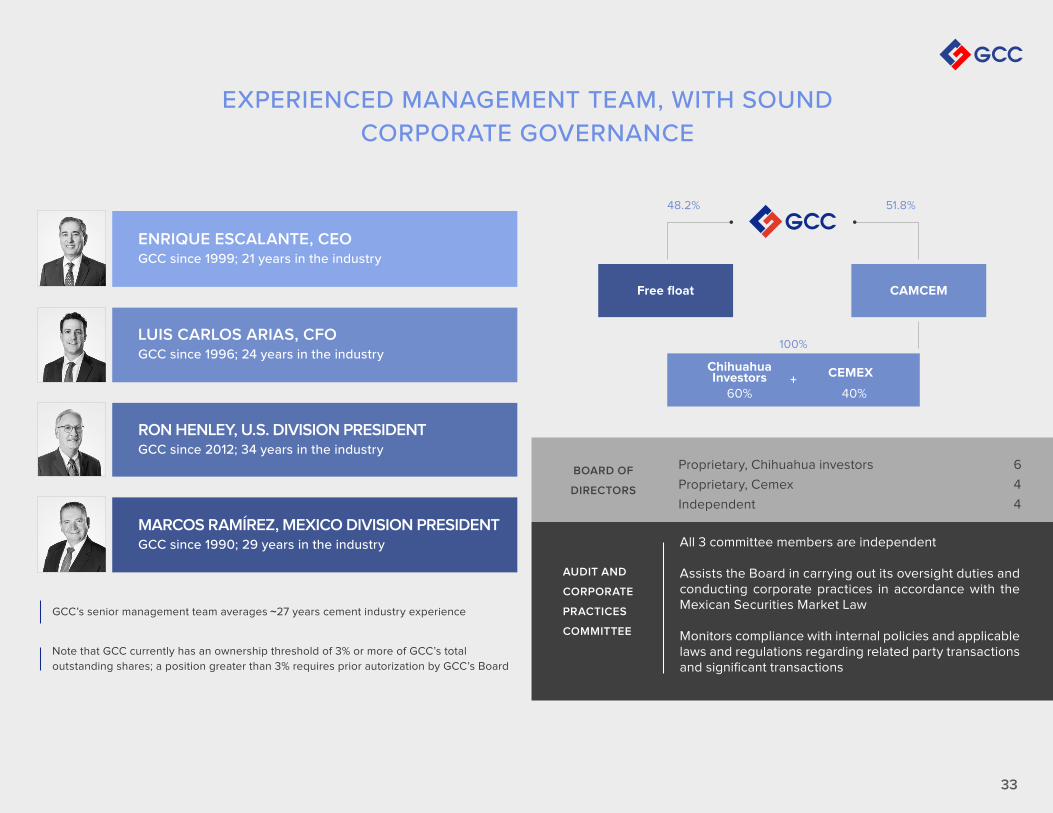
EXPERIENCED MANAGEMENT TEAM, WITH SOUND CORPORATE GOVERNANCE
All 3 committee members are independent
Assists the Board in carrying out its oversight duties and conducting corporate practices in accordance with the Mexican Securities Market Law
Monitors compliance with internal policies and applicable laws and regulations regarding related party transactions and significant transactions
AUDIT AND
CORPORATE
PRACTICES
COMMITTEE
BOARD OF
DIRECTORS
Proprietary, Chihuahua investors 6
Proprietary, Cemex 4
Independent 4
100%
48.2% 51.8%
Free float CAMCEM
ChihuahuaInvestors CEMEX
+60% 40%
ENRIQUE ESCALANTE, CEOGCC since 1999; 21 years in the industry
LUIS CARLOS ARIAS, CFOGCC since 1996; 24 years in the industry
RON HENLEY, U.S. DIVISION PRESIDENTGCC since 2012; 34 years in the industry
MARCOS RAMÍREZ, MEXICO DIVISION PRESIDENTGCC since 1990; 29 years in the industry
GCC’s senior management team averages 27 years cement industry experience
Note that GCC currently has an ownership threshold of 3% or more of GCC’s total
outstanding shares; a position greater than 3% requires prior autorization by GCC’s Board
~
34
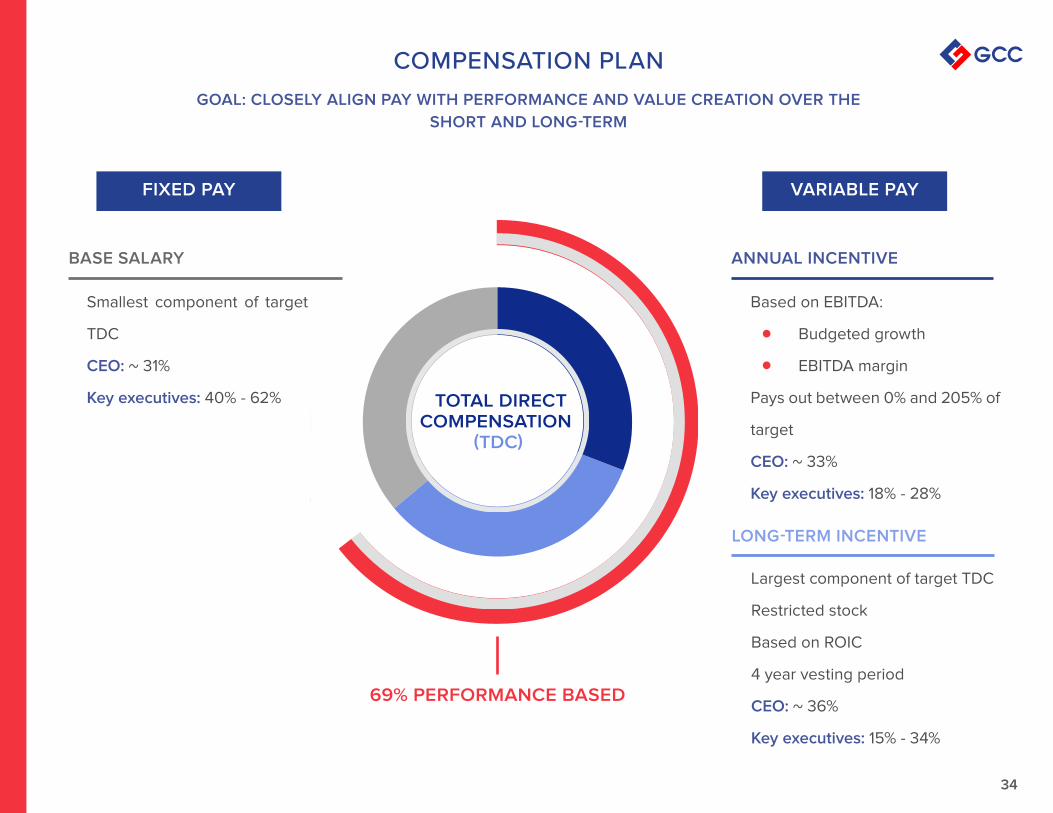
GOAL: CLOSELY ALIGN PAY WITH PERFORMANCE AND VALUE CREATION OVER THE
SHORT AND LONG-TERM
COMPENSATION PLAN
FIXED PAY VARIABLE PAY
Smallest component of target
TDC
CEO: ~ 31%
Key executives: 40% - 62%
Largest component of target TDC
Restricted stock
Based on ROIC
4 year vesting period
CEO: ~ 36%
Key executives: 15% - 34%
Based on EBITDA:
Budgeted growth
EBITDA margin
Pays out between 0% and 205% of
target
CEO: ~ 33%
Key executives: 18% - 28%
BASE SALARY ANNUAL INCENTIVE
LONG-TERM INCENTIVE
TOTAL DIRECTCOMPENSATION
(TDC)
69% PERFORMANCE BASED
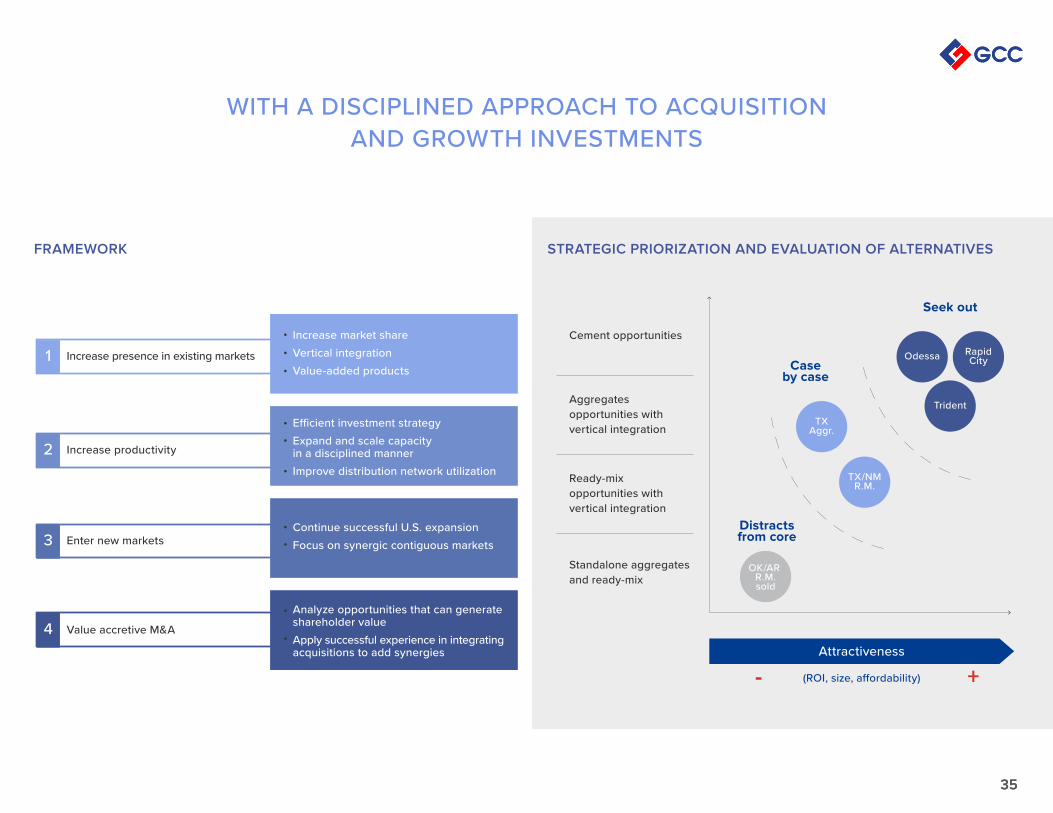
FRAMEWORK STRATEGIC PRIORIZATION AND EVALUATION OF ALTERNATIVES
Increase presence in existing markets
Increase productivity
Enter new markets
Value accretive M&A
1
2
3
4
Increase market shareVertical integrationValue-added products
E�cient investment strategyExpand and scale capacityin a disciplined mannerImprove distribution network utilization
Continue successful U.S. expansionFocus on synergic contiguous markets
Analyze opportunities that can generate shareholder value Apply successful experience in integrating acquisitions to add synergies
WITH A DISCIPLINED APPROACH TO ACQUISITION AND GROWTH INVESTMENTS
Cement opportunities
Aggregates opportunities with vertical integration
Ready-mix opportunities with vertical integration
Standalone aggregates and ready-mix
Distractsfrom core
OK/AR R.M.sold
TXAggr.
Attractiveness
(ROI, size, a ordability)- +
TX/NMR.M.
Odessa RapidCity
Trident
Caseby case
Seek out
3535
36
ENRIQUE ESCALANTE CEO Q2 2020 QUOTE
Enrique Escalante, GCC’s Chief Executive Officer, commented:
“GCC delivered strong operational and solid bottom-line growth results for the second quarter of 2020 despite the challenges arising from the pandemic. Increased concrete and cement volumes in the U.S; demonstrate the construction industry´s tailwinds and resiliency on the back of improved weather conditions. EBITDA growth, free cash flow generation & margin expansion reflected the successful execution of a comprehensive plan to reduce costs and expenses.
Looking forward, our backlog remains strong in the U.S; overall macro conditions are starting to deteriorate, and high levels of uncertainty prevail. Therefore, we expect additional challenges in the quarters ahead. We remain cautiously optimistic on further economic stimuli from the governments, including a sizable infrastructure bill.
We are confident in our financial and operational strengths, as well as in the bold steps taken to navigate today´s challenges. I am convinced that, like in the past downturns, GCC will weather this storm and will emerge from it even stronger.”
37
APPENDIXQ2 2020RESULTS
38
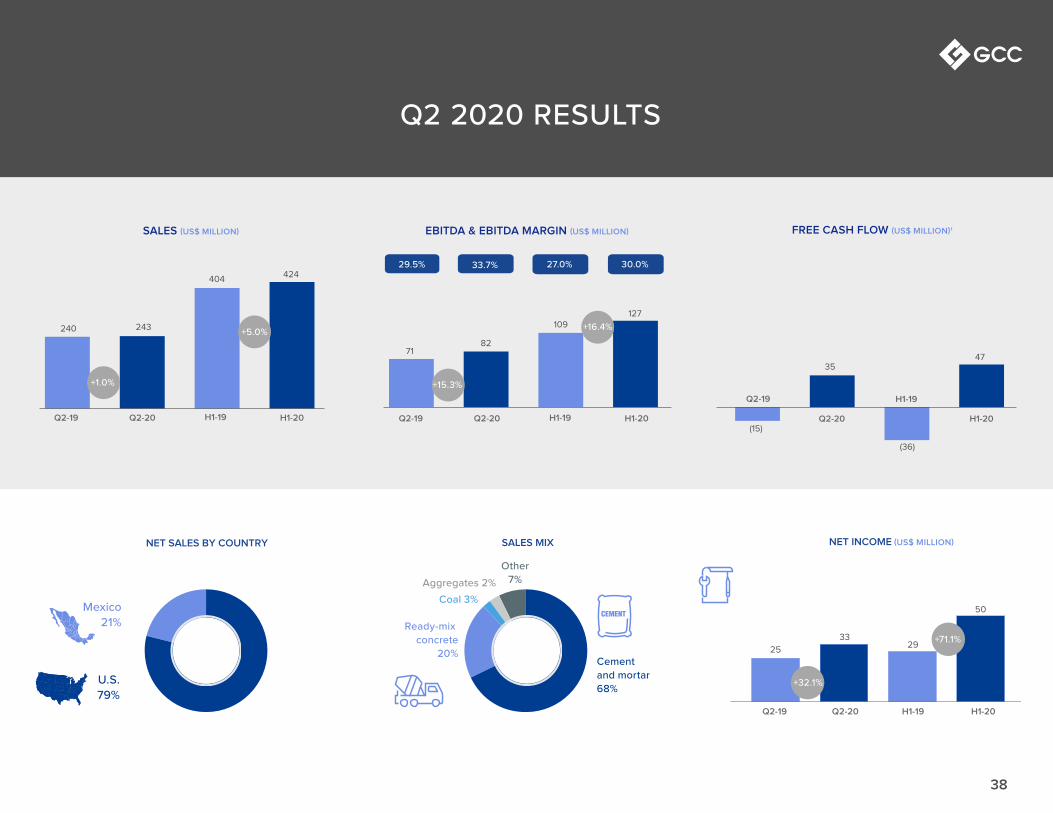
Q2 2020 RESULTS
NET SALES BY COUNTRY SALES MIX NET INCOME (US$ MILLION)
Mexico21%
U.S.79%
Cement and mortar68%
Ready-mix concrete
20%
Coal 3%Aggregates 2%
Other7%
25
33
50
29
Q2-19 Q2-20 H1-19 H1-20
+32.1%
+71.1%
404424
Q2-19 Q2-20 H1-19 H1-20
SALES (US$ MILLION) EBITDA & EBITDA MARGIN (US$ MILLION)
7182
109127
29.5% 33.7% 27.0% 30.0%
FREE CASH FLOW (US$ MILLION)1
+5.0%
+1.0%
+16.4%
+15.3%
(36)
4735
(15)
240 243
Q2-19 Q2-20 H1-19 H1-20
Q2-19
Q2-20
H1-19
H1-20
39
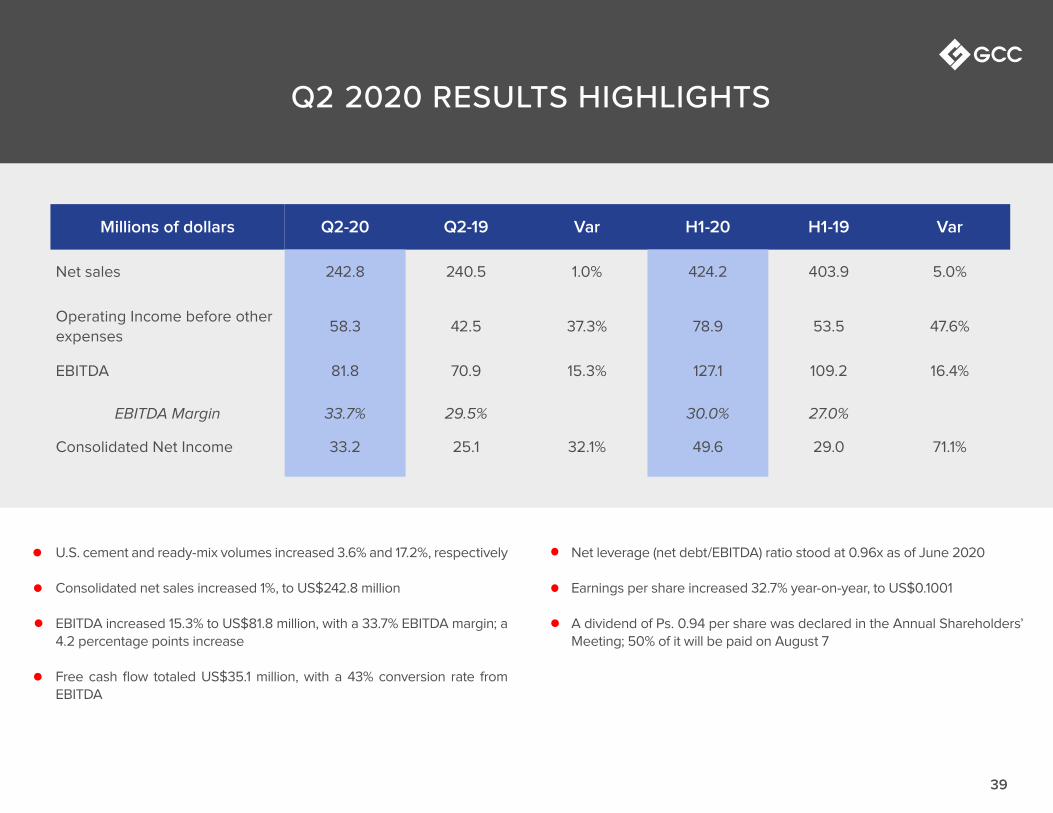
Q2 2020 RESULTS HIGHLIGHTS
Millions of dollars Q2-20 Q2-19 Var H1-20 H1-19 Var
Net sales 242.8 240.5 1.0% 424.2 403.9 5.0%
Operating Income before other expenses
58.3 42.5 37.3% 78.9 53.5 47.6%
EBITDA 81.8 70.9 15.3% 127.1 109.2 16.4%
EBITDA Margin 33.7% 29.5% 30.0% 27.0%
Consolidated Net Income 33.2 25.1 32.1% 49.6 29.0 71.1%
U.S. cement and ready-mix volumes increased 3.6% and 17.2%, respectively Consolidated net sales increased 1%, to US$242.8 million
EBITDA increased 15.3% to US$81.8 million, with a 33.7% EBITDA margin; a 4.2 percentage points increase
Free cash flow totaled US$35.1 million, with a 43% conversion rate from EBITDA
Net leverage (net debt/EBITDA) ratio stood at 0.96x as of June 2020
Earnings per share increased 32.7% year-on-year, to US$0.1001
A dividend of Ps. 0.94 per share was declared in the Annual Shareholders’ Meeting; 50% of it will be paid on August 7
40
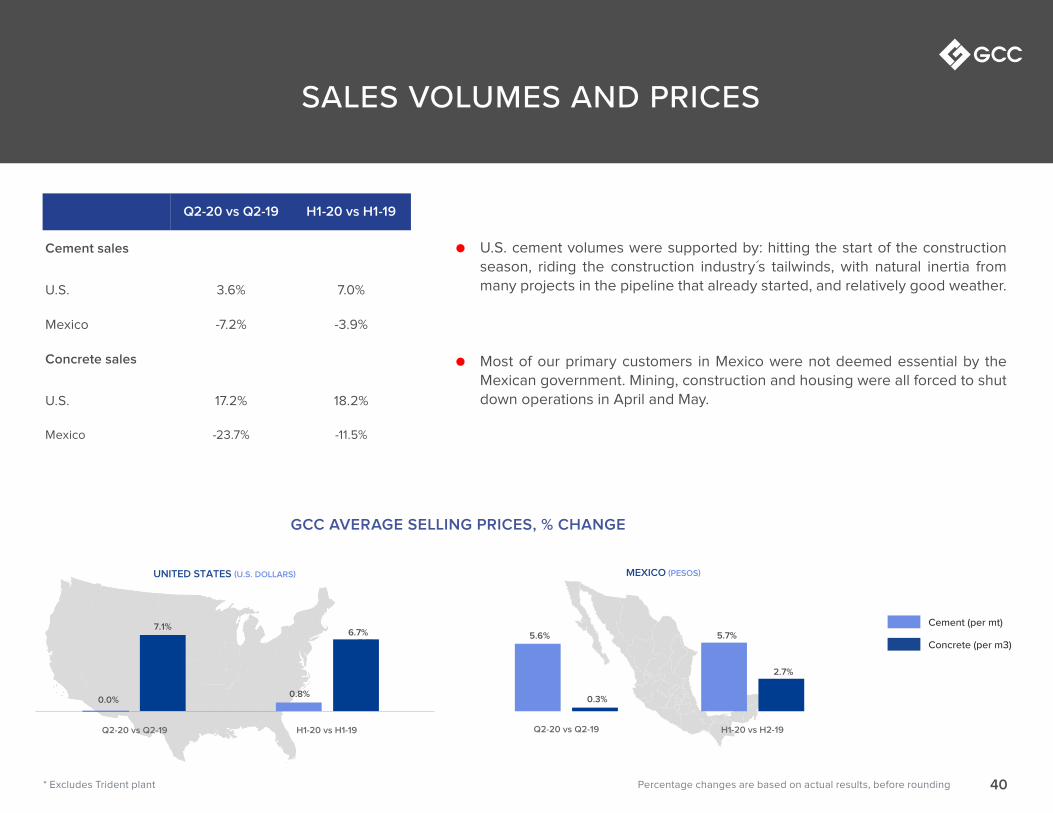
SALES VOLUMES AND PRICES
Q2-20 vs Q2-19 H1-20 vs H1-19
Cement sales
U.S. 3.6% 7.0%
Mexico -7.2% -3.9%
Concrete sales
U.S. 17.2% 18.2%
Mexico -23.7% -11.5%
U.S. cement volumes were supported by: hitting the start of the construction season, riding the construction industry´s tailwinds, with natural inertia from many projects in the pipeline that already started, and relatively good weather.
Most of our primary customers in Mexico were not deemed essential by the Mexican government. Mining, construction and housing were all forced to shut down operations in April and May.
GCC AVERAGE SELLING PRICES, % CHANGE
UNITED STATES (U.S. DOLLARS) MEXICO (PESOS)
0.0%
5.7%
Q2-20 vs Q2-19 H1-20 vs H1-19
5.6%
Cement (per mt)
Concrete (per m3)
7.1%
0.8%
Q2-20 vs Q2-19 H1-20 vs H2-19
0.3%
5.7%
2.7%
6.7%
Percentage changes are based on actual results, before rounding* Excludes Trident plant
41
SALES
U.S SALES MEXICO SALES
Percentage changes are based on actual results, before rounding
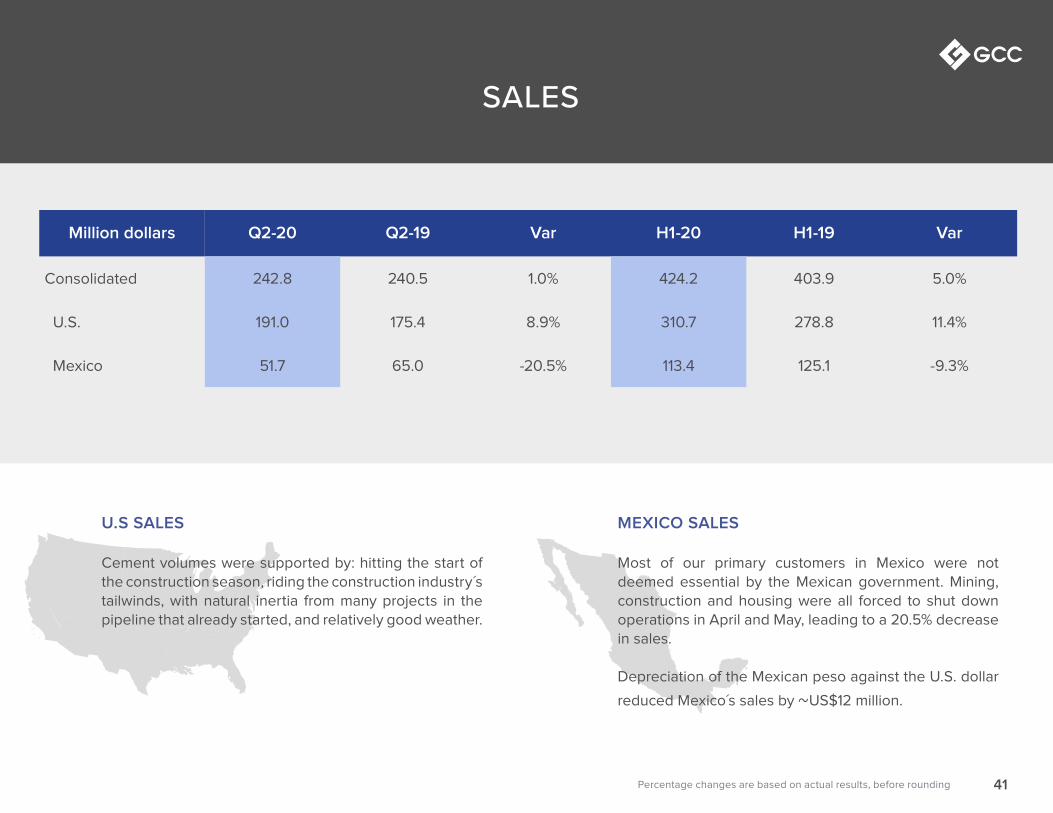
Million dollars Q2-20 Q2-19 Var H1-20 H1-19 Var
Consolidated 242.8 240.5 1.0% 424.2 403.9 5.0%
U.S. 191.0 175.4 8.9% 310.7 278.8 11.4%
Mexico 51.7 65.0 -20.5% 113.4 125.1 -9.3%
Cement volumes were supported by: hitting the start of the construction season, riding the construction industry´s tailwinds, with natural inertia from many projects in the pipeline that already started, and relatively good weather.
Most of our primary customers in Mexico were not deemed essential by the Mexican government. Mining, construction and housing were all forced to shut down operations in April and May, leading to a 20.5% decrease in sales.
Depreciation of the Mexican peso against the U.S. dollar
reduced Mexico´s sales by ~US$12 million.
42
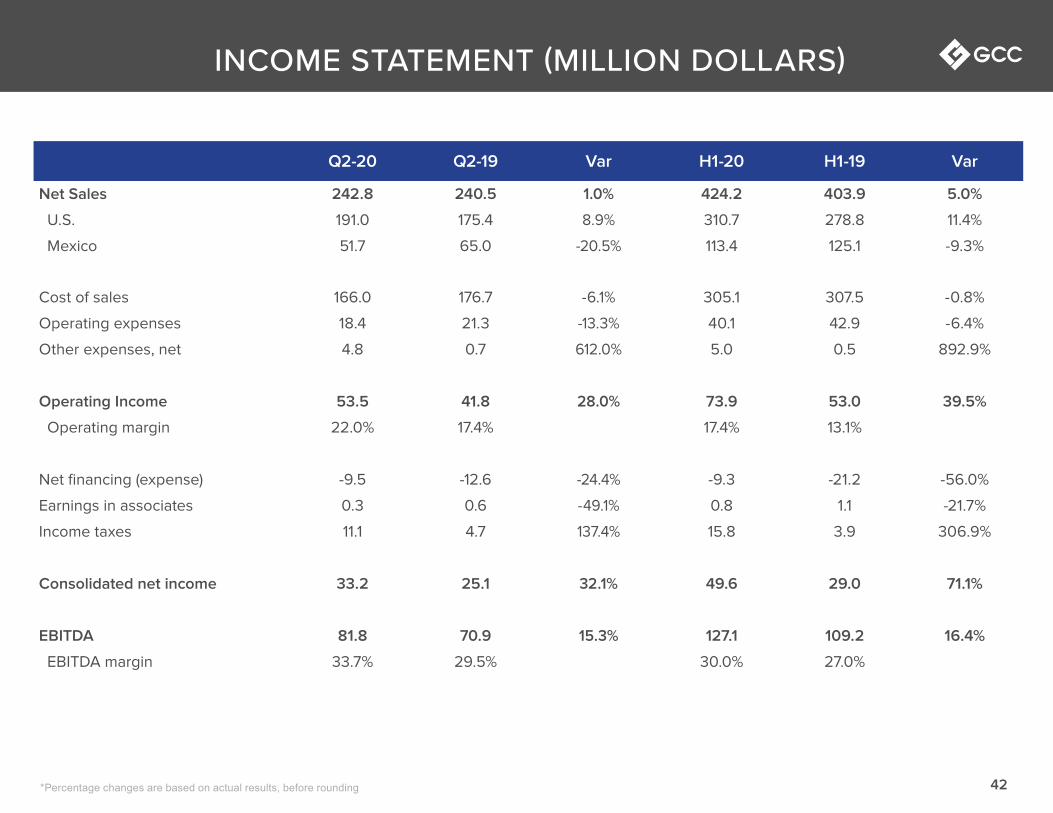
Q2-20 Q2-19 Var H1-20 H1-19 Var
Net Sales 242.8 240.5 1.0% 424.2 403.9 5.0%
U.S. 191.0 175.4 8.9% 310.7 278.8 11.4%
Mexico 51.7 65.0 -20.5% 113.4 125.1 -9.3%
Cost of sales 166.0 176.7 -6.1% 305.1 307.5 -0.8%
Operating expenses 18.4 21.3 -13.3% 40.1 42.9 -6.4%
Other expenses, net 4.8 0.7 612.0% 5.0 0.5 892.9%
Operating Income 53.5 41.8 28.0% 73.9 53.0 39.5%
Operating margin 22.0% 17.4% 17.4% 13.1%
Net financing (expense) -9.5 -12.6 -24.4% -9.3 -21.2 -56.0%
Earnings in associates 0.3 0.6 -49.1% 0.8 1.1 -21.7%
Income taxes 11.1 4.7 137.4% 15.8 3.9 306.9%
Consolidated net income 33.2 25.1 32.1% 49.6 29.0 71.1%
EBITDA 81.8 70.9 15.3% 127.1 109.2 16.4%
EBITDA margin 33.7% 29.5% 30.0% 27.0%
*Percentage changes are based on actual results, before rounding
INCOME STATEMENT (MILLION DOLLARS)
43
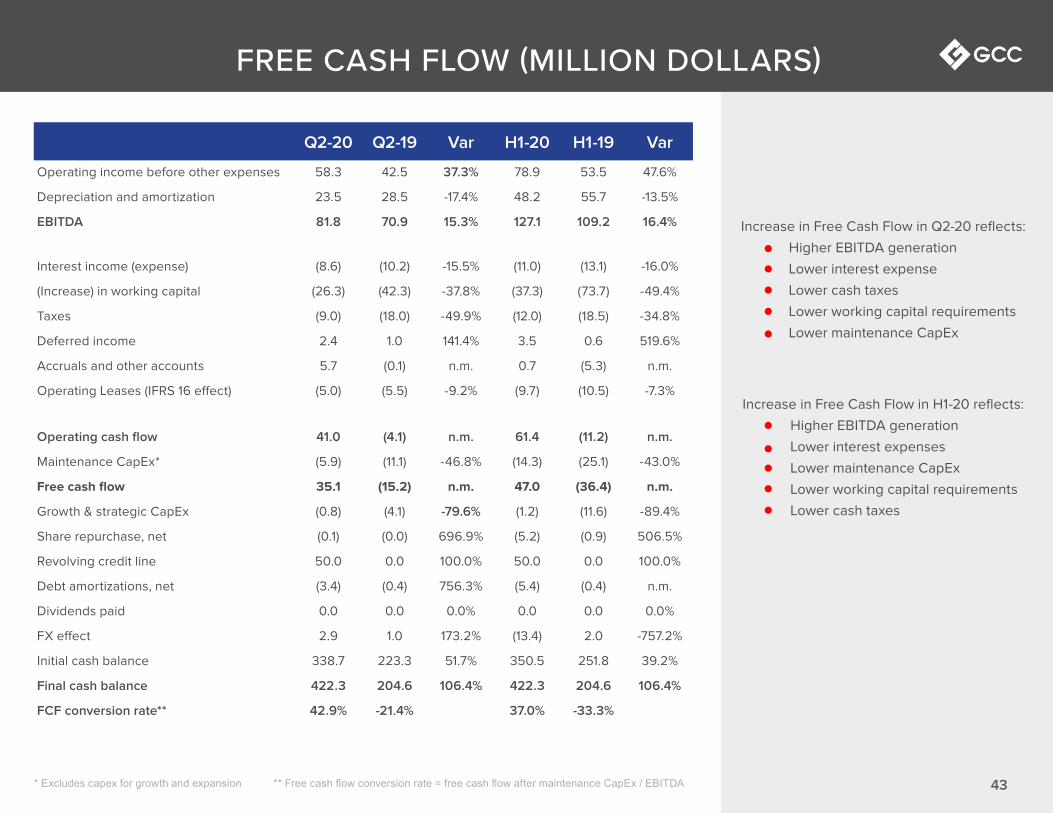
Q2-20 Q2-19 Var H1-20 H1-19 Var
Operating income before other expenses 58.3 42.5 37.3% 78.9 53.5 47.6%
Depreciation and amortization 23.5 28.5 -17.4% 48.2 55.7 -13.5%
EBITDA 81.8 70.9 15.3% 127.1 109.2 16.4%
Interest income (expense) (8.6) (10.2) -15.5% (11.0) (13.1) -16.0%
(Increase) in working capital (26.3) (42.3) -37.8% (37.3) (73.7) -49.4%
Taxes (9.0) (18.0) -49.9% (12.0) (18.5) -34.8%
Deferred income 2.4 1.0 141.4% 3.5 0.6 519.6%
Accruals and other accounts 5.7 (0.1) n.m. 0.7 (5.3) n.m.
Operating Leases (IFRS 16 effect) (5.0) (5.5) -9.2% (9.7) (10.5) -7.3%
Operating cash flow 41.0 (4.1) n.m. 61.4 (11.2) n.m.
Maintenance CapEx* (5.9) (11.1) -46.8% (14.3) (25.1) -43.0%
Free cash flow 35.1 (15.2) n.m. 47.0 (36.4) n.m.
Growth & strategic CapEx (0.8) (4.1) -79.6% (1.2) (11.6) -89.4%
Share repurchase, net (0.1) (0.0) 696.9% (5.2) (0.9) 506.5%
Revolving credit line 50.0 0.0 100.0% 50.0 0.0 100.0%
Debt amortizations, net (3.4) (0.4) 756.3% (5.4) (0.4) n.m.
Dividends paid 0.0 0.0 0.0% 0.0 0.0 0.0%
FX effect 2.9 1.0 173.2% (13.4) 2.0 -757.2%
Initial cash balance 338.7 223.3 51.7% 350.5 251.8 39.2%
Final cash balance 422.3 204.6 106.4% 422.3 204.6 106.4%
FCF conversion rate** 42.9% -21.4% 37.0% -33.3%
* Excludes capex for growth and expansion ** Free cash flow conversion rate = free cash flow after maintenance CapEx / EBITDA
FREE CASH FLOW (MILLION DOLLARS)
Increase in Free Cash Flow in Q2-20 reflects:
Higher EBITDA generation
Lower interest expense
Lower cash taxes
Lower working capital requirements
Lower maintenance CapEx
Increase in Free Cash Flow in H1-20 reflects:
Higher EBITDA generation
Lower interest expenses
Lower maintenance CapEx
Lower working capital requirements
Lower cash taxes
43

4444
Jun-20 Jun-19 Var
Total Assets 2,067.2 1,963.8 5.3%
Current Assets 739.8 540.4 36.9%
Cash 422.3 204.6 106.4%
Other current assets 317.5 335.7 -5.4%
Non-current assets 1,327.4 1,423.4 -6.7%
Plant, property, & equipment 949.4 1,022.4 -7.1%
Goodwill and intangibles 305.6 316.9 -3.6%
Other non-current assets 72.4 84.1 -13.9%
Total Liabilities 1,019.8 973.1 4.8%
Current Liabilities 273.3 185.1 47.7%
Short-term debt 90.0 9.4 854.9%
Other current liabilities 183.3 175.7 4.4%
Long-term liabilities 746.4 788.0 -5.3%
Long-term debt 606.7 642.5 -5.6%
Other long-term liabilities 84.3 98.7 -14.6%
Deferred taxes 55.4 46.8 18.4%
Total equity 1,047.4 990.6 5.7%
* Excludes capex for growth and expansion
BALANCE SHEET (MILLION DOLLARS)
Net leverage (net debt/EBITDA) ratio stood
at 0.96x as of June 2020
A dividend of Ps. 0.94 per share was
declared in the Annual Shareholders’
Meeting; 50% of it was paid on August 7
45
WWW.GCC.COM
CONTACT:
Luis Carlos Arias, Chief Financial Officer
Ricardo Martinez, Head of Investor Relations
+52 (614) 442 3176
+ 1 (303) 739 5943