q2 - mb.cision.com · planning processes and discussions with municipalities have also continued...
TRANSCRIPT
CREATING THE RIGHT CONDITIONS
Q2 2020
Summary, SEKm
January–June 2020¹
• Rental income fell to SEK 1,407m (1,449). The fall was primarily due to property sales. In the second quarter, rental income declined by SEK 18m as a result of rebates granted due to the Covid-19 pan-demic. In an identical portfolio, income rose by approximately 4 per cent (19).
• Net operating income declined to SEK 1,046m (1,063). In an identi-cal portfolio, net operating income rose by approximately 6 per cent (20).
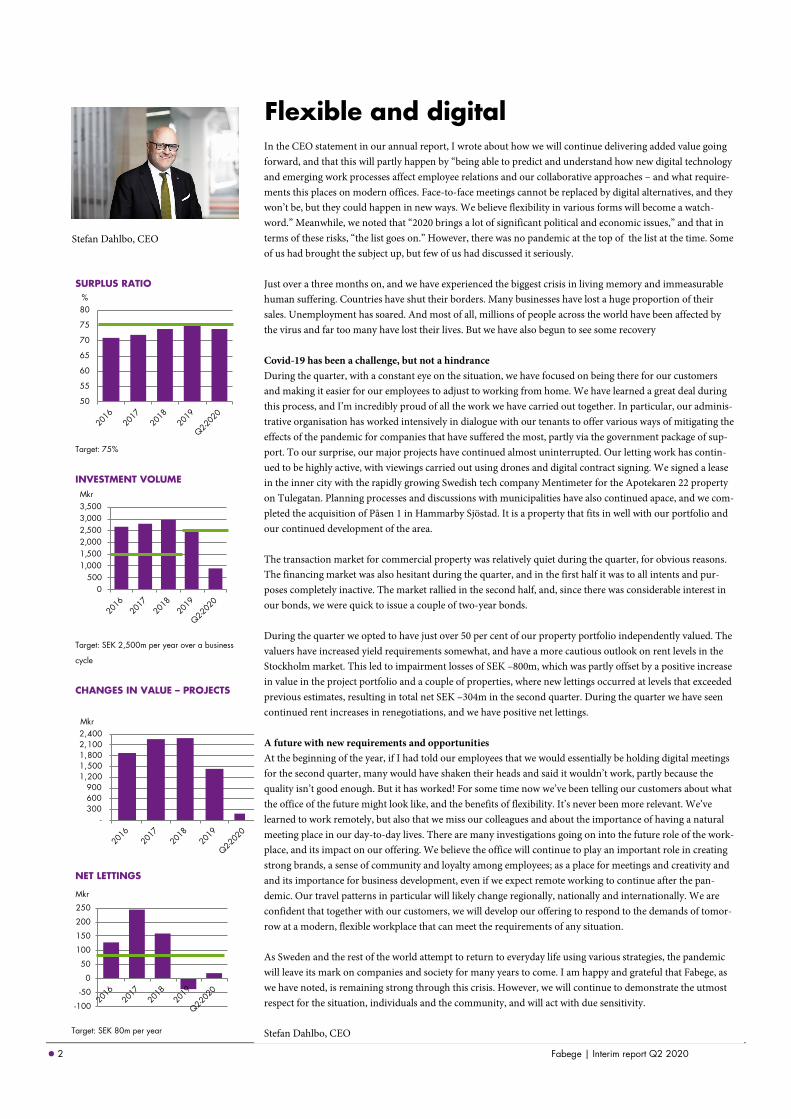
• The surplus ratio was 74 per cent (73).
• Profit from property management declined to SEK 728m (741).
• Realised and unrealised changes in value amounted to SEK 1,550m (3,122) in properties and SEK −292m (−503) in fixed-income deriva-tives.
• Profit before tax for the period amounted to SEK 1,985m (3,358).
• Profit after tax for the period amounted to SEK 1,559m (2,790), corresponding to SEK 4.73 per share (8.44).
• Net lettings totalled SEK 20m (−87).
• Rent levels in renegotiated leases increased by an aver-age of 16 per cent (20).
• The equity/assets ratio was 53 per cent (52) and the loan-to-value ratio was 34 per cent (36).
¹ The comparison figures for income and expense items relate to values for the
January–June 2019 period and for balance sheet items at 31 December 2019.
2020 2019 2020 2019Apr-Jun Apr-Jun Jan-Jun Jan-Jun
Rental income 696 731 1,407 1,449
Net operating income 526 554 1,046 1,063
Profit from property management 359 375 728 741
Profit before tax 6 1,909 1,985 3,358
Profit after tax -15 1,642 1,559 2,790
Net lettings 5 20 20 -87
Surplus ratio,% 76 76 74 73
Loan-to-value ratio, properties, % - - 34 38
EPRA NRV, SEK per share - - 150 134
2 Fabege | Interim report Q2 2020
Flexible and digital
7
SURPLUS RATIO
Target: 75% INVESTMENT VOLUME
Target: SEK 2,500m per year over a business
cycle
CHANGES IN VALUE – PROJECTS
NET LETTINGS
50
55
60
65
70
75
80%
0500
1,0001,5002,0002,5003,0003,500Mkr
- 300 600 900
1,200 1,500 1,800 2,100 2,400Mkr
Target: SEK 80m per year
In the CEO statement in our annual report, I wrote about how we will continue delivering added value going forward, and that this will partly happen by “being able to predict and understand how new digital technology and emerging work processes affect employee relations and our collaborative approaches – and what require-ments this places on modern offices. Face-to-face meetings cannot be replaced by digital alternatives, and they won’t be, but they could happen in new ways. We believe flexibility in various forms will become a watch-word.” Meanwhile, we noted that “2020 brings a lot of significant political and economic issues,” and that in terms of these risks, “the list goes on.” However, there was no pandemic at the top of the list at the time. Some of us had brought the subject up, but few of us had discussed it seriously. Just over a three months on, and we have experienced the biggest crisis in living memory and immeasurable human suffering. Countries have shut their borders. Many businesses have lost a huge proportion of their sales. Unemployment has soared. And most of all, millions of people across the world have been affected by the virus and far too many have lost their lives. But we have also begun to see some recovery Covid-19 has been a challenge, but not a hindrance During the quarter, with a constant eye on the situation, we have focused on being there for our customers and making it easier for our employees to adjust to working from home. We have learned a great deal during this process, and I’m incredibly proud of all the work we have carried out together. In particular, our adminis-trative organisation has worked intensively in dialogue with our tenants to offer various ways of mitigating the effects of the pandemic for companies that have suffered the most, partly via the government package of sup-port. To our surprise, our major projects have continued almost uninterrupted. Our letting work has contin-ued to be highly active, with viewings carried out using drones and digital contract signing. We signed a lease in the inner city with the rapidly growing Swedish tech company Mentimeter for the Apotekaren 22 property on Tulegatan. Planning processes and discussions with municipalities have also continued apace, and we com-pleted the acquisition of Påsen 1 in Hammarby Sjöstad. It is a property that fits in well with our portfolio and our continued development of the area. The transaction market for commercial property was relatively quiet during the quarter, for obvious reasons. The financing market was also hesitant during the quarter, and in the first half it was to all intents and pur-poses completely inactive. The market rallied in the second half, and, since there was considerable interest in our bonds, we were quick to issue a couple of two-year bonds. During the quarter we opted to have just over 50 per cent of our property portfolio independently valued. The valuers have increased yield requirements somewhat, and have a more cautious outlook on rent levels in the Stockholm market. This led to impairment losses of SEK –800m, which was partly offset by a positive increase in value in the project portfolio and a couple of properties, where new lettings occurred at levels that exceeded previous estimates, resulting in total net SEK –304m in the second quarter. During the quarter we have seen continued rent increases in renegotiations, and we have positive net lettings. A future with new requirements and opportunities At the beginning of the year, if I had told our employees that we would essentially be holding digital meetings for the second quarter, many would have shaken their heads and said it wouldn’t work, partly because the quality isn’t good enough. But it has worked! For some time now we’ve been telling our customers about what the office of the future might look like, and the benefits of flexibility. It’s never been more relevant. We’ve learned to work remotely, but also that we miss our colleagues and about the importance of having a natural meeting place in our day-to-day lives. There are many investigations going on into the future role of the work-place, and its impact on our offering. We believe the office will continue to play an important role in creating strong brands, a sense of community and loyalty among employees; as a place for meetings and creativity and and its importance for business development, even if we expect remote working to continue after the pan-demic. Our travel patterns in particular will likely change regionally, nationally and internationally. We are confident that together with our customers, we will develop our offering to respond to the demands of tomor-row at a modern, flexible workplace that can meet the requirements of any situation. As Sweden and the rest of the world attempt to return to everyday life using various strategies, the pandemic will leave its mark on companies and society for many years to come. I am happy and grateful that Fabege, as we have noted, is remaining strong through this crisis. However, we will continue to demonstrate the utmost respect for the situation, individuals and the community, and will act with due sensitivity. Stefan Dahlbo, CEO
Stefan Dahlbo, CEO
-100
-50
0
50
100
150
200
250
Mkr
3 Fabege | Interim report Q2 2020
Impact of Covid-19 on Fabege
Special Covid-19 measures
• Regular status updates for Fabege’s crisis management group and Execu-tive Management Team.
• Regular briefings for all staff. • Support for employees to help them
work from home. • Dialogue and measures for customers
with liquidity problems. • Agreements on monthly payments
and deferrals, as well as the govern-ment rent support package.
• Planning and measures to ensure pro-jects continue to move forward.
Contributing to the com-munity
• During the April to June period, Fa-bege paid for over 15,000 lunches to be delivered to the City Mission and hospitals in Stockholm.
• Helped provide materials for the field hospital in Älvsjö.
• Financial contribution to the City Mission’s work in Stockholm.
Government rent support • The proposed support package would
give companies in vulnerable sectors a 50 per cent reduction in their rent, half to be covered by the landlord and half by the state.
• The support relates to rental payments in the second quarter.
• Fabege has granted rebates relating to rental support totalling SEK 36m, around SEK 18m of which is covered by Fabege.
Property management and rental income The majority of Fabege’s customers are large, stable companies. However, we also have customers in the ser-vice sector who have asked to defer rental payments and for rental rebates due to the pandemic. We are mak-ing arrangements with customers on a case-by-case basis, focusing on transfers to monthly payments and repayment deferrals. We have also granted rebates in accordance with the government rent support package. Rebates granted for Q2 have totalled SEK 36.4m, 50 per cent of which is covered by Fabege. The net amount, i.e. approximately SEK 18.2m, has reduced rental income in Q2. Outstanding rent receivables relating to Q2 amount to SEK 21m excluding VAT, the majority of which relates to granted deferrals to be repaid. We have also granted certain rebates concerning the second half of 2020. These amount to a total of around SEK 10m excluding VAT, and will reduce rental income in the second half of the year.
Financing Both the commercial paper and bond markets have rallied after the capital market effectively closed down in March, and margins have seen a gradual improvement. In the second quarter we issued SEK 1,875m on the commercial paper market and SEK 650m on the bond market, including SEK 150m via SFF. Our good access to unutilised credit facilities provides reassurance. No bank facilities are due to lapse until the fourth quarter of 2021. A total of SEK 860m of bonds via SFF are due to mature in the second half of 2020. If market condi-tions allow, we intend to replace commercial paper and bonds due to mature with new issues, but we are able to refinance remaining maturities during the year using existing credit facilities in banks, if required. During this turbulent time we have seen evidence of Fabege’s strong brand, both with the banks and on the capital market. Our strategy of spreading our financing across several different sources is an even greater strength in the current situation. Projects On the whole, all our projects are proceeding according to plan. Where there is a risk of delays in the deliv-ery of materials, we investigate alternatives. So far we have managed to staff our projects and keep to our schedules by planning ahead. Transactions and valuations It is still difficult to assess the impact of Covid-19 and its effects on the transaction markets. Few transac-tions took place on Fabege’s markets in the second quarter. The property portfolio is valued according to a well-established process. Before the end of the quarter, just over 50 per cent of the portfolio was inde-pendently valued by Newsec and Cushman Wakefield. In these valuations, yield requirements have generally been raised slightly, and expectations regarding rent levels have been revised down. At the same time, this has been partly offset by a certain delay in rent increases and adjusted yield requirements, which has had a positive impact on the values of individual properties. Gross impairment losses in the second quarter of ap-proximately SEK –800m were offset by appreciation of almost SEK 500m, giving a net amount of SEK –304m. Overall, the average yield requirement in the portfolio increased to 3.90 per cent and the total unreal-ised change in value for the entire first half of the year amounted to SEK 1,525m. Employees All employees apart from our technical operations staff are working from home as far as possible. Technical operations have been divided into teams working in shifts, the aim being to reduce the risk of spreading in-fection as much as we can. Meetings and collaboration are largely taking place digitally and we are providing various forms of support to make it easier for employees to work from home. We carried out two surveys during the period, both of which reveal that our employees are coping well and that working from home is effective, but that we miss meeting at the office. We are proud to have dedicated staff who are helping keep the business running. Fabege is stable As for so many other companies, the corona situation is having a negative impact on the business, albeit lim-ited for Fabege. Our strong financial position means we are well placed to cope even in difficult times.
• Our strong balance sheet provides security • We have a stable customer base • We have access to financing through our banks • We have dedicated employees who make a difference
4 Fabege | Interim report Q2 2020
Earnings Jan–Jun 20201 In the second quarter, the effects of Covid-19 began to be noticeable in earnings in the form of rent rebates and reduced property values. Slightly lower earnings from property management and positive changes in value were recognised for the first half of the year.
Revenues and earnings Profit after tax for the period was SEK 1,559m (2,790), corresponding to earnings per share of SEK 4.73 (8.44). Profit before tax for the period amounted to SEK 1,985m (3,358). Earnings from property management fell slightly, and lower changes in value meant that profit before tax declined in comparison with the previous period.
Rental income decreased to SEK 1,407m (1,449), while net operating income fell to SEK 1,046m (1,063). The divestment of Pelaren 1 and Trängkåren 7 meant that rental income fell by approximately SEK 100m against a comparable period. In an identical portfolio, rental income grew by roughly 4 per cent (19), just over half of which related to growth through tenants moving into completed project properties. The remaining in-crease was primarily growth due to new lettings and renegotiated rent levels. Rebates ap-plied according to the government rent support package reduced rental income in the second quarter by SEK 18m. The lower running costs were mainly due to a mild winter with little snow. In addition, as a result of the new tax assessment values, the amount set aside for property tax was too high at the start of 2019. Net operating income in an iden-tical portfolio rose by approximately 6 per cent (20). Overall, the surplus ratio amounted to 74 per cent (73).
Realised changes in value of SEK 25m (0) related mainly to the divestment of a land property in Vallentuna.
Total unrealised changes in value amounted to SEK 1,525m (3,122). The unrealised change in the value of the investment property portfolio of SEK 1,339m (1,965) was mainly attributable to increased rent levels for new lettings and renegotiations and lower yield requirements. However, the average yield requirement increased by 0.1 per cent in the second quarter to 3.90 per cent (3.97 at year-end).
The project portfolio contributed to an unrealised change in value of SEK 186m (1,019), primarily due to development gains in the major project properties.
The share in earnings of associated companies was SEK −29m (−32) and mainly re-lated to a capital contribution to Arenabolaget.
Unrealised changes in value in the derivatives portfolio totalled SEK −292m (−503). The extension of the fixed-rate term and lower long-term interest rates led to an increase in the deficit value during the period. Net interest items amounted to SEK −227m (-233).
Segment reporting The Property Management segment generated net operating income of SEK 1,038m (1,044), representing a surplus ratio of 77 per cent (75). The occupancy rate was 92 per cent (94). Earnings from property management totalled SEK 754m (755). Unrealised changes in the value of properties amounted to SEK 1,339m (1,965).
The Property Development segment generated net operating income of SEK 8m (19), giving a surplus ratio of 14 per cent (36). Earnings from property management to-talled SEK −26m (−14). Unrealised changes in the value of properties amounted to SEK 186m (1,019).
Earnings from transactions totalled SEK 25m (138).
1 The comparison figures for income and expense items relate to values for the January–June 2019 period and for balance sheet items at 31 December 2019.
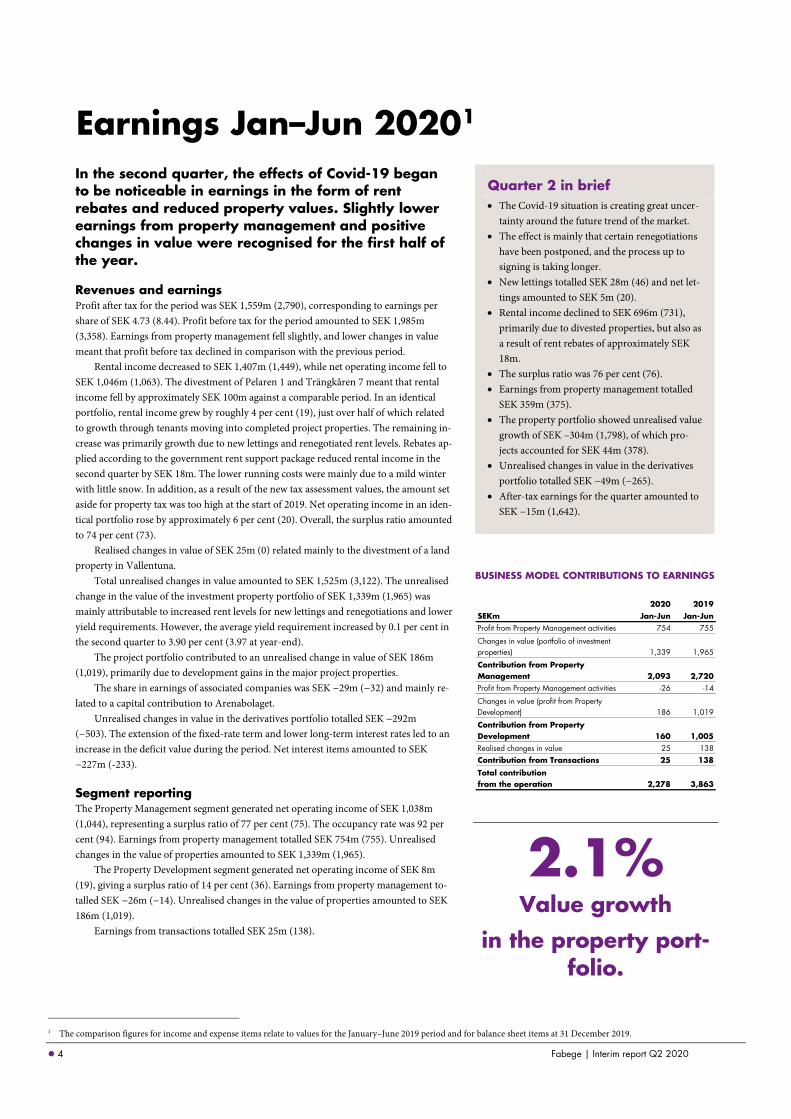
BUSINESS MODEL CONTRIBUTIONS TO EARNINGS
2.1% Value growth
in the property port-folio.
2020 2019SEKm Jan-Jun Jan-JunProfit from Property Management activities 754 755
Changes in value (portfolio of investment properties) 1,339 1,965
Contribution from Property Management 2,093 2,720Profit from Property Management activities -26 -14
Changes in value (profit from Property Development) 186 1,019
Contribution from Property Development 160 1,005Realised changes in value 25 138Contribution from Transactions 25 138
Total contribution from the operation 2,278 3,863
Quarter 2 in brief
• The Covid-19 situation is creating great uncer-tainty around the future trend of the market.
• The effect is mainly that certain renegotiations have been postponed, and the process up to signing is taking longer.
• New lettings totalled SEK 28m (46) and net let-tings amounted to SEK 5m (20).
• Rental income declined to SEK 696m (731), primarily due to divested properties, but also as a result of rent rebates of approximately SEK 18m.
• The surplus ratio was 76 per cent (76). • Earnings from property management totalled
SEK 359m (375). • The property portfolio showed unrealised value
growth of SEK –304m (1,798), of which pro-jects accounted for SEK 44m (378).
• Unrealised changes in value in the derivatives portfolio totalled SEK −49m (−265).
• After-tax earnings for the quarter amounted to SEK −15m (1,642).
5 Fabege | Interim report Q2 2020
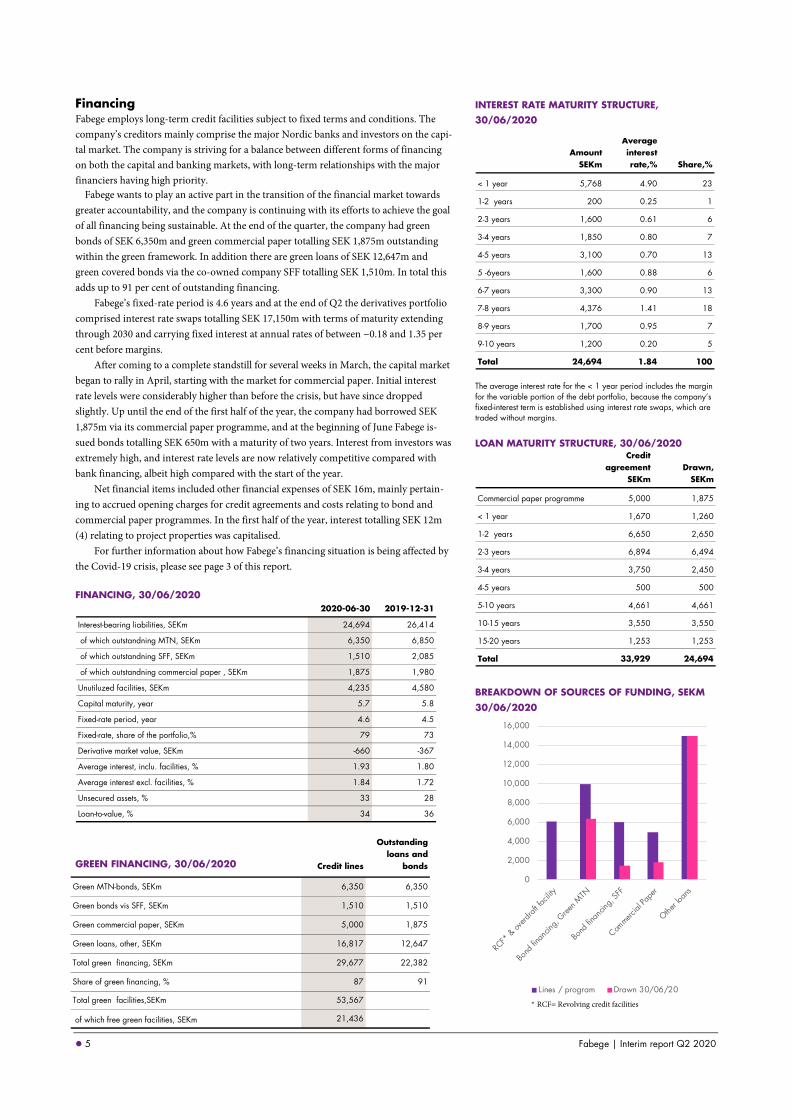
Financing Fabege employs long-term credit facilities subject to fixed terms and conditions. The company’s creditors mainly comprise the major Nordic banks and investors on the capi-tal market. The company is striving for a balance between different forms of financing on both the capital and banking markets, with long-term relationships with the major financiers having high priority.
Fabege wants to play an active part in the transition of the financial market towards greater accountability, and the company is continuing with its efforts to achieve the goal of all financing being sustainable. At the end of the quarter, the company had green bonds of SEK 6,350m and green commercial paper totalling SEK 1,875m outstanding within the green framework. In addition there are green loans of SEK 12,647m and green covered bonds via the co-owned company SFF totalling SEK 1,510m. In total this adds up to 91 per cent of outstanding financing. Fabege’s fixed-rate period is 4.6 years and at the end of Q2 the derivatives portfolio comprised interest rate swaps totalling SEK 17,150m with terms of maturity extending through 2030 and carrying fixed interest at annual rates of between −0.18 and 1.35 per cent before margins. After coming to a complete standstill for several weeks in March, the capital market began to rally in April, starting with the market for commercial paper. Initial interest rate levels were considerably higher than before the crisis, but have since dropped slightly. Up until the end of the first half of the year, the company had borrowed SEK 1,875m via its commercial paper programme, and at the beginning of June Fabege is-sued bonds totalling SEK 650m with a maturity of two years. Interest from investors was extremely high, and interest rate levels are now relatively competitive compared with bank financing, albeit high compared with the start of the year. Net financial items included other financial expenses of SEK 16m, mainly pertain-ing to accrued opening charges for credit agreements and costs relating to bond and commercial paper programmes. In the first half of the year, interest totalling SEK 12m (4) relating to project properties was capitalised. For further information about how Fabege’s financing situation is being affected by the Covid-19 crisis, please see page 3 of this report.
FINANCING, 30/06/2020
GREEN FINANCING, 30/06/2020
INTEREST RATE MATURITY STRUCTURE,
30/06/2020
The average interest rate for the < 1 year period includes the margin for the variable portion of the debt portfolio, because the company’s fixed-interest term is established using interest rate swaps, which are traded without margins.
LOAN MATURITY STRUCTURE, 30/06/2020
BREAKDOWN OF SOURCES OF FUNDING, SEKM
30/06/2020
2020-06-30 2019-12-31
Interest-bearing liabilities, SEKm 24,694 26,414
of which outstandning MTN, SEKm 6,350 6,850
of which outstandning SFF, SEKm 1,510 2,085
of which outstandning commercial paper , SEKm 1,875 1,980
Unutiluzed facilities, SEKm 4,235 4,580
Capital maturity, year 5.7 5.8
Fixed-rate period, year 4.6 4.5
Fixed-rate, share of the portfolio,% 79 73
Derivative market value, SEKm -660 -367
Average interest, inclu. facilities, % 1.93 1.80
Average interest excl. facilities, % 1.84 1.72
Unsecured assets, % 33 28
Loan-to-value, % 34 36
Amount SEKm
Average interest rate,% Share,%
< 1 year 5,768 4.90 23
1-2 years 200 0.25 1
2-3 years 1,600 0.61 6
3-4 years 1,850 0.80 7
4-5 years 3,100 0.70 13
5 -6years 1,600 0.88 6
6-7 years 3,300 0.90 13
7-8 years 4,376 1.41 18
8-9 years 1,700 0.95 7
9-10 years 1,200 0.20 5
Total 24,694 1.84 100
Credit agreement
SEKmDrawn,
SEKm
Commercial paper programme 5,000 1,875
< 1 year 1,670 1,260
1-2 years 6,650 2,650
2-3 years 6,894 6,494
3-4 years 3,750 2,450
4-5 years 500 500
5-10 years 4,661 4,661
10-15 years 3,550 3,550
15-20 years 1,253 1,253
Total 33,929 24,694
0
2,000
4,000
6,000
8,000
10,000
12,000
14,000
16,000
Lines / program Drawn 30/06/20
* RCF= Revolving credit facilities
Credit lines
Outstanding loans and
bonds
Green MTN-bonds, SEKm 6,350 6,350
Green bonds vis SFF, SEKm 1,510 1,510
Green commercial paper, SEKm 5,000 1,875
Green loans, other, SEKm 16,817 12,647
Total green financing, SEKm 29,677 22,382
Share of green financing, % 87 91
Total green facilities,SEKm 53,567
of which free green facilities, SEKm 21,436

6 Fabege | Interim report Q2 2020
Tax The tax expense for the period amounted to SEK −426m (-568). Current tax of SEK 25m related mainly to the reversal of current tax after retesting of prior years’ tax assess-ments. Tax was calculated at a rate of 21.4 per cent on taxable earnings. In accordance with the new corporate taxation method, the deferred tax liability has been recalculated at the new tax rate of 20.6 per cent. The valuation of the loss carryforwards that are ex-pected to be utilised in 2020 has been calculated based on the current tax rate for the year of 21.4 per cent.
The new regulations relating to restrictions on interest deductions apply as of 1 Jan-uary 2019. Fabege is of the opinion that the new rules will not have any material impact on tax paid. For 2020, the new rules mean increased utilisation of tax loss carryforwards of just over SEK 300m. This will incur a greater cost of SEK 64m for the 2020 full year, which is reflected in the tax calculation for the period.
Financial position and net asset value Shareholders’ equity amounted to SEK 40,278m (40,068) at the end of the period and the equity/assets ratio was 53 per cent (52). Equity per share attributable to Parent Com-pany shareholders totalled SEK 123 (121). EPRA NRV was SEK 150 per share (145).
Cash flow Cash flow from operating activities before changes in working capital amounted to SEK 756m (751). Changes in working capital had an impact on cash flow of SEK −64m (176). Investing activities had an impact of SEK 2,110m (−1,328) on cash flow, while cash flow from financing activities was affected in the amount of SEK −2,544m (401). In investing activities, cash flow was driven by property transactions and projects. Cash and cash equivalents changed by a total of SEK 258m (0) during the period.
SEK 150/share
EPRA NRV 30 June 2020
Financial targets Fabege’s Board of Directors has adopted the fol-lowing financial targets for the business.
• Loan-to-value ratio of max. 50 per cent. • Interest coverage ratio of at least 2.2. • Debt ratio of max. 13.0. • Equity/assets ratio of min. 35 per cent.
Operational targets
• Investment volume of approximately SEK 2,500m per year.
• Net lettings at least SEK 80m per year. • Surplus ratio 75 per cent.
ACQUISITION OF THE PÅSEN 1 PROPERTY IN HAMMARBY SJÖSTAD The building is very close to Fabege’s properties along Hammarby Fabriksväg and nextdoor to the Trikåfabriken 9 property. It has a lettable area of around 10,000 sqm, 8,270 sqm of which is office space and the remainder is storage, with an additional area for parking spaces. The acquisition is taking place via companies with an underlying property value of SEK 441 million before deductions for deferred tax. Transfer of ownership is scheduled for the second quarter of 2020.
“This acquisition represents one more piece of the puzzle in realising our vision for the area and consolidating our position as a local urban developer in Hammarby Sjöstad,” commented Stefan Dahlbo, Fabege’s CEO.

7 Fabege | Interim report Q2 2020
Operations Jan–June 20201 Two properties were acquired in the second quarter. Projects progressed as planned without any significant disruptions. Net lettings in the first half of the year totalled SEK 20m. Renegotiations declined in volume as result of the pandemic, but made a positive contribution to the rental value.
Property portfolio and property management Fabege’s property management and urban and property development activities are con-centrated on a few selected submarkets in and around Stockholm: Stockholm inner city, Solna, Hammarby Sjöstad and Flemingsberg. On 30 June 2020, Fabege owned 88 prop-erties with a total rental value of SEK 3.2bn, lettable floor space of 1.2m sqm and a carry-ing amount of SEK 73.6bn, of which development and project properties accounted for SEK 8.6bn. The financial occupancy rate for the entire portfolio, including project prop-erties, dropped to 92 per cent (94). The decline is attributable to the vacation of the Glädjen 13 property in Västra Kungsholmen, which was announced some time ago. The effect of bankruptcies resulting from Covid-19 was negligible. The occupancy rate in the investment property portfolio was 92 per cent (95).
During the period, 51 new leases were signed at a total rental value of SEK 93m (82), and 92 per cent of the space pertained to green leases. Lease terminations amounted to SEK 73m (169). Net lettings totalled SEK 20m (−87). Leases totalling SEK 67m were renegotiated, with an average rise in rental value of 16 per cent. However, the volume of renegotiations has declined due to several negotiations being postponed be-cause of the pandemic. The retention rate during the period was 73 per cent (66).
Changes in the property portfolio During the first quarter, a land property in Vallentuna was sold for a purchase price of SEK 58m, with a realised change in value of SEK 25m (0).
Fabege and Peab are joint investors in a co-owned garage property in Råsunda, Solna. The property is being accounted for using proportionate consolidation and was included in Fabege’s accounts at the end of H1 with a property value of SEK 35m. Two properties were acquired in the second quarter; Påsen 1 in Hammarby Sjöstad and a land property in Arenastaden for a purchase price totalling SEK 440m.
Changes in value of properties The property portfolio is valued according to a well-established process. The entire property portfolio is independently valued at least once annually. Just over 50 per cent of the portfolio was independently valued in the second quarter, while the remaining properties were internally valued based on the most recent independent valuations. The total market value at the end of the period was SEK 73.6bn (74.3).
Unrealised changes in value totalled SEK 1,525m (3,122). During the second quar-ter the average yield requirement increased by 0.1 per cent from 3.89 per cent on 31 March to 3.90 per cent at June 30 (3.97 at year-end). The valuations in the second quar-ter were based on slightly higher yield requirements and a more cautious outlook re-garding rent levels on the Stockholm market. For the second quarter alone, changes in value totalled SEK −304m and the average yield requirement increased by 0.1 per cent. Impairment losses of approximately SEK −800m were offset by appreciation of almost SEK 500m, giving a net amount of SEK −304m. The change in the value of the investment property portfolio amounted to SEK 1,339m (1,965). The project portfolio contributed to an unrealised change in value of SEK 186m (1,019). The change in value of the project portfolio was mainly due to development gains in major project properties.
1 The comparison figures for income and expense items relate to values for the January–June 2019 period and for balance sheet items at 31 December 2019.
BREAKDOWN OF MARKET VALUE
30/06/ 2020
Project properties SEK 2.7bn
Stockholm inner city 0%Solna 92%Hammarby Sjöstad 6%Other markets 2%
Development properties SEK 2,2bn
Stockholm inner city 26%Solna 63%Hammarby Sjöstad 0%Other markets 11%
Managment properties SEK 65.0bn
Stockholm inner city 26%Solna 63%Hammarby Sjöstad 0%Other markets 11%
All properties SEK 73.6bn
Stockholm inner city 39%Solna 50%Hammarby Sjöstad 10%Other markets 1%
8 Fabege | Interim report Q2 2020
Environmental certification of properties Fabege’s objective is for the company’s entire property portfolio to be certified to BREEAM-SE/BREEAM In-Use standard. Fabege’s new builds are certified in accord-ance with BREEAM-SE, and our aim is to achieve the level of ‘Excellent’. Of Fabege’s 88 properties, 56 were certified by the end of the period. Overall, this represents 81 per cent (83) of the total combined area of Fabege’s existing portfolio. The properties that have not yet begun certification relate to land and development property for future project development. In the current year, work is underway on upgrading several certifications in the ex-isting portfolio. In the second quarter, Fortet 2 was awarded BREEAM In-Use certifica-tion, ‘Excellent’.
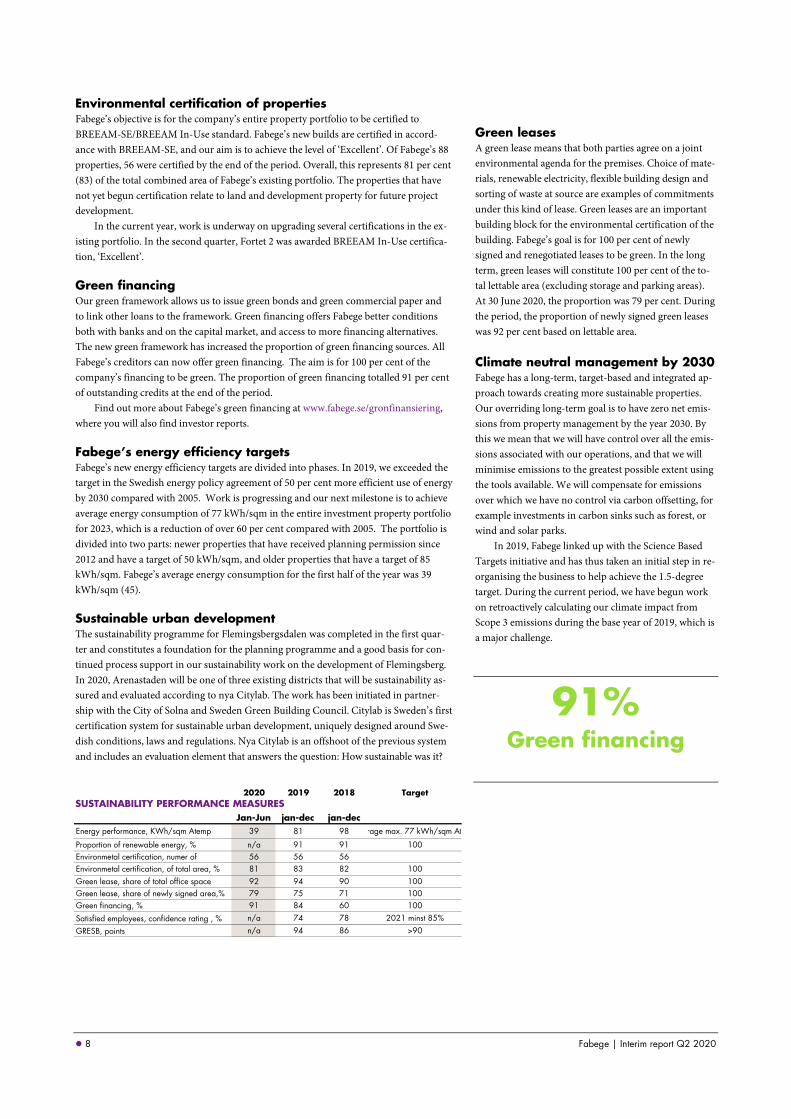
Green financing Our green framework allows us to issue green bonds and green commercial paper and to link other loans to the framework. Green financing offers Fabege better conditions both with banks and on the capital market, and access to more financing alternatives. The new green framework has increased the proportion of green financing sources. All Fabege’s creditors can now offer green financing. The aim is for 100 per cent of the company’s financing to be green. The proportion of green financing totalled 91 per cent of outstanding credits at the end of the period. Find out more about Fabege’s green financing at www.fabege.se/gronfinansiering, where you will also find investor reports.
Fabege’s energy efficiency targets Fabege’s new energy efficiency targets are divided into phases. In 2019, we exceeded the target in the Swedish energy policy agreement of 50 per cent more efficient use of energy by 2030 compared with 2005. Work is progressing and our next milestone is to achieve average energy consumption of 77 kWh/sqm in the entire investment property portfolio for 2023, which is a reduction of over 60 per cent compared with 2005. The portfolio is divided into two parts: newer properties that have received planning permission since 2012 and have a target of 50 kWh/sqm, and older properties that have a target of 85 kWh/sqm. Fabege’s average energy consumption for the first half of the year was 39 kWh/sqm (45).
Sustainable urban development The sustainability programme for Flemingsbergsdalen was completed in the first quar-ter and constitutes a foundation for the planning programme and a good basis for con-tinued process support in our sustainability work on the development of Flemingsberg. In 2020, Arenastaden will be one of three existing districts that will be sustainability as-sured and evaluated according to nya Citylab. The work has been initiated in partner-ship with the City of Solna and Sweden Green Building Council. Citylab is Sweden’s first certification system for sustainable urban development, uniquely designed around Swe-dish conditions, laws and regulations. Nya Citylab is an offshoot of the previous system and includes an evaluation element that answers the question: How sustainable was it? SUSTAINABILITY PERFORMANCE MEASURES
Green leases A green lease means that both parties agree on a joint environmental agenda for the premises. Choice of mate-rials, renewable electricity, flexible building design and sorting of waste at source are examples of commitments under this kind of lease. Green leases are an important building block for the environmental certification of the building. Fabege’s goal is for 100 per cent of newly signed and renegotiated leases to be green. In the long term, green leases will constitute 100 per cent of the to-tal lettable area (excluding storage and parking areas). At 30 June 2020, the proportion was 79 per cent. During the period, the proportion of newly signed green leases was 92 per cent based on lettable area. Climate neutral management by 2030 Fabege has a long-term, target-based and integrated ap-proach towards creating more sustainable properties. Our overriding long-term goal is to have zero net emis-sions from property management by the year 2030. By this we mean that we will have control over all the emis-sions associated with our operations, and that we will minimise emissions to the greatest possible extent using the tools available. We will compensate for emissions over which we have no control via carbon offsetting, for example investments in carbon sinks such as forest, or wind and solar parks. In 2019, Fabege linked up with the Science Based Targets initiative and has thus taken an initial step in re-organising the business to help achieve the 1.5-degree target. During the current period, we have begun work on retroactively calculating our climate impact from Scope 3 emissions during the base year of 2019, which is a major challenge.
91% Green financing
2020 2019 2018 Target
Jan-Jun jan-dec jan-decEnergy performance, KWh/sqm Atemp 39 81 98 rage max. 77 kWh/sqm At
Proportion of renewable energy, % n/a 91 91 100Environmetal certification, numer of 56 56 56Environmetal certification, of total area, % 81 83 82 100Green lease, share of total office space 92 94 90 100Green lease, share of newly signed area,% 79 75 71 100Green financing, % 91 84 60 100
Satisfied employees, confidence rating , % n/a 74 78 2021 minst 85%
GRESB, points n/a 94 86 >90
9 Fabege | Interim report Q2 2020
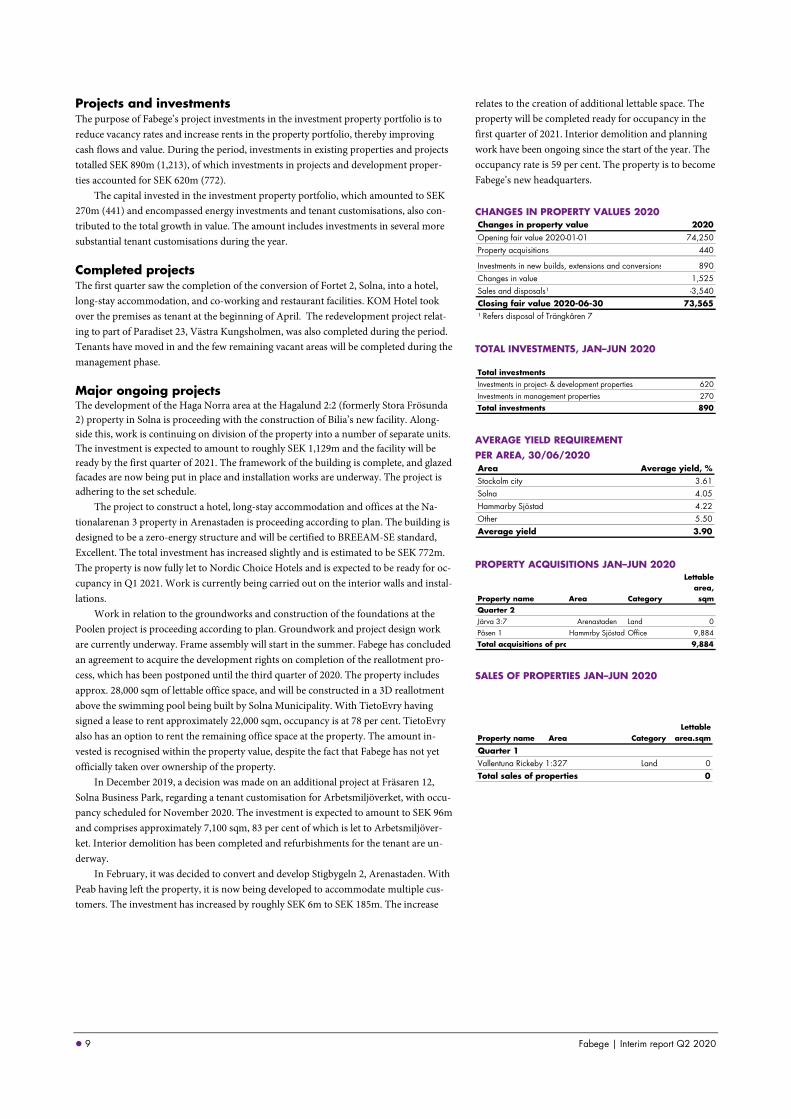
Projects and investments The purpose of Fabege’s project investments in the investment property portfolio is to reduce vacancy rates and increase rents in the property portfolio, thereby improving cash flows and value. During the period, investments in existing properties and projects totalled SEK 890m (1,213), of which investments in projects and development proper-ties accounted for SEK 620m (772).
The capital invested in the investment property portfolio, which amounted to SEK 270m (441) and encompassed energy investments and tenant customisations, also con-tributed to the total growth in value. The amount includes investments in several more substantial tenant customisations during the year.
Completed projects The first quarter saw the completion of the conversion of Fortet 2, Solna, into a hotel, long-stay accommodation, and co-working and restaurant facilities. KOM Hotel took over the premises as tenant at the beginning of April. The redevelopment project relat-ing to part of Paradiset 23, Västra Kungsholmen, was also completed during the period. Tenants have moved in and the few remaining vacant areas will be completed during the management phase.
Major ongoing projects The development of the Haga Norra area at the Hagalund 2:2 (formerly Stora Frösunda 2) property in Solna is proceeding with the construction of Bilia’s new facility. Along-side this, work is continuing on division of the property into a number of separate units. The investment is expected to amount to roughly SEK 1,129m and the facility will be ready by the first quarter of 2021. The framework of the building is complete, and glazed facades are now being put in place and installation works are underway. The project is adhering to the set schedule.
The project to construct a hotel, long-stay accommodation and offices at the Na-tionalarenan 3 property in Arenastaden is proceeding according to plan. The building is designed to be a zero-energy structure and will be certified to BREEAM-SE standard, Excellent. The total investment has increased slightly and is estimated to be SEK 772m. The property is now fully let to Nordic Choice Hotels and is expected to be ready for oc-cupancy in Q1 2021. Work is currently being carried out on the interior walls and instal-lations.
Work in relation to the groundworks and construction of the foundations at the Poolen project is proceeding according to plan. Groundwork and project design work are currently underway. Frame assembly will start in the summer. Fabege has concluded an agreement to acquire the development rights on completion of the reallotment pro-cess, which has been postponed until the third quarter of 2020. The property includes approx. 28,000 sqm of lettable office space, and will be constructed in a 3D reallotment above the swimming pool being built by Solna Municipality. With TietoEvry having signed a lease to rent approximately 22,000 sqm, occupancy is at 78 per cent. TietoEvry also has an option to rent the remaining office space at the property. The amount in-vested is recognised within the property value, despite the fact that Fabege has not yet officially taken over ownership of the property.
In December 2019, a decision was made on an additional project at Fräsaren 12, Solna Business Park, regarding a tenant customisation for Arbetsmiljöverket, with occu-pancy scheduled for November 2020. The investment is expected to amount to SEK 96m and comprises approximately 7,100 sqm, 83 per cent of which is let to Arbetsmiljöver-ket. Interior demolition has been completed and refurbishments for the tenant are un-derway.
In February, it was decided to convert and develop Stigbygeln 2, Arenastaden. With Peab having left the property, it is now being developed to accommodate multiple cus-tomers. The investment has increased by roughly SEK 6m to SEK 185m. The increase
relates to the creation of additional lettable space. The property will be completed ready for occupancy in the first quarter of 2021. Interior demolition and planning work have been ongoing since the start of the year. The occupancy rate is 59 per cent. The property is to become Fabege’s new headquarters. CHANGES IN PROPERTY VALUES 2020
TOTAL INVESTMENTS, JAN–JUN 2020
AVERAGE YIELD REQUIREMENT
PER AREA, 30/06/2020
PROPERTY ACQUISITIONS JAN–JUN 2020
SALES OF PROPERTIES JAN–JUN 2020
Changes in property value 2020Opening fair value 2020-01-01 74,250Property acquisitions 440
Investments in new builds, extensions and conversions 890Changes in value 1,525Sales and disposals¹ -3,540Closing fair value 2020-06-30 73,565¹ Refers disposal of Trängkåren 7
Total investmentsInvestments in project- & development properties 620Investments in management properties 270Total investments 890
Area Average yield, %Stockolm city 3.61Solna 4.05Hammarby Sjöstad 4.22Other 5.50Average yield 3.90
Property name Area Category
Lettable area, sqm
Quarter 2Järva 3:7 Arenastaden Land 0Påsen 1 Hammrby Sjöstad Office 9,884Total acquisitions of pro 9,884
Property name Area CategoryLettable
area.sqm
Quarter 1Vallentuna Rickeby 1:327 Land 0Total sales of properties 0

10 Fabege | Interim report Q2 2020
Housing development in joint ventures Fabege and Svenska Hyreshus AB are leading a housing development project in Kista via co-owned Selfoss Invest AB. The total investment is estimated to be SEK 570m excluding purchase of the land. The project comprises 276 apartments. All 69 apartments in stage 1 have been sold and were occupied on 1 April. Stage 2 is expected to be ready for occupancy in autumn 2020. 42 of 77 apartments have been sold, corresponding to a selling rate of 55 percent. Stage 3, compris-ing 130 apartments, is being built with the flexibility to change the leasing form from tenant-owned apartments to rental or company apartments. Completion is planned for the first quarter of 2021. The project is being externally financed with a construction loan.
Development of the Lagern 3 property in Råsunda into tenant-owned apartments is pro-gressing according to schedule. The project is being managed together with the TB Group in a 50/50 per cent co-owned company. The investment has increased and is estimated to total SEK 288m excluding purchase of the land. Meanwhile, the revenue calculation based on actual price of the leased apartments has improved the total calculation. 52 of the project’s 134 apartments have been leased via booking agreements. Conversion to binding pre-agreements will take place after the summer. External work is underway on facades, balconies, windows and doors.
Work is continuing on the development of the housing project in connection with Brabo at the Hagalund 2:2 property (formerly Stora Frösunda 2) in Haga Norra. The project includes 418 apartments that will be produced in a 3D reallotment above the facility that Fabege is building for Bilia at the property. The estimated investment totals approximately SEK 1.1bn. Work on as-sembly of the frame and installations on the roof is largely complete. Alongside this, work is con-tinuing on reallotment of the property. The project is being financed with an owner’s loan and external construction loan.
The current JV projects are not being consolidated, but will be recognised in accordance with the equity method. Income recognition will not occur until the projects are approaching completion.
89% Occupancy rate in
projects
ONGOING PROJECTS > SEK 50M
30/06/2020
DEVELOPMENT RIGHTS
30/06/2020
Area and carrying amount relate to additional development rights space. Development will in some cases require demolition of existing areas, which will impact the project calculation. The volumes are not maximised. Ongoing planning work aims to increase the volume of future development rights. Flemingsberg is not included, as work is underway on the vision and overall plan. The conclusion is that Flemingsberg will bring a substantial volume of development rights at low initial values.
Commercial, sqm Residential, sqmInner city 29,300 Inner city -Solna 266,100 Solna 238,500Hammarby Sjöstad 56,200 Hammarby Sjöstad -Others 81,800 Others -Total 433,400 Total 238,500Legal binding, % 28 Legal binding, % 32Booked value, SEK/sqm 4,700 Booked value, SEK/sqm 7,300
Property listing Property type Area CompletedLettable
area, sqmOccupancy rate,
area, %¹ Rentel value²Booked value,
SEKmEstimated
investment, SEKm
of which, worked up.
SEKm
Fräsaren 12 (part of) Offices Solna Q4-2020 7,100 83% 23 338 96 42Stigbygeln 2 Offices Solna Q1-2021 8,400 59% 30 401 185 28Hagalund 2:2 (part of)³¹ Retail/Office Arenastaden Q1-2021 40,300 100% 51 454 1,129 630Nationalarenan 3 Hotel Arenastaden Q1-2021 19,100 100% 55 768 772 514Poolen Offices Arenastaden Q1-2022 28,000 78% 97 165 1,103 154Total 102,900 89% 256 2,126 3,285 1,368Other land and project properties 840Other development properties 5,960Total projects, land and development properties 8,926¹ Operational occupancy rate 30 June 2020.
³ In leaseable area for the property Hagalund 2:2 (former Stora Frösunda 2) there are approximately 25,400 sqm garage space
² Rental value including additions. The annual rent for the largest projects in progress could increase to SEK 256m (fully let) from SEK 0m in annualised current rent as of 30 June 2020.
11 Fabege | Interim report Q2 2020
PROPERTY PORTFOLIO
30/06/2020
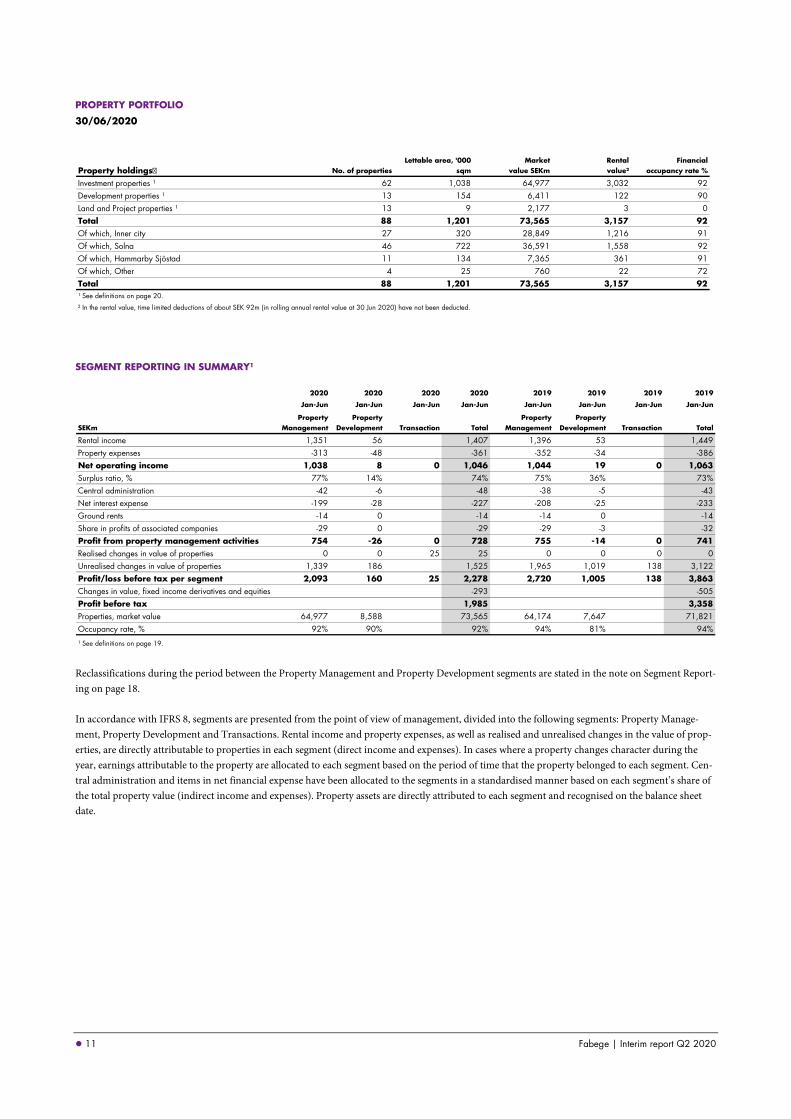
SEGMENT REPORTING IN SUMMARY¹
Reclassifications during the period between the Property Management and Property Development segments are stated in the note on Segment Report-ing on page 18. In accordance with IFRS 8, segments are presented from the point of view of management, divided into the following segments: Property Manage-ment, Property Development and Transactions. Rental income and property expenses, as well as realised and unrealised changes in the value of prop-erties, are directly attributable to properties in each segment (direct income and expenses). In cases where a property changes character during the year, earnings attributable to the property are allocated to each segment based on the period of time that the property belonged to each segment. Cen-tral administration and items in net financial expense have been allocated to the segments in a standardised manner based on each segment’s share of the total property value (indirect income and expenses). Property assets are directly attributed to each segment and recognised on the balance sheet date.
Property holdings No. of propertiesLettable area, '000
sqmMarket
value SEKmRental value²
Financial occupancy rate %
Investment properties ¹ 62 1,038 64,977 3,032 92Development properties ¹ 13 154 6,411 122 90Land and Project properties ¹ 13 9 2,177 3 0Total 88 1,201 73,565 3,157 92Of which, Inner city 27 320 28,849 1,216 91Of which, Solna 46 722 36,591 1,558 92Of which, Hammarby Sjöstad 11 134 7,365 361 91Of which, Other 4 25 760 22 72Total 88 1,201 73,565 3,157 92¹ See definitions on page 20.
² In the rental value, time limited deductions of about SEK 92m (in rolling annual rental value at 30 Jun 2020) have not been deducted.
2020 2020 2020 2020 2019 2019 2019 2019
Jan-Jun Jan-Jun Jan-Jun Jan-Jun Jan-Jun Jan-Jun Jan-Jun Jan-Jun
SEKmProperty
ManagementProperty
Development Transaction TotalProperty
ManagementProperty
Development Transaction Total
Rental income 1,351 56 1,407 1,396 53 1,449Property expenses -313 -48 -361 -352 -34 -386Net operating income 1,038 8 0 1,046 1,044 19 0 1,063Surplus ratio, % 77% 14% 74% 75% 36% 73%Central administration -42 -6 -48 -38 -5 -43Net interest expense -199 -28 -227 -208 -25 -233Ground rents -14 0 -14 -14 0 -14Share in profits of associated companies -29 0 -29 -29 -3 -32Profit from property management activities 754 -26 0 728 755 -14 0 741Realised changes in value of properties 0 0 25 25 0 0 0 0Unrealised changes in value of properties 1,339 186 1,525 1,965 1,019 138 3,122Profit/loss before tax per segment 2,093 160 25 2,278 2,720 1,005 138 3,863Changes in value, fixed income derivatives and equities -293 -505Profit before tax 1,985 3,358Properties, market value 64,977 8,588 73,565 64,174 7,647 71,821Occupancy rate, % 92% 90% 92% 94% 81% 94%
¹ See definitions on page 19.
12 Fabege | Interim report Q2 2020
Other financial information SENSITIVITY ANALYSIS – PROPERTY VALUES
Earnings and key ratios are affected by realised and unrealised changes in the value of properties. The table shows the effect of a 1 percentage point change in value after deferred tax deduction.
SENSITIVITY ANALYSIS – CASH FLOW AND EARNINGS
The sensitivity analysis shows the effects on the Group’s cash flow and earnings on an annualised basis after taking account of the full effect of each parameter.
¹In the short term, interest expenses increase regardless of whether the short-term rate rises or falls. Due to interest rate floors in loan agreements, Fabege is not able to fully utilise negative interest rates, whereby a negative outcome arises even when interest rates are reduced.
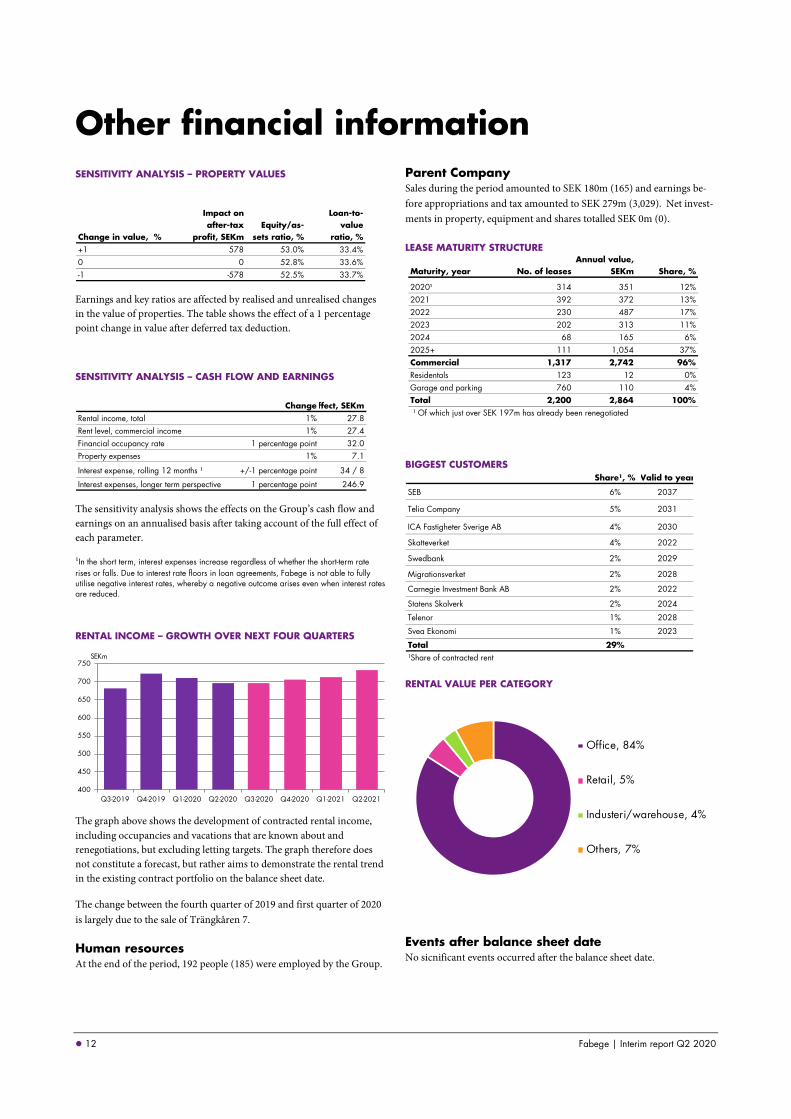
RENTAL INCOME – GROWTH OVER NEXT FOUR QUARTERS
The graph above shows the development of contracted rental income, including occupancies and vacations that are known about and renegotiations, but excluding letting targets. The graph therefore does not constitute a forecast, but rather aims to demonstrate the rental trend in the existing contract portfolio on the balance sheet date.
The change between the fourth quarter of 2019 and first quarter of 2020 is largely due to the sale of Trängkåren 7.
Human resources At the end of the period, 192 people (185) were employed by the Group.
Parent Company Sales during the period amounted to SEK 180m (165) and earnings be-fore appropriations and tax amounted to SEK 279m (3,029). Net invest-ments in property, equipment and shares totalled SEK 0m (0).
LEASE MATURITY STRUCTURE
BIGGEST CUSTOMERS
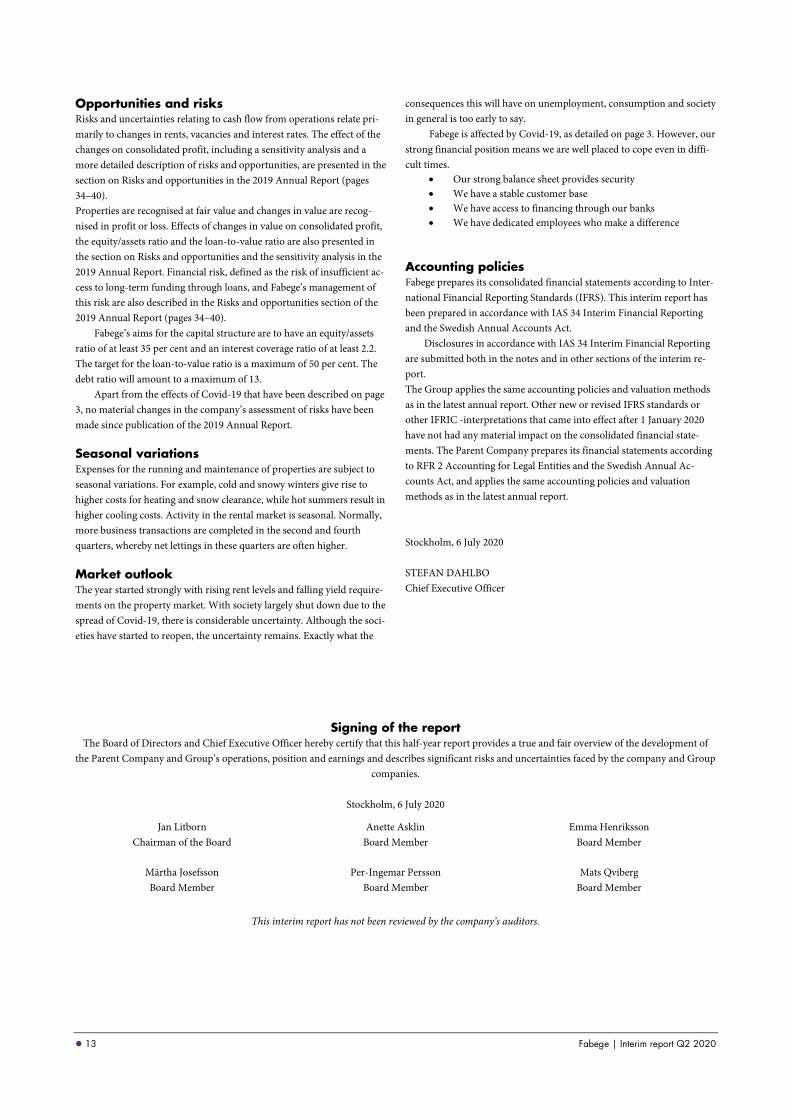
RENTAL VALUE PER CATEGORY
Events after balance sheet date No sicnificant events occurred after the balance sheet date.
Change in value, %
Impact on after-tax
profit, SEKmEquity/as-
sets ratio, %
Loan-to-value
ratio, %+1 578 53.0% 33.4%0 0 52.8% 33.6%-1 -578 52.5% 33.7%
Changeffect, SEKmRental income, total 1% 27.8Rent level, commercial income 1% 27.4Financial occupancy rate 1 percentage point 32.0Property expenses 1% 7.1
Interest expense, rolling 12 months ¹ +/-1 percentage point 34 / 8
Interest expenses, longer term perspective 1 percentage point 246.9
400
450
500
550
600
650
700
750
Q3-2019 Q4-2019 Q1-2020 Q2-2020 Q3-2020 Q4-2020 Q1-2021 Q2-2021
SEKm
Maturity, year No. of leasesAnnual value,
SEKm Share, %
2020¹ 314 351 12%2021 392 372 13%2022 230 487 17%2023 202 313 11%2024 68 165 6%2025+ 111 1,054 37%Commercial 1,317 2,742 96%Residentals 123 12 0%Garage and parking 760 110 4%Total 2,200 2,864 100% ¹ Of which just over SEK 197m has already been renegotiated
Share¹, % Valid to year
SEB 6% 2037
Telia Company 5% 2031
ICA Fastigheter Sverige AB 4% 2030
Skatteverket 4% 2022
Swedbank 2% 2029
Migrationsverket 2% 2028
Carnegie Investment Bank AB 2% 2022
Statens Skolverk 2% 2024
Telenor 1% 2028
Svea Ekonomi 1% 2023
Total 29%¹Share of contracted rent
Office, 84%
Retail, 5%
Industeri/warehouse, 4%
Others, 7%
13 Fabege | Interim report Q2 2020
Opportunities and risks Risks and uncertainties relating to cash flow from operations relate pri-marily to changes in rents, vacancies and interest rates. The effect of the changes on consolidated profit, including a sensitivity analysis and a more detailed description of risks and opportunities, are presented in the section on Risks and opportunities in the 2019 Annual Report (pages 34–40). Properties are recognised at fair value and changes in value are recog-nised in profit or loss. Effects of changes in value on consolidated profit, the equity/assets ratio and the loan-to-value ratio are also presented in the section on Risks and opportunities and the sensitivity analysis in the 2019 Annual Report. Financial risk, defined as the risk of insufficient ac-cess to long-term funding through loans, and Fabege’s management of this risk are also described in the Risks and opportunities section of the 2019 Annual Report (pages 34–40).
Fabege’s aims for the capital structure are to have an equity/assets ratio of at least 35 per cent and an interest coverage ratio of at least 2.2. The target for the loan-to-value ratio is a maximum of 50 per cent. The debt ratio will amount to a maximum of 13.
Apart from the effects of Covid-19 that have been described on page 3, no material changes in the company’s assessment of risks have been made since publication of the 2019 Annual Report.
Seasonal variations Expenses for the running and maintenance of properties are subject to seasonal variations. For example, cold and snowy winters give rise to higher costs for heating and snow clearance, while hot summers result in higher cooling costs. Activity in the rental market is seasonal. Normally, more business transactions are completed in the second and fourth quarters, whereby net lettings in these quarters are often higher.
Market outlook The year started strongly with rising rent levels and falling yield require-ments on the property market. With society largely shut down due to the spread of Covid-19, there is considerable uncertainty. Although the soci-eties have started to reopen, the uncertainty remains. Exactly what the
consequences this will have on unemployment, consumption and society in general is too early to say.
Fabege is affected by Covid-19, as detailed on page 3. However, our strong financial position means we are well placed to cope even in diffi-cult times.
• Our strong balance sheet provides security • We have a stable customer base • We have access to financing through our banks • We have dedicated employees who make a difference
Accounting policies Fabege prepares its consolidated financial statements according to Inter-national Financial Reporting Standards (IFRS). This interim report has been prepared in accordance with IAS 34 Interim Financial Reporting and the Swedish Annual Accounts Act.
Disclosures in accordance with IAS 34 Interim Financial Reporting are submitted both in the notes and in other sections of the interim re-port. The Group applies the same accounting policies and valuation methods as in the latest annual report. Other new or revised IFRS standards or other IFRIC -interpretations that came into effect after 1 January 2020 have not had any material impact on the consolidated financial state-ments. The Parent Company prepares its financial statements according to RFR 2 Accounting for Legal Entities and the Swedish Annual Ac-counts Act, and applies the same accounting policies and valuation methods as in the latest annual report.
Stockholm, 6 July 2020 STEFAN DAHLBO Chief Executive Officer
Signing of the report The Board of Directors and Chief Executive Officer hereby certify that this half-year report provides a true and fair overview of the development of
the Parent Company and Group’s operations, position and earnings and describes significant risks and uncertainties faced by the company and Group companies.
Stockholm, 6 July 2020
Jan Litborn Chairman of the Board
Anette Asklin Board Member
Emma Henriksson Board Member
Märtha Josefsson Board Member
Per-Ingemar Persson Board Member
Mats Qviberg Board Member
This interim report has not been reviewed by the company’s auditors.
14 Fabege | Interim report Q2 2020
Share information Fabege’s shares are listed on Nasdaq TURNOVER AND TRADING* JAN–MAY 2020
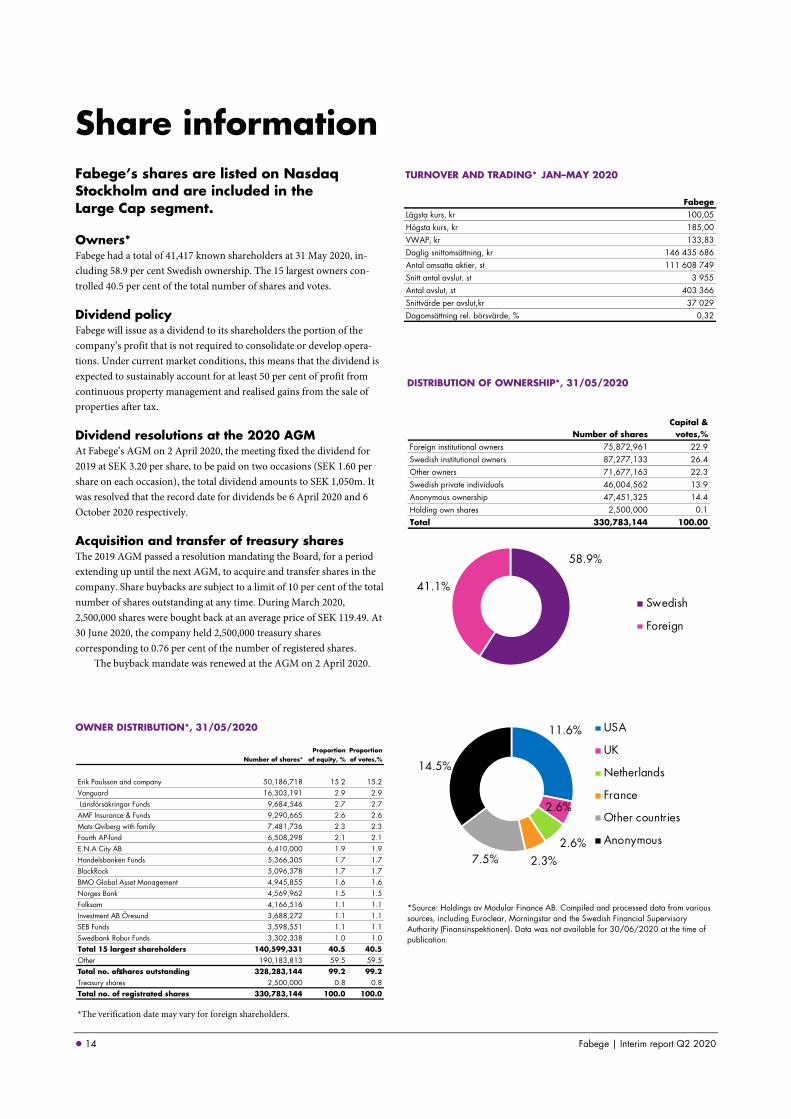
Stockholm and are included in the Large Cap segment. Owners* Fabege had a total of 41,417 known shareholders at 31 May 2020, in-cluding 58.9 per cent Swedish ownership. The 15 largest owners con-trolled 40.5 per cent of the total number of shares and votes.
Dividend policy Fabege will issue as a dividend to its shareholders the portion of the company’s profit that is not required to consolidate or develop opera-tions. Under current market conditions, this means that the dividend is expected to sustainably account for at least 50 per cent of profit from continuous property management and realised gains from the sale of properties after tax.
Dividend resolutions at the 2020 AGM At Fabege’s AGM on 2 April 2020, the meeting fixed the dividend for 2019 at SEK 3.20 per share, to be paid on two occasions (SEK 1.60 per share on each occasion), the total dividend amounts to SEK 1,050m. It was resolved that the record date for dividends be 6 April 2020 and 6 October 2020 respectively.
Acquisition and transfer of treasury shares The 2019 AGM passed a resolution mandating the Board, for a period extending up until the next AGM, to acquire and transfer shares in the company. Share buybacks are subject to a limit of 10 per cent of the total number of shares outstanding at any time. During March 2020, 2,500,000 shares were bought back at an average price of SEK 119.49. At 30 June 2020, the company held 2,500,000 treasury shares corresponding to 0.76 per cent of the number of registered shares.
The buyback mandate was renewed at the AGM on 2 April 2020.
OWNER DISTRIBUTION*, 31/05/2020
DISTRIBUTION OF OWNERSHIP*, 31/05/2020
*Source: Holdings av Modular Finance AB. Compiled and processed data from various sources, including Euroclear, Morningstar and the Swedish Financial Supervisory Authority (Finansinspektionen). Data was not available for 30/06/2020 at the time of publication.
Number of shares*Proportion
of equity, %Proportion of votes,%
Erik Paulsson and company 50,186,718 15.2 15.2Vanguard 16,303,191 2.9 2.9 Länsförsäkringar Funds 9,684,546 2.7 2.7AMF Insurance & Funds 9,290,665 2.6 2.6Mats Qviberg with family 7,481,736 2.3 2.3Fourth AP-fund 6,508,298 2.1 2.1E.N.A City AB 6,410,000 1.9 1.9Handelsbanken Funds 5,366,305 1.7 1.7BlackRock 5,096,378 1.7 1.7BMO Global Asset Management 4,945,855 1.6 1.6Norges Bank 4,569,962 1.5 1.5Folksam 4,166,516 1.1 1.1Investment AB Öresund 3,688,272 1.1 1.1SEB Funds 3,598,551 1.1 1.1Swedbank Robur Funds 3,302,338 1.0 1.0Total 15 largest shareholders 140,599,331 40.5 40.5Other 190,183,813 59.5 59.5Total no. ofshares outstanding 328,283,144 99.2 99.2Treasury shares 2,500,000 0.8 0.8Total no. of registrated shares 330,783,144 100.0 100.0
Number of sharesCapital &
votes,%Foreign institutional owners 75,872,961 22.9Swedish institutional owners 87,277,133 26.4Other owners 71,677,163 22.3Swedish private individuals 46,004,562 13.9Anonymous ownership 47,451,325 14.4Holding own shares 2,500,000 0.1Total 330,783,144 100.00
58.9%
41.1%Swedish
Foreign
11.6%
2.6%
2.6%2.3%7.5%
14.5%
USA
UK
Netherlands
France
Other countries
Anonymous
*The verification date may vary for foreign shareholders.
FabegeLägsta kurs, kr 100,05Högsta kurs, kr 185,00VWAP, kr 133,83Daglig snittomsättning, kr 146 435 686Antal omsatta aktier, st 111 608 749Snitt antal avslut. st 3 955Antal avslut, st 403 366Snittvärde per avslut,kr 37 029Dagomsättning rel. börsvärde, % 0,32
15 Fabege | Interim report Q2 2020
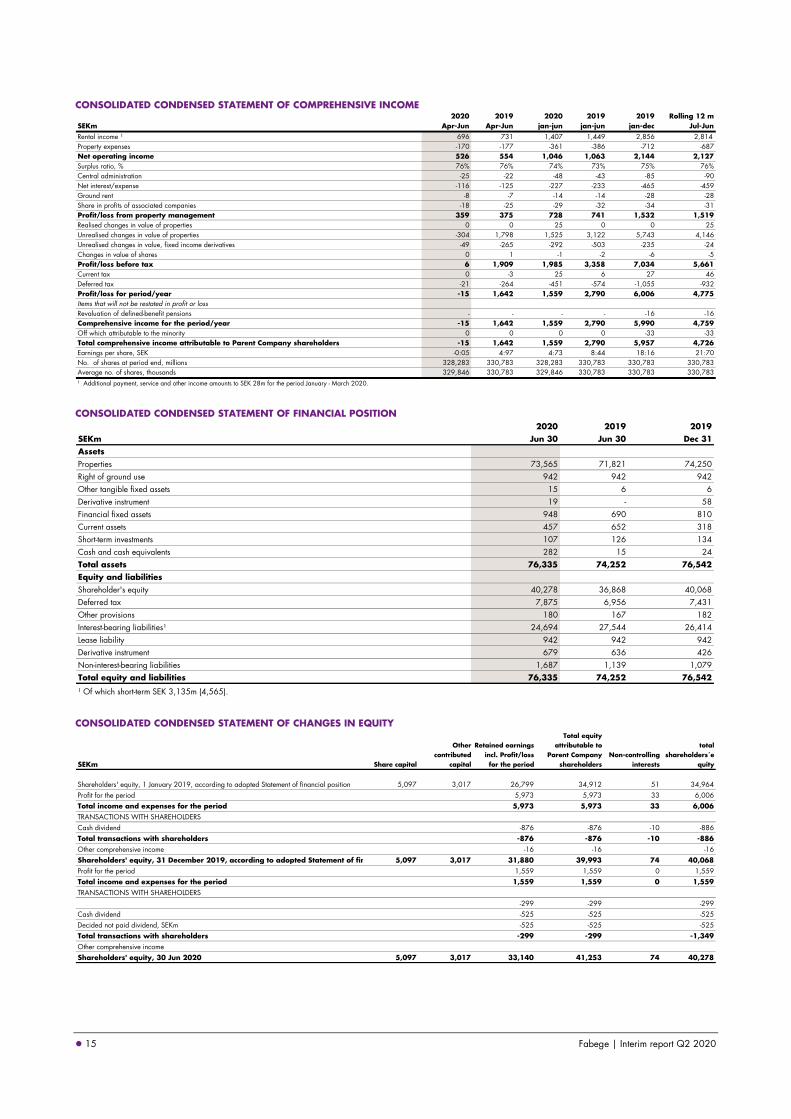
CONSOLIDATED CONDENSED STATEMENT OF COMPREHENSIVE INCOME
CONSOLIDATED CONDENSED STATEMENT OF FINANCIAL POSITION
CONSOLIDATED CONDENSED STATEMENT OF CHANGES IN EQUITY
2020 2019 2020 2019 2019 Rolling 12 mSEKm Apr-Jun Apr-Jun jan-jun jan-jun jan-dec Jul-JunRental income ¹ 696 731 1,407 1,449 2,856 2,814 Property expenses -170 -177 -361 -386 -712 -687Net operating income 526 554 1,046 1,063 2,144 2,127Surplus ratio, % 76% 76% 74% 73% 75% 76%Central administration -25 -22 -48 -43 -85 -90Net interest/expense -116 -125 -227 -233 -465 -459Ground rent -8 -7 -14 -14 -28 -28Share in profits of associated companies -18 -25 -29 -32 -34 -31Profit/loss from property management 359 375 728 741 1,532 1,519Realised changes in value of properties 0 0 25 0 0 25Unrealised changes in value of properties -304 1,798 1,525 3,122 5,743 4,146Unrealised changes in value, fixed income derivatives -49 -265 -292 -503 -235 -24Changes in value of shares 0 1 -1 -2 -6 -5Profit/loss before tax 6 1,909 1,985 3,358 7,034 5,661Current tax 0 -3 25 6 27 46Deferred tax -21 -264 -451 -574 -1,055 -932Profit/loss for period/year -15 1,642 1,559 2,790 6,006 4,775Items that will not be restated in profit or lossRevaluation of defined-benefit pensions - - - - -16 -16Comprehensive income for the period/year -15 1,642 1,559 2,790 5,990 4,759Off which attributable to the minority 0 0 0 0 -33 -33Total comprehensive income attributable to Parent Company shareholders -15 1,642 1,559 2,790 5,957 4,726Earnings per share, SEK -0:05 4:97 4:73 8:44 18:16 21:70No. of shares at period end, millions 328,283 330,783 328,283 330,783 330,783 330,783Average no. of shares, thousands 329,846 330,783 329,846 330,783 330,783 330,783¹ Additional payment, service and other income amounts to SEK 28m for the period January - March 2020.
2020 2019 2019SEKm Jun 30 Jun 30 Dec 31AssetsProperties 73,565 71,821 74,250Right of ground use 942 942 942Other tangible fixed assets 15 6 6Derivative instrument 19 - 58Financial fixed assets 948 690 810Current assets 457 652 318Short-term investments 107 126 134Cash and cash equivalents 282 15 24Total assets 76,335 74,252 76,542Equity and liabilitiesShareholder's equity 40,278 36,868 40,068Deferred tax 7,875 6,956 7,431Other provisions 180 167 182Interest-bearing liabilities¹ 24,694 27,544 26,414Lease liability 942 942 942Derivative instrument 679 636 426Non-interest-bearing liabilities 1,687 1,139 1,079Total equity and liabilities 76,335 74,252 76,542
¹ Of which short-term SEK 3,135m (4,565).
SEKm Share capital
Other contributed
capital
Retained earnings incl. Profit/loss for the period
Total equity attributable to
Parent Company shareholders
Non-controlling interests
total shareholders´e
quity
Shareholders' equity, 1 January 2019, according to adopted Statement of financial position 5,097 3,017 26,799 34,912 51 34,964Profit for the period 5,973 5,973 33 6,006Total income and expenses for the period 5,973 5,973 33 6,006TRANSACTIONS WITH SHAREHOLDERSCash dividend -876 -876 -10 -886Total transactions with shareholders -876 -876 -10 -886Other comprehensive income -16 -16 -16Shareholders' equity, 31 December 2019, according to adopted Statement of fin 5,097 3,017 31,880 39,993 74 40,068Profit for the period 1,559 1,559 0 1,559Total income and expenses for the period 1,559 1,559 0 1,559TRANSACTIONS WITH SHAREHOLDERS
-299 -299 -299Cash dividend -525 -525 -525Decided not paid dividend, SEKm -525 -525 -525Total transactions with shareholders -299 -299 -1,349Other comprehensive incomeShareholders' equity, 30 Jun 2020 5,097 3,017 33,140 41,253 74 40,278
16 Fabege | Interim report Q2 2020
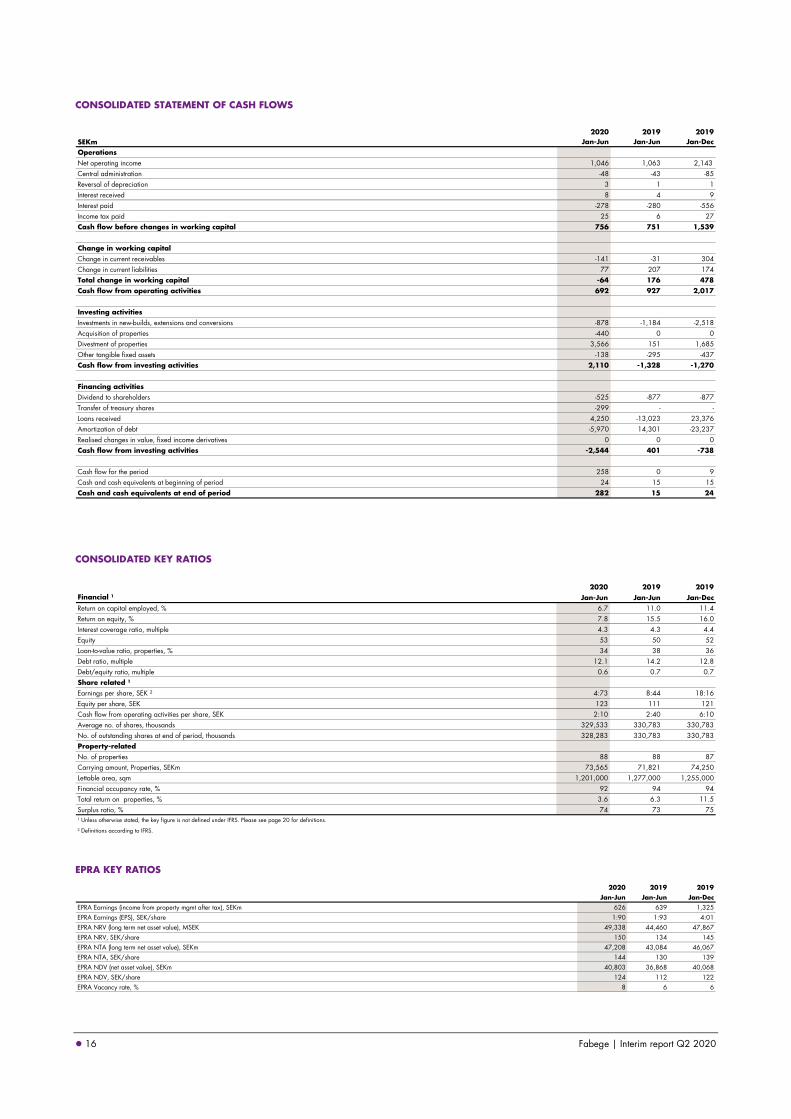
CONSOLIDATED STATEMENT OF CASH FLOWS
CONSOLIDATED KEY RATIOS
EPRA KEY RATIOS
2020 2019 2019SEKm Jan-Jun Jan-Jun Jan-DecOperationsNet operating income 1,046 1,063 2,143 Central administration -48 -43 -85Reversal of depreciation 3 1 1Interest received 8 4 9Interest paid -278 -280 -556Income tax paid 25 6 27Cash flow before changes in working capital 756 751 1,539
Change in working capitalChange in current receivables -141 -31 304Change in current liabilities 77 207 174Total change in working capital -64 176 478Cash flow from operating activities 692 927 2,017
Investing activitiesInvestments in new-builds, extensions and conversions -878 -1,184 -2,518Acquisition of properties -440 0 0Divestment of properties 3,566 151 1,685Other tangible fixed assets -138 -295 -437Cash flow from investing activities 2,110 -1,328 -1,270
Financing activitiesDividend to shareholders -525 -877 -877Transfer of treasury shares -299 - -Loans received 4,250 -13,023 23,376Amortization of debt -5,970 14,301 -23,237Realised changes in value, fixed income derivatives 0 0 0Cash flow from investing activities -2,544 401 -738
Cash flow for the period 258 0 9Cash and cash equivalents at beginning of period 24 15 15Cash and cash equivalents at end of period 282 15 24
2020 2019 2019Financial ¹ Jan-Jun Jan-Jun Jan-DecReturn on capital employed, % 6.7 11.0 11.4Return on equity, % 7.8 15.5 16.0Interest coverage ratio, multiple 4.3 4.3 4.4Equity 53 50 52Loan-to-value ratio, properties, % 34 38 36Debt ratio, multiple 12.1 14.2 12.8Debt/equity ratio, multiple 0.6 0.7 0.7Share related ¹ Earnings per share, SEK ² 4:73 8:44 18:16Equity per share, SEK 123 111 121Cash flow from operating activities per share, SEK 2:10 2:40 6:10Average no. of shares, thousands 329,533 330,783 330,783No. of outstanding shares at end of period, thousands 328,283 330,783 330,783Property-relatedNo. of properties 88 88 87Carrying amount, Properties, SEKm 73,565 71,821 74,250Lettable area, sqm 1,201,000 1,277,000 1,255,000Financial occupancy rate, % 92 94 94Total return on properties, % 3.6 6.3 11.5Surplus ratio, % 74 73 75¹ Unless otherwise stated, the key figure is not defined under IFRS. Please see page 20 for definitions.
² Definitions according to IFRS.
2020 2019 2019Jan-Jun Jan-Jun Jan-Dec
EPRA Earnings (income from property mgmt after tax), SEKm 626 639 1,325EPRA Earnings (EPS), SEK/share 1:90 1:93 4:01EPRA NRV (long term net asset value), MSEK 49,338 44,460 47,867EPRA NRV, SEK/share 150 134 145EPRA NTA (long term net asset value), SEKm 47,208 43,084 46,067EPRA NTA, SEK/share 144 130 139EPRA NDV (net asset value), SEKm 40,803 36,868 40,068EPRA NDV, SEK/share 124 112 122EPRA Vacancy rate, % 8 6 6
17 Fabege | Interim report Q2 2020
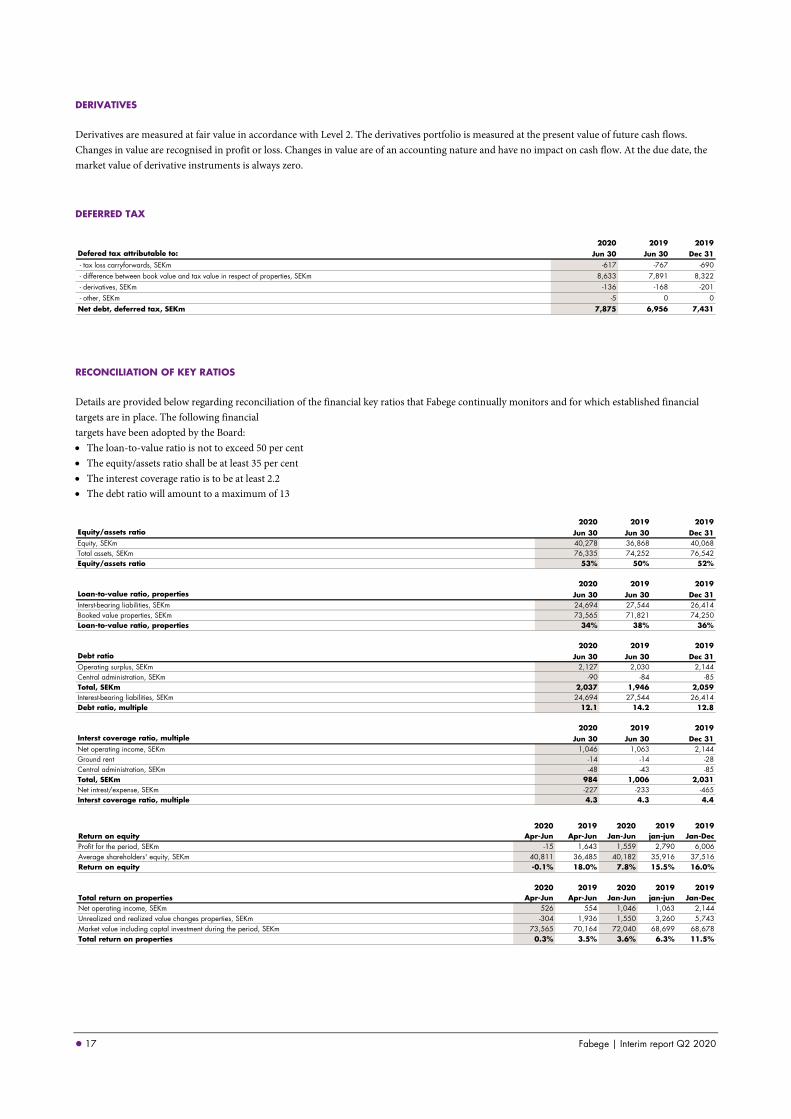
DERIVATIVES
Derivatives are measured at fair value in accordance with Level 2. The derivatives portfolio is measured at the present value of future cash flows. Changes in value are recognised in profit or loss. Changes in value are of an accounting nature and have no impact on cash flow. At the due date, the market value of derivative instruments is always zero.
DEFERRED TAX
RECONCILIATION OF KEY RATIOS
Details are provided below regarding reconciliation of the financial key ratios that Fabege continually monitors and for which established financial targets are in place. The following financial targets have been adopted by the Board: • The loan-to-value ratio is not to exceed 50 per cent • The equity/assets ratio shall be at least 35 per cent • The interest coverage ratio is to be at least 2.2 • The debt ratio will amount to a maximum of 13
2020 2019 2019Defered tax attributable to: Jun 30 Jun 30 Dec 31 - tax loss carryforwards, SEKm -617 -767 -690 - difference between book value and tax value in respect of properties, SEKm 8,633 7,891 8,322 - derivatives, SEKm -136 -168 -201 - other, SEKm -5 0 0Net debt, deferred tax, SEKm 7,875 6,956 7,431
2020 2019 2019Equity/assets ratio Jun 30 Jun 30 Dec 31Equity, SEKm 40,278 36,868 40,068Total assets, SEKm 76,335 74,252 76,542Equity/assets ratio 53% 50% 52%
2020 2019 2019Loan-to-value ratio, properties Jun 30 Jun 30 Dec 31Interst-bearing liabilities, SEKm 24,694 27,544 26,414Booked value properties, SEKm 73,565 71,821 74,250Loan-to-value ratio, properties 34% 38% 36%
2020 2019 2019Debt ratio Jun 30 Jun 30 Dec 31Operating surplus, SEKm 2,127 2,030 2,144Central administration, SEKm -90 -84 -85Total, SEKm 2,037 1,946 2,059Interest-bearing liabilities, SEKm 24,694 27,544 26,414Debt ratio, multiple 12.1 14.2 12.8
2020 2019 2019Interst coverage ratio, multiple Jun 30 Jun 30 Dec 31Net operating income, SEKm 1,046 1,063 2,144Ground rent -14 -14 -28Central administration, SEKm -48 -43 -85Total, SEKm 984 1,006 2,031Net intrest/expense, SEKm -227 -233 -465Interst coverage ratio, multiple 4.3 4.3 4.4
2020 2019 2020 2019 2019Return on equity Apr-Jun Apr-Jun Jan-Jun jan-jun Jan-DecProfit for the period, SEKm -15 1,643 1,559 2,790 6,006Average shareholders' equity, SEKm 40,811 36,485 40,182 35,916 37,516Return on equity -0.1% 18.0% 7.8% 15.5% 16.0%
2020 2019 2020 2019 2019Total return on properties Apr-Jun Apr-Jun Jan-Jun jan-jun Jan-DecNet operating income, SEKm 526 554 1,046 1,063 2,144Unrealized and realized value changes properties, SEKm -304 1,936 1,550 3,260 5,743Market value including captal investment during the period, SEKm 73,565 70,164 72,040 68,699 68,678Total return on properties 0.3% 3.5% 3.6% 6.3% 11.5%
18 Fabege | Interim report Q2 2020
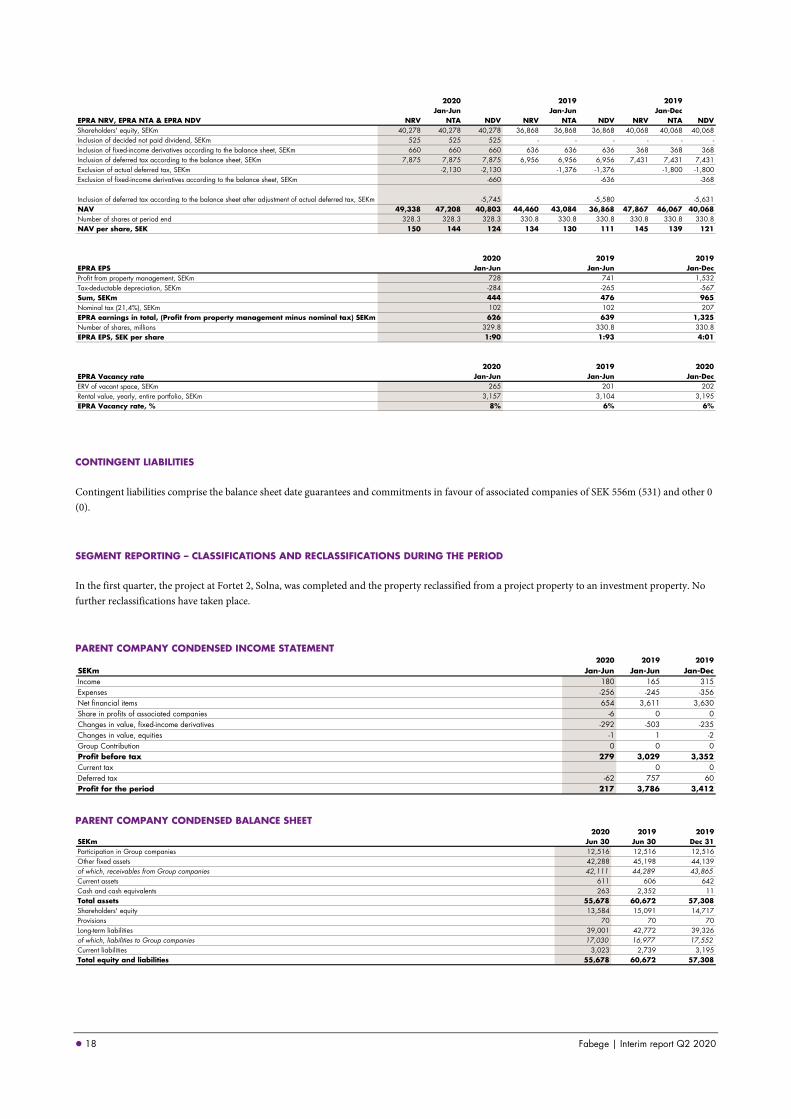
CONTINGENT LIABILITIES
Contingent liabilities comprise the balance sheet date guarantees and commitments in favour of associated companies of SEK 556m (531) and other 0 (0).
SEGMENT REPORTING – CLASSIFICATIONS AND RECLASSIFICATIONS DURING THE PERIOD
In the first quarter, the project at Fortet 2, Solna, was completed and the property reclassified from a project property to an investment property. No further reclassifications have taken place. PARENT COMPANY CONDENSED INCOME STATEMENT
PARENT COMPANY CONDENSED BALANCE SHEET
2020 2019 2019Jan-Jun Jan-Jun Jan-Dec
EPRA NRV, EPRA NTA & EPRA NDV NRV NTA NDV NRV NTA NDV NRV NTA NDVShareholders' equity, SEKm 40,278 40,278 40,278 36,868 36,868 36,868 40,068 40,068 40,068Inclusion of decided not paid dividend, SEKm 525 525 525 - - - - - -Inclusion of fixed-income derivatives according to the balance sheet, SEKm 660 660 660 636 636 636 368 368 368Inclusion of deferred tax according to the balance sheet, SEKm 7,875 7,875 7,875 6,956 6,956 6,956 7,431 7,431 7,431Exclusion of actual deferred tax, SEKm -2,130 -2,130 -1,376 -1,376 -1,800 -1,800Exclusion of fixed-income derivatives according to the balance sheet, SEKm -660 -636 -368
Inclusion of deferred tax according to the balance sheet after adjustment of actual deferred tax, SEKm -5,745 -5,580 -5,631NAV 49,338 47,208 40,803 44,460 43,084 36,868 47,867 46,067 40,068Number of shares at period end 328.3 328.3 328.3 330.8 330.8 330.8 330.8 330.8 330.8NAV per share, SEK 150 144 124 134 130 111 145 139 121
EPRA EPSProfit from property management, SEKmTax-deductable depreciation, SEKmSum, SEKmNominal tax (21,4%), SEKmEPRA earnings in total, (Profit from property management minus nominal tax) SEKmNumber of shares, millionsEPRA EPS, SEK per share
EPRA Vacancy rateERV of vacant space, SEKmRental value, yearly, entire portfolio, SEKmEPRA Vacancy rate, %
-284444
2020 2019 2019Jan-Jun Jan-Jun Jan-Dec
728
265
207
330.8 330.81:93 4:01
2019 2020
201 202
1,325
3,1578%
741 1,532-265 -567476 965
639102626
329.81:90
2020Jan-Jun
102
3,104 3,1956% 6%
Jan-Jun Jan-Dec
2020 2019 2019SEKm Jan-Jun Jan-Jun Jan-DecIncome 180 165 315Expenses -256 -245 -356Net financial items 654 3,611 3,630Share in profits of associated companies -6 0 0Changes in value, fixed-income derivatives -292 -503 -235Changes in value, equities -1 1 -2Group Contribution 0 0 0Profit before tax 279 3,029 3,352Current tax 0 0Deferred tax -62 757 60Profit for the period 217 3,786 3,412
2020 2019 2019SEKm Jun 30 Jun 30 Dec 31Participation in Group companies 12,516 12,516 12,516Other fixed assets 42,288 45,198 44,139of which, receivables from Group companies 42,111 44,289 43,865Current assets 611 606 642Cash and cash equivalents 263 2,352 11Total assets 55,678 60,672 57,308Shareholders' equity 13,584 15,091 14,717Provisions 70 70 70Long-term liabilities 39,001 42,772 39,326of which, liabilities to Group companies 17,030 16,977 17,552Current liabilities 3,023 2,739 3,195Total equity and liabilities 55,678 60,672 57,308
19 Fabege | Interim report Q2 2020
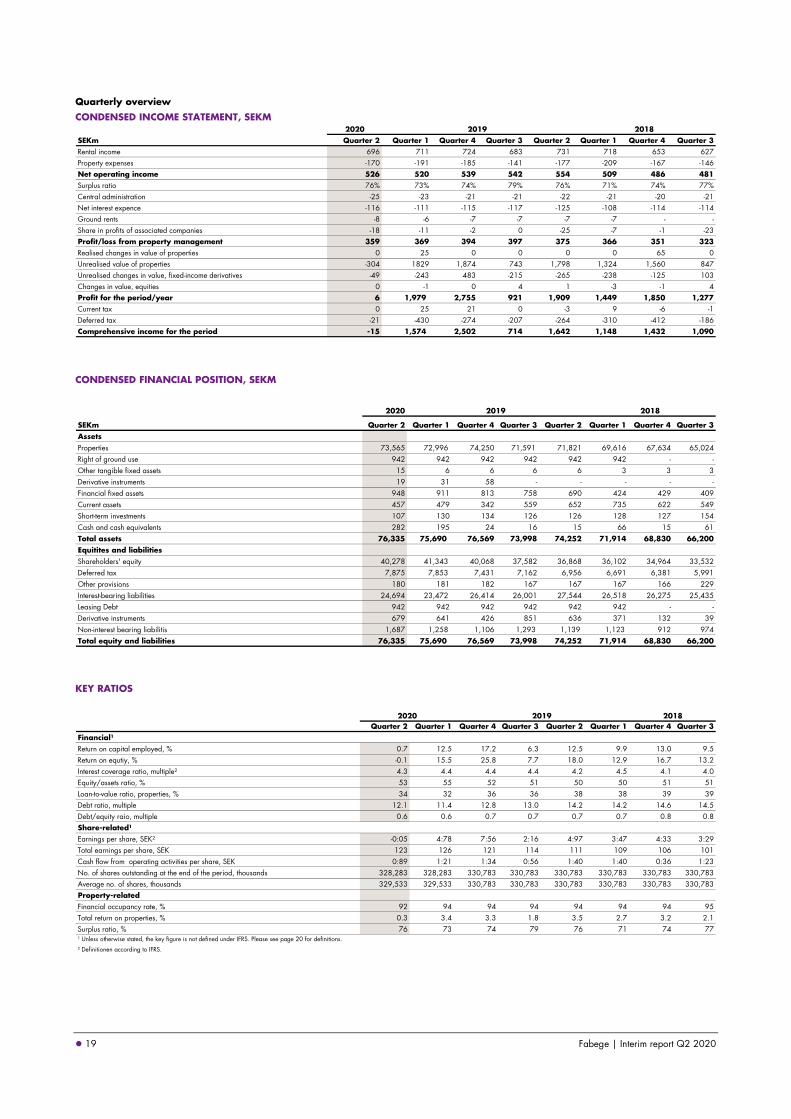
Quarterly overview
CONDENSED INCOME STATEMENT, SEKM
CONDENSED FINANCIAL POSITION, SEKM
KEY RATIOS
2020SEKm Quarter 2 Quarter 1 Quarter 4 Quarter 3 Quarter 2 Quarter 1 Quarter 4 Quarter 3Rental income 696 711 724 683 731 718 653 627Property expenses -170 -191 -185 -141 -177 -209 -167 -146Net operating income 526 520 539 542 554 509 486 481Surplus ratio 76% 73% 74% 79% 76% 71% 74% 77%Central administration -25 -23 -21 -21 -22 -21 -20 -21Net interest expence -116 -111 -115 -117 -125 -108 -114 -114Ground rents -8 -6 -7 -7 -7 -7 - -Share in profits of associated companies -18 -11 -2 0 -25 -7 -1 -23Profit/loss from property management 359 369 394 397 375 366 351 323Realised changes in value of properties 0 25 0 0 0 0 65 0Unrealised value of properties -304 1829 1,874 743 1,798 1,324 1,560 847Unrealised changes in value, fixed-income derivatives -49 -243 483 -215 -265 -238 -125 103Changes in value, equities 0 -1 0 4 1 -3 -1 4Profit for the period/year 6 1,979 2,755 921 1,909 1,449 1,850 1,277Current tax 0 25 21 0 -3 9 -6 -1Deferred tax -21 -430 -274 -207 -264 -310 -412 -186Comprehensive income for the period -15 1,574 2,502 714 1,642 1,148 1,432 1,090
2019 2018
2020
SEKm Quarter 2 Quarter 1 Quarter 4 Quarter 3 Quarter 2 Quarter 1 Quarter 4 Quarter 3AssetsProperties 73,565 72,996 74,250 71,591 71,821 69,616 67,634 65,024Right of ground use 942 942 942 942 942 942 - -Other tangible fixed assets 15 6 6 6 6 3 3 3Derivative instruments 19 31 58 - - - - -Financial fixed assets 948 911 813 758 690 424 429 409Current assets 457 479 342 559 652 735 622 549Short-term investments 107 130 134 126 126 128 127 154Cash and cash equivalents 282 195 24 16 15 66 15 61Total assets 76,335 75,690 76,569 73,998 74,252 71,914 68,830 66,200Equitites and liabilitiesShareholders' equity 40,278 41,343 40,068 37,582 36,868 36,102 34,964 33,532Deferred tax 7,875 7,853 7,431 7,162 6,956 6,691 6,381 5,991Other provisions 180 181 182 167 167 167 166 229Interest-bearing liabilities 24,694 23,472 26,414 26,001 27,544 26,518 26,275 25,435Leasing Debt 942 942 942 942 942 942 - -Derivative instruments 679 641 426 851 636 371 132 39Non-interest bearing liabilitis 1,687 1,258 1,106 1,293 1,139 1,123 912 974Total equity and liabilities 76,335 75,690 76,569 73,998 74,252 71,914 68,830 66,200
2019 2018
Quarter 2 Quarter 1 Quarter 4 Quarter 3 Quarter 2 Quarter 1 Quarter 4 Quarter 3Financial¹Return on capital employed, % 0.7 12.5 17.2 6.3 12.5 9.9 13.0 9.5Return on equtiy, % -0.1 15.5 25.8 7.7 18.0 12.9 16.7 13.2Interest coverage ratio, multiple² 4.3 4.4 4.4 4.4 4.2 4.5 4.1 4.0Equity/assets ratio, % 53 55 52 51 50 50 51 51Loan-to-value ratio, properties, % 34 32 36 36 38 38 39 39Debt ratio, multiple 12.1 11.4 12.8 13.0 14.2 14.2 14.6 14.5Debt/equity raio, multiple 0.6 0.6 0.7 0.7 0.7 0.7 0.8 0.8Share-related¹ Earnings per share, SEK² -0:05 4:78 7:56 2:16 4:97 3:47 4:33 3:29Total earnings per share, SEK 123 126 121 114 111 109 106 101Cash flow from operating activities per share, SEK 0:89 1:21 1:34 0:56 1:40 1:40 0:36 1:23No. of shares outstanding at the end of the period, thousands 328,283 328,283 330,783 330,783 330,783 330,783 330,783 330,783Average no. of shares, thousands 329,533 329,533 330,783 330,783 330,783 330,783 330,783 330,783Property-relatedFinancial occupancy rate, % 92 94 94 94 94 94 94 95Total return on properties, % 0.3 3.4 3.3 1.8 3.5 2.7 3.2 2.1Surplus ratio, % 76 73 74 79 76 71 74 77¹ Unless otherwise stated, the key figure is not defined under IFRS. Please see page 20 for definitions.
² Definitionen according to IFRS.
2020 2019 2018
20 Fabege | Interim report Q2 2020
Definitions
The company presents certain financial performance measures in the interim report that are not defined according to IFRS. The company considers that these measures provide valuable supplementary information for investors and company management, as they enable an assessment and benchmarking of the company’s presentation. Since not all companies calculate financial performance measures in the same way, these are not always comparable to measures used by other companies. These financial performance measures should not therefore be regarded as substitutes for measures defined according to IFRS. The following key ratios are not defined according to IFRS, unless otherwise stated.
ACTUAL DEFERRED TAX
Estimated actual deferred tax has been cal-culated at approximately 4 per cent based on a discount rate of 3 per cent. Further-more, it has been assumed that loss car-ryforwards are realised over four years with a nominal tax rate of 21.4 per cent, which gives a net present value for deferred tax as-sets of 19.7 per cent. The calculation is also based on the property portfolio being real-ised over 50 years, with 10 per cent being sold directly with a nominal tax rate of 20.6 per cent and the remaining 90 per cent be-ing sold indirectly via companies with a nominal tax rate amounting to 6 per cent, which gives a net present value for deferred tax liabilities of 4 per cent. CASH FLOW FROM OPERATING
ACTIVITIES PER SHARE Cash flow from operating activities (after changes in working capital) divided by the average number of shares outstanding. CAPITAL EMPLOYED Total assets less non-interest bearing liabilities, provisions and deferred tax. DEBT/EQUITY RATIO Interest-bearing liabilities divided by share-holders’ equity. DEBT RATIO Interest-bearing liabilities divided by roll-ing twelve-month net operating income less central administration. DEVELOPMENT PROPERTIES* Properties in which a conversion or exten-sion is in progress or planned that has a significant impact on the property’s net op-erating income. Net operating income is af-fected either directly by the project or by limitations on lettings prior to impending improvement work. EPRA EPS Profit from property management less tax at a nominal rate attributable to profit from property management, divided by average number of shares. Taxable profit from property management is defined as profit from property management less such amounts as tax-deductible depreciation and remodelling.
EPRA NDV – NET DISPOSAL VALUE Shareholders’ equity according to balance sheet. EPRA NRV – NET REINSTATEMENT VALUE Shareholders’ equity according to balance sheet fol-lowing the reversal of fixed-income derivatives and deferred tax according to the balance sheet. EPRA NTA – NET TANGIBLE ASSETS Shareholders’ equity according to balance sheet fol-lowing the reversal of fixed-income derivatives and deferred tax according to the balance sheet. Ad-justed for actual deferred tax instead of nominal de-ferred tax. EPRA VACANCY RATE Estimated market rent for vacant rents divided by the annual rental value for the entire property portfolio. EQUITY/ASSETS RATIO Shareholders’ equity including non-controlling in-terest divided by total assets. EQUITY PER SHARE Parent Company shareholders’ share of equity ac-cording to the balance sheet, divided by the number of shares outstanding at the end of the period. FINANCIAL OCCUPANCY RATE* Lease value divided by rental value at the end of the period. INTEREST COVERAGE RATIO Net operating income including ground rent less central administration in relation to net interest items (interest expenses less interest income). INVESTMENT PROPERTIES* Properties that are being actively managed on an on-going basis. LAND AND PROJECT PROPERTIES* Land and development properties and properties in which a new construction/complete redevelopment is in progress. LEASE VALUE* Stated as an annual value. Index-adjusted basic rent under the rental agreement plus rent supplements. LOAN-TO-VALUE RATIO, PROPERTIES Interest-bearing liabilities divided by the carrying amount of the properties at the end of the period. NET LETTINGS* New lettings during the period less terminations to vacate. PROFIT/EARNINGS PER SHARE Parent Company shareholders’ share of earnings af-ter tax for the period, divided by average number of shares outstanding during the period. Definition ac-cording to IFRS.
RETURN ON CAPITAL EMPLOYED Profit before tax plus interest expenses, divided by average capital employed. In interim reports, the return is converted into its annu-alised value without taking account of seasonal variations. RETURN ON EQUITY Profit for the period/year divided by average shareholders’ equity including non-controlling interest. In interim reports, the return is converted into its annualised value without taking account of sea-sonal variations. RETURN ON INVESTED CAPITAL IN THE PROJECT
PORTFOLIO* Change in value of project and development properties, divided by invested capital (excluding initial value) in project and develop-ment properties during the period. RETURN, SHARE Dividend for the year divided by the share price at year-end. RENTAL VALUE* Lease value plus estimated annual rent for vacant premises after a reasonable general renovation. RETENTION RATE* Proportion of leases that are extended in relation to the proportion of cancellable leases. SURPLUS RATIO* Net operating income divided by rental income. TOTAL RETURN PROPERTIES Net operating income for the period plus unrealised and realised changes in the value of properties, divided by market value at start of period plus investments for the period.
*This key ratio is operational and is not regarded as an alternative perfor-
mance measure according to ESMA’s guidelines.
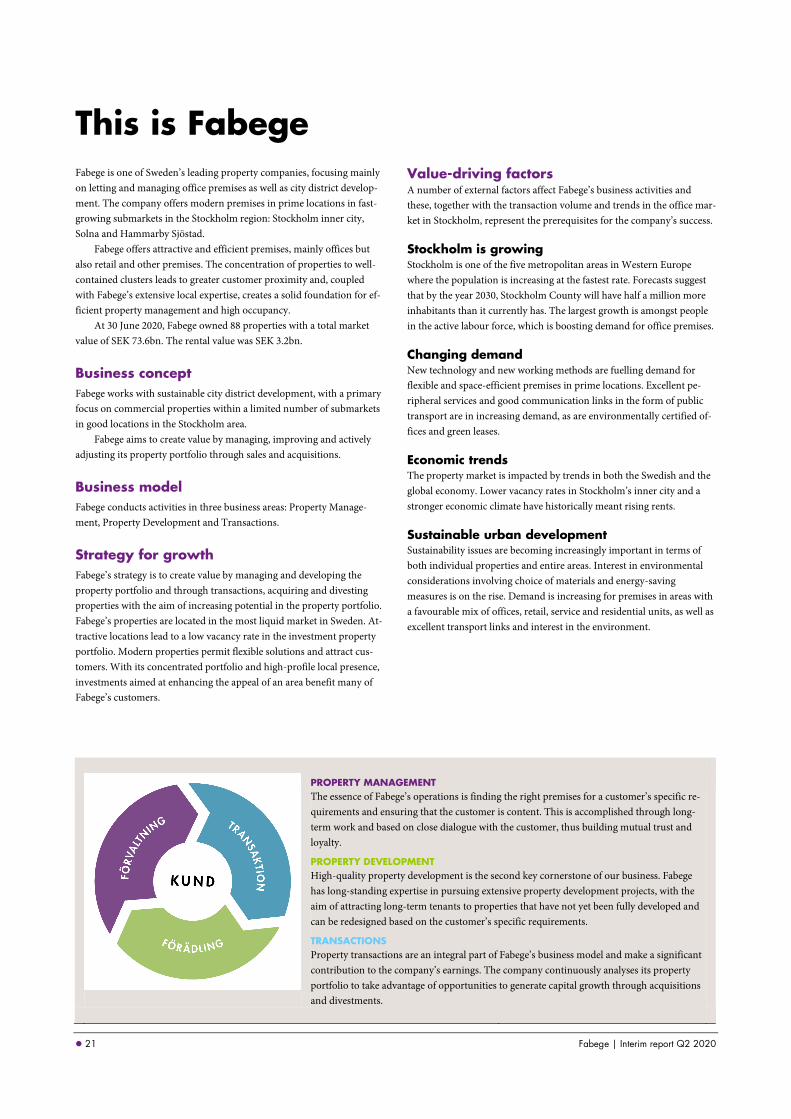
21 Fabege | Interim report Q2 2020
This is Fabege Fabege is one of Sweden’s leading property companies, focusing mainly on letting and managing office premises as well as city district develop-ment. The company offers modern premises in prime locations in fast-growing submarkets in the Stockholm region: Stockholm inner city, Solna and Hammarby Sjöstad.
Fabege offers attractive and efficient premises, mainly offices but also retail and other premises. The concentration of properties to well-contained clusters leads to greater customer proximity and, coupled with Fabege’s extensive local expertise, creates a solid foundation for ef-ficient property management and high occupancy.
At 30 June 2020, Fabege owned 88 properties with a total market value of SEK 73.6bn. The rental value was SEK 3.2bn.
Business concept Fabege works with sustainable city district development, with a primary focus on commercial properties within a limited number of submarkets in good locations in the Stockholm area.
Fabege aims to create value by managing, improving and actively adjusting its property portfolio through sales and acquisitions.
Business model Fabege conducts activities in three business areas: Property Manage-ment, Property Development and Transactions.
Strategy for growth Fabege’s strategy is to create value by managing and developing the property portfolio and through transactions, acquiring and divesting properties with the aim of increasing potential in the property portfolio. Fabege’s properties are located in the most liquid market in Sweden. At-tractive locations lead to a low vacancy rate in the investment property portfolio. Modern properties permit flexible solutions and attract cus-tomers. With its concentrated portfolio and high-profile local presence, investments aimed at enhancing the appeal of an area benefit many of Fabege’s customers.
Value-driving factors A number of external factors affect Fabege’s business activities and these, together with the transaction volume and trends in the office mar-ket in Stockholm, represent the prerequisites for the company’s success.
Stockholm is growing Stockholm is one of the five metropolitan areas in Western Europe where the population is increasing at the fastest rate. Forecasts suggest that by the year 2030, Stockholm County will have half a million more inhabitants than it currently has. The largest growth is amongst people in the active labour force, which is boosting demand for office premises.
Changing demand New technology and new working methods are fuelling demand for flexible and space-efficient premises in prime locations. Excellent pe-ripheral services and good communication links in the form of public transport are in increasing demand, as are environmentally certified of-fices and green leases.
Economic trends The property market is impacted by trends in both the Swedish and the global economy. Lower vacancy rates in Stockholm’s inner city and a stronger economic climate have historically meant rising rents.
Sustainable urban development Sustainability issues are becoming increasingly important in terms of both individual properties and entire areas. Interest in environmental considerations involving choice of materials and energy-saving measures is on the rise. Demand is increasing for premises in areas with a favourable mix of offices, retail, service and residential units, as well as excellent transport links and interest in the environment.
PROPERTY MANAGEMENT The essence of Fabege’s operations is finding the right premises for a customer’s specific re-quirements and ensuring that the customer is content. This is accomplished through long-term work and based on close dialogue with the customer, thus building mutual trust and loyalty.
PROPERTY DEVELOPMENT High-quality property development is the second key cornerstone of our business. Fabege has long-standing expertise in pursuing extensive property development projects, with the aim of attracting long-term tenants to properties that have not yet been fully developed and can be redesigned based on the customer’s specific requirements.
TRANSACTIONS Property transactions are an integral part of Fabege’s business model and make a significant contribution to the company’s earnings. The company continuously analyses its property portfolio to take advantage of opportunities to generate capital growth through acquisitions and divestments.
Fabege AB (publ)
Box 730, SE 169 27 Solna, Sweden
Visitors: Pyramidvägen 7, 169 56 Solna, Sweden
Telephone: +46 (0)8 555 148 00
Email: [email protected]
www.fabege.se
Corporate registration number: 556049-1523
Registered office of the Board of Directors: Stockholm
STEFAN DAHLBO, President and CEO ÅSA BERGSTRÖM, Vice President and CFO
Contact: +46 (0 )8 555 148 10, [email protected] Contact: +46 (0) 8 555 148 29, [email protected]
Calendar
‘Interim report Jan–March 2020
Interim report Jan–June 2020
Interim report Jan–Sep 2020
Year-end report 2020
21 April 2020, 7.30 am CET
6 July 2020, 7.30 am CET
20 October 2020, 7.30 am CET
4 February 2021, 12.00 noon CET
Press releases during the second quarter 2020¹
02/04/2020 Resolution by Fabege’s Annual General Meeting on
2020
21/04/2020
08/05/2020 11/05/2020
Interim report January–March 2020
Fabege acquires property in Hammarby Sjöstad
Fast-growing technology company signs contract
with Fabege
FOLLOW US ONLINE: WWW.FABEGE.SE
There will also be
a web presentation on the Group’s website on 6 July 2020, during which Stefan Dahlbo and Åsa Bergström will present the report.
¹Including regulatory and non-regulatory press releases.