q3 15 earnings slides-final
TRANSCRIPT

Bruker Corporation (NASDAQ: BRKR)
Q3 2015 Earnings Presentation
Frank Laukien, President & CEO
Anthony Mattacchione, SVP & Interim CFO
Joshua Young, VP, IR & Corporate Development November 4, 2015
Innovation with Integrity

Any statements contained in this presentation that do not describe historical facts may constitute
forward-looking statements as that term is defined in the Private Securities Litigation Reform Act of 1995.
Any forward-looking statements contained herein are based on current expectations, but are subject to
risks and uncertainties that could cause actual results to differ materially from those projected, including,
but not limited to, risks and uncertainties relating to adverse changes in conditions in the global economy
and volatility in the capital markets, the integration of businesses we have acquired or may acquire in the
future, our ability to successfully implement restructuring initiatives, changing technologies, product
development and market acceptance of our products, the cost and pricing of our products,
manufacturing, competition, dependence on collaborative partners and key suppliers, capital spending
and government funding policies, changes in governmental regulations, realization of anticipated benefits
from economic stimulus programs, intellectual property rights, litigation, and exposure to foreign
currency fluctuations and other risk factors discussed from time to time in our filings with the Securities
and Exchange Commission. These and other factors are identified and described in more detail in our
filings with the SEC, including, without limitation, our annual report on Form 10-K for the year ended
December 31, 2014 and our quarterly reports on Form 10-Q for the periods ended March 31, 2015 and
June 30, 2015. We will also be referencing non-GAAP financial measures in this presentation. A
reconciliation of non-GAAP to GAAP results is available in our earnings press release and in this
presentation.
Bruker Corporation
Safe Harbor & Reg. G Statement
© Bruker Corporation 2

Q3-15 & YTD 2015 Business Update
© Bruker Corporation 3

$0.14
$0.19
Q3-14
Q3-15
Q3 Financials
Revenues [$ m]
Non-GAAP EPS
Bruker delivers stronger, more balanced financial
performance in Q3 2015
-6%
+36%
© Bruker Corporation 4
420 396
Q3-14 Q3-15
Q3 2015 Performance
Revenues decline -$24m, or -6% y-o-y
− FX headwinds lower revenue -11% y-o-y
Organic revenue growth of +8% y-o-y, driven
by CALID and BioSpin Groups
− Europe & Asia are strongest regions
Non-GAAP operating margins expand by +470
basis points y-o-y
Non-GAAP EPS grows by +36% y-o-y despite
higher tax rate
Free cash flow of $45M in Q3-15 up compared
to $4M in Q3-14
− Higher profitability and lower working
capital drive FCF improvement
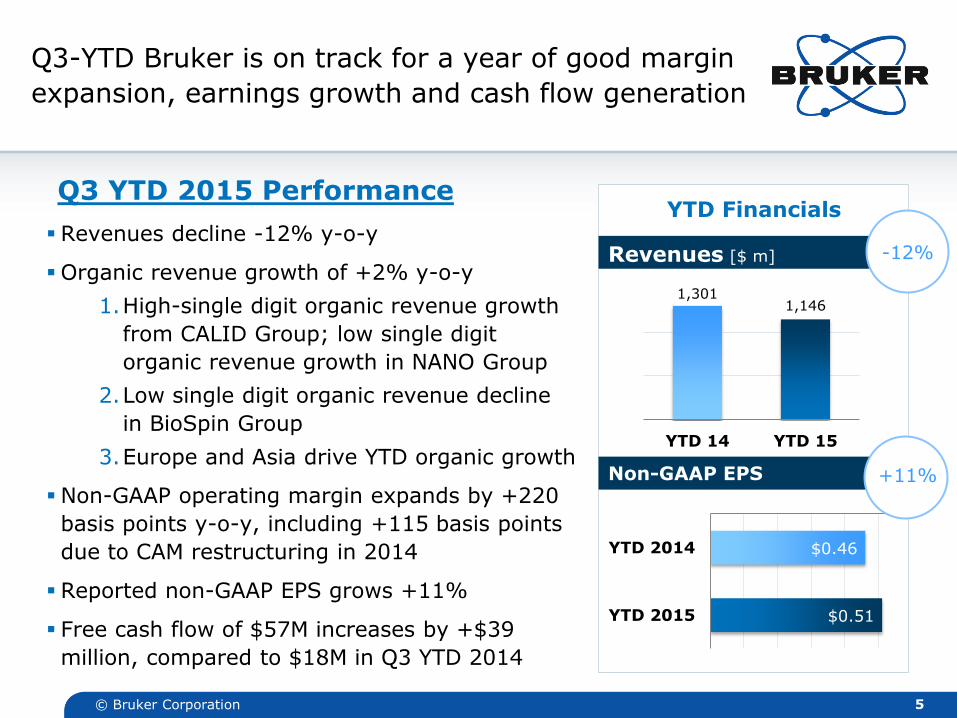
$0.46
$0.51
YTD 2014
YTD 2015
YTD Financials
Revenues [$ m]
Non-GAAP EPS
Q3-YTD Bruker is on track for a year of good margin
expansion, earnings growth and cash flow generation
-12%
+11%
© Bruker Corporation 5
1,301 1,146
YTD 14 YTD 15
Q3 YTD 2015 Performance
Revenues decline -12% y-o-y
Organic revenue growth of +2% y-o-y
1.High-single digit organic revenue growth
from CALID Group; low single digit
organic revenue growth in NANO Group
2.Low single digit organic revenue decline
in BioSpin Group
3.Europe and Asia drive YTD organic growth
Non-GAAP operating margin expands by +220
basis points y-o-y, including +115 basis points
due to CAM restructuring in 2014
Reported non-GAAP EPS grows +11%
Free cash flow of $57M increases by +$39
million, compared to $18M in Q3 YTD 2014

Bruker BIOSPIN Group
Strong revenue growth for Nuclear Magnetic Resonance (NMR) as
business rebounds in all major geographies
NMR business recovery continues as order bookings remain healthy
Preclinical imaging business reports mid-single digit organic growth
in Q3-15, but YTD weakness in order bookings continues
Positive product mix, benefits from restructuring, higher-margin
transactions, earlier than expected customer acceptances drive
improved margins
Bruker CALID Group
Delivers double-digit organic revenue growth y-o-y with strong
performance in Europe and Asia, and with strong margin expansion
Daltonics Division drives organic revenue growth in nearly all product
lines and geographies
Detection Division generates exceptional, but non-recurring revenue
growth in Q3-15 with new explosives trace detection products
Optics Division experiences flat organic revenues due to restrained
demand from industrial and high-end R&D customers
6 © Bruker Corporation
GROUP OVERVIEW:
Q3 2015 Performance
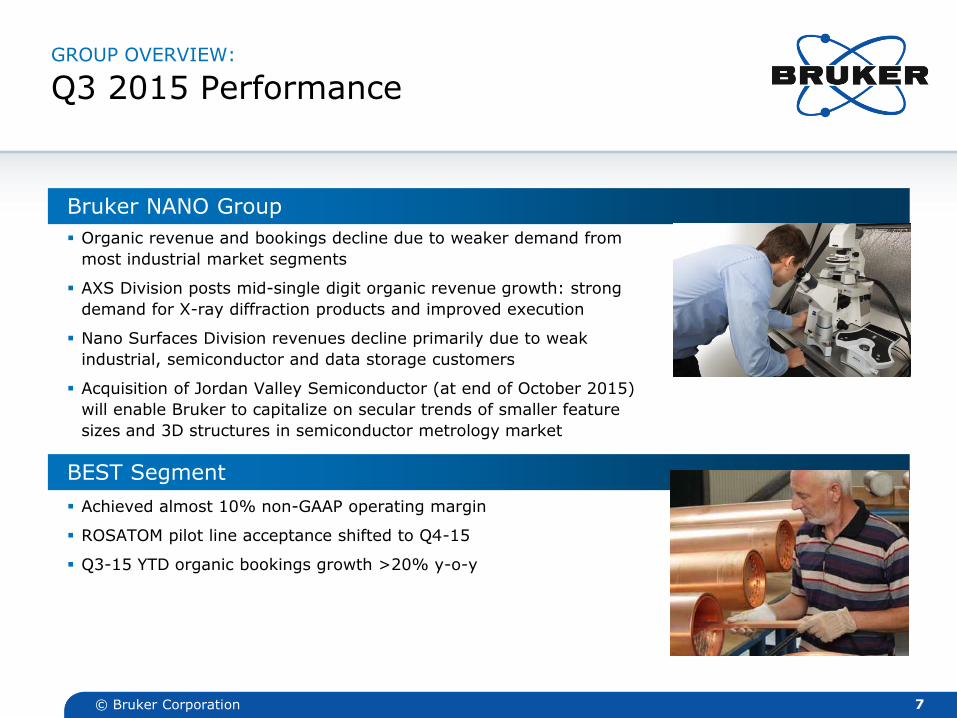
Bruker NANO Group
Organic revenue and bookings decline due to weaker demand from
most industrial market segments
AXS Division posts mid-single digit organic revenue growth: strong
demand for X-ray diffraction products and improved execution
Nano Surfaces Division revenues decline primarily due to weak
industrial, semiconductor and data storage customers
Acquisition of Jordan Valley Semiconductor (at end of October 2015)
will enable Bruker to capitalize on secular trends of smaller feature
sizes and 3D structures in semiconductor metrology market
BEST Segment
Achieved almost 10% non-GAAP operating margin
ROSATOM pilot line acceptance shifted to Q4-15
Q3-15 YTD organic bookings growth >20% y-o-y
GROUP OVERVIEW:
Q3 2015 Performance
7 © Bruker Corporation

8
A9 processor
14nm FinFET
Xeon + FPGA for Data Center
10nm FinFET 3D packaging
Social Media Cloud Computing Wearable/Portable Electronics
V - NAND
3D NAND
Acquisition of Jordan Valley Semiconductor closed enables new Bruker Semiconductor Division to capitalize on semi
trends to 3D features & smaller size nodes for:
© Bruker Corporation

Key Messages after Q3 2015:
© Bruker Corporation 9
Bruker is on track to meet or exceed its FY15 guidance for organic revenue growth, margin expansion and EPS
BIOSPIN Group is recovering after a weak start in H1 2015
CALID Group is successfully driving the adoption of new products and generating higher growth and margins
We are attracting top-notch senior managers and board members

Q3 2015 Financial Update
© Bruker Corporation 10

NON-GAAP FINANCIAL PERFORMANCE:
Q3 2015 Overview
[$ m, except EPS] Q3 2015 Q3 2014 Δ
Revenues 396.1 419.8 -6%
Operating Income 52.8 35.9 47%
Margin (%) 13.3% 8.6%
EPS $0.19 $0.14 36%
Free Cash Flow 44.7 3.6 41.1M
Strong operating margin expansion aided by an easy Q3-14 comparison and absence of CAM results
Strong cash flow generation driven by operational improvements and tax refunds
Working capital ratios continue to improve
11 © Bruker Corporation
COMMENTS
[$ m] Sep 30, 2015 Sep 30, 2014 Δ
Net Cash 160.9 87.1 85%
Working capital (WC)* 633.2 737.2 -14%
WC-to-revenue ratio 0.38 0.40 -0.02
* WC = (Accounts Receivable + Inventory – Accounts Payable)

Q3 2014 Organic Currency Divestitures Q3 2015
$419.8M
$396.1M
Q3 2015 revenue bridge
CALID and BioSpin Group drive organic revenue increase
Strong currency headwinds
12 © Bruker Corporation
Q3 2015 DRIVERS
Q3 2015 Revenue Bridge [$ m]
+$33.2 -$45.8 -$11.1
Organic Currency Divestitures Total
8.1% -10.9% -2.8% -5.6%
Q3 2015 Revenue for Bruker Corp.

Q3 2015 Non-GAAP Results
Gross margin improvement is primarily the result of increased volume, positive product mix, restructuring actions, and the absence of CAM results
Lower operating expenses due to FX translation and absence of CAM results
Higher tax rate is the result of changes in jurisdictional mix, including lower US pre-tax profits
FX headwinds lower EPS by (-$0.02) in Q3-15
13 © Bruker Corporation
COMMENTS [$ m, except EPS] Q3 2015 Q3 2014 Δ
Total Revenues 396.1 419.8 -6%
Gross Profit 182.7 185.5 -2% Margin (% of revenues) 46.1% 44.2%
SG&A -95.6 -107.5 -11%
(% of revenues) 24.1%
25.6%
R&D -34.3 -42.1 -19% (% of revenues) 8.7% 10.0%
Operating Income 52.8 35.9 47%
(% of revenues) 13.3% 8.6%
Tax Rate 32.2% 27.0% 520 bps
Net Income* 31.6 23.8 33%
EPS $0.19 $0.14 36%
Shares Outstanding 168.7 169.6 NM
* Attributable to Bruker Sum of items may not total due to rounding

Q3 2015 Reconciliation of GAAP and
Non-GAAP Results
[$ m, except EPS] Q3 2015 Q3 2014
GAAP Operating Income 28.2 4.9
Restructuring Costs 12.7 16.2
Acquisition-Related Costs 1.2 1.4
Purchased Intangible Amortization 5.1 5.1
Other Costs 5.6 8.3
TOTAL 24.6 31.0
Non-GAAP Operating Income 52.8 35.9
Non-GAAP Interest & Other Income (Expense), net* -4.6 -2.2
Non GAAP Profit* Before Tax 48.2 33.7
Non-GAAP Income Tax Provision -15.5 -9.1
Non-GAAP Tax Rate 32.2% 27.0%
Minority Interest -1.1 -0.8
Non-GAAP Net Income** 31.6 23.8
Non-GAAP EPS $0.19 $0.14
14 © Bruker Corporation
Sum of items may not total due to rounding *Excludes $6.3M of net gains for 2014 **Attributable to Bruker

Q3-14 YTD Organic Currency Divestitures Q3-15 YTD
$1,300.9M
$1,145.6M
Q3-15 YTD revenue bridge
Organic revenue growth of 1.9% driven by CALID Group
Europe is strongest region on YTD basis
15 © Bruker Corporation
Q3-15 YTD DRIVERS
Q3-15 YTD Revenue Bridge [$ m]
+$23.9 -$145.2 -$34.0
Organic Currency Divestitures Total
1.9% -11.1% -2.7% -11.9%
Q3-15 YTD Revenue for Bruker Corp.

Q3-15 YTD Non-GAAP Results
CALID drives most of gross margin improvement
– CAM divestments in 2014 add +64 bps to gross margin
-$67M reduction in opex related to FX translation and absence of CAM results
Non-GAAP operating margin increases by +220 bps
Non-GAAP EPS headwind of (-$0.07) from FX
16 © Bruker Corporation
COMMENTS [$ m, except EPS] Q3-15 YTD Q3-14 YTD Δ
Total Revenues 1,145.6 1,300.9 -12%
Gross Profit 528.2 584.5 -10% Margin (% of revenues) 46.1% 44.9%
SG&A -287.7 -331.2 -13%
(% of revenues) 25.1%
25.5%
R&D -109.0 -132.6 -18% (% of revenues) 9.5% 10.2%
Operating Income 131.5 120.7 9%
(% of revenues) 11.5% 9.3%
Tax Rate 23.9% 28.0% -410 bps
Net Income* 86.6 77.4 12%
EPS $0.51 $0.46 11%
Shares Outstanding 169.1 169.5 NM
* Attributable to Bruker Sum of items may not total due to rounding

Q3-15 YTD Reconciliation of GAAP and
Non-GAAP Results
[$ m, except EPS] Q3-15 YTD Q3-14 YTD
GAAP Operating Income 75.0 60.9
Restructuring Costs 21.2 29.3
Acquisition-Related Costs -1.4 3.0
Purchased Intangible Amortization 15.5 15.1
Other Costs 21.2 12.4
TOTAL 56.5 59.8
Non-GAAP Operating Income 131.5 120.7
Non-GAAP Interest & Other Income (Expense), net* -14.1 -9.7
Non-GAAP Profit* Before Tax 117.4 111.0
Non-GAAP Income Tax Provision -28.1 -31.1
Non-GAAP Tax Rate 23.9% 28.0%
Minority Interest -2.7 -2.5
Non-GAAP Net Income** 86.6 77.4
Non-GAAP EPS $0.51 $0.46
17 © Bruker Corporation
* Excludes $0.2M of net losses for 2015 and $6.6M of net gains for 2014 **Attributable to Bruker
Sum of items may not total due to rounding

Q3-15 Cash Flow Statement
Higher gross margins, lower restructuring costs result in higher net income
Working capital efficiency continues to improve
“Other” increases as a source of cash mostly due to tax refunds and operational improvements
18 © Bruker Corporation
COMMENTS [$ m] Q3 2015 Q3 2014 Δ
Net Income 12.9 6.3 6.6
Depreciation & amortization 13.3 17.6 -4.3
Changes in working capital* -3.0 -16.0 13.0
Other 30.9 5.6 25.3
Operating cash flow 54.1 13.5 40.6
Capital expenditures -9.4 -9.9 0.5
Free cash flow 44.7 3.6 41.1
Full Year 2015 Outlook
© Bruker Corporation 19

Updated FY 2015 Guidance
Organic Revenue Growth Approximately +1%
Non-GAAP Operating Margin Expansion y-o-y
>150 bps
Non-GAAP EPS $0.75 - $0.80
20 © Bruker Corporation
We are increasing our FY-2015 Guidance
Changes in currency reduce revenues by (-10%)
FX generates -13% or (-$0.10) headwind to non-GAAP EPS in 2015
CAM revenues decrease by ~$50M in 2015
FY 2015 tax rate: ~24%-25%
Current currency assumptions: Yen/USD: 120 USD/EUR: 1.12
2015 ASSUMPTIONS

Appendix
© Bruker Corporation 21

Q3 2015 GAAP Results
[$ m, except EPS] Q3 2015 Q3 2014 Δ
Total Revenues 396.1 419.8 -6%
Gross Profit 167.5 167.3 NM
Margin (% of sales) 42.3% 39.9%
SG&A -96.1 -108.0 -11%
(% of revenues) 24.3% 25.7%
R&D -34.3 -42.1 -19%
(% of revenues) 8.7% 10.0%
Operating Income 28.2 4.9 476%
(% of revenues) 7.1% 1.2%
Net Income* 11.8 5.5 115%
EPS $0.07 $0.03 133%
Shares Outstanding 168.7 169.6 NM
22 © Bruker Corporation
* Attributable to Bruker Sum of items may not total due to rounding

Balance sheet
[$ m] Sep 30, 2015 Sep 30, 2014 Dec 31, 2014
Cash, Cash Equivalents & Short-term Investments
532.3 442.3 497.5
Financial Debt 371.4 355.2 355.0
Net Cash 160.9 87.1 142.5
23 © Bruker Corporation
[$ m] Sep 30, 2015 Sep 30, 2014 Dec 31, 2014
Total Assets 1,842.9 1,910.6 1,864.8
Working Capital* 633.2 737.2 694.6
Intangibles, Net & Other Long-Term Assets
224.1 245.9 248.6
* WC = (Accounts Receivable + Inventory - Accounts Payable)

Q3-15 YTD GAAP Results
[$ m, except EPS] Q3-15 YTD Q3-14 YTD Δ
Total Revenues 1,145.6 1,300.9 -12%
Gross Profit 497.1 547.5 -9%
Margin (% of sales) 43.4% 42.1%
SG&A -289.2 -332.5 -13%
(% of revenues) 25.2% 25.6%
R&D -109.0 -132.6 -18%
(% of revenues) 9.5% 10.2%
Operating Income 75.0 60.9 23%
(% of revenues) 6.5% 4.7%
Net Income* 40.2 30.6 31%
EPS $0.24 $0.18 33%
Shares Outstanding 169.1 169.5 NM
24 © Bruker Corporation
* Attributable to Bruker Sum of items may not total due to rounding

Q3-15 YTD Cash Flow Statement
[$ m] Q3-15 YTD Q3-14 YTD Δ
Net Income 42.9 33.1 9.8
Depreciation & amortization 40.0 47.6 -7.6
Changes in working capital* 11.4 2.8 8.6
Other -14.7 -38.5 23.8
Operating cash flow 79.6 45.0 34.6
Capital expenditures -22.8 -26.7 3.9
Free cash flow 56.8 18.3 38.5
25 © Bruker Corporation

Q3-15 GAAP SEGMENT RESULTS:
BSI and BEST GAAP Performance
[$ m] Q3 2015 Q3 2014 Δ
REVENUE
Scientific Instruments (BSI) 366.6 383.4 -4%
Organic Revenue Growth (%) 9.3% -7.1%
Energy & Supercon Technologies (BEST) 32.9 40.0 -18%
Organic Revenue Growth (%) -2.6% 22.6%
Corporate Eliminations -3.4 -3.6
Total Revenue 396.1 419.8 -6%
OPERATING INCOME
Scientific Instruments (BSI) 25.8 0.8 NM
Energy & Supercon Technologies (BEST) 2.5 3.9 -36%
Corporate Eliminations -0.1 0.2
Total Operating Income 28.2 4.9 476%
26 © Bruker Corporation
Sum of items may not total due to rounding