q3 2014 investors resentation 23 october
TRANSCRIPT
1
Q3 Report 2014
Johan Molin President & CEO

Financial highlights Q3 2014
Continued strong development
– Strong growth in Americas and ESD
– Good growth in EMEA and APAC
– Growth in Global Tech
– Investments in front end and R&D
Sales 14,727 MSEK +21%
4% organic, 11% acquired growth, 6% currency
EBIT 2,499 MSEK +20% Currency effect 112 MSEK
EPS 4.72 SEK +19% Underlying tax rate 26%
2

Financial highlights Jan-Sep 2014
A strong first nine month
– US market improving
– Europe divided and Emerging markets slowing
– Good contribution from acquisitions
– Efficiency improvements
Sales 40,996 MSEK +16%
3% organic, 10% acquired growth, 3% currency
EBIT 6,575 MSEK +15% Currency effect 140 MSEK
EPS 12.28 SEK +14% Underlying tax rate 26%
3

Two no#1 product awards ASIS, USA
– HID Mobile Access
– Anti-Ram Perimeter Barrier
New Digital lock for EU knob doors
– BLE operated and virtual keys
Green lock offering drives sales
– Reduces power consumption by 97%
– 55% of commercial buildings LEED equivalent by 2016
Launch of HID Mobile Access
– All smartphones compatible, BLE and NFC
– All Group readers compatible
– Based on Seos triple encryption
– Complete Eco-system
4
Market highlights

5
Group sales in local currencies Jan-Sep 2014
2 +23
36 +27
16 +4
4 +5
1 +18
Share of Group sales 2014 YTD, % Year-to-date vs previous year, %
41 +6
Emerging markets 24% of sales

-15-12-9-6-30369121518212427
28 500
31 500
34 500
37 500
40 500
43 500
46 500
49 500
52 500
55 500
2007 2008 2009 2010 2011 2012 2013 2014Organic Growth Acquired Growth Sales in Fixed Currencies
Sales growth, currency adjusted
6
2014 Q3 +15%
Organic +4%
Acquired +11%
Sales MSEK Growth, %

Operating income (EBIT*), MSEK
4 500
5 000
5 500
6 000
6 500
7 000
7 500
8 000
8 500
9 000
900
1 100
1 300
1 500
1 700
1 900
2 100
2 300
2 500
2 700
2007 2008 2009 2010 2011 2012 2013 2014Quarter Rolling 12-months
Quarter 12-months
Run rate 8,777 MSEK (7,752) +13%
7

12,0
13,0
14,0
15,0
16,0
17,0
2007 2008 2009 2010 2011 2012 2013 2014Quarter Rolling 12-months
2014 Dilution Q3 -0.3% 2014 FC -0.3%
Operating margin (EBIT), %
Run rate 2014 16.2% (16.3)
Long term target range (average)
8
EBIT Margin

Manufacturing footprint
9
Status manufacturing footprint programs 2006-2013:
– 61 factories closed to date, 19 to go
– 74 factories converted to assembly, 15 to go
– 29 offices closed, 18 to go
Personal reduction QTD 237p and total 8,955p
1,029p in further planned reductions
1,063 MSEK of the provision remains for all programs

Margin highlights Q3 2014
EBIT margin 17.0% (17.2) -0.2%
+ Volume increase 3%, price 1%
+ Margin decrease -0.2%
+ Organic growth
+ Manufacturing footprint
- Investments in front end and R&D
- Acquisitions -0.3%
10

Acquisitions 2014
Fully active pipeline
12 acquisitions done in 2014
Annualized sales 1,700 MSEK
Added sales 3,5%
11

Jiawei, China
12
Turnover of 500 MSEK with 920 employees
One of the leading security locks companies in China
Broadens our presence in the OEM channel and gives access to distribution
Accretive to EPS

Turvaykköset, Finland
13
Turnover of 200 MSEK with 110 employees
The second largest locksmith in Finland
Good geographical coverage
Adds project and specification focus
At arms length
Dilutive to EPS

Division - EMEA
Strong growth in Scandinavia, Germany, Africa and Eastern Europe
Good growth in Finland, UK and growth in Iberia and Israel
Slightly negative in Benelux, France and negative in Italy
Investment in new sales people and R&D
Operating margin (EBIT)
+ Organic 3%
= Savings offset by sales and R&D
- Dilution & Currency (-0.4%)
SALES
share of
Group total %
24
14
13
14
15
16
17
18
19
2009 2010 2011 2012 2013 2014
EBIT %

Division - Americas
Strong growth in Doors, Residential, Mexico and South America
Growth in AHW, Elmech and High Security
Continued slight decline in Canada
Investment in R&D and spec salesmen
Strong quoting activity
Operating margin (EBIT)
+ Organic 5%
+ Strong leverage
+ Currency & Accretion (0.2%)
16
SALES
share of
Group total %
22
18
19
20
21
22
23
2009 2010 2011 2012 2013 2014
EBIT %

Division - Asia Pacific
Strong growth in Australia, New Zeeland and SEA
Good growth in Korea
Growth in China
Cost inflation in China
Intensified work on automation and efficiency in China
Operating margin (EBIT)
+ Organic 3%
+ Efficiency in China
- Cost pressure in China
+ Currency & Dilution (0.2%)
15
18
SALES
share of
Group total %
5
7
9
11
13
15
17
2009 2010 2011 2012 2013 2014
EBIT %

Division - Global Technologies
HID
– Strong growth in Gov-ID and Lumidigm
– Growth in IAM (Identity and access management) and IDT (Inlay business)
– Strong decline in Project sales
– Consolidation of North American operations to Austin
Hospitality
– Strong growth
– Strong profit development
Operating margin (EBIT)
+ Organic 2%
+ Positive sales mix
- Currency & Dilution (-0.2%)
13
20
SALES
share of
Group total %
13
14
15
16
17
18
19
20
2009 2010 2011 2012 2013 2014
EBIT %

Division - Entrance Systems Strong growth in Amarr, 4Front, Door Automatics,
High Speed Doors and Flexiforce
Good growth in Ditec and Growth in EU Industrial doors
Negative in EU Residential doors
High price pressure in EU on Industrial and Residential doors
Operating margin (EBIT)
+ Organic 5%
+ Efficiency improvement
- Price pressure in EU
- Dilution (-1.1%)
26
22
SALES
share of
Group total %
11
12
13
14
15
16
17
18
2009 2010 2011 2012 2013 2014
EBIT %

24
Q3 Report 2014
Carolina Dybeck Happe CFO

Financial highlights Q3 2014
MSEK 2013 2014 Change 2013 2014 Change
Sales 12,131 14,727 +21% 35,239 40,996 +16%
Whereof
Organic growth +4% +3%
Acquired growth +11% +10%
FX-differences +690 +6% +1,009 +3%
Operating income (EBIT) 2,090 2,499 +20% 5,722 6,575 +15%
EBIT-margin (%) ) 17.2 17.0 16.2 16.0
Operating cash flow 2,175 2,249 +3% 4,262 4,769 +12%
EPS (SEK) 3.98 4.72 +19% 10,76 12.28 +14%
3rd Quarter Nine months
25

Bridge Analysis – Jul-Sep 2014
MSEK 2013
Jul-Sep
Organic Currency Acq/Div 2014
Jul-Sep
4% 6% 11% 21%
Revenues 12,131 504 690 1,402 14,727
EBIT 2,090 106 112 192 2,499
% 17.2% 21.0% 16.2% 13.7% 17.0%
Dilution / Accretion 0.1% 0.0% -0.3%
26
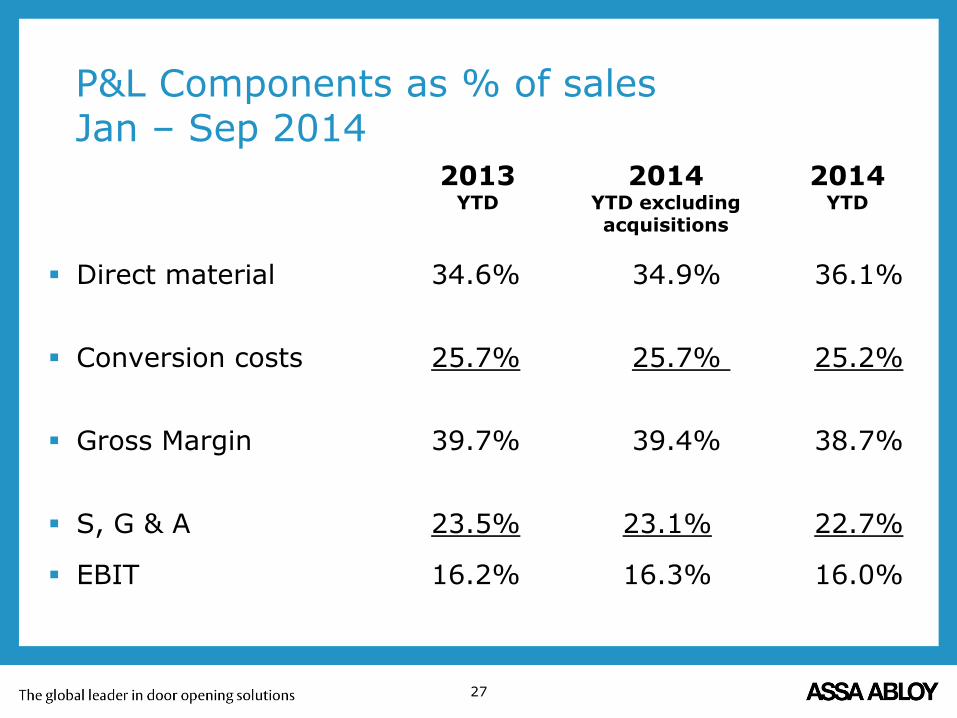
P&L Components as % of sales Jan – Sep 2014
Direct material 34.6% 34.9% 36.1%
Conversion costs 25.7% 25.7% 25.2%
Gross Margin 39.7% 39.4% 38.7%
S, G & A 23.5% 23.1% 22.7%
EBIT 16.2% 16.3% 16.0%
2014 YTD excluding acquisitions
2013 YTD
2014 YTD
27

Operating cash flow, MSEK
3 500
4 000
4 500
5 000
5 500
6 000
6 500
7 000
7 500
8 000
8 500
0
500
1 000
1 500
2 000
2 500
3 000
3 500
2007 2008 2009 2010 2011 2012 2013 2014
Quarter Cash Rolling 12-months EBT Rolling 12 months
28
Quarter 12 months

Gearing % and net debt MSEK
0
20
40
60
80
100
120
0
5 000
10 000
15 000
20 000
25 000
30 000
2007 2008 2009 2010 2011 2012 2013 2014
Net debt Gearing
Debt/Equity 68 (63)
Net debt/EBITDA 2.3 (2.0)
29
Net Debt Gearing
*) 2007-2011 Not restated for changed pension accounting principles.

Earnings per share, SEK
8,00
9,00
10,00
11,00
12,00
13,00
14,00
15,00
16,00
17,00
0,00
0,50
1,00
1,50
2,00
2,50
3,00
3,50
4,00
4,50
5,00
2007 2008 2009 2010 2011 2012 2013 2014
Quarter Rolling 12-months
Quarter SEK 12-months
30
Excluding restructuring costs of 1,000 MSEK in Q4 and full year 2013. 2007-2011 Not restated for changed pension accounting principles.
2014 YTD EPS +14%

31
Q3 Report 2014
Johan Molin President & CEO

Conclusions Q3 2014
Strong growth by 21% with 4% organic
– US market improving
– Europe divided
– Emerging markets slowing
Efficiency improvements supports profit
Investments in front end and R&D
Strong EBIT improvement of 20% to 2,499 MSEK
32

33
Q&A