q3 2015 investors presentation 20 october 2015
TRANSCRIPT
ASSA ABLOY is the global leader in door opening solutions, dedicated to satisfying end-user needs for security, safety and convenience
Q3 Report 2015 Johan Molin President and CEO

Financial highlights Q3 2015
Continued positive development – Strong growth in Americas, EMEA and Entrance – Flat in Global tech – Negative in APAC due to weak Chinese market
Sales 17,465 MSEK +19% 3% organic, 4% acquired growth, 12% currency
EBIT 2,970 MSEK +19% Currency effect 238 MSEK
EPS 1.86 SEK +18% Underlying tax rate 26%
2

Financial highlights Jan-Sept 2015
A strong year – Strong growth in Americas, Global Tech and Entrance – Good growth in EMEA – Negative growth in APAC due to China
Sales 49,799 MSEK +21% 4% organic, 3% acquired growth, 14% currency
EBIT 8,041 MSEK +22% Currency effect 789 MSEK
EPS 5.02 SEK +23% Underlying tax rate 26%
3

4
Market highlights Multiple innovation awards at ASIS
– Quantum Secure Predictive security, – Active ID Tap – Aperio cabinet lock for data servers – Ecopower supply, EcoFlex electrified mortise Lock
US Green Card program – Contract of 88 MUSD over five-year period
Accentra, solution for multi family-housing – Comprehensive cloud-based el-mech solution
– Access from anywhere and real-time trace and tracking
Google’s NEST partners with Yale

Google’s NEST partners with Yale
Seamlessly connected to Google’s NEST
Passcodes for family, friends & visitors
Cloud based and managed through apps
Real time track and trace
5

6
Group sales in local currencies Jan-Sep 2015
2 +24
39 +7 17 +9
4 +7
1 +8
Share of Group sales 2015 YTD, % Year-to-date vs previous year, %
37 +5
Emerging markets 25% (24) of sales
-15-12-9-6-30369121518212427
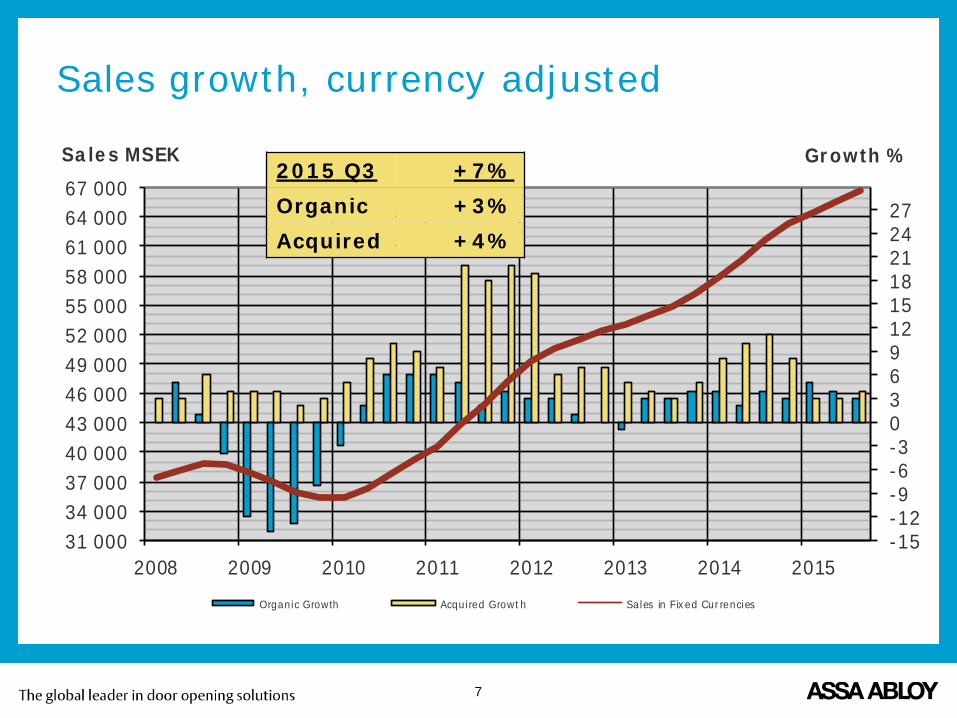
31 00034 00037 00040 00043 00046 00049 00052 00055 00058 00061 00064 00067 000
2008 2009 2010 2011 2012 2013 2014 2015
Growth %Sales MSEK
Organic Growth Acquired Growth Sales in Fixed Currencies
Sales growth, currency adjusted
7
2015 Q3 +7% Organic +3% Acquired +4%

Operating income (EBIT), MSEK
4 5005 0005 5006 0006 5007 0007 5008 0008 5009 0009 50010 00010 50011 000
1 000
1 200
1 400
1 600
1 800
2 000
2 200
2 400
2 600
2 800
3 000
2008 2009 2010 2011 2012 2013 2014 2015
12-monthsQuarter
Quarter Rolling 12-months
Run rate 10,722 MSEK (8,777) +22%
8

12
13
14
15
16
17
2008 2009 2010 2011 2012 2013 2014 2015
EBIT Margin
Quarter Rolling 12-months2015 Acquisitions Currency
Q3 -0.1% -0.3% 2015 -0.1% -0.3%
Operating margin, %
Run rate 2015 16.3% (16.2)
9

Manufacturing footprint
10
Status manufacturing footprint programs 2006-2013: – 72 factories closed to date, 6 to go – 84 factories converted to assembly, 25 to go – 39 offices closed, 10 to go
Total personnel reduction in Q3: – 510 FTE and total 10,269 FTE
1,000 FTE to go for all programs
711 MSEK of the provision remains for all programs
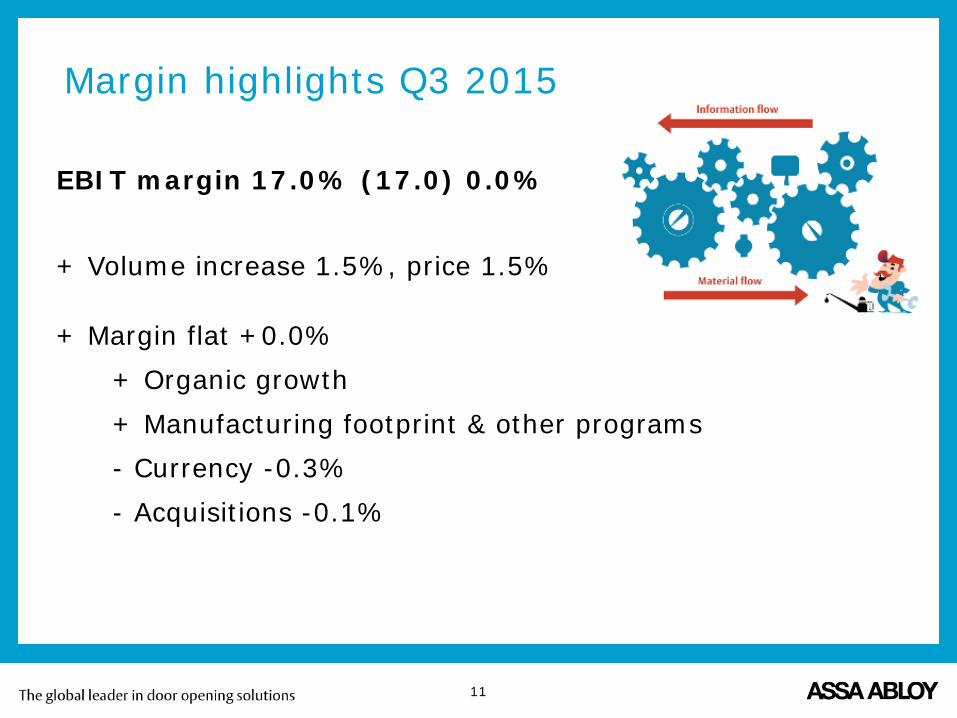
Margin highlights Q3 2015
EBIT margin 17.0% (17.0) 0.0%
+ Volume increase 1.5%, price 1.5%
+ Margin flat +0.0% + Organic growth + Manufacturing footprint & other programs - Currency -0.3% - Acquisitions -0.1%
11
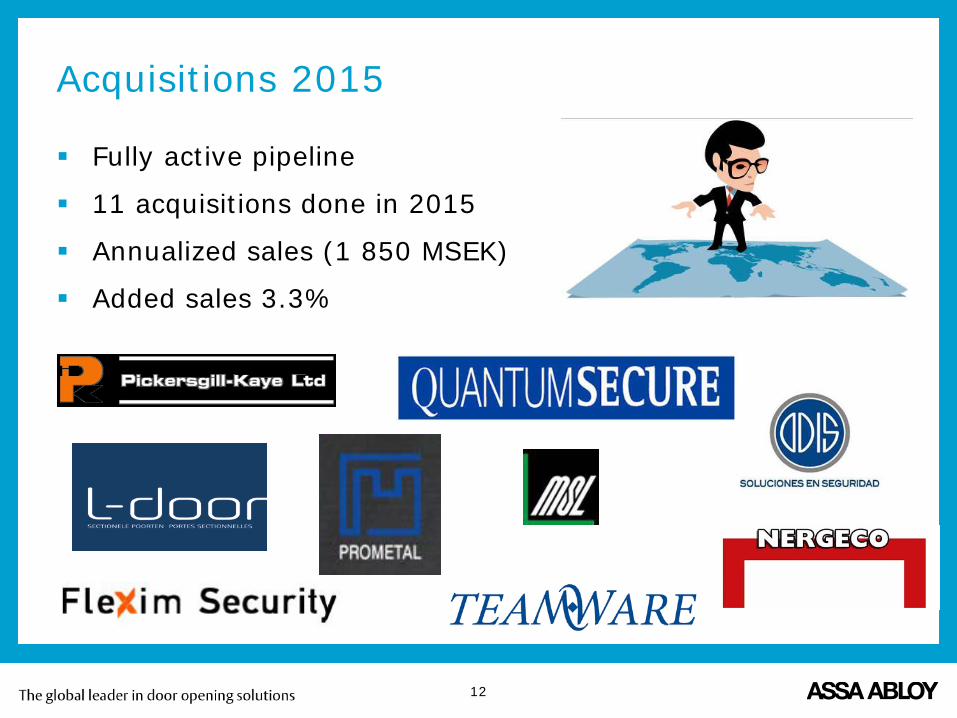
Acquisitions 2015
Fully active pipeline
11 acquisitions done in 2015
Annualized sales (1 850 MSEK)
Added sales 3.3%
12

Nergeco, France
13
Turnover of 350 MSEK with 150 employees
High-speed door company, with complementary products
Market leader in Southern Europe
Strengthens service offering
Accretive to EPS

23%
SALES share of
Group total %
Division – EMEA
Continues strong growth in Scandinavia, Finland and Eastern Europe
Good growth in Africa, Italy, Iberia and Israel
Growth in UK
Negative in Benelux and France
Price increases implemented
Operating margin (EBIT) + Organic +5%
+ Savings & efficiency
- Dilution from acq -0.3%
14
13141516171819
2010 2011 2012 2013 2014 2015
EBIT %

Division - Americas
Strong growth in AHW, Elmech, Canada, Mexico and South America
Good growth in Residential
Flat in Doors
Slightly negative in High security
Operating margin (EBIT)
+ Organic +6%
+ Efficiency
- Dilution from acq -0.3%
16
20
18
19
20
21
22
23
2010 2011 2012 2013 2014 2015
EBIT %
23%
SALES share of
Group total %

Division - Asia Pacific
Strong growth in New Zealand, South Asia and North Asia
Growth in Australia
Continued decline in China – Efficiency measures mitigate profit pressure
Operating margin (EBIT) - Organic -3%
+ Personnel reduction in China -9%
+ Positive sales mix
+ Currency and acq +0.2%
14
18
8
10
12
14
16
18
2010 2011 2012 2013 2014 2015
EBIT %
16%
SALES share of
Group total %

Division - Global Technologies
HID – Strong growth in IDT (inlays) and Quantum secure
– Good growth in PACS, SI and IDA
– Flat in Project sales
– Strong decline in Gov-Id and BIO solutions
Hospitality – Strong growth
– Strong profit
Operating margin (EBIT) - Organic 0%
- Negative mix
- Dilution from acq -0.6%
13
20
1415161718192021
2010 2011 2012 2013 2014 2015
EBIT %
12%
SALES share of
Group total %

Division - Entrance Systems Strong growth in Industrial EU, High Speed Doors and
4Front
Good growth in Amarr
Growth in Door automatics and Flexiforce
Flat in Ditec and Residential EU
Strongly improving efficiency
Operating margin (EBIT) + Organic +6%
+ Consolidation effects
- Dilution from acq -0.1%
28
22
1112131415161718
2010 2011 2012 2013 2014 2015
EBIT %
26%
SALES share of
Group total %
ASSA ABLOY is the global leader in door opening solutions, dedicated to satisfying end-user needs for security, safety and convenience
Q3 Report 2015 Carolina Dybeck Happe CFO
ASSA ABLOY is the global leader in door opening solutions, dedicated to satisfying end-user needs for security, safety and convenience

Financial highlights Q3 2015
MSEK 2014 2015 Change 2014 2015 Change
Sales 14,727 17,465 +19% 40,996 49,799 +21% Whereof Organic growth +3% +4% Acquired growth +4% +3% FX-differences +1,661 +12% +5,561 +14% Operating income (EBIT) 2,499 2,970 +19% 6,575 8,041 +22% EBIT-margin (%) 17.0 17.0 16.0 16.1 Operating cash flow 2,249 2,816 +25% 4,769 5,327 +12% EPS (SEK) 1.57 1.86 +18% 4.09 5.02 +23%
3rd Quarter Nine months
25

Bridge Analysis – Jul-Sep 2015
MSEK 2014
Jul-Sep
Organic Currency Acq/Div 2015
Jul-Sep
3% 12% 4% 19%
Sales 14,727 471 1,661 606 17,465
EBIT 2,499 152 238 81 2,970
% 17.0% 32.2% 14.3% 13.3% 17.0%
Dilution / Accretion 0.4% -0.3% -0.1%
26
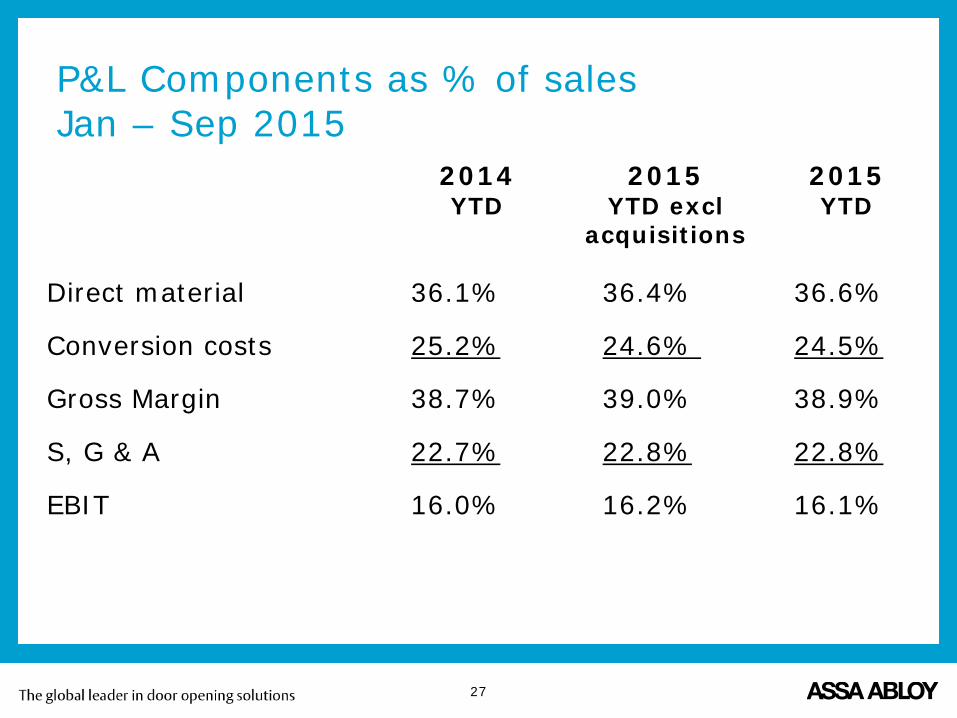
P&L Components as % of sales Jan – Sep 2015
Direct material 36.1% 36.4% 36.6%
Conversion costs 25.2% 24.6% 24.5%
Gross Margin 38.7% 39.0% 38.9%
S, G & A 22.7% 22.8% 22.8%
EBIT 16.0% 16.2% 16.1%
2015 YTD excl
acquisitions
2014 YTD
2015 YTD
27
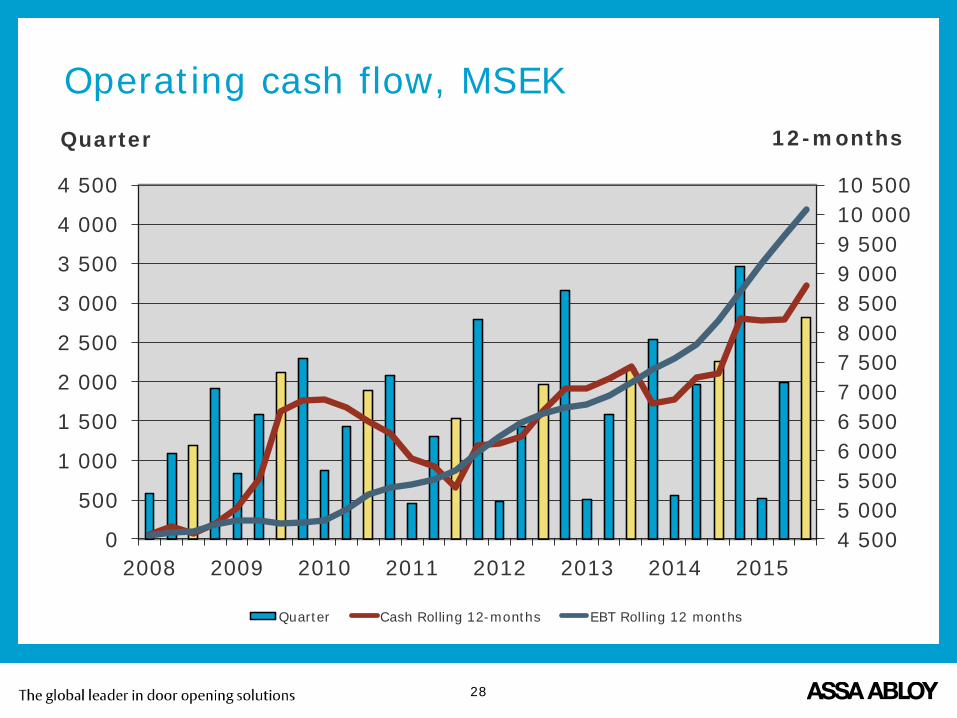
Operating cash flow, MSEK
4 5005 0005 5006 0006 5007 0007 5008 0008 5009 0009 50010 00010 500
0
500
1 000
1 500
2 000
2 500
3 000
3 500
4 000
4 500
2008 2009 2010 2011 2012 2013 2014 2015
12-monthsQuarter
Quarter Cash Rolling 12-months EBT Rolling 12 months
28

Gearing % and net debt MSEK
0
20
40
60
80
100
120
0
5 000
10 000
15 000
20 000
25 000
30 000
2008 2009 2010 2011 2012 2013 2014 2015
GearingNet Debt
Net debt Gearing
Debt/Equity 63 (68)
Net debt/EBITDA 2.1 (2.3)
29
*) 2008-2011 Not restated for changed pension accounting principles.

Earnings per share, SEK
2,002,503,003,504,004,505,005,506,006,507,00
0,40
0,60
0,80
1,00
1,20
1,40
1,60
1,80
2,00
2008 2009 2010 2011 2012 2013 2014 2015
12-monthsQuarter SEK
Quarter Rolling 12-months
30
Restated for Stock split 3:1 2015.
Stock split 2015 3:1

ASSA ABLOY is the global leader in door opening solutions, dedicated to satisfying end-user needs for security, safety and convenience
Q3 Report 2015 Johan Molin President and CEO

Conclusions Q3 2015
Strong growth by 19% with 3% organic
Emerging markets 25% (24) Strong EBIT +19% Strong EPS +18% Strong Cash flow +25%
32

ASSA ABLOY is the global leader in door opening solutions, dedicated to satisfying end-user needs for security, safety and convenience
Q&A
