q3 2017 quarterly report: wilderhill clean energy index ... q3 eco quarterly report.pdf · rose...
TRANSCRIPT

Q3 2017 Quarterly Report: WilderHill Clean Energy Index®, Sept. 30, 2017 For 3rd Quarter 2017 the Clean Energy Index® (ECO) began near 45 and ended near 49 for a Quarterly gain of roughly +8%, while ECO in 2017 is also up now by +28% year to date (YTD); such increases are likely not sustainable and are much more than broader market indices. Look farther back say over some 4 years, from the start of 2014 and clean energy’s theme & so the ECO Index® first gained in 2014 but then fell and didn’t re-test highs that year with declines only broken by an upturn late 2015; clean energy fell Q1/Q2 2016, went sideways Q3/Q4 and has risen (so far) 2017 to Q3 - for a clean energy theme that can drop very hard (or rise) at times while carrying much risk. Yet it must also be said ‘dirty’ fossil fuels have fallen far harder over say the last 5 years than ECO. Oil, coal & natural gas all have dropped much farther than clean energy for instance over these past five years. Quite different is the Progressive Energy Index® (WHPRO) that generally excludes solar, wind & renewables: the differing WHPRO theme is instead about reducing CO2 & pollutants from - and getting greater efficiencies in fossil fuels and dominant energy today. Last year WHPRO gained strongly in 2016 going up near +40% over a year when ECO declined; in the more recent 1st – 3rd Quarters of 2017, however, it’s been ECO that did ‘better’. A result again is that WHPRO can often move very unlike the ECO theme (that ‘can and does at times drop like a rock’); meanwhile WHPRO is different too from fossil fuel indexes. For WilderHill® New Energy Global Innovation Index (NEX) capturing new energy worldwide mostly outside the U.S., it slightly ‘underperformed’ ECO early in 2017 – and by Q3 often was nearer. Over say the last 5 years however we observe NEX has done ‘best’ of the three WilderHill Indexes up some +60%, while ECO is up near +10%, Progressive is about nil this period. Yet despite ECO only modestly up there – the fossil fuels are down sizably last five years as will be seen in Charts below with big declines of some -30% to -70%. In other unrelated matters during Q3, a brief OpEd co-authored by 2 members of the ECO Advisory Committee appeared in an online Yale publication reflecting some personal views on climate risk & possible sea level rise. In a minor administrative point the NEX is now a Partnership of 2 entities starting Q4 2017: Josh Landess of First Energy Research, & Dr. Rob Wilder of WilderHill – for jointly WilderHill New Energy Finance (WHNEF) which owns NEX. Returning to clean energy’s theme, here next is a Chart for ECO Q3 showing some ongoing up momentum again in 3rd Quarter. Doubtless however strong gains seen so far in 2017 very easily could go into reverse ahead, if recent bullishness here becomes pessimism:
Source: bigcharts.com
1

For a longer period we step-back as usual for what is now roughly ~10 years from about 2006 to mid-2017, in a chart below. Included are fossil fuels and most dramatic is Natural Gas (green) crashing down by ~90%! So we see once again starting from lowest at bottom the Natural Gas tracker, green. Just above it is a tracker for Solar, blue also far down - although rising of late. 3rd up from bottom is an Oil tracker, red that’s also fallen hard. Hence natural gas, oil, and solar are all well down, strikingly over the past ~10 years. Above those as seen several years now are 3 other clumping themes: first is an active fund in dark red for alternative energy (showing a long while it’s pretty hard for an active-fund to beat an Index); just above that is ECO Index via an independent tracker, bold: it along with 2 others are well down yet all 3 are ‘doing better’ (down less) than Natural Gas, Oil, and Solar. Next up here is Coal that once had been badly trailing; its tracker again in blue, rose strongly however in 2016+2017 on a new Administration & greater coal exports despite coal facing some unfavorable economics domestically. Among all these 6 themes then, coal here is ‘slightly best of late’ - but that’s only after its very big earlier falls. Above those 6 after some gap is global NEX via tracker, brown. Then well above them all, here at ‘top’ is WilderHill Progressive (WHPRO via PUW, orange) for lower CO2 & improving efficiency in major energy today. It ends here near nil, only theme near ‘up’ if starting so early – note however that most trackers don’t begin so far back as ~10 years ago:
Source: bigcharts.com
In these energy themes above all (but for Progressive) are far down due to an energy crash. Yet there’s many unique stories. Take solar: installations growth has been dramatic here, along with a crash in pricing power and awful profit margins as manufacturing capacity has exploded in Asia. Now a question is how the U.S. may erect trade barriers as a result of a unanimous (4-0) Sec. 201 finding by the U.S. International Trade Commission of ongoing solar product dumping. Such recent finding is causing some solar stocks to decline globally. Hence a coming remedy recommendation is causing freshening attention to this solar sub-sector, in anticipation of a new round of trade barriers being erected in the U.S. That said internal solar demand within China has become so strong, impacts may be muted. Next and unrelated, but also in Q3 was a Solar Eclipse on August 21st that shined a light on how future eclipses may impact Solar given a dip in output. Measured here that eclipse peaked 10:10 AM Pacific as seen in 2 charts below measuring our own rooftop solar PV – for a past 1 day and a past week. The remarkable drop in Solar Irradiance (sunshine) is shown at 9:30 am – nadir at 10 am, then rebounding quickly. Similarly Panel Temperatures (in C) are seen to drop too but here in somewhat more lagging fashion – afterwards resuming again swiftly a normal morning rise this bright and clear sky on the day of Eclipse:
2

For the 1 Day of the Eclipse:
5 days, with Eclipse on the Last Day: This very same remarkable drop can be seen rather prominently as happening on the last day in this Chart for the week in August 2017:
--------- Lastly back on point and returning to Clean Energy / Progressive themes for ECO & WHPRO - looking here say, late in Q3 we see here how constituents in ECO & WHPRO fared over say, their past 52-weeks. Here’s next a page for ECO components – and then for WHPRO. Consider on the next page ECO individual component ranges a past Year for relative Lows, Highs or somewhere in between up to September 9, 2017; we see Top Performers for ECO are in very diverse themes, including in fuel cells (BLDP rising too on new fuel cell design needing less precious metals), in the lithium mining needed for batteries (SQM), in solar (JASO), in Organic LEDs / lighting (OLED), and renewables Utility-scale (GLBL). Likewise WHPRO’s top names are also diverse on the following page, there in power transmission, in lithium, in efficiency / heating, in electricity generation, and building efficiency. “Worst’ performers in ECO near 52-week lows were also diverse, and in less-polluting water-based battery recycling (AQMS, though after a steep run-up), in LEDs/ lighting (LYTS), in electrical transmission (MYRG), in global solar parks (SKYS), and in thin film manufacturing (VECO). WHPRO’s lows by contrast, were Not at all diverse, clumping around natural gas where declining global prices have hit producers very hard. But first, here’s ECO:
3
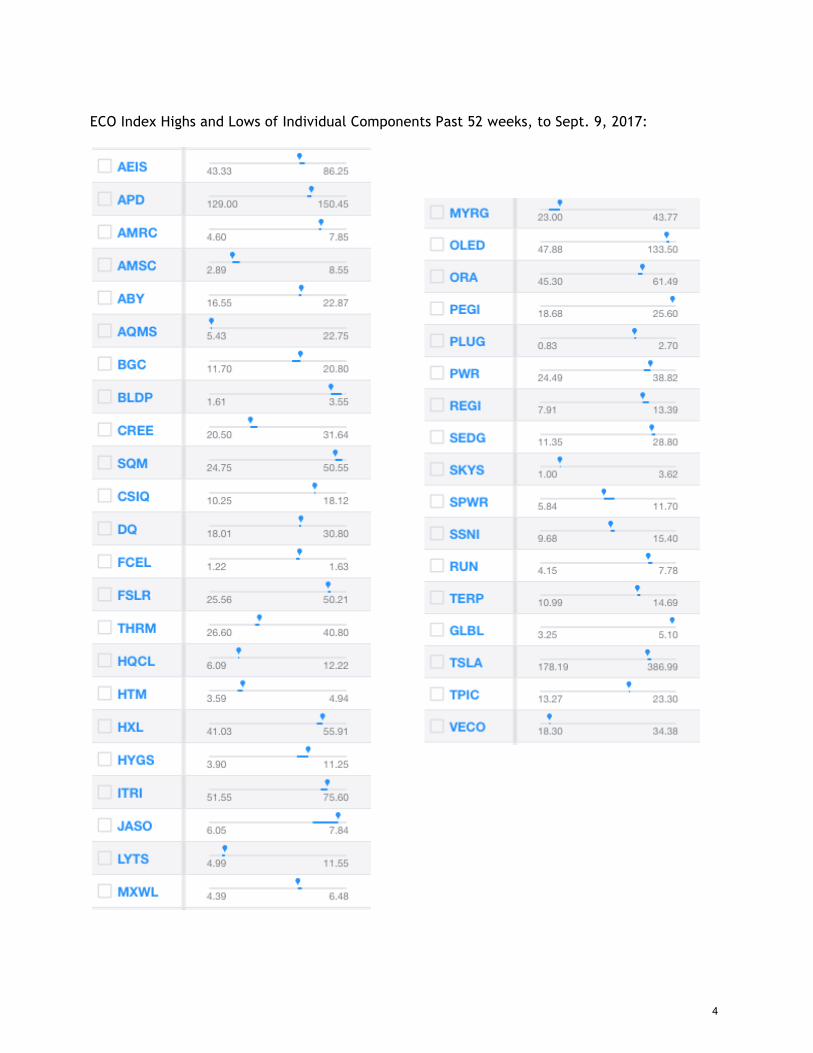
ECO Index Highs and Lows of Individual Components Past 52 weeks, to Sept. 9, 2017:
4

WHPRO Index Highs / Lows of Individual Components Past 52 weeks to Sept. 9, 2017 (*CPN, HASI not displayed below):
We see above WHPRO top performers are in diverse areas of: power transmission (AIMC), lithium (ALB), energy efficiency / heating (AOS), electricity generation (AGR; these 1st 4 all ‘A’s), and in building energy efficiency. Much less-diverse bottom performers included in biofuels (ANDE), natural gas (CHK), natural gas as a vehicle fuel (CLNE), liquefied natural gas (GLNG), filtration (LDL, though was much more-broadly rising), and again in natural gas (both RRC & SWN).
5
------------------ Conclusion: For 3rd Quarter 2017 the Clean Energy Index® (ECO) began near 45 and ended near 49 for a Quarterly gain of roughly +8%, with ECO in 2017 also up now by +28% year to date (YTD); such increases are likely not sustainable and are much more than broader market indices. Look farther back say over some 4 years, from the start of 2014 and clean energy’s theme & so the ECO Index® first gained in 2014 but then fell and didn’t re-test highs that year with declines only broken by an upturn late 2015; clean energy fell Q1/Q2 2016, went sideways Q3/Q4 and has risen (so far) 2017 to Q3 - for a clean energy theme that can drop very hard (or rise) at times while carrying much risk. Yet it must also be said ‘dirty’ fossil fuels have fallen far harder over say the last 5 years than ECO. Oil, coal & natural gas all have dropped much farther than clean energy for instance over these past five years. Progressive WHPRO is mainly sideways so far YTD. NEX capturing new energy worldwide ‘underperformed’ ECO for this YTD – yet it well outperformed WHPRO. However over say the last 5 years the NEX global basket has done ‘best’ of the three WilderHill Indexes up near +60%, while ECO is up near +10%, and Progressive nil here. Yet despite ECO & WHPRO being slightly up or even nil this period – the traditional fossil fuels are significantly down the last 5 years as seen with their big declines of some -30% to -70% that period. Lastly 2 constituents were deleted from ECO to start Q4 2017, GLBL & SSNI, and there were no additions. At the-much-differently themed WilderHill Progressive Energy Index (WHPRO) there was one deletion of CPN to start Q4; there were no additions. As always we welcome your thoughts and suggestions. Sincerely,
Dr. Rob Wilder [email protected]
Disclaimer: The following is a reminder from the friendly folks at Clean Energy Index® who worry about liability. Performance figures quoted represent past performance only, and are no guarantee of future results. Views expressed are those of just one of the managers of this WilderHill® Index. Views are not meant as investment advice and should not be considered as predictive in nature. Any descriptions of a holding, applies only as of September 30, 2017. Positions in the ECO Index® can and do change thereafter. Discussions of historical performance do not guarantee and are not indicative of future performance. The Index covers a highly volatile sector & is highly volatile too, always subject to well above-average changes in its valuation. WilderHill Clean Energy Index® (ECO) is published and owned by WilderShares® LLC. No financial instruments or products based on this Index are sponsored or sold by WilderShares LLC, and Wildershares® LLC makes no representation regarding advisability of investing in such product(s). Marks to WilderHill@, to the Clean Energy Index®, to the ECO Index®, to WilderShares®, and to the Progressive Energy Index® are all registered and each one is exclusive property; all rights reserved. -----------------------
6

----- Appendix I: ECO Index (via independent tracker PBW) Descending Weights & Components late-Q3 on 9/13/2017, or about ~2 weeks before rebalance to start Q4 2017. 40 stocks: Name HoldingsTicker WeightSociedadQuimicaMineraChile SQM 4.132DaqoNewEnergyCorpADR DQ 3.751JASolarHoldingsCoLtdADR JASO 3.612FirstSolarInc FSLR 3.352GeneralCableCorp BGC 3.236QuantaServicesInc PWR 3.191SilverSpringNetworksInc SSNI 3.183UniversalDisplayCorp OLED 3.178BallardPowerSystemsInc BLDP 3.168SolarEdgeTechnologiesInc SEDG 3.147TPICompositesInc TPIC 3.085CanadianSolarInc CSIQ 2.995HexcelCorp HXL 2.984ItronInc ITRI 2.941TerraFormPowerInc TERP 2.902AmerescoInc AMRC 2.879HanwhaQCELLSCoLtdADR HQCL 2.854AirProducts&ChemicalsInc APD 2.728AdvancedEnergyIndustriesInc AEIS 2.712OrmatTechnologiesInc ORA 2.696PatternEnergyGroupInc PEGI 2.653SunrunInc RUN 2.642SunPowerCorp SPWR 2.641MaxwellTechnologiesInc MXWL 2.639RenewableEnergyGroupInc REGI 2.607TeslaInc TSLA 2.545AtlanticaYieldplc ABY 2.488TerraFormGlobalInc GLBL 2.471MYRGroupInc MYRG 2.457PlugPowerInc PLUG 2.456CreeInc CREE 2.408GenthermInc THRM 2.066VeecoInstrumentsInc VECO 1.772LSIIndustriesInc LYTS 1.614AquaMetalsInc AQMS 1.465
7

FuelCellEnergyInc FCEL 0.556SkySolarHoldingsLtdADR SKYS 0.515USGeothermalInc HTM 0.465AmericanSuperconductor AMSC 0.412HydrogenicsCorp HYGS 0.401
------ ECO Index Year to Date to September 15, 2017
Source: Bigcharts.com ----------------
8
------- Appendix II, ECO Index for Start of the New Quarter: NDEX (ECO) SECTOR & STOCK WEIGHTS FOR START OF Q4 2017. 38 STOCKS. Each stock freely floats according to its share price after rebalance. *Stocks below $200 million in size at rebalance are *banded with a 0.5% weight. Renewable Energy Harvesting - 31% weight (9 stocks @3.38% each; plus 1 *banded) Canadian Solar, CSIQ. Solar, vertically integrated solar manufacturer, China. Daqo New Energy, DQ. Solar, polysilicon/wafer manufacturer; China-based. First Solar, FSLR. Thin film solar, CdTe a low-cost alternate to polysilicon. Hanwha Q Cells, HQCL. Solar, integrated from poly through modules. Hexcel, HXL. Light composites, in wind blades & spars, aerospace, vehicles. JA Solar, JASO. Solar, China-based sells PV modules in Asia, Europe, U.S. Ormat, ORA. Geothermal, works too in areas of recovered heat energy. SunPower, SPWR. Solar, efficient PV panels have all-rear-contact cells. TPI Composites, TPIC. Wind Blades; also light-weighting for transportation. *U.S. Geothermal, HTM. Geothermal, operating & development-stage sites. Power Delivery & Conservation - 20% sector weight (6 stocks @3.25%; +1 *banded) Ameresco, AMRC. Energy saving performance contracts, also in renewables. *American Superconductor, AMSC. Wind, grid conditioning; superconductors. General Cable, BGC. Power grid innovation, includes high-voltage offshore wind. Itron, ITRI. Meters, utility energy monitoring, measurement & management. MYR Group, MYRG. Transmission and Distribution, includes solar & wind farms. Quanta Services, PWR. Infrastructure, modernizing grid & power transmission. Universal Display, OLED. Organic light emitting diodes, efficient displays. Energy Conversion - 23% sector weight (7 stocks @3.14% each; +2 *banded) Advanced Energy, AEIS. Power conditioning: inverters, thin film deposition. Ballard Power, BLDP. Mid-size fuel cells; R&D, PEM FCs as in transportation. Cree, CREE. LEDs, manufacturer in power-saving lumens, efficient lighting. *FuelCell Energy, FCEL. Large fuel cells, high-operating temps, multiple-fuels. Gentherm, THRM. Thermoelectrics, waste heat to energy, power harvesting. *LSI Industries, LYTS. Lighting, LEDs, is vertically integrated U.S. manufacturer. Plug Power, PLUG. Small fuel cells, for e.g. forklifts; drop in replacements. SolarEdge Technologies, SEDG. Inverters: makes solar optimizers, inverters. Veeco, VECO. Thin film equipment, for LEDs, energy efficient electronics. Greener Utilities – 13% sector weight (4 stocks @3.12% each; +1 *banded stock) Atlantica Yield, ABY. Yieldco, Contracted renewables assets, also transmission. Pattern Energy, PEGI. Wind farms, solar may be added too for GW sized PPAs. *Sky Solar, SKYS. Solar farms, creating & operating utility-scale projects. Sunrun, RUN. Residential solar systems, lease, PPA or purchase rooftop PV. TerraForm Power, TERP. Owns operates solar/wind, developed nations, yieldco. Energy Storage - 7% sector weight (2 stocks @3.00% each; + 2 banded stock) *Aqua Metals, AQMS. Recycling lead acid batteries, eliminating toxic wastes. *Maxwell, MXWL. Ultracapacitors, an alternative to batteries as in hybrids. Chemical & Mining Co. of Chile, SQM. Lithium, energy storage, large producer. Tesla Motors, TSLA. Electric vehicles, solar; purer-play in EVs & energy storage.
9

Cleaner Fuels – 6% sector weight (2 stocks @2.75% each; +1 *banded stock) Air Products & Chemicals, APD. Hydrogen, is a supplier of industrial gases. *Hydrogenics, HYGS. Hydrogen, fuel and electrolysis for fuel cells, H2 storage. Renewable Energy Group, REGI. Biodiesel, natural fats, oils, grease to biofuels. ---- ECO (seen via independent tracker in bold) plus other ‘tough times’ clean & fossil fuel themes past 5 years, Sept. 1, 2012 to Sept. 1, 2017 a period with big declines:
Source: Bigcharts.com As seen by ECO (via tracker bold) plus several other themes above the last 5 years have been very rough for many themes across clean, alternative & traditional fossil fuel energy. For example despite ECO falling hard and ending this period just positive, this clean energy theme still is far above an oil tracker orange, and Natural Gas tracker burnt red, both at bottom and down near -70%, plus a tracker for Coal (in blue) down near -30%. So clean energy is only up around +8%; yet fossil fuels are down around -30 to -70%. A tracker for Solar, also blue, once at top fell - then has risen to moderately over ECO. And just below ECO is an independent WHPRO tracker, in green, here sideways since 2016. Last 5 years were remarkably tough across many energy themes, including the fossil fuels oil, coal & natural gas! But Not All Energy themes suffered so harshly… Of some note for finishing positive with ‘much better’ results here is the global new energy NEX Index with its tracker in brown at very top here for this timeframe. The NEX is here up near +60% for past 5 years. It’s interesting too to see Global clean / new energy as captured by the NEX did relatively quite ‘better’ than ECO this period since both are in clean/new energy, though the former’s theme is mainly outside of the U.S. ---------------
10

-------- Appendix III: WHPRO Index via independent tracker PUW; component weights as seen in late-Q3 2017 on 9/13/2017 or about ~2 weeks before the rebalance to start Q4 2017. 43 Stocks:
Name SymbolWeight
CosanLtd CZZ 3.634MethanexCorp MEOH 3.523FMCCorp FMC 3.15AlbemarleCorp ALB 3.116CiaEnergeticadeMinas CIG 3.083AltraIndustrialMotionCorp AIMC 3.05WABCOHoldingsInc WBC 3.005OwensCorning OC 2.95ChartIndustriesInc GTLS 2.886CovantaHoldingCorp CVA 2.768SouthwesternEnergyCo SWN 2.764GreenPlainsInc GPRE 2.722CalpineCorp CPN 2.705AvangridInc AGR 2.672AndersonsInc/The ANDE 2.642EmersonElectricCo EMR 2.629WoodwardInc WWD 2.622AcuityBrandsInc AYI 2.618NRGYieldInc NYLD 2.609REXAmericanResources REX 2.608AOSmithCorp AOS 2.595EatonCorpPLC ETN 2.551TennecoInc TEN 2.544MasTecInc MTZ 2.512GolarLNGLtd GLNG 2.50CorningInc GLW 2.492LydallInc LDL 2.477McDermottInternationalInc MDR 2.472HannonArmstrong HASI 2.451RegalBeloitCorp RBC 2.444EnerSys ENS 2.432ESCOTechnologiesInc ESE 2.359TataMotorsLtdADR TTM 2.316ChesapeakeEnergyCorp CHK 2.267RangeResourcesCorp RRC 2.214ApogeeEnterprisesInc APOG 2.111
11
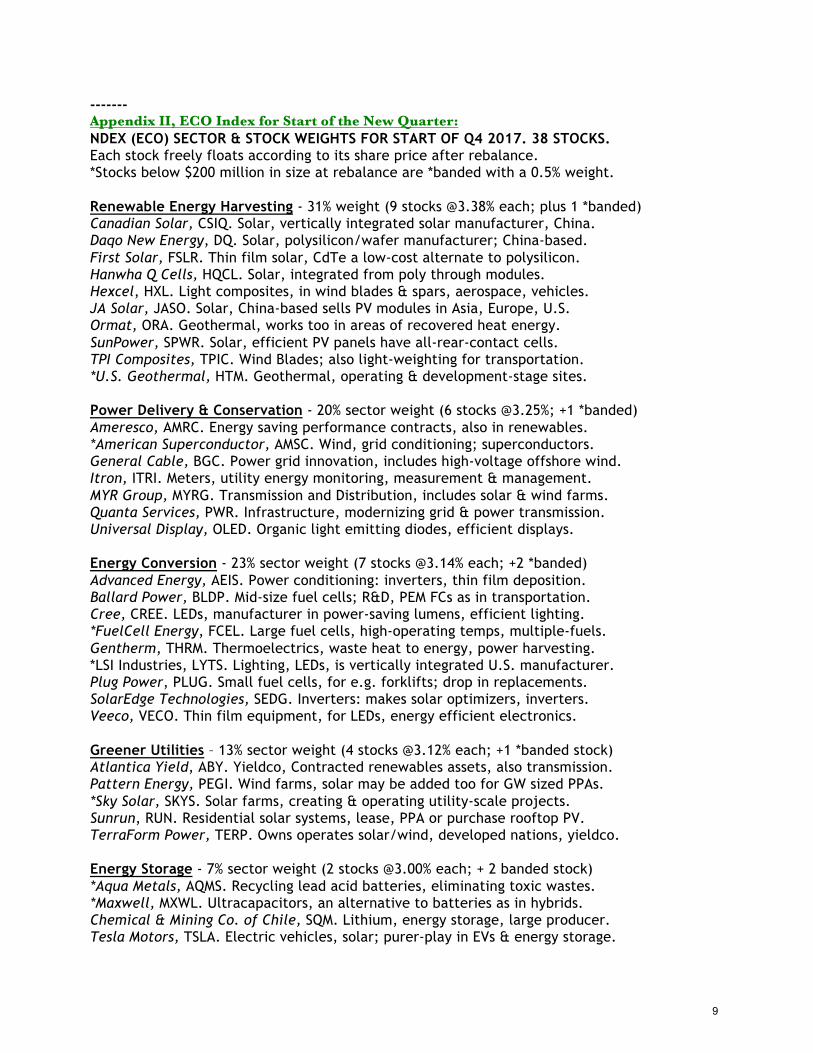
Heritage-CrystalCleanInc HCCI 0.648HudsonTechnologiesInc HDSN 0.53LuxferHoldingsPLCADR LXFR 0.514KandiTechnologiesGroupInc KNDI 0.51CleanEnergyFuelsCorp CLNE 0.471CECOEnvironmentalCorp CECE 0.421PacificEthanolInc PEIX 0.413WHPRO Index Year to Date to September 15, 2017
Source: Bigcharts.com ------
12

-----------------------
Appendix IV: WHPRO Index for the start of the New Quarter. Sectors & Stock Weightings: WilderHill Progressive Energy Index (WHPRO) for start of Q4 2017. 42 stocks.
Each stock freely moves according to its share price after the rebalance; *Banded stocks are those under $400 million in size and weighted at 0.5%.
Alternative Fuel – 24% Sector Weight (8 stocks @2.87% each +2 *banded) Andersons, ANDE. Ethanol producer, corn-based; rail group is in fuel transport. Chesapeake Energy, CHK. Natural gas, one of larger U.S. independent producers. *Clean Energy Fuels, CLNE. Natural gas fuel integration; for use in fleet vehicles. Cosan, CZZ. Biofuels, Brazil-based using sugarcane feedstock, ethanol exporter. Green Plains Energy, GPRE. Biofuel, ethanol; using U.S. domestic feedstock. Methanex, MEOH. Methanol, liquid fuel may be derived from fossil fuels or organics. *Pacific Ethanol, PEIX. Biofuels, major U.S. producer of lower-carbon fuels. Range Resources, RRC. Natural gas, produces in Appalachian & Gulf Coast regions. Rex American, REX. Biofuels, with subsidiaries is a major U.S. ethanol producer. Southwestern Energy, SWN. Natural gas, U.S. producer, also midstream services. Conversion & Storage – 24% Sector weight (9 stocks @2.66% each) Albermarle, ALB. Lithium & Lithium Compounds; for energy storage, transportation. Altra Holdings, AIMC. Mechanical power transmission, electromechanical conversion. Chart Industries, GTLS. Natural gas, LNG; liquefied gas storage/transport, efficiency. Covanta Holding, CVA. Incineration, converts waste to energy (WtE); conglomerate. EnerSys, ENS. Battery maker, for telecommunications, utilities, motive power. FMC, FMC. Lithium producer for carbonate, metal, expanding hydroxide capacity. Golar LNG, GLNG. LNG, major independent carrier, gas transport, regasification. MasTec, MTZ. Engineering & construction, distribution of electricity, natural gas. Wabco, WBC. Mechatronics, better vehicle mechanical/energy/braking controllers. Better Efficiency – 18% Sector Weight (7 stocks @2.57% each) Acuity Brands, AYI. LED lights, OLEDs, and controls for indoor & outdoor lighting. A.O. Smith, AOS. Energy efficiency, innovations for water heating & monitoring. Apogee, APOG. Advanced glass, for better efficiency, green building designs. Emerson Electric, EMR. Broad work in energy efficiency, storage, lately biofuels. Esco Technologies, ESE. Power grid, advances 2-way metering & communications. Regal Beloit, RBC. Energy efficient motors, in commercial, industrial, homes etc. Woodward, WWD. Energy controllers, optimization, industrial turbines in generation. Emission Reduction – 12% Sector Weight (4 stocks @2.62% each +3 *banded) *CECO Environmental, CECE. End-of-pipe emissions controls and pollution reduction. Corning, GLW. Diverse, activity includes emissions reduction, filters, and catalysts. *Kandi Technologies, KNDI. Developing small gasoline and urban electric vehicles. *Luxfer Holdings PLC, LXFR. Advanced material, reduced emissions, gaseous storage. McDermott, MDR. Natural Gas; fewer emissions/CO2 vs. coal; EPCI in LNG facilities. Tata Motors, TTM. Smaller & ‘nano’ vehicles, India-based with worldwide sales. Tenneco, TEN. Automotive end-of-pipe emissions controls, catalytic converters. New Energy Activity – 12% Sector weight (4 stocks @2.87% each +1 *banded stock). Eaton, ETN. Hybrids, better electric and fluid power in truck & auto applications.
13

*Hudson, HDSN. Refrigerant HFCs reclamation; reduces potent greenhouse gases. Heritage Crystal Clean, HCCI. Oil re-refining, modern waste reuse and recycling. Lydall, LDL. Thermal and filtration separation; innovative energy efficiency. Owens Corning, OC. Materials lightening, building insulation composite materials. Utility – 10% Sector weight (4 stocks @2.50% each) Avangrid, AGR. Electricity & Natural Gas, generation, storage, distribution. Companhia Energetica de Minas Cemig, CIG. Brazil Utility, large hydroelectric. Hannon Armstrong, HASI. Energy efficiency, capital & finance for infrastructure. NRG Yield, NYLD. Contracted power generation and thermal, also some renewables. ----- Chart for the WHPRO Index via an independent tracker bold Past 5 years to Aug. 31, 2017 – versus the ECO Index shown in light blue via an independent tracker for it:
Source: Bigcharts.com
WHPRO Index here in bold last 5 years late 2012 - 2017 as seen via the tracker above. This includes a period of WHPRO rising moderately to Summer 2014 hitting a relative high - dropping strongly to a February 2016 nadir – then rising in 2016 – mainly sideways since. Thus it finishes near nil, while ECO which had gone up farther & dropped more, is here now up near +10% (in past Quarterly Reports WHPRO had finished up farther past 5 years). Hence the WHPRO theme for less CO2/pollution from fossil fuels can move unlike the ECO basket, blue tracker, that dropped relatively much harder early 2014 through late 2016. That said all 3 WilderHill Indexes are in late 2017 far below their own previous all-time highs. ECO is much, much lower – having been in 2007 several-fold higher – that crash in some part due to a solar sub-theme having fallen so greatly from its peaks (and as noted the fossil fuels have fallen too). So Charts can differ greatly depending on the starting point. Moreover as always, past movements are not an indication of future performance. -----------
14

---------- Appendix V: WilderHill New Energy Global Innovation Index (NEX) seen late-Q3 2017 via independent tracker (PBD) on 9/13/17 or ~2 weeks before Rebalance to start Q4 2017. 99 in tracker: Name Symbol WeightEpistarCorp 2448 2.259KingspanGroupPLC KSP 2.068DONGEnergyA/S DENERGDC 1.983CaverionCorp CAV1VFH 1.93UniversalDisplayCorp OLED 1.893BoralexInc BLX 1.879EDPRenovaveisSA EDPR 1.805SaetaYieldSA SAY 1.778VestasWindSystemsA/S VWSDC 1.764OSRAMLichtAG OSR 1.763ItronInc ITRI 1.751ChinaLongyuanPowerGroup 916 1.749AcuityBrandsInc AYI 1.737GSYuasaCorp 6674 1.737RenewablesInfrastructure TRIGLN 1.737GreencoatUKWindPLC UKWLN 1.736MeidenshaCorp 6508 1.73HuanengRenewables 958 1.73NibeIndustrierAB NIBEBSS 1.728PatternEnergyGroupInc PEGI 1.72NRGYieldInc NYLD 1.718XinjiangGoldwindScience 2208 1.704PhilipsLightingNV LIGHT 1.688TransAltaRenewablesInc RNW 1.683Sino-AmericanSilicon 5483 1.672NordexSE NDX1 1.66SMASolarTechnologyAG S92 1.634CreeInc CREE 1.633HannonArmstrong HASI 1.609TeslaInc TSLA 1.606BYDCoLtd 1211 1.58ChinaHighSpeedTrans. 658 1.57FDGElectricVehiclesLtd 729 1.53XinyiSolarHoldingsLtd 968 1.385FirstSolarInc FSLR 1.371TanakaChemicalCorp 4080 1.308TerraFormPowerInc TERP 1.294
15

GCL-PolyEnergyHoldingsLtd 3800 1.257CanadianSolarInc CSIQ 1.225VeecoInstrumentsInc VECO 1.199SiemensGamesaRenewable SGRE 1.18PandaGreenEnergy 686 1.18SuperblockPCL SUPER-RTB 1.138AtlanticaYieldplc ABY 1.11SaoMartinhoSA SMTO3 1.096SunPowerCorp SPWR 1.08NovozymesA/S NZYMBDC 1.063TakumaCoLtd 6013 1.032EnergyAbsolutePCL EA-RTB 0.992CanvestEnvironmental 1381 0.952ChinaEverbrightIntl. 257 0.941GreenPlainsInc GPRE 0.876DraxGroupPLC DRXLN 0.875VerbundAG VERAV 0.837InnergexRenewableEnergy INE 0.795EnergyDevelopmentCorp EDC 0.765MercuryNZLtd MCY 0.712ContactEnergyLtd CEN 0.694OrmatTechnologiesInc ORA 0.649OdelicCoLtd 6889 0.543SilverSpringNetworksInc SSNI 0.539TPICompositesInc TPIC 0.521AdvancedLithiumElectro. 5227 0.516ChinaTitansEnergyTech. 2188 0.511KandiTechnologies KNDI 0.494RicardoPLC RCDOLN 0.491AmerescoInc AMRC 0.487CreditSuisseRealEst. GREENSW 0.477BallardPowerSystemsInc BLDP 0.466EverlightElectronicsCoLtd 2393 0.45WasionGroupHoldingsLtd 3393 0.444ChinaPowerCleanEnergy 735 0.426SenvionSA SEN 0.424SolarEdgeTechnologiesInc SEDG 0.423JASolarHoldingsCoLtdADR JASO 0.422MaxwellTechnologiesInc MXWL 0.412RECSiliconASA REC 0.388
16

VERBIOVereinigteBioEnergie VBK 0.374MeyerBurgerTechnologyAG MBTNSW 0.364PlugPowerInc PLUG 0.358DialightPLC DIALN 0.357CapitalStageAG CAP 0.347GCPInfrastructureInvest. GCPLN 0.341SunrunInc RUN 0.337SPCGPCL SPCG-RTB 0.331NeoSolarPowerCorp 3576 0.326UtilitywisePLC UTWLN 0.319LSIIndustriesInc LYTS 0.312WestHoldingsCorp 1407 0.31MotechIndustriesInc 6244 0.305ShunfengInternationalClean 1165 0.294GigasolarMaterialsCorp 3691 0.29eRexCoLtd 9517 0.29CropEnergiesAG CE2 0.289ChinaSingyesSolarTech. 750 0.268AlbiomaSA ABIOFP 0.264VivintSolarInc VSLR 0.261RenewableEnergyGroupInc REGI 0.256AkenerjiElektrikUretimAS AKENRTI 0.208
------- Sample recent Sector Weightings in NEX Index as seen for Q4 2017:
Key Sectors ECV 0.011
ECV Energy Conversion EEF 0.293
EEF Energy Efficiency ENS 0.067
ENS Energy Storage RBB 0.082
RBB Renewables - Biofuels & Biomass ROH 0.046
ROH Renewables - Other RSR 0.205
RSR Renewable - Solar RWD 0.292
RWD Renewable - Wind http://www.nex-index.com/Constituents_And_Weightings.php For Component values see, http://www.nex-index.com/Constituents_And_Weightings.php
17

Appendix VI: WilderHill New Energy Global Innovation Index (NEX) for start of Q4 2017. Grouped here generally by NEX Index Sector: (subject to revision; see also http://www.nexindex.com/Constituents_And_Weightings.php )
Company Name 2017 Q4 NEX Category
Start of Q4 NEX Weight
Tesla Motors Inc EEF 0.0182 Universal Display Corp EEF 0.0182 Acuity Brands Inc EEF 0.0182 OSRAM Licht AG EEF 0.0182 Philips Lighting NV EEF 0.0182 Kingspan Group PLC EEF 0.0182 Itron Inc EEF 0.0182 Nibe Industrier AB EEF 0.0182 Cree Inc EEF 0.0182 Epistar Corp EEF 0.0182 Veeco Instruments Inc EEF 0.0182 Hannon Armstrong Sustainable Infra. EEF 0.0182 Meidensha Corp EEF 0.0182 Vestas Wind Systems A/S RWD 0.0181 Siemens Gamesa Renewable Energy SA RWD 0.0181 DONG Energy A/S RWD 0.0181 NRG Yield Inc RWD 0.0181 China Longyuan Power Group Corp Ltd RWD 0.0181 Huaneng Renewables Corp Ltd RWD 0.0181 TransAlta Renewables Inc RWD 0.0181 Xinjiang Goldwind Science & Tech RWD 0.0181 EDP Renovaveis SA RWD 0.0181 Pattern Energy Group Inc RWD 0.0181 Nordex SE RWD 0.0181 Boralex Inc RWD 0.0181 China High Speed Transmission Equip. RWD 0.0181 Saeta Yield SA RWD 0.0181 Renewables Infrastructure Group RWD 0.0181 Byd Co Ltd ENS 0.0175 GS Yuasa Corp ENS 0.0175 FDG Electric Vehicles Ltd ENS 0.0175 First Solar Inc RSR 0.0121 Xinyi Solar Holdings Ltd RSR 0.0121 SunPower Corp RSR 0.0121 SolarEdge Technologies Inc RSR 0.0121 Sino-American Silicon Products Inc RSR 0.0121 Canadian Solar Inc RSR 0.0121 GCL-Poly Energy Holdings Ltd RSR 0.0121 Atlantica Yield plc RSR 0.0121 Superblock PCL RSR 0.0121 Meyer Burger Technology AG RSR 0.0121 SMA Solar Technology AG RSR 0.0121 TerraForm Power Inc RSR 0.0121 United Photovoltaics Group Ltd RSR 0.0121 Novozymes A/S RBB 0.0097 China Everbright International Ltd RBB 0.0097 Energy Absolute PCL RBB 0.0097 Green Plains Inc RBB 0.0097
18
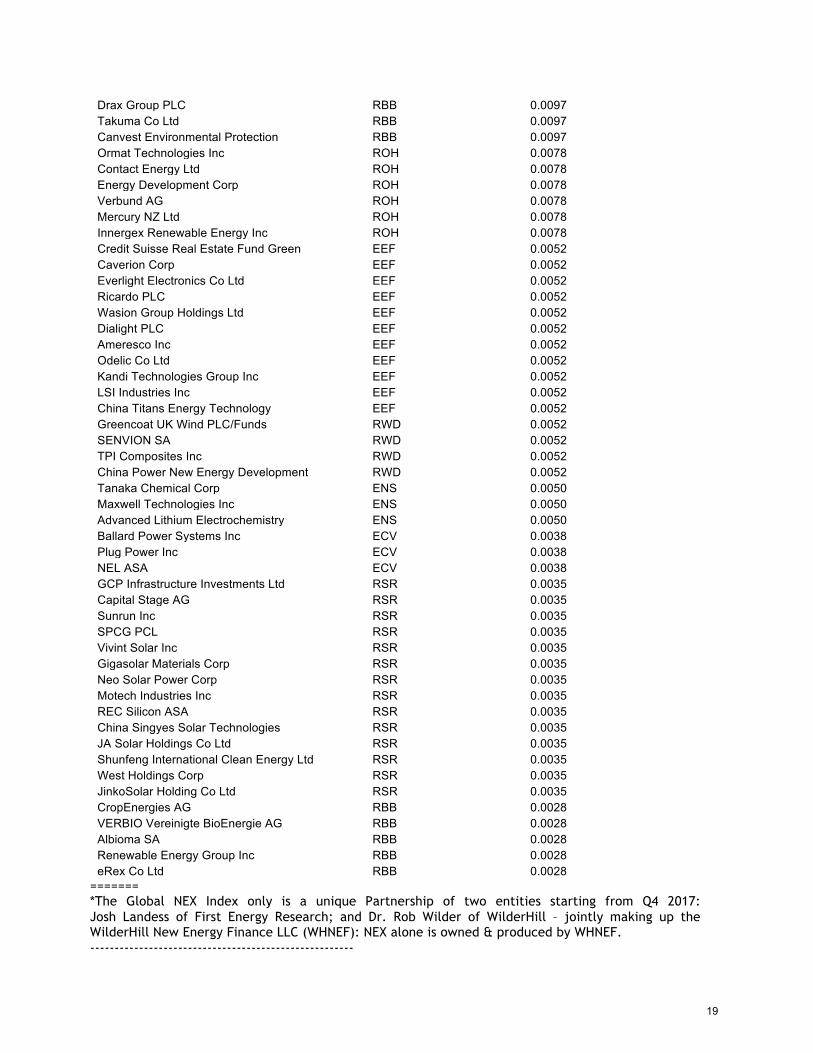
Drax Group PLC RBB 0.0097 Takuma Co Ltd RBB 0.0097 Canvest Environmental Protection RBB 0.0097 Ormat Technologies Inc ROH 0.0078 Contact Energy Ltd ROH 0.0078 Energy Development Corp ROH 0.0078 Verbund AG ROH 0.0078 Mercury NZ Ltd ROH 0.0078 Innergex Renewable Energy Inc ROH 0.0078 Credit Suisse Real Estate Fund Green EEF 0.0052 Caverion Corp EEF 0.0052 Everlight Electronics Co Ltd EEF 0.0052 Ricardo PLC EEF 0.0052 Wasion Group Holdings Ltd EEF 0.0052 Dialight PLC EEF 0.0052 Ameresco Inc EEF 0.0052 Odelic Co Ltd EEF 0.0052 Kandi Technologies Group Inc EEF 0.0052 LSI Industries Inc EEF 0.0052 China Titans Energy Technology EEF 0.0052 Greencoat UK Wind PLC/Funds RWD 0.0052 SENVION SA RWD 0.0052 TPI Composites Inc RWD 0.0052 China Power New Energy Development RWD 0.0052 Tanaka Chemical Corp ENS 0.0050 Maxwell Technologies Inc ENS 0.0050 Advanced Lithium Electrochemistry ENS 0.0050 Ballard Power Systems Inc ECV 0.0038 Plug Power Inc ECV 0.0038 NEL ASA ECV 0.0038 GCP Infrastructure Investments Ltd RSR 0.0035 Capital Stage AG RSR 0.0035 Sunrun Inc RSR 0.0035 SPCG PCL RSR 0.0035 Vivint Solar Inc RSR 0.0035 Gigasolar Materials Corp RSR 0.0035 Neo Solar Power Corp RSR 0.0035 Motech Industries Inc RSR 0.0035 REC Silicon ASA RSR 0.0035 China Singyes Solar Technologies RSR 0.0035 JA Solar Holdings Co Ltd RSR 0.0035 Shunfeng International Clean Energy Ltd RSR 0.0035 West Holdings Corp RSR 0.0035 JinkoSolar Holding Co Ltd RSR 0.0035 CropEnergies AG RBB 0.0028 VERBIO Vereinigte BioEnergie AG RBB 0.0028 Albioma SA RBB 0.0028 Renewable Energy Group Inc RBB 0.0028 eRex Co Ltd RBB 0.0028
======= *The Global NEX Index only is a unique Partnership of two entities starting from Q4 2017: Josh Landess of First Energy Research; and Dr. Rob Wilder of WilderHill – jointly making up the WilderHill New Energy Finance LLC (WHNEF): NEX alone is owned & produced by WHNEF. ------------------------------------------------------
19