q3fy19 financial results presentation
TRANSCRIPT

Q3FY19 Financial Results Presentation
For the quarter ended 31 Dec 2018
Chua Sock Koong, Group CEO
14 February 2019

2
Forward looking statement – Important note
The following presentation contains forward looking statements by the management ofSingapore Telecommunications Limited ("Singtel"), relating to financial trends for futureperiods, compared to the results for previous periods.
Some of the statements contained in this presentation that are not historical facts arestatements of future expectations with respect to the financial conditions, results ofoperations and businesses, and related plans and objectives. Forward looking informationis based on management's current views and assumptions including, but not limited to,prevailing economic and market conditions. These statements involve known and unknownrisks and uncertainties that could cause actual results, performance or events to differmaterially from those in the statements as originally made. Such statements are not, andshould not be construed as a representation as to future performance of Singtel. Inparticular, such targets should not be regarded as a forecast or projection of futureperformance of Singtel. It should be noted that the actual performance of Singtel may varysignificantly from such targets.
“S$” means Singapore dollars, "A$" means Australian dollars and “US$” means UnitedStates dollars unless otherwise indicated. Any discrepancies between individual amountsand totals are due to rounding.

AgendaOverview
Business Units
Outlook
Supplementary Information

4
› Growth in equipment sales, ICT and digital services2
offset carriage erosion› Strong postpaid momentum in Australia & Singapore
Margin erosion in carriage services, lower NBN migration revenues & prior year one-off items
Intense competition in India; Increased depreciation & amortisation & network costs
Lower EBITDA & associates’ contribution
Slower operational performance, timing of ICT milestone-based receipts & dividends from Telkomsel
Earnings impacted by Airtel India performance
1. Constant currency – assuming constant exchange rates from corresponding period in FY20182. Includes consolidation of Videology results in Amobee Group3. Excludes exceptional items N.M. – not meaningful
Revenue
% change (reported)
% change (constant currency)1
1%
(11%)
(35%)
(28%)
(14%)
4%
(8%)
(33%)
(27%)
(12%)
(51%) N.M.
Underlying NPAT
Regional Associates’
PBT3
Free Cashflow
NPAT
4,626
1,190EBITDA
342
680
823
387
Q3FY19(S$M)

5
Quarter 9 Months
(S$M) Dec 18 Dec 17 YoY % Dec 18 Dec 17 YoY %
Operating revenue 4,626 4,583 1% 13,030 13,006 Stable
EBITDA 1,190 1,331 (11%) 3,526 3,820 (8%)
- margin 25.7% 29.0% 27.1% 29.4%
Associates pre-tax earnings1 342 523 (35%) 1,035 1,816 (43%)
EBITDA & share of associates’pre-tax earnings 1,561 1,884 (17%) 4,642 5,762 (19%)
Depreciation & amortisation (553) (563) (2%) (1,661) (1,688) (2%)
Net finance expense (98) (81) 22% (262) (258) 2%
Profit before EI and tax 909 1,240 (27%) 2,719 3,816 (29%)
Tax (235) (299) (21%) (609) (1,062) (43%)
Underlying net profit 680 950 (28%) 2,128 2,773 (23%)
Exceptional Items (post tax) 143 10 N.M. 194 1,931 (90%)
Net profit 823 959 (14%) 2,322 4,703 (51%)
Q3FY19 and 9MFY19 Performance
1. Excluding exceptional items. N.M. – not meaningful.

6
Quarter Dec 2018 9 Months Dec 2018
Currency Exchange rate1
Increase/ (decrease)against S$
Exchange rate1
Increase/ (decrease)against S$
YoY QoQ YoY
1 AUD2
0.9864 (5.2%) (1.3%) 0.9982 (5.2%)
1 USD3
1.3722 1.2% 0.6% 1.3590 (0.7%)
IDR 10,753 (7.5%) (1.1%) 10,638 (8.9%)
INR 52.4 (10.1%) (2.1%) 51.3 (9.1%)
PHP 38.6 (2.7%) 1.5% 39.1 (6.5%)
THB 23.9 1.6% 0.8% 24.0 2.0%
1. Average exchange rates for the quarter and 9 months ended 31 December 2018.2. Average A$ rate for translation of Optus’ operating revenue.3. Average US$ rate for translation of Trustwave, Amobee and HOOQ’s operating revenue.
Foreign Exchange Movements

› Major data centre service contract win of up to S$850M› Awarded best in managed security, data centre and infrastructure
services2
7
Group Q3FY19 HighlightsGroup Consumer
› SG: Extended Premier League rights till 2022 & enhanced other TV content
› SG: Entered electricity market
› AU: Launched Australia’s first 5G commercial service
› AU: Optus rated Australia’s strongest telecommunications brand1
1. Brand Finance Australia 100 2019 Report 2. Frost & Sullivan APAC Best Practices Awards 2018 & NWA Readers’ Choice Product Excellence Awards 2018
› HOOQ introduces video streaming on Grab’s platform
Group Enterprise
Group Digital Life
International Group
› Dash offers remittance service to Myanmar & partnered Visa and Apple Pay to expand global usage

8
Singapore▼ S$198m
▼ 10%
Associates’ dividends▼ S$35m
1. Gross debt less cash and bank balances adjusted for related hedging balances.2. The ratio of net debt to net capitalisation. Net capitalisation is the aggregate of net debt, shareholders’ funds and minority interests.
Australia ▼ S$44m
Net debt1 S$9.8b
Net debt gearing2 25.2%
Net debt: EBITDA & share of associates’ pre-tax profits
1.58x
Credit Ratings: A+A1
S&PMoody’s
Solid Financial Position
Free Cash Flow S$2,530m Balance Sheet
1,401 1,366
622 578
783
586
9MFY18 9MFY19
2,806
2,530
S$m

AgendaOverview
Business Units
Outlook
Supplementary Information

201 194
143 137
203188
273261
15
634
11Q3FY18 Q3FY19 Q3FY19Q3FY18
598
10
Revenue
S$m
Mobile revenue (incl equipment sales) down 6%› Voice erosion mitigated by growing data usage› Higher amortisation of handset subsidies› Lower equipment sales on weaker demand for key
handset models
Home service revenue down 1%› Broadband revenue growth from increase in
subscribers & migration to higher-tier fibre plans› Offset by decline in voice & TV service
EBITDA down 3%› Lower voice revenue moderated by stringent cost
management
EBITDA
32.5%
Fixed
31.7%
EBITDA margin
Others
Singapore Consumer
▼ 3%
Mobile Revenue
▼ 6%
▼ 6%
11
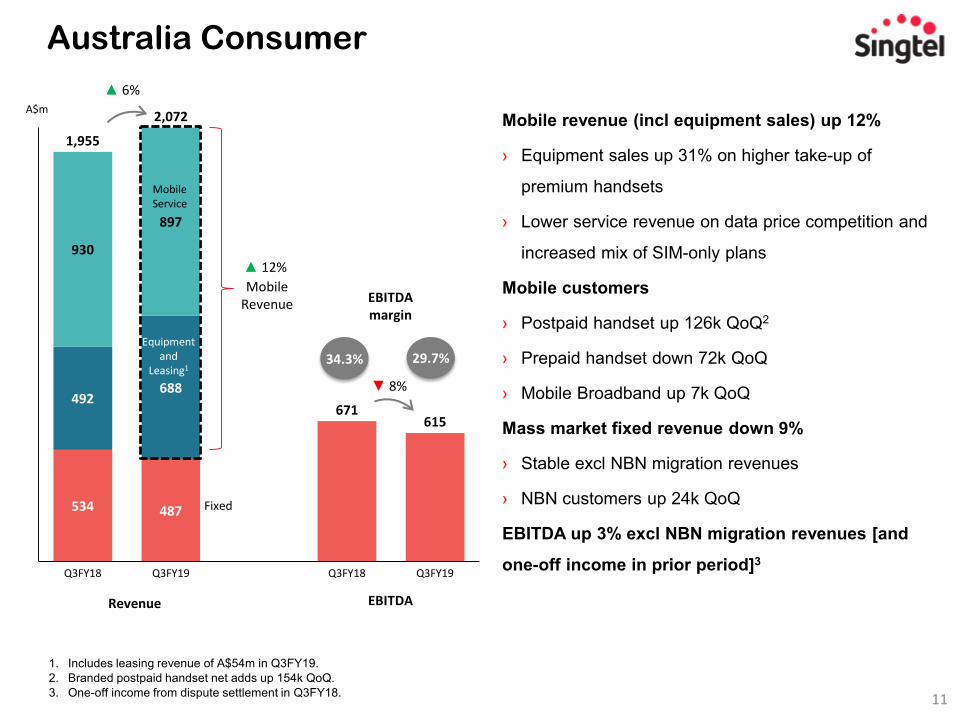
Australia Consumer
1. Includes leasing revenue of A$54m in Q3FY19.2. Branded postpaid handset net adds up 154k QoQ.3. One-off income from dispute settlement in Q3FY18.
Mobile revenue (incl equipment sales) up 12%
› Equipment sales up 31% on higher take-up of
premium handsets
› Lower service revenue on data price competition and
increased mix of SIM-only plans
Mobile customers
› Postpaid handset up 126k QoQ2
› Prepaid handset down 72k QoQ
› Mobile Broadband up 7k QoQ
Mass market fixed revenue down 9%
› Stable excl NBN migration revenues
› NBN customers up 24k QoQ
EBITDA up 3% excl NBN migration revenues [and
one-off income in prior period]3
534 487
671615
492688
930
897
Q3FY18Q3FY19Q3FY18 Q3FY19
1,955
2,072
Revenue
A$m
EBITDA
29.7%
Mobile Service
Fixed
34.3%
EBITDA margin
▲ 6%
▼ 8%
Mobile Revenue
▲ 12%
Equipmentand
Leasing1

12
Q3FY19PBT1
(S$m)% Change
(S$)% Change (local ccy)
Business Highlights
Regional Associates 342 (35%) N.M. › Lower contribution from Airtel, Telkomsel and AIS
Telkomsel 305 (7%) (1%) › Revenue stable YoY; sequential quarter growth as SIM-cardregistration exercise largely completed
Airtel (129) N.M. N.M. › Share of Airtel’s PBT declined S$167 million YoY
› India:• Continued pricing pressures in mobile market• Introduced minimum recharge plans to drive revenue and
ARPU uplift• Strong 4G customer net adds
› Africa:• Robust growth in revenue and profits• US$200 million investment from Qatar Investment
Authority
- India & South Asia (50) N.M. N.M.
- Africa 86 8% 19%
- Others2 (12) 244% 265%
- Net finance costs & fair value losses (145) (12%) (3%)
- BTL3 (9) 9% 21%
AIS 80 (10%) (11%) › Higher marketing cost and depreciation due to networkinvestment
Intouch 21 (13%) (15%) › Impacted by AIS’ lower earnings
Globe 65 47% 51% › Strong data revenue growth in mobile & broadband and costmanagement
1. Excludes exceptional items. 2. Bharti’s share of Associates / Joint Ventures’ profits / (losses).3. BTL, in its standalone books, recorded net losses due to higher interest charges arising from its upstake in Airtel.N.M. – Not Meaningful
Regional Associates

882 835
471428
584 633
125 137
1,591
Q3FY18Q3FY18 Q3FY19 Q3FY19
1,606
Group EnterpriseS$m
Carriage▼ 5%
29.6% 26.7%
EBITDA margin
▲ 1%
ICT ▲ 9%
Revenue EBITDA
▼ 9%
1. Comprises Managed Security & Technology services (MST) and Payment Card Industry (PCI) compliance revenues.
21 18
105 119
125
Q3FY19Q3FY18
137
Cyber Security Revenue1
▲ 10%
MST▲14%
PCI▼11%
S$m

HOOQ
Amobee
14
Revenue EBITDA
S$m
1. Includes revenues from HOOQ and DataSpark.
Group Digital Life
Group Digital Life
20
321
-34 -24
Q3FY19
5
Q3FY18
9
370
Q3FY19
8
-14
379
Q3FY18
325
Others1
Amobee
› Growing distribution partnerships
▲ 17%
▲ 15%
-16
› Enhanced capabilities with data & channel partnerships
› Programmatic platform gains traction with key client wins

Agenda
Overview
Business Units
Outlook
Supplementary Information

16
Outlook1
1. Based on average exchange rates during FY2018.2. Excludes NBN migration revenue in Australia for FY2018 and FY2019. 3. Excludes spectrum payments and associates’ dividends. 4. Includes intragroup revenue.
Group
› Revenue2 to grow by low single digit
› EBITDA2 to decline by low single digit (Updated)
› Cash and accrued capital expenditure to be ~S$2.2b
› Free cash flow3 to be ~S$1.9b
› Dividends from regional associates to be ~S$1.4b
Core Business
› Revenue2 to grow by low single digit
› EBITDA2 to decline by low single digit (Updated)
› Australia Mobile Service revenue to be stable (Updated)
› Singapore Mobile Service revenue to decline by mid single digit
› Group ICT revenue to increase by low single digit (Updated)› Cyber Security revenue to increase by high single digit
Group Digital Life
› Amobee revenue4 to grow by low teens (Updated for Videology acquisition)
› Amobee EBITDA to be slightly negative (Updated for Videology acquisition)

Agenda
Overview
Business Units
Outlook
Supplementary Information

18
1.68 1.64 1.62 1.62 1.64
2.43 2.45 2.46 2.51 2.54
436409 421 411 410
732
607591
609
696
Q3FY18 Q4FY18 Q1FY19 Q2FY19 Q3FY19
Prepaid PostpaidMobile service Mobile revenue
Mobile customers (m)
Revenue(S$m)
Singapore Mobile
Mobile revenue S$696m
▲ 36k QoQ
4G customers up 87k QoQ› 74% penetration
3,101k
Average quarterly smartphone data usage› Up from 3.7Gb in Dec 2017 quarter› Up from 4.4Gb in Sep 2018 quarter
4.5Gb
Postpaid ARPU down 11% › Pre-SFRS(I) ARPU down 7% to $60› Dilutive impact of SIM-only & Mobile Share
plans› Decline in roaming & voice usage
S$43
Prepaid ARPU down 3% › Higher data usage mitigated lower voice
traffic
S$18▲ 21k QoQ
(incl mobile service & equipment sales)

510 509 510 513 515
Q3FY18 Q4FY18 Q1FY19 Q2FY19 Q3FY19
Households on triple/quad services
19
Customers (‘000)
Home service revenue(S$m) Singtel TV revenues
› Down 6%S$54m
Singtel TV ARPU› Stable
S$41
Singtel TV churn› Stable
1.4%
Singtel Fibre broadband customers› Up 8k QoQ› 99% of broadband customers on fibre
624k
Singtel OTT services (CAST & Singtel TV GO)› Up 2k QoQ
116k
1. Excludes 2018 World Cup broadcast and advertising revenues.
Singapore FixedHome service revenue S$133m
1134
148
135135 133
1491
133

20
Australia MobileMobile revenue A$1,652m
1.08 1.10 1.11 1.14 1.16
3.67 3.71 3.72 3.60 3.53
5.20 5.30 5.34 5.43 5.56
$974 $959 $963 $943 $942
$1,487$1,383 $1,386 $1,422
$1,652
Q3FY18 Q4FY18 Q1FY19 Q2FY19 Q3FY19
Mobile BB Prepaid HandsetPostpaid Handset Service RevenueMobile Revenue
Mobile customers (m)
Revenue (A$m)
4G customers1 up 74k QoQ› 64% penetration
6,557k
Postpaid› Handset ARPU
- down 7%- Pre-SFRS(I) ARPU down 5% to A$56
› Churn- down 0.1ppt YoY and up 0.1ppt QoQ
A$41
1.4%
Prepaid› Handset ARPU
- down 10%A$18
Mobile Broadband› ARPU
- down 4%
A$20
1. 4G handsets on the Optus network.
▲ 129k QoQ
▲ 20k QoQ
▼ 72k QoQ
(incl mobile service & equipment sales)

21
Australia FixedMass market revenue A$355m
Customers (‘000)
Mass market revenue(A$m)
394 396 395 391 381
354 339 322 303 282
416 453 483 516 540
59 56 49 47 44
$389
$329$340 $336
$355
$312 $312 $315 $313 $3111
Q3FY18 Q4FY18 Q1FY19 Q2FY19 Q3FY19
HFC BB customers ULL BB customers
NBN BB customers Others
Mass market revenue mm rex-NBN
On-net BB ARPU
› Up 2%
A$57
NBN BB Customers
› up 24k QoQ
540k
TV Customers
› Down 2k QoQ
513k1,223 1,245
1. Ex-NBN payments, revenue stable.
Mass market revenue ex-NBN migration revenue
1,249 1,257 1,247

24
27
42
95
131
320
9MFY19
Cost of sales
Staff costs
Traffic Expense
Selling & admin
Others
Cost savings of S$320m in 9MFY19
Cost savings Customer experience
› Increase adoption of self-service channels › Integrate online & offline sales channels› Optimise customer acquisition costs› Rationalise content portfolio
Network & operations
› Headcount efficiency from streamlining processes› Leverage Group scale for supply & sourcing› Negotiate with vendors for better rates & rebates› Standardisation of enterprise product suite› Review & renegotiate overseas termination payments› Reduce marketing cost from targeted advertising &
lower agency fees› Shut down legacy systems (ADSL, copper
deployment to commercial buildings)

231. Assuming constant exchange rates from corresponding periods in FY2018.2. The Group’s share of associates’ earnings before exceptionals.
Quarter Dec 2018 Q3FY19(reported S$m)
YoY % change(reported S$)
YoY % change(at constant FX)1
Group revenue 4,626 0.9% 3.7%
Group reported NPAT 823 (14.2%) (11.9%)
Group underlying NPAT 680 (28.4%) (26.9%)
Optus revenue 2,386 (0.9%) 4.6%
Regional Associates pre-tax earnings2 342 (34.7%) (33.4%)
Trends In Constant Currency Terms1
9 Months Dec 2018 9MFY19(reported S$m)
YoY % change(reported S$)
YoY % change(at constant FX)1
Group revenue 13,030 0.2% 3.1%
Group reported NPAT 2,322 (50.6%) (49.0%)
Group underlying NPAT 2,128 (23.3%) (20.6%)
Optus revenue 6,784 (0.3%) 5.2%
Regional Associates pre-tax earnings2 1,035 (43.0%) (40.5%)

Disclaimer: This material that follows is a presentation of general background information about Singtel’s activities current at the date of the presentation. The information contained in this document is intended only for use during the presentation and should not be disseminated or distributed to parties outside the presentation. It is information given in summary form and does not purport to be complete. It is not to be relied upon as advice to investors or potential investors and does not take into account the investment objectives, financial situation or needs of any particular investor. This material should be considered with professional advice when deciding if an investment is appropriate.