q4 fy2020 - kpr mill limited
TRANSCRIPT


Q4 FY2020

Safe Harbor
This presentation and the accompanying slides (the “Presentation”), which have been prepared by KPR Mill Limited (the “Company”), have been prepared solely for information purposes and do not constitute any offer, recommendation or invitation to purchase or subscribe for any securities, and shall not form the basis or be relied on in connection with any contract or binding commitment whatsoever. No offering of securities of the Company will be made except by means of a statutory offering document containing detailed information about the Company.
This Presentation has been prepared by the Company based on information and data which the Company considers reliable, but the Company makes no representation or warranty, express or implied, whatsoever, and no reliance shall be placed on, the truth, accuracy, completeness, fairness and reasonableness of the contents of this Presentation. This Presentation may not be all inclusive and may not contain all of the information that you may consider material. Any liability in respect of the contents of, or any omission from, this Presentation is expressly excluded.
Certain matters discussed in this Presentation may contain statements regarding the Company’s market opportunity and business prospects that are individually and collectively forward-looking statements. Such forward-looking statements are not guarantees of future performance and are subject to known and unknown risks, uncertainties and assumptions that are difficult to predict. These risks and uncertainties include, but are not limited to, the performance of the Indian economy and of the economies of various international markets, the performance of the textile industry in India and world-wide, competition, the company’s ability to successfully implement its strategy, the Company’s future levels of growth and expansion, technological implementation, changes and advancements, changes in revenue, income or cash flows, the Company’s market preferences and its exposure to market risks, as well as other risks. The Company’s actual results, levels of activity, performance or achievements could differ materially and adversely from results expressed in or implied by this Presentation. The Company assumes no obligation to update any forward-looking information contained in this Presentation. Any forward-looking statements and projections made by third parties included in this Presentation are not adopted by the Company and the Company is not responsible for such third party statements and projections.
2

WHY ‘FASO’ (Specialities) 100% Organic Cotton
Super fine combed compact yarn
Knitting by global standard “Mayer & Cie” machines
Processing through hi-tech eco- friendly cold processing technology
Garments
– World’s best advanced technology Sewing Machines
– With Super soft micro nylon elastics
– By highly skilled & dedicated work force
– In centralised Air-Conditioned Facilities.
stringent Quality control at every stages of production
Above all, the vertical integration reaps the benefits of own supply chain
These key factors ensure ultra-soft comfort and skin friendly ‘FASO’ Products
3

Manufacturing Facilities
Sathyamangalam Spinning
Karumathampatti Spinning, Compact , P.C, Melange
& Color Melange
Neelambur Spinning & Knitting
Arasur Spinning, Knitting & Garmenting
Tirupur Garmenting
Yarn :
1,00,000 MT
Fabric :
27,000 MT
Garments :
115 million Garments
Processing :
22,000 MT
Fabric Printing :
7500 MT
Co-gen & Sugar :
30 MW &
5,000 TCD
100 KLPD
4
Tirunelveli, Tenkasi, Theni & Coimbatore
Windmills
Thekkalur
Processing & Fabric Printing
Bijapur, Karnataka Co-gen cum Sugar and Ethanol
Tam
il N
adu
Windmills:
61.92 MW
Perundurai
Garmenting
Mekelle, Ethiopia Garmenting

An Overview
One of the largest vertically integrated textile player with presence across the entire value chain - from “fibre to fashion”
Best quality cotton ‘Shankar 6’ used as the raw material for consistent quality
Strategic investment in Wind Power Projects & Co-gen plant for captive consumption
Marquee relationships with more than 1,000 regular domestic clients for yarn and fabric and around 55 leading international brands for garments
Trendsetting welfare policies including higher education facilities for employees & various CSR activities
An exemplary and massive ETP in its Processing Unit to treat 5 Million litres a day
Quality initiatives and consistent technology upgradation secured several International Accreditations
With 105 million Knitted Garments capacity , KPR has become one of the largest Apparel Manufacturers in India. In addition 10 million Knitted garment Capacity at Ethiopia.
Eco-friendly Processing ‘unit 2’ and sophisticated high resolution printing division
Garment plant in Ethiopia – Ramping up in progress
Retail segment - ‘FASO’ - 100% Organic Cotton Men’s innerwear launched
To enlarge export activities established a Company at Singapore
5

Presence across the textile value chain
• Amongst top five manufacturers in India
• Entire yarn capacity upgraded to value added yarn(Compact, Melange, Color Melange, PC, Slub & Grindle Yarn)
• 30% captively consumed to manufacture value added Products
• Revenue contributes 36% to total sales
Yarn
• Revenue contributes 5% to total sales
• Around 61% captively consumed to manufacture value added products.
• Major Buyers - Knitted Apparel Export Manufacturers
Fabric • A largest Knitted garment
manufacturer
• Revenue contributes 40% to total sales
• Exporting to over 60 Countries
• Key export markets - Europe, Australia & USA.
• Retail segment : ‘FASO’ – 100% Organic Cotton Men’s innerwear launched
Knitted Garments
Domestic Sales – 58%; Exports – 42%
6

Key competitive advantages
7
• Rich exposure in textile and apparel Industry
• Consistent better performer even during tough times and growth driven entity
• Dividend track record since listing
Strong Fundamentals
• Assuring superior quality products meeting market requirement
• On time delivery – An essential factor for market reputation
• Facilities located within a 50 KM radius of Tirupur, largest apparel manufacturing cluster in Asia
• Proximity to buyers helps to reduce the material handling costs and facilitates immediate feedback
• Utilize the key technical personnel across all plant sites
Largest vertically Integrated Apparel Manufacturer strategically located
• Ability to maintain power cost through investment in Green Power
• 61.92 MW Wind Power & 30 MW Co-Gen
• Green power availability throughout the year
Strategic Investment in Green Power
• Low power cost through captive green power
• Minimal finance cost through prudential financial planning
Scale of Economy

Key competitive advantages Contd…
8
• Feel at home accommodation and amenities including Higher Education, Vocational training, yoga,
meditation, library, sports, swimming pool, etc.
• The trendsetting welfare factors crowned by Five Star Certification &Higher Education facilities at KPR
distinguishes it from Peer Group with higher efficiency level and lower attrition rate facilitating enhanced
Productivity at optimized Operating cost
Rejoiced Workforce
• More than 1,000 Customers for yarn & fabric
• Around 55 Top International Brands
• Exporting to over 60 Countries
Strong client base
• Converted conventional yarn capacity to value added yarn, carrying premium prices
• Expanded garment capacity to 105 million garments per annum – Making KPR a largest Knitted garment
manufacturer in India. In addition 10 million knitted garment capacity at Ethiopia
• Eco-friendly Processing ‘Unit 2’ and sophisticated high resolution printing division commenced its
operations.
• Garment plant in Ethiopia – Ramping up in progress .
• Company at Singapore-To enlarge Export business
• Retail segment - ‘FASO’ - 100% Organic Cotton Men’s innerwear launched
Growth Initiatives

KPR is well Poised to capture the opportunity
9
INDUSTRY GROWTH DRIVERS COMPANY SPECIFIC GROWTH DRIVERS
Most cost competitive Textile manufacture base
Largest Cotton base – Number one in World
Most efficient Spinning sector in the World
Second biggest exporter of textile & apparel
Growing Domestic & Global demand
Challenges of growth in neighboring competing
countries driving the Indian textile Industry
India has an edge over other major competitors
in Asia in respect of cost of production
Consistent Modernization & Capacity Expansion –
enhanced realization
Value Added Yarn - Compact, Melange, PC, Colour
Melange, Slub & Grindle Yarn– Volume Driven Growth
A largest Knitted garment manufacturer with 115 mn
garment capacity.
Eco-friendly Processing ‘unit 2’ and sophisticated high
resolution printing division commenced its operations
Self sufficiency in power generation
Increased focus on exports
– Enhanced garment production
– Penetrate into newer markets for garments & yarn
– Impressive response from existing clients, new buyers
and new market
Garment plant in Ethiopia – Ramping up in progress
Company at Singapore-To enlarge Export business
Retail segment - ‘FASO’ 100% organic Cotton Men’s
innerwear launched.

Evolution
10
1984-1999
2000-2005
2006-2009
1984 – Maiden business
at Coimbatore, India 1989 – Knitted garment
export at Tirupur. 1995 – First spinning unit
at Sathyamangalam with
6,000 spindles.
Increased to 30,240
spindles by 1999
2001 – Spinning mill at
Karumathampatti with 30,240
spindles; Knitting facility & Wind
mill for captive use 2003 – Spinning unit at
Neelambur with 50,784 spindles;
Knitting facility & Wind mill
2005 – At Arasur 1,00,800
spindles; Knitting facility,
Garment Unit and Wind Mills
2006 – Private Equity
participation by leading US
Corporate ‘Brandot Investments’
& Two others - $ 25 Mn
2007 – IPO at a premium.
Shares Listed at Bombay &
National Stock Exchanges, India 2008 – Fabric Processing Unit at
SIPCOT, Perundurai 9,000 MT
per annum with trendsetter
Effluent Treatment Plant

Evolution Contd…
11
2010-11
2012-13
2014-15
2010 – Exclusive value
added Compact Spinning
unit of 1,03,680 spindles at
Karumathampatti & Wind
Mills
2011 – Modernization &
expansion of 21,216
spindles at
Sathyamangalam
2012 – Another Value
added product Melange
yarn. 16,608 spindles at
Karumathampatti.
2013 - Co-gen cum Sugar
Plant at Karnataka - 30
MW & 5000 TCD capacity
2014 - Expanded Garment
capacity at Arasur by 10
Mn garments,
2015 - New green field
Garment capacity at
Thekkalur with 12 Mn
garments

Evolution Contd…
12
2018-19
2016-17
2018 – Established 10 Million
Garment Manufacturing unit
at Mekelle, Ethiopia.
2019 – Increased Processing
capacity by 4000 MT
2019 – Brown field garment
expansion by 10 Mn
Garments
2016 – Established New green
field garment facility of 36 Mn
garments.
2017 Established new Eco-
friendly Processing capacity with
Advanced Technology - 9000 MT.
Established Sophisticated high
resolution printing division – 7500
MT
2019 – Setting up 90 KLPD
Ethanol Plant with an estimated
Cost of Rs.120 Crores
2019 –Retail segment : ‘FASO’
100% Organic Cotton Men’s
innerwear launched
2019 - To enlarge export
activities in Asia, established a
Wholly owned Subsidiary
Company at Singapore
2019-20

Key Highlights of FY 2020
13
FY20 Garments Production up by 4.76% YoY to
98.67 Mn Garments as against 94.19 Mn Garments
FY20 EBITDA up ` 658.40 Crores (Previous Year
` 648.65 Crores)
FY20 PBT up ` 471.67 Crores (Previous Year ` 468.58 Crores) FY20 PAT up ` 376.68 Crores (Previous Year ` 334.87 Crores)

Key Highlights of FY 2020 Contd…
14
In March 2020, the World Health Organization declared COVID-19 to be a pandemic. The Company has
adopted measures to curb the spread of infection in order to protect the health of its employees and ensure
business continuity with minimal disruption. In view of the pandemic, the Company has considered internal
and external information and has performed an analysis based on current estimates while assessing the
recoverability of assets including trade receivables, inventories and other current / non-current assets (net of
provisions established) for any possible impact on the standalone financial results. The Company has also
assessed the impact of this whole situation on its capital and financial resources, profitability, liquidity
position, internal financial controls etc., and is of the view that based on its present assessment, this
situation does not materially impact these standalone financial results. The Management believes that the
Company will not have any challenge in meeting its financial obligations for the next 12 months. In this
regard, the Company will continue to closely monitor any material changes to future economic conditions.
Due to COVID-19 Pandemic, the Top Management has voluntarily undertaken 50% cut in their remuneration
for the FY 2020, to reduce the financial burden to the Company at this juncture
Owing to the prevailing market conditions which has led to significant decline in the price of cotton and
considering management’s intention to hold a portion of its inventory as stock-in-trade, the Company had
measured the said inventory at lower of cost and net realizable value. Consequent to the above, the amount
of write-down charged to the income statement for the quarter and year ended 31.03.2020 was ` 43.47
Crores.

Consolidated P&L
15
` Crore Q4 FY20 Q4 FY20 FY20 FY19
Revenue 882 958 3389 3421
Raw Material 564 585 1987 2027
Employee Expenses 79 96 394 381
Other Expenses 93 110 349 364
EBITDA 146 167 659 649
EBITDA Margin 16.6% 17.4% 19.4 19.0%
Interest & Finance Charges 12 14 50 49
Depreciation 37 32 137 131
PBT 97 121 472 469
Tax 16 35 95 134
PAT 81 86 377 335
PAT Margin 9.2% 9.0% 11.1% 9.8%

Self sufficiency in Power with 92 MW Green Power portfolio
One of the largest Captive power generators in Textile Industry
Invested in eco-friendly Wind Mills at Tirunelveli, Tenkasi, Theni & Coimbatore Districts in Tamil Nadu, India
Total Wind Power Capacity 61.92 MW
60% of Textile power requirement met through wind power
16
Strategic Investment in Wind Power Project 61.92 MW
Invested in 30 MW Co-Gen Power Project
With Co-gen Power, KPR attained self sufficiency in meeting its substantial power requirement throughout the year
Investments in Co-Gen Power Project 30 MW

1,621
1,559
1,611
804
1,006
1,341
191
265
252
201
195
180
FY 17
FY 18
FY 19
Yarn & Fabric Garments Sugar Others
Segment Wise Revenue contribution
17
` in Crore
1,416 1413 341 183 FY20
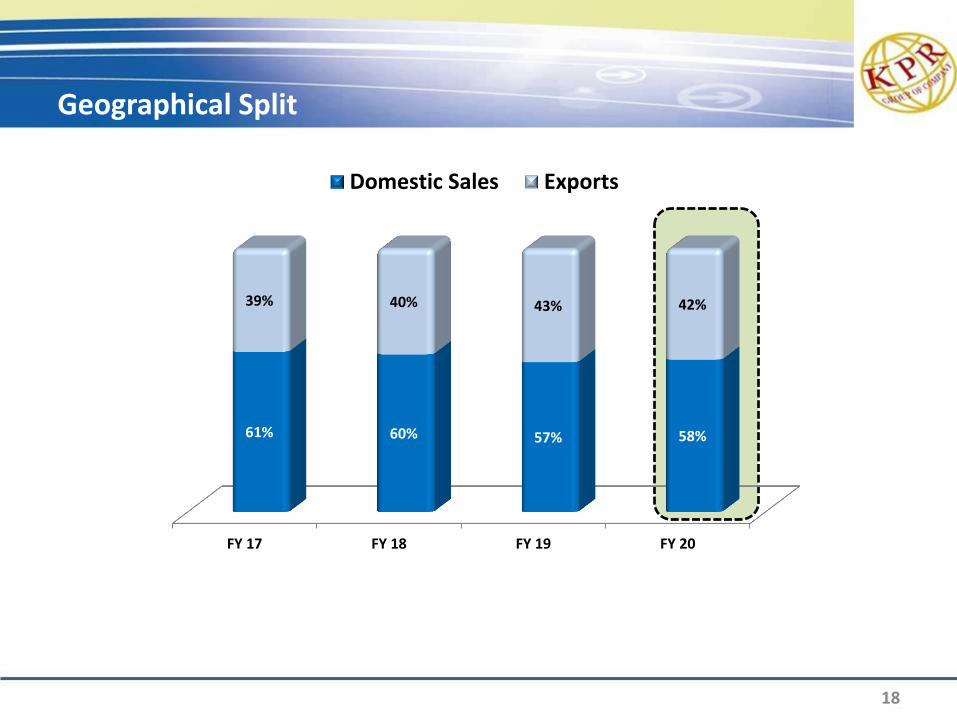
FY 17 FY 18 FY 19 FY 20
61% 60% 57% 58%
39% 40% 43% 42%
Domestic Sales Exports
Geographical Split
18

71,965
66,526
FY19 FY20
-7.6%
Yarn & Fabric Sales [MT] Yarn & Fabric Sales [` Crore]
Yarn & Fabric
19
1,611
1,416
FY19 FY20
-12.1%
Note : Captive consumption of Yarn & Fabric increased in FY20

936 980
FY19 FY20
4.7%
Garment Sales [No. of Garments in Lacs] Garment Sales [` Crore]
Garments
20
1,341 1,413
FY19 FY20
5.4%

Historical Performance
21
FY 17 FY 18 FY 19 FY 20
804
1,006
1,341 1,413
FY 17 FY 18 FY 19 FY 20
579
764
936 980
Garment Sales [No. of Garments in Lacs]
Garment Sales [` Crore]
FY 17 FY 18 FY 19 FY 20
1621 1559 1611 1416
FY 17 FY 18 FY 19 FY 20
79,744 74,970 71,965 66,526
Yarn & Fabric Sales [MT]
Yarn & Fabric Sales [` Crore]
Note : Captive consumption of Yarn & Fabric increased in FY 2020

22
Particulars FY 16 FY 17 FY 18 FY19 FY20
Profit After Tax - ` Crores 210.11 286.82 290.38 334.87 376.68
- Buyback - ` Crores -- 97.02 108.13 263.31 --
- Dividend - ` Crores 45.36 6.67 6.54 6.54 36.27
- Dividend % 100 15 15 15 90
Profit distributed to Share Holders

For further information, please contact:
23
Company :
KPR Mill Limited CIN - L17111TZ2003PLC010518 Mr. PL Murugappan, CFO [email protected] www.kprmilllimited.com