qatar economic outlook 2014-2016
TRANSCRIPT

Qatar Economic Outlook
Update2014-2016

Qatar Economic Outlook 2014–2016Update

Copyright 2014 by the Ministry of Development Planning and Statistics, Qatar.
Published December 2014.
Ministry of Development Planning and Statistics, QatarDoha TowerP.O. Box 1855Doha, Qatar
www.mdps.gov.qa
The content of this publication may be freely reproduced for non-commercial purposes with attribution to the copyright holder.
DISCLAIMER: The views expressed in the Qatar Economic Outlook 2014–2016 Update reflect the professional assessment of staff members of the Ministry of Development Planning and Statistics (MDP&S). They do not necessarily represent the official views of MDP&S or of the State of Qatar. While every effort has been made to ensure the accuracy of all data and information, MDP&S accepts no responsibility for errors in sources or in their reporting. The data cut-off for this report was 15 November 2014.

iii
Foreword
This Qatar Economic Outlook 2014–2016 Update revisits the analysis presented in June 2014 and expands the analysis to 2016.
Robust economic growth is expected during 2014–2016. The assessment in this Update broadly reaffirms the perspective offered in June of this year, in that the non-hydrocarbon sector, led by services and construction, continues to account for most of the economy’s expansion. This pattern is likely to be maintained for the foreseeable future.
Consumer price inflation picked up in the third quarter of 2014, as anticipated, but moderate inflation in the first half of the year will restrain the year’s average. Inflation is set to nudge up in 2015 and 2016: despite subdued global commodity prices, the expanding population will continue exerting pressure on local non-traded services, particularly residential rents. Inflation will, though, stay manageable and is unlikely to present any threat to macroeconomic stability.
On the fiscal side, while an overall fiscal surplus again is assured in 2014, it is poised to narrow over the projection period owing to robust spending growth and the likelihood of lower hydrocarbon-related revenue. Oil and gas revenues collected during the first half of the fiscal year are down on the first half’s outcome of previous years.
The recent declines in oil prices, if they persist or deepen, could represent a key downside risk to the outlook in the medium term. However, the near-term impact of lower oil prices and fiscal revenues on the real economy will be mitigated by the substantial fiscal buffers that the state possesses.
This Update could not have been produced without the generous cooperation of other agencies. I would therefore like to thank Qatar Central Bank; Qatar Petroleum; the Ministry of Economy and Commerce; and the Ministry of Finance for their continuous cooperation in providing us with the information and data required. A special thanks goes to the Public Investment Management Department in the Ministry of Finance, who prepared the box on public investment management in Qatar.
H.E. Dr. Saleh Al Nabit
Minister
Ministry of Development Planning and Statistics
December 2014

iv
Dr. Frank Harrigan led the team at the Ministry of Development Planning and Statistics. Inputs were provided by Zeiad Abdel-Rahman, Christian Hiddink, Dr. Issa Ibrahim, Sylvie Maalouf, Thaddeus Malesa, and Dr. Osama Noujoum. Research and administrative support was provided by Hissa Ahmed Al-Assiry, Noor Al-Kuwari and Haya Al-Semaiti.
The Economic Statistics and National Accounts Department, led by Hassan Mohammed Al-Emadi, provided invaluable data inputs and advice. Colleagues in the departments of Joint Services, led by Hamad Rashid Al-Athba, and Public Relations and Communications, led by Torfa Saad Al Zarraa, facilitated the production and launch of the report. Jonathan Aspin copy edited the report and designed the layout. Osama Al-Manasir assisted in designing Arabic graphics and layout. Ali Barazi translated the English version into Arabic.
Acknowledgements

v
Contents
Foreword iii
Acknowledgements iv
Qatar—Update at a glance 1Economic growth—robust, driven by the non-hydrocarbon sector 1
Inflation—moderate, but marginally rising 1
Fiscal balance—comfortable, but narrowing 1
External balance—in surplus, yet gradually declining 2
Risks to the outlook—pressure from lower oil prices balanced by fiscal buffers 2
Part 1—Outlook for 2014–2016 3The Update on the outlook 3
Economic prospects 4
Consensus forecasts—GDP and inflation 7
Prospects for energy and commodity markets 9
Global economic prospects 13
Part 2—Performance in 2014 15Economic growth 15
Prices and asset markets 17
Money supply and credit 20
Fiscal accounts 22
Trade and balance of payments 25
Glossary—Key economic concepts 27

vi
Qatar Economic Outlook 2014–2016 Update
Tables
Qatar—Update at a glance 1
Table 1.1 Qatar, latest forecasts of key indicators 3
Table 1.2 Poll of economic forecasts for Qatar, as of 15 November 2014 (%) 8
Boxes
Box 1.1 Forecast methodology and assumptions 4
Box 1.2 WEO sees increased downside risks 13
Box 1.3 Oil break-even prices across the region 14
Box 2.1 Demand components of nominal GDP 16
Box 2.2 The elements of economic diversification 18
Box 2.3 Other revenue 22
Box 2.4 Public investment management 23

vii
Figures
Figure 1.1 The outlook for Qatar 3
Figure 1.2 Contributions to GDP growth (percentage points) 4
Figure 1.3 Sectoral shares in GDP (%) 5
Figure 1.4 Sectoral growth in the economy, constant 2004 prices (%) 5
Figure 1.5 Break-even oil price 6
Figure 1.6 Consensus estimates of real GDP growth (%) 7
Figure 1.7 Consensus estimates of nominal GDP growth (%) 8
Figure 1.8 Consensus estimates of inflation (%) 8
Figure 1.9 Average daily crude oil spot price ($ per barrel) 9
Figure 1.10 Annual average crude oil price ($ per barrel) 9
Figure 1.11 International crude oil and liquid fuel, global demand and supply 10
Figure 1.12 Natural gas price index (2005 = 100) 10
Figure 1.13 Spot price ratios: Crude oil to gas 10
Figure 1.14 Natural gas prices ($ per mmbtu) 10
Figure 1.15 Average monthly crude oil prices: Spot vs futures 11
Figure 1.16 Non-fuel commodity price index (2005 = 100) 13
Figure 1.17 Global real GDP growth projections (%) 13
Figure 1.18 Regional real GDP growth projections (%) 14
Figure 1.19 Regional inflation projections (%) 14
Figure 2.1 GDP growth, nominal and real (%) 15
Figure 2.2 Real GDP growth: Hydrocarbons and non-hydrocarbons (%) 15
Figure 2.3 Contributions to real GDP growth (percentage points) 16
Figure 2.4 Services growth (%) 16
Figure 2.5 Total population (million) 17
Figure 2.6 Construction growth (%) 17
Figure 2.7 Manufacturing growth (%) 17
Figure 2.8 Hydrocarbons and non-hydrocarbons, share of nominal GDP (%) 17
Figure 2.9 Monthly headline and core inflation growth (year on year, %) 17
Figure 2.10 Monthly inflation (year on year, %) 19
Figure 2.11 Producer price index growth (year on year, %) 19
Figure 2.12 QE Index and S&P Global 100 (year-on-year change, %) 19

viii
Qatar Economic Outlook 2014–2016 Update
Figure 2.13 GCC stock price indices and S&P Global (year-on-year change, %) 19
Figure 2.14 QCB real estate price index 20
Figure 2.15 Money supply (M2 ) 20
Figure 2.16 Contribution to money supply growth (percentage points) 20
Figure 2.17 Contribution to domestic credit growth (percentage points) 21
Figure 2.18 Growth of commercial banks’ private sector credit (year-on-year change, %) 21
Figure 2.19 Private business credit by main sectors (QR billion) 21
Figure 2.20 Balance of deposits and credits for the public sector, private sector and individuals 22
Figure 2.21 Total government revenue (QR billion) 22
Figure 2.22 Expenditure growth (%) 23
Figure 2.23 Fiscal balances, expenditure and revenue (% of GDP, current prices) 23
Figure 2.24 Fiscal revenue, first-half actual and budget, FY2014/15 (QR billion) 23
Figure 2.25 Fiscal revenue, first-half actual (QR billion) 24
Figure 2.26 Fiscal expenditure, first-half actual and budget FY2014/15 (QR billion) 24
Figure 2.27 Fiscal expenditure, first-half actual (QR billion) 24
Figure 2.28 Fiscal balance, first-half actual (QR billion) 25
Figure 2.29 Current account components (% of nominal GDP) 25
Figure 2.30 Foreign reserves (QR billion) 25

1
Economic growth—robust, driven by the non-hydrocarbon sector
This Update reaffirms projections made in June’s Qatar Economic Outlook and foresees robust economic growth persisting through to 2016 (see table). Solid expansion in non-hydrocarbon activities will continue to drive overall economic momentum, propelled by investment spending, an expansionary fiscal stance and population growth. Services will be the largest contributor to growth, followed by construction.
Whereas flat gas production and receding oil output are seen checking overall expansion in 2014, the commissioning of production from Barzan in 2015 is set to support higher economic growth in 2015–2016. The year 2015 will see the non-oil and gas sector accounting for more than 50% of nominal output for the first time since 2009 when oil prices were at depressed levels.
Qatar’s economy expanded by 5.9% year on year in real (volume) terms in the first half of 2014. The decelerating pace from previous years stemmed from declining
Qatar—Update at a glance
Qatar—Update at a glance
2014 2015 2016
Real GDP growth (%) 6.3 7.7 7.5
Nominal GDP growth (%) 6.5 6.7 8.0
Consumer price inflation (%) 3.0 3.5 3.7
Fiscal surplus (% of nominal GDP) 12.9 8.7 4.7
Current account surplus (% of nominal GDP)
24.8 19.5 16.0
Note: Real GDP in constant 2004 prices.Source: Estimates from the Ministry of Development Planning and Statistics.
output at maturing oil fields and lower gas production after maintenance shutdowns in major liquefied natural gas (LNG) facilities. In nominal terms the economy grew by 5.2% over the first half, the slower rate due to terms-of-trade losses on sliding international oil prices.
Inflation—moderate, but marginally rising
Annual inflation, as measured by the change in Qatar’s consumer price index, is forecast to average 3.0% in 2014, and to nudge up to 3.5% in 2015 and 3.7% in 2016. Domestic sources of inflationary pressures are expected to build over the projection period as domestic demand strengthens, but they will be mitigated by a benign global inflationary outlook.
Annual average inflation over the 12 months to October 2014 was 3.0%. Rising monthly inflation continued to be led by rent, utilities and related household services, which grew by 8.1% in October year on year, the fastest since end-2009. Foreign inflationary pressures were absent, mirroring soft food and commodity prices globally.
Fiscal balance—comfortable, but narrowing
In calendar years 2014–2016, the overall fiscal balance is expected to stay in surplus. It is, though, set to narrow as public investment spending gathers pace, and as hydrocarbon revenue and transfers of investment income from Qatar Petroleum edge down. Given maturing oil fields and LNG maintenance shutdowns,

2
Qatar Economic Outlook 2014–2016 Update
oil and gas revenues in the first half of the fiscal year (April–September) were down on first-half outcomes of previous years.
External balance—in surplus, yet gradually declining
The external current account surplus is expected to continue drifting down over the forecast period, but remain ample. The key factors are declining hydrocarbon export revenue, rising imports (reflecting stronger domestic demand) and higher foreign workers’ remittances (in line with the expected growth in the expatriate population).
Qatar posted a substantial trade surplus in the first half of 2014 of 52% of nominal GDP, though somewhat lower than the outcome in the first half of 2013. Merchandise export proceeds rose; the increase was offset by import growth, mainly in machinery, transport equipment and miscellaneous manufactured articles. This pattern, along with a continuing rise of service imports and remittances, led to a slightly lower current account surplus than in the same period in 2013, of 30.4% of nominal GDP.
Risks to the outlook—pressure from lower oil prices balanced by fiscal buffers
The economic outlook for 2014–2016 is generally favourable, and although falling oil prices could be a key downside external risk if they persist for long or become steeper, their impact on the wider economy is likely to be shielded by Qatar’s considerable fiscal headroom.
Domestic risks mainly concern the scale and complexity of Qatar’s planned infrastructure project portfolio. A sharp increase in spending over a short period could generate domestic overheating pressures and higher project costs.

3
the International Monetary Fund (IMF) (released in October 2014) and from the World Bank, which form the foundation for our baseline oil price assumptions, are broadly in line with those used in June’s QEO. They imply a recovery of oil prices in 2015–2016 from their current (mid-November) levels. The QEO forecast methodology and assumptions are summarised in box 1.1. The section Risks to the outlook discusses the fiscal headroom that might be available to absorb lower oil prices.
Part 1—Outlook for 2014–2016
Robust economic growth is expected during 2014–2016. Solid expansion in non-hydrocarbon activities will continue to drive overall economic momentum, propelled by investment spending and population growth. By 2015, the non-hydrocarbon sector will account for more than half of nominal GDP. Whereas flat gas production and receding oil output are seen checking overall growth in 2014, the commissioning of production from Barzan in 2015 is set to support higher economic growth rates in 2015–2016.
Consumer price inflation picked up in the third quarter of 2014, as foreseen in the Qatar Economic Outlook (QEO) of June 2014, but moderate inflation in the first half of the year will restrain the year’s average, and benign global inflation alongside the recent appreciation of the US dollar will help offset domestic sources of inflationary pressure in the near term. Still, inflation is set to rise gradually in 2015–2016, as these domestic sources continue simmering and global prices slowly start to stabilise.
Balance-of-payments surpluses are set to continue during 2014–2016, although declining on the back of stronger domestic demand, which will pull in imports, and lower hydrocarbon export receipts. And while an overall fiscal surplus again seems assured in 2014, it is poised to narrow over the projection period owing to robust spending growth and lower hydrocarbon-related revenue.
The recent declines in oil prices, if they persist or become steeper still, could represent a key downside risk to the outlook. However, their near-term impact on fiscal spending and the real economy will be mitigated by the substantial fiscal buffers that the state possesses.
The Update on the outlookTable 1.1 provides a summary of the latest baseline forecasts for key macroeconomic indicators for the outlook period, which has been extended through to 2016.
Figure 1.1 compares the current forecasts with those made in the previous QEO, issued in June. This Update has broadly maintained June’s forecasts as these have been largely validated by the subsequent data releases and events. The only notable departure is an upward revision to the fiscal surplus, reflecting stronger than expected investment income receipts. Although oil prices have fallen sharply in recent months, the latest forecasts from the World Economic Outlook (WEO) of
Table 1.1 Qatar, latest forecasts of key indicators
2014 2015 2016
Real GDP growth (%) 6.3 7.7 7.5
Nominal GDP growth (%) 6.5 6.7 8.0
Consumer price inflation (%) 3.0 3.5 3.7
Fiscal surplus (% of nominal GDP) 12.9 8.7 4.7
Current account surplus (% of nominal GDP)
24.8 19.5 16.0
Note: Real GDP in constant 2004 prices.Source: Estimates from the Ministry of Development Planning and Statistics (MDP&S).
Figure 1.1 The outlook for Qatar
Real GDPgrowth (%)
Nominal GDPgrowth (%)
Consumer pricein�ation (%)
Fiscal surplus(% of nominal
GDP)
Current accountsurplus (% of nominal GDP)
0
5
10
15
20
25
30
0
5
10
15
20
25
30
QEO UpdateQEO June 2014
2015201420152014201520142015201420152014
6.36.37.87.7 6.86.5 6.6 6.7
3.03.0 3.4 3.5
9.3
12.9
5.5
8.7
25.124.8
19.519.5
Source: MDP&S estimates.
Click here for chart data
4
Qatar Economic Outlook 2014–2016 Update
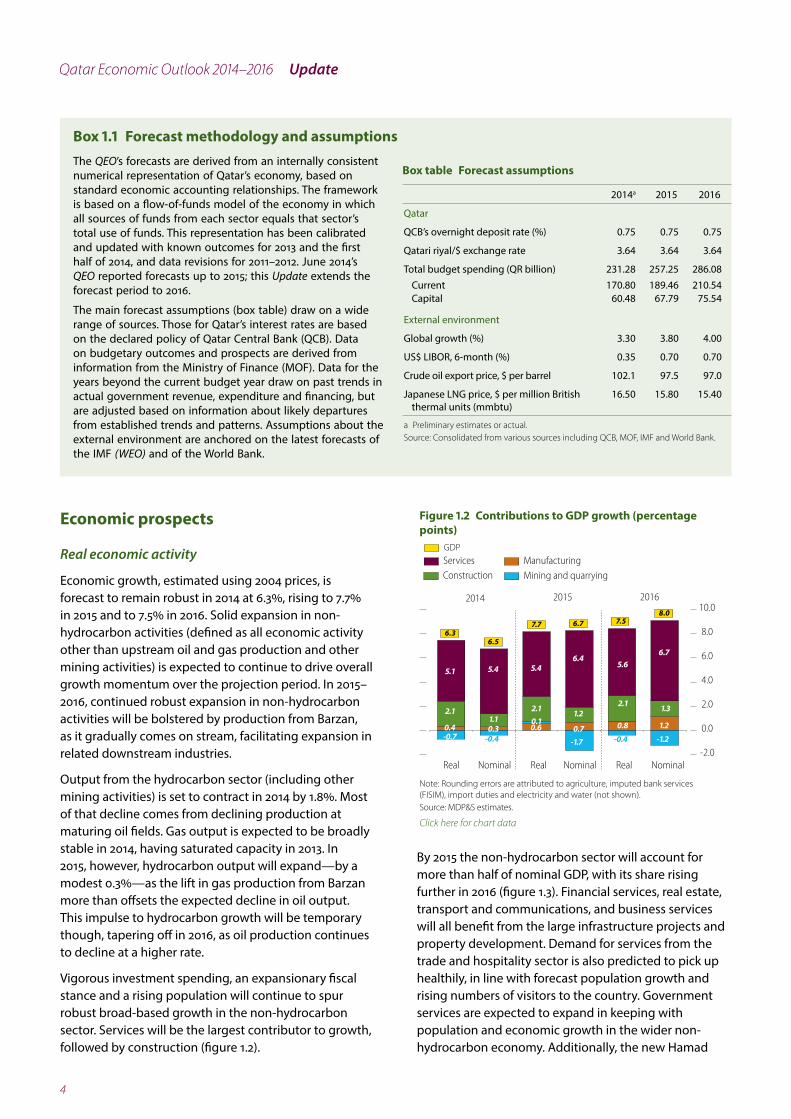
Box 1.1 Forecast methodology and assumptionsThe QEO’s forecasts are derived from an internally consistent numerical representation of Qatar’s economy, based on standard economic accounting relationships. The framework is based on a flow-of-funds model of the economy in which all sources of funds from each sector equals that sector’s total use of funds. This representation has been calibrated and updated with known outcomes for 2013 and the first half of 2014, and data revisions for 2011–2012. June 2014’s QEO reported forecasts up to 2015; this Update extends the forecast period to 2016.
The main forecast assumptions (box table) draw on a wide range of sources. Those for Qatar’s interest rates are based on the declared policy of Qatar Central Bank (QCB). Data on budgetary outcomes and prospects are derived from information from the Ministry of Finance (MOF). Data for the years beyond the current budget year draw on past trends in actual government revenue, expenditure and financing, but are adjusted based on information about likely departures from established trends and patterns. Assumptions about the external environment are anchored on the latest forecasts of the IMF (WEO) and of the World Bank.
Box table Forecast assumptions
2014a 2015 2016
Qatar
QCB’s overnight deposit rate (%) 0.75 0.75 0.75
Qatari riyal/$ exchange rate 3.64 3.64 3.64
Total budget spending (QR billion) 231.28 257.25 286.08Current 170.80 189.46 210.54Capital 60.48 67.79 75.54
External environment
Global growth (%) 3.30 3.80 4.00
US$ LIBOR, 6-month (%) 0.35 0.70 0.70
Crude oil export price, $ per barrel 102.1 97.5 97.0
Japanese LNG price, $ per million British thermal units (mmbtu)
16.50 15.80 15.40
a Preliminary estimates or actual.Source: Consolidated from various sources including QCB, MOF, IMF and World Bank.
Economic prospects
Real economic activity
Economic growth, estimated using 2004 prices, is forecast to remain robust in 2014 at 6.3%, rising to 7.7% in 2015 and to 7.5% in 2016. Solid expansion in non-hydrocarbon activities (defined as all economic activity other than upstream oil and gas production and other mining activities) is expected to continue to drive overall growth momentum over the projection period. In 2015–2016, continued robust expansion in non-hydrocarbon activities will be bolstered by production from Barzan, as it gradually comes on stream, facilitating expansion in related downstream industries.
Output from the hydrocarbon sector (including other mining activities) is set to contract in 2014 by 1.8%. Most of that decline comes from declining production at maturing oil fields. Gas output is expected to be broadly stable in 2014, having saturated capacity in 2013. In 2015, however, hydrocarbon output will expand—by a modest 0.3%—as the lift in gas production from Barzan more than offsets the expected decline in oil output. This impulse to hydrocarbon growth will be temporary though, tapering off in 2016, as oil production continues to decline at a higher rate.
Vigorous investment spending, an expansionary fiscal stance and a rising population will continue to spur robust broad-based growth in the non-hydrocarbon sector. Services will be the largest contributor to growth, followed by construction (figure 1.2).
By 2015 the non-hydrocarbon sector will account for more than half of nominal GDP, with its share rising further in 2016 (figure 1.3). Financial services, real estate, transport and communications, and business services will all benefit from the large infrastructure projects and property development. Demand for services from the trade and hospitality sector is also predicted to pick up healthily, in line with forecast population growth and rising numbers of visitors to the country. Government services are expected to expand in keeping with population and economic growth in the wider non-hydrocarbon economy. Additionally, the new Hamad
Figure 1.2 Contributions to GDP growth (percentage points)
- - -
Real Nominal Real Nominal Real Nominal
2014 2015 2016
ManufacturingConstruction Mining and quarryingServicesGDP
-2.0
0.0
2.0
4.0
6.0
8.0
10.0
5.1 5.4 5.46.4
5.66.7
2.11.1
2.1 1.22.1 1.3
0.4 0.30.1
0.7 0.8 1.2-0.7 -0.4
0.6
-1.7 -0.4 -1.2
6.36.5
7.7 6.7 7.58.0
Note: Rounding errors are attributed to agriculture, imputed bank services (FISIM), import duties and electricity and water (not shown). Source: MDP&S estimates.
Click here for chart data

5
Part 1 Outlook for 2014–2016
International Airport—now operational for cargo and passengers—is seen boosting a range of logistical and other related service activities.
As was the case in the first half of 2014, construction is expected to continue recording the strongest growth among all economic sectors during the projection period (figure 1.4). It will continue to benefit from the rollout of planned public investment projects, including local roads and expressways, Doha metro and rail, drains and sanitation, and construction of new health centres and education facilities. The building of stadiums and other infrastructure for the FIFA World Cup 2022 will also gather momentum. Private construction activity centred on residential and commercial real estate development, including new malls, hotels and labour accommodation, will also support the sector’s expansion.
After sluggish outturns in 2013 and 2014, manufacturing growth rates will rebound somewhat in 2015 and continue to pick up in 2016 (see figure 1.4). This revival will be driven mainly by the planned capacity expansion in downstream activities, supported by availability of feedstock from Barzan. Beyond that, growing demand from construction activity for cement and metals should encourage some investment in new capacity, prompting growth in other segments of manufacturing.
Nominal GDP
Qatar’s GDP deflator is susceptible to movements in hydrocarbon product prices, which are determined on international markets. Rising hydrocarbon prices tend to raise the growth rate of nominal GDP relative to that of real GDP—vice versa for falling prices.
Despite robust real GDP expansion, nominal GDP growth is predicted to moderate slightly from 6.8% in 2013 to 6.5% in 2014 and to 6.7% in 2015, mainly on assumed lower hydrocarbon prices. In 2016, nominal GDP growth is set to increase to 8.0% on the back of solid expansion in nominal non-hydrocarbon activities, supported by stabilising hydrocarbon prices.
Inflation
Annual inflation, as measured by the change in Qatar’s consumer price index, is forecast to average 3.0% in 2014, and to nudge up to 3.5% and 3.7% in 2015 and 2016. Domestic sources of inflationary pressures are expected to build over the projection period as local demand strengthens. The vigorous growth of local demand will push up prices of non-tradable goods and services, including rentals, especially in affordable housing for the low- to middle-income segment of the market where availability is usually tighter.
Benign global inflationary conditions and the US dollar’s recent appreciation will help offset domestic sources of inflationary pressure in the near term, keeping overall inflation in check. Nonetheless, the offset from falling global commodity and manufactured goods prices is set to diminish gradually as global prices are expected to slowly stabilise.
Risks of rapidly accelerating inflation seem contained at the moment but consumer price pressures would pick up if imported inflation gathered pace more quickly than currently foreseen. A global commodity supply shock, a depreciation of the US dollar or an unanticipated global demand recovery would add to local price pressures.
Figure 1.3 Sectoral shares in GDP (%)
2014 2015
0
20
40
60
80
100
0
20
40
60
80
100
Mining and quarryingConstruction
ServicesManufacturing
Nominal Real Nominal Real Nominal Real
2016
37.8
13.0
8.9
42.9
50.735.2 46.0 32.4 41.4
5.5
14.06.3
15.07.0
35.4 44.939.2 46.9 42.4
9.6 8.8 9.6 8.9 10.0
Note: Rounding errors are attributed to agriculture, imputed bank services (FISIM), import duties and electricity and water (not shown). Source: MDP&S estimates.
Click here for chart data
Figure 1.4 Sectoral growth in the economy, constant 2004 prices (%)
7.46.5
-5
0
5
10
15
20
-5
0
5
10
15
20
201620152014
Electricity and water
Services
Manufacturing
Construction
Mining and quarrying
Agriculture
6.5
17.516.1
15.0
3.8
6.48.7
12.5 12.5 12.4
8.57.5 7.0
-1.8
0.3
-1.1
Source: MDP&S estimates.
Click here for chart data

6
Qatar Economic Outlook 2014–2016 Update
impact on the wider economy is likely to be shielded by the available fiscal headroom.
A useful metric for gauging fiscal space or headroom is the “break-even” price of oil (and see box 1.3 below). For given levels of hydrocarbon output, government spending and non-hydrocarbon fiscal revenue (including investment income received from QP), the break-even price is that which generates enough hydrocarbon revenues to fund the non-hydrocarbon deficit.
The QEO’s estimates, which assume full indexation of gas revenue to oil prices, point to break-even prices of $42 and $55 in 2014 and 2015 (figure 1.5). Break-even prices at these levels provide a large cushion over market prices as of mid-November 2014. These revised break-even prices are lower than those reported in June’s QEO for 2014 and 2015 owing to the larger investment income that MOF has received from QP in 2014 than foreseen in June. For fiscal year 2014/15 this investment income has already been realised (see part 2) and so will not be affected by the recent decline in oil prices.
In 2016, however, the break-even price is expected to ratchet up to about $71 as government expenditure continues to grow, oil production declines and QP’s financial surplus moderates. Yet the projected break-even price remains significantly below the latest consensus forecasts for oil prices in 2016 (see Prospects for energy and commodity markets below), and if required the state’s large financial reserves could be deployed to shore up planned spending.
These estimates de-link QP’s financial surpluses and transfers to the budget from oil prices. However, if QP’s future financial surpluses and investment income received on the budget were adversely affected by lower oil prices, the implied fiscal break-even prices
Fiscal outlook
The fiscal surplus is predicted to remain robust in 2014 at nearly 13% of GDP—though down a little on 2013’s outcome—and is set to narrow further over the rest of the projection period (see table 1.1). (Fiscal estimates and forecasts are made on a calendar-year basis; MOF data are provided on an April–March fiscal year basis.) This narrowing will be driven by a combination of growing expenditure (capital and recurrent) as the public investment programme gathers pace, and of slipping hydrocarbon revenue (reflecting both declining output from maturing oil fields and lower hydrocarbon prices).
The strong boost to the fiscal surplus that larger investment income transferred from Qatar Petroleum (QP) gave in 2013 and 2014 (box 2.4 in June’s QEO) is set to moderate gradually over the rest of the outlook period. This fading impetus is expected as hydrocarbon receipts continue declining and as QP spending picks up over 2015–2016, with investments in recovery of oil from maturing fields.
The mirror image of the narrowing headline fiscal surplus is a widening of the non-hydrocarbon deficit as a share of GDP, to 10.9% and 13.1% in 2015 and 2016, from 8.8% in 2014. Relative to non-hydrocarbon GDP, this deficit is expected to increase from nearly 18% in 2014 to 20.2% and 22.3% in 2015 and 2016. This widening suggests an expansionary fiscal stance over the next two years, which will support growth of the non-hydrocarbon economy.
Balance of payments
The external current account surplus is expected to drift down over the projection period but to remain ample (see table 1.1). The key factors are the decline in hydrocarbon export revenue, higher imports (reflecting stronger domestic demand) and higher foreign workers’ remittances (in line with the expected growth in the expatriate population).
As the bulk of the current account surplus is recycled abroad as overseas investments, the current account surplus will be far greater than the overall balance-of-payments surplus. This overall surplus will support the foreign reserves position of QCB, and so foreign reserves cover is expected to remain robust, comfortably exceeding six months of total imports of goods and services.
Risks to the outlook
The economic outlook for 2014–2016 is still generally favourable, although falling oil prices could be a key downside external risk if they persist for long. Yet their
Figure 1.5 Break-even oil price
0
20
40
60
80
100
120
-120
-100
-80
-60
-40
-20
0
Non-hydrocarbon de�cit Break-even price
20162015201420132012
$ per barrel QR billion
Note: Projections assume the revenue received for Qatar’s LNG basket is indexed to the oil price. Source: Source: MDP&S calculations.
Click here for chart data

7
Part 1 Outlook for 2014–2016
would in the near term be higher. With investment income linked to oil prices, the break-even price could be $70 in 2015, rising to $81 by 2016.
Over the longer term, continued moves to build a sound fiscal position capable of absorbing oil price shocks will be supported by MOF initiatives on forward-looking fiscal policy guidance and modernised budgetary processes.
Spillovers from the world economy through financial channels could represent another external risk. Heightened global financial market volatility could raise funding costs on international and domestic markets. Domestic banking system liquidity conditions may tighten under such a scenario, particularly for banks reliant on foreign currency wholesale funding, with knock-on effects for funding domestic investment projects.
But substitution of short-term funds by debt securities of longer tenure by domestic banks—a trend seen since 2013—is expected to help meet demand for longer-term credit with lower liquidity risks. And the large buffer of foreign assets at the government’s disposal could be used to address any short-term foreign currency liquidity shortage that may arise in the banking system.
As in June, domestic risks are mainly related to the scale and complexity of Qatar’s planned infrastructure project portfolio. A sharp increase in spending over a short period could stretch capacity across several fronts including logistics, front-line services and public administration. Wider congestion in the economy could push up project costs and fuel domestic overheating pressures.
Consensus forecasts—GDP and inflationTable 1.2 (below) presents a summary of the latest publicly available economic forecasts for 2014, 2015 and 2016. A consensus view of Qatar’s prospects is obtained as the mean/median of all projections polled. Since June’s QEO, the real and nominal consensus GDP growth forecasts have been revised upwards for 2014 and 2015, and the consensus inflation forecast is estimated to be slightly lower. One source has not revised its forecasts for some of the indicators, shown in red.
Real GDP growth, 2014 and 2015
The updated consensus mean forecast for Qatar’s real GDP growth in 2014 is 6.1%, slightly higher than the consensus forecast in June (figure 1.6). Most forecasters have either maintained or increased their GDP
forecast for 2014, usually reflecting a better economic performance than most had expected for the first half of the year. This better performance was supported by higher government (investment) spending and stronger non-hydrocarbon growth. And with data for the first half now available, forecasts for 2014 are converging: both the standard deviation and the coefficient of variation are falling relative to June’s forecasts (from 0.8 to 0.4 and from 13.3% to 6.0%).
The 2015 consensus mean forecast is 6.6%, also higher than June’s estimate, though most forecasters do not detail why they have upped their outlook. For 2015, too, the range of forecasts has tightened, with a lower standard deviation and coefficient of variation (from 0.8 to 0.6 and from 13.0% to 9.1%).
This Update largely maintains June QEO’s real GDP growth estimate for 2014 and 2015, at 6.3% and 7.7% (see Economic prospects), which remain slightly above the 2014 and well above the 2015 consensus forecast. However, the gap between QEO and the consensus forecast is narrowing, given the decreasing forecast variation and the recent upward revisions of both 2014 and 2015 consensus forecasts.
Nominal growth, 2014 and 2015
The nominal GDP consensus forecasts for 2014 and 2015 have also been revised up. The 2014 figure is 1.1 percentage points higher than in June, the 2015 forecast 0.8 percentage points higher (figure 1.7). The 2014 coefficient of variation has fallen from 45.7% to 35.5%. For 2015 the dispersion is higher than observed in June, probably reflecting greater uncertainty and wider dispersion in oil price assumptions (see also Prospects for energy and commodity markets).
This Update revises June’s nominal GDP growth estimates for 2014 to 6.5% from 6.8%, reflecting recent data updates, and now foresees marginally higher
Figure 1.6 Consensus estimates of real GDP growth (%)
0123456789
0123456789
2015 (December)
2015 (June)
2014 (December)
2014 (June)
5.9 6.1 6.26.6QEO, 6.3 Update, 6.3
Update, 7.7QEO, 7.8
Source: Staff estimates based on forecasts consolidated from various reports and news articles.
Click here for chart data

8
Qatar Economic Outlook 2014–2016 Update
Inflation forecast, 2014 and 2015
The consensus forecast for consumer price inflation is 3.5% in 2014 and 4.1% in 2015 (figure 1.8), both a notch lower than in June but still higher than the forecasts of this Update. The IMF has also brought down its inflation forecasts, noting that a further softening of food prices in the first half of 2014 and the peg to a stronger US
growth in 2015. The consensus forecasts for nominal GDP growth in 2014 and 2015 are now higher than in June, and closer to the estimates of this Update.
Table 1.2 Poll of economic forecasts for Qatar, as of 15 November 2014 (%)
Economic forecaster Real GDP growth Nominal GDP growth Inflation
2014 2015 2016 2014 2015 2016 2014 2015 2016
BNP Paribas (Oct 14) 6.1 6.9 7.4 .. .. .. 3.4 4.4 4.3Business Monitor International (Sep 14) 5.7 6.6 6.1 2.9 6.9 9.0 3.6 4.5 4.5Capital Economics (Oct 14) 6.5 5.5 5.0 .. .. .. 3.5 4.0 4.0Citigroup (Sep 14) 5.5 6.9 .. 5.4 6.6 .. 4.3 4.0 ..Economist Intelligence Unit (Oct 14) 6.4 6.7 6.1 9.9 10.9 .. 3.7 4.4 4.8Emirates NBD (Aug 14) 6.3 6.9 .. 3.7 7.6 .. 3.6 4.5 ..Fitch Ratings (Oct 14) 5.8 6.9 6.4 6.5 3.4 7.4 3.7 4.5 5.0HSBC (Oct 14) 6.1 6.0 6.1 11.4 10.2 8.9 3.8 4.5 4.6IHS Global Insight (Oct 14) 6.0 6.8 6.3 6.3 7.0 7.9 3.4 4.3 4.8Institute of International Finance (Oct 14) 6.1 6.6 .. 5.0 5.2 .. 3.7 4.0 ..IMF (Oct 14) 6.5 7.7 7.8 4.5 7.1 7.6 3.4 3.5 3.6J.P. Morgan Securities plc (Nov 14) 5.9 6.4 .. … … .. 2.7 4.6 ..National Bank of Kuwait (July 14) 6.4 7.0 .. 6.4 7.0 .. 3.4 3.8 ..Oxford Economics (Oct 14) 6.2 6.8 6.5 6.1 8.5 7.4 3.2 4.2 4.5Qatar National Bank (Sep 14) 6.8 7.5 7.8 7.7 6.1 10.4 3.4 3.5 4.4Roubini Global Economics (Oct 14) 5.9 5.5 5.0 … .. .. 3.2 3.3 3.0SAMBA (Sep 14) 6.7 6.9 .. 6.0 4.0 .. 3.2 3.4 ..Standard and Poor's (Sep 14) 6.0 6.0 5.0 7.5 6.9 6.0 3.5 4.0 4.5Standard Chartered (Sep 14) 5.5 5.8 5.5 … .. .. 3.5 4.2 4.5
Consensus (mean) 6.1 6.6 6.2 6.4 7.0 8.1 3.5 4.1 4.3Median 6.1 6.8 6.1 6.2 6.9 7.7 3.5 4.2 4.5High 6.8 7.7 7.8 11.4 10.9 10.4 4.3 4.6 5.0Low 5.5 5.5 5.0 2.9 3.4 6.0 2.7 3.3 3.0Standard deviation 0.4 0.6 1.0 2.3 2.0 1.3 0.3 0.4 0.5Coefficient of variation (%) 6.0 9.1 15.7 35.5 29.5 16.4 9.1 10.2 12.5
Memo itemsConsensus (mean) June 2014 5.9 6.2 .. 5.6 6.2 .. 3.7 4.2 ..Update forecasts December 2014 6.3 7.7 7.5 6.5 6.7 8.0 3.0 3.5 3.7
... = not availableNote: The World Bank and other forecasters that quote IMF WEO and other secondary sources have been removed from the table. The sample has changed marginally since June 2014’s QEO. Bank of America Merril Lynch and EFG Hermes forecasts have been replaced by BNP Paribas and Capital Economics. Source: Consolidated from various reports and news articles.
Figure 1.7 Consensus estimates of nominal GDP growth (%)
0
1
2
3
4
5
6
7
8
0
1
2
3
4
5
6
7
8
2015(December)
2015(June)
2014(December)
2014(June)
5.66.4 6.2 7.0
QEO, 6.8 QEO, 6.6Update, 6.5 Update, 6.7
Source: Staff estimates based on forecasts consolidated from various reports and news articles.
Click here for chart data
Figure 1.8 Consensus estimates of inflation (%)
0.00.51.01.52.02.53.03.54.04.5
0.00.51.01.52.02.53.03.54.04.5
2015(December)
2015(June)
2014(December)
2014(June)
3.73.5
4.2 4.1
QEO, 3.0 Update, 3.0QEO, 3.4 Update, 3.5
Source: Staff estimates based on forecasts consolidated from various reports and news articles.
Click here for chart data

9
Part 1 Outlook for 2014–2016
dollar justify these minor downward revisions for 2014. This Update in effect maintains the June inflation estimates at 3.0% for 2014 and 3.5% at 2015, still below the consensus forecasts.
Forecasts for 2016
Starting with this publication, the forecast horizon has been extended by one year, in this instance to 2016. (As 2016 forecasts are provided for the first time, no comparison can be made with previous estimates.) Although slightly fewer forecast observations are available for 2016 than for 2014 and 2015, there are still enough to make the exercise pertinent.
In real terms the consensus GDP growth estimate for 2016 is 6.2%, suggesting a slight weakening in economic activity relative to 2015. But in nominal terms an acceleration of growth is expected, to 8.1%. The diverging trend between the real and nominal outlook might reflect an expectation for hydrocarbons of flat or declining volumes but rising prices. The consensus forecast also has a slight pick-up in inflation in 2016, to 4.3%.
This Update’s forecasts see marginally lower real and higher nominal GDP growth than in 2015 (of 7.5% and 8.0% respectively), and inflation edging up (to 3.7%). Further growth of the non-hydrocarbon sector is foreseen, with inflation lifted mainly by continuing upward pressure on rents.
Even though this Update’s estimates follow a similar pattern to the consensus estimates, its growth forecast for 2016 is a full 1.3 percentage points higher than the consensus, and the inflation forecast is 0.7 percentage points lower. The disparity in real GDP growth projections is likely to lie in varying assumptions of the volume of upstream and downstream hydrocarbon activities.
The difference in inflation projections stems largely from this Update’s view that global inflationary conditions are likely to remain benign, limiting any increases in traded goods prices. Although there may be continuing cost pressures on infrastructure projects, these pressures are distinct from those on consumer prices.
Prospects for energy and commodity markets
Oil prices
Global oil prices have dropped sharply since late June, with Brent spot prices in mid-November 2014 more than 30% below their 12-month peak of $115.2 per barrel on 19 June (figure 1.9). A conjunction of expanding supply
from Brazil, Iraq, Libya and the US, marginal declines in output from countries in the Organization of the Petroleum Exporting Countries (OPEC) and subdued demand (particularly from large emerging markets, including China) appears to have dragged prices down. A strengthened dollar (in which oil cargoes are priced) may also have weighed on demand and on price.
Given these developments, the expected average oil price for 2014 has been revised down, although most market participants and major analysts still see prices recovering in 2015–2016. The IMF’s October 2014 WEO, prepared in September when prices had fallen only modestly from their June 2014 peak, expects the simple average of UK Brent, Dubai Fateh and West Texas Intermediate (WTI) to average $99.4 in 2015—far higher than the prevailing spot price as of mid-November 2014—slipping only a little to $97.3 in 2016 (figure 1.10).
In October, the US Energy Information Administration (EIA) forecast that supply growth would moderate in 2015 (figure 1.11), and provide support for a recovery in
Figure 1.9 Average daily crude oil spot price ($ per barrel)
75
85
95
105
115
125US WTIUK Brent
Nov14
Oct14
Sep14
Aug14
Jul14
Jun14
May14
Apr14
Mar14
Feb14
Jan14
Dec13
Nov13
Oct13
Sep13
Aug13
Jul13
Jun13
May13
Apr13
Mar13
Feb13
Jan13
Source: US EIA (http://www.eia.gov/dnav/pet/pet_pri_spt_s1_d.htm), accessed 16 November 2014.
Click here for chart data
Figure 1.10 Annual average crude oil price ($ per barrel)
61.8
105.0 104.1 102.8 99.4 97.3
Forecast
0
15
30
45
60
75
90
105
120
-40
-30
-20
-10
0
10
20
30
40
Growth (%)Average crude oil price
201620152014201320122011201020092008
79.0
104.097.0
-2.0
-3.3-1.3-0.91.0
31.627.9
-36.3
36.4
Note: Simple average of three spot prices: Dated Brent, WTI and Dubai Fateh.Source: IMF, WEO October 2014 database (http://http://www.imf.org/external/pubs/ft/weo/2014/01/weodata/download.aspx), accessed 21 October 2014.
Click here for chart data

10
Qatar Economic Outlook 2014–2016 Update
prices. However, it cautions that future realised prices could differ significantly from its forecasts, given high levels of uncertainty over broader political and economic developments, and decisions about future levels of production from OPEC members. After the OPEC meeting on 27 November 2014 and the decision to hold OPEC output levels steady, oil prices came under further downward pressure.
Gas prices
October’s WEO revised down its forecast for average natural gas prices—a weighted average of European, Japanese and US prices—by 3.3% from the WEO forecast of April 2014. The revision is due to booming production in the US, faster than expected restocking and weaker demand in Europe as economic growth slows (figure 1.12). The pass-through of lower oil prices in the second half of 2014 to longer-term liquefied natural gas (LNG) contract prices in Japan and other parts of Asia is expected in the first part of 2015.
Natural gas continues to be sold at prices substantially less than their energy equivalent parity with oil—in effect, at a discount to oil (figure 1.13), though the discount in the first 10 months of 2014 narrowed relative to that in the same period in 2013 and 2012. Oil and gas remain imperfect substitutes for one another.
Markets for natural gas remain highly geographically segmented. The band separating US and Japanese natural gas prices has widened in 2014, with a spread of $14 per million BTU in October 2014 (figure 1.14). The US has lower prices, where most gas sales are made spot, and Japan higher prices, where gas is sold under long-term contracts. In Europe, gas trades under a variety of arrangements and has been priced between the other two for the last five years.
The IMF and EIA expect average global gas prices to soften further in 2015. They have trimmed global gas demand forecasts, reflecting downward revisions to
Figure 1.11 International crude oil and liquid fuel, global demand and supply (million barrels per day)
86.5
88.0
89.5
91.0
92.5
94.0
95.5Consumption Production
Oct15
Jul15
Apr15
Jan15
Oct14
Jul14
Apr14
Jan14
Oct13
Jul13
Apr13
Jan13
Oct12
Jul12
Apr12
Jan12
Forecast
Source: US EIA (http://www.eia.doe.gov/steo/cf_query/index.cfm), accessed 2 November 2014.
Click here for chart data
Figure 1.12 Natural gas price index (2005 = 100)
Forecast48.6
100
110
120
130
140
150
160
170
180
-40-30-20-1001020304050
Growth (%)Index
201620152014201320122011201020092008
174
110
155154159
165171
154
113
-36.9
11.0
36.2
3.4
-3.7 -3.3 -3.1 0.2
Note: The index is a weighted average of European, Japanese and US prices.Source: IMF, WEO October 2014 database (http://http://www.imf.org/external/pubs/ft/weo/2014/01/weodata/download.aspx), accessed 21 October 2014.
Click here for chart data
Figure 1.13 Spot price ratios: Crude oil to gas
0
10
20
30
40
50
60
70
Oil-gas price equivalent UK Brent: US Henry Hub
Sep14
May14
Jan14
Sep13
May13
Jan13
Sep12
May12
Jan12
Sep11
May11
Jan11
Source: World Bank Commodity Markets database (http://econ.worldbank.org/WBSITE/EXTERNAL/EXTDEC/EXTDECPROSPECTS/0,,contentMDK:21574907~menuPK:7859231~pagePK:64165401~piPK:64165026~theSitePK:476883,00.htmll) and US EIA (http://www.eia.gov/dnav/pet/pet_pri_spt_s1_m.htm), both accessed 16 November 2014.
Click here for chart data
Figure 1.14 Natural gas prices ($ per mmbtu)
02468101214161820
LNG–JapanEurope US Henry Hub
Oct14
Jul14
Apr14
Jan14
Oct13
Jul13
Apr13
Jan13
Oct12
Jul12
Apr12
Jan12
Oct11
Jul11
Apr11
Jan11
Oct10
Jul10
Apr10
Jan10
Oct09
Jul09
Apr09
Jan09
Source: World Bank Commodity Markets database (http://econ.worldbank.org/WBSITE/EXTERNAL/EXTDEC/EXTDECPROSPECTS/0,,contentMDK:21574907~menuPK:7859231~pagePK:64165401~piPK:64165026~theSitePK:476883,00.html) accessed 16 November 2014.
Click here for chart data

11
Part 1 Outlook for 2014–2016
economic growth forecasts for advanced and emerging economies. Europe’s economic prospects look dim for the year ahead (see Global economic prospects), and with it demand for natural gas. Given the recent gas deal between Ukraine and Russia, severed supplies seem less likely (though not inconceivable). US gas supplies are projected to continue outpacing domestic demand but to stay beyond the reach of foreign buyers in the absence of LNG and pipeline infrastructure.
Consensus forecasts—oil and gas
The vast majority of forecasting agencies have revised down their estimates for oil prices in light of the recent sharp price dip, with Brent consensus projections down 2.1% for 2014 and 8.3% for 2015 from those reported in June. Financial investors have become increasingly active on oil markets, and this may have led to sharper price peaks and troughs over the short term.
Over the longer term, however, fundamentals are still the driving force as both demand and supply respond to real prices. In recent years, high prices have supported exploitation of comparatively high-cost, lean oil in North America. With the prospect of lower prices, higher-cost projects may well be cancelled or deferred in, for example, Canada and the Arctic, though technological advances that bring down the costs of production will support supply.
Short-term forecasts of the oil price have typically not drifted too far from actual prices, but given the complex and often unpredictable mix of factors that can influence short-term price movements, these forecasts have rarely proven accurate. The average absolute forecast error as a proportion of the average price (one month ahead) was 4% between January 2012 and September 2014 (figure 1.15).
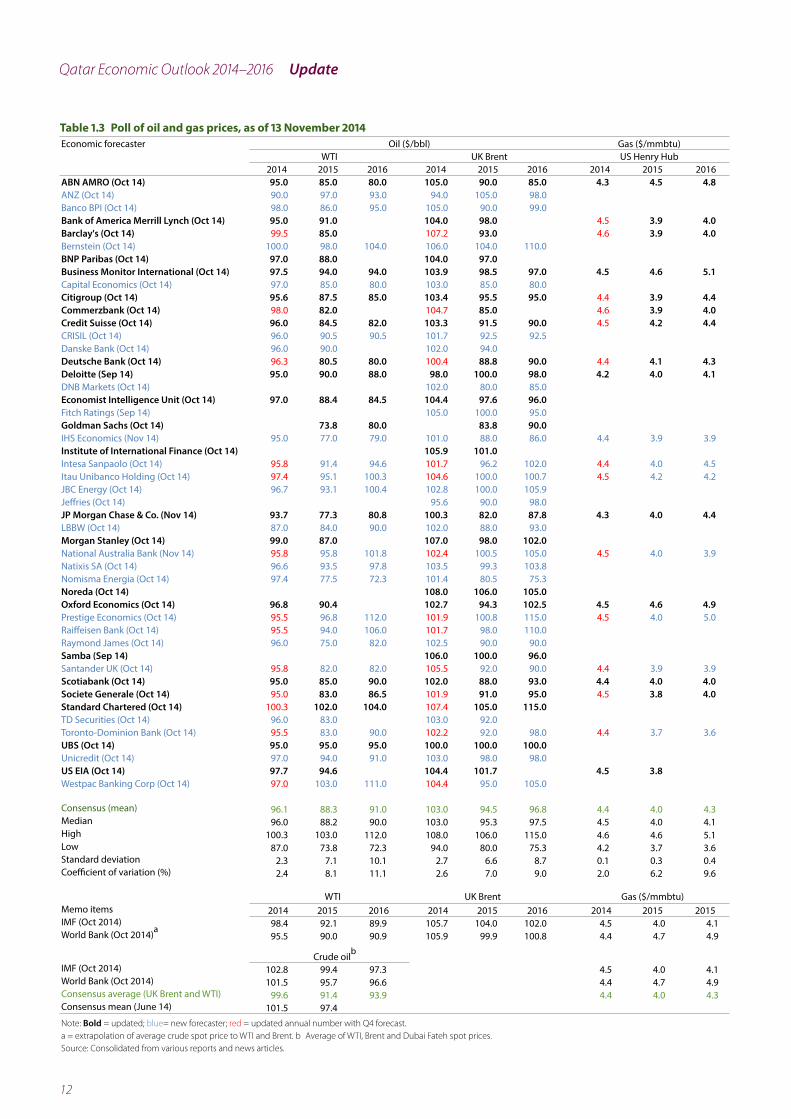
As well as this Update, which anchors its forecasts on the hydrocarbon price outlook of the IMF and World Bank, a wide range of other institutions publish their views on the future trajectory of oil and gas prices (table 1.3).
Expert forecasts of oil prices diverge widely for 2015 and perhaps inevitably (because it is further out) more so for 2016: the range for Brent spans $26 in 2015, stretching to nearly $40 in 2016. The most bearish price forecast for Brent in 2015 is $80.00, and $75.30 in 2016. The World Bank and IMF price forecasts also diverge somewhat, although both are notably above the consensus mean and median, probably because their forecasts predate the sharp falls seen in October and November.
The price difference between Brent and WTI is expected to narrow over the forecast period. Before 2010, WTI had traded at a premium to Brent, a premium that was subsequently reversed as large quantities of crude flowed into Cushing, the major trading hub for oil cargoes in the US, from the Dakotas and Canada. More recently still, high demand from refineries and lower inventories have supported the price of WTI. The consensus is that the premium on Brent will drop to $6.88 per barrel in 2014, $6.21 in 2015 and $5.83 in 2016 from its current level of roughly $10. Some pundits predict that the premium could be eliminated, or even reversed.
For gas prices, the story is broadly similar, with consensus forecasts (based on over 20 observations) expecting a dip in 2015 but recovering in 2016. The consensus is based on US Henry Hub prices only, as US gas sales are made on a liquid spot market. The lowest commercial forecast for gas in 2015 is $3.7/mmbtu and the highest is $4.6 (although the World Bank’s forecast made in October is higher at $4.7). For 2016, against consensus some forecasters remain bearish and expect that the price could dip to $3.6.
Non-energy commodity markets
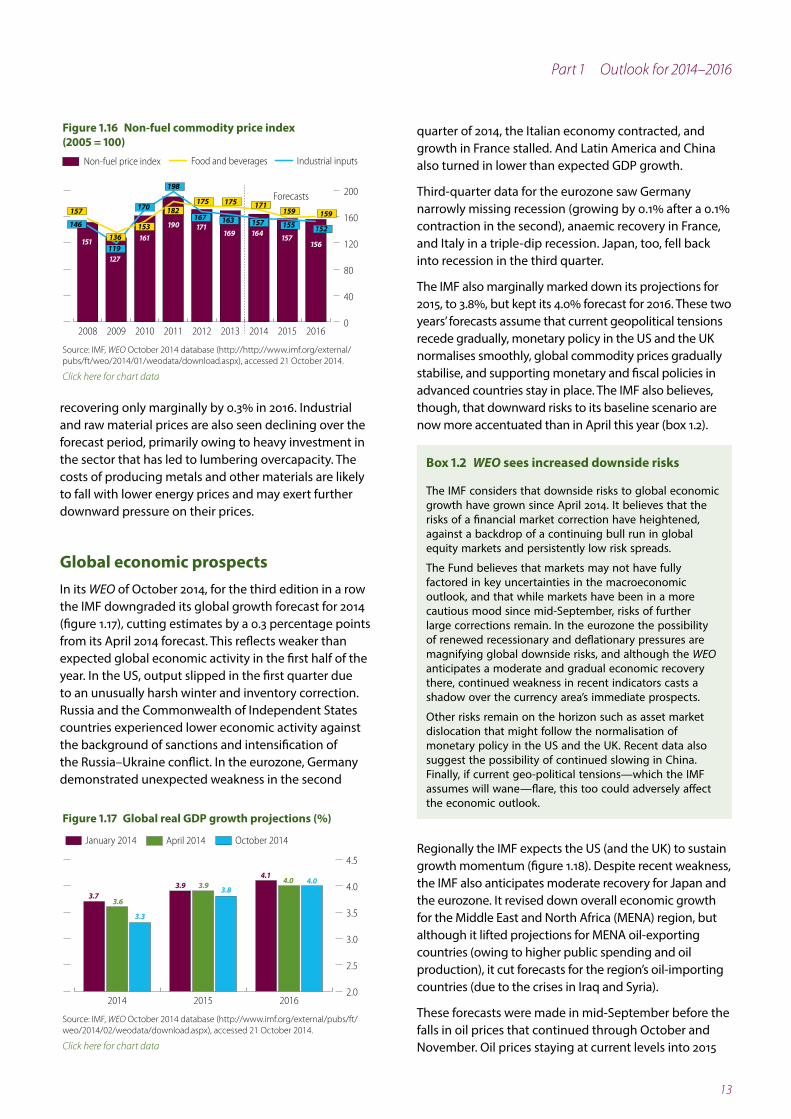
Global non-energy commodity prices continued their declining trend over the first three quarters of 2014, as supply improved and demand growth slowed with sluggish expansion in emerging economies, particularly China. According to October 2014’s WEO, the non-fuel commodity price index is expected to decline by 3% in 2014 relative to 2013. The index is forecast to fall further by 4.1% in 2015 and 0.8% in 2016 (figure 1.16).
For food, expected lower prices for 2014 are driven by a combination of better weather and higher cyclical crop yields, coupled with anaemic demand growth from emerging economies. Food prices are expected to decline by 2.1% in 2014 and a further 7% in 2015,
Figure 1.15 Average monthly crude oil prices: Spot vs futures
Price ($ per barrel) Absolute, % of actual price
Average of forecast error(absolute, % of actual price): 4.0%
80
90
100
110
120
0
4
8
12
16
Forecast errorWTI crude 1-month futures priceWTI crude spot price (actual)
Jul14
Jan14
Jul13
Jan13
Jul12
Jan12
Apr12
Oct12
Apr13
Oct13
Oct14
Apr14
Source: Estimates based on data from US EIA (http://www.eia.doe.gov/steo/cf_query/index.cfm), accessed 16 November 2014.
Click here for chart data
12
Qatar Economic Outlook 2014–2016 Update
Table 1.3 Poll of oil and gas prices, as of 13 November 2014Economic forecaster Oil ($/bbl) Gas ($/mmbtu)
WTI UK Brent US Henry Hub2014 2015 2016 2014 2015 2016 2014 2015 2016
ABN AMRO (Oct 14) 95.0 85.0 80.0 105.0 90.0 85.0 4.3 4.5 4.8ANZ (Oct 14) 90.0 97.0 93.0 94.0 105.0 98.0Banco BPI (Oct 14) 98.0 86.0 95.0 105.0 90.0 99.0Bank of America Merrill Lynch (Oct 14) 95.0 91.0 104.0 98.0 4.5 3.9 4.0Barclay's (Oct 14) 99.5 85.0 107.2 93.0 4.6 3.9 4.0Bernstein (Oct 14) 100.0 98.0 104.0 106.0 104.0 110.0BNP Paribas (Oct 14) 97.0 88.0 104.0 97.0Business Monitor International (Oct 14) 97.5 94.0 94.0 103.9 98.5 97.0 4.5 4.6 5.1Capital Economics (Oct 14) 97.0 85.0 80.0 103.0 85.0 80.0Citigroup (Oct 14) 95.6 87.5 85.0 103.4 95.5 95.0 4.4 3.9 4.4Commerzbank (Oct 14) 98.0 82.0 104.7 85.0 4.6 3.9 4.0Credit Suisse (Oct 14) 96.0 84.5 82.0 103.3 91.5 90.0 4.5 4.2 4.4CRISIL (Oct 14) 96.0 90.5 90.5 101.7 92.5 92.5Danske Bank (Oct 14) 96.0 90.0 102.0 94.0Deutsche Bank (Oct 14) 96.3 80.5 80.0 100.4 88.8 90.0 4.4 4.1 4.3Deloitte (Sep 14) 95.0 90.0 88.0 98.0 100.0 98.0 4.2 4.0 4.1DNB Markets (Oct 14) 102.0 80.0 85.0Economist Intelligence Unit (Oct 14) 97.0 88.4 84.5 104.4 97.6 96.0Fitch Ratings (Sep 14) 105.0 100.0 95.0Goldman Sachs (Oct 14) 73.8 80.0 83.8 90.0IHS Economics (Nov 14) 95.0 77.0 79.0 101.0 88.0 86.0 4.4 3.9 3.9Institute of International Finance (Oct 14) 105.9 101.0Intesa Sanpaolo (Oct 14) 95.8 91.4 94.6 101.7 96.2 102.0 4.4 4.0 4.5Itau Unibanco Holding (Oct 14) 97.4 95.1 100.3 104.6 100.0 100.7 4.5 4.2 4.2JBC Energy (Oct 14) 96.7 93.1 100.4 102.8 100.0 105.9Jeffries (Oct 14) 95.6 90.0 98.0JP Morgan Chase & Co. (Nov 14) 93.7 77.3 80.8 100.3 82.0 87.8 4.3 4.0 4.4LBBW (Oct 14) 87.0 84.0 90.0 102.0 88.0 93.0Morgan Stanley (Oct 14) 99.0 87.0 107.0 98.0 102.0National Australia Bank (Nov 14) 95.8 95.8 101.8 102.4 100.5 105.0 4.5 4.0 3.9Natixis SA (Oct 14) 96.6 93.5 97.8 103.5 99.3 103.8Nomisma Energia (Oct 14) 97.4 77.5 72.3 101.4 80.5 75.3Noreda (Oct 14) 108.0 106.0 105.0Oxford Economics (Oct 14) 96.8 90.4 102.7 94.3 102.5 4.5 4.6 4.9Prestige Economics (Oct 14) 95.5 96.8 112.0 101.9 100.8 115.0 4.5 4.0 5.0Raiffeisen Bank (Oct 14) 95.5 94.0 106.0 101.7 98.0 110.0Raymond James (Oct 14) 96.0 75.0 82.0 102.5 90.0 90.0Samba (Sep 14) 106.0 100.0 96.0Santander UK (Oct 14) 95.8 82.0 82.0 105.5 92.0 90.0 4.4 3.9 3.9Scotiabank (Oct 14) 95.0 85.0 90.0 102.0 88.0 93.0 4.4 4.0 4.0Societe Generale (Oct 14) 95.0 83.0 86.5 101.9 91.0 95.0 4.5 3.8 4.0Standard Chartered (Oct 14) 100.3 102.0 104.0 107.4 105.0 115.0TD Securities (Oct 14) 96.0 83.0 103.0 92.0Toronto-Dominion Bank (Oct 14) 95.5 83.0 90.0 102.2 92.0 98.0 4.4 3.7 3.6UBS (Oct 14) 95.0 95.0 95.0 100.0 100.0 100.0Unicredit (Oct 14) 97.0 94.0 91.0 103.0 98.0 98.0US EIA (Oct 14) 97.7 94.6 104.4 101.7 4.5 3.8Westpac Banking Corp (Oct 14) 97.0 103.0 111.0 104.4 95.0 105.0
Consensus (mean) 96.1 88.3 91.0 103.0 94.5 96.8 4.4 4.0 4.3Median 96.0 88.2 90.0 103.0 95.3 97.5 4.5 4.0 4.1High 100.3 103.0 112.0 108.0 106.0 115.0 4.6 4.6 5.1Low 87.0 73.8 72.3 94.0 80.0 75.3 4.2 3.7 3.6Standard deviation 2.3 7.1 10.1 2.7 6.6 8.7 0.1 0.3 0.4Coefficient of variation (%) 2.4 8.1 11.1 2.6 7.0 9.0 2.0 6.2 9.6
WTI UK Brent Gas ($/mmbtu)Memo items 2014 2015 2016 2014 2015 2016 2014 2015 2015IMF (Oct 2014) 98.4 92.1 89.9 105.7 104.0 102.0 4.5 4.0 4.1World Bank (Oct 2014)a 95.5 90.0 90.9 105.9 99.9 100.8 4.4 4.7 4.9
Crude oilb
IMF (Oct 2014) 102.8 99.4 97.3 4.5 4.0 4.1World Bank (Oct 2014) 101.5 95.7 96.6 4.4 4.7 4.9Consensus average (UK Brent and WTI) 99.6 91.4 93.9 4.4 4.0 4.3Consensus mean (June 14) 101.5 97.4Note: Bold = updated; blue= new forecaster; red = updated annual number with Q4 forecast.a = extrapolation of average crude spot price to WTI and Brent. b Average of WTI, Brent and Dubai Fateh spot prices.Source: Consolidated from various reports and news articles.
13
Part 1 Outlook for 2014–2016
quarter of 2014, the Italian economy contracted, and growth in France stalled. And Latin America and China also turned in lower than expected GDP growth.
Third-quarter data for the eurozone saw Germany narrowly missing recession (growing by 0.1% after a 0.1% contraction in the second), anaemic recovery in France, and Italy in a triple-dip recession. Japan, too, fell back into recession in the third quarter.
The IMF also marginally marked down its projections for 2015, to 3.8%, but kept its 4.0% forecast for 2016. These two years’ forecasts assume that current geopolitical tensions recede gradually, monetary policy in the US and the UK normalises smoothly, global commodity prices gradually stabilise, and supporting monetary and fiscal policies in advanced countries stay in place. The IMF also believes, though, that downward risks to its baseline scenario are now more accentuated than in April this year (box 1.2).
Regionally the IMF expects the US (and the UK) to sustain growth momentum (figure 1.18). Despite recent weakness, the IMF also anticipates moderate recovery for Japan and the eurozone. It revised down overall economic growth for the Middle East and North Africa (MENA) region, but although it lifted projections for MENA oil-exporting countries (owing to higher public spending and oil production), it cut forecasts for the region’s oil-importing countries (due to the crises in Iraq and Syria).
These forecasts were made in mid-September before the falls in oil prices that continued through October and November. Oil prices staying at current levels into 2015
recovering only marginally by 0.3% in 2016. Industrial and raw material prices are also seen declining over the forecast period, primarily owing to heavy investment in the sector that has led to lumbering overcapacity. The costs of producing metals and other materials are likely to fall with lower energy prices and may exert further downward pressure on their prices.
Global economic prospectsIn its WEO of October 2014, for the third edition in a row the IMF downgraded its global growth forecast for 2014 (figure 1.17), cutting estimates by a 0.3 percentage points from its April 2014 forecast. This reflects weaker than expected global economic activity in the first half of the year. In the US, output slipped in the first quarter due to an unusually harsh winter and inventory correction. Russia and the Commonwealth of Independent States countries experienced lower economic activity against the background of sanctions and intensification of the Russia–Ukraine conflict. In the eurozone, Germany demonstrated unexpected weakness in the second
Figure 1.17 Global real GDP growth projections (%)
3.63.7
3.3
2.0
2.5
3.0
3.5
4.0
4.5
2.0
2.5
3.0
3.5
4.0
4.5
October 2014April 2014January 2014
201620152014
3.93.9 3.84.0
4.14.0
Source: IMF, WEO October 2014 database (http://www.imf.org/external/pubs/ft/weo/2014/02/weodata/download.aspx), accessed 21 October 2014.
Click here for chart data
Figure 1.16 Non-fuel commodity price index (2005 = 100)
Forecasts
0
40
80
120
160
200
Industrial inputsFood and beveragesNon-fuel price index
201620152014201320122011201020092008
151
127
161
190 171169 164 157
156
157
146
136119
153
170 182
198
175
163
175
167171
152
159157
159
155
Source: IMF, WEO October 2014 database (http://http://www.imf.org/external/pubs/ft/weo/2014/01/weodata/download.aspx), accessed 21 October 2014.
Click here for chart data
Box 1.2 WEO sees increased downside risks
The IMF considers that downside risks to global economic growth have grown since April 2014. It believes that the risks of a financial market correction have heightened, against a backdrop of a continuing bull run in global equity markets and persistently low risk spreads.
The Fund believes that markets may not have fully factored in key uncertainties in the macroeconomic outlook, and that while markets have been in a more cautious mood since mid-September, risks of further large corrections remain. In the eurozone the possibility of renewed recessionary and deflationary pressures are magnifying global downside risks, and although the WEO anticipates a moderate and gradual economic recovery there, continued weakness in recent indicators casts a shadow over the currency area’s immediate prospects.
Other risks remain on the horizon such as asset market dislocation that might follow the normalisation of monetary policy in the US and the UK. Recent data also suggest the possibility of continued slowing in China. Finally, if current geo-political tensions—which the IMF assumes will wane—flare, this too could adversely affect the economic outlook.

14
Qatar Economic Outlook 2014–2016 Update
could further tarnish fiscal prospects for oil exporters (box 1.3). However, falls in oil prices could give a fillip to economic growth in large, oil-importing countries. The IMF baseline sees solid prospects for Developing Asia, underpinned by growth of both domestic demand and exports. China is assumed to sustain high, albeit slightly lower, growth.
The October WEO revised up its 2015 and 2016 inflation projections for the US and Japan, while more or less
maintaining its expectations in Developing Asia (figure 1.19). It adjusted downward its forecasts for the eurozone and MENA. Persistently low inflation (or even deflation) remains an elevated risk for the eurozone.
Although the WEO revised down inflation forecasts for the whole MENA region, its forecasts diverge within the region: it revised them down for oil-exporting countries (due to softening international food prices and strengthening nominal effective exchange rates) and revised them up for oil-importing countries (reflecting persistent bottlenecks, inefficiencies and pressures of large refugee populations).
Figure 1.19 Regional inflation projections (%)
0.5
0
2
4
6
8
10October 2014April 2014
161514161514161514161514161514
Eurozone US Japan DevelopingAsia
MENA
2.0
0.9 1.2
2.1 2.12.7
2.0
7.5
4.24.24.1
2.6
7.48.0
Source: IMF, WEO October 2014 database (http://www.imf.org/external/pubs/ft/weo/2014/02/weodata/download.aspx), accessed 21 October 2014.
Click here for chart data
Box 1.3 Oil break-even prices across the region
Government spending has risen not only in Qatar, but across Gulf Cooperation Council (GCC) countries since 2009, supported by stable and high oil prices. Although the Brent oil price has risen close to 76% between 2009 and 2013, government expenditures have climbed by 77.7% on average across all six member states over the period.
This rise in expenditure comes mainly from higher infrastructure spending, rising transfers to citizens and general growth of recurrent expenditure. The IMF’s MECA Regional Economic Outlook of October 2014 estimates that this government spending surge has lifted the average GCC fiscal break-even oil price (the price that will generate oil revenues that cover the spending deficit after non-oil and gas revenues are applied to total spending) by over 75% from 2009 to 2014.
The IMF forecast in the MECA Regional Economic Outlook that GCC government spending will rise further in 2015, reaching on average 36% of GDP. Should this spending materialise, and oil prices follow the trajectory predicted by the IMF (or consensus), which would lift prices substantially from late-November 2014’s levels, the IMF cautions that half the GCC member states (though not Qatar) could run a fiscal deficit in 2015.
In circumstances where the possibility of longer-term downward pressures on oil prices could be sustained by structural developments on the supply side of the market and substitution into renewables and greater energy efficiency on the demand side, the IMF cautioned that medium-term fiscal consolidation may be required.
Figure 1.18 Regional real GDP growth projections (%)
Eurozone US Japan Developing Asia
MENA
0.8
0
2
4
6
8October 2014April 2014
161514161514161514161514161514
1.3 1.72.2
3.1 3.0
0.9 0.8
6.5
0.8
6.6 6.5
2.6
3.84.5
Source: IMF, WEO October 2014 database (http://www.imf.org/external/pubs/ft/weo/2014/02/weodata/download.aspx), accessed 21 October 2014.
Click here for chart data

15
Economic growth
Aggregate analysis
Qatar’s economy expanded by 5.9% year on year in real (volume) terms in the first half of 2014, a slower rate than in the first half of 2013 (figure 2.1). Lower oil output (which fell 3.8% year on year) pulled growth down as did lower gas production gas (down 1.8%) following maintenance shutdowns in major liquefied natural gas facilities. In nominal terms, the economy grew by 5.2% in the first half of 2014 year on year. The GDP deflator—a measure of the price of all goods and services produced in the economy—fell by 0.7%.
Sector breakdown
The expenditure components of growth are discussed in box 2.1.
The non-oil and gas sector’s output continued to grow fast in the first half of 2014, at 11.8% year on year (figure 2.2). Hydrocarbon output contracted by 2.3% in volume terms in that half.
Growth in non-oil and gas output was spearheaded by services, followed by construction, with only a marginal contribution from manufacturing and utilities (figure 2.3).
Part 2—Performance in 2014
Qatar’s economy expanded by 5.9% year on year in real (volume) terms in the first half of 2014, driven by the non-hydrocarbon sector, in turn led by services and construction. The slower rate (compared with previous years) reflected declining oil and gas output, caused by maturing oil fields and maintenance shutdowns in major liquefied natural gas facilities.
Annual average inflation over the 12 months to October 2014 stood at 3.0%. Monthly inflation continued to rise, led by rent, utilities and related household services, which at 8.1% in October year on year was the fastest in five years. Foreign inflationary pressures were absent, given soft global food and commodity prices and an appreciating US dollar.
The gradual declining trend in the fiscal and external balances continues. Still, recent data from the Ministry of Finance (MOF) suggests a higher fiscal balance for FY2013/14 than reported in June’s QEO. Total spending, especially capital spending, increased in FY2013/14, and spending patterns resemble earlier years’ closely. Oil and gas revenues recorded during the first half of the fiscal year are down on first-half outcomes of previous years.
Qatar posted a substantial trade surplus in the first half of 2014 of 52% of nominal GDP, somewhat lower than first-half 2013’s outcome. A continuing rise of service imports and remittances led to a slightly lower current account of 30.4% of nominal GDP.
Figure 2.1 GDP growth, nominal and real (%)
37.3
16.2
0
5
10
15
20
25
30
35
40
Real GDPNominal GDP
H1 2014H2 2013H1 2013H2 2012H1 2012H2 2011H1 2011
34.3
10.1
16.3
6.38.2
5.8 6.7 6.3 6.9 6.3 5.2 5.9
Source: MDP&S estimates based on data available at http://www.qsa.gov.qa/eng/index.htm, accessed 5 October 2014.
Click here for chart data
Figure 2.2 Real GDP growth: Hydrocarbons and non-hydrocarbons (%)
23.0
11.0
-5
0
5
10
15
20
25Non-hydrocarbonsHydrocarbonsGDP
H1 2014H2 2013H1 2013H2 2012H1 2012H2 2011H1 2011
16.2
9.310.910.1
3.3
8.8
6.3
-0.6
11.1
5.8
0.3
11.1
6.3
0.2
10.9
-2.3
11.8
6.3 5.9
Note: Hydrocarbons include crude oil and gas extraction under mining and quarrying.Source: MDP&S estimates based on data available at http://www.qsa.gov.qa/eng/index.htm, accessed 15 October 2014.
Click here for chart data

16
Qatar Economic Outlook 2014–2016 Update
land transport services in Doha and solid growth of telecommunications. Although slowing, government, household and social services grew respectably, broadly in line with Qatar’s growing population (which by end-October 2014 was over 2.2 million, 9.5% up on 12 months earlier—figure 2.5).
Spurred by the government’s large capital spending programme, construction contributed 2.1 percentage points of real GDP growth, as output climbed by 17.9% (figure 2.6). This upward trend is expected to continue in the second half and through the outlook period (see part 1).
Though still growing in the first half at 2.0% (figure 2.7), manufacturing decelerated to contribute just 0.2 percentage points of GDP growth. Manufacture of basic chemicals and iron and steel accounted for all the growth. The period saw reduced output of refined petroleum products, other petrochemicals and fertilisers, hit by maintenance shutdowns, constraints on feedstock
Expanding by 12.4% in the first half, year on year, services contributed 4.9 percentage points of real growth (figure 2.4), taking its share in real GDP to 40%. All services subcomponents grew quickly, most at double digits. Finance and real estate accelerated, growing by 16.0% year on year in the first half, as did trade and hospitality (15.3%). (Data from Qatar Tourism Authority show a 9% year-on-year rise in the number of total tourists visiting the country in the first quarter of 2014.) Transport and telecommunications services maintained their upward momentum, supported by the expansion of Qatar Airways, the introduction of new
Figure 2.3 Contributions to real GDP growth (percentage points)
HydrocarbonsManufacturingElectricity and water
ConstructionServices
Real GDP
H1 2011 H2 2011 H1 2012 H2 2012 H1 2013 H2 2013 H1 2014
-202468
1012141618
16.2
4.1
Imputed bank services
1.41.1
9.9
-0.5
10.1
4.8
0.90.7
4.2
-0.6
6.33.31.00.71.5-0.3
5.83.8
1.01.2-0.3
6.3
4.9
1.50.8
0.1-1.1
6.3
5.0
1.50.2
0.1-0.5
5.9
4.9
2.10.2-0.9-0.5
Note: Hydrocarbons include crude oil and gas extraction under mining and quarrying. Services include transport and communications, trade and hospitality, financial, government, household and social services. Data may not sum owing to rounding and omission of agriculture.Source: MDP&S estimates based on data available at http://www.qsa.gov.qa/eng/index.htm, accessed 15 October 2014.
Click here for chart data
Figure 2.4 Services growth (%)
0
5
10
15
20
0
5
10
15
20
Finance and real estate
Trade and hospitalityGovernment, household and social servicesTransport and telecommunications
Services
H1 2014H2 2013H1 2013H2 2012H1 2012H2 2011H1 2011
10.9 13.1
9.0
10.1 13.2 12.7 12.4
Source: MDP&S estimates based on data available at http://www.qsa.gov.qa/eng/index.htm, accessed 15 October 2014.
Click here for chart data
Box 2.1 Demand components of nominal GDP
MDP&S released, for the first time, demand-side estimates (nominal GDP only) in July 2014, dating back to the first quarter of 2013 (box figure). The availability of quarterly data now allows half-year growth estimates to be presented.
In the first half of 2014, exports, dominated by hydrocarbons, were the single largest component of demand, accounting for 73.3% of GDP. Investment contributed 29.1%, household consumption 14.1% and government consumption of final goods and services 13.9%. Imports, a leakage from demand in the domestic economy, amounted to 30.5% of GDP. Qatar’s saving rate (see Glossary) tracked up by 2.3 percentage points, reaching 59.5% of nominal GDP.
Year on year, exports were up by 2.9% but imports by 10.9% in the first half of 2014. Spurred by the government’s large investment programme, gross capital formation grew by 12.5%. Household consumption increased by about 11%, and government consumption spending by 9.7%.
Box figure Nominal demand-side GDP (QR billion)
-200000
-100000
0
100000
200000
300000
400000
500000
-200
-100
0
100
200
300
400
500Imports (goods and services)Exports (goods and services)Gross capital formationGovernment �nal consumption expenditureHousehold consumption expenditureGross domestic product
H1 2014H2 2013H1 2013
Note: Preliminary estimates for 2013 and 2014, gross capital formation includes statistical discrepancySource: MDP&S estimates based on data available at http://www.qsa.gov.qa/eng/index.htm), accessed 27 October 2014.
Click here for chart data

17
Part 2 Performance in 2014
and declining margins on global markets. In other areas, manufacturing was pinched by capacity constraints.
Economic diversification
The share of non-hydrocarbon output in nominal GDP continued to increase, following a trend begun in the second half of 2012, edging up to 47.9% of GDP in the first half (figure 2.8). Although this suggests
diversification of the economic base, broader metrics suggest that in other important dimensions diversification is proceeding more slowly than this trend implies (box 2.2).
Prices and asset markets
Consumer prices
Headline consumer price inflation (CPI), measured as the year-on-year percentage change in the consumer price index, was 3.0% in October 2014 (figure 2.9). Core inflation, which leaves out the most volatile components of the CPI basket including food, utilities and residential rent, came in at 1.8%. The annual average inflation rate over the 12 months to October 2014 stood at just under 3.0%, in line with June’s QEO forecast for 2014 of 3.0%.
On a rising trend since March of this year and continuing to lead the rise in monthly inflation, rent, utilities and related household services grew by 8.1% in October year
Figure 2.6 Construction growth (%)
12.2
0
4
8
12
16
20
0
4
8
12
16
20
H1 2014H2 2013H1 2013H2 2012H1 2012H2 2011H1 2011
8.9 9.28.8
13.2
17.9
14.0
Source: MDP&S estimates based on data available at http://www.qsa.gov.qa/eng/index.htm, accessed 15 October 2014.
Click here for chart data
Figure 2.7 Manufacturing growth (%)
12.1
8.0
9.2
8.3
13.8
2.3
9.2
0
2
4
6
8
10
12
14
16
0
2
4
6
8
10
12
14
H1 2014H2 2013H1 2013H2 2012H1 2012H2 2011H1 2011
2.0
Source: MDP&S estimates based on data available at http://www.qsa.gov.qa/eng/index.htm, accessed 15 October 2014.
Click here for chart data
Figure 2.8 Hydrocarbons and non-hydrocarbons, share of nominal GDP (%)
0
20
40
60
80
100
0
20
40
60
80
100
Hydrocarbons Non-hydrocarbons
H1 2014H2 2013H1 2013H2 2012H1 2012H2 2011H1 2011
58.1
41.9
58.1 58.5 55.4 55.6 53.2 52.1
41.9 41.5 44.6 47.944.4 46.8
Note: Hydrocarbons include crude oil and gas extraction under mining and quarrying.Source: MDP&S estimates based on data available at http://www.qsa.gov.qa/eng/index.htm, accessed 15 October 2014.
Click here for chart data
Figure 2.9 Monthly headline and core inflation growth (year on year, %)
0.0
0.5
1.0
1.5
2.0
2.5
3.0
3.5
4.0
0.0
0.5
1.0
1.5
2.0
2.5
3.0
3.5
4.0
Core Headline
Sep14Jul14May14Mar14Jan14Nov13Sep13Jul13May13Mar13Jan13
3.4
2.93.1
2.3
3.8
3.0
Note: Core inflation is headline inflation less food, rent and utilities.Source: MDP&S estimates based on data available from Qatar Information Exchange database (http://www.qix.gov.qa/), accessed 17 November 2014.
Click here for chart data
Figure 2.5 Total population (million)
1.401.451.501.551.601.651.701.751.801.851.901.952.002.052.102.152.202.252.30
12-month moving averageTotal
Oct14
Jul14
Apr14
Jan14
Oct13
Jul13
Apr13
Jan13
Oct12
Jul12
Apr12
Jan12
Source: MDP&S estimates based on data available at http://www.qsa.gov.qa/eng/index.htm, accessed 3 November 2014.
Click here for chart data

18
Qatar Economic Outlook 2014–2016 Update
Box 2.2 The elements of economic diversification
Qatar’s economy is still heavily dependent on exploiting its non-renewable oil and gas mineral deposits—with upstream production contributing more than half of nominal GDP in 2013—even though oil and gas output has plateaued.
The non-oil and gas economy has grown solidly in recent years, its share in nominal GDP climbing from 41.9% in 2011 to 45.6% in 2013. This trend is set to continue in 2014. In the narrow sense that the contribution of non-oil and gas activities to aggregate economic activity is growing, Qatar’s economy is becoming more diversified. But to assess prospects for the emergence of durable sources of wealth creation to replace oil and gas, it is important to drill down into the production data.
Although in output terms the non-oil and gas economy is showing vigorous growth (see figure 2.2), much of it is in the non-traded sectors of the economy, such as construction and non-traded services (see figure 2.3). An economy built on only non-traded services—though meeting important needs today—cannot provide a durable platform for generating wealth in the future. The litmus test of longer-term prospects for sustained growth is therefore the extent to which current investments in infrastructure and other capital assets raise future productivity and economic returns in the wider economy.
Linked to this is the need to diversify sources of export income. And indeed Qatar’s services exports (particularly transport services) have exhibited strong expansion, but diversification of merchandise export earnings appears to have lagged behind. In 2013 for example, upstream oil and gas revenues still accounted for the lion’s share of revenue (box figure 1) and since 2009 the share of non-hydrocarbon merchandise export revenue in the total has never exceeded 5%. So far at least, Qatar shows little sign of establishing a foothold in new activities and exporting new products, as measured by new product survival (box figure 2).
Three other dimensions of diversification are also important.
• Income—a widening of sources of income (foreign exchange and fiscal), as the economy moves from reliance on converting mineral to financial resources to generating income both from non-oil and gas output and from a portfolio of financial and direct foreign investments
• Ownership structure—a rebalancing from a largely state-led economy to one where the private sector plays an increasing role in generating wealth, income and productive jobs
• Capabilities—a transitioning from a predominantly low-technology, low-skilled, non-oil and gas economy to one where human, institutional and technological capabilities advance
Viewed through this wider prism, the scorecard on diversification is mixed.
Income. Qatar has been accumulating foreign assets through its sovereign investment vehicles. The accumulated value of its
current account surpluses (equivalent to claims on non-residents) over 2000–2014 amounts to $345.7 billion. In the short and medium terms, capital investment abroad provides an important safety valve that prevents overheating in the domestic economy. In the longer term, it provides a potential source of revenue that can be used to finance the state budget. Yet in FY2013/14, fiscal income still depended largely on hydrocarbon activity, directly contributing 57% of total revenue (85.7% if investment income from Qatar Petroleum is added). And over the last six years, the share of other revenue (such as corporate tax revenue, public utility fees and customs duties) in total government revenue has increased only slightly, from 20% to 23% (box 2.3).
Ownership structure. Private sector development indicators tell a story of gain, but from a very low base. In 2012, the latest year for which data are available, the proportion of private activity in the overall economy was larger than a decade earlier, but that share had fallen back from its 2009 peak. The share of Qatari citizens opting for private employment has also grown: in 2013, 11.9% of the Qatari workforce was in the private sector, a more than doubling from 5.8% in 2006.
Capabilities. As it has for many years, Qatar makes heavy investments in education, but they inevitably have a long gestation period. Some of the country’s outcome indicators, like the OECD’s PISA scores (Programme for International Student Assessment), have begun to register improvements, but Qatar still lags behind benchmarks. Similarly, the research and development activities of Qatar University, Qatar Science and Technology Park, the Qatar Foundation Research Fund and sponsored research centres will take time to bear fruit. But once the current heavy infrastructure build-out phase of Qatar’s development winds down, the share of highly skilled and professional workers in the labour force should begin to rise, reversing a recent trend towards a greater share of lesser skilled workers.
Economic diversification cannot happen with the stroke of a pen. Shifts in output structure tell only part of the story. The discovery of new and durable sources of wealth creation—the essence of diversification—will, as Qatar’s National Development Strategy 2011–2016 observes, require deeper transformations in incentives, institutions and capabilities.
Source: MDP&S analysis.
Box figure 1 Qatar’s export composition (QR billion)
0
100
200
300
400
500
600
OthersHydrocarbon derivativesHydrocarbons
2013201220112010200920082007200620052004
38.7
436.7
22.5
6.558.8
2.7 7.283.2
3.3 9.7
111.2
3.1 12.3
145.8
3.816.7
222.7
5.6
12.1
155.7
7.0
13.8
245.8
13.3
19.9
382.2
14.4 35.0
425.9
23.2
Source: MDP&S.
Click here for chart data
Box figure 2 Qatar’s export new product survival by sector, 2011–2013
0
50
100
150
200
250
300
350
Mineral productsProducts of the chemical or allied industriesPlastics and articles thereof; rubber and articles thereofBase metals and articles of base metal Machinery and mechanical appliances; electrical equipment; parts thereofOther
No. of new productssurvived in 2013
No. of new products exported in 2012 (HS 8-digit)
139
20
66
29
52
10
58
54020204
Source: MDP&S.
Click here for chart data

19
Part 2 Performance in 2014
on year (figure 2.10), the highest rate since end-2009. The published data do not suggest price pressures of a similar size on other non-traded goods and services components of the CPI. Softening global commodity prices led to a slight dip in the food, beverages and tobacco category. Miscellaneous goods and services also fell year on year in October.
Producer prices
Producer price inflation—a measure of the cost of goods produced in Qatar—has remained tame. In the first half of 2014, producer prices rose by 1.2% over the same period in 2013 (figure 2.11). Mute price increases were seen across the board. The price of oil, which has a weight of 77.1% in the overall index, was only marginally higher in the first half of 2014 than in the same period in 2013, and was kept in check by the lower prices seen in the first quarter of 2014.
Asset markets: Equity and property
Qatar Exchange
The Qatar Exchange (QE) Index closed at 13,724 on 13 November 2014, up 32.3% year to date, for a total market capitalisation of $203.7 billion, or equivalent to about 96% of Qatar’s estimated GDP. A benchmark index of the 20 largest and most liquid stocks, it has outperformed broader global indices such as the S&P 100 since November 2013 (figure 2.12). It has also performed better than other markets in Gulf Cooperation Council (GCC) countries, apart from Dubai (up 38.2% year to date). Regional markets saw brief reversals in June and in October, when they were struck by commodity-market volatility, given the substantial presence of energy-focused companies, tapering gains (figure 2.13).
Both the trailing price-to-earnings ratio (17.5) and the price-to-book ratio (2.7) of the QE Index had the best and second-best performance among GCC markets. Market
Figure 2.11 Producer price index growth (year on year, %)
37.1
-0.8
22.5
-5051015202530354045
ManufacturingEnergy and utilities
HydrocarbonsProducer prices
H1 2014H2 2013H1 2013H2 2012H1 2012H2 2011H1 2011
19.8
0.2-0.4
-2.3
2.7 2.3
41.0
14.0
2.9
-1.1
1.4 1.1
35.9
11.2
2.3
-1.2
2.6 1.55.4
8.7
-1.21.7
1.2
33.3
Source: MDP&S estimates based on data available on Qatar Information Exchange database (http://www.qix.gov.qa/), accessed 21 October 2014.
Click here for chart data
Figure 2.12 QE Index and S&P Global 100 (year-on-year change, %)
-20
-10
0
10
20
30
40
50
60S&P Global 100QE Index
Sep14
Jul14
May14
Mar14
Jan 14
Nov13
Sep13
Jul13
May13
Mar13
Jan13
Nov12
Sep12
Jul12
May12
Mar12
Jan12
Source: QE (http://www.qe.com.qa/pps/qe/qe%20english%20portal/Pages/Home/) and CEIC database, accessed 16 November 2014.
Click here for chart data
Figure 2.13 GCC stock price indices and S&P Global (year-on-year change, %)
-20020406080100120140160
S&P GlobalUAE (Dubai Financial Market) UAE (Abu Dhabi Index)Saudi Arabia (TSA Index)
Kuwait (KSE Index)Oman (MSM 30)
Bahrain (BSE Index)QE index
Oct 14Jul 14Apr 14Jan 14Oct 13Jul 13Apr 13Jan 13
Source: QE (http://www.qe.com.qa/pps/qe/qe%20english%20portal/Pages/Home/) and CEIC database, accessed 16 November 2014.
Click here for chart data
Figure 2.10 Monthly inflation (year on year, %)
-6-4-202468
1012
-6
-4
-2
0
2
4
6
8
10
Sep14
Jul14
May14
Mar14
Jan14
Nov13
Sep13
Jul 13
May13
Mar13
Jan13
Miscellaneous goods and services
Entertainment, recreation and culture
Transport and communications
Medical care and health services
Furniture, textiles and home appliancesRent, utilities and related housing services
Clothing and footwearFood, beverages and tobaccoConsumer price index
3.13.42.72.7 2.3
3.52.6
3.4 3.23.73.6
2.9 2.9 2.72.7 2.83.4
2.83.8
3.1 3.6 3.0
Source: MDP&S estimates based on data available from Qatar Information Exchange database (http://www.qix.gov.qa/), accessed 17 November 2014.
Click here for chart data

20
Qatar Economic Outlook 2014–2016 Update
capitalisation stayed concentrated in banks and financial services, which at 39.3% of the entire market, grew by 40.3% year to date. The next-largest shares of the market were held by industrials (31.1%) and real estate (11.1%). The fastest-appreciating sector, though with only 3.1% of the market, was insurance, which grew by 74.2% year to date. Mesaieed Petrochemical Holding Co. is the newest stock traded—and the one gaining the most year to date (220.5%).
Real estate
Tracking sales transactions of residential properties and land, the real estate price index of Qatar Central Bank (QCB) has been on a rising trend since mid-2013, reaching a new high in September, at 42.1% higher than 12 months earlier and 32% higher than the previous peak in August 2008 (figure 2.14).
Al Asmakh, a real estate agent, reports that land prices throughout Doha have continued to rise, by 15% in the first quarter of 2014 in some prime areas. Prices for land in areas outside Doha are also moving up.
Headline retail rental rates have been climbing in 2014, although the likely opening of six new malls in the next year will probably soften rates in the near term.
Money supply and credit
Money supply
Growth of money supply—based on its broad definition, M2 (see Glossary)—continued to moderate year on year, keeping the trend seen since the second half of 2013 (figure 2.15). The growth of M2 slowed to 7.5% over January–August 2014 from 13.2% in the same period of 2013.
Money supply growth in January–August 2014 was driven mostly by a rise in local currency (particularly demand) deposits, which alone contributed nearly half the overall money supply growth (figure 2.16), and by broadly stable growth in time deposits. Solid expansion of local currency deposits can be traced to the mobilisation of financial resources by public entities and private businesses as they gear up to execute planned investment projects. The local currency deposits of individuals rose broadly in line with the population increase.
Slower growth in foreign currency deposits was the main reason for the slower growth of M2 over the period, as they edged up by just 3.7%, far slower than the 23% over the same period in 2013 and mirroring a slowdown in the growth of public sector foreign currency deposits. (These deposits account for more than 75% of all foreign currency deposits in the banking system). The contribution of foreign currency deposits dropped from 6.6 percentage points to just 1.2 percentage points.
Figure 2.14 QCB real estate price index
120
140
160
180
200
220
240
260
Sep 14Jun 14Mar 14Dec 13Sep 13Jun 13Mar 13Dec 12
Note: The index shows sales transactions of real estate properties (including land, villas and residential estates) based on data supplied by the Ministry of Justice.Source: QCB, http://www.qcb.gov.qa/English/Publications/Statistics/RealEstate/Pages/RealEstatePriceIndex.aspx, accessed 22 October 2014.
Click here for chart data
Figure 2.15 Money supply (M2 )
300
350
400
450
500
550
0
10
20
30
40
50
Growth (y o y, %)QR billion
Aug14
Jun14
Apr 4
Feb14
Dec13
Oct13
Aug13
Jun13
Apr13
Feb13
Dec12
Source: QCB, Monthly Monetary Bulletins.
Click here for chart data
Figure 2.16 Contribution to money supply growth (percentage points)
0
2
4
6
8
10
12
14
Currency in circulationDemand depositsTime depositsDeposits in foreign currency
Jan–Aug 2014Jan–Aug 2013
Source: QCB, Monthly Monetary Bulletins.
Click here for chart data

21
Part 2 Performance in 2014
The contribution of real estate to private business credit growth was minor, despite being the largest component of private sector credit (figure 2.19). This weakness most probably reflects the effect of measures taken by QCB to limit banks’ exposure to the property market, as it strengthened its risk-based supervisory framework for banks.
Similarly, credit growth to consumers remained robust at 12.7% in January–August 2014, bolstered by rising nominal non-hydrocarbon income and strong population growth (see figure 2.18).
Outstanding credit to the public sector has been on a declining trend since the start of 2014, contracting by 3.7% over the period. This is likely to be indicative of debt repayments (including redemptions of Treasury bills and bonds, issued for capital market development rather than financing) and more reliance on self-financing supported by large fiscal surpluses. Since the first quarter of 2013 total public sector deposits have exceeded outstanding credit, suggesting less reliance by the public sector on financing from the banking system (figure 2.20).
This slower growth occurred from a strong base, and hence could possibly reflect a rebalancing of the public sector asset portfolio as a larger proportion of hydrocarbon receipts is allocated to fund investments abroad and domestically, rather than being held as foreign currency deposits in the banking system. A relatively large deficit on the financial account of the balance of payments during the first half of 2014 and a build-up of QCB foreign assets are both consistent with this explanation. As foreign currency hydrocarbon receipts are converted to local currency deposits to finance domestic investment projects, QCB’s reserves will rise.
Credit
The slowdown in money supply growth in 2014 is mirrored in the movements of the counterpart assets of the banking system, of which banks’ credit facilities form the main component, with bank credit witnessing a similar slowdown in growth. In the first eight months of 2014, the growth rate of domestic credit—representing over 90% of banks’ total credit—slowed to 4.2% from nearly 7% in the year-earlier period. Credit growth was exclusively to the private sector (private businesses and consumer credit), while credit to the public sector contracted by about 3.7%, acting as a drag on overall domestic credit growth (figure 2.17).
Credit to private businesses saw nearly a 10% expansion through to August 2014, driven by robust credit growth rates to the services sector and general trade businesses, and by credit to contractors (figure 2.18). This reflects the underlying momentum in services and construction and their notable contributions to economic growth (see Economic growth).
Figure 2.17 Contribution to domestic credit growth (percentage points)
Jan–Aug 2013 Jan–Aug 2014
Consumption
Private sectorPublic sector
-2
-1
0
1
2
3
4
5
6
7
Source: QCB, Monthly Monetary Bulletins.
Click here for chart data
Figure 2.18 Growth of commercial banks’ private sector credit (year-on-year change, %)
0
20
40
60
ConsumptionServices
Real estateContractors General trade
Aug 14Apr 14Dec 13Aug 13
10
-10
30
50
Source: QCB, Monthly Monetary Bulletins.
Click here for chart data
Figure 2.19 Private business credit by main sectors (QR billion)
10
60
110
160
210
260
ServicesReal estateContractorsIndustryGeneral trade
Aug 14Dec 13Dec 12
Source: QCB, Monthly Monetary Bulletins.
Click here for chart data

22
Qatar Economic Outlook 2014–2016 Update
On the spending side, the revised MOF figures show an increase of 14.1% in FY2013/14 from the previous fiscal year (figure 2.22). June QEO’s data had a 1% decrease. Current spending, revised to 7.4% higher than in FY2012/13, shows the lowest percentage increase in the last five years, even though it exceeded the budget estimate by 22%. Capital spending growth in FY2013/14 is revised to 34.1% against a year earlier, but still fell 8% short of the budget target. MOF has initiated measures to improve the planning and management of public investments (box 2.4).
The overall surplus stood at QR108 billion, up from June’s estimate of QR96.6 billion. The revisions show a narrower non-hydrocarbon deficit of 11.7% of GDP for FY2013/14 against the previous year’s outturn (figure 2.23), though wider than the 7.3% reported in June. The
Fiscal accounts
Fiscal year 2013/14
Total government revenue for FY2013/14 has been revised by MOF to QR342.4 billion (up 14.9%) and total expenditure to QR234.5 billion (up 15.3%) since June’s QEO (figure 2.21). These revisions lift the estimated overall surplus to QR108 billion, up from June’s figure of QR96.6 billion. As further revisions are possible, these estimates remain provisional.
Based on these revised figures, fiscal revenue in FY2013/14 rose by 20.4% from FY2012/13. Given conservative oil price planning assumptions, realised hydrocarbon revenue and investment income for FY2013/14 came in at 57% above the original budget target. However, other revenue (mainly corporate tax, but also customs duties and public utility fees) fell some way short of the budget planning figure (box 2.3).
Box 2.3 Other revenue
The government collects revenue besides oil and gas receipts and investment income. The other revenue category comprises mainly corporate income tax, customs duties and public utility fees (box figure).
Over the last six fiscal years the volume of other revenue has shown a rising trend, mainly because of higher corporate tax receipts, but the share in total revenue has shown no consistent trend, moving within a band of 15% to 23% of the total.
Corporate taxes have risen fast in the past six years, peaking at QR55.5 billion in FY2012/13 but falling back in FY2013/14. Yet despite imports rising by 25% during 2008–2013, customs duties have not shown commensurate growth, which was probably capped by duty exemptions on imports of machinery, equipment, raw materials and partially manufactured materials. Public utility fees contributed just 0.7% of other revenue in FY2013/14 but still rose from QR230 million in FY2008/09 to QR330 million in FY2013/14.
Figure 2.21 Total government revenue (QR billion)
0
50
100
150
200
250
300
350
400
0
6
12
18
24
30
36
42
48
Growth (%) Other InvestmentOil and gas
FY13/14(QEO June 14)
FY13/14(Update)
FY12/13FY11/12
27.7
42.8
20.4
4.8
Note: The fiscal year runs 1 April–31 March. Source: MOF.
Click here for chart data
Box figure Other revenue
%QR billion
0
15
30
45
60
75
0
5
10
15
20
25
Customs dutiesBusiness/corporate income taxPublic utility feesMiscellaneous
Share of other revenuein total revenue
FY13/14FY12/13FY11/12FY10/11FY09/10FY08/09
Note: The fiscal year runs from 1 April to 31 MarchSource: MOF.
Click here for chart data
Figure 2.20 Balance of deposits and credits for the public sector, private sector and individuals (QR billion)
-80
-60
-40
-20
0
20
40
60
80
Personal Companies/institutionsPublic sector
Sep 14Mar 14Sep 13Mar 13Sep 12Mar 12
Source: QCB, Monthly Monetary Bulletins.
Click here for chart data

23
Part 2 Performance in 2014
3.5% revenue uplift over the previous year’s budget, reflecting higher oil revenue (26.4%), lower gas revenue (7.1%), and largely unchanged estimates of investment income and other revenue.
In the first half of FY2014/15, according to preliminary figures, the government collected QR164.1 billion, 72% of the overall revenue budget target (figure 2.24). It received almost twice as much investment income (QR111.7 billion) as budgeted for the full fiscal year, whereas oil and gas revenues (QR35.9 billion) and other revenue (QR16.5 billion) reached 36% and 24% of their budget targets.
Oil and gas revenues during the first half of the fiscal year are down on first-half outcomes of previous years, reflecting lower output volumes and prices (see
non-hydrocarbon deficit as a share of non-hydrocarbon GDP—a measure of the net injections that government spending is making to the non-hydrocarbon economy—stood at 25.1% in FY2013/14.
A key factor in the narrower deficit as a share of GDP is the greater investment income accruing to the budget. However, the government’s investment income largely comprises Qatar Petroleum’s consolidated financial surplus, which will depend on oil and gas output and prices.
Government revenue, first half FY2014/15
Estimates for the first half of FY2014/15 (April–September) are preliminary and could be subject to significant change. The budget for FY2014/15 anticipates a modest
Box 2.4 Public investment management
Given the large portfolio of capital projects to achieve Qatar’s development goals and to meet the pressing timeline for hosting the 2022 World Cup, it is essential to plan and manage the portfolio well. Following from the approach highlighted in Qatar’s National Development Strategy 2011–2016, Qatar has established the Public Investment Management Department within MOF.
The primary purpose of the Department is to scrutinise, select and monitor major capital and non-capital projects sponsored by the state. It seeks both to ensure close correspondence between the public investment portfolio and Qatar’s priority needs, and to support improved delivery at project level. The Department will be involved throughout the lifecycle of major projects, including construction and operations, to see to it that public assets are delivered and operated in a way that maximises value to the state. It will not be an engineering or auditing office, but rather will work with other government institutions.
Source: MOF.
Figure 2.22 Expenditure growth (%)
29.8
14.3
-5
0
5
10
15
20
25
30
35
Total CapitalCurrent
FY13/14(QEO June 14)
FY13/14(Update)
FY12/13FY11/12
25.0
15.214.1
-1.0
20.5
7.4
-2.1
2.4
34.1
1.9
Note: The fiscal year runs 1 April–31 March. Source: MOF
Click here for chart data
Figure 2.23 Fiscal balances, expenditure and revenue (% of GDP, current prices)
-16.5
-8.3
-37.2
-45-40-35-30-25-20-15-10-5051015
Investment revenueOther revenueDevelopment expenditure Current expenditure Non-hydrocarbon balance (% of non-hydrcarbon GDP)Non-hydrocarbon balance (% of GDP)
FY13/14FY12/13FY11/12FY10/11FY09/10FY08/09
6.98.2
-19.6
-10.2
8.5
14.1
-21.8
-7.3
6.64.0
-22.2
-7.8
9.27.4
-21.7
-9.1
6.4
13.2
-20.2
-9.3
4.7 5.9
-41.3
-25.1
-32.1
-9.6 -9.5
-17.1 -17.1-14.0
-11.7
Note: The fiscal year runs 1 April–31 March. Source: MOF.
Click here for chart data
Figure 2.24 Fiscal revenue, first-half actual and budget, FY2014/15 (QR billion)
164.1
225.7
0 50 100 150 200 250
Budget, FY2014/15Actual H1, FY2014/15
Other
Oil and gas
Investmentincome
Total revenue
58.1
111.7
99.5
35.9
68.0
16.5
Note: The fiscal year runs 1 April–31 March. FY2014/15 actual data are preliminary, for 1 April–30 September. Source: MOF.
Click here for chart data
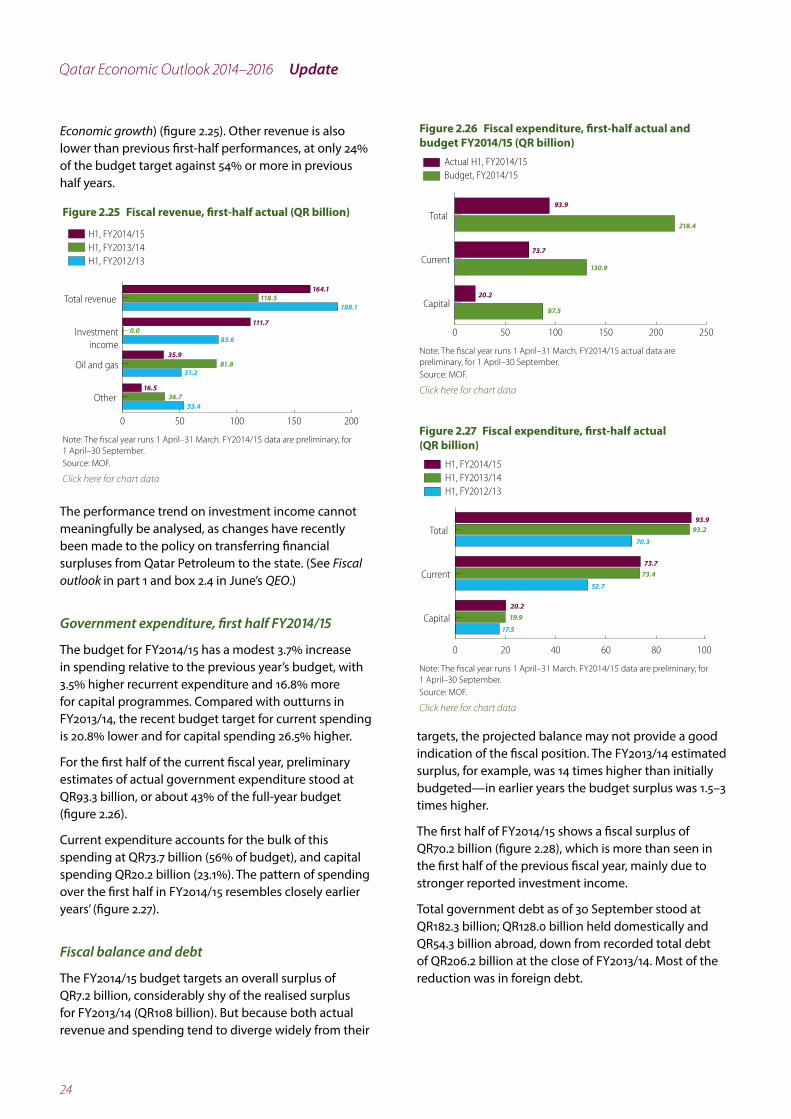
24
Qatar Economic Outlook 2014–2016 Update
Economic growth) (figure 2.25). Other revenue is also lower than previous first-half performances, at only 24% of the budget target against 54% or more in previous half years.
The performance trend on investment income cannot meaningfully be analysed, as changes have recently been made to the policy on transferring financial surpluses from Qatar Petroleum to the state. (See Fiscal outlook in part 1 and box 2.4 in June’s QEO.)
Government expenditure, first half FY2014/15
The budget for FY2014/15 has a modest 3.7% increase in spending relative to the previous year’s budget, with 3.5% higher recurrent expenditure and 16.8% more for capital programmes. Compared with outturns in FY2013/14, the recent budget target for current spending is 20.8% lower and for capital spending 26.5% higher.
For the first half of the current fiscal year, preliminary estimates of actual government expenditure stood at QR93.3 billion, or about 43% of the full-year budget (figure 2.26).
Current expenditure accounts for the bulk of this spending at QR73.7 billion (56% of budget), and capital spending QR20.2 billion (23.1%). The pattern of spending over the first half in FY2014/15 resembles closely earlier years’ (figure 2.27).
Fiscal balance and debt
The FY2014/15 budget targets an overall surplus of QR7.2 billion, considerably shy of the realised surplus for FY2013/14 (QR108 billion). But because both actual revenue and spending tend to diverge widely from their
targets, the projected balance may not provide a good indication of the fiscal position. The FY2013/14 estimated surplus, for example, was 14 times higher than initially budgeted—in earlier years the budget surplus was 1.5–3 times higher.
The first half of FY2014/15 shows a fiscal surplus of QR70.2 billion (figure 2.28), which is more than seen in the first half of the previous fiscal year, mainly due to stronger reported investment income.
Total government debt as of 30 September stood at QR182.3 billion; QR128.0 billion held domestically and QR54.3 billion abroad, down from recorded total debt of QR206.2 billion at the close of FY2013/14. Most of the reduction was in foreign debt.
Figure 2.26 Fiscal expenditure, first-half actual and budget FY2014/15 (QR billion)
93.9
218.4
0 50 100 150 200 250
Budget, FY2014/15Actual H1, FY2014/15
Capital
Current
Total
73.7
130.9
20.2
87.5
Note: The fiscal year runs 1 April–31 March. FY2014/15 actual data are preliminary, for 1 April–30 September. Source: MOF.
Click here for chart data
Figure 2.27 Fiscal expenditure, first-half actual (QR billion)
93.993.2
70.3
0 20 40 60 80 100
H1, FY2012/13H1, FY2013/14H1, FY2014/15
Capital
Current
Total
73.773.4
52.7
20.219.9
17.5
Note: The fiscal year runs 1 April–31 March. FY2014/15 data are preliminary, for 1 April–30 September. Source: MOF.
Click here for chart data
Figure 2.25 Fiscal revenue, first-half actual (QR billion)
164.1118.5
0 50 100 150 200
H1, FY2012/13H1, FY2013/14H1, FY2014/15
Other
Oil and gas
Investmentincome
Total revenue 188.1
111.70.0
83.6
35.981.8
51.2
16.536.7
53.4
Note: The fiscal year runs 1 April–31 March. FY2014/15 data are preliminary, for 1 April–30 September. Source: MOF.
Click here for chart data

25
Part 2 Performance in 2014
account surplus in the first half of 2014. The surplus on merchandise trade offset a deficit on other components of the current account. The deficits on services, income and transfers (which includes remittances) were relatively large.
QCB’s foreign currency reserves stood at QR159.4 billion at end-September 2014, up by QR16.4 billion from the previous year (figure 2.30), reflecting the underlying overall surplus on the balance of payments. In September 2014, Qatar’s high foreign reserves amounted to the equivalent of 15 months of goods imports, or around 20% of nominal GDP.
Trade and balance of paymentsQatar posted a substantial trade surplus in the first half of 2014 of QR199.6 billion, given higher exports and slower-growing imports (figure 2.29). During the first half of 2014, estimates from QCB show that merchandise export proceeds rose by 1.3% relative to the first half of 2013, mainly on oil and gas. Merchandise imports grew in the first half of 2014 by 0.9%, mainly reflecting inputs required for construction projects. MDP&S estimates show that import growth was concentrated in machinery and transport equipment along with miscellaneous manufactured articles.
Oil and gas continues to provide the bulk of Qatar’s export earnings. Non-oil and gas items accounted for just 11.7% of total merchandise exports, unchanged from 2013.
A sizeable trade surplus, equivalent to 52.0% of nominal GDP, once again underpinned a substantial current
Figure 2.28 Fiscal balance, first-half actual (QR billion)
117.9
188.1
70.3
0
40
80
120
160
200
Total expenditure Total revenue Overall balance
H1, FY2014/15H1, FY2013/14H1, FY2012/13
25.2
70.2
164.1
93.9
118.5
93.2
Note: The fiscal year runs 1 April–31 March. FY2014/15 data are preliminary, for 1 April–30 September. Source: MOF.
Click here for chart data
Figure 2.29 Current account components (% of nominal GDP)
54.1
-8.0 -10
0
10
20
30
40
50
60
Current account
TransfersIncome
Services Goods
H1 2014H2 2013H1 2013
52.049.8
30.427.7
34.0
-8.0 -9.2-5.0 -7.0 -6.2 -4.1
-8.0 -8.3
Source: MDP&S estimates based on data available from QCB (http://www.qcb.gov.qa/English/Publications/Statistics/BalanceofPayments/Pages/default.aspx), accessed 25 November 2014.
Click here for chart data
Figure 2.30 Foreign reserves (QR billion)
124.8
0
20
40
60
80
100
120
140
160
180
Balances with foreign banksForeign securitiesOthers (gold, IMF reserves position, SDR holdings)
Total
Sep14
Jul14
May14
Mar14
Jan14
Nov13
Sep13
Jul13
May13
Mar13
Jan13
37.6
83.1
153.6146.7159.4152.6
143.0
41.162.0
54.3
48.353.7
101.495.8
94.586.7
98.4
Source: MDP&S estimates based on data available from CEIC database, accessed 25 November 2014.
Click here for chart data

26
Qatar Economic Outlook 2014–2016 Update
27
Glossary—Key economic concepts
Gross domestic productGross domestic product (GDP) is a fundamental macroeconomic aggregate that plays a central role in macroeconomic analysis, although it has limitations (see below).
What is GDP?GDP is widely used as a measure of economic output, as it represents the value of final goods and services produced in a given period of time, usually one year. Another way of looking at it is as the sum of value added across all sectors in the economy over a period.
How is GDP measured?There are three main approaches to measure GDP, which should give the same results.
• Production approach: GDP is equal to the sum of value added across all sectors i.e. the gross output minus the value of intermediate consumption of goods and services summed across all sectors.
• Expenditure approach: GDP is the sum of final consumption of goods and services by the government and private sector; of gross investment (additions to physical stock of capital in the economy, including changes in inventories); and of net exports of goods and non-factor services (exports minus imports).
• Income approach: GDP is the sum of all income generated from the production process. This includes compensation of employees, and the gross operating surplus of enterprises such as profits, rents and interest.
What is the difference between GDP valued at factor cost and at market prices? GDP at factor cost is the sum of all factor-of-production incomes generated from the production process (such as wages, profits, rents and interest), while GDP valued at market prices is GDP at factor cost plus indirect output taxes, less subsidies to businesses, which creates
a wedge between the incomes earned by factors of production and the price paid for output in the market.
What is the difference between nominal and real GDP?Nominal GDP values economic output using current prices, the prices prevailing over the period during which GDP is measured. Accordingly, changes in nominal GDP will reflect changes in prices as well as changes in the volume of output. Real GDP values output at constant prices by using the prices of a selected year called the “base year”. When relative prices change, the choice of the base year can influence measured real GDP growth.
What is the GDP deflator?This is simply the ratio of nominal and real GDP, and hence it can be considered a measure of the aggregate price level of all domestically produced goods and services in the economy.
What is GDP per capita?This is total GDP divided by the resident population of the country. While it is commonly used as a proxy for standard of living, GDP per capita is not a measure of personal income nor necessarily of the representative well-being of the population.
What are the limitations of GDP as a measure for economic output and income?GDP measures do not normally capture the value of goods and services that are not traded in the market, such as volunteer and charitable services and goods and services produced for own use. Similarly, the existence of a large underground economy or black-market activities (which are not that important in Qatar) would result in a GDP measure that underestimates the true size of the economy.
What is final consumption?This consists of goods and services used by the household and government sectors to satisfy their current needs or wants.

28
Qatar Economic Outlook 2014–2016 Update
What is investment? Gross investment is equivalent to the economy’s acquisition of fixed assets (or gross fixed capital formation) plus the value of inventory changes. Net investment is equal to gross investment less the consumption of fixed capital (i.e. depreciation) and is equal to the addition to the physical stock of capital in the economy between two periods.
What is national saving?This is national disposable income less final consumption expenditure.
What is national income?This is equal to GDP plus factor income receivable from non-residents less factor income payable to non-residents.
What is national disposable income?This equals national income plus the sum of all current transfers in cash or in kind receivable by resident institutional units from non-resident units and subtracting all current transfers in cash or in kind payable by resident institutional units to non-resident units.
Fiscal conceptsWhat is the overall fiscal balance?This is the difference in a given period between total government revenues (including grants) and total government expenditures (current and capital) plus net lending.
What is the primary balance? This is the overall fiscal balance net of all interest payments and receipts by government. The primary balance provides an indicator of the current fiscal support for aggregate demand since interest payments are linked to stocks of liabilities and assets of the previous period.
What is the non-hydrocarbon fiscal balance?This is the overall fiscal balance less oil and gas revenues, which in Qatar is defined in terms of direct revenues (royalties and taxes) received from hydrocarbon production. Investment income from government companies and government-linked companies, which may accrue from hydrocarbon-related activities, is not included in the definition of oil and gas revenues. The non-hydrocarbon fiscal balance provides an indication of the fiscal stimulus to the local economy funded by oil and gas revenues.
What is the fiscal year?The annual budget and accounting period for which revenue and expenditure provisions are made, and for which accounts are presented. The fiscal year for Qatar runs from 1 April to 31 March.
What is cash accounting?Cash accounts record revenue when cash is received and expenses when they are paid in cash, irrespective of when the income fell due or the expenditure commitments were made. Although they are important for understanding what the government contributes to liquidity in the economy and for managing cash, cash accounts may not provide a true picture of the government’s financial position.
What is accrual accounting?Accrual accounts record transactions when the underlying event or commitment occurs, regardless of the timing of the related cash settlement. Revenues are recorded when income is earned, and expenses are recorded when liabilities are incurred or resources consumed. In principle, the difference between cash-based balances and those calculated on an accrual basis should equal “changes in arrears”.
What is “quasi-fiscal” spending?This is expenditure executed by state-owned (financial and non-financial) enterprises. It is in character similar to expenditure normally executed by the government, but is not included in the government budget (or listed under “contingent liabilities” in the budget). Central bank operations that entail implicit subsidies or taxes are also quasi-fiscal in nature.
Monetary conceptsWhat is reserve money or M0?Reserve money is a liability of the central bank. It is the sum of (i) currency issued by and held outside the central bank; (ii) banks’ deposits at the central bank to satisfy reserve requirements and for clearing purposes; and (iii) in the case of Qatar, other reserves including bank deposits at the central bank in excess of requirements. Reserve money can also be expressed in terms of the central bank’s counterpart assets, which fall into two main categories: net foreign assets, which comprise the net official international reserves plus any other net foreign assets that are less liquid and hence are not included in the net official international reserves; and net domestic assets, which include central bank net claims on government (claims minus deposits) and claims on other sectors.

29
Glossary
What is narrow money or M1?This is currency in circulation plus demand deposits. Narrow money is considered “liquid”. Narrow money typically pays zero or relatively low rates of interest.
What is “quasi money”?This is the less liquid part of the money supply and includes savings deposits and all deposits denominated in foreign currency.
What is “broad money” or M2?This is the sum of quasi-money and M1.
What are official foreign reserves?These are the central bank’s liquid foreign assets that can be used to secure the country’s external payments at any moment. Reserves include gold, foreign exchange, and the reserve position at the International Monetary Fund. Reserves are usually presented in net terms by excluding from the gross official foreign reserves the central bank’s foreign liabilities.
What is “credit”? Credit creation involves the provision of resources by the lender (such as banks or any other financial institution) to the borrower. In this way the lender acquires a financial claim and the borrower incurs a liability to repay in the future. Credit to non-financial sectors (such as government, private businesses and households) is mainly used to finance production, consumption and capital formation.
What is the trailing price-to-earnings ratio?This is calculated by taking the current stock price and dividing it by a company’s trailing earnings per share for the past 12 months. This measure differs from the forward price-to-earnings ratio, which uses earnings estimates for the next four quarters.
What is the price-to-book ratio?This ratio compares a stock’s market value to its book value, calculated by dividing the current closing price of the stock by the latest quarter’s book value per share.
Balance-of-payments conceptsWhat is the trade balance? This is the difference between a nation’s imports and exports of merchandise measured over a specified period (normally a calendar year). The trade balance is part of the wider current account balance.
What is the free on board (f.o.b.) price?The f.o.b. price of exports and imports of goods is the market value of the goods at the point of uniform valuation (the customs frontier of the economy from which they are exported). It is equal to the cost, insurance, freight (c.i.f.) price less the costs of transport and insurance charges, between the customs frontier of the exporting (importing) country and that of the importing (exporting) country.
What is the c.i.f. price? The c.i.f. price is the price of a good delivered at the frontier of the importing country, including any insurance and freight charges incurred to that point, or the price of a service delivered to a resident, before the payment of any import duties or other taxes on imports or trade and transport margins within the country.
What is the income and services balance?This is the sum of net income received from non-residents and the balance in services trade measured over a specified period. The income account comprises flows derived from labour (wages paid to non-resident employees) and from net investment income. The services balance consists mainly of payments for travel, transport, communications, construction, housing rentals and financial services.
What is the current account balance?This is the sum of the trade, income and services balances, plus net current transfers, which include cash transfers, gifts in kind and remittances (which are sizeable in Qatar) sent by foreign workers to families back home. It is termed the current account because goods and services are generally consumed in the current period.
What is the capital and financial account balance?This records purchases or sales of financial assets or transactions related to international borrowing and lending. It also includes capital transfers.
What is the international investment position and the capital accountThe international investment position of a country is a financial statement presenting both the composition and value of a country’s external financial assets and liabilities. The difference between these assets and liabilities is its net international investment position.
What is external debt?This is the stock of outstanding contractual liabilities, issued by the public and private sector to non-residents, that have been disbursed.
30
Qatar Economic Outlook 2014–2016 Update
Exchange rate conceptsWhat is the bilateral exchange rate? This is the price of one currency measured in units of another. The nominal US dollar exchange rate for the Qatari riyal is pegged at QR3.64 = $1.
What is the nominal effective exchange rate (NEER)?Unlike the bilateral exchange rate, the NEER is not a market price but an index number that measures the weighted average of the country’s bilateral exchange rate against a basket of trading partners’ currencies over a given period. The size of the weights normally reflects their relative importance in the country’s international trade or in its overall foreign transactions, including external financial transactions. Movement of the NEER provides an indication of changes in the value of the domestic currency against the currencies in the basket. An appreciation occurs when a domestic currency unit can buy more of the basket of currencies.
What is the real effective exchange rate (REER)?This is the NEER adjusted for differential inflation rates between a home country (Qatar, for example) and its trading partners. An appreciation of the REER can occur either because the NEER is appreciating or because domestic inflation in the home country (Qatar) is higher than that in its trading partners. Changes in the REER provide a measure of the change in the currency’s purchasing power and of the price competitiveness of the country’s tradeable goods and services against trading partners’ goods and services.
