qatar economic outlook 2018-2020
TRANSCRIPT

Qatar Economic Outlook
Issue Number 11
2018-2020

Qatar Economic Outlook 2018-2020
Issue Number 11
Copyright (2018) of the Planning and Statistics Authority in the State of Qatar
Date of publication December 2018.
Note: The previous issues of the Qatar Economic Outlook report have been renumbered from 1 to 10 so that this issue is number (11).
- Qatar Economic Outlook Report 2011 - 2012 October 2011 No. (1)- Qatar Economic Outlook Report 2012 - 2013 June 2012 (2)- Qatar Economic Outlook Report 2012 - 2013 Updated December 2012 No. (3)- Qatar Economic Outlook Report 2013 - 2014 June 2013 No. (4)- Qatar Economic Outlook Report 2013 - 2014 Updated December 2013 No. (5)- Qatar Economic Outlook Report 2014 - 2015 June 2014 No. (6)- Qatar Economic Outlook Report 2014 - 2016 Updated December 2014 No. (7)- Qatar Economic Outlook Report 2015 - 2017 June 2015 No. (8)- Qatar Economic Outlook Report 2015 - 2017 Updated December 2015 No. (9)- Qatar Economic Outlook Report 2016 - 2018 June 2016 No. (10)
The numbers from 1 to 4 were published on behalf of the General Secretariat for Development Planning. The numbers 5-10 were issued under the name of the Ministry of Development Planning and Statistics. The current number 11 is issued under the name of the Planning and Statistics Authority in the State of Qatar
Doha TowerPO Box: 1855Doha, Qatarwww.mdps.gov.qa
The content of this report may be reproduced free of charge for non-commercial purposes provided that reference is made to copyright holders.
Disclaimer: The opinions expressed in this report reflect the professional evaluation of the Planning and Statistics Authority staff, and do not necessarily represent the official views of the PSA or the State of Qatar. In spite of all efforts to ensure accuracy in all data and information, the PSA shall not be liable for any errors in the sources or in the transmission of the data. It should also be noted that the data in the report date back to December 2018.

Foreword
Research, studies, modeling and simulation are part of the planning process related to the preparation and following-up the implementation of the National Development Strategy, an endeavor striving to achieve the overall vision of development as envisaged by the Qatar National Vision 2030. The Planning and Statistics Authority is honored to present this edition of the Qatar Economic Outlook (QEO). The QEO’s aim is to monitor, analyze, and anticipate the implications of the implementation of development projects on a regular basis, nominally twice a year. The QEO consists of two chapters; the first chapter presents the short-term forecasts of economic performance over the next three years. It also analyzes the assumptions underlying the forecasting process, which are often derived from follow-up reports on the implementation of development projects submitted to the Council of Ministers, as well as analyzing the potential and risks at local, regional, and global levels that are likely to have some influence on the implementation of development projects during the forecast period. The second chapter of the QEO reviews the trends and patterns of the evolution of the performance of the primary and secondary economic sectors during the previous year, highlighting the course of the development of macroeconomic policies, including fiscal policies, monetary policies, and foreign trade, together with their implications on the course of economic and social development. In this context, the timeframe for the first chapter of this QEO issue (No. 11) is the period 2018-2020 and uses results from forecast models to predict future outcomes relevant to policy planning, while the timeframe for the second part is the previous year, i.e., 2017 and three quarters of 2018.
This QEO includes a brief description of the impact of the economic blockade imposed on the State of Qatar by four neighboring countries across all macroeconomic indicators with comparisons to the performance of pre-blockade years. Fortunately, the preparation and issuance of this report is taking place under a favorable economic climate stemming from the resounding success in overcoming the consequences and impacts of the blockade. The economy of the State of Qatar is open to the outside world and thus positively and negatively affected by changes in the world at all political and economic levels. At present, the Qatar economy is
benefiting from the growth and expansion of the global economy, notwithstanding the political and security tensions within the region.
The Planning and Statistics Authority expects Qatar’s overall economic performance to improve due to an increasing real GDP growth rate, which is forecast to edge up from 2.6% in 2018 to 2.9% in 2019 and 3.1% in 2020. The non-hydrocarbon sector is predicted to contribute most of that growth in the first two years of the outlook period, deriving especially from the services and manufacturing sectors. Real GDP growth will also be further supported by the hydrocarbon sector benefiting from the expected increase in global demand for oil and gas combined with the lifting of the OPEC production ceiling, and with new gas development projects entering their production and export phase. Moreover, the inflation rate is expected to remain at low levels, ranging between less than 1% and 2.5%.
Additionally, the fiscal deficit is expected to decline due to increased oil and gas revenues and increased efficiency and effectiveness of government spending. The current account balance is projected to register a surplus during the forecast period as oil prices continue to improve. However, the main risks to Qatar’s overall economic performance are sudden changes and shocks in the global economy and therefore in worldwide oil and gas markets, especially the resultant price decline potentially triggered by global trade anxieties and regional political tensions.
This Qatar Economic Outlook Report 2018-2020 is based on the official data issued by various government agencies, and without their cooperation, the report could not have been produced. Therefore, I would like to thank all Ministries and multiple government agencies, including the Ministry of Finance, Qatar Central Bank, and Qatar Petroleum for their unstinting cooperation in sharing information and data. My sincere thanks are also extended to the PSA team that participated in the preparation of this report.
Dr. Saleh Alnabit
President of Planning and Statistics Authority
Under the supervision of Noora Nasser Almerekhi, Director of Strategic Planning Department (SPD), Dr. Mohammed M. Al-Sabbry led the process of compiling and authoring the Qatar Economic Outlook 2018-2020 in both Arabic and English (Issue No. 11). The first draft of the Arabic version was reviewed by Mr. Hamad Rashid Alathba, Dr. Yousef Al-Mulla, Dr. Issa Ibrahim, Ali Soliman and Mansoor Albashiry, while Dr. Lenard Milich thoroughly examined the English version for consistency and logical expression. The Ministry of Finance and the Qatar Central Bank provided constructive comments, which improved the analysis and presentation of the report and appreciations to the efforts of the MOF team headed by Mr. Aziz Al-Othman/Abdulrahman Jolo and the QCB team led by Ms. Maha
Al-Suwaidi. Hissa Ahmed Alassiry of the SPD oversaw the organization, and communications necessary for the report’s completion and Noor Al-Kuwari provided administrative support.
The PSA’s Statistical Department provided data and technical advice and made generous contributions to the analysis by Martin Poveda, Asmaa Suwailam, and Fatima Alhammadi. The report was facilitated by colleagues in the PSA’s Administration and Finance led by Mr. Hamad Alathba. The PSA’ Public Relations and Communications led by Torfa Alzarraa contributed in translating the report into English by Mohammed Al-Sharqawi, and then design for printing the report by Osama Almanasir and Mohamed Ifraz.
Acknowledgments
Contents
Foreword iii
Acknowledgments iv
Part 1 - Economic Outlook 2018-2020 1Outlook Summary 1
Forecasts of Macroeconomic Indicators 5
Real GDP growth forecast 5
Forecast of the performance of nominal GDP 9
Inflation Forecasts 10
Forecasts of fiscal balance of the state budget 12
Forecasts of the current account of the balance of payments 12
Risks to oil & gas prices and markets 13
Monetary liquidity and risks 14
Regional and international consensus forecasts for the Qatari economy 16
Consensus forecasts of real GDP growth 16
Consensus forecasts of nominal GDP growth 17
Consensus forecasts of inflation rate 18
World Economic Outlook 18
Risks to global economy 19
Implications of Global Economy Developments on Qatar’s Economy 20
Energy and commodity markets outlook 22
Oil Prices 22
Consensus Oil Prices Forecasts 25
Gas Prices 27
The gas industry and future challenges 29
Commodity markets outside the energy sector 32
Part 2- Economic Performance for 2017 and the first half of 2018 37Performance Summary 37
Performance of GDP by production 37
Performance of GDP by expenditure 39
Sectoral Progress and Diversification Potentiality 41
Non-Oil Sector Development 42
Labour force and skill level 44
vi
Qatar Economic Outlook 2018-2020
Prices 44
Consumer Price Index 44
Producer Price Index 45
Asset Markets: Equity and Real Estate 46
Qatar Stock Exchange 46
Real Estate 48
Liquidity and Money Supply 49
Developments in banking assets and liabilities 51
The repercussions of the siege on the banking system 52
Monetary policy of domestic credit 54
Monetary policy and interest rates 55
Public Debt 58
Fiscal policy and public finance accounts 59
General Fiscal Balance 60
Government Revenues 60
Government expenditures 61
Balance of Payments and Foreign Trade 63
Balance of Payments Accounts 63
Current and Financial Accounts and their components 63
Foreign Trade 64
Glossary—Key economic and finance concepts 67

Boxes
Box 1-1: Measures to overcome the blockade repercussions 2
Box 1-2: Forecast methodology and assumptions 4
Box 1-3: Major projects expected to be completed in the construction sector 6
Box 1-4: Manufacturing activities’ development 7
Box 1-5: Real Effective Exchange Rate (REER) of Qatari Riyal in relation to Dollar Index 11
Box 1-6: Merger and restructuring of revenue and productive institutions 13
Box 1-7: Breakeven price of crude oil 14
Box 1-8: Full application of Basel III and preparation for Basel IV standards: 15
Box 1-9: The United States as a major producer and game-changer in the global oil market 24
Box 1-10: Recovery of oil and gas exploration investments in the medium term 33
Box 1-11: Japan to change LNG buying strategy 34
Box 1-12: Qatar Short-term Economic Prospects 2018 - 2020 35
Box 2-1: Monetary Policy 56
Box 2-2: The consequences of the blockade and its role in re-adjusting the Qatari economic path 59
Box 2-3: Ministry of Finance’s efforts to implement the GFS Manual 62
Tables
Table 1-1: Forecasts of Qatar’s Key Economic Indicators 1
Table 1-2: Qatar Economic Forecasts as Viewed by others 17
Table 1-3: IMF Forecast for China and USA 19
Table 1-4: Consensus Forecasts of Oil Prices 26
Table 2-1: Qatar Key Economic Indicators 37
Table 2-2: Nominal and Real GDP and the GDP Deflator 38
Table 2-3: Regional Equity Market Ratios 48
Table 2-4: Development Broad Money Supply (QR billion) 51
Table 2-5: Development Non-Resident Deposits (QR billion) 53
Table 2-6: Fiscal Revenues by Economic Classification (QR billion) 60
Table 2-7: Fiscal expenditure according to economic and functional classifications (%) 62

viii
Qatar Economic Outlook 2018-2020
Figures
Figure 1-1: Forecast Real GDP sectoral growth in the economy (%) 5
Figure 1-2: Forecast Sectoral Contributions on real GDP growth (percentage points) 5
Figure 1-3: Sectoral contributions to nominal and real GDP growth (Percentage points) 9
Figure 1-4: Trends and forecast in the Crude Oil Price and GDP deflator 9
Figure for Box 1-5: Index of Real effective exchange rateof QR vs US Dollar Index 11
Figure for Box 1-6: Projected dividend income stream for the stocks of QIA (QR million) 13
Figure for Box 1-7: Breakeven price of oil under different scenarios (US$ per barrel) 14
Figure 1-5: Consensus and QEO estimates of Real GDP growth for Qatar (%) 16
Figure 1-6: Consensus and QEO estimates of Nominal GDP growth for Qatar (%) 17
Figure 1-7: Consensus and QEO estimates of Inflation growth (%) 18
Figure 1-8: Rate of Changes of Global Real GDP Growth Projections by IMF (%) 19
Figure 1-9: IMF Projection of Real GDP growth for GCC countries (%) 20
Figure 1-10: World annual CPI Inflation projection by the IMF (%) 21
Figure 1-11: Qatari and International Oil Prices, $/bbl 22
Figure 1-12: World Net Petroleum and Liquids Position Spot Prices of Brent and WTI 23
Figure 1-13: Global petroleum and other liquids production, m bbl/d 23
Figure 1-14: OECD commercial crude oil and liquid fuels inventories, end-of-period (million bbls) 24
Figure for Box 1-9: US-focused Private Equity Investment in Energy 24
Figure 1-15: Total global production and consumption of crude oil and liquid fuels (MBPD) 24
Figure 1-16: Global Liquids* Consumption and Inventories (m bbl) 25
Figure 1-17: Average Monthly Crude Oil Prices: Spot vs Futures 27
Figure 1-18: LNG prices -US$ per million thermal power units 28
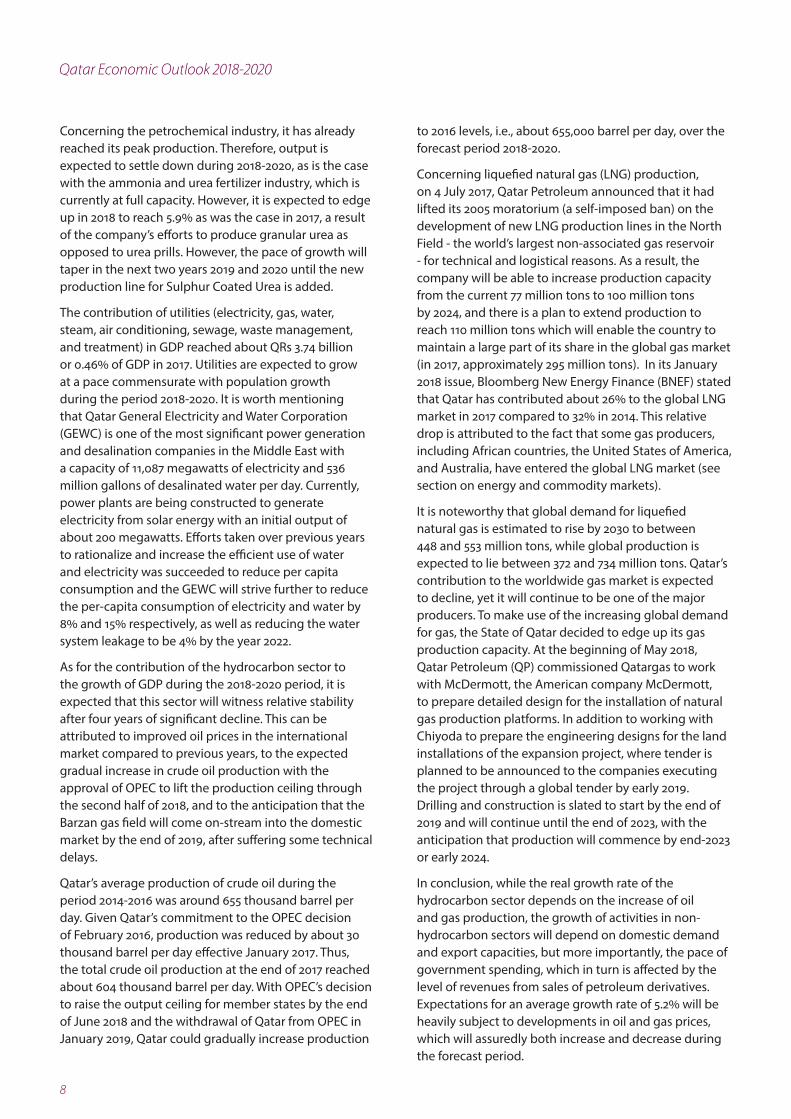
Figure 1-19: Spot price ratios: Crude oil to gas 28
Figure 1-20: Qatari Export of LNG by Contract Type and Volumes 28
Figure 1-21: Natural Gas Price Index (2005=100) 29
Figure 1-22: Nominal Liquefaction Capacity by Region 2011-2023 29
Figure 1-23: The LNG export scenario up to 2030 before and after FID by major exporters (MMtpa) 30
Figure 1-24: Non-fuel Commodity Price Indices (2005=100) (Points) 32
Figure for Box 1-10: US and Global E&P Spending by Type 33
Figure 1 for Box 1-11: Premium or discount of contract vs spot deliveries of LNG 34
Figure 2 for Box 1-11: Re-exports of LNG by exporting region and volumes 34
Figure 2-1: Nominal GDP (US$ Billion and QR Billion) 38
Figure 2-2: Nominal and real GDP growth (%) 38
Figure 2-3: Rate of Change of GDP deflator for 2017 (%) 39
Figure 2-4: Nominal Expenditure Side GDP, QR Billion 40

Figure 2-5 : Contributions to rate of change of nominal GDP by expenditure (points) 40
Figure 2-6: Total gross savings as percentage of GDP (%) 40
Figure 2-7: Hydrocarbons and non-hydrocarbons, share in real and nominal GDP (%) 41
Figure 2-8: Business Confidence Index and inventory growth 41
Figure 2-9: Projects contracts by economic sector 41
Figure 2-10: Sector contribution to GDP growth (percentage point) 42
Figure 2-11: Real GDP Growth by Sector (%) 42
Figure 2-12: Growth of service sector components (%) 42
Figure 2-13: Contribution of service sector components to its total growth (%) 43
Figure 2-14: Construction sector values & growth 43
Figure 2-15: Real output of the manufacturing sector 44
Figure 2-16: Non-Qatari employment skills composition (%) 44
Figure 2-17: Annual Rate of Change (General and Core) (%) 45
Figure 2-18: The contribution of 2018 CPI components on its annual rate of change (points*) 45
Figure 2-19: Rate of change of Producer Price Index (PPI) (annual change %) 46
Figure 2-20: GCC Stock Price Index and the S & P Global Index (YoY %) 47
Figure 2-21: MSCI stock price index (points based on US dollar) 47
Figure 2-22: Issuances of Treasury bills, Bonds and Sukuk 48
Figure 2-23: Index and rate of change in Real Estate Prices and Credits 49
Figure 2-24: Contributions of the monetary base to total rate of change 49
Figure 2-25: Contributions of broad money supply components to its total rate of change 50
Figure 2-26: Distribution of total liabilities by source 51
Figure 2-27: Distribution of total assets by source 51
Figure 2-28: Source of funds for commercial banks (% of total deposits) 52
Figure 2-29: The contribution of public and private deposits to total deposits 53
Figure 2-30: The contributions of public and private credit to total credits 54
Figure 2-31: Credit facilities of commercial bank to public sector 54
Figure 2-32: Credit facilities of commercial bank to private sector 55
Figure 2-33: Annual Interest Policy Rates (%) 55
Figure 2-34: Interbank transaction rates (weighted average) 56
Figure 2-35: International Reserve and percentage of its components 57
Figure 2-36: Contribution of International Reserve components to its total growth 57
Figure 2-37: The impacts of monetary policy intervention on international reserve (%) 58
Figure 2.38: Development of total public debt up to November 2018 58
Figure 1 for Box 2-2: Qatar’s credit default swap index (CDS points) 59
Figure 2 for Box 2-2: The trend of the Qatar Central Bank’s foreign assets development 59
Figure 2-39: State Budget Balance (as percentage of GDP) 60
Figure 2-40: Ratios of fiscal revenues’ main components and total rate of change (%) 61

x
Qatar Economic Outlook 2018-2020
Figure 2-41: Ratios of fiscal expenditure’ main components and total rate of change (%) 61
Figure 2-42: Current Account Balance (as % of GDP) 63
Figure 2-43: BOP Current Account Balance (as % of GDP) 63
Figure 2-44: BOP Financial Account Balance and its components (% of GDP) 64
Figure 2-45: Total trade and its annual growth 64
Figure 2-46: Total value of monthly imports of commodities (QR billion) 65
Figure 2-47: Value of Quarterly imports by its main groups (QR billion) 65

1
Part 1 - Economic Outlook 2018-2020
Outlook SummaryAfter the State of Qatar achieved real GDP growth of 1.6% during the year (2017), this Qatar Economic Outlook (QEO) for the 2018-2020 period forecasts the average1 real GDP growth to rise to 2.8% per annum, while the average rate of change of nominal GDP to be 8% during the same period (Table 1.1 and see the section on GDP).
Qatar’s economy has proven to be immune to external forcing factors by adeptly surviving the repercussions of the air, land and sea blockades along with the severance of the economic and financial ties that were imposed by some neighboring countries on the State of Qatar since June 5th, 2017. The quarterly real GDP grew from 0.7% at the end of June 2017 (the second quarter) to 3.3% at the end of December 2017 (the fourth quarter). Moreover, the real GDP growth for the first half of 2018 achieved 2.25%.
Nevertheless, it is evident that Qatar’s economy was not completely protected from the negative consequences of the blockade at its beginning since it was imposed suddenly, and resulted in an immediate sharp drop in the goods trade volume and the number of visitors from the blockading countries due to the cessation of air and sea traffic and all land transport. It also triggered a significant drop of non-resident deposits in Qatari banks in addition to a sharp drop in trading values at Qatar’s Stock Exchange. It has also put more pressures on the Qatari riyal exchange rate, and has increased insurance premium costs for the shipping industry, along with the premium rate of credit swap default for Qatar’s external debt.
Unsurprisingly, these repercussions have entirely or selectively squelched the performance of many service-sector enterprises; including the activities of wholesale and retail trade, transport and storage, and hotels and restaurants. The economic and social blockade has also triggered, to an extent, a relative decline in the performance of the activities of the banking and real estate sectors. Alongside these private-sector impacts, the blockade forced the government to increase public recurrent and capital expenditures to subsidize food and nonfood imports, together with an obvious requirement to extend financial support to encourage domestic food production. The government had also withdrawn some of its foreign savings and investments to be deposited at local banks to support the local banking system.
1 the average is the arithmetical average rather than the compound annual growth rate (CAGR), otherwise, if CAGR is used will be mentioned
Table 1-1: Forecasts of Qatar’s Key Economic Indicators
Real Forecasts
2017 2018 2019 2020
Real GDP growth * (%) 1.6 2.6 2.9 3.1
Hydrocarbons: change in GDP * (%)
-0.7 -0.3 0.2 0.8
Non-hydrocarbon GDP * (%) 3.8 5.2 5.2 5.1
Nominal GDP growth (%) 10.0 13.8 6.5 3.9
Consumer Price Inflation (Consensus) (%)
0.5 <1 2.5 2.6
Fiscal balance (% of nominal GDP)
-5.7 3.3 5.1 5.9
Current account balance (% of nominal GDP)
3.8 9.2 8.9 7.9
* % In constant 2013 pricesSource: PSA in coordination with MOF and QCB

2
Qatar Economic Outlook 2018-2020
With the negative repercussions of the blockade beginning to taper off, the Qatari economy is forecast to recover and grow favorably during the 2018-2020 period, benefiting from the current and expected global economic growth and positive domestic and international developments, most notably the rise in world oil prices that are likely to stabilize at higher levels coupled with the potential increase of Qatar’s production of crude oil to full output capacity after the abolition of production ceilings among the Petroleum Exporting Countries (OPEC) member states as well as the announcement of the State of Qatar to withdraw from OPEC in January 2019. In addition, it is expected that Qatar’s economy will benefit in the medium-term from the direct and indirect positive effects of the policies and structural reforms adopted by the Qatari government to face the consequences of the blockade, the foremost of which are: measures to improve the investment environment; strategies to encourage local manufacturing industries to achieve self-sufficiency and food security; the expansion of new air and sea shipping lines and launching the operation of Hamad Port; allowing visa-free entry for citizens of 80 countries; policies to bolster ties with Qatar’s import and export partners; measures to achieve macroeconomic stability, whether those related to improved public fiscal management and banking liquidity or those related to external balances; and the effectiveness of public investments in infrastructure and social services,
especially in education and health (see Box 1-1).
Forecasts show that economic growth during 2018-2020 will be able to capitalize on the growth of non-hydrocarbon-related economic activities with an average annual growth rate of 5.2%, and will be bolstered by construction, manufacturing, and an increasing basket of service activities. Furthermore, the hydrocarbon sector (oil, gas and their derivatives) will restore its positive and stable contribution to overall growth with an average annual growth rate of about 0.1%.
It is noteworthy that the construction sector will continue to expand at high growth rates during the forecast period, although its growth pace will slow down in 2020 as a result of the completion of a large number of infrastructure projects currently under construction, before growing again once the expansion work for LNG production from the North Field commences as well as the expansion of Hamad port and Hamad international airports.
The service sector will continue its high growth, particularly in service activities related to the ongoing preparation of the World Cup in 2022, namely, transport, public services, real estate, and banking activities. In this regard, the services sector is expected to become one of the most significant contributor to economic growth during forecast period. However, the growth pace of this sector will slow down if population growth is moderated, according to some sources’ predictions.
Box 1-1: Measures to overcome the blockade repercussions
Despite the abrupt imposition of blockade measures against the State of Qatar by Saudi Arabia, UAE, Egypt, and Bahrain, nonetheless the Qatari government - from the first moments - has taken rapid measures that contributed to curb and counteract the harmful effects of the blockade on the standard of living of citizens and the level of economic performance; such as:
• Toovercometheclosureoftheimportoutlets,the State of Qatar harnessed its air fleet - Qatar Airways - to secure the country’s food needs from alternative sources; mainly, Turkey, Oman, Iran, India, and Kuwait. Also, Qatar smoothed the maritime importation process from several sources worldwide. It also encouraged the local production of some food commodities, especially vegetables, dairy products, poultry, and eggs.
• Toovercometheshortageofcashresultingfromthewithdrawal of non-resident deposits by the blockading countries and finding alternatives to finance and credit, the State of Qatar deployed its financial, institutional and banking capabilities. The public
sector, including Qatar Central Bank (QCB), increased its deposits with the local banking system in local and foreign currencies. A joint committee was formed from among competent agencies in the private and public sectors to monitor the developments and to face any risks in the lack of liquidity and stymie local currency speculation. Furthermore, local banks were afforded the opportunity to borrow money from QCB according to Repurchase Agreement (Repo) (Repo is a borrowing agreement where a seller of a security agrees to buy it back from a buyer (investor) at a higher price on a specified date). Using repo mitigated the lack of liquidity which have increased borrowing from QR5.4 billion in April 2017 to QR82.7 billion in October 2017. Due to the improvement of liquidity, the repo borrowing declined to QR38.8 billion by April 2018, and it further dropped to QR5.3 billion in May 2018 and then fluctuated up and down until it reached QR0.25 billion in August 2018 indicating the improvement of the status of the local banking system in relying on their own sources of funding.

3
Part 1 - Economic Outlook 2018-2020
Inflation
The source of inflation in Qatar is either demand-pull inflation or imported inflation, and the annual inflation rate is measured by the annual rate of change of the consumer price index (CPI). It is relevant to note that the average inflation rate for the period Jan-Oct 2018 was 0.44%, ranging between a maximum of 1.01% and a minimum of negative 0.25%. However, when excluding price inflation of housing and utilities the average inflation for the same period was 1.66%, having a maximum of 2.9% and a minimum of 0.53%; therefore, this QEO predicts that the Qatar’s average annual inflation rate by the end of 2018 to be around less than 1%, while it expects to be ranged during the rest of forecast period 2019-2020 between a minimum of 1.6% to reflect the average domestic inflation in Qatar over the past three years, and at a maximum of 3.7% to reflect the average global increase in inflation over the previous three years, according to IMF recent estimates of October 2018, with an average inflation rate of 2.5% to reflect the average inflation rate of emerging countries and Eurozone countries as the main trade partners of Qatar (see the section on inflation).
The fiscal position of the Qatari State budget.The forecasts of the Ministry of Finance (MOF) indicated that the 2018 state budget would register a fiscal deficit of QR28 billion, equivalent to 4.1% of GDP based on the assumption that the price of crude oil will be $45 per barrel. However, the increase in the average prices of crude oil and gas on the international market between January 2018 and mid-September 2018 was 39% for oil and about 40% for gas, thus, the new estimates of the MOF indicate the possibility of achieving a surplus in 2018 for QR 23 billion, equivalent to 3.3% of GDP. In fact, the first half of the 2018 state budget has witnessed a surplus of 2.1% of GDP.
It is noteworthy that the preliminary estimate of government revenues indicate the difficulty of mobilizing non-oil revenues owing to the inability to collect taxes in 2018, coupled with the possibility of a decrease in dividend income from Qatar Petroleum (QP) (which are transferred to the state budget after some delay) as a result of deducting (retaining) part of profits from QP dividend income to cover the cost for the expansion of gas fields as well as the modernization and maintenance of crude oil fields. As for public spending, projections indicate that current expenditures will not increase significantly, but there may be a slight upward
movement of investment (capital) expenditures in 2018 for infrastructure-related projects.
With reference to 2019 and 2020, the early estimation of the MOF indicates that state budget of 2018 would witness a financial surpluses of around 5.1% and 5.9% of GDP respectively, assuming oil prices continue their upward march. The volume of investment capital expenditures is also expected to fall, according to MOF projections, as a result of the completion of the first stages of a number of infrastructure projects including the Hamad Port and Hamad International Airport, and the completion of a large part of the roads and bridges currently under, or projected for, construction, which accounts for 45.1% of total investment expenditure.
The current account of the balance of payments The external balance, as measured by the current account of the balance of payments, is expected to register a surplus of 9.2% of GDP in 2018 and 8.9% of GDP in 2019. However, the current account balance is expected to witness a limited drop in 2020, with the surplus reaching only 7.9% due to an anticipated increase in imports with an average annual growth of 7%, which reflects the need to increase the imports of construction materials for the North Gas Field Expansion Project and the completion of the World Cup infrastructure projects.
RISKS TO THE OUTLOOK- International Oil and Gas Prices Fluctuations Qatar’s economy is similar to other economies in the region that rely on a single economic resource (economic rent); these countries, Qatar included, are far more vulnerable to the risk of global oil market fluctuations than countries with multiple economic sources, which in turn affects both short- and medium-term forecasts. Hence, since Qatar’s budget is dependent on revenues from oil and gas sales, and as the budget is a crucial driver of economic dynamics, substantial risks to the continued growth trajectory of the Qatari economy arise through price fluctuations and changes in the global supply and demand of oil and gas products and their derivatives.
Therefore, the State of Qatar, represented by the Ministry of Finance (MOF), has taken such risks into account during the preparation of the state general budget since 2015. For instance, the MOF has used a conservative oil price of US$65 per barrel in 2015, and US$48 per barrel

4
Qatar Economic Outlook 2018-2020
in 2016, and US$45 per barrel in 2017 and 2018. However, given that average global oil prices have increased from US$59 per barrel in the fourth quarter of 2017 to US$72.4 during the period (January-October 2018), and concomitantly the average price of Qatar’s onshore and offshore oil has reached about US$73 and US$69.3 respectively in during the same period. Based on oil price development that will be discussed later, this QEO forecasts most of Qatar’s economic indicators for the period 2018-2020 using an average price of oil pegged at US$68.5 per barrel with a maximum of US$69.8 per barrel in 2018 and US$67.4 per barrel in 2020 (see Box 1-2), taking into consideration the recent reverse of crude of oil price of Brent and WTI during the second half of
November 2018 where it reached $59 and $51 per barrel respectively.
It is worth mentioning that there are many potential risks that could affect the forecasts of macroeconomic indicators until 2020, notably: slowness to pursue structural reforms related to the improvement of the investment environment as well as the implementation of fiscal prudence and the mobilization of non-oil revenues; and the downside risks of lower oil and gas prices in the global market owing to technical barriers or political reasons that counteract the agreement achieved on 22 June 2018 between OPEC member states and several non-OPEC members, including Russia, to
Box 1-2: Forecast methodology and assumptions
The Qatar Economic Outlook (QEO)’s forecasts are derived from the technical methodology and mechanism used to prepare a short- and medium-term macroeconomic framework using the Revised Minimum Standard Model (RMSM-X) developed by the World Bank for Qatar in 2011 during the preparation of the First National Development Strategy (2011-2016) emanating from the Qatar National Vision 2030 (QNV 2030). This model allows for forecasting GDP components by the production and expenditure approaches based on standard economic accounting and consistency checks of real economy, fiscal, monetary, and BOP aspects, in line with the integration of macroeconomic policies to achieve development goals of QNV 2030 and the second National Development Strategy (2018-2022) NDS-2. All GDP data forecasts for the period 2018-2020 are made on the basis of 2013 constant prices based on the practice of the Statistical Department at the PSA while drawing upon several numerical assumptions, listed below.
Based on historical data (2015-2017) of national accounts, monetary and public finance of the state budget, and in the light of a number of assumptions, a baseline scenario forecast for the macroeconomic indicators over the short-term (2018-2020) was prepared, which coincides with the first half of planning period for NDS2-2018-2022 (see Box 1-12 at the end of Part I). This scenario is a conservative with progressive approach, based on the principle that sound planning should be done in the worst-case scenario, taking into account what potential risks may occur during the forecast period.Changes in oil and gas prices as well as their supply and demand are one of the key factors that would affect the performance levels of the Qatari economy. As discussed in the text, the MOF has been taking the challenge of price in mind when preparing annual budgets. Furthermore, there may be some risks associated with the fluctuation of the exchange rate of US dollar against major currencies and raising international interest rates as well as the ramifications of the trade skirmish between the United States on the one hand and China and the European Union on the other, which may lead to a slowdown in global demand for commodities, including energy, which may have negative impacts on the Qatari economy. Other internal risks related to the Qatari economy are associated with the questions of whether the economy will benefit from:
1. The expected achievement of institutional, administrative, and legislative reforms to stimulate the private sector and diversify its activities
2. The success of enhancing production efficiency in the oil and non-oil sectors
3. The completion of basic infrastructure projects in education, health, and transportation, followed by their utilization to improve economic diversification
4. The success of rationalization of government spending and the development of non-oil revenues, which is assumed will attract private sector investments and enhance this sector’s contribution to the local economy
5. Absorption of any fluctuations in global demand and supply on the volume of the country exports and imports
Table for Box 1-2: Forecast Assumptions
2018 2019 2020
QCB’s overnight deposit rate (%) 2.5 3.0 3.5
Qatari riyal/$ exchange rate 3.6 3.6 3.6
Total Expenditure (QR billion) 203.2 204.1 203.3
Current expenditure forecasts (MOF)
105.7 111.0 116.5
Capital expenditure forecasts (MOF)
97.5 93.0 93.0
Global growth (IMF WEO)(1) 3.73 3.65 3.66
US LIBOR, 6-month (%) 2 2.33 2.65 3.69
Crude oil price, $ per barrel (1) 69.85 68.39 67.41
Average LNG price, $/mmBtu (million British Thermal Unit (1)
8.80 8.90 9.10
1. IMF World Economic Outlook, Oct 2018 * based on forecast about US federal rate sourced from www.thebalance.com
2 obtained forecast LIBOR from https://longforecast.com/libor forecast-2017-2018-2020 in October 2018.

5
Part 1 - Economic Outlook 2018-2020
increase oil production by about 1 million barrels per day, equivalent to 1% of global demand, to face expectations of falling production from Iran and Venezuela by the end of 2018. However, the positive impact of Qatar’s withdrawal from OPEC in January 2019 will enable it to produce crude oil with full capacity.
Although many observers are optimistic over oil and gas markets and expect oil prices to rise further or at least settle at a peak of US$65 - US$80 per barrel until the end of this year, prices may yet decline in 2019 and 2020 to stabilize between US$45 - US$65 as expected by some observers including EIA, either due to increasing global production in particular from USA or to reduced global demand in particular from China. Thus, Therefore, the International Monetary Fund (IMF) recommends in its recent report that commodity-exporting countries should continue structural reforms in public finances and maintain liquidity in the local banking so that to avoid resorting to the international market to obtain financing at the high-interest rates sparked by the rising global interest rate.
Forecasts of Macroeconomic Indicators Real GDP growth forecast
The Planning and Statistics Authority (PSA) predicts that Qatar’s economy will achieve reasonable economic growth during the forecast period of QEO (2018-2020), with the real GDP growth rate (at constant price 2013=100) to reach 2.6% in 2018, 2.9% in 2019, and 3.1% in 2020, where such growth is attributed to a number of factors, most notably: (1) the gradual increase in the production of the hydrocarbon sector, with an average annual growth of about 0.3% that takes into account the anticipated increase of crude oil production
pursuant to the agreement of OPEC in June 2018 to lift the production ceiling through the second half of 2018 as well as the withdrawal of Qatar from OPEC starting January 2019; (2) the output of the Barzan gas project, which is expected to come on-stream at the end of 2019; and (3) the increase in the production capacity of non-oil (non-hydrocarbon) sectors with an average annual growth rate estimated to be about 5.2% during the forecast period (2018-2020).
The non-hydrocarbon growth during the forecast period (2018-2020) derives mainly from the construction sector, with an average annual growth of 14.5%, and – following far behind, but nonetheless significant – the manufacturing sector with an average annual growth of 2.6%, and a large part of service sector with an average annual growth of 2.8% (Figure 1-1). The contribution of each sector to total GDP growth is reflected as percentage points as shown in Figure 1-2. For example, in 2018, the construction sector will contribute about 1.8 percentage points of the total expected growth of 2.6%, followed by the services sector by 0.90 percentage point and the manufacturing sector by 0.25 percentage point.
Thus, the construction sector is anticipated to be the driver of economic growth in Qatar during the forecast period, with a growth rate of 12.8% to 16.3% during the period 2018-2020. It is unsurprising that such high growth can be anticipated, for construction-related activities accommodates more than 41% of the total labor force. Although the outlook for construction growth was based on relatively conservative assumptions compared to the large growth in 2016 and 2017 of 28.5% and 17.5% respectively, the construction sector still ranks as the primary contributor to overall economic growth. Figure 1-2 indicates that its contribution to total growth is expected to be around 1.8 percentage point for the years 2018-2020.
Figure 1-1: Forecast Real GDP sectoral growth in the economy (%)
-0.3Mining & Quarrying
Construction Manufacturing Services Utilities-2024681012141618
2018 2019 2020
16.3
2.5 2.70.90.2
14.5
2.6 2.81.00.8
12.8
2.7 2.81.2
Note: Excludes agriculture and fishing and Source: PSA estimates (2013=100)
Figure 1-2: Forecast Sectoral Contributions on real GDP growth (percentage points)
2018 2019 2020
Manufacturing Mining & Quarrying
Construction Services GDP
0.25
(0.15)
1.77
0.90
2.6
0.26 0.11
1.78
0.93
2.9
0.27 0.39
1.75
0.96
3.1
-1
0
1
1
2
2
3
3
4
Source: PSA estimates

6
Qatar Economic Outlook 2018-2020
The moderate conservative forecasts for growth in the construction sector for the forecast period is based on the assumption that the construction activities of the mega-projects will focus on completing existing projects rather than launching new ones, while the increase in construction associated with overall economic activities will continue in transport, oil and gas, tourism, education, and infrastructure (Box 1-3). Moreover, it is expected that the completion and construction of residential housing will continue to grow due to factors of high per-capita income and the possibility to obtain credit from local banks for real estate purchases and activities
The services sector is the second source of economic growth at constant prices, rising from 2.69% in 2018 to 2.76% in 2019 and 2.84% in 2020, surpassing the 2.2% and 2% growth rates achieved in 2016 and 2017, respectively. Thus, the services sector will become the second largest contributor to economic growth, representing an average of 33% of real GDP and about 48% of nominal GDP, which is expected to contribute 0.93 percentage points to the average real growth rate of 2.8% during the projection period.
In spite of the blockade’s impacts on the services sector that limited growth rates in the second half of 2017, this sector plays a prominent and vital role at the economic, social, and urban levels through its role in financing economic activities and linking production areas with areas of consumption and transport of individuals, raw materials, and goods, as well as its role in providing social services such as education and health, which makes its development feedback on itself and feedforward into other activities. Therefore, total public service activities are expected to witness high growth rates to reflect developments in other sectors, especially financial services and insurance 5.2%, real estate activities 4%, transport and storage 3.5% and education and health 4% each.
It is worth mentioning that various services benefited greatly from the policies and measures taken by the government to cope with the repercussions of the blockade; concomitantly, activities in the construction sectors remain positive, and include preparing for the World Cup 2022, real estate development projects, and existing infrastructure projects. Additionally, the tourism sector is expected to witness a substantial recovery after being affected by the blockade, thanks to the improvement of cruise line facilities, the introduction of “festivals” (e.g., Qatar Shopping Festival and Qatar Summer Festival) organized by the Qatar Tourism Authority, conference activities, and a slow but steady increase in the number of tourists.
Regarding the wholesale and retail sector, although it has been declining since 2016, forecasts suggest its stability over the next three years, thanks to the opening of retail outlets throughout the country, increased demand associated with other economic activities, the expected growth of capital spending on the overall service sectors, and expectations of continued population growth at about 1.7% compared to about 4.1% in 2017 and 7.4% in 2016.
With the manufacturing sector continuing to grow by 2.5% in 2018, 2.6% in 2019, and 2.7% in 2020 (compared to the modest growth achieved in 2016 and 2017 of 1% and 0.4%, respectively), this sector will be the third source of growth in the overall real GDP (see Box 1-4). The emphasis of growth in this sector is directly and exponentially linked to the development and growth of the mining and quarrying sectors, both being affected by the level of world prices of oil and gas given that approximately 70% of the activities of Qatar’s manufacturing industry are related to petroleum
Box 1-3: Major projects expected to be completed in the construction sector
Transport projects:
• ExpansionofHamadInternationalAirporttobuild Concourse F, swelling capacity from 50 to 65 million passengers annually.
• Expansionofthepassengerterminalandconnecting the airport to the train network (Doha Metro) and the railway.
• DevelopmentofHamadPorttobecomeoneofthe region’s deepest ports and raising its capacity to handle 12 million containers annually.
• CompletionoftheDohaMetrotoconnectwiththe railway network, to link the residential cities with the two industrial cities of Umm Said and Ras Laffan, and linkage of the essential Doha commercial centres Lusail City, Education City, and West Bay.
Real estate and tourism projects:
• CompletionofalargenumberofdwellingsinLusail City, which is expected to accommodate at least 200,000 residents.
• CompletionofthebuildingsinThePearltoincrease the housing capacity to about 40,000 residents.
• DevelopmentofMsheirebDowntownDohatobecome a tourist attraction, which includes hotels and must-visit places.
• CompletionofaboutninemarketmallsincludingNorth Gate Mall, Place Vendome, Doha Mall, Doha Oasis, Katara Plaza, and Waab Mall, which will in total increase the area of shops to more than 2 million square meters.
• Completionofalargenumberofhotelstoaddmore than 20,000 hotel rooms so as to total more than 43,000 hotel rooms by 2022.
7
Part 1 - Economic Outlook 2018-2020
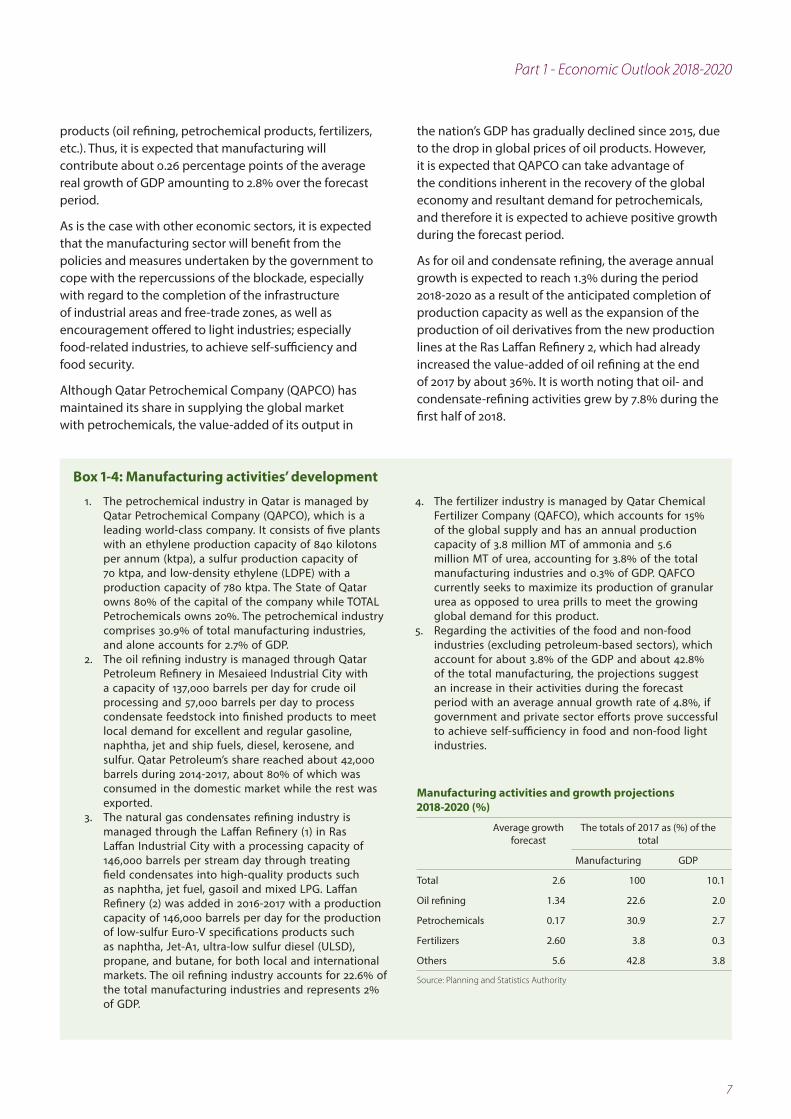
products (oil refining, petrochemical products, fertilizers, etc.). Thus, it is expected that manufacturing will contribute about 0.26 percentage points of the average real growth of GDP amounting to 2.8% over the forecast period.
As is the case with other economic sectors, it is expected that the manufacturing sector will benefit from the policies and measures undertaken by the government to cope with the repercussions of the blockade, especially with regard to the completion of the infrastructure of industrial areas and free-trade zones, as well as encouragement offered to light industries; especially food-related industries, to achieve self-sufficiency and food security.
Although Qatar Petrochemical Company (QAPCO) has maintained its share in supplying the global market with petrochemicals, the value-added of its output in
the nation’s GDP has gradually declined since 2015, due to the drop in global prices of oil products. However, it is expected that QAPCO can take advantage of the conditions inherent in the recovery of the global economy and resultant demand for petrochemicals, and therefore it is expected to achieve positive growth during the forecast period.
As for oil and condensate refining, the average annual growth is expected to reach 1.3% during the period 2018-2020 as a result of the anticipated completion of production capacity as well as the expansion of the production of oil derivatives from the new production lines at the Ras Laffan Refinery 2, which had already increased the value-added of oil refining at the end of 2017 by about 36%. It is worth noting that oil- and condensate-refining activities grew by 7.8% during the first half of 2018.
Box 1-4: Manufacturing activities’ development
1. The petrochemical industry in Qatar is managed by Qatar Petrochemical Company (QAPCO), which is a leading world-class company. It consists of five plants with an ethylene production capacity of 840 kilotons per annum (ktpa), a sulfur production capacity of 70 ktpa, and low-density ethylene (LDPE) with a production capacity of 780 ktpa. The State of Qatar owns 80% of the capital of the company while TOTAL Petrochemicals owns 20%. The petrochemical industry comprises 30.9% of total manufacturing industries, and alone accounts for 2.7% of GDP.
2. The oil refining industry is managed through Qatar Petroleum Refinery in Mesaieed Industrial City with a capacity of 137,000 barrels per day for crude oil processing and 57,000 barrels per day to process condensate feedstock into finished products to meet local demand for excellent and regular gasoline, naphtha, jet and ship fuels, diesel, kerosene, and sulfur. Qatar Petroleum’s share reached about 42,000 barrels during 2014-2017, about 80% of which was consumed in the domestic market while the rest was exported.
3. The natural gas condensates refining industry is managed through the Laffan Refinery (1) in Ras Laffan Industrial City with a processing capacity of 146,000 barrels per stream day through treating field condensates into high-quality products such as naphtha, jet fuel, gasoil and mixed LPG. Laffan Refinery (2) was added in 2016-2017 with a production capacity of 146,000 barrels per day for the production of low-sulfur Euro-V specifications products such as naphtha, Jet-A1, ultra-low sulfur diesel (ULSD), propane, and butane, for both local and international markets. The oil refining industry accounts for 22.6% of the total manufacturing industries and represents 2% of GDP.
4. The fertilizer industry is managed by Qatar Chemical Fertilizer Company (QAFCO), which accounts for 15% of the global supply and has an annual production capacity of 3.8 million MT of ammonia and 5.6 million MT of urea, accounting for 3.8% of the total manufacturing industries and 0.3% of GDP. QAFCO currently seeks to maximize its production of granular urea as opposed to urea prills to meet the growing global demand for this product.
5. Regarding the activities of the food and non-food industries (excluding petroleum-based sectors), which account for about 3.8% of the GDP and about 42.8% of the total manufacturing, the projections suggest an increase in their activities during the forecast period with an average annual growth rate of 4.8%, if government and private sector efforts prove successful to achieve self-sufficiency in food and non-food light industries.
Manufacturing activities and growth projections 2018-2020 (%)
The totals of 2017 as (%) of the total
Average growth forecast
GDPManufacturing
10.1100 2.6 Total
2.0 22.6 1.34 Oil refining
2.7 30.9 0.17 Petrochemicals
0.3 3.8 2.60 Fertilizers
3.8 42.8 5.6 Others
Source: Planning and Statistics Authority
8
Qatar Economic Outlook 2018-2020
Concerning the petrochemical industry, it has already reached its peak production. Therefore, output is expected to settle down during 2018-2020, as is the case with the ammonia and urea fertilizer industry, which is currently at full capacity. However, it is expected to edge up in 2018 to reach 5.9% as was the case in 2017, a result of the company’s efforts to produce granular urea as opposed to urea prills. However, the pace of growth will taper in the next two years 2019 and 2020 until the new production line for Sulphur Coated Urea is added.
The contribution of utilities (electricity, gas, water, steam, air conditioning, sewage, waste management, and treatment) in GDP reached about QRs 3.74 billion or 0.46% of GDP in 2017. Utilities are expected to grow at a pace commensurate with population growth during the period 2018-2020. It is worth mentioning that Qatar General Electricity and Water Corporation (GEWC) is one of the most significant power generation and desalination companies in the Middle East with a capacity of 11,087 megawatts of electricity and 536 million gallons of desalinated water per day. Currently, power plants are being constructed to generate electricity from solar energy with an initial output of about 200 megawatts. Efforts taken over previous years to rationalize and increase the efficient use of water and electricity was succeeded to reduce per capita consumption and the GEWC will strive further to reduce the per-capita consumption of electricity and water by 8% and 15% respectively, as well as reducing the water system leakage to be 4% by the year 2022.
As for the contribution of the hydrocarbon sector to the growth of GDP during the 2018-2020 period, it is expected that this sector will witness relative stability after four years of significant decline. This can be attributed to improved oil prices in the international market compared to previous years, to the expected gradual increase in crude oil production with the approval of OPEC to lift the production ceiling through the second half of 2018, and to the anticipation that the Barzan gas field will come on-stream into the domestic market by the end of 2019, after suffering some technical delays.
Qatar’s average production of crude oil during the period 2014-2016 was around 655 thousand barrel per day. Given Qatar’s commitment to the OPEC decision of February 2016, production was reduced by about 30 thousand barrel per day effective January 2017. Thus, the total crude oil production at the end of 2017 reached about 604 thousand barrel per day. With OPEC’s decision to raise the output ceiling for member states by the end of June 2018 and the withdrawal of Qatar from OPEC in January 2019, Qatar could gradually increase production
to 2016 levels, i.e., about 655,000 barrel per day, over the forecast period 2018-2020.
Concerning liquefied natural gas (LNG) production, on 4 July 2017, Qatar Petroleum announced that it had lifted its 2005 moratorium (a self-imposed ban) on the development of new LNG production lines in the North Field - the world’s largest non-associated gas reservoir - for technical and logistical reasons. As a result, the company will be able to increase production capacity from the current 77 million tons to 100 million tons by 2024, and there is a plan to extend production to reach 110 million tons which will enable the country to maintain a large part of its share in the global gas market (in 2017, approximately 295 million tons). In its January 2018 issue, Bloomberg New Energy Finance (BNEF) stated that Qatar has contributed about 26% to the global LNG market in 2017 compared to 32% in 2014. This relative drop is attributed to the fact that some gas producers, including African countries, the United States of America, and Australia, have entered the global LNG market (see section on energy and commodity markets).
It is noteworthy that global demand for liquefied natural gas is estimated to rise by 2030 to between 448 and 553 million tons, while global production is expected to lie between 372 and 734 million tons. Qatar’s contribution to the worldwide gas market is expected to decline, yet it will continue to be one of the major producers. To make use of the increasing global demand for gas, the State of Qatar decided to edge up its gas production capacity. At the beginning of May 2018, Qatar Petroleum (QP) commissioned Qatargas to work with McDermott, the American company McDermott, to prepare detailed design for the installation of natural gas production platforms. In addition to working with Chiyoda to prepare the engineering designs for the land installations of the expansion project, where tender is planned to be announced to the companies executing the project through a global tender by early 2019. Drilling and construction is slated to start by the end of 2019 and will continue until the end of 2023, with the anticipation that production will commence by end-2023 or early 2024.
In conclusion, while the real growth rate of the hydrocarbon sector depends on the increase of oil and gas production, the growth of activities in non-hydrocarbon sectors will depend on domestic demand and export capacities, but more importantly, the pace of government spending, which in turn is affected by the level of revenues from sales of petroleum derivatives. Expectations for an average growth rate of 5.2% will be heavily subject to developments in oil and gas prices, which will assuredly both increase and decrease during the forecast period.

9
Part 1 - Economic Outlook 2018-2020
Forecast of the performance of nominal GDP
The preliminary estimates of the performance of (nominal ) GDP at current prices indicate that its rate of change will decline from 13.8% in 2018 to 3.9% in 2020 (Figure 1-3). This is due to the expected change in trends and rate of change of the mining and quarrying industries (i.e., the hydrocarbons sector) as the primary driver of nominal GDP, which contributes positively by 7.56 percentage points in overall growth in 2018 while turning negative (by 0.54 percentage points) in 2020.
The change in the performance and growth of the hydrocarbon sector can be attributed to the expectation that oil and gas prices will remain stable at the level of 2018 and may relatively decline in 2019-2020. Volatility in oil and gas prices is the norm: it is worth noting, for example, that the increase in average oil prices in the world market from $53 per barrel in 2017 to $69.8 in 2018, and an average price of gas in Japanese markets from $8 to $8.8 per thermal unit, has contributed to the increase in the rate of change nominal GDP from 10% in 2017 to 13.8% in 2018.
The rate of change of nominal GDP is directly correlated to the development of the Qatar GDP deflator, which is subject to movements of hydrocarbon product prices. As shown in Figure 1-4, when the price of petroleum products changed, the level of GDP deflator altered, which in turn changes the rate of change of nominal GDP compared with the growth rate of real GDP (and vice versa). For example, when average oil prices rose by about 23% in 2017 compared to the previous year, the nominal GDP change by about 10%, and GDP deflator grew by about 20%, while the real GDP grew by only 1.6%. This real GDP growth of 1.6% mainly derived from the output of the non-hydrocarbon sector rather than from production by the hydrocarbon sector because,
in fact, the production of hydrocarbon sector declined by 0.7% in 2017. In other words, the rise in crude oil prices usually results in an increase in the income of the hydrocarbon sector in nominal terms rather than real terms. Therefore, it contributes indirectly to real GDP growth via oil revenues generated and then transferred to the State of Qatar, where thereafter most of it is invested in public services and projects that help non-hydrocarbon activities to grow.
Accordingly, the anticipated rise of about 32% in the average price of crude oil and gas in 2018 will increase the growth rate of nominal GDP by 13.8%, which in turn will increase the non-hydrocarbon GDP deflator by about 24%. This will result in the real GDP to grow by 2.6% in 2018, reflecting the value-added growth of non-hydrocarbons by about 5.2%, while the value added from hydrocarbons is expected to remain at best stable, and possibly decline.
Although the rate of change of nominal GDP at current prices is correlated with the level of oil prices in the global market, which if abruptly changing can alter the trends and trajectories for forecasts of Qatar’s macroeconomic performance indicators, particularly on the side of hydrocarbon GDP. However, as Figure 1-3 shows, the contribution of the non-hydrocarbon economic sectors will remain mostly unchanged. Even though it is expected that oil prices and nominal GDP are going to change during the years 2018-2020, the contribution of the construction sector to nominal GDP growth remained unchanged at 2.07 percentage points in 2018 and 2.04 percentage points in 2020. Likely, the contribution of the services sector is expected to be 2.07 percentage points in 2018 and slightly decrease to 1.99 percentage points in 2020.
Based on the above analysis, most of the risks to the forecasts of macroeconomic indicators performance
Figure 1-3: Sectoral contributions to nominal and real GDP growth (Percentage points)
2018 2019 2020
-
2.0
4.0
6.0
8.0
10.0
12.0
14.0
16.0
2.6
(2.0)
2.9
6.5
3.1 3.9
0.91.8
2.1
2.6
7.6
1.7
0.9
1.8
2.0
2.3 1.01.8
2.0
2.20.5-
0.42.0
13.8
Total GDP
ManufacturingMining & Quarrying Services GDP
Construction
Real Nominal Real Nominal Real Nominal
* Note: Rounding errors are attributed to agriculture, imputed bank services (FISIM), import duties and electricity and water, which are not shown in the figure. Source: PSA estimates
Figure 1-4: Trends and forecast in the Crude Oil Price and GDP deflator
2012 2013 2014 2015 2016 2017 2018 2019 2020 2021 2022 2023
Qatar real oil price Qatar Oil priceGDP Deflator
40
50
60
70
80
90
100
110
120
US$
/bar
rel a
nd G
DP
Defl
ator
Source: PSA and Thomson Reuters Eikon, GDP deflator (2013=100)

10
Qatar Economic Outlook 2018-2020
are due to international oil price volatility, which is an uncontrollable external force. Higher prices than expected in this report will stimulate nominal GDP growth, and thus both the fiscal and current account balances will achieve surpluses. If oil prices remain low or fall below the current level for a long time, the deficit in the fiscal and external accounts will be more visible, requiring additional efforts to provide funding. Delays or cost overruns (or both) in the implementation of mega infrastructure projects, or the slow pace of tax reforms and the application of taxes, represent real risks to the overall economic forecasts presented in this report outlook (refer to Box 1-12 at the end of Part-I).
Inflation Forecasts The source of inflation in Qatar is either demand-pull inflation or imported inflation, and the annual inflation rate is measured by the annual rate of change of the consumer price index (CPI). Demand-pull inflation occurs when aggregate demand is higher than the availability of goods and services, and perhaps especially in Qatar, where the level of income is high and thus leads to a tendency towards increased consumption, which in turn leads to inflationary pressures. Concomitantly, imported inflation occurs in Qatar through two processes, the foremost being due to the dependence of Qatar on importing both its food and non-food commodities from international markets for a large percentage of its total consumption, therefore, any change in the level of world prices will have a positive or negative impact on the cost of imported goods. The second is due to the Qatari Riyal’s peg to a fixed exchange rate with the US dollar at QR3.64 per dollar. Therefore, any change in the US dollar exchange rate against the currencies of Qatar’s trading partners will have a positive or negative effect on the prices of imported and exported goods.
Based on the above, and since the average inflation for the period January-October 2018 was 0.44%, ranged between a maximum of 1.01% and a minimum (negative) 0.25%, this QEO predicts that Qatar’s average annual inflation rate by the end of 2018 to be around less than 1%. It also predicts the average yearly rate of inflation for the rest of the forecast period 2019-2020 to be ranged between a minimum of 1.6% to reflect the average domestic inflation in Qatar over the past three years, and a maximum of 3.7% to reflect the average global increase in inflation over the previous three years, according to IMF recent estimates of October 2018, or with an average inflation rate of 2.5% to reflect the average inflation rate of emerging countries and Eurozone countries as the main trade partners of Qatar.
However, excluding price inflation of housing and utilities for the period January-October 2018, the average inflation reached 1.66% bounded between a maximum of 2.9% and a minimum of 0.53%. Therefore, the impact of imported inflation on the price of imported food and non-food commodities is being experienced (see Inflation section on the second part). It should also be noted that another factor affecting the inflation rate is domestic fuel prices, which rose during the same period by about 23% for premium gasoline, 21% for super-grade gasoline, and 28% for diesel, which inevitably must effect retail and transport prices.
In terms of the impact of the Qatari Riyal being pegged to the US dollar, which has recently fluctuated up and down against a six-currency basket, this can positively or negatively affect the price of imported goods, but of course it depends on the volume of goods imported from Qatar’s trading partners whose currencies have been affected by variable exchange rates against the US dollar. The preliminary estimates of the real effective exchange rate as indicated in Box 1-5 suggests that the effect of exchange rate mechanisms on the inflation rate in 2018 is very limited because it has depreciated and subsequently appreciated, cancelling out having a net effect on inflation.
As for the years 2019 and 2020, inflation rates are likely to change depending on the extent to which the new tax laws are applied and enforced during the forecast period, namely selective taxes (excise), value-added tax, and income tax. Qatar has joined the GCC agreement on the application of value-added tax at a basic rate of 5% as of January 2018, but this has now been indefinitely postponed. Moreover, electricity and water rates are likely to increase as a result of additional cuts in government subsidies (see Section on 2017 Inflation in Part II of this report).
In spite of the impact of high education costs on the annual inflation rate in 2015 and 2016, the effects of these steep costs on the inflation rate relatively declined in 2017 and during the first half of 2018. However, forecasts indicate that the impact of rising education costs may show greater effect on inflation with the beginning of the new school year in the second half of 2018, especially in light of a news report from Ministry of Education in February 2018 indicating that 27 out of 115 private kindergartens and schools were approved to increase their fees for the academic year 2018-2019. A total of 144 private schools and kindergartens, out of 278 schools and kindergartens in Qatar, had applied for increasing fees for the next academic year; 29 schools and kindergartens were excluded for not fulfilling the requirements for granting a raise of their fees. The latest

11
Part 1 - Economic Outlook 2018-2020
CPI data of September and October of 2018 indicates that the rate of CPI change for education has increased by an average of 5.9%.
On the other hand, it is expected that a set of factors, if attained, could slow down domestic inflation in the coming years and maintain it at very low levels less than 1% - as occurred in 2017 when it was even lower, limited to just 0.46 %. The most important among these factors are: (1) continuing the provision of logistics support for food commodities to help Qatari residents cope with the consequences of the blockade; and (2), continuation of the trend of declining rents and housing prices (including for commercial properties) due to the market force of high supply and low demand, in particular the decline in demand for residential villas in favor of
apartments resulting from the reduction of housing allowance provided by employers to employees.
Of course, a risk of inflationary increases exists in Qatar as in every country in the world, but in Qatar it will largely depend on whether the government succeeds beyond current expectations in eliminating subsidies for public services, raises service charges, and imposes new taxes for revenue generation - or if the cost of imports increases precipitously due to the ongoing blockade. A shock in the global supply of goods, a sudden drop in the dollar exchange rate, or an unexpected rise in global demand will increase pressures on domestic prices. The possibility of eliminating government subsidies for other consumable goods as part of the government’s effort to cut spending is also likely to raise the consumer price index.
Box 1-5: Real Effective Exchange Rate (REER) of Qatari Riyal in relation to Dollar Index
The Nominal Effective Exchange Rate (NEER) is an accurate measure of the value of the Qatari riyal against the currencies of the major trading partners of Qatar. It reflects changes in bilateral exchange rates weighted by the relevant volumes of trade flows. The Real Effective Exchange Rate (REER) is adjusted to the inflation differential (measured by CPI) between Qatar and its trading partners. This measure reflects how Qatar’s currency movement, either negatively or positively, affects Qatar’s competitiveness in international trade compared with its major trading partners.
Because the Qatari Riyal is pegged to the US dollar, the REER of the Riyal (QR Index) has accompanied the depreciation and appreicaiton of the dollar index since the beginning
of 2017 until September 2018, which will thereby increase the competitiveness of Qatari exports of oil and non-oil commodities when it is depreciated and increase the purchasing power of Qatari Riyal when it is appreciated against the currencies of trade partners. However, given Qatar’s market dependence on China, Japan, and Europe imports for many of its needs, whose national currencies for the central part have also fluctuated against the dollar, this is likely to constitute an inflationary or deflationary pressure factors on both food and non-food prices depending on the volume of goods imported from Qatar’s trading partners whose currencies have been affected by variable exchange rates against the US dollar, but this also depends on elasticities of demand and competation.
Figure for Box 1-5: Index of Real effective exchange rateof QR vs US Dollar Index
REER QR Index US Dollar Index
86
88
90
92
94
96
98
100
102
104
106
92
94
96
98
100
102
104
106
REER
(201
0=10
0)
US
Dol
lar I
ndex
Jan
15
Mar
15
May
15
Jul 1
5
Sep
15
Nov
15
Jan
16
Mar
16
May
16
Jul 1
6
Sep
16
Nov
16
Jan
17
Mar
17
May
17
Jul 1
7
Sep
17
Nov
17
Jan
18
Mar
18
May
18
Jul 1
8
Sep
18
“Source: CPI and Exchnage Rate data obtained from from Thomson Reuters database while USD index data from www.macrotrends.net and the preparation and analysis by PSA staff“

12
Qatar Economic Outlook 2018-2020
Forecasts of fiscal balance of the state budget
The preliminary forecasts of the Ministry of Finance during the preparation of 2018 state budget, it indicated that fiscal balance will register a deficit of QR28.2 billion, equivalent to 4.1% of GDP, based on the assumption that the price of crude oil remains at US$45 per barrel would generate a total revenue of QR175 billion (US$48 billion). Besides, total expenditure was estimated to be QR203.2 billion, of which QR105.7 billion (US$29 billion) as current expenditures and about US$97.5 billion (US$26.8 billion) as capital investment expenditures. However, due to higher oil and gas prices than expected when the budget was prepared, which have risen by about 39-40% during January-October of 2018, respectively, the budget for 2018 is expected to generate a surplus of SR23 billion instead of a deficit, equivalent to 3.3% of GDP. It is worth to note that Asian market represents 68% of Qatar’s oil and gas exports which has experienced an increase in gas prices reaching 40%.
Although oil revenues might significantly increase during 2018, the non-oil revenues is expected to grow slowly owing to the State’s inability to impose taxes during this year, coupled with the possibility of a decrease in Qatar Petroleum’s dividend income because of deducting a part of its profits for the expansion of gas fields as well as the modernization and maintenance of crude oil fields. As for current expenditures, it is assumed that there will be no significant increase, but there may be a slight increase in capital investment expenditures in 2018.
For the years 2019 and 2020, the preliminary projections of MOF indicate that the budget balance will achieve surpluses at around 5.1% and 5.9% of GDP respectively, under the assumption that oil prices will remain at their high levels. More non-oil revenues will be generated due to the expectation of enacting and implementing an excise tax on harmful goods, together with the Value Added Tax. Furthermore, capital investment expenditures will fall - according to Ministry of Finance expectations - by about 25% and 11.5%, respectively. This decline can be attributed to the completion of the first stages of several infrastructure projects including Hamad Port and Hamad International Airport, and the successful conclusion of a large part of road and bridge infrastructure projects, which account for 45.1% of total investment expenditures, followed by spending on education, health and sport at 48.4%, and subsequently by spending on electricity and water services at 6.5%.
The forecasts of public finance are based on the assumptions that the government will cut current spending to around 15% of GDP, down from 18.5% of
GDP in 2017, as well as cutting investment expenditures because of progress in completing the World Cup projects. Accordingly, a decline in the proportion of investment expenditures is expected, from 14.1% of GDP in 2018 to 11.4% in 2020.
Regarding revenues, and as a result of the merger of some gas and petrochemical companies with the intent of cutting operational costs (see Box 1-6), Qatar Petroleum (QP)’s profits from its investments are foreseen to increase. The net profit of QP is classified in the budget as a particular item related to dividend income of investments, whether domestic or foreign, in the oil and gas sector, rather than Oil and Gas Revenues, according to the Government Finance Statistics (GFS) classification 1112 and 1415. Investment dividend income of QP in 2017 accounted for about 30.5% of total revenues compared to oil revenues at 27.6% and gas revenues at 24.6%.
It is worth noting that QP relies on its internal revenues along with loans from its partners abroad or from financial institutions to finance its investment projects, that is, in building facilities for oil and gas upstream and downstream operations and fertilizer production.
It is expected that additional revenues (other than oil and gas revenues) are likely to be added to the budget through the imposition of new taxes and fees, as well as the reduction of subsidies on electricity and water services provided that social and political factors are appropriately addressed.
Forecasts of the current account of the balance of payments
Due to the increase in oil prices in the international market by about US$10 in 2017 to reach $53 per barrel compared to US$43 per barrel in 2016, the deficit of the balance of payment (BOP)’s current account as a share of GDP has shifted from minus 5.5% in 2016 to a positive surplus of about 3.8% in 2017. Inasmuch as the average price of oil in the global market during the period 2018-2020 is expected to reach about $68.5 per barrel with the additional anticipation of increasing production quantities of crude oil following the lifting of the production ceiling by OPEC, the current account is foreseen to register an annual average surplus during the forecast period of around 9% of GDP, assuming that the demand for imports is going to stabilize at 35.8% of GDP during the forecast period compared to 37.3% in 2017. The decline in imports is attributed to lower needs for capital equipment and building materials for existing investment projects, together with lower imports of foodstuffs due to the expansion of domestic production. On the other hand, forecasts indicate an impact of the increase of imports on GDP after 2020 to meet the necessary requirements for the preparation of the World Cup.

13
Part 1 - Economic Outlook 2018-2020
Risks to oil & gas prices and markets
Putting aside any immediate negative repercussions that will result from the continuation and escalation of the blockade, most of the risks to the outlook of overall macroeconomic indicators emanate from fluctuations in international oil and gas prices as they are subject to global political, economic, and security variables. Although we have ruled out a decline in oil and gas prices for the foreseeable future, nonetheless it is possible to predict their decline as highly probable, since the primary driver of current price increases at present is the drop in the global oil supply for both technical2 and political reasons, as well as an increase in overall demand supported by the worldwide economic recovery (refer to Box 1-10 at the end of Part I)
On the other hand, increases in oil and gas prices at a higher rate than expected in this report means that the rate of change of nominal GDP will be greater than the current forecast, and thus both the balances of fiscal and current accounts will achieve better results. On the contrary, if prices fall short of projections over a protracted period, the rate of change of nominal GDP will decline, and the deficit in both the fiscal and external balances shall move upward. Therefore, a useful metric for gauging how oil prices have an impact on important outcomes of economic activity is the “breakeven” price of oil (refer to Box 1-7).
Against this background, and regardless of optimistic expectations, it is necessary to retain vigilance against responding to the desire to increase current spending.
Box 1-6: Merger and restructuring of revenue and productive institutions
The merger of some of government and semi-government institutions and companies aims to rationalize spending and increase efficiency and effectiveness of the use of financial resources and human cadres. In January 2016, Sheikh Tamim bin Hamad al-Thani, Emir of Qatar, issued a decree that merges eight ministries into four ministries. The process of integration continued in the oil and gas sector and in banks with a view to cut administrative costs, focus on core business fields, and achieve better gains by the merged entities. Direct effects included reduced recruitment and expenditure levels, cancellation of useless and flawed projects, and provision of comprehensive reviews of corporate strategies. Medium- and long-term efforts will be applied to make use of the competitive advantages of existing institutions. The most important institutions that are already merged or under study to be merged are as follows:
• InJanuary2018,QPannouncedthecompletionofthe merger of Qatargas and RasGas into a new entity named Qatargas with a production capacity of 77 million tonnes per year through 14 trains at Ras Laffan Industrial City and having a chartered fleet of 70 LNG carriers.
• AttheendofJune2017,QatarVinylCompany(QVC)was merged into Qatar Petrochemical Company (QAPCO), which already operates Qatofin Company.
• AsofthebeginningofJuly2018andafterthewithdrawal of Masraf Al Rayan, talks are still underway on the merger of Barwa Bank with Qatar International Bank.
• QatarInvestmentAuthority(QIA)isthesovereignwealth fund of the State of Qatar. It invests surpluses of oil and gas sales revenues in external and local markets both to diversify revenue sources and geographically distribute these sources around the globe to serve the interests of Qatar economically and politically. In July 2018, the total assets of QIA were estimated by the Sovereign Wealth Fund Institute (SWFI) to be around $320 billion. Like other sovereign
wealth funds and international pension funds, QIA seeks to be the partner of choice for local and international investors and financiers. Many countries have benefited from QIA investments in real estate, production, and services sectors, which has raised the status of Qatar at the international level. QIA owns assets in a number of large companies such as: Qatar Airways, Katara, Qatar Stock Exchange, and up to 20% of the total assets of domestic banks. It also manages the investments of the Qatar Foundation, which owns 49% of Vodafone shares stake, and both own 45% of Vodafone’s assets. At the external level, QIA hold assets in: Volkswagen, Barclays, Canary Wharf, Harrods, Credit Suisse, Heathrow Airport, Glencore, Tiffany & Co., and Total Company. Through its real estate arm (Qatari Diar and Barwa Bank), QIA has indirect investments in real estate in Europe, North Africa, Asia and recently the United States of America, with QIA investments made in over 30 countries.
Figure for Box 1-6: Projected dividend income stream for the stocks of QIA (QR million)
Qatar National Bank;2955.39; 58%
Other banks; 1089.33; 22%
Non Banks; 382.45; 8%
Ooredoo; 631.80;12%
Source: Thomson Reuters EIKON, accessed on November 2018. Note: Dividend Income is calculated based on equity stakes in 18 publicly traded firms
2 The chronic mismanagement and underinvestment in many oil fields across countries, in particular, Venezuela, Iran, Iraq, Libya, and Sudan, which resulted in shortages of essential equipment and supplies for maintaining and increasing production

14
Qatar Economic Outlook 2018-2020
Box 1-7: Breakeven price of crude oil
This breakeven of oil price can be viewed from two perspectives: budget balance and current account balance. From the perspective of the general budget, - and for given levels of hydrocarbon output, government spending, and non-hydrocarbon fiscal revenue - it is the price that generates hydrocarbon revenues that match deficits in the non-hydrocarbon sectors. From the perspective of the balance of payments, it is the price needed to cover import costs and the deficit on the income and transfer flows of the current account, given non-oil and gas export revenues.
The figure embedded in this box shows the estimated oil breakeven price for the public budget and for the current account for 2018, 2019, and 2020, where the baseline oil price underlying this QEO’s forecasts. It takes into account a wide range of channels through which oil prices affect financial revenues, including the impact of oil prices on investment income and hydrocarbon companies’ income tax. Alongside these factors, it also considers lags in the transfer of those revenues to the government budget. As these delays can be long, the fiscal balance depends not only on the current oil price but also, to an extent, on the price during the previous calendar year. The calculation of the current account breakeven price depends on factors driving import demand and prices, remittances and transfers, and non-oil and gas exports.
For the three years of the Qatar Economic Outlook (QEO), the breakeven price in 2018 from a budgetary perspective is slightly higher than the baseline price assumptions in the same year, explaining the small deficits. But the difference between them widens because of a decline in the breakeven price, while the baseline price expectation remains constant, indicating a surplus during the period 2019 and 2020. As for the current account, the breakeven price is below the baseline prices by a large margin, which explains the large surplus anticipated during the forecast period.
Figure for Box 1-7: Breakeven price of oil under different scenarios (US$ per barrel)
54.7
44.6
30.0 31.9
69.8 68.4 67.4
2018 2019 2020
US
$/ba
rrel
Fiscal breakeven oil price Current account break-even oil priceQEO baseline forecasts
15
25
35
45
55
65
75
85
49.3
28.2
Source: PSA estimate using PSA’ economic model
Instead, it would be useful to increase investment spending to create new economic dividends, or to use oil surpluses to repay domestic sovereign debt as well as to look for opportunities to repay external debt ahead of schedule. In both cases, there should be no complacency in continuing the pace of tax reforms so as to generate public revenues, and to work towards implementing infrastructure projects more effectively and efficiently to ensure the success of hosting the 2022 World Cup. Among the IMF’s guidelines in the most current World Economic Outlook issued in April and October 2018 was an advisory for countries worldwide in general, and commodities-exporting countries in particular, which of course also applies to the State of Qatar, that “many countries need to rebuild fiscal buffers to create policy space for the next downturn and strengthen financial resilience to an environment of possibly higher market volatility”.
Monetary liquidity and risks
The Central Bank of Qatar (QCB) managed the shortage of monetary liquidity that has experienced by the Qatari commercial banks in 2015 by using interest rate policy
mainly to match the US monetary policy as the Qatari riyal is pegged to the US dollar. Therefore, as the US Federal Reserve began to move to traditional monetary policy instead of non-traditional monetary policy since November 2015, the federal interest rate has been raised by 0.25 percentage point from 0.25% in November 2015 to 0.5% in December 2015 and then to 0.75 in December 2016. During 2017 they were increased three times by 0.25 percentage points to 1.5% December 2017, and during January-September 2018, it was raised three times by 0.25 percentage points to reach 2.25% in September 2018 and is expected to rise to 2.5% in December 2018. There are other expectations that it will continue to grow to 3% in 2019 and to 3.5% in 2020.
In response the QCB has raised its overnight deposit rate by 0.25 percentage points for six-time during the same period (November 2015-September 2018) from 0.75% in November 2015 to 2.25% in September 2018. Therefore, similar to the US federal policy rate, the QCB overnight rate hike is expected to rise to 2.5% by the end of 2018, then to 3% in 2019 and to 3.5% in 2020.

15
Part 1 - Economic Outlook 2018-2020
Box 1-8: Full application of Basel III and preparation for Basel IV standards:
Basel III aims to increase the retention of banks’ resources (capital and retained earnings) to meet future shocks to about 4.5% of risk-weighted assets while introducing a new Capital Conservation Buffer equivalent to 2.5% of common equity, bringing the total common equity requirements to 7%. It is used as a measurement of the ability of banks alone to withstand shocks caused by economic and financial periods of stress without recourse to government intervention. In case of non-compliance with this 7% rate, monetary authorities were given the power to impose restrictions on banks in the distribution of profits and financial rewards. Banks should also keep between 0 and 2.5 percent of their core capital as reserves - as per their sole discretion- in order to overcome shocks arising from economic cycles.
The Basel III standards face a range of criticisms, notably: banks’ exposure to losses as a result of profit cuts, pressure on small banks, and increased borrowing costs. It should be noted that a transition period for 2013-2018 has been provided to banks worldwide to prepare for Basel requirements, which are to become fully active in January 2019. Qatar Central Bank (QCB), in cooperation with local banks, has embarked on the process of gradual implementation since 2012, so that by January 2018 all local banks have applied the standards in their entirety. Part of
Basel III, the QCB implemented the two liquidity standards; the Liquidity Coverage Ratio (LCR) to enhance local banks’ short-term resilience and the Net Stable Funding Ratio (NSFR) to promote local banks’ resilience over a longer time horizon. The QCB has also implemented the IFRS 9 (International Financial Reporting Standard) which mandates local banks to set aside a certain proportion of profit against losses for unseen reasons.
With the issuance of a new reform proposal in December 2017 to be named Basel IV, which aims both to increase capital in banks and to conduct periodic assessments of collaterals received from customers for loans in order to calculate potential risks systematically, it appears from the banking sector’s experience in implementing Basel III that it will be able to apply Basel IV standards once these are approved, and in the event that QCB makes a commitment to the Bank for International Settlements to enforce them.
Despite warnings against the implications of the application of such standards on curbing credit and profit, there is almost unanimous agreement that Basel III and Basel IV will enhance capital standards, contribute to long-term financial stability and growth, and decrease borrowing costs, especially compared against the values of the shocks the economy may face in cases of financial and economic crises.
As part of the Government’s efforts to take measures to overcome blockade repercussions (as previously mentioned in Box 1-1) and to strengthen the resilience of local banks to cope with the risks of financial crises, Qatar Central Bank - as of January 2018 - has initiated implementation of Basel III standards (see Box 1-8) to protect local banks from the dangers of banking collapses, such as occurred during the financial crisis in Southeast Asia in 1997 and the global financial crisis in 2008. Despite the short- and medium-term negative impact of the application of these standards on the domestic financial market regarding a lack of liquidity available for credit, i.e., increased borrowing costs and declining bank profitability, they will nevertheless ultimately enhance the resilience of banks to meet economic challenges when facing inevitable repeats of external crises.
Based on the results of the Risk Perception Survey conducted by local banks to express their assessments and expectations of domestic and international risks during 2018 and 2019 (as published in the Qatar Central Bank’s Financial Stability Report No. 9), it is found that
the confidence in the financial stability of the banking sector at the local level remains high. As for the outlook for credit risk, it remained stable in 2017, but there are expectations that it will increase in 2018 but again lower in 2019. As for systemic risks related to risks affecting the economy as a whole, such as changes in interest or exchange rate, the results suggest a decline in 2018 and 2019. When asked about the sources of domestic risks to the banking sector, it was determined that high rates of inflation, local stock market volatility, and an external balance decrease do not represent a significant threat compared to fluctuations in real estate market prices, low economic growth, and an increased budget deficit. In terms of regional and international risks to the banking sector, the most prominent and most influential risks to the Qatari economy are: geopolitical instability, low oil prices, tightening of US interest rates, and liquidity, while the expectation of the impact of emerging market risks and Chinese debt was limited in the foreseeable future.

16
Qatar Economic Outlook 2018-2020
Regional and international consensus forecasts for the Qatari economyThe first section of this report has presented and rationalized the forecasts of the Planning and Statistics Authority (PSA) concerning the macroeconomic indicators for the period 2018-2020. It gave a summary review of the assumptions as well as the risks that may change the level of expectations. Moreover, in order to elicit the views and opinions of experts and those interested in regional and international developments and their impacts on Qatari economic performance levels in a way that enhances a mechanism for improving assumptions and thereby forecast accuracy, this section will review the expectations of international and regional research institutions and banks regarding their projections of the Qatari economy; while these can be used as a benchmark, they should not necessarily be adopted.
It is worth mentioning that several forecasters systematically cover performance predictions of all the various economic indicators of the State of Qatar in their entirety. Therefore, we herein will use the arithmetic average, median, and standard deviation of the available numbers to make a comparison for each year separately since the number of forecasters varies from one year to another (see Table 1-2). For example, the arithmetical average of nominal GDP forecasts for 2020 is made for only five forecasters, while it is for nine forecasters in 2018 and 2019.
Consensus forecasts of real GDP growth
The consensus estimates of real GDP growth during the forecast period 2018-2020 were relatively close and ranged between a maximum of 3.5% and a minimum of 1.7%, but they are less differentiated in 2018 and 2019 than in 2020. Figure 1-5 shows that most forecasters cut their forecasts of real GDP growth for 2018 to 2.6% from their 2017 average of 3.6%, but all stakeholders maintained their projections of growth at an average of 2.7% for 2019 and 2020, which reflects international analysts’ consensus on the ability of Qatar’s economy to achieve an average growth of 2.6% in 2018 and 2.7% in 2019 and 2020, with a standard deviation of 0.5, 0.6, and 0.7 percentage point and coefficient of variation of 19.7%, 22.9%, and 25.6%, respectively. The projections involve a more consistent view of the direct impact of long-term oil-price increases on the Qatari economy and its great benefits for the economy, in terms of achieving high financial returns reflected in improving the overall position of both the state budget and the balance of payments, thereby increasing the government’s ability to increase public expenditures, which in turn will improve the level of investment and public and private
consumption and thus achieve economic growth.
Concerning the variation between the forecasters of the economic growth rates in Qatar, Citigroup provided high growth forecasts for 2018 and 2019, reaching 3.5% and 3.7%, respectively. To the contrary, HSBC predicted a low growth rate for 2018 and 2019 at about 1.7% and 1.8%, respectively. As for the 2020 forecast, out of a total of 20 forecasters, only nine provided reasonable projections, including the International Monetary Fund (IMF), which predicts a growth rate of 2.7% for the year 2020, and the World Bank, predicting 2.8%.
Figure 1-5: Consensus and QEO estimates of Real GDP growth for Qatar (%)
0.0
0.5
1.0
1.5
2.0
2.5
3.0
3.5
4.0
June 2017 'Oct 2018 June 2017 'Oct 2018 Oct 2018
2018 2019 2020
Consensus QEO
3.6
2.6 2.7 2.7 2.7 2.6 2.6
3.7
2.9 3.1
Source: Estimates of the PSA based on data collected from various reports for 20 participants who provided forecasts for Qatar’s real GDP for 2018 and 2019 while 9 participants provided forecasts for 2020.
It is worth stating that several economic forecasters provided high projections for the real GDP growth in Qatar for 2018 by more than 3%, such as the National Bank of Dubai by 3%, National Bank of Kuwait by 3.5%, Citigroup by 3.5% and Oxford Economic by 3.1%. The high forecasts can be attributed to forecasters’ optimism that an increase in oil prices will result in increased government spending, that there will be sufficient availability of banking liquidity. They are also expressing optimism concerning the recovery of the global economy, albeit inflation may increase and monetary policy may return to normal through rising interest rates in the United States. The trade tariff skirmish between USA and China as well as the fluctuation of exchange rates of US dollar’s against a broad basket of currencies, could limit the overall demand in the US market. However, a moderate rate of inflation is foreseen at the global level in 2020.
Against this backdrop, the Qatar Economic Outlook shows more conservative growth than that shown in the average consensus forecast, but nonetheless it depicts a raise from 2.6% in 2018 to 3.1% in 2020 (see Figure 1-5). The assumptions upon which the Report’s expectations were based are detailed in the previous section, in Box 1-2 above.

17
Part 1 - Economic Outlook 2018-2020
Table 1-2: Qatar Economic Forecasts as Viewed by others
Qatar Economic Forecasts as Viewed by Research Institutions and Regional and International BanksEconomic Forecasters Real Growth Nominal Growth Inflation
2018 2019 2020 2018 2019 2020 2018 2019 2020
BNP Paribas (Mar-18) 2.1 2.3 2.7 .. .. .. 2.2 2.0 2.0 Business Monitor International (April-18) 2.7 3.1 .. .. .. .. .. .. ..Capital Economics (Mar-18) 2.0 2.5 .. .. .. .. 2.0 2.0 ..Credit Agricole (Jun-18) 2.9 2.5 .. .. .. .. 3.0 2.8 ..Citigroup (Jun-18) 3.5 3.7 .. 10.1 0.8 .. 0.1 2.5 2.5 Economist Intelligence Unit (Aug-18) 1.8 1.8 1.7 11.3 (1.4) .. 0.8 3.8 2.3 Emirates NBD (Mar-18) 3.0 3.6 .. .. .. .. 2.5 3.0 ..Fitch Ratings (Mar,2018) 2.3 2.5 1.8 13.0 1.7 (0.3) 1.5 2.5 2.5 HSBC (May,2018) 1.7 1.8 .. 6.4 3.8 .. 1.2 2.4 ..IHS Markit (May,2018) 2.6 3.6 .. 8.2 7.2 .. 2.0 2.9 2.4 Institute of International Finance (June,2018) 2.0 1.6 .. 15.1 (0.5) .. 3.2 3.0 ..IMF (Oct-18) 2.7 2.8 2.6 11.6 6.2 2.5 3.8 3.5 1.9 J.P. Morgan Securities plc (May-18) 2.3 3.0 .. .. .. .. 1.0 5.1 ..J.P. Morgan Securities plc (May-18)- Consensus 2.8 2.7 .. .. .. .. 1.0 5.1 ..National Bank of Kuwait (May-18) 3.5 2.0 .. .. .. .. 2.5 2.5 ..Oxford Economics (May,2018) 3.1 3.3 3.6 12.3 12.8 11.1 1.8 2.9 2.5 Standard and Poor's (May,2018) 2.8 2.5 3.0 8.5 5.6 6.1 .. .. ..Standard Chartered (Jun, 2018) 2.8 2.9 3.5 .. .. .. 0.8 1.2 1.5 World Bank (April 2018) 2.8 3.2 2.8 .. .. .. .. .. ..Qatar National Bank 2.6 3.2 .. 12.3 3.5 .. 0.5 1.9 ..
Participate in forecasting 20.0 20.0 8.0 10.0 10.0 4.0 17.0 17.0 8.0 Consensus (Mean) 2.6 2.7 2.7 10.9 4.0 4.8 1.8 2.9 2.2 Median 2.7 2.8 2.8 11.4 3.7 4.3 1.8 2.8 2.4 High 3.5 3.7 3.6 15.1 12.8 11.1 3.8 5.1 2.5 Low 1.7 1.6 1.7 6.4 (1.4) (0.3) 0.1 1.2 1.5 Standard Deviation 0.5 0.6 0.7 2.6 4.2 4.9 1.0 1.0 0.4 Coefficient of Variation (%) Ratio of SD to Mean 19.7 22.9 25.6 23.9 106.4 101.8 58.4 35.8 16.7
Source: data collected from various reports for 20 participants who provided forecasts for Qatar's real and nominal GDP and inflation. Note, it is not clear what the assumptions and methodologies used to derive GDP and inflation calculation, only IMF and EIU provide a brief description of their calcualtions; (blanks indicates no data available)
Consensus forecasts of nominal GDP growth
The number of forecasters for nominal GDP declined from 20 to 10 for 2018 and 2019; most of them estimated a double-digit growth rate for 2018, ranging from a maximum of 15.1% to a minimum of 6.4%, with an average growth rate of 10.9%, a median of 11.4%, and a standard deviation of 2.6 percentage point (Figure 1-6). The forecasts show a more significant variation in the years 2019 and 2020. Although the standard deviation is between 2.6 and 4.5 percentage points, nevertheless the coefficient of variation fluctuated significantly, reaching 106.4% in 2019, compared to 23.9% in 2018 before slightly declining to 101.8% in 2020. This is ascribed to a projected drop in oil prices in 2019 and 2020 compared to 2018. The Economist Intelligence Unit is at the forefront of forecasters that expect negative growth in nominal GDP by 1.4%, followed by the Institute of International Finance by negative 0.5%. Citigroup forecasts a decline in positive growth at 0.8%, but Oxford Economics expects a high growth of 12.8%.
Given the fact that oil prices are currently stable at
Figure 1-6: Consensus and QEO estimates of Nominal GDP growth for Qatar (%)
0.0
2.0
4.0
6.0
8.0
10.0
12.0
14.0
16.0
June 2017 'Oct 2018 June 2017 'Oct 2018 Oct 2018
Consensus QEO
2018 2019 2020
10.9
2.94.0
13.8
9.3
6.5
8.0
12.2
4.83.9
Source: Estimates of the PSA based on data collected from various reports for 20 participants, of which 10 provided forecasts for Qatar’s nominal GDP for 2018 and 2019 while 5 participants
around US$70 per barrel, their impact on nominal GDP growth is anticipated to be higher in 2019 and 2020. However, consensus forecasters have a full range of views on nominal growth for these two years, ranging

18
Qatar Economic Outlook 2018-2020
between negative 0.3% and positive 12.8%, respectively. The rates of change of nominal GDP are expected to be higher than the rate of real GDP growth due to expectations of having lower general inflation rates as expressed in the GDP deflator, mainly due to favorable oil price projections.
Based on the above, when comparing the consensus forecasts with QEO forecasts, one can say that the estimates included in this report for rate of change of nominal GDP at 13.8% in 2018 are optimistic when compared with the average consensus forecasts of 10.9%. However, in spite of the agreement between the QEO forecasts and the consensus forecasts on the decline of the rate of change of nominal GDP in 2019, still QEO forecasts are more optimistic by showing an increase of 6.5% compared to consensus’ 4%, and vice versa for 2020, where the QEO report expects a rise of 3.9% compared to an average of 4.8% for the consensus forecasts.
Consensus forecasts of inflation rate
Sources of consensus forecasts predict a gradual increase in the rate of change of the consumer price index (CPI) during the forecast period 2018-2020, from an average of 1.8% in 2018 to 2.9% in 2019, and then dropping again to 2.2% (Figure 1-7). It is worth noting that the average consensus forecasts issued for October 2018 were lower than the expected estimates reported in June 2017 for all years of the forecast period. However, the expected inflation according to those forecasters is still high; maybe they based their estimates on the possible impacts of the imported inflation from regional and global markets. They may also found it on the weakness of the nominal effective exchange rate (NEER) of the US dollar (to which the Qatari riyal is pegged), which may increase the prices of goods imported from countries in which the dollar fell against their currencies such as
Figure 1-7: Consensus and QEO estimates of Inflation growth (%)
Consensus QEO
1.8
3.32.9
2.2
1.0
3.8
2.5 2.6
0.0
0.5
1.0
1.5
2.0
2.5
3.0
3.5
4.0
June 2017 'Oct 2018 June 2017 'Oct 2018 'Oct 2018
2018 2019 2020
2.83.0
Source: Estimates of the PSA based on data collected from various reports for 20 participants, of which 17 provided forecasts for Qatar’s inflation for 2018 and 2019 while 8 participants provided forecasts for 2020.
Eurozone and China. As a side note, it is pertinent that the US dollar index declined from 102.1 points in January 2017 to 94.6 points in January 2018 before it reversed its decline to reach 101.17 points in September 2018, which had the immediate effect of causing the Qatari Riyal index (Real Effective Exchange Rate) to decline from 104.22 points in January 2017 to 96.9 points in March 2018 before it reversed its decline to reach 100.02 points in Aug 2018 (see Box 1-5 above). As discussed above the fluctuation of the real effective exchange rate will have either a negative or positive impact depending on from where commodities are imported. Also, some forecasters opined that the projected decline in domestic inflation, especially in 2018, will be due to a decrease in rentals. Therefore, such forecasters gave variable expectations for the inflation rate, ranging from a maximum of 3.8% and a minimum of 0.1%, with an average of 1.8% and a coefficient of variation at 58.4%.
On the other hand, the discrepancies among forecasters with regard to the estimation of the inflation rate for 2019 have edged down to 35.8% due to a reached consensus on the possibility of imposing duties and introducing new taxes such as the tax on harmful goods, VAT, and an income tax, and the reduction in subsidies for electricity and water services, which may cause the average inflation to tick up to 3%, ranging between a maximum of 5.1% and a minimum of 1.2%. As for 2020, the number of inflation forecasters declined from 17 to 8, an indicate an average inflation of 2.2% with a standard deviation of less than 0.4 percentage points, compared with one percentage point for 2018 and 2019.
World Economic OutlookIn the October 2018’s World Economic Outlook of the International Monetary Fund (WEO), under the theme “Challenges for Steady Growth,” the IMF reduced its global economic growth forecast for 2018 and 2019 by 0.2 percentage points to 3.7% compared to what it was in April 2018 at 3.9%. The IMF has also reduced the tone of the slogan of April 2018 from “Cyclical Upswing and Structural Change,” which can be reprised as global growth is developing more strongly based on booming growth in manufacturing, international trade and global investment, to “less balanced expansion and rising trade tensions” in July 2018 to reflect the expected effects of the US-led trade war, but it retained its global growth forecast at 3.9% for 2018 and 2019. Now, in October 2018, the trade war continues to escalate harshly, which will bring about more challenges for achieving steady economic growth in global trade, manufacturing and investment. Therefore, the IMF has not only modified the

19
Part 1 - Economic Outlook 2018-2020
outlook theme but has also reduced the global growth to 3.7% for this year and 2019.
Figure 1-8: Rate of Changes of Global Real GDP Growth Projections by IMF (%)
3.653.68 3.67
3.71 3.70 3.72
3.94 3.94
3.763.7
3.7 3.7
3.453.503.553.603.653.703.753.803.853.903.954.00
2018 2019 2020
April_2017 Oct_2017 April_2018 Oct_2018
Source: IMF, World Economic Outlook for April and October of Years 2017 and 2018 obtained from WEO database https://www.imf.org
At the level of the economic blocs affecting the global economy, the most recent IMF forecasts indicated that the economic growth rate in most developed countries, especially the Eurozone, Japan, Korea and Britain, will decline due to the consequences of the tariff war with the United States, the tightening of monetary policy, and the high prices of oil derivatives, as well as politically-related tensions.
Despite the trade tensions between China and the United States, their growth forecasts for 2018 have not changed, maintaining a projected growth rate of 6.6% and 2.9% respectively as shown in Table 1-3. However, due to the escalation of the reciprocal customs duties imposed between the two countries reaching in September of 2018 by about half of the total Chinese exports to the USA, the IMF lowered their growths for the years 2019 and 2020, reducing China’s growth from 6.4% to 6.2% in 2019, and from 6.3% to 6.2% in 2020. Similarly, the US growth was also reduced by a small percentage point from 2.7% to 2.5% in 2019 and from 1.9% 1.8% for 2020.
Table 1-3: IMF Forecast for China and USA
2018 2019 2020
April 2018 China 6.6 6.4 6.3
United States 2.9 2.7 1.9
Oct2018 China 6.6 6.2 6.2
United States 2.9 2.5 1.8
Source: IMF Database - October 2018
As for growth rates forecasts for the group of emerging and developing market economies, the expectations varied by their vulnerability to changing factors influencing global economic growth, most notably:
the changes in oil prices, the rise in US bond yields, the escalation of trade tensions along with the relative inability of these countries to control the consequences, financial stresses , and currency market pressures, any of which have the potential to limit the investments and business activities of a number of countries, affecting their growth by a minor rate. At the forefront of these countries are Argentina, Brazil, and Mexico from Latin America, Iran from Middle East, and Turkey from emerging Europe. As for commodity-exporting countries, including oil-exporting nations, forecasts indicate an improvement in their growth rates in the foreseeable future as a result of the increase in global demand for, and high prices of, raw materials, therefore, the growth rates of GCC countries was favorably increased for 2018 and 2019
Risks to global economy
The growth of business and investment activities constitutes one of the most critical factors that stimulated the global economic recovery that began in early 2017. These two elements contributed to the increase of productivity and growth of the economies of developed countries, which in turn led the process of growth in the emerging and developing markets economies, especially those exporting commodities. In the coming few years, as a result of escalating trade and economic tensions between the United States, China, and the European Union, it is expected that reciprocal actions between parties will affect the reallocation of resources away from investments, thereby reducing productivity and increasing mistrust, which will force a downward trajectory in the investment, consumption, and economic growth globally.
It is noteworthy that the United States has imposed customs duties on some goods imported from the European Union and China, most notably on aluminum, steel, agricultural commodities, electronics, cars, and spare parts, worth a total of around US$300 billion until the mid of September 2018. The Trump administration continued to threaten to imposing tariffs on all US$500 billion of imported goods from China that are roughly equal to the total value of America’s import bill from China in 2017. In contrast, due to China’s low import bill from the United States of about $130 billion, China is in a weak position, but it seems determined to use all available tools to face US protectionist policies, including moving to a war footing in currency markets.
In addition to commercial risks, the global economy faces another threat related to the tightening of monetary policy, which is still accommodative despite the return to standard fiscal policies while following more stringent procedures in financing processes. This

20
Qatar Economic Outlook 2018-2020
may reveal financial vulnerabilities and cause negative implications on the growth of developed economies in general and emerging market economies in particular. The economic outlook suggests that tighter monetary conditions in the United States could have spillovers to other economies, including via a reduction in capital flows to emerging markets. Very expansionary fiscal policy in the United States is projected to widen global imbalances, at a time when the current account deficit is already more massive than justified by fundamentals, combined with persistent excess current account surpluses in other countries. Besides, anxiety about technological change and globalization is on the rise and, when combined with broader trade imbalances, might foster a shift toward inward-looking and protectionist policies, disrupting trade and investment.
Due to the forecasted risks, the IMF has adopted a conciliatory approach, calling on nations to resolve trade tensions through dialogue and cooperation. The IMF also called on the countries of the world to maintain the pace of economic growth by continuing structural reforms and fiscal policies improvements that would contribute to increasing productivity rates, and in order to counteract the inequities inherent in globalization, by promoting “Inclusive Growth.” It also urged that monetary accommodation needs to remain where inflation is weak, encouraged the gradual and deliberate adoption of traditional foundations of monetary policy, as well as the continuation of prudential fiscal policies to curb rising leverage and contain financial market risks.
With regard to enabling developing countries to achieve the United Nation’s Sustainable Development Goals (SDGs 2030), states have to adopt policies that strengthen their financial positions, build-in greater safety margins to react more effectively to the next downturn, improve fiscal rigidity to contain market risks and face stability concerns, reduce poverty while promoting environmental sustainability, and make growth more inclusive for all population segments.
Implications of Global Economy Developments on Qatar’s Economy
In the World Economic Outlook, the IMF classifies the economies of the GCC countries, including the State of Qatar, as economies of commodity exporters that depend on developments of the global economy. The current and future improvement in the economies of the United States, Japan, the Eurozone, and emerging Asia - including China, India and Korea - all of which are Qatar’s commercial partners, will be reflected in an increase in the demand for oil and gas and the possibility of increasing prices in the near future (until these countries eventually replace fossil fuels with renewables), or at
minimum, remain at high levels compared to previous years. This will reflect positively on the revenues of oil and gas exporters and provide increasing government spending potentials, especially in regard to investment expenditures and the stimulation of macroeconomic growth in the GCC countries as shown in Figure 1-9. However, there are several risks to the GCC economies, some of which may not necessarily be reflected in the Qatari economy. The most important of these risks are: fluctuations in oil and gas prices; the rising costs of finance if global interest rates increase due to the worldwide trend to return to standard monetary policy rather than exceptional monetary policies; tariff wars and shifts toward inward-looking and protectionist policies, and the consequential impact on the course of foreign trade which may affect global growth; a deterioration of commodity prices; and finally, the negative consequences of any geographical or political tensions in the region.
Figure 1-9: IMF Projection of Real GDP growth for GCC countries (%)
Bahrain Kuwait Oman Qatar Saudi Arabia UAE
2017 2018 2019 2020
-4
-3
-2
-1
0
1
2
3
4
5
6
3.8
(3.3)
(0.9)
1.6
(0.9)
0.8
3.2
2.3 1.9
2.7 2.2
2.9 2.6
4.1
5.0
2.8 2.4
3.7
2.5
4.1
2.7 2.6 1.9
3.6
Source: IMF, World Economic Outlook for October of 2018 obtained from WEO database https://www.imf.org
With regard to the risks of global interest rates increase - arising primarily from the Federal Reserve raising interbank interest rates from 1.5% in January 2018 to 2.25% in October 2018, the Qatar Central Bank (QCB) has been keeping pace with recent developments in 2018 by raising overnight deposit interest rate (Qatar Monetary Rate – QMR) from 1.5% in February 2018 to 2.25% in October 2018, which indirectly induced the market rate of 3-month interbank interest rates to be increased from 2.4% in January 2018 to 4.27% in May 2018, before it decreased to 2.45% in September 2018. By raising QMR and encouraging market rate to increase when it is necessary, the QCB aims to maintain non-resident deposits and make the banking sector attractive to foreign deposits, particularly in light of pegging the Qatari riyal to US dollar. However, a policy of raising interest rates contains many economic risks, including

21
Part 1 - Economic Outlook 2018-2020
the high cost of financing - especially as the State of Qatar, since 2017, began to rely heavily on short-term financing (Treasury bills) and sources of domestics and international medium- and long-term financing - and increasing risks of higher financing costs for its current debt balance, especially those that incorporate rollover risks when mature. If interest rates rise, refinancing debt is needed and will become a new debt with high-interest rates. It must be noted that according to a policy note published by the Ministry of Finance, the Qatari government is determined to reduce its debt over the next four years to 36% of GDP.
To know the impact of a rise in global interest rates on financing costs for the Qatari economy, the Thomson Reuters database will be used for sovereign and local debt, which is not necessarily consistent with official data as absolute numbers but can be used as indicators. The data available until July 2018 indicate that 32% of sovereign debt bonds issued by the government, public and private institutions, and companies will be due to be paid during the period 2018-2020, these having an annual arithmetical average of nominal interest rate of about 2.8% for the same period, with the possibility of an increase in the average yearly interest rate in line with global trends in interest rates.
Note that about 84% of total debt are local and external sovereign debts, having a total value of $66 billion and due by the end of 2030. Loans from government and private institutions account for 43.4% of such liabilities, most of which may not have the same high credit rating as government debt. Thus, they may be subject to higher interest rates.
In addition to the risks of rising interest rates, the possible drop in global demand for oil derivatives and consequently lower prices and lower financial returns for oil and gas exports, there are also risks related to the escalating trade war between the United States on the one hand and China and the European Union on the other, which may affect the course of global trade and investment. This could lead to a slowdown in global economic growth and a decline in demand for primary commodities, including oil and gas. This bears negative consequences for the Qatari economy, both regarding exports of aluminum to the United States amounting to QR1.04 billion (US$284 million), as well as risking an increase in imported inflation due to the Qatari Riyal’s peg to the dollar. The lower the value of the dollar, the higher the prices of imported goods for the Qatari consumer, and vice versa.
In addition to the above-mentioned indirect risks, there are potential and direct risks caused by protectionist policies that the United States is seeking to adopt: major
U.S. airlines, such as American Airlines, Delta Airlines, and United Airlines have long argued that they face unfair competition with Qatar Airways on the grounds that the Qatari government heavily subsidizes it. The State of Qatar took this into account and entered into bilateral consultations with the US Administration, which resulted in the signing of the Open Skies Agreement in January 2018, under which Qatar Airways agreed to publish its annual financial statements to refute the unjustified claim. International companies per international auditing always prepare such financial statements and accounting standards, so as to demonstrate the financial transparency of the company’s business. As well, the agreement also provides for Qatar’s approval for direct flights between Doha and US cities without stop-overs in European cities to carry passengers from the European market to and from the United States.
Despite the vagueness of the financial, monetary, or commercial trends of economic policies at the global level, the IMF’s most recent inflation forecasts - according to current data - suggest a slight growth 0.1-0.44 percentage point during 2018-2020 for all countries except for Middle Eastern countries, where Inflation rates are projected to increase by 3.77 percentage point, as Figure 1-10 shows IMF projection for 2018 compared to 2017. This is attributed to the significant recovery in most the economies of MENA countries due to the increase in oil prices, which are often reflected in the rise in aggregate demand resulting from increased government consumption and investment, as well as increased private consumption.
Figure 1-10: World annual CPI Inflation projection by the IMF (%)
1.4 1.7 1.8
2.1 2.6 2.4
0.5 1.1
1.6
3.2 3.3 3.4
8.1
6.0 5.5
1.7 1.7 1.8 2.4 2.1 2.3
1.2 1.3 1.7
3.0 3.2 3.3
8.5
Euro Area US Japan Developing Asia MENA
0
1
2
3
4
5
6
7
8
9
2018 2019 2020 2018 2019 2020 2018 2019 2020 2018 2019 2020 2018 2019 2020
Oct 2017 Oct 2018
Source: IMF, World Economic Outlook for October of Years 2017 and 2018 obtained from WEO database https://www.imf.org
At the level of regional economic blocs, forecasts suggest that inflation in developed economies (Japan and Eurozone, Figure 1-10) is likely to slightly increase or maintain a steady level in 2018 and 2019. However, their level depend on whether the unconventional monetary policy, i.e., “quantitative easing” which adopted by the

22
Qatar Economic Outlook 2018-2020
European Central Bank and the Bank of Japan over the past few years is going to be used during the forecast period or not. As for inflation rates in developing Asia, they are likely to be relatively high due to the possibility of oil price increases that could affect the prices of other energy-intensive products. In the United States, the impact of consecutive increases in interest rates is still neutral to the inflation rate, but is subject to future pressures from the trade war with US trading partners as well as the impact of expansionary fiscal and monetary policies on inflation.
Energy and commodity markets outlookOil Prices
In late June 2018, the OPEC member states and their non-OPEC allies, led by the Russian Federation, agreed to ramp up crude oil production by one million barrels a day, i.e., by 1% of total world production, in order to meet the growing global demand for oil, and to compensate for the anticipated drop in the global supply of fuel for technical reasons related to the decline of oil exports from Venezuela, as well as for political reasons induced by the sanctions imposed against Iran.
OPEC and its allies seek to restrain recently rising oil prices and maintain the current momentum of global economic growth. Indeed, since the production increase was announced, oil prices relatively calmed during July 2018, but the price’s stability at reasonable levels depends on an array of factors, notably: how to narrow the current supply-demand gap in the oil market, how effective sanctions will be in reducing Iranian crude oil production, how the trade tensions between the United States, China, and the European Union will play out and affect the growth of the global economy, and, finally, the impact of security tensions at strait of Bab-Elmandeb (Yemen) the level of oil supplies on the world market. Therefore, forecasts suggest continued speculations on oil prices in the short term until political and security variables stabilize, and the recovery of international oil markets is assured.
Considering reasons affecting oil prices, the forces of supply and demand and the associated volume of oil stocks constitute the most important and direct factor in price changes. When the OPEC countries agreed with their allies in November 2016 to cut production by 1.8 million barrels per day, the alliance achieved its goal not only by gradually raising prices to reasonable levels to cover cost and produce lucrative profits, but also by restoring the dynamism of international oil markets as a result of global stock cuts. The average price per barrel of
Brent Crude rose from $43 in January-November 2016 to $53 per barrel by December 2016. The price of crude oil fluctuated during January - November 2017 between $43 and $55, realizing up to $60 per barrel in December 2017.
As for the price of Qatari onshore and offshore oil sales, Figure 1-11 indicates that the average price of Qatar Marine Crude Oil rose from $39 per barrel in 2016 to $54 per barrel in March 2017, and remained fluctuating between $45.9 to $55.8 per barrel with standard deviation of $2.9, before surpassing the threshold of $61 in December 2017, to continue to swing between an average prices of over $62.7 per barrel to $75 per barrel during the first half of 2018. Despite the OPEC’s decision made at the end of June 2018 to boost production for the purpose to reduce price hike, the oil price, in general, remained at a high level and the Qatari marine oil price ranged at high level during July-October 2018 from a maximum of $78 per barrel and a minimum of $72.9 per barrel with an average of $74 and standard deviation of $1.3 per barrel. Similarly, the average price of Qatar Land crude oil was ranged after OPEC’s decision during July-October 2018 between a maximum of $83.5 per barrel and a minimum of $72.5 per barrel with an average of $76.9 per barrel and standard deviation of $3.5 per barrel. It should be noted that the oil market in late November 2018 witnessed a sharp decline of Brent and WTI by $59 and $51 per barrel, respectively. Also, note that the average price of Qatar Land Oil, which accounts for about 28% of the total production of crude oil, is always higher than the price of marine oil by about 3%.
Figure 1-11: Qatari and International Oil Prices, $/bbl
- - - - - - - - - - - - - - - - - - - - - - - - - - - - - - - -
2016 2017 2018
20253035404550556065707580
Qatar LandOPEC Oil Basket
Qatar MarineBrent
1 2 3 4 5 6 7 8 9 10 11 12 1 2 3 4 5 6 7 8 9 10 11 12 1 2 3 4 5 6 7 8 9 10
62.8 78.00
46.4
44.0
69.2
78.6 78.73
Source: Thomson Reuters EIKON, ICIS Pricing, OPEC accessed October 2018 (numbers in X-axis represent months)
As for the global inventory of liquids fuel3 and its relation to the oil market, the latest data and forecasts issued by US Energy Information Administration (EIA) in October 2018 can be used. Figure 1-12 shows the inverse
3 According to EIA Liquid fuels are all petroleum including crude oil and products of petroleum refining, natural gas liquids, biofuels, and liquids derived from other hydrocarbon sources (including coal to liquids and gas to liquids). Not included are liquefied natural gas (LNG) and liquid hydrogen. See petroleum and other liquids.

23
Part 1 - Economic Outlook 2018-2020
relationship between the level of net global inventories and oil prices. The increasing oil prices in the worldwide market - given the decline in global production of liquid fuels on the one hand and the increase in global demand on the other hand during 2017 - resulted in a reduction of net global inventories of liquids by an average of 0.84 million barrels per day (mbpd). This falling inventory continued during January-August of 2018 by an average of 0.42 mbpd, but forecasts suggest improved inventories levels due to the announcement made by OPEC and its allies to raise production by the end of June 2018 and therefore expected inventories to be increased by an average of 0.20 mbpd during 2018. The EIA expects increasing inventories in 2019 by an average of 0.62 mbpd due to rise in global production of liquids from the average of 99.87 mbpd during 2018 to an average of 101.84 mbpd during 2019; an increase of 1.97 mbpd.
Concerning fossil-fuel producing regions as indicated in Figure 1-13, forecasts suggest that half of this increase is projected to come from OPEC countries and their allies involved in the recent output increase agreement, but the level of growth depends on the production capacity
Figure 1-12: World Net Petroleum and Liquids Position Spot Prices of Brent and WTI
Mill
ion
barre
ls pe
r day
US$
per
bar
rel
(4) (3) (2) (1)
- 1 2 3 4 5
$0
$15
$30
$45
$60
$75
$90
$105
$120
World Net Liquids Position (L-Axis)
Brent Spot
WTI Spot
70.23 78.95
Jan
14M
ar 1
4M
ay 1
4Ju
l 14
Sep
14N
ov 1
4Ja
n 15
Mar
15
May
15
Jul 1
5Se
p 15
Nov
15
Jan
16M
ar 1
6M
ay 1
6Ju
l 16
Sep
16N
ov 1
6Ja
n 17
Mar
17
May
17
Jul 1
7Se
p 17
Nov
17
Jan
18M
ar 1
8M
ay 1
8Ju
l 18
Sep
18N
ov 1
8Ja
n 19
Mar
19
May
19
Jul 1
9Se
p 19
Nov
19
Note: World Net Petroleum and Liquids Position is equal to Total World Production net of Total World Consumption Source: US Energy Information Administration, International Petroleum and Other Liquids Production, accessed in October 2018
of each country and the possibility of allowing other producers to compensate for the shortfall. However, the level of global oil prices is not a simple balanced supply-demand equation; it is always subject to many
variables due to the sensitivity of the global oil markets to technical, political, and security changes at global and regional levels, especially in the main production areas, the most important of which is the Middle East with its incessant political tensions and conflicts, as well as its high levels of insecurity. Saudi Arabia, for example, has suspended all shipments of crude oil exports passing through the Red Sea strait of Bab al-Mandab due to the fallout of its war in Yemen and the attack on oil tankers. Subsequently, the price of Brent rose to $74.35 per barrel, and West Texas Intermediate price rose to $69.35 per barrel, on 26 July 2018.
Figure 1-13: Global petroleum and other liquids production, m bbl/d
Non-OPEC Production OPEC Production (rt axis)
54
56
58
60
62
64
34
35
36
37
38
39
40
41
59
62 40
39
Jan
14M
ar 1
4M
ay 1
4Ju
l 14
Sep
14N
ov 1
4Ja
n 15
Mar
15
May
15
Jul 1
5Se
p 15
Nov
15
Jan
16M
ar 1
6M
ay 1
6Ju
l 16
Sep
16N
ov 1
6Ja
n 17
Mar
17
May
17
Jul 1
7Se
p 17
Nov
17
Jan
18M
ar 1
8M
ay 1
8Ju
l 18
Sep
18N
ov 1
8Ja
n 19
Mar
19
May
19
Jul 1
9Se
p 19
Nov
19
Source: US Energy Information Administration, International Petroleum and Other Liquids Production, accessed in October 2018
It should be noted that OECD inventory of liquids reached 2.83 billion barrels in Sept 2018. The United States accounts for about 43% of the OECD’s total stockpile. Figure 1-14 shows the fluctuations in the level of the OECD’s inventory during the period 2016-2019 according to changes – actual and forecast – that occurred in the international oil market and the price level. The stockpile grew by about 6.8% in 2016 to hit a peak in July 2016 of about 3.1 billion barrels, while the lowest inventory sank to 2.8 billion barrels in March 2018 because of a decline in 2017 by about 2%. The average reduction for 2018 is foreseen to be around 5.5%, to be followed by growth at a rate of 2.5% in 2019 in line with the announcement made by OPEC and its allies to boost production. The wild card here is the advent of the United States as a major producer, as explained in Box 1-9.

24
Qatar Economic Outlook 2018-2020
Figure 1-14: OECD commercial crude oil and liquid fuels inventories, end-of-period (million bbls)
2,6002,6502,7002,7502,8002,8502,9002,9503,0003,0503,1003,150
OECD Inventory Avg 2014Avg 2015 Avg 2016Avg 2017 Avg 2018Avg 2019 Ave 2014-2019
Forecasts
Jan
14M
ar 1
4M
ay 1
4Ju
l 14
Sep
14N
ov 1
4Ja
n 15
Mar
15
May
15
Jul 1
5Se
p 15
Nov
15
Jan
16M
ar 1
6M
ay 1
6Ju
l 16
Sep
16N
ov 1
6Ja
n 17
Mar
17
May
17
Jul 1
7Se
p 17
Nov
17
Jan
18M
ar 1
8M
ay 1
8Ju
l 18
Sep
18N
ov 1
8Ja
n 19
Mar
19
May
19
Jul 1
9Se
p 19
Nov
19
Note: The colored lines represent average annual inventories.Source: US Energy Information Administration Energy Short -Term Energy Outlook database (http://www.eia.doe.gov/steo/cf_query/index.cfm), accessed October 2018.
Based on the above, it can be said that oil prices in the global market and the associated changes in the size of the world’s oil reserves are primarily linked to how broad or narrow the gap is between supply and demand, as shown in Figure 1-15. It is apparent that as the supply will partially exceed demand in the second half of 2018, and for most of 2019, there will be an abundance that will allow the stock to increase, which in turn will be
reflected in the spot prices of crude materials, most notably according to EIA that WTI crude oil, which is foreseen to stabilize at an average price of $65.9 per barrel in 2018 and fall again with production increases to $62.04 per barrel in 2019. However, the decline in the oil markets at the end of November 2018 may make the institutions concerned with the expectations of oil prices to adjust the expectations for their forecasts for the years of 2019 and 2020.
Figure 1-15: Total global production and consumption of crude oil and liquid fuels (MBPD)
Consumption Production
Forecasts
84
86
88
90
92
94
96
98
100
102
104
106
Jan
14M
ar 1
4M
ay 1
4Ju
l 14
Sep
14N
ov 1
4Ja
n 15
Mar
15
May
15
Jul 1
5Se
p 15
Nov
15
Jan
16M
ar 1
6M
ay 1
6Ju
l 16
Sep
16N
ov 1
6Ja
n 17
Mar
17
May
17
Jul 1
7Se
p 17
Nov
17
Jan
18M
ar 1
8M
ay 1
8Ju
l 18
Sep
18N
ov 1
8Ja
n 19
Mar
19
May
19
Jul 1
9Se
p 19
Nov
19
Source: US Energy Information Administration Energy Short -Term Energy Outlook database (http://www.eia.doe.gov/steo/cf_query/index.cfm), accessed October 2018
Box 1-9: The United States as a major producer and game-changer in the global oil marketThe high costs of shale oil production compared to the cost of conventional oil production is one of the most significant challenges faced by oil producers in the United States, increasing the rewarding breakeven price to about $50 a barrel, as well as their having to contend with problems of infrastructure deficiencies and the risk associated with financing operations. However, producers of this type of oil have recently responded dynamically to oil price rises, even the modest increases. In this context, data shows that although the average West Texas Intermediate (WTI) prices had fallen from $48.7 per barrel in 2015 to $43.1 per barrel in 2016, shale oil production declined from 9.4 million barrels per day (mbpd) in 2015 to 8.9 mbpd in 2016. However, when price levels increased in 2017 to reach an average of $51 a barrel, production returned to 9.4 mbpd, is envisaged to grow by the end of 2018 to 10.8 mbpd, and is projected to reach an average of 11.8 mbpd in 2019. This dynamism is underlain by the technological and financing developments that the shale oil industry has witnessed over the past few years, which helped increase production efficiency in upstream operations and subsequently allowed for reductions in production costs from $66-$98 per barrel in 2013 to $29- $38 per barrel in 2016, according to estimates of Rystad Energy. Utilizing a study prepared by the IHS in 2016, the EIA estimates that there is a possibility to reduce the average cost of producing a barrel of shale by a range of 7% and 22% of what it was in 2014 per barrel in the main areas of Bakken, Eagle Ford, Newberry, Permian Delaware, and Permian Midland.It is worth noting that the financing process of US shale oil industry differs from that of international oil companies,
which rely heavily on self-financing and bank borrowing since they are large or giant companies. In contrast, the shale oil industry is independent and small in size, forcing its operators to regularly resort to financial markets to finance their operations. According to the data of the Brecken Foundation highlighted in the figure below, these show the course of the development and mobilization of investment resources in the energy sector, where investment in 2017 amounted to about $69 billion while the investment mobilized until the second half of 2018 amounted to about $29 billion.
Figure for Box 1-9: US-focused Private Equity Investment in Energy
Total Capital Raised Q1 Capital Raised
2011 2012 2013 2014 2015 2016 2017 2018
WTI spot annual avg (R-Axis) WTI Q1 spot avg (R-Axis)
0
10
20
30
40
50
60
70
80
90
$ bi
llion
0
20
40
60
80
100
120
$/Ba
rrel
22.0
51.2
71.6 72.6
83.2
66.9 68.8
28.8
8.4 13.5
26.6 18.9 21.1
12.2 8.7
13.9
Source: Database of Preqin and US Energy Information Administration

25
Part 1 - Economic Outlook 2018-2020
On the overall demand-side of liquid fuels, EIA analysis, as shown in Figure 1-16, reveals that the annual growth rate of developing countries’ demand as of the second half of 2017 will be more stable than that of developed countries. The EIA forecasts suggest that developing countries’ demand, especially that of China and the Eurasian region, will grow at an annual average of about 2.4% with minimal variance, while demand growth rates in developed countries will be about 1% with a more subtle variation.
It should be noted that the forecasts of the majority of international oil market observers suggest that global growth levels (demand) for liquid fuels will be lower than the expectations for global economic growth. Consequently, short-term oil prices will swing between highs and lows, but will remain higher than in 2016 (see consensus prices below). In the medium term, a lesser degree of certainty is envisaged despite expectations of an increase in the amount of production due to increases in investments in energy (see Box 1-10 at the end of Part-1) which will come mostly from the United States, and expectations of increasing the strategic stocks of many countries, especially the USA and China, as well as increasing the capacity of smaller and independently operated refineries, known as ‘teapot’ refiners, which account for 21% of China’s refining capacity, all of which will constitute pressure factors and put a brake on rising prices over the medium term. However, developments in overall demand growth, which will be a major stimulus to the upward movement of prices, specifically China’s demand for crude oil, cannot be ignored.
Figure 1-16: Global Liquids* Consumption and Inventories (m bbl)
Non-OECD OECDOECD Inventory (R-Axis)
Inve
ntor
y (M
illio
n ba
rrels)
Cons
umpt
ion
Grow
th R
ate
-3%
-2%
-1%
0%
1%
2%
3%
4%
5%
6%
7%
Jan
15M
ar 1
5M
ay 1
5Ju
l 15
Sep
15N
ov 1
5Ja
n 16
Mar
16
May
16
Jul 1
6Se
p 16
Nov
16
Jan
17M
ar 1
7M
ay 1
7Ju
l 17
Sep
17N
ov 1
7Ja
n 18
Mar
18
May
18
Jul 1
8Se
p 18
Nov
18
Jan
19M
ar 1
9M
ay 1
9Ju
l 19
Sep
19N
ov 1
9
2,500
2,600
2,700
2,800
2,900
3,000
3,100
3,200
*Note: Liquid fuel is all liquid petroleum products, including crude oil and liquids derived from hydrocarbon sources, including gas and coal via refining. The global net liquid fuel is the difference between total net production and global consumption Source: US Energy Information Administration, Short-Term Energy Outlook, Table 3a, sourced October 2018.
In October 2018, the EIA forecasts Chinese demand for liquid fuels to grow by 3.9% in 2018 and 3.4% in 2019,
and the total demand from the United States is likewise expected to increase by about 2.3%, and that of the Non-OECD European countries by about 2.6%. Conversely, the consumption level in Canada is envisaged to decline by 1.7 % in 2018 and then recover to a positive growth of 1.3% in 2019. As for Japan, and as is customary since 2014, it is anticipated that its consumption of crude oil will decline during 2018 and 2019.
Consensus Oil Prices Forecasts
After the announcement of OPEC and its allies to increase crude oil production at the end of June 2018, the consensus estimates of crude oil prices for UK Brent basket (Brent) and the West Texas Intermediate (WTI) for the period 2018-2020 varied by an average difference of about $6.4 per barrel (Table 1-4).
Although WTI oil price forecasts for 2018 ranged from $77 per barrel at a maximum to $69.3 per barrel at a minimum, having an average of $73.3 per barrel, nevertheless the estimates for Brent prices for 2018 was more conservative and ranged between $70 per barrel at maximum and $62.2 per barrel at minimum with an average of $67 per barrel. Both benchmarks median maintained the same forecasting pattern for 2019-2020, down by about $0.3 dollar per barrel for WTI at $73.8 a barrel, and while Brent was down by $1.6 a barrel reaching $65.7 a barrel. In 2020, Brent shows a massive gap between the maximum limit of $80 per barrel as forecasted by the LLBW and Natixis and the minimum at $47 a barrel as projected by the British Julius Baer Group. Similarly, the forecasts for WTI prices in 2020 ranged between $85.3 maximum as projected by Natixis, Nomisma Energia, LLBW, and $50 minimum as projected by the British Julius Baer Group.
Thus, that the global oil market and its associated prices and oil supplies are of high global interest can be observed from the many international institutions publishing their views and outlooks on the future course of oil prices as we note in Table 1-4.
The longer the forecast period, however, the more different are the forecasts; it can be seen that there is a more significant difference between the estimates for 2019 and 2020 compared to the semi-consensus on the price forecasts for 2018, which resulted in a standard deviation of about $2 for both prices, while the standard coefficient of variation increased to between $6.1 - $6.3 in 2019 and to $9 - $9.1 in 2020.
It is worth mentioning that the high expectations of oil prices in the coming years indicate almost positive optimistic outlook for global economic growth and thus the increasing global demand for crude oil compared with the slow increase in the worldwide supply of oil;

26
Qatar Economic Outlook 2018-2020
this is entirely different from the gas industry, which is mostly governed by long-term contracts. The variance in these expectations is mirrored by projections made by the International Monetary Fund (IMF) in October 2018; the IMF expects a higher scenario for 2019 and 2020 with Brent prices at $72.3 and $69.4 per barrel, while for WTI prices to range between $64.1 and $60.78 per barrel. On the other hand, the IMF simple average of three spot
prices (Brent, WTI and Dubai) to $68.8 and $65.7 for 2019 and 2020, respectively.
Considering the fundamentals governing the international oil market nowadays, crude oil supply and demand projections from relevant institutions and international organizations (Rystad Energy, Bloomberg New Energy Finance, US Energy Corp., and Cube Energy Corp.) suggest increasing global demand for crude oil
Table 1-4: Consensus Forecasts of Oil Prices
Forecaster Oil (US $/bbl)WTI UK Brent
2018 2019 2020 2018 2019 2020ABN Amro 73.0 85.0 82.0 67.0 78.0 73.0 ANZ 76.0 79.0 73.0 69.0 72.0 69.0 Banco Santander 70.6 67.0 62.0 64.9 60.5 55.5 Barclays 72.0 71.0 75.0 66.0 65.0 -- Bernstein 73.0 76.0 73.0 63.0 66.0 63.0 BMO 73.6 67.5 65.0 67.5 63.0 61.0 BNP Paribas 74.0 79.0 -- 68.0 74.0 -- BOCI 72.5 -- -- 66.7 -- -- BofA Merrill 74.1 80.0 -- 67.3 71.0 -- Caixa Bank 72.9 70.8 66.0 -- -- -- Capital Economics 71.0 65.0 57.0 65.0 57.0 53.0 Citi 75.0 70.0 -- 68.0 62.0 -- Commerzbank 72.0 66.0 -- 66.0 63.0 -- Credit Suisse 73.5 75.0 75.0 67.3 67.0 68.0 CRISIL 74.5 70.5 62.5 67.5 65.5 59.5 Daishin 74.0 75.0 74.0 67.0 66.0 65.0 Danske Bank 72.0 73.0 -- 67.0 70.0 -- Deutsche Bank 75.6 76.0 68.0 69.7 69.0 59.0 DNB 72.5 68.0 80.0 -- -- -- NEXT <OILPOLL-3> -- -- -- -- -- -- EIU 73.2 72.3 70.0 67.3 66.5 64.4 Emirates NBD 73.5 73.0 -- 66.8 66.4 -- Global Risk 74.0 82.0 85.0 -- -- -- GMP Capital 75.3 82.0 77.0 68.5 74.0 70.0 ING 73.0 66.0 69.0 66.0 59.0 65.0 Global Gas Analytics -- 74.1 76.5 -- -- -- Intesa Sanpaolo 73.8 80.0 80.0 68.2 74.0 75.0 JBC Energy 73.6 74.7 74.8 68.0 68.8 71.5 Jefferies 77.0 75.0 70.0 70.0 67.0 64.0 JP Morgan 69.3 63.0 -- 62.2 58.3 -- Julius Baer 71.2 60.6 50.0 66.1 57.5 47.0 LBBW 73.5 80.0 85.0 68.5 77.0 80.0 Lloyds Bank UK -- 76.5 81.5 -- 69.0 77.5 MUFG 71.4 62.0 60.9 66.6 56.4 55.2 NAB 73.4 69.3 69.3 67.8 63.3 63.3 Natixis 73.5 80.0 85.0 68.0 75.0 80.0 Nomisma Energia 73.7 81.9 85.3 67.7 74.9 79.3
Consensus (Mean) 73.3 73.3 72.6 67.0 67.0 66.0 Median 73.5 74.1 73.5 67.3 66.5 65.0 High 77.0 85.0 85.3 70.0 78.0 80.0 Low 69.3 60.6 50.0 62.2 56.4 47.0 Standard deviation 1.6 6.3 9.1 1.7 6.1 9.0 Coefficient of variation (%) Ratio of SD to Mean
2.13 8.63 12.49 2.49 9.12 13.66
Source: Thomson Reuters EIKON, accessed on October 2018.

27
Part 1 - Economic Outlook 2018-2020
compared to a short-term decline in inventory. This is attributed to lower production forecasts from major producers Iran, Venezuela, and Libya, compared to a modest increase in aggregate supply by the rest of the producing countries, bringing the global total crude oil supply from 96.7 mbpd in 2017 to 103 mbpd in 2020. Therefore, it is possible to achieve a surplus in supply in favor of increasing the inventory by half a million barrels per day for the years 2018 and 2019, and about 1.3 mbpd in 2020. However, this convergence still maintains oil prices at around the level of $70 per barrel.
In addition to the expected impact of the level of crude oil inventories on future oil prices, the International Maritime Organization (IMO)’s policy of forcing ships to use low sulfur fuel oil by January 2020 will lead to increase demand for distillate fuel products (diesel and gas oil), which in turn will increase demand for crude oil. Such policy may lead to increase oil prices by 2020.
It should be noted that any increase in crude oil supply would, in the first place, affect the spot delivery prices. As indicated in Figure 1-17, spot delivery price for WTI has twined around the contracted prices’ upper and lower
Figure 1-17: Average Monthly Crude Oil Prices: Spot vs Futures
Forecast Error (absolute, % of actual price) WTI crude spot price (actual)
WTI crude 1-month future price
Average of forecast error (absolute, as % of actual price): 6.8%
Fore
cast
erro
r (ab
solu
te, %
of a
ctua
l pric
e)
Pric
e (U
S$/b
arre
l)
0
3
6
9
12
15
18
21
24
27
0
10
20
30
40
50
60
70
80
Jan
15Fe
b 15
Mar
15
Apr 1
5M
ay 1
5Ju
n 15
Jul 1
5Au
g 15
Sep
15O
ct 1
5N
ov 1
5D
ec 1
5Ja
n 16
Feb
16M
ar 1
6Ap
r 16
May
16
Jun
16Ju
l 16
Aug
16Se
p 16
Oct
16
Nov
16
Dec
16
Jan
17Fe
b 17
Mar
17
Apr 1
7M
ay 1
7Ju
n 17
Jul 1
7Au
g 17
Sep
17O
ct 1
7N
ov 1
7D
ec 1
7Ja
n 18
Feb
18M
ar 1
8Ap
r 18
May
18
Jun
18Ju
l 18
Aug
18Se
p 18
Source: Estimates based on data from US Energy Information Agency Energy Short -Term Energy Outlook database (http://www.eia.gov/dnav/pet/pet_pri_spt_s1_d.htm), accessed Sept 6th 2018.
ranges during the period 2015-2018. In all of 2017, the spot price was lower than the contracted amount for only three months, while during the first nine months of 2018, this occurred for four months; perhaps the relative importance of such contracts will increase as the supply increases, since it is directly subject to supply and demand forces. On the other hand, there is a relentless drive on the part of both producers and scientific research institutions towards finding a technological solution that reduces the costs of upstream operations of energy resources. There is also a welcome increase in investments in the field of renewable energies, intending to use them to counter environment pollution and
climate change, all of which could create pressures to lower oil prices over the medium- and long-terms.
Gas Prices
For the State of Qatar, liquefied natural gas (LNG) prices are more important than the price of crude oil owing to its high relative importance compared against total oil exports. The proportion of oil-related exports in 2017 was about 87% of total exports, of which 65% consisted of gas exports, destined mostly to Northeast Asia (by 75% of the total gas exports), with the remainder transported to the rest of the world, especially to Europe and Latin America.
It is worth noting that the State of Qatar - since 2011 - has maintained its export capacity of 77 million tons per year, increasing its share in total LNG production worldwide from 30% in 2011 to 32% in 2013 and 2014, before it gradually fell to 26% in 2017 due to increased LNG production from Australia, a country which rose from 8% of the world’s production in 2011 to 20% in 2017.
The methodology for pricing natural gas and LNG is different from that of crude oil pricing. These are not priced at a global level, but instead geographically at a regional level. The price of natural gas in the United States is often lower than the prices of LNG in Northeast Asia, while prices in Europe generally range between the US and Asian prices. Gas transfer from the producing country to the consumer country is an essential determinant of prices. Gas transported by pipelines is cheaper than LNG transported by carriers, which involves both the high costs of liquefaction as well as transportation to consumption areas.
LNG prices are subject to multiple mechanisms and methods. LNG transported by pipelines is priced in different ways from one country to another. In the United States, pricing is determined by the Henry Hub Center for Gas Trading. In the European countries importing Russian gas, the price is determined according to bilateral agreements, which is also the case between Qatar and the UAE. On the other hand, LNG is priced either as spot prices, which are subject to supply and demand factors, or by futures contracts, which are mostly linked to the expectations of oil prices in the international market. Each barrel of oil contains 5.8 million British thermal units (MBTU), so assuming that the price of a barrel of oil is $100, then the price of one MBTU of LNG will be $17, which it is called Barrel of oil equivalent (BOE).
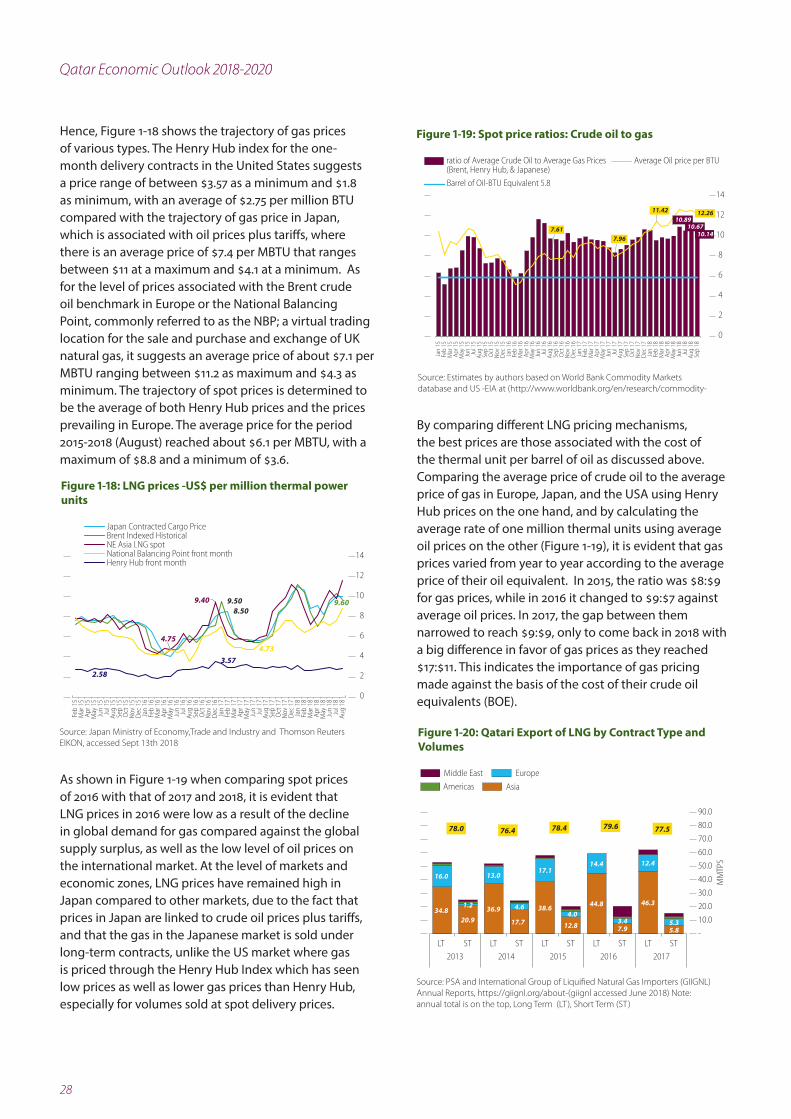
28
Qatar Economic Outlook 2018-2020
Hence, Figure 1-18 shows the trajectory of gas prices of various types. The Henry Hub index for the one-month delivery contracts in the United States suggests a price range of between $3.57 as a minimum and $1.8 as minimum, with an average of $2.75 per million BTU compared with the trajectory of gas price in Japan, which is associated with oil prices plus tariffs, where there is an average price of $7.4 per MBTU that ranges between $11 at a maximum and $4.1 at a minimum. As for the level of prices associated with the Brent crude oil benchmark in Europe or the National Balancing Point, commonly referred to as the NBP; a virtual trading location for the sale and purchase and exchange of UK natural gas, it suggests an average price of about $7.1 per MBTU ranging between $11.2 as maximum and $4.3 as minimum. The trajectory of spot prices is determined to be the average of both Henry Hub prices and the prices prevailing in Europe. The average price for the period 2015-2018 (August) reached about $6.1 per MBTU, with a maximum of $8.8 and a minimum of $3.6.
Figure 1-18: LNG prices -US$ per million thermal power units
0
2
4
6
8
10
12
14
8.50 9.50 9.60 9.40
4.75 4.73
2.58
3.57
Japan Contracted Cargo PriceBrent Indexed HistoricalNE Asia LNG spotNational Balancing Point front monthHenry Hub front month
Feb
15M
ar 1
5Ap
r 15
May
15
Jun
15Ju
l 15
Aug
15Se
p 15
Oct
15
Nov
15
Dec
15
Jan
16Fe
b 16
Mar
16
Apr 1
6M
ay 1
6Ju
n 16
Jul 1
6Au
g 16
Sep
16O
ct 1
6N
ov 1
6D
ec 1
6Ja
n 17
Feb
17M
ar 1
7Ap
r 17
May
17
Jun
17Ju
l 17
Aug
17Se
p 17
Oct
17
Nov
17
Dec
17
Jan
18Fe
b 18
Mar
18
Apr 1
8M
ay 1
8Ju
n 18
Jul 1
8Au
g 18
Source: Japan Ministry of Economy,Trade and Industry and Thomson Reuters EIKON, accessed Sept 13th 2018
As shown in Figure 1-19 when comparing spot prices of 2016 with that of 2017 and 2018, it is evident that LNG prices in 2016 were low as a result of the decline in global demand for gas compared against the global supply surplus, as well as the low level of oil prices on the international market. At the level of markets and economic zones, LNG prices have remained high in Japan compared to other markets, due to the fact that prices in Japan are linked to crude oil prices plus tariffs, and that the gas in the Japanese market is sold under long-term contracts, unlike the US market where gas is priced through the Henry Hub Index which has seen low prices as well as lower gas prices than Henry Hub, especially for volumes sold at spot delivery prices.
Figure 1-19: Spot price ratios: Crude oil to gas
7.61 7.96
11.42
0
2
4
6
8
10
12
14Barrel of Oil-BTU Equivalent 5.8
ratio of Average Crude Oil to Average Gas Prices (Brent, Henry Hub, & Japanese)
Average Oil price per BTU
Jan
15Fe
b 15
Mar
15
Apr 1
5M
ay 1
5Ju
n 15
Jul 1
5Au
g 15
Sep
15O
ct 1
5N
ov 1
5D
ec 1
5Ja
n 16
Feb
16M
ar 1
6Ap
r 16
May
16
Jun
16Ju
l 16
Aug
16Se
p 16
Oct
16
Nov
16
Dec
16
Jan
17Fe
b 17
Mar
17
Apr 1
7M
ay 1
7Ju
n 17
Jul 1
7Au
g 17
Sep
17O
ct 1
7N
ov 1
7D
ec 1
7Ja
n 18
Feb
18M
ar 1
8Ap
r 18
May
18
Jun
18Ju
l 18
Aug
18Se
p 18
10.89
10.14
12.26
10.67
Source: Estimates by authors based on World Bank Commodity Markets database and US -EIA at (http://www.worldbank.org/en/research/commodity-
By comparing different LNG pricing mechanisms, the best prices are those associated with the cost of the thermal unit per barrel of oil as discussed above. Comparing the average price of crude oil to the average price of gas in Europe, Japan, and the USA using Henry Hub prices on the one hand, and by calculating the average rate of one million thermal units using average oil prices on the other (Figure 1-19), it is evident that gas prices varied from year to year according to the average price of their oil equivalent. In 2015, the ratio was $8:$9 for gas prices, while in 2016 it changed to $9:$7 against average oil prices. In 2017, the gap between them narrowed to reach $9:$9, only to come back in 2018 with a big difference in favor of gas prices as they reached $17:$11. This indicates the importance of gas pricing made against the basis of the cost of their crude oil equivalents (BOE).
Figure 1-20: Qatari Export of LNG by Contract Type and Volumes
78.0 76.4 78.4 79.6 77.5
-
10.0
20.0
30.0
40.0
50.0
60.0
70.0
80.0
90.0
MM
TPS
20172016201520142013
34.8
16.0
20.9
1.2 36.9
17.7
38.6
12.8
44.8
7.9
46.3
5.8
13.0
4.6
17.1
4.0
14.4
3.4
12.4
5.3
Middle East Europe
Americas Asia
LT ST LT ST LT ST LT ST LT ST
Source: PSA and International Group of Liquified Natural Gas Importers (GIIGNL) Annual Reports, https://giignl.org/about-(giignl accessed June 2018) Note: annual total is on the top, Long Term (LT), Short Term (ST)

29
Part 1 - Economic Outlook 2018-2020
It worth mentioning that Qatar LNG exports sold in Futures Contracts over the past few years have been, on average, 75% of total gas exports as shown in Figure 1-20. These contracts are linked to oil prices (with a delay of 6 months) and at an average of $8.4 per MBTU, ranging from $13.4 at a maximum to $5.85 at a minimum. However, the rest (25% of total exported gas) is sold at spot delivery prices. Qatar’s LNG exports in long-term contracts increased from 67.8% in 2013 to 80.3% in 2017 according to data from the International Group of LNG Importers (GIIGNL), as depicted in Figure 1-20, which shows both long-term (LT) and spot (ST) export levels.
The gas industry and future challenges
The LNG industry, like other international primary commodity-based industries, faces a range of challenges and risks, summarized by the IGU4 report in 10 points. There are macro- and microeconomic challenges, regional and international political risks, the competitive challenges between the need for export revenues versus meeting local market needs, as well as competition between LNG and other fuel or power resources such as nuclear, coal, solar, hydro, and wind. Moreover, there are administrative challenges to the requirements of maintaining environmental balances, as well as trade challenges, contracts, and prices. A significant part of these challenges applies to the gas industry in Qatar, particularly those related to the increase in global supplies and the resulting pressure on prices, as well as the intensification of regional and international competition, which will result in giving buyers greater bargaining power to change the terms of long-term contracts and rates.
It should be noted that the challenges of falling LNG prices will be one of, if not the most, critical economic problems facing Qatar, as it represents a decline in the annual revenues of gas exports, which then have a significant knock-on effect on the state budget and, consequently, the pace of macroeconomic growth. However, we will only keep track of short-term forecasts in this report. The World Bank’s projections in what is called (pink sheet) indicate that the average LNG prices for the period 2018-2020 will range between $6.5-$6.67 per MBTU in the European market, $3-$3.2 per MBTU in the United States, and $8.8-$9.1 per MBTU on the Asian market.
The IMF forecasts suggest that the weighted average index of gas prices in the European, American and Japanese markets in 2018 as shown in (Figure 1-21) will achieve moderate growth by about 3.3%, but the growth
rate will decline in 2019 by about 3% and continues to fall in 2020 by about 1.8%.
Figure 1-21: Natural Gas Price Index (2005=100)
160
107
7079 82 80 78 78
2014 2015 2016 2017 2018 2019 2020 2021Actual Forecast
-3.0
-33.2-34.5
13.2 -3.0-1.8
-0.23.6
Index Growth (%)
-60-40-20020406080100120140160180
Poin
ts a
nd R
ate
of C
hang
e %
Note: The index is a weighted average of European, Japanese and US prices. Source: IMF, World Economic Outlook April 2018 database (https://www.imf.org/external/pubs/ft/weo/2018/01/weodata/index.aspx), accessed June 2018.
Perhaps the IMF forecasts are based on the assumption that the total supply of LNG will exceed total demand in 2019 and 2020, driven by the increasing number of LNG projects under construction in the USA, Australia, and the Asia-Pacific region, which will enter their production and export phases in the coming years, according to the report of the International Gas Union for 2018, which predicted a growth of exportable quantities of LNG in the short- and medium-term of about 28% more than in 2017, as shown in Figure 1-22.
Figure 1-22: Nominal Liquefaction Capacity by Region 2011-2023
2011 2017 2023
Met
ric To
n
0
20
40
60
80
100
120
140
160
180
60.368.3 74.1
82.8
135.9
164.3
10.8 10.8
3020 20 20
1.5
19.5
66.6
100.8 100.8 100.8
EuropeAfrica Latin America
Former Soviet Union North AmericalAsia Pacific
Source: Internal Gas Union, World Gas Report -2018 Edition Table 4-2
On the other hand, according to the US Energy Information Administration (EIA – Short-Term Energy Outlook Table 5a), the average US Natural Gas
4 2018 World LNG Report (27th World Gas Conference Edition) at https://www.igu.org/publications-page

30
Qatar Economic Outlook 2018-2020
production in 2017 amounted to 613 million metric ton annualy (MMTPA) and is expected to tick upward to reach 686 and 741 MMTPA in 2018 and 2019, respectively. USA laws ban the exportation of such products without obtaining a permit from the US Department of Energy, which agreed in 2015 to export about 10% of the total production of the United States. The International Gas Union report indicates that the LNG exportation potential from the United States is still limited, as it is achieved through only four production lines with a production capacity of 18 million tons per year until March 2018, along with six projects under construction for production lines with a production capacity of 48.6 million tons annually. Exports from such project will start at the end of 2018 and 2019, and the United States plans to gear up to export capacity to 336 million tons by 2030.
Furthermore, reports suggest that Canada has an enormous gas wealth that qualifies it to compete in the LNG market in the future, but the exploitation of that wealth is very limited. It is also difficult to expand and increase LNG export projects from Canada in the short- and medium-terms due to the lack of infrastructure in the areas where natural gas exists, which brings high costs to exploitation and development. In contrast, Australia has made qualitative leaps in the past three years towards LNG production and export despite the higher production cost per ton compared to other countries such as the United States and Qatar, and moreover currently has plans to increase production over the medium- and long-term.
For the State of Qatar, as mentioned earlier, Qatar Petroleum is moving forward with a set of designs and contracts to start the natural gas expansion project in the North Field to boost the country’s annual production from 77 million tons to 110 million tons5. Most likely, the output is to start at the beginning of 2024. Given the slow and sometimes shambolic extension of pipelines to transport LNG to neighboring countries, Qatar Petroleum seeks to expand its customer base in Europe, Latin America, and Asia. In April 2018, QP signed a contract to supply Vietnam with up to 1 million tons per year of LPG and Naphtha over the next 15 years, to be used as valuable input materials for Vietnam’s petrochemical industry. In the same month, QP delivered its first LNG cargo to Bangladesh as part of a long-term sale and purchase agreement (SPA) signed in September 2017 to supply up to 2.5 million tons of LNG per annum for 15 years. In September 2018, QP signed a contract to supply PetroChina International Co, a unit of PetroChina Co, to provide China with around 3.4 million tons of LNG per annum for 22 years, delivering the first cargo in September 2018 given that China is planning to combat
air pollution from using coal by using LNG.
In seeking the assessment of LNG global production and export expectations during the period 2018-2030, we will be guided by Bloomberg Energy Finance data, which uses the Final Investment Decision (FID) as a benchmark for determining both future optimistic production scenarios and conservative future production scenarios, as well as by economic incentives such as forecasts of increased global economic growth and the subsequent growth of investments, which in turn require liquid fuels, including LNG. Therefore, this approach will ultimately maintain rewarding prices for exported gas, which encourages the implementation of investment projects in this sector. Bloomberg developed two scenarios for increasing global demand for imported gas on the basis that total global demand will increase from 285 million tons in 2017 to between 448 and 552 million tons in 2030. At the same time, it assesses the total exporting capacity of LNG; if the investments were partially or fully implemented, to increase from 296 million tons in 2017 to between 372.2 and 733.7 million tons in 2030. Figure 1-23 shows the optimistic scenario of LNG export forecasts by geographical area up to 2030 before and after investments that are now being implemented by significant exporters (the units are million metric tons per annum, MMtpa). It can be seen that North America (primarily the USA) will contribute 42% of total gas exports in 2030, followed by Qatar with 14% assuming the current expansion projects of production from the North Field from 77 million tons to 110 million tons5 is achieved, trailed closely by Australia with 13%. It is anticipated that Malaysia’s share will drop from 10% in 2017 to 1% in 2030, while Russia’s share is expected to increase from 4% in 2017 to 7% in 2030.
Figure 1-23: The LNG export scenario up to 2030 before and after FID by major exporters (MMtpa)
448.3
489.7
552.7
733.7
050100150200250300350400450500550600650700750
Other
RussiaAfricaAustraliaQatarOther
RussiaAfricaIndonesiaMalaysiaAustraliaQatarGlobal demand (Low)Global demand (Base)Global Demand (High)Global Supply (High)
2013
2014
2015
2016
2017
2018
2019
2020
2021
2022
2023
2024
2025
2026
2027
2028
2029
2030
Pote
ntia
l in
crea
se a
fter F
IDEx
pect
ed e
xpor
ts
befo
re F
ID
N. America
N. America
Source: Bloomberg New Energy Finance, accessed in June 2018 Note: Final Investment Decision is abbreviated as FID.
5 QP announced on Sept. 26th 2018 that LNG production capacity would reach 110 million tons per year.

31
Part 1 - Economic Outlook 2018-2020
However, market supply and demand forces remain the drivers of price differentials and associated investment and production decisions. The International Gas Union Report indicated that some projects have been either canceled or postponed in the United States, Australia, Russia, and Canada during the period 2016-2017. The investment expenditure data obtained from Rystad Energy indicates that investment expenditures on exploration in 2017 declined, as shown in Box 1-10. This drop in investment will translate into lower quantities offered for short-term marketing. On the other hand, if we take into account the expectations of increasing demand for LNG, this will be reflected in long-term prices.
Assuming the accuracy of forecasts with regards to the increasing total supply of LNG compared with a lower aggregation in the overall demand side, the price level of LNG will witness a limited decline in the coming years. For certain, gas projects under spot-delivery contracts will be the first to be affected by the total supply surplus. Thus, the level of delivery prices will decline, and the relative importance of spot pricing and delivery contracts can also be expected to fall since they are directly subject to supply and demand volatility.
Historically, energy companies used to sign long-term supply contracts with purchasers for up to 25 years to have the requisite means through which to secure finance in order to make large capital investments that may exceed US$10 billion support the construction of new LNG facilities. However, with such projects completed in the medium term, long-term supply contracts are expected to decline over time due to developments in transportation technology and the spread of gas liquefaction plants, as well as the increasing numbers of producers and their closer locations to the sites of consumption, all of which will serve to provide importers more freedom of choice under appropriate conditions. Despite the recovery of long-term contracts associated with oil prices, they are also forecasted to face pressures to change the terms of agreements for the benefit of purchasers. However, according to the International Gas Union Report, there are still companies that prefer to sign long-term contracts, as many contracts were approved in 2018. As mentioned above, Qatar signed two long-term supply contracts with Bangladesh in 2017 and with Vietnam in 2018, both for a duration of 15 years and with China in 2018 for a duration of 22 years.
Based on the above, and due to significant and successive changes in the LNG market and the associated new and advanced technology, it can be said that forecasts of LNG spot delivery prices suggest a steep
decline in the near term due to the increasing imbalance of world market forces and their associated various balances, particularly in light of the expectation of a new flow of gas supply coming from Australia, North America, and other regions. At the same time, it is also possible to say that the State of Qatar will not be significantly impacted by such negative changes, owing to the fact that most of Qatar’s gas exports (80% in 2017) are sold on long-term contracts, mainly to the Asian market, and are usually linked to oil prices which are relatively high as we have previously noted in Figure 1-18. Nonetheless, an LNG importer’s request to renegotiate their contract prices cannot be ruled out if spot delivery prices fall below the pricing level of long-term contracts (see Box 1-11)
Although the various forecasts are based on a set of assumptions with initial conditions set on current circumstances while incorporating probable future scenarios and developments, many factors were ignored and assumptions made when developing such estimates. For example, abundant physical and financial challenges are facing new gas exploration in many countries of the world. Efforts to extract natural gas from the Permian Basin in the United States requires vast amounts of money to build infrastructure to transport gas from the fields to exporting ports and consumption areas. On the other hand, in the total demand side, behavioral changes are noted in energy usage in many global economies as they shift to clean energy sources to reduce the consequences of global climate change and mitigate the problem of global warming, following their commitment to the Paris Accords. Natural gas is at the forefront of new energy sources that will replace traditional energy sources - especially dirty coal - in some countries, including China, which has an unbridled desire to use gas as a clean source of energy. Consequently, the modest growth of the global gas supply against a significant increase in global demand may lead to a continued rise in gas prices in the short and medium terms.

32
Qatar Economic Outlook 2018-2020
Commodity markets outside the energy sector
Global prices for other commodities outside the energy sector (oil and gas) are foreseen to rise moderately in 2018 and then to decline slightly in 2019 and 2020. According to the International Monetary Fund Report (World Economic Outlook, April 2018), the Commodity Non-Fuel Price Index will increase in 2018 by just 1.8% compared with its significant growth of 7.4% in 2017, but will decline moderately in 2019 by 0.4%, then 0.9% in 2020 (Figure 1-24).
Figure 1-24: Non-fuel Commodity Price Indices (2005=100) (Points)
100
110
120
130
140
150
160
170
180
Actual Forecast
Industrial Inputs Index
2014 2015 2016 2017 2018 2019 2020 2021
154
124
117
134137 135 135 135
171
144 146 149 150 151 149 148
Non-fuel Price Index Food and Beverages Index
162 134 132 142 144 143 142 141
Source: Estimates based on data from Source: IMF, World Economic Outlook April 2018 database (https://www.imf.org/external/pubs/ft/weo/2018/01/weodata/index.aspx), accessed 23 June 2018
It is noteworthy that the forecasts of higher oil prices will assuredly step up the cost of production inputs, thereby increasing the prices of manufactured goods, albeit at a moderate growth rate in 2018, up by 2.3% compared to 2017’s high growth of 14.6%. China’s tendency to reduce its demand for metals, and its moves towards a consumer-driven economy, as well as its slowing investment in residential real estate, will reduce the prices of industrial and raw materials by 1.4% in 2019 and 0.5% in 2020. In addition, due to trade tension between USA and China and other metal producer countries, metal price decline during the second half of 2018. As for food prices, forecasts suggest they will grow slowly during the projection period by 1% in 2018, and 0.5% in 2019, to decline in 2020 because of an abundant supply of food.

33
Part 1 - Economic Outlook 2018-2020
Box 1-10: Recovery of oil and gas exploration investments in the medium term
It is known among those involved in issues of exchange and oil markets that investments in the oil sector are of a cyclical nature and are dynamically affected by the variables of current and future forecasts of oil prices. When prices rise, investments increase to secure future supplies (and vice versa), but there are long recession periods for investment projects that usually lead to considerable fluctuations in the spot price as the supply seeks to adapt slowly to levels of demand and future projections. For example, due to the sharp fall in oil prices in the second half of 2014, global investment spending on exploration declined by 28% in 2015 but sharply decreased in 2016 by 38%. But once oil prices recovered at the beginning of 2017, the decline slowed to just 5% in 2017; and because of uncertainty and speculation, exploration costs will likely fall by about 6% by the end of 2018. According to Rystad Energy estimates, exploration costs are expected to increase by 15% in 2019 and 7% in 2020. It is worth noting that exploration expenditures are more affected than capital and operating expenses.
The latter achieved positive growth in 2017 and 2018, and they are forecasted to rise in 2019 and 2020 by 4% and 8% for capital expenditures and 12% and 91% for operating costs.
Now, it’s December 2018, and after crude oil prices have stabilized at medium levels and the expectation of OPEC to reduce its production, oil producers’ forecasts seem more optimistic and attractive to investors in the United States. The US contributed to the overall global growth in total investment expenditures in the oil sector by about 4 percentage point in 2017. It expected to add 2.7 percentage points to the overall global growth of investments estimated at 3.5% in 2018. However, the US contribution’s share in 2019 is foreseen to fall to 3.8 percentage points of the total investment growth forecasts of 10% in favor for in the rest of the world. In the same trend, the US is expected to contribute by about 3.4 percentage points in 2020 to the global investment growth forecasts of 9.8%.
Figure for Box 1-10: US and Global E&P Spending by Type Global ex-US Other CAPEX Global ex-US Exploration CAPEX
US Other CAPEX (R-Axis) US Exploration CAPEX (R-Axis)
Global OPEX
0
50
100
150
200
250
300
350
400
450
500
550
600
650
$ Bi
llion
$ bi
llion
0
25
50
75
100
125
150
175
200
225
250194
134
86 112 129
143
161
560
478 433
461 486
551
544
430
353
340 337 351 381
102 73
50 42 42 47 51 50 37 17 22 18 22 23
2014 2015 2016 2017 2018 2019 2020
Source: PSA and Rystad Energy UCube

34
Qatar Economic Outlook 2018-2020
Box 1-11: Japan to change LNG buying strategy
Japanese LNG buyers have often expressed discontent with the “Destination and Diversion Restrictions” clause in most Qatari sales contracts, as this clause restricts the diversion of sold cargoes and keep buyers from reselling shipments on terms that may compete with other shipments from the same seller. The Japan Fair Trade Commission (JFTC) reviewed the “Destination and Diversion Restrictions” clauses in 2016 at a time when the international LNG market was undergoing structural changes that saw trade shifting away from point-to-point sales to greater liquidity as new supplies came online and new markets emerged. The assumption of JFTC and Japanese buyers was that contract prices would be higher than the spot delivery rates, but the reality in 2015 was the opposite (Figure 1 below) where average prices of futures contracts were $7.87 per MBTU while spot contracts prices were $8.45 per MBTU; and in 2017 the spot delivery price was $6.58 while the contract price to Japan was $7.16 per MBTU. As of May 2018, prices of both spot and contract
were equal at $9.56 per MBTU.
Considering that the majority of global LNG projects - outside the United States - continue to attract capital based on quantity contracting under long-term contracts linked to oil prices, it is no wonder that LNG re-export volumes are very low. The LNG re-export volumes worldwide dropped from 5.6% of total Qatari exports in 2016 to 3.4% in 2017. Most of the re-export transactions occurred in European markets (Figure 2 below). Although the increase in LNG re-export volumes may theoretically reduce the final consumer price, especially in areas where the traded volume is small, such as Asia, particularly Japan, the most recent figures for 2017 indicate that profits from such deals are highly questionable. Therefore, the most important qualifier for Japanese LNG buyers is to enhance flexibility and dialogue with sellers on the quantities and prices of spot delivery.
Figure 1 for Box 1-11: Premium or discount of contract vs spot deliveries of LNGContracted Cargo Price3-Moving Averge (R-Axis)
Spot Arrival Price
0
2
4
6
8
10
12
14
16
$ pe
r mm
Btu
Mov
ing
Aver
age
-4
-3
-2
-1
0
1
2
3
May
14
Jun
14Ju
l 14
Aug
14Se
p 14
Oct
14
Nov
14
Dec
14
Jan
15Fe
b 15
Mar
15
Apr 1
5M
ay 1
5Ju
n 15
Jul 1
5Au
g 15
Sep
15O
ct 1
5N
ov 1
5D
ec 1
5Ja
n 16
Feb
16M
ar 1
6Ap
r 16
May
16
Jun
16Ju
l 16
Aug
16Se
p 16
Oct
16
Nov
16
Dec
16
Jan
17Fe
b 17
Mar
17
Apr 1
7M
ay 1
7Ju
n 17
Jul 1
7Au
g 17
Sep
17O
ct 1
7N
ov 1
7D
ec 1
7Ja
n 18
Feb
18M
ar 1
8Ap
r 18
May
18
Jun
18Ju
l 18
Source: Website of Japanese Ministry of Economy, Trade and Industry, http://www.meti.go.jp/english/ accessed Sept 7th, 2018 and 3 months moving average for the difference between spot and contracted prices
Figure 2 for Box 1-11: Re-exports of LNG by exporting region and volumesEurope Developing Asia Developed Asia Americas
2013 2014 2015 2016 2017
Met
ric to
n
0
1
2
3
4
5
6
7
0.2 0.1 0.4 0.3 0.20.1 0.20.5 0.5 0.80.1 0.1 0.1
4.0
6.0
2.53.6
1.6
Source: Various reports of International Group of LNG importers

35
Part 1 - Economic Outlook 2018-2020
Box 1-12: Qatar Short-term Economic Prospects 2018 - 2020
Main indicators Actual Preliminary Forecasts QEO Average2016 2017 2018 2019 2020 2018-2020
GDP and economic performance Growth rates (%) unless otherwise specified Real GDP (at 2013 constant prices) 2.1 1.6 2.6 2.9 3.1 2.8Hydrocarbon GDP -0.9 -0.7 -0.3 0.2 0.8 0.3Non-hydrocarbon GDP 5.3 3.8 5.2 5.2 5.1 5.17Real GDP per capita -4.9 -2.4 0.8 1.1 1.4 1.1Total GDP deflator (period average) -8.1 8.3 10.9 3.5 0.7 5.0Nominal GDP (QR bn) 552.3 607.6 691.3 736.0 764.3 730.5Growth in nominal GDP -6.2 10.0 13.8 6.5 3.9 8.0Central Government Percent of Nominal GDP (%) unless otherwise specifiedTotal revenue 31.0 26.5 32.7 32.8 32.8 32.8 MoF-classified Hydrocarbon revenue 14.7 13.8 18.3 17.2 16.4 17.3 Direct crude oil revenue 8.9 7.3 11.2 10.3 9.7 10.4 Direct LNG revenue 5.8 6.5 7.1 6.9 6.7 6.9 MoF-classified Non-hydrocarbon revenue 16.3 12.8 14.5 15.6 16.4 15.5 Tax revenue 2.5 2.3 2.7 3.7 4.2 3.5 Other revenue 3.0 2.4 3.6 2.9 3.4 3.3 Dividend income (QP) 10.8 8.1 8.2 9.0 8.8 8.7Total expenditure 40.2 32.2 29.4 27.7 26.6 27.9 Current expenditure 21.6 18.5 15.3 15.1 15.2 15.2 Capital expenditure 18.6 13.7 14.1 12.6 11.4 12.7Overall deficit(-)/surplus(+) -9.2 -5.7 3.3 5.1 5.9 4.8Investment and Saving Percent of Nominal GDP (%) unless otherwise specified Investment 48.9 44.6 40.1 38.6 37.4 38.7 Government fixed investment 18.6 13.7 14.1 12.6 11.4 12.7 Private and SOE fixed investment 30.3 30.9 26.0 26.0 26.0 26.0 Hydrocarbon fixed investment 2.7 3.4 3.4 4.5 5.3 4.4 Non-hydrocarbon fixed investment 27.6 27.5 22.7 21.5 20.7 21.6Gross domestic savings 54.8 58.4 61.1 58.2 54.2 57.8Total savings 48.9 44.6 40.1 38.6 37.4 38.7 Foreign savings (= -CA balance) 5.5 -3.8 -9.2 -8.9 -7.9 -8.7 Gross national savings 43.4 48.5 49.3 47.5 45.3 47.4 Public 9.3 8.0 17.5 17.7 17.3 17.5 Private 34.1 40.4 31.9 29.8 28.0 29.9External Sector Percent of Nominal GDP (%) unless otherwise specifiedCurrent account balance (% of GDP) -5.5 3.8 9.2 8.9 7.9 8.7 Exports of goods & services (US$ bn) 72.5 85.2 107.5 111.4 111.4 110.1 of which hydrocarbon exports 46.5 56.6 74.7 77.2 75.6 75.8 Exports of goods & services (% of GDP) 47.8 51.0 56.6 55.1 53.1 54.9 Imports of goods & services (US$ bn) 63.5 62.2 67.6 71.8 76.2 71.9 Imports of goods & services (% of GDP) 41.8 37.3 35.6 35.5 36.3 35.8Gross international reserves ex. QIA (US$ bn)1 31.6 14.8 25.9 29.2 30.3 28.4Gross Reserves (ex. Gold) (months of imports) 5.1 2.3 3.6 3.8 3.8 3.7Memorandum items:Exchange rate (QR/$ average) 3.64 3.64 3.64 3.64 3.64 3.64Crude oil export Price ($/bbl) 2 43.1 53.1 69.8 68.4 67.4 68.5Natural gas price ($/mmbtu) Japan 2 6.9 8.0 8.8 8.9 9.1 8.9Population (year average, mn) 2.62 2.72 2.77 2.82 2.87 2.82
1. Including Gold and for 2018 (updated monthly) so this reserve is up to Aug 2018 2. Forecasts are based on the average of LNG and crude oil price published by the World Bank and IMF adjusted for Qatari onshore and offshore prices Note: Totals may not sum precisely from components due to rounding Source: Real GDP and Fiscal data were estimated based on discussions with the MOF using PSA macroeconomic framework model


37
Part 2- Economic Performance 2017
Performance SummaryThe State of Qatar achieved real GDP growth of 1.6% in 2017 compared to 2.1% in 2016, maintaining its moderate growth rate since 2012 (Table 2-1). As in 2016, the economic growth in 2017 comes from the non-oil (non-hydrocarbon) sectors, primarily from the construction sector 1.6 percentage point and the service sector 0.2 percentage point. The oil and gas hydrocarbon sector witnessed a negative growth rate of 0.7 percentage point, resulting from: (1) the obligatory curbing of crude oil production as prescribed by OPEC and effective January 2017; and (2), from a reduction of gas production and its derivatives due to routine maintenance operations.
Table 2-1: Qatar Key Economic Indicators 2016 2017Real GDP Growth (Constant 2013=100) 2.13 1.58 Nominal GDP Growth (%) 6.19- 10.02 Nominal GDP (Hydrocarbon) )%) 25.81- 19.51 Nominal GDP (non-Hydrocarbon) )%) 5.61 6.00 Rate of Change (CPI %) 2.66 0.46 Current Account Balance (as % of GDP) 5.45- 3.85Overall Fiscal Balance (as % of GDP) 9.24- 5.69-Crude Oil Price ($US/barrel) 43.06 53.11 Source: PSA, MOF , and QCB
The development of nominal GDP at current prices achieved a rate of change of around 10% in 2017 compared to its negative rate of change of 6.2% in 2016 due to the additional revenues from Qatar's oil sales at higher prices in the international market (from an average per-barrel of $43.1 in 2016 to $53.1 in 2017).
The annual rate of change in the Consumer Price Index (CPI) during 2017 witnessed a significant decrease compared to the previous year, falling from 2.7% in 2016 to 0.46% in 2017 due to the reduction of rental and housing costs, which represents about 22% of the total basket of CPI, as well as a significant decline in the price of entertainment, restaurants, and hotel rooms due to
the decrease in the number of tourists arriving from Gulf countries resulting from the economic embargo imposed on the State of Qatar by several of its neighbors since June 2017. On the other hand, the increase in oil prices in world markets led to a rise in the rate of change of the Producer Price Index (PPI), which reached 19.8% in 2017 compared to a negative rate of change of 22.8% in 2016.
Furthermore, the increase in oil revenues in 2017 has led to a marked improvement in the performance indicators of fiscal balance and balance of payment (BOP) compared to their levels in 2016. The most recent preliminary data of the State of Qatar’s 2017 budget provided by the Ministry of Finance indicate a decline in the level of the budget balance (revenue minus expenditure) for 2017 to reach a deficit of QR34.6 billion (Qatari Riyals), equal to 5.69% of the current GDP, compared to a shortage in 2016 of about QR51billion, which was equivalent to 9.24% of current GDP.
In terms of the performance of BOP accounts, the Qatar’s commodity exports achieved a positive growth rate of 17.8% in 2017 compared to a negative growth rate of 25.9% in 2016, which improved the trade balance to produce a higher surplus of about 21.9% of the current GDP compared to the surplus achieved in 2016 of 16.6%. Thanks to the surplus of the trade balance, the current account of the BOP shifted from a deficit of 5.45% of GDP in 2016 to a surplus of 3.85% in 2017, albeit income and services balances continued to be in a deficit status in 2017 due to the continued outflow of corporate income and foreign remittances, as well as a decline of Qatari income from abroad.
Performance of GDP by production Two methods are utilized to measure the Qatari economy via estimating its Gross Domestic Product (GDP), namely the production method and the expenditure method. While the production method
Part 2- Economic Performance for 2017 and the first half of 2018

38
Qatar Economic Outlook 2018-2020
estimates the output for each economic sector’s activities, the expenditure method compiles the sum of all final goods and services purchased in the economy whether produced domestically or imported. This section briefly describes the economy from the production side, which consists of two main sectors: (1) the hydrocarbon sector, which includes the activities of the mining sector and extractive industries (mining and quarrying) for the production of oil and gas and their derivatives of Liquefied Natural Gas and condensates; and (2) the non-oil sector (non-hydrocarbon), which
Figure 2-1: Nominal GDP (US$ Billion and QR Billion)
394
221 164
196
356
368 388
412
$108 $61 $45 $54
$98
$101 $107 $113
751
589 552
608
$206
$162 $152
$167
100
200
300
400
500
600
700
800
2014 2015 2016 2017
Mining GDP Non-oil GDP GDP$
Billi
on
Source: PSA-National Accounts Bulletin 2018
consists of the rest of the economic sectors, the most important of which are manufacturing, construction, transportation, and public services provided by government. It should be noted, however, that the manufacturing industry includes activities integrally related to the hydrocarbon sector, namely oil refining, petrochemicals, fertilizers, and cement. Thus, the growth in GDP of the main sectors and sub-sectors will be used to assess macroeconomic progress during 2017.
The preliminary national account statistical data for 2017 indicate that the value of GDP at current prices (nominal) during the year 2017 amounted to about QR608 billion (US$167 billion). The contribution of the oil sector reached about US$53.8 billion, or 32.3%
of the total current GDP, while the non-oil sector contributed by about US$113 billion, or 67.7% of total current GDP (Figure 2-1). Thus the rate of change of nominal GDP achieved a positive 10% in 2017 compared with negative rates of change in 2016 and 2015 (6.2% and 21.6% respectively). In fact, the positive rate of change of nominal GDP in 2017 and the first half of 2018 is due to the increase in oil and gas prices in the world market compared with the previous two years, which contributed to the conversion of the negative rate of change in the deflator of oil and gas sector (hydrocarbon) from negative 25.1% in 2016 to a positive rate of change of 20.4% in 2017 (Table 2-2). It also contributed to easing the pressure on the growth of non-oil GDP deflator (non-hydrocarbon) resulting from the repercussions of the economic embargo imposed on the State of Qatar by several neighboring countries, to achieve an increase of 2.1%.
Moreover, the positive nominal and real GDP growth combined with the relative decline in population growth rates from 7.4% in 2016 to 4.5% in 2017, thereby reducing the rate of decline in real per capita income (real GDP) to negative 2.4% in 2017 compared to a negative 4.9% in 2016. However, at US$63,844 per person in 2017, Qatar’s nominal per capita income still remains one of the highest in the region as well as globally. Therefore, excluding the impact of price changes, the real growth rate of GDP (constant 2013=100) reached 1.6% in 2017 compared to 2.1% in 2016, continuing the trend of decline in the last four years (Figure 2-2).
Figure 2-2: Nominal and real GDP growth (%)
6.4 3.8
21.6-
6.2-
10.0 11.5
17.9
4.4 4.0 3.7 2.1 1.6 2.0 2.5
25.0- 20.0- 15.0- 10.0- 5.0-- 5.0 10.0 15.0 20.0
2013 2014 2015 2016 2017
2018
Q1 Q2
Nominal Real
Source: PSA-National Accounts Bulletin 2018
Table 2-2: Nominal and Real GDP and the GDP Deflator
2014 2015 2016 2017 Nominal GDP (QR billion) 751 589 552 608 Real GDP (QR billion) 752 780 796 809 GDP deflator (Index) 99.8 75.5 69.4 75.1 Mining and quarrying deflator 98.4 55.5 41.6 50.0 Non-Mining and quarrying deflator 101.4 96.4 96.6 98.7 Crude Oil price ($/barrel) 96.8 51.1 43.1 53.1 GDP deflator (%) 0.2- 24.3- 8.1- 8.3 Mining and quarrying deflator (%) 1.6- 43.6- 25.1- 20.4 Non-Mining and quarrying deflator (%) 1.4 4.9- 0.3 2.1 Crude Oil price (%) 10.1- 47.2- 15.7- 23.3

39
Part 2- Economic Performance 2017
It is noteworthy that the magnitude of the difference between the value of real GDP and its growth versus the nominal GDP and its rate of change (growth) over the past four years in Qatar has been highly influenced by the rate of change in the GDP deflator, which measures the overall price inflation or deflation in an economy. As shown in Table 2-2, the rate of change of GDP deflator in Qatar has experienced sharp fluctuations since 2014; it has decreased from a miniscule negative growth of 0.2% in 2014 to a high negative growth of 24.3% in 2015, and continued this decline to achieve minus 8.1% in 2016, before converting to positive increase of 8.3% in 2017. These changes in the GDP deflator are mainly creditable to the volatility of the hydrocarbon deflator, which in turn has tracked the rate of change in crude oil prices since 2014.
Therefore, the rate of change of GDP deflator for each economic sub-sector for the year 2017 is used herein to assess how the twin factors of blockade measures and the increase in crude oil prices have impacted the development of Qatar’s main economic sub-sectors. As shown in Figure 2-3, the GDP deflator for the hydrocarbon sector (mining and quarrying) has increased by 20.4%, which is attributable to the increase in crude oil prices in world markets of about 23.3%. The GDP deflator for the manufacturing sector has also improved positively by 11.6%, reflecting the dominance of oil-related activities including refining and petrochemical manufacturing. On the other hand, the
Figure 2-3: Rate of Change of GDP deflator for 2017 (%)
2.7 20.4
11.6 2.2
0.6 2.6 2.7
(6.1) 0.0
(3.5)(3.4)
2.6 2.4 2.6 2.6 1.2
1.2
10- 5- 0 5 10 15 20 25
Agriculture, forestry and fishing
Mining and quarrying
Manufacturing
Elec&Water
Construction
Whole Sale
Transportation and storage
Food services
Information and communication
Financial and insurance activities
Real estate activities
Professional, scientific
Public services
Education
Health Services
Art & Entertainment
Household services
Source: Planning and Statistics Authority
GDP deflators for the industries of hotels, restaurants, real estate, finance, and insurance have shrunk due to the repercussions of the embargo. The rest of the sectors witnessed increases of varying rates of less than 3% due to changes in both the prices of materials produced by local industries and the costs of intermediate goods and raw materials required by the production process.
Performance of GDP by expenditureThis section briefly describes the GDP by expenditure method (household consumption expenditure, government consumption expenditure, capital formation (investment), and net exports (exports minus imports). To review, the expenditure method provides a mechanism to track the trend and pattern of consumption and savings in the country and to estimate their marginal propensities that can be used to determine the fiscal multipliers. The fiscal multiplier is used to measure, for instance, the effect of spending a QR1 on the level of income (GDP), which helps policy makers to monitor and evaluate the effectiveness of macroeconomic policies in achieving economic stability and advancing macroeconomic and social development processes.
The International Monetary Fund (IMF)5 has already estimated the fiscal multipliers for the GCC countries in 2015 based on historical data (1990-2008) to be 0.7 for current expenditure, 1.2 for government consumption, and 1.4 for government investment spending, meaning that when the government spends one Qatari riyal as investment expenditure, local production in terms of GDP or income will increase by 1.4 Qatari riyals. However, if the same Qatari riyal spends in the field of government consumption, it will increase the GDP by 1.2 Qatari riyals. Therefore, the effect of the government expenditure on investment or capital formation generates more economic growth than if it is spent on current spending,6 a limited 0.7 Qatari riyals due to the lower impact of transfer and subsidies on GDP growth as well as the leakage of some of the current expenditure out of the country via foreign labor remittances or imports.
Within the above context, Figure 2-4 illustrates the share of each expenditure component of total nominal GDP. The highest share came from the export component, which is mostly oil and gas, and constitutes 51% of total nominal GDP with an annual
5Cerisola, M; Chadi Abdallah, Victor Davies, and Mark Fischer, 2015, “Assessing the impact of Fiscal Shocks on Output in MENAP Countries”, IMF working paper.6Current spending is the sum of government consumption expenditure, and subsidies and transfers

40
Qatar Economic Outlook 2018-2020
Figure 2-4: Nominal Expenditure Side GDP, QR Billion
271.0 310.1
-199.1 -214.6 -233.0 -215.7 -231.1 -226.4
76.5 72.7
68.0
57.1
47.7 51.0
0
10
20
30
40
50
60
70
80
90
-300.0
-200.0
-100.0
-
100.0
200.0
300.0
400.0
500.0
600.0
2012 2013 2014 2015 2016 2017
Household Consumption Government ConsumptionInvestment ExportsImports Exports (% of GDP) (R-Axis)
As %
of G
DP
QR
Billi
on
Source: Planning and Statistics Authority
growth rate of 17.5% in 2017, while imports account for 37% of total GDP, indicating a high dependency ratio on imports and the limited basis of local production. The second share came from the capital formation (investment) as the most effective driving force for economic growth with a total nominal GDP share of 44.6% in 2017. Such a high percentage reflects the government’s policy toward increasing investment in economic and social infrastructure, to providing logistics support for the private sector to develop major real estate projects, and to providing low-cost feedstock materials for downstream manufacturing of products derived from the hydrocarbon sector, which are thereafter used in other production processes in the fields of manufacturing, electricity production, or fertilizers). Concerning household expenditure (private consumption), it maintained a reasonable growth rate of 5.3% in 2017, reaching 24.6% of total GDP compared to 25.7% in 2016; this suggests a higher level for the marginal propensity to consume, undoubtedly related to the high wages offered to both public and private sector employees.
Regarding the contribution of each expenditure component to the total rate of change of nominal GDP, again the export sector led the increase of rate of change of nominal GDP in 2017 with a contribution rate of 8.44 percentage points to the total rate of change of nominal GDP of 10%, followed by the rate of change of private consumption of 1.4 percentage points and imports by about 0.8 of a percentage point as shown in Figure 2-5. The contribution of gross capital formation (investment) in the rate of change of nominal GDP is 0.2 percentage point. Perhaps the reason for this is that using nominal capital formation does not provide a good indicator, in particular to the capital formation component is used statistically as “residual” by National Account Section at PSA to absorb statistical, computational differences (i.e.,
so that the GDP by the production method is equal to the GDP by the expenditure method, which varies from one year to another, causing the contribution of capital formation to change).
Figure 2-5 : Contributions to rate of change of nominal GDP by expenditure (points)
2.61.5
-6.5
2.3
8.8
-12.3
-2.6
12.5
3.2 2.5 0.9
-2.3
1.5 1.5 5.2
-2.2 -2.5
1.7
-23.2
1.8 1.4
-0.8 -1.9
8.4
0.8 0.2 1.2 2.1 0.4
-2.7
-30-25-20-15-10-5051015
2012 2013 2014 2015 2016 2017
Household Consumption Government Consumption InvestmentExports Imports
Source: Planning and Statistics Authority
Therefore, when removing the impact of current prices from the GDP using the expenditure approach, the real capital formation shows a growth rate of 1.3% compared to 0.4% in nominal prices. Private consumption maintained its growth rate of 4.4% at constant prices compared to 5.3% in nominal prices, mainly due to the spending of the population and in particular the expatriate community of non-Qataris. As regards government consumption, and despite the continued expansion of social services, defense, security, and other services, its growth rate was negative during 2017 by 6% in constant prices and 4.3% in nominal prices due to the contraction of government spending compared to previous years.
Figure 2-6: Total gross savings as percentage of GDP (%)
60.0 60.3 58.2
55.7
45.6 43.4
48.5
35
40
45
50
55
60
65
2011 2012 2013 2014 2015 2016 2017
Source: Planning and Statistics Authority
Based on the interaction between the supply and demand forces in the economy (Figure 2-6), the share of gross domestic savings as a percentage of total nominal GDP grew by 5 percentage point in 2017, reaching 48.5% of total nominal GDP compared to 43.4% of GDP in 2016.

41
Part 2- Economic Performance 2017
However, although the rate of savings as a percentage of GDP declined during the period 2011-2017, it remains among the highest saving rates in the world and always gives an indication about the level of current and capital account as well as gross capital formation. Although the above indicators are important, they should be used as indicators rather than as absolute figures and should be treated with caution as they may be subject to computational errors when estimating GDP in the form of expenditure.
Sectoral Progress and Diversification Potentiality
Due to the oil price changes, the relative importance of the hydrocarbon sector versus the non-hydrocarbon sector has slightly changed in terms of the structure of real and nominal GDPs in 2017. The share of the hydrocarbon sector in the formation of real GDP has declined from 49.5% in 2016 to 48.4% in 2017, in favor of an increase in the percentage of the non-hydrocarbon sector, which rose from 50.5% in 2016 to 51.6% in 2017. However, the share of the hydrocarbon sector in the structure of nominal GDP increased from 29.7% in 2016 to 32.3% in 2017, reducing the percentage of the non-hydrocarbon sector to nominal GDP at 67.7% in 2017 compared with 70.3% in 2016
Figure 2-7: Hydrocarbons and non-hydrocarbons, share in real and nominal GDP (%)
ConstantCurrentConstantCurrentConstantCurrentConstantCurrentConstantCurrentConstantCurrent
58.0 58.1 55.7 55.7 52.5 53.2 37.5
51.1
29.7 49.5
32.3 48.4
42.0 41.9 44.3 44.3 47.5 46.8 62.5
48.9
70.3 50.5
67.7 51.6
0102030405060708090100
2012 2013 2014 2015 2016 2017
non-hydrocarbons Hydrocarbons
Source: Planning and Statistics Authority
This simple comparison, as shown in Figure 2-7, underscores the reliance of the Qatari economy to the oil market, but it also indicates a potential to increase opportunities for economic diversification and to reduce dependence on the oil sector. All sub-sectors within the non-hydrocarbon sector have expanded and have continued to lead economic growth during 2013-2015 with an average of 9.6%. While the growth rate in 2016 and 2017 reached 5.3% and 3.8%, respectively, in spite of the blockade’s repercussions on some areas within the service sector. However, it is essential to note that the slowdown in the non-hydrocarbon sector in 2016-2017
can be partly attributed to a contraction in current expenditure, partly to a drop in investor enthusiasm, and finally a deceleration in remunerative project contracts. The decline in government spending on goods and services by about 25% in 2016 has had a significant impact on the expansion of the overall trade activities (see public financial accounts).
Furthermore, the drop in oil prices in the international market since mid-2014 and the subsequent decline in government procurements are reflected rapidly in the manufacturing sector in 2015 through the decrease in the business confidence index (BCI) and the start of accumulation of stockpiles resulting from the decline in demand (Figure 2-8). The slowdown in remunerative project contracts (Figure 2-9) according to MEED’s June 2018 data has led to a slowing in the pace of construction sector growth from 28.5% in 2016 to 17.5% in 2017, as discussed below. However, the extended duration of construction projects will have a more significant impact on medium- and long-term growth and the pace of expansion in the sector.
Figure 2-8: Business Confidence Index and inventory growth
Business Confidence Index Inventory size of finished goods
Inve
ntor
y Po
int
BCI p
oint
2015 2016 2017 2018Q1 Q1Q2 Q2Q3 Q4 Q1 Q2 Q3 Q4 Q1 Q2 Q3 Q4
024681012141618
0369
121518212427
Source: Planning and Statistics Authority
Figure 2-9: Projects contracts by economic sector
-4
1
6
11
16
21
26
31
2015 2016 2017 2018
Billi
on D
olla
r
Water Transport Power Oil Industrial
Gas Construction
Source: MEED as of June 2018 and Planning and Statistics Authority

42
Qatar Economic Outlook 2018-2020
Although the services sector continued to be the critical driver of economic growth during 2012-2015, its contribution to GDP growth crashed during 2016 and 2017 to reach 0.4 percentage point and 0.2 percentage point, respectively, compared to the greater contribution rates of previous years when services contributed an order of magnitude higher to overall GDP growth as shown in Figure 2-10. This sharp decline in the service sector’s contribution allowed for the construction sector to take the lead in its contribution to total economic growth by reaching 1.6 percentage point in 2017 compared to 2.1 percentage point in 2016. The contribution of the manufacturing sector to the overall growth during 2017 also improved slightly, to reach 0.3 percentage point, despite its precipitous decline in 2016 from previous years, when it fell to 0.05 percentage point. On the other hand, the contribution of the oil and gas sector (hydrocarbons) to macroeconomic growth during 2017 continued a decline that started in 2014, to a negative 0.36 percentage point, a slight improvement over 2016 when the sector’s growth decreased to 0.5 percentage point primarily due to the decline in the production of oil condensates.
Figure 2-10: Sector contribution to GDP growth (percentage point)
0.41.0 1.2 1.3
2.11.6
2.32.8 2.6 2.2
0.40.2
4.74.4
4.03.7
2.11.6
-1
0
1
2
3
4
5
6
2012 2013 2014 2015 2016 2017
Perc
enta
ge P
oint
Services Manufacturing Construciton
Utilities Mining GDP
Source: Planning and Statistics Authority
Figure 2-11: Real GDP Growth by Sector (%)
22.9 20.4
28.5
17.5
11.5
5.5 4.2 4.4
0.4 1.0
8.9
11.5 10.4
7.8
2.2 2.0
-5-214710131619222528
2012 2013 2014 2015 2016 2017
8.8
21.2
Mining Construciton Manufacturing Services
%
Source: Planning and Statistics Authority
Accordingly, one can conclude that the construction sector was the highest growing sector among the
non-oil sectors (non-hydrocarbon) during the past years, with a growth rate of 17.5% in 2017, followed by services and manufacturing sectors by 2% and 1%, respectively (Figure 2-11).
Non-Oil Sector Development
Before going into detail about the level of development of the non-oil sector, it should be noted that since August 2016, the National Accounts Section of the Planning and Statistics Authority has adopted the International Standard Industrial Classification (ISIC4), which contains greater details for the service sector. As a result of this shift, some sub-groups of the service sector have been relabeled from what they were named in previous QEO versions.
The services sector as one of the main sectors of non-oil activities witnessed a decline in 2016 and 2017 compared with 2015 as shown in (Figure 2-11). This decline is due to the service sub-sectors having slowed during the period with the exception of the sub-sectors that benefited from government support in 2016: arts, entertainment, transport, storage, health, social work, and education. However, these subsidized sub-sectors fell behind in their growth in 2017 except for the education sector, which achieved an increase of 6.5%.
As figure 2-12 indicates, financial services and insurance continued their rapid growth, increasing by 8.9% and 7.9% in 2016 and 2017 respectively. Such growth can be attributed to the provision of additional credit in response to requests submitted by the public sector as well as real estate developers and contracting companies working on large infrastructure projects, which having been granted subsequently stimulated high growth in insurance markets. The growth of the real estate sector followed a similar trend of 6.2% and 4.4% during the two years due to the significant increase in the delivery
Figure 2-12: Growth of service sector components (%)
Whole Sale Transportation Food services Information and IT
11.7
6.3
10.7-
1.3-
18.3
2.3-
1.9
2.0-
8.9 7.9
6.2
4.45.5
2.5- 1.3-
11.614.8
21.5
3.3-1.1-
-15-12-9-6-303691215182124
2014 2015 2016 2017
Financial & insurance Real estate Professional & scientific Public services
Education Health Services Art & Entertainment Household services
Source: Planning and Statistics Authority
of new housing units. The delivery of real estate in Doha and its suburbs, as well as in Qatar’s smaller towns,

43
Part 2- Economic Performance 2017
together with services related to these properties, contributed to the enhancement of the sector.
The recovery in the health services sector (which also includes social security) was also seen in 2016 when it grew by 21.5%, but by 2017 it fell by minus 3.3%. Education, professional, scientific and technical activities witnessed a significant recovery during the period 2014-2017 as a result of the exemption of the education sector from the requirements of having a Qatari partner as well as the continuation of government support to improve the quality of education. Educational sector growth can also be partly attributed to the success of the Qatar Science and Technology Park (QSTP), not only because members increased by 10 new startup companies but also because of the ramping up of the pace of development of technological projects. Thus, the growth of the education sector reached 8.4% in 2016 and 6.5% in 2017 while the growth of professional activities amounted to 5.5% in 2016 but partially decreased in 2017 by about 1.5%.
The growth in the public services sector declined in 2016 and 2017 by 2.5% and 1.3%, respectively. On the other hand, household domestic services continued to grow by 7.9% and 3.7% during the two years as a result of the increase in the number of independent households.
However, the decline in consumer confidence in Qatar and the Gulf region in general has contributed to a significant slowdown in two important sub-sectors: wholesale and retail trade as well as hotel and restaurant services. Growth in the Qatari wholesale and retail trade sector plunged from 6.3% in 2015 to -10.7% in 2016 and further to -1.3% in 2017, mainly driven by lower sales volumes of cars and major household appliances (refrigerators, washing machines, etc.) as consumers postponed purchases during the period of uncertainty.
As a result of the decline of oil prices in 2014, most of the oil-exporting countries, including the GCC countries, witnessed a dramatic reduction of their oil revenues which led many of them to implement a series of austerity measures during 2015-2016. Those measures were affecting public and private sector incomes, which in turn reduced the level of public and private consumption, especially tourism and trade sectors across the GCC countries. In Qatar, as an example, the hotel and restaurant services sector had been significantly affected where its annual growth rate was reduced from 18% in 2014 to negative rates in 2015 and 2016 before achieving positive growth of 1.9% in 2017. The 2017 increase was occurred because of measures were taken by hoteliers and restaurants to reduce costs, thereby producing relative stability in the revenues of hotels and restaurants.
In terms of the contribution of service’s sub-sectors to the growth of total service sector GDP, the financial services and insurance sector was the main driver of service sector growth in 2016 and 2017, contributing 1.6 and 1.5 percentage points, respectively, to the overall expansion of services of 1.98% (Figure 2-13). Real estate services accounted for the second largest contributor to service sector growth by about 0.8 and 0.6 percentage points in 2016 and 2017, respectively. The education sector ranked third in terms of contribution, reaching 0.30 and 0.28 percentage points for the same years, respectively. The rest of the service sector components witnessed a decline in 2017 compared to 2016 and most of them with negative values. However, the decline in the contribution of the wholesale and retail trade sub-sector to the growth of the services sector in 2017 is less than the decline in 2016.
Figure 2-13: Contribution of service sector components to its total growth (%)
7.8
2.2 1.98
0
1
2
3
4
5
6
7
8
9
10
11
2014 2015 2016 2017
Household services Art & Entertainment Health Services Education
Public services Real estate
Food services Transportation Whole Sale Services (Growth %)
10.4
Professional & scientific
Financial & insurance
Information and IT
Perc
enta
ge P
oint
s and
%
2.3 1.2
2.3
1.5
1.6 1.54
1.3
1.3
0.8 0.61
0.4
0.1
0.3
0.28
Source: Planning and Statistics Authority
In the commodities sector, including construction and manufacturing, the real GDP of the construction sector has grown rapidly over the past few years thanks to the massive investment in infrastructure and real estate in Qatar, recording 17.5% in 2017 (Figure 2-14).
Figure 2-14: Construction sector values & growth
48
58
75
88
22.9 20.4
28.5
17.5
024681012141618202224262830
0
10
20
30
40
50
60
70
80
90
2014 2015 2016 2017
Growth %Construction Values
%
QR
Billi
on
Source: Planning and Statistics Authority

44
Qatar Economic Outlook 2018-2020
Figure 2-15: Real output of the manufacturing sector
Manufacturing Values
77 80 81 81
4.2 4.4
0.4 1.0
0
2
4
6
0
10
20
30
40
50
60
70
80
2014 2015 2016 2017
Growth %
QR
Billi
on
%
Source: Planning and Statistics Authority
There are several major projects under construction including Qatar Rail, roads, bridges, the real estate developments of Lusail City and Msheireb Downtown Doha, along with a number of substantial shopping malls and a large number of hotels, schools, and hospitals. On the other hand, the manufacturing sector was able once again to achieve a real growth in 2017 by about 1% after falling significantly to 0.4% in 2016 (Figure 2-15) as petrochemical and fertilizer companies reduced production volume in 2016 may be due to low prices for their products as international oil prices fell. However, production expanded through traditional production lines of refineries and fertilizer, where refinery production grew by 12.8% in 2016, while after the addition of Ras Laffan No. 2, it grew by an additional 36%. Meanwhile, fertilizer production fell by 2.6% in 2016, countered by growth of 5.9% in 2017. On the other hand, other manufacturing industries declined by 2.8% in 2017 compared to their positive growth of 1.3% in 2016.
Labour force and skill level
The most recent Labor Force Survey of 2017 indicates that skilled and highly skilled workers are well represented in the composition of the Qatari economy (Figure 2-16), reaching 612.5 thousand which represents about 31.4% of the total non-Qatari workforce (1.95 million), resulting in significant economic returns. Although the economy needs unskilled labor in many productive and service
Figure 2-16: Non-Qatari employment skills composition (%)
Highly skilled Skilled Semi-skilled Unskilled
15.6 15.9 15.6 14.1 15.9 16.2
11.6 12.3 15.6 14.7 15.1 15.2
48.8 48.3 47.4 51.6 49.2 49.0
24.0 23.5 21.4 19.6 19.7 19.6
0
10
20
30
40
50
60
70
80
90
100
2012 2013 2014 2015 2016 2017
Source: Planning and Statistics Authority - Table 87 of 2017 Labor Survey
sectors, this category has remained near its lowest level since the beginning of the Labor Force Survey in 2008, reaching 19.6% in 2017 compared to 24% in 2012.
Given the size of specific business needs as well as projects being implemented during the current and future periods, the slight increasing trend that occurred in 2017 is expected to continue for the ratio of highly skilled labors who are at the forefront of building a knowledge-based economy. This goes hand-in-hand with Qatar seeking to achieve its goals for a diversified and sustainable economy as set forth in the Second National Development Strategy (2018-2022).
PricesConsumer Price Index
Figure 2-17 depicts the pattern of change in the Consumer Price Index (CPI) during the period 2015-2018, which in general reflects the effects of both internal and international factors on domestic prices and on the cost of living in Qatar. With regard to the internal factors that would have contributed to the increase in the CPI from 1.8% in 2015 to 2.7% in 2016, these were mainly a consequence of the impact of governmental administrative measures for 2016, when subsidies were partially removed on water and electricity as well as on fuel, coupled with a reduction of financial support to private schools. However, once consumers began to adapt to such reforms during the first half of 2017, the CPI commenced its fall from 2.67% in 2016 to 0.73% during Jan-May of 2017, with a maximum of 1.2% in January and a minimum of 0.1% in May. However, due to the blockade measures, it increased again from 0.1% in May to 0.86% in June 2017, reflecting the overreaction of the people to the blockade measures by stockpiling food commodities, leading to soaring prices of many basic products due to their shortage at local markets.
However, the government’s measures to reduce the effects of the embargo directly contributed to the CPI’s continuing downward trajectory which intensified by decreases in the Qatari rental market and housing prices, as well as a reduced demand for hotel services, restaurants, and entertainment, all of which can be attributed to the drop in the number of resident high-income expatriates and a corresponding low number of visitors and tourists from neighboring countries. Thus reducing the average CPI index from 0.73% during the period (January-May 2017) to an average of 0.17% during the period (June-December 2017). On the same trend, the CPI index fluctuated between the ups and downs during the period (January - October 2018), with an average of 0.44% between a maximum of 1% and a minimum of negative 0.25%.

45
Part 2- Economic Performance 2017
Using the General CPI to measure the cost of living in the State of Qatar is inadequate due to limited domestic production and a high dependency on the international market for the majority of commodities consumed; moreover, several of the CPI components do not reflect the underlying causes of inflation. Therefore, many countries exclude food and energy from the CPI basket when calculating core inflation due to their highly volatile behaviors. For the State of Qatar; these two items of food and energy are always kept in the Core CPI basket to reflect the impact of imported inflation given that a high proportion of Qatar’s commodities derive from international markets. Instead, the service component of the cost of renting houses is excluded when calculating Qatar’s core inflation due to its sizeable weight, which reaches 22% of the CPI basket.
Within this context, Figure 2-17 portrays the pattern of the rate of change of the amended CPI (Core CPI) during 2015-2018 after excluding the component of housing costs, which is known globally as core inflation. During the first half of 2017, the core inflation witnessed a significant decline reaching less than 1% in May (0.81%) before it increased to 2% in May 2017 as the result of the total restriction on exports from neighboring countries - air, land, and sea – which led the State of Qatar to work towards finding alternatives in the short and medium term. In the first place, air cargo is normally heavily utilized to supply the Qatari market with essential commodities. As soon as this trialing situation started to be addressed, and alternative solutions found (including the launching of operations at Hamad Port), the rate of core inflation dropped from 2% in June to 0.75% in August 2017. It is worth mentioning that the trend of core inflation has now returned to its usual pattern by rising during the first quarter and then decreasing in the second quarter; it increases again in the third quarter before starting to fall in the fourth quarter. The pattern is repeated during January-October 2018, with core inflation reaching an average of 1.66% with a maximum of 2.9% and a minimum of 0.53% (Figure 2.17).
Figure 2-17: Annual Rate of Change (General and Core) (%)
3.36
0.28
0.050.25
2.01
(1.00)
(0.50)
0.50
1.00
1.50
2.00
2.50
3.00
3.50
2015 2016 2017 2018
Headline CPI Core CPI
4.2
0.77
1.90
2.90
2.03
1.67
0.53
0.82
Jan
Feb
Mar
Apr
May Jun Jul
Aug
Sep
Oct
Nov Dec Jan
Feb
Mar
Apr
May Jun Jul
Aug
Sep
Oct
Nov Dec Jan
Feb
Mar
Apr
May Jun Jul
Aug
Sep
Oct
Nov Dec Jan
Feb
Mar
Apr
May Jun Jul
Aug
Sep
Oct
Source: Planning and Statistics Authority
As for the contribution of the CPI components on its annual rate of change during January-October 2018 as shown in Figure 2-18, it fluctuates up and down from month to month or from season to season, reflecting discrepancies in supply and demand in the local and international markets. However, the components that regularly and visibly contribute to the annual rate of change in the CPI in absolute terms (not necessarily positive or negative) are almost exclusively limited to the costs of transportation and rental of housing. The other components of food, entertainment, clothing, and furniture vary in their contributions from one month to another depending on their supply and demand forces as shown for April and September of 2018. It is worth mentioning that the costs of transport and food are subject to supply and demand forces in the international market, unlike the cost of housing rent and communication which reflects the local supply and demand factors.
Figure 2-18: The contribution of 2018 CPI components on its annual rate of change (points*)
2018
Food Clothes Housing Furniture health
Transportation Communication Entertainment Education
Hotel & Restaurant Others
Jan Feb Mar Apr May Jun Jul Aug Sept Oct-40-35-30-25-20-15-10-50510152025303540
Source: Planning and Statistics Authority -* the points are not percentage it is just a figure to measure the magnitude of the impacts
Producer Price Index
The increase in oil prices in world markets in 2017 led to a rise in the average rate of change in the producer price index (PPI) to a positive 19.8% in 2017 compared to a negative rate of change of 22.8% in 2016. The OPEC members’ agreement to cut production in late November 2016 contributed to the rise in oil and gas prices in the international market, which helped to increase world producer prices. Consequently, the rate of change in Qatar’s PPI rose to 30% in the first quarter of 2017 due to the rise in the PPI of the hydrocarbon and manufacturing sectors. Subsequently, the rate of change of the PPI slowed in the second and third quarters of 2017 before it rose again in the fourth quarter, continued to increase until attaining 37.9% by the end of the third quarter of 2018.

46
Qatar Economic Outlook 2018-2020
The rate of changes in the PPI for the manufacturing sector is principally related to the rate of change in the hydrocarbon sector because the production of refined petroleum and petrochemical products dominates the output of the manufacturing industries since they obtained most of their production inputs from the hydrocarbon sector.
Figure 2-19: Rate of change of Producer Price Index (PPI) (annual change %)
26.7-
33.621.2
44.7
3.0
15.0-
24.8
17.7
25.6
22.8-
19.8
37.9
-50-40-30-20-10
0102030405060
2016 2017 2018
Mining Electricity and water Manufacturing PPI
Q1 Q2 Q3 Q4 YR Q1 Q2 Q3 Q4 YR Q1 Q2 Q3
Source: Planning and Statistics Authority
As indicated in Figure 2-19, the average rate of change in the manufacturing sector’s PPI in 2016 bottomed out at a negative rate of 15%. However, as soon as the PPI for the hydrocarbon sector improved in 2017, the PPI for manufacturing sector followed suit, becoming positively enhanced by an average of 17.7% in 2017. Thus, when hydrocarbons’ PPI intensified during the third quarter of 2018 to reach 44.7%, the manufacturing PPI commensurately increased to 25.6% in the same quarter, when together they induced the total PPI to rise to 37.9% by the end of that month. The contribution of the PPI for utilities including electricity, water, and gas was modest throughout the period, touching almost 3% by the end of the third quarer 2018.
Asset Markets: Equity and Real EstateQatar Stock Exchange
The Qatar Stock Exchange (QSE) became a member of the Emerging Markets Index in 2014, which it is called Morgan Stanley Capital International (MSCI). This index monitors the performance of the equities market of its members to identify the opportunities and risks in the investment portfolios of each member country. The Qatar MSCI helps the QSE to improve its financial market and attract foreign capital to the domestic market.
The QSE measures the performance of its portfolio using three benchmark indices and eight sub-indices. Among the primary indices is the General Index, which contains
the top 20 largest and most liquid stocks, assigning a maximum weight for each share of 15%; hence the General Index is used to measure the performance of the price of shares comprising the index. The Index of Total Return (yield) of stocks is similar to the General Index regarding composition, but it measures the income from the earnings of shares (dividends). The third index is the All-Shares Index, which as its name suggests, is comprised of all the shares listed on the stock exchange (about 44 companies) and which does not have an absolute ceiling for the weight of the shares. One caveat for this index is that its shares should have a movement of at least 1%, which is the ratio of the number of shares transferred from one person to another during the year. The All-Shares Index measures both prices and the movement of income from dividends.
Note that the All-Shares Index is the average of the sub-indices of the leading economic sectors (banking and finance, industry, insurance, real estate, consumption, communication, and transportation). It provides a mechanism for potential investors to analyze the performance of each economic sector concerning their prices and dividends income. It also enables investors to compare the QSE with the performance of the S & P index, as well as the stock indices of the GCC countries whose economies are similar to the economy of the State of Qatar regarding reliance on one primary resource to generate revenues for financing the state budgets. Such income allows GCC governments to increase their public spending on public projects, which leads to a cycle of expansion of non-hydrocarbon (non-oil) economic sectors.
However, an increase in oil prices does not necessarily lead to growth across all stock markets; its impact varies from one market to another, depending on the nature of the components of each sector in that stock market and the extent to which they benefit from the flow of oil revenues. As Figure 2-20 shows, when oil prices were low during the second half of 2016, the performance of all financial markets was low for all GCC countries compared with the S & P Index. The lowest was Saudi Arabia with an average growth of negative 14.8%, followed by Bahrain with an average of negative 7.9%, Kuwait at an average of negative 5.6%, and Qatar at an average of negative 3.4%. Oil prices rose in November 2016, which led to a direct improvement in the performance of financial markets during November and December 2016, further improving during the first half of 2017 once oil prices stabilized at a higher level. Most of the GCC markets made significant progress, led by Kuwait’s security market with an average growth of positive 29.5%, Bahrain with an average increase of 16.7%, Saudi Arabia with an average growth of positive 11.5%, Dubai

47
Part 2- Economic Performance 2017
with an average growth of positive 6.8% and Qatar with an average growth of positive 4.2%, while Oman remained down 0.8%. Moreover, Kuwait, Saudi Arabia, and Bahrain continued to grow significantly in the second half of 2017, but not the Qatar Exchange, which fell by an average of 16.3% due to the repercussions of the blockade. Oman too declined by an average of 10.6%.
Figure 2-20: GCC Stock Price Index and the S & P Global Index (YoY %)
7.1-
1.6-0.0-
3.3
15.4
0.9
3.6
20.8-14.5-
10.9-
17.5-
13.7-
5.3- 6.1-
6.28
15.74
21.90
33.13
11.56
9.84
12.23
4.29
18.64-
21.92- 20.46-
13.7
16.219.4
14.017.4
25-
15-
5-
5
15
25
35
2016 2017 2018
1.56
Bahrain-BSE Kuwait-KSA Dubai S&P Global
QE Oman-MSI Saudi -TSA Abu Dhabi
Jul
Aug
Sep
Oct
Nov Dec Jan
Feb
Mar
Apr
May Jun Jul
Aug
Sep
Oct
Nov Dec Jan
Feb
Mar
Apr
May Jun Jul
Aug
Sep
Oct
Sources: Thomson, Reuters, Akon, the date of navigation 12 November 2018 and PSA analysis
As for the level of development of the GCC stock exchanges during the third quarter of 2018, the indices of Qatar, Saudi Arabia, Abu Dhabi and Bahrain increased by 14.6%, 12.1%, 10.1% and 3.1%, respectively compared to the third quarter of 2017. On the other hand, Oman, Dubai and Kuwait declined by an average of 12.6%, 20.3% and 2.5%, respectively, as indicated in Figure 2-20. The Dubai stock market witnessed a significant loss during August and September of 2018, exceeding an average of 20% due to the setbacks in the real estate market, including Abraaj. As for Qatar, all sub-indices of the economic sectors recovered from the negative average of 16.3% in the second half of 2017 to the negative average of 8.7% in the first half of 2018, and furthermore during August and September of 2018, all sub-indices of the economic sectors achieved a positive average growth of 18.8% compared to the Standard & Poor’s Global Index of 16.5% during the same period. However, Qatar’s all-share index rose 33.1% in October 2018, while the Standard and Poor’s 500 fell 10.5%.
In general, the performance of financial markets at local, regional, and international levels reflects either uncertainty in the fundamentals of the global market
or the persistence of sharp fluctuations in commodity prices, or perhaps more randomly, simply the mood of investors; all can have an impact on how investors evaluate the performance of a financial market. As seen above, the performance of the GCC’s financial markets is highly correlated to international oil prices and the level of public finances. To measure the performance of the Qatari financial market compared to global and regional indices, the MSCI Emerging Markets Index is used. The MSCI index for the period January -October 2018 experienced an average growth of 9.1% compared with its average in 2017 as shown in Figure 2-21. Similarly, the GCC’s MSCI index witnessed an average growth of 9.3% during the same period compared with its average in 2017, mainly due to the increase in oil prices (Brent crude increased by 39% during the same period), and possible stability in public8 spending.
Regarding the performance of the MSCI Qatar Index in 2018, despite the impact of the embargo on the stock market since June 2017, as shown in Figure 2-21, which contributed to the decline in performance of MSCI Qatar during the period January - July 2018 by an average of 3.6% compared to the average performance in 2017. However, from the beginning of August 2018 to the end of October, the MSCI Qatar Index witnessed a steady growth of 6%.
Figure 2-21: MSCI stock price index (points based on US dollar)
1,273
1,093
1,022
671 760
818
641713
804
5005506006507007508008509009501000105011001150120012501300
May
15-
Jun1
5-Ju
l15-
Aug1
5-Se
p15-
Oct
15-
Nov
15-
Dec
15-
Jan1
6-Fe
b16-
Mar
16-
Apr1
6-M
ay16
-Ju
n16-
Jul1
6-Au
g16-
Sep1
6-O
ct16
-N
ov16
-D
ec16
-Ja
n17-
Feb1
7-M
ar17
-Ap
r17-
May
17-
Jun1
7-Ju
l17-
Aug1
7-Se
p17-
Oct
17-
Nov
17-
Dec
17-
Jan1
8-Fe
b18-
Mar
18-
Apr1
8-M
ay18
-Ju
n18-
Jul1
8-Au
g18-
Sep1
8-
Poin
ts
MSCI EM MSCI GCC MSCI QATAR
Sources: Thomson, Reuters, Akon, the date of navigation 12 November 2018 and PSA analysis
However, it should be noted that the average cost of the shares listed on the Qatar Exchange is relatively close to the average price of the shares in the stock markets of Saudi Arabia, Kuwait and Abu Dhabi, having a ratio of price to earnings of 14.55 in October 2018 compared to
8Increasing public financial stability often increases confidence in the stock market

48
Qatar Economic Outlook 2018-2020
14.72 in Saudi Arabia, 13.76 in Kuwait, and 12.68 in Abu Dhabi as indicated in Table 2-3. Furthermore, Qatar’s share ratio of price to book value was 1.36 in October 2018, compared to 1.73 in Saudi Arabia, 1.3 in Abu Dhabi, and 1.39 in Kuwait. However, Qatar’s average dividend yield of 3.86% was slightly higher than that of Kuwait, but lower than Saudi Arabia, Dubai, Abu Dhabi, Bahrain, and Oman.
In terms of performance of the economic sectors according to companies listed on the Qatar Exchange, the total market capitalization of the shares of companies amounted to QR580.5 billion at the end of October 2018, experienced an increase of 14.5% over the average value of (January-September 2018). The rate of change of Qatari General Index in October 2018 was 11.7% compared to the average value of the index (January- September 2018). The All-Shares Index, which comprised of seven economic sectors, witnessed a monthly rate of change of 5.41% in October 2018, mainly came from the monthly rate of change of real estate by 7.64%, followed by banks and financial services by 7.57%, industrial sector by 4.47%, transportation sector by 3.22%, and consumer goods and services by 1.91%, while the rest of the economic sector indices of telecommunications and insurance fell by minus 2.34% and 1.86% respectively.
To increase the financial transactions of the Qatar Exchange and to develop its financial market on a broader scale, the Government of Qatar, represented by the Ministry of Finance and the Qatar Central Bank, seeks to encourage the trading of bonds and treasury bills in the stock market. These financial instruments are aimed at absorbing liquidity and, if required, to cover part of the fiscal deficit of the state budget. For example, in 2017, the budget deficit was about QR 35.4 billion, which was financed entirely through domestic borrowing through issuing treasury bills valued at about QR14.6 billion, government bonds at about QR18.5 billion, and Sukuk (Islamic bonds) at about QR15.4 billion, reaching a total amount of QR48.5 billion (equivalent to US$13.3 billion). However, only 19.5% of the total bonds and about 6.4% of the entire Treasury Bills that were issued
during 2017 were marketed on the QSE.
Figure 2-22: Issuances of Treasury bills, Bonds and Sukuk
02468101214161820
2016 2017 November 2018
Treasury bills Sukuk Bonds
35.5 19.4
48.5
QR
Billi
on
2.2 14.6 10.15.7
15.4
8.8
11.5
18.5
16.7
Source: Monthly Monetary Bulletin of QCB and analysis of the PSA
In spite of the budget surplus in the first half of 2018 accounting for 2.1% of total expenditure, nonetheless the government has issued treasury bills, bonds and Sukuk to develop the financial market and support the stock exchange as well as to absorb liquidity or if necessary to finance budget deficit. As for the treasury bills, bonds, and Sukuk issued during January-November 2018, they account for QR35.5 billion (US$9.75 billion), with the treasury bills (short-term loans) constituting nearly 28.3% of the total (Figure 2-22). The QSE report for October 2018 indicated that bonds were traded at a total value of QR 2.7 billion, representing 16.3% of total issued bonds during the period January-November 2018.
Real Estate
Over the past few years, the real estate market in Qatar has been fluctuating because of real estate speculation and imbalances between supply and demand forces, which is also the case in the rest of the global real estate market as well as the GCC real estate market. The real estate market in Qatar has economic and financial importance since it accounts for nearly 38% of the domestic credit issued by local banks.
Accordingly, the Qatar Central Bank (acting as the supervisor of the financing process), in cooperation with the Ministry of Justice (which is responsible for real estate registration and documentation processes),
Table 2-3: Regional Equity Market Ratios City of Headquarters .QEAS .QSI .ADI .DFMGI .TASI .BAX .KWSE .MSI
Doha Doha ABU DHABI DUBAI Riyadh MANAMA Kuwait City MUSCATIndex Points 3,060 10,368 5,029 2,826 7,743 1,313 6,633 4,491 Price to earning ratio 14.55 14.44 12.68 7.68 14.72 8.61 13.97 9.45 Price to Book ratio 1.36 1.42 1.32 1.00 1.73 0.78 1.39 0.85 Dividend Yield (%) 3.86 4.22 5.06 5.82 4.01 5.77 3.74 6.42 Volatility - 200 days 16.80 16.37 11.13 11.98 14.98 6.35 3.81 6.67 Year to date performance(%) 24.77 21.64 14.33 16.15- 7.16 1.39- 3.52 11.95-Year on year performance(%) 40.66 31.97 15.10 17.25- 11.63 3.66 7.34 10.76-
Source: Thomson Reuters Eikon, November 2018 and PSA calculation

49
Part 2- Economic Performance 2017
initiated the preparation of a real estate price index in Qatari cities. This Real Estate Price Index (REPI) in Qatar is based on data on sales transactions of real estate (including land, residential villas, and residential properties) collected by the Ministry of Justice, except for operations that are considered unusual or that are conducted independently as a transfer of ownership within the family. After consulting with the Ministry of Justice, the average months of April 2009 – March 2010 was used as the base year to calculate the REPI.
Figure 2-23: Index and rate of change in Real Estate Prices and Credits
-9.9
-9.3
-16.6
-4.04.0
9.5 15.6
5.0
3.5 1.0
-2.8-2.2
20-15-10-5-051015202530354045
0
50
100
150
200
250
300
350
2016 2017 2018
Real Estate Index - (L-Axis) Y-o-Y ChangeYOY Credit Growth M-o-M Change
Apr
May Jun Jul
Aug
Sep
Oct
Oct
Nov
NovDec
DecJan
Feb
Mar
Apr
May Jun Jul
Aug
Sep
Jan
Feb
Mar
Apr
May Jun Jul
Aug
Sep
Rate
of C
hang
e of
REP
I & C
redi
t (%
)
Inde
x Po
int
Source: Monthly Monetary Bulletin of QCB and analysis of the PSA
Although the real estate prices witnessed a fluctuating downward trend during the first three quarters of 2016, it experienced stability and growth in the fourth quarter of 2016 and the first half of 2017 before falling moderately in mid-2017 due to the repercussions of the blockade. However, with Qatar weathering the impact of the embargo and with the Qatari economy adjusting to the new changes, the Qatari real estate market has again showed signs of growth since the end of 2017 and the beginning of Q1 of 2018, entirely independently of any impacts in real estate prices in neighboring Gulf markets. However, by the beginning of the second quarter of 2018, a decline started once more, due to an increasing supply and low demand for real property, which has induced a decline in rents. Moreover, there is a trending change in people’s taste for moving to modern buildings instead of older ones. Finally, several companies chose not to renew their rental contracts for large premises, moving instead to smaller ones to suit their reduced staff sizes due to the completion of a large number of construction projects.
Despite falling real estate prices, demand for bank credit increased during Q1 of 2018 before markedly declining in Q2. It is apparent from Figure 2-23 that there is a correlation between the growth rate of REPI and the growth in credit granted to the real estate sector on an annual basis during the first half of 2018. As credit growth improved by 15.6% in March 2018, the annual growth of real estate index improved from a decline of
9.9% in December 2017 to a drop of 9.3% in March 2018. However, as the growth of REPI declined further by 16.6% in June 2018, concomitantly credit growth also fell to 5%. However, while the REPI improved to minus 4% at the end of the third quarter (September 2018) from minus 16.6% at the end of the second quarter (June 2018), the credit growth remained positive at modest rate of 3.5%.
It can be confirmed that part of the REPI’s decline is caused by procedural improvements to correct price imbalances resulting from the speculation in real estate that hit the global economies; including Qatar’s, which will reset the real estate market to be once again subject to supply and demand, as has occurred in the international real estate market at present time.
Liquidity and Money SupplyAs shown in Box 2-1, the Qatar Central Bank (QCB) measures liquidity and money supply using four monetary criteria: primary liquidity, monetary base, and money supply within its narrow and wide limits. These standards are positively and negatively affected by volatile oil and gas prices in international markets, the level of economic growth and global demand for goods and services, as well as the level of political and/or security tensions at international and regional levels. The contribution of the components of primary liquidity and the monetary base will be used to assess the impact of the twin factors of high oil prices and blockade measures on the level of liquidity in Qatar during the period 2014-2018. As indicated in Figure 2-24, all elements of the monetary base contributed positively to the rate of change of monetary base liquidity in 2014, whether the currency issued, the required reserves, excess reserves, and other deposits. As oil prices dropped in mid-2014, the level of all components retracted, and some of them began contributing negatively by 2015. However, such contractions were recovered as soon as oil prices turned around at the end of 2016, and they continued to grow as oil prices steadily increased until the rate of
Figure 2-24: Contributions of the monetary base to total rate of change
2014
2015
2016
Poin
ts a
nd R
ate
of C
hang
e %
Years
3.6 1.16
3.37-
7.7 11.0 7.8 9.5
3.9-
8.3- 10.3-13.2-
1.5-
10.3-
22.3
23.0 20.5
14.2
6.9-
31.0
18.5
20-15-10-5-05101520253035
2017 2018
10.3
Currency Issued Required Reserve Excess Reserve
Others Monetary Base (%)
Jan
Feb
Mar
Apr
May Jun Jul
Aug
Sep
Oct
Nov Dec Jan
Feb
Mar
Apr
May Jun Jul
Aug
Sep
Source: Monthly Monetary Bulletin of QCB and analysis of the PSA

50
Qatar Economic Outlook 2018-2020
change of monetary base achieved 20.5% in May 2017, but the shock of the blockade in June 2017 decreased the rate of change of monetary base during June and July 2017. Subsequently it has recovered because of the measures that were taken by QCB to counter the repercussions of the blockade, including an increase in government deposits in foreign currencies, the provision of credit facilities through the repurchase agreement (repo)10 and monitoring the value of the Qatari riyal on exchange markets. These measures led to stability of primary liquidity, and the monetary base advanced by the end of 2017 to attain nearly 14.2%. During the first three quarters of 2018, the monetary base witnessed a steep drop followed by a cautious increase and then by a downward trend, indicating a normal movement of monetary aggregates and reflecting the aggregate demand and supply mechanisms of the Qatari economy. As for the annual rate of change of the monetary base by 31% in July 2018 is due to the increase of other deposits from QR 276.4 million in July 2017 to QR16,400.8 million in July 2018, and when it declined to QR15,049.1 million in September 2018, the annual rate of change declined to 18.5% .
Concerning money supply in broad terms as shown in Figure 2-25, it grew modestly by 3.4% in 2015 and declined negatively by 4.6% in 2016. It has experinced positive growth since January 2017, reaching about 4.7% in May 2017 just prior to the imposition of the blockade. Due to the repercussions of the blockade, the Qatar Central Bank, in cooperation with the Qatar Investment Authority (QIA), intervened by pumping foreign currency liquidity into local banks. This increased broad money supply (M2) to 21.3% in December 2017. It remained at high levels during the first half of 2018 until stabilizing at 0.14% in September 2018.
Figure 2-25 indicates that the primary driver of monetary supply growth during the second half of 2017 and the first half of 2018 have been deposits in foreign currencies, where its increase or its decrease during the past few years have represented one of the main reasons for rates of change in money supply. For example, the withdrawal of foreign currency deposits in 2016 contributed to the contraction of the money supply by negative 5.3%. The exact opposite occurred in 2017, when the proportion of public sector deposits in foreign currencies to total public sector deposits rose from 45% in May 2017 to 60% in August 2017, inducing broad money supply to grow by 14.4%, and it continued this growth until it reached 21.3% in December 2017.
Figure 2-25: Contributions of broad money supply components to its total rate of change
Currency in Circulation Demand Deposits Time Deposits
Foreign Currency
Broad Money Supply (%)
1.0
(1.8) (1.9)
5.3- 3.0-
2.5
5.07.7
14.4
21.3
19.6
10.2 10.3
4.0
2015
2016
2017 2018
Poin
ts a
nd R
ate
of C
hang
e %
9.1
Jan
Feb
Mar
Apr
May Jun Jul
Aug
Sep
Oct
Nov Dec Jan
Feb
Mar
Apr
May Jun Jul
Aug
Sep
0.3 0.6
19.3
9.2
1.8
0.1
-8-6-4-2024681012141618202224
Source: Monthly Monetary Bulletin of QCB and analysis of the PSA
It is expected that the annual rate of change of the broad money supply during October -December of 2018 will become a single digit and maybe with a negative values rather than a double-digit with a positive values because its calculation is based on those months that witnessed an upward growth, in particular from July 2017 onward as a result of the blockade until it reached 21.3% in December 2017 (Table 2-4) mainly benefiting from the increase of government’s foreign currency deposits. However, as the growth rate of these deposits declined since the first quarter of 2018, the magnitude rate of change of broad money supply shrank to 0.14% in September 2018, and it is expected the broad money growth to slow down and may become negative during the upcoming months because the comparison will take place with the highest growth rates during the second half of 2017 (the first siege period).
Furthermore, it should be noted that since the beginning of the siege the increase of foreign currency deposits was to counter the decrease in non-resident deposits, which fell from 24.2% in May 2017 (before the blockade) to 16.7% in December 2017, equivalent to QR137 billion. However, since the beginning of 2018, it started to increase to 20.8% of total deposits in September 2018 and equal to QR170 billion compared to QR142.77 billion in September 2017 (see table 2-5 below page 53).
The money multiplier of Qatar, which is the ratio of money supply to the monetary base, has increased from 5.5 points in 2009 to about 7.7 points in August 2018. This means that depositing QR100 in local banks would create about QR550 in 2009 or QR770 in August 2018, indicating the increasing role of banking deposits to generate credit, and thus the formation of wealth (see Box 2-1 Page 56).
10 Repurchase agreements’ operations comprise purchases of assets by QCB from commercial banks under a contract providing for their resale at specified price
on a given future date (limited to two weeks or one month)

51
Part 2- Economic Performance 2017
Developments in banking assets and liabilities
In view of the role of local credit activities in creating money and wealth, the Qatari banking system has been actively involved in providing local credit to finance development and construction activities in Qatar over the past decade, forcing it to seek external sources of funding (i.e., attracting foreign deposits) since 2005 to continue the construction sector’s growth. Therefore, this section highlights the development of liabilities and assets in commercial banks, which reached QR1404 (US$385.7billion) at the end of September 2018 with an annual Y-o-Y growth rate of 5% compared to September 2017. The total growth of liabilities in September 2018 is attributed to the liabilities growth of both conventional and Islamic banks by about 7.1% and 0.9% respectively, which correspondingly accounted for 71.9% and 24.9% of total liabilities.
Concerning the share of components of total liabilities in terms of sources of financing as shown in Figure 2-26, the private sector deposits account for 25.3% of total liabilities, followed by deposits of the public sector at 20.8%. The share of other liabilities including the capital account, provisions, insurance, and others represent 21.2%, followed by foreign liabilities from banks’ assets abroad at 15.2% and non-resident deposits at 12.1%. Besides these, the deposit of debt securities
Figure 2-26: Distribution of total liabilities by source
0.3 2.6 2.7 2.5 2.8 1.6 1.7 1.6 1.5
28.7 27.4 26.4 27.2 26.2 25.5 26.1 26.0 25.3
15.2 18.5 22.6 23.1 22.2 22.5 21.0 20.8 20.8
14.1 13.1 10.7 10.1 10.5 10.8 11.5 11.6 12.1
17.9 14.8 12.7 13.0 15.0 14.6 15.2 14.9 15.2
3.8 3.9 4.0 3.5 3.5 3.8 3.9 3.9 3.8
20.0 19.7 21.0 20.6 19.7 21.2 20.6 21.2 21.2
1,250
1,275
1,300
1,325
1,350
1,375
1,400
- 10.0 20.0 30.0 40.0 50.0 60.0 70.0 80.0 90.0
100.0
2017 2018
QR
Billi
on
As %
of t
otal
liab
ilitie
s (A
sset
s)
QCB deposits in local banks Private Deposits Public DepositsNon-Resident Deposits Due to Banks Abroad Debt Securities
Total Liabilities (R-Axis)Others
May Jun Sep Dec Mar Jun Jul Aug Sep
Source: Monthly Monetary Bulletin of QCB and analysis of the PSA
and the deposit of QCB at local banks constitute a relatively minor 3.8% and 1.5%, respectively. As for the role of each component in the 6.2% growth of total liability during the first three quarters of 2018, the public sector deposits contributed nearly 5.2 percentage point of the total growth rate, which helped to offset the decline in non-resident deposits by 2 percentage point and also offset the decline in private sector deposits by 0.2 percentage point. However, the QCB’s balances contributed at an average of 0.7 percentage point during the same period.
On the other hand, Figure 2-27 highlights the development of assets in commercial banks by the type of its usage. Private sector credit accounted for 37.4% of total assets in September 2018, followed by public sector credit at 24.2%. However, the commercial banks investments in debt securities, domestically or in abroad, accounted for 16% of total assets. The assets of local banks in foreign banks are about 9.6% and the credit granted to overseas customers accounts for 5.9% of total assets. The banks’ balances with QCB constitute 2.9% of the total. As for the role of each component in the total asset growth during the first three quarter of 2018 (6.2%), public sector credit contributed 1.1 percentage point of the total growth and private sector credit another 4.1 percentage, as did foreign investments at 1.8 percentage,
Figure 2-27: Distribution of total assets by source
May Jun Sep SepDec Mar Jun Jul Aug
Local Banks Deposits in QCB Private Credits Public CreditsForeign Credit Due from banks in abroad and in QatarDomestic and Abroad Investments Total Assests (R-Axis)Others
3.4 3.6 3.3 3.3 3.4 3.5 4.1 4.3 4.0
34.8 35.6 35.3 35.1 35.7 36.9 37.3 37.6 37.4
25.0 24.1 24.6 25.0 25.2 23.8 23.1 23.4 24.2
7.3 7.4 7.1 6.6 6.4 6.2 6.0 6.0 5.9
10.3 9.5 9.2 9.2 9.6 10.1 10.5 9.6 9.6
16.5 16.7 17.6 17.8 17.0 16.8 16.3 16.3 16.0
2.7 3.1 2.9 2.8 2.8 2.8 2.8 2.9 2.9
1,250
1,275
1,300
1,325
1,350
1,375
1,400
-
10.0
20.0
30.0
40.0
50.0
60.0
70.0
80.0
90.0
100.0
2017 2018
As %
of t
otal
Ass
ets (
liabi
litie
s)
QR
Billi
on
Source: Monthly Monetary Bulletin of QCB and analysis of the PSA
Table 2-4: Development Broad Money Supply (QR billion)Jan Feb Mar Apr May Jun Jul Aug Sep Oct Nov Dec
2015 Values (QR Billion)
503 518 508 505 520 532 519 520 518 510 519 521
2016 505 505 506 497 497 494 492 489 493 489 496 498 2017 501 517 518 525 521 532 533 559 565 578 590 603 2018 599 599 602 586 581 586 588 581 5662016 Annual
Growth % 0.4 2.5- 0.4- 1.6- 4.4- 7.2- 5.2- 6.0- 4.7- 4.1- 4.4- 4.6-
2017 0.8- 2.5 2.4 5.7 4.7 7.7 8.3 14.4 14.5 18.3 18.9 21.3 2018 19.6 15.7 16.1 11.6 11.6 10.2 10.3 4.0 0.1
Source: Monthly Monetary Bulletin of the Qatar Central Bank and analysis of PSA staff

52
Qatar Economic Outlook 2018-2020
which more than covered the 0.7 percentage point decline in overseas credit.
In terms of the contribution of conventional and Islamic banks to the provision of domestic and foreign credit facilities, amounting to QR948.2 billion in September 2018, domestic credit accounts for nearly 91.3% of this (QR865.5 billion). Conventional banks provide about 71.6% of total domestic credit, followed by Islamic banks at around 25.9%; lagging far behind are foreign banks at about 1.8%, while specialized banks provide less than 0.6%. In terms of local banks’ investment on government bonds and Sukuk, conventional banks invested 55.4% of total bonds and Sukuk issued, followed by Islamic banks at 39.4% and foreign banks at 3.9%, and whereas specialized banks invested just 1.3%.
The repercussions of the siege on the banking system
Given the impact of the blockade measures on foreign banking liabilities, this section reviews the development of foreign liabilities (deposits) since early 2017. The deposits of foreign liability (before the embargo) had achieved an annual growth of 22% in May 2017 compared to May 2016, of which the non-resident deposits contributed to foreign liability growth by 11.5 percentage point and claims to bank branches abroad added another 11.5 percentage point, while debt securities contributed by 2 percentage point.
However, the contribution of the headquarters of overseas banks declined by 1.6 percentage point and other liabilities decreased by 1.3 percentage point. The blockade’s repercussions have reduced the annual growth of foreign liabilities to negative 19% in December 2017, of which the non-resident deposits negatively contributed to the decline of foreign liability growth by 10.3 percentage point, followed by the negative contribution of the claims of banks abroad (branches and headquarters) by 4.5 percentage point and 2.4 percentage point, respectively. The other liability and debt securities also contributed negatively by 1.3 percentage point and 0.5 percentage point, respectively.
The foreign liabilities have achieved an annual growth of 18.8% in September 2018, which helped to shrank the magnitude of foreign liabilities’ reduction to average of negative 2.7% during the first three quarter of 2018 compared to negative 19% by the end of 2017, mostly from non-resident deposits falling by 5.5 percentage point while the claims of foreign banks’ branches also contributed by negative 0.8 percentage point, and other foreign liability by negative 0.8 percentage point. However, the claims of foreign banks’ headquarters as well as debt securities showed a positive contribution
by 2.9 percentage point and 0.6 percentage point, respectively.
It is worth mentioning that non-resident deposits in the Qatari banking system accounted for about 36.7% of total foreign liabilities during January-July 2018, followed by balances of foreign banks’ headquarters and branches at around 29% and 21.5%, respectively, followed by debt securities at 12.5%. Also, when adding foreign bank balances (due to banks abroad) to non-resident deposits, it accounted for about 31% of the total sources of fund for Qatari commercial banks in 2016, but declining to 23.1% in 2017 before increasing to 27.3% at the end of September 2018 as showin in Figure 2-28.
Figure 2-28: Source of funds for commercial banks (% of total deposits)
2018
Non Resident Deposits Debt SecuritiesPrivate Sector Public Sector Others
Due to Banks Abroad
11.5 11.6 12.1
15.2 14.9 15.2
3.8 3.8 3.8
26.1 26.0 25.3
21.0 20.8 20.8
22.3 22.8 22.8
0102030405060708090100
2017
2013
2014
2015
2016
2017
Years
Jun Jul
Aug
Sep
Oct
Nov Dec Sep
Jan
Feb
Mar
Apr
May Jun Jul
Aug
Source: Monthly Monetary Bulletin of QCB and analysis of the PSA
Deposits and domestic credit
Total deposits in Qatari commercial banks during the first three quarters of 2018 amounted to QR808.1 billion (US$222 billion). Private sector deposits accounted for 44.7%, followed by public sector deposits at 36.7% and non-resident deposits at 18.5%. Figure 2-29 suggests that the growth of total deposits during the year 2017 ranged between 11.7% and 20%, with an average growth rate of 15.5%, where public deposits accounted for about 8.3 percentage point of total growth, followed by non-resident deposits by 4.9 percentage point, and the local private sector contributed with 2.3 percentage point of overall growth. In the second half of 2017 (the first direct period of the blockade), deposits grew by an average of 16.2%, ranging from 12.8% to 20%. Most of the growth came from public sector deposits with around 16.9 percentage point, which more than covered a decline in the growth of non-resident deposits of 1.3 percentage point. The private sector maintained a modest increase of 0.5 percentage point. In the period January- September of 2018, which can be taken as a transitional period for the banking system to return to the fundamentals of supply and demand of monetary aggregates, deposits continued to grow, albeit less than

53
Part 2- Economic Performance 2017
previously, to reach an average of 5%, bounded by the highest growth of 9.1% and the lowest of 1.7%. Most of the growth came from public sector deposits at around 8.8 percentage point, which covered the decline in non-resident and private sector growth of 3.4 percentage point and 0.5, respectively. In September 2018, the total deposits stood at QR817.85 billion (US$224.7), of which private sector deposits accounted for 43.5%, followed by public deposits by 35.7% and non-resident deposits of about 20.8%. As indicated in Figure 2-29, total growth of deposits reached 2.51% in September 2018; most of the growth came from private sector deposits by 3.4 percentage points and non-resident deposits by 0.41 percentage point, while public sector declined by about 1.32% in favor of the increase contribution of non-resident deposits and relatively private sector deposits.
Figure 2-29: The contribution of public and private deposits to total deposits
2017 2018
1.3-
3.4 2.5
-10-8-6-4-202468101214161820
Poin
ts a
nd R
ate
of C
hang
e %
Jan
Feb
Mar
Apr
May Jun Jul
Jul
Aug
Aug
Sep
Sep
Oct
Nov Dec Jan
Feb
Mar
Apr
May Jun
Public Private Non-residents Total deposits (%)
Source: Monthly Monetary Bulletin of QCB and analysis of the PSA
It is worth noting that non-resident deposits growth rates were favourable during the blockade period although they were expected to be negative. The reason is that non-resident deposits witnessed an upward trajectory peaking in January 2017 with a growth rate of 125% compared to January 2016 (Table 2-5) mainly benefiting from the increase of oil revenue thanks to the rise in oil prices in November 2016. However, as these
deposits declined in absolute value since the beginning of the second half of 2017, in particular from June 2017 onward as a result of the blockade, their growth rates were favourable compared to 2016-Sept 2017. From September 2017 and onward, the non-resident deposits started to achieve negative growth rates compared to the same period in 2016. Similarly, despite the increase in non-resident deposits during the first half of 2018, they recorded negative growth compared to the first half of 2017, which witnessed a boom due to the increase in oil prices. Here are the non-resident deposits witnessed positive growth since July 2018 and reaching 19.1% indicating the overcoming the blockade repercussions.
Regarding commercial banks’ credit activities in Qatar, total credit during the first three quarters of 2018 amounted to nearly QR925.1 billion ($254.15 billion). Local private sector credit accounts for almost 54.6%, followed by public sector credit at 36.1%, then foreign private sector credit at around 9.4%. As Figure 2-30 indicates, the average growth of total credit during 2017 was approximately 11.7%, ranging from between 14.5% as a maximum and 8.5% as a minimum. Public sector credit contributed about 7% of total growth, followed by the local private sector by 3.7%, and the foreign private sector by 0.9%.
During the second half of 2017 (the first direct period of the blockade), the average growth rate of total credit was 12.3%, ranging from 8.5% to 14.5%. Most of the growth came from credit directed to the public sector at 8 percentage point, followed by lending to the private sector at 3.9 percentage point, while lending to the private foreign sector maintained modest growth at less than 0.6 percentage point. The period January-September 2018 shoud be considered as a transitional period for the banking system to return to regular business without incentives from the public sector, where the average growth of total credit amounted to 5.6%, with a maximum of 9.6% and a minimum of 2.7%, mostly coming from increases in lending directed to the local private sector at 5 percentage point followed by the public sector at about 1.6 percentage point,
Table 2-5: Development Non-Resident Deposits (QR billion)Jan Feb Mar Apr May Jun Jul Aug Sep Oct Nov Dec
2016 Value QR Billion
88.4 98 114.9 121.7 140.2 134.8 138.1 137.5 146.5 148.9 159.9 183.2
2017 199.2 197.4 189.9 190.1 184.6 170.6 157.2 149 142.8 137.7 134.9 137.12018 137 142.4 146.7 142 140.1 150.1 159.3 160 1702017 Annul
Growth %125.3 101.4 65.3 56.2 31.7 26.6 13.8 8.4 -2.5 -7.5 -15.6 -25.2
2018 -31.2 -27.9 -22.7 -25.3 -24.1 -12.0 1.3 7.4 19.1
Source: Monthly Monetary Bulletin of the Qatar Central Bank and analysis of PSA staff

54
Qatar Economic Outlook 2018-2020
Figure 2-30: The contributions of public and private credit to total credits
6.05
2017 2018Po
ints
and
Rat
e of
Cha
nge
%
domestic private credit foreign credit Public credit
Total credits (%)
Jan
Feb
Mar
Apr
May Jun Jul
Aug
Sep
Sep
Oct
Nov Dec Jan
Feb
Mar
Apr
May Jun Jul
Aug
5.69 6.05
0.79-1.30- 1.32-
0.93-
1.22 2.69
5.95
-3-2023568911121415
Source: Monthly Monetary Bulletin of QCB and analysis of the PSA
while lending to the private foreign sector decreased its contribution to the growth of total credit to about negative one percentage point.
In September 2018, total credit stood at QR948.2 billion ($260.5 billion), representing 55.4% of the domestic private sector credit, followed by public sector credit at 35.8% and external private sector credit at 8.7%. The annual growth in September 2018 was 5.95% as shown in Figure 2-30, where most of it derived from private sector growth at 6.05 percentage points. However, external private sector credit fell by 1.32 percentage points, while concomitantly the public sector growth fell by 1.22 percentage point, which cumulatively reducing overall credit growth.
Monetary policy of domestic credit
For more detail regarding the credit extended to the public sector, it should be recalled that the oil price variables, and consequently the state budget revenue from oil as well as the variables of fiscal and monetary policies and the related developments on the current and investment expenditure levels, are reflected in the overall credit and deposit performance of the banking system. Public sector deposits increased in the second half of 2017 as a result of the increase in the financial revenues of the oil and gas sector, in addition to the measures were taken by the government to contend with the economic blockade, which contributed to reducing the volume of public borrowing as a percentage of the net public sector deposits within the banking system. Note that overall, the net public sector account (difference between total public deposits and total public credits) within the banking system has remained as a constant deficit since the onset of the global financial crisis in 2009, with the result that total deposits are lower than total credit. The deficit ratio ranged between 4% and 30% during 2009-2013 before the
Figure 2-31: Credit facilities of commercial bank to public sector
32.2
49.4
48.0
58.8
6.2
291.6
320.9
0
50
100
150
200
250
300
350
400
0.010.020.030.040.050.060.070.080.090.0
100.0
2008
2009
2010
2011
2012
2013
2014
2015
Years 2016 2017 2018
Government Government institutions Semi-government institutions
Total Public Deposits (R-Axis) Total Public Sector Credits (R-Axis)
Jan
Feb
Mar
Apr
May Jun Jul
Aug
Sep
Sep
Oct
Nov Dec Jan
Feb
Mar
Apr
May Jun Jul
Aug
Sep
Oct
Nov Dec Jan
Feb
Mar
Apr
May Jun Jul
Aug
QR
Billi
on
As %
of t
otal
cre
dit
Source: Monthly Monetary Bulletin of QCB and analysis of the PSA
deficit receded to 2% in 2014 to surge again in 2015 to about 12%, thereafter increasing significantly during the months of 2016 to attain an average of 28%, ranging between 18% and 36.7%. Subsequently, volatility returned, with the deficit ratio retreating slightly in the year of the blockade (2017) to an average rate of 24%, but ranging between 7.7% and 43.7%. Greater stability dominated during Jan-Sept of 2018, with the deficit gap narrowing to an average of 10.8%, having a maximum of 16.1% and a minimum of 5.3%. Moreover, Figure 2-31 shows that government credit during the same period accounted for 49.8% of total public credit, 53.7% at a maximum and 46.6% at minimum, followed by wholly-state-owned enterprises, which accounted for 44.2% of total public sector credit. The semi-governmental institutions, in which the state owns nearly 50% of the total shares, represent 6% of the total public sector credit.
In terms of credit offered to the private sector by recipients, the real estate sector, including contractors, came in first place with a total amount of QR174.3 billion, which represent 37.3% of total private credit during 2013-2018 (September), perhaps largely due to the commercial banks making it easy to provide financial financing for a large number of commercial and residential projects where a large number of skyscrapers and mega-malls such as the Mall of Qatar near Doha, as well as across Qatar in new residential compounds outside Doha. The average credit value during the period January-Sept 2018 amounted to about QR188.04 billion, or 22.4% of the total domestic credit or 37.5% of the total credit granted to the local private sector. As for total credit granted to real estate and construction activities in September 2018 accounted for 35.4% of total private sector credits. The consumer sector is the second largest recipient of commercial loans, accounting for 24.5% of the commercial bank credit granted to the private sector.

55
Part 2- Economic Performance 2017
Figure 2-32: Credit facilities of commercial bank to private sector
517.3 519.6 525.8
0
100
200
300
400
500
600
0
20
40
60
80
100
120
2013
2014
2015
2016
2017
Years 2017 2018
QR
Billi
on
As %
of t
otal
cre
dits
for p
rivat
e se
ctor
293.3
13.5
35.4
24.5
26.6
Trade Real Estate and Contracts Consumption
Service & others Total Private Sector Credits (R-Axis)
Jun Jul
Aug
Sep
Sep
Oct
Nov Dec Jan
Feb
Mar
Apr
May Jun Jul
Aug
Source: Monthly Monetary Bulletin of QCB and analysis of the PSA
However, despite the steady rate of consumption loans as well as the continued population growth, it witnessed moderate growth during 2016 and 2017 by 3.5% and 0.8%, respectively, perhaps primarily due to the banks’ tightening of lending standards and uncertainty among non-Qatari residents.
By comparing Figures 2-31 and 2-32, it is noticeable that the growth trajectory of credit directed to the public sector is volatile and reflects the irregular needs of infrastructure projects. In contrast, the growth trajectory of credit directed to the private sector is fairly smooth and consistent with credit developments for consumption.
Monetary policy and interest rates
In order to avoid the adverse effects of the embargo imposed on Qatar since mid-2017, the QCB has adopted a set of monetary policies and measures aimed at reducing the risks faced by Qatari commercial banks as a result of changes in the mood and attitudes of foreign investors towards Qatari banks, the effects of changes in the USA’s monetary policy; as well as the possibility of a decrease in the effectiveness of attractive conditions offered by Qatari banks for foreign investments during the past years. The most important of the QCB procedures is the deposit of large amounts of foreign currencies in local banks amounting to more than $20 billion, in coordination with the Qatar Investment Authority (QIA). This step increased the contribution and importance of public sector deposits in banking transactions.
In terms of the utilization of monetary policy instruments as outlined in Box 2-1 to manage monetary policy and the banking sector, the QCB has continued the movement of the overnight deposit and lending rates as well as the repo11 policy as needed; mainly to respond to any action in US policy rates as it has been practiced
by QCB since November 2016, when the Federal Reserve gradually raised its federal rate by 25 basis point per month from 0.25% in November 2015 until it reached 2.25% in September 2018 (Figure 2-33). Thus, the QCB, in response, increased its overnight deposit rate six times by 25 basis point from 0.75% in November 2016 to 1.25% in May 2017, and gradually increased to 2% in June 2018, remaining at that level until September 2018 when it rose to 2.25% so as to reduce the risk of money outflow from the Qatari market while also limiting the non-differentiation between the Qatari financial and equity markets and the foreign financial and capital markets, especially the American market, where interest rates have recently exceeded 3% for 10-year treasury notes, as well as defending the value of the Qatari riyal, which suffered media attacks and speculation during the past period.
Figure 2-33: Annual Interest Policy Rates (%)
1.75 2.00
2.00 1.75 2.00
2.50
5.00
1
2
3
4
5
6
-
0.50
1.00
1.50
2.00
2.50
2015 2016 2017 2018
US Fed Fund policy rate QCB Overnight Deposit rateRepo at QCB (R-Axis) QCB Overnight Lending rate (R-Axis)
Nov Dec Jan
Feb
Mar
Apr
May Jun Jul
Aug
Sep
Oct
Nov Dec Jan
Feb
Mar
Apr
May Jun Jul
Aug
Sep
Oct
Nov Dec Jan
Feb
Mar
Apr
May Jun Jul
Aug
Sep
Oct
Source: Monthly Monetary Bulletin of QCB’s and US Federal Reserve website (https://fred.stlouisfed.org/series/FEDFUNDS) accessed October 2018
In the same context, the QCB raised the overnight lending interest rate two times by 25 basis point from 4.50% in November 2016 to 4.75% in December 2016, and increased further to 5% in March 2017 and remaining at that level until writing this report (October 2018).
Concerning the repo rate12 , the QCB cut it by 250 basis point from 4.5% in November 2016 to 2.25% in December 2016 before raising it to 2.5% in December 2017 and continued to be at the same level until writing this report (October 2018). By lowering the repo rate, the QCB aimed to give commercial banks an opportunity to obtain liquidity at lower costs since reducing the repo rate, theoretically, helps banks borrow at a lower interest rate, whenever their funds are shortend they can borrow from the QCB. Commercial banks have benefited from this measure since June 2017. As a result of the blockade, the value of repo borrowing has increased from an average of QR1.6 billion during Jan-May 2017 (i.e., before the embargo) to QR43.6 billion in June 2017 and reaching QR82.7 billion in October 2017 after which it oscillated
11 purchases of assets by QCB from commercial banks under a contract providing for their resale at specified price on a given future date (limited to two weeks or one month)12 Ibid

56
Qatar Economic Outlook 2018-2020
up and down to arrive at QR63.56 billion in March 2018 before falling to QR38.8 billion in April 2018, then to QR5.3 billion in May 2018, and then fluctutated up and down until it reached QR0.76 billion in September 2018 indicating the improvement of the status of the local banking system in relying on their own sources of funding.
Figure 2-34: Interbank transaction rates (weighted average)
0.751.001.251.501.752.002.252.502.753.003.253.50
1 Week 1 Month 1 Year
2.13
2.06
1.94
2.773.00
3.10
2016 2017 2018
May Ju
l
Aug
Aug
Aug
Jun
Jun
Jun
Sep
Oct
Oct
Dec
Dec
Nov Jan
Feb
Feb
Mar
Apr
Apr
May Ju
l
Sep
Sep
Nov Jan
Mar
May Ju
l
Source: Monthly Monetary Bulletin Qatar Central Bank
While the QCB does not directly affect market interest
rates or interbank rates, instead, it adjusts its policy rate rates as described in Box 2-1, which indirectly led to the modification of market interest and interbank rates during 2016-2018. As indicated in Figure 2-34, due to the movement of QMR overnight deposit and lending rates, the interbank interest rates for weekly transactions increased from 1.40% in May 2017 to 2.43% in March 2018 before declining to 2.06% in September 2018. The interest rates for monthly transactions ranged from 1.6% in May 2017 to 2.85% in April 2018 before falling to 2.77% in September 2018. Similarly, interest rates for annual and semi-annual transactions also remained at high levels. As for yearly transactions, they ranged from 2.5% in May 2017 to 3.35% in June 2018 before it declined to 3.10% in September 2018.
Official and international reserves
The monetary data for September 2018 indicates that Qatar’s total foreign exchange reserves, known as international reserves, reached nearly US$46.5 billion in September 2018, approaching a higher level of May 2017 when it was US$45.75 billion, with a Y-o-Y rise in September 2018 of 31% compared to September 2017.
Box 2-1: Monetary Policy
As needed, the QCB uses several monetary policy instruments including Required Reserve, Certificate of Deposits, QCB rates consisting of Lending Rate (QCBLR) and Deposit Rate (QCBDR), the Qatar Money Rate (QMR) represented by Lending Operation (QMRL) and Deposit Operation (QMRD), Open Market Operation represented by selling and buying Treasury Bill and Bonds, the REPO operation and Discount Window. The main objective of the QCB monetary policy is to maintain a fixed parity between the Qatari riyal (QR) and the United States dollar (USD) at QR3.64 per dollar. To achieve this objective, the above instruments are used, most notably the QCBLR as the leading indicator to convey signals to the market revealing the stance of its monetary policy whether it is an expansionary or contractionary policy. Although the QCBDR is a function of QCBLR, the QCBDR is more dynamic due to its linkages to the changes in world monetary policy, in particular, the US Federal Reserve’s monetary policy as a result of pegging the Qatari riyal to the US dollar.
In this regard, the QCBLR compound with the operations of QMR play a significant role in guiding the interbank rate and regulates market interest rates in general. The Monetary Policy Committee (MPC) chaired by the Governor of QCB manages monetary policy tools via reviewing interest rates on an ongoing basis in the light of developments in global interest rates that have an impact on the QCB lending rate.
The Central Bank of Qatar measures monetary liquidity by using four monetary criteria: primary liquidity, monetary base, and money supply at its narrow and broad terms. The initial liquidity consists of the excess reserve and other reserve deposits, while adding the required reserve and the currency issued to the primary liquidity would form
the monetary base. The bank also uses the commercial banks’ current-deposits account at QCB as a measure of the primary liquidity, since these funds are used as means of payment at the banks’ initiatives.
Regarding the narrow money supply, it consists of currency in circulation and demand deposits, but when adding time deposits and deposits in foreign currencies, the broad money supply is formed.
As for the level of the monetary multiplier in Qatar, which expresses the ratio of the broad money supply to the monetary base, it is the amount of money generated by the Qatari banking system from each Qatari Riyal deposited with the banking system. The multiplier measures the ability of the economy to create money from deposits available in the banking system, reflecting the level of economic activity. However, the calculation of the multiplier depends mainly on the mandatory required reserve ratio set by Qatar Central Bank from time to time in light of developments in the economy such as inflation rates and the level of aggregated demand, which reached 4.5% in August 2018. This required reserve ratio obliges the commercial banks not to lend 4.5% of their total deposits and instead to save it as reserves at their vault or at the Qatar Central Bank. Its implication is that if the ratio increases, the ability of banks to create credit decreases, but if this ratio decreases, the ability of banks to offer credit increases. The money multiplier of Qatar has increased from 5.5 points in 2009 to about 9 points in June 2018, which means that depositing QR100 in local banks would create about QR 550 in 2009 or QR 900 in June 2018, indicating the increasing role of banking deposits to generate credits, and thus the formation of wealth.

57
Part 2- Economic Performance 2017
As shown in Figure 2-35, the foreign exchange reserves in September 2018 was distributed between 41.8% of foreign currency reserve deposits in local banks, and 58.2% in official reserves, which consist of foreign bonds and treasury bills amounting to around 23% of total foreign reserves. Furthermore, gold reserves and balances in foreign banks, as well as balance at the IMF, account for 35.2% of total reserves.
Figure 2-35: International Reserve and percentage of its components
Deposits at foreign banks including Gold and IMF reserveTotal reserve ($ billion) (R-Axis)
Foreign Securities Official reserve Reserve deposits at local banks
USA
$ Bi
llion
As %
of T
otal
Inte
rnat
iona
l Res
erve
23.72 23.00
35.58 33.01
35.16
56.73
58.16
36.11
45.22 45.71
46.48
05101520253035404550
020406080
100120140160180200
2017 2018
20.23
41.84
43.27
Jan
Feb
Mar
Apr
May Jun Jul
Aug
Sep
Sep
Oct
Nov Dec Jan
Feb
Mar
Apr
May Jun Jul
Aug
Source: Monthly Monetary Bulletin of QCB and analysis of the PSA
As for the factors that led to the change of foreign-exchange reserves level during January 2017-September 2018, it can be theoretically concluded that the financing of the state budget deficit was one of the main reasons for the decline in reserves since January 2017, i.e., before the blockade. Figure 2-36 shows a decline in official reserves by about 5.1% to finance part of the state budget deficit along with other sources of financing the deficit, such as domestic borrowing, whether directly from local banks or by issuing bonds, Sukuk instruments, or treasury bills, and amounting to about QR48 billion in 2017 (see Public Debt section). It seems that the withdrawal of foreign exchange reserve in the form of foreign securities by 7.8% in January 2017, part of which was allocated to finance budget deficit while the remainder was deposited as foreign assets.
Figure 2-36: Contribution of International Reserve components to its total growth
Foreign Securities
Reserve deposits at local banks
Deposits at foreign banks including Gold and IMF reserve
Official reserve
Total reserve (Rate of Change %)
2017 2018
Poin
ts a
nd R
ate
of C
hang
e %
-50-40-30-20-10010203040
Jan
Feb
Mar
Apr
May Jun Jul
Aug
Sep
Sep
Oct
Nov Dec Jan
Feb
Mar
Apr
May Jun Jul
Aug
7.8-
10.9-
16.0
5.3-
3.2
29.5
10.4-
30.5
5.1-
2.3
Source: Monthly Monetary Bulletin of QCB and analysis of the PSA
In general, the international foreign-exchange reserves in January 2017 fell by about 10.4% due to the decline in official reserves (5.1 Percentage point- PP) and the withdrawal of part of the government’s reserve deposits with local banks (5.3 pp). As a result of the blockade imposed on the State of Qatar, the government has shifted from the policy of withdrawal from the local banking system to a depositary policy by transferring the assets of international reserves abroad (e.g Foreign Securities) in favor of deposits in local banks. Foreign bonds fell from around 49.5% of foreign-exchange reserves in May 2017 to only 9.96% in Mar 2018 before rising to 23% in September 2018.
In order to measure the impact of the policies taken by the Qatari government to confront the blockade, the month of May 2017 is used as a base month for calculating the rate of change of official reserves and government deposits in the Qatari banking system and, consequently, measuring their effect on the level of international reserves. Figure 2-37 indicates that the official reserves decreased by around 60% during June and July 2017 compared to May 2017.Thereafter, it continued to fluctuate upward and downward until it stabilized in December 2017 before achieving uneven growth during the first half of 2018, when it reached 20% in January 2018 and 25% in May 2018. On the other hand, it is noted that the government has compensated for the decrease in official reserves by increasing its deposits with local banks by 46% in June 2017 compared to May 2017. Subsequently, it increased its deposits in local banks by 21% in July 2017 compared to June 2017. The government also monitored the financial market and compensated the banking system whenever the official reserve dropped, as happened in November 2017. Nevertheless, in January 2018 it withdrew about 12% of its total reserve deposits.
Furthermore in June 2018, one year after the blockade started, the official reserve achieved a positive growth of 1.2% as a result of a 12% increase in reserves in foreign banks, which covered the decline of 10.9% in purchases of foreign bonds. Summing the increase of reserve deposits in local banks of around 11.3% and the 1.2% growth of official reserves, the growth of international reserves amounted to 12.5%. This proves that the Qatari economy has adapted to the regional economic changes and underscores its ability to overcome the impacts of the blockade. Moreover, this also suggests that local banks have become self-reliant in managing their own liquidity. This has enabled the QCB and Qatar Investment Authority to reverse their resources by increasing their balances with foreign banks and purchasing foreing securities during Mar-Sept of 2018 (see Box 2-2).

58
Qatar Economic Outlook 2018-2020
Figure 2-37: The impacts of monetary policy intervention on international reserve (%)
4 2-
2
30- 30-
14
17-
3
17-
5
20 11
25
2
46
21 2
0-
20
12-0-
1
1- 0-
12- 10-
8
9-
2 0
5
13
1
43-
33-
23-
13-
3-
7
17
27
37
47
2017 2018
Official reserve Reserve deposits at local banks
International reserveJa
n
Feb
Mar
Apr
May Jun
Jun Jul
Jul
Aug
Sep
Sep
Oct
Nov Dec
Aug
Source: Monthly Monetary Bulletin of the QCB and analysis of PSA staff (May 2017 is base month)
Public Debt
Figure 2-38 shows the evolution of public (i.e., government) debt from domestic sources (treasury bills, bonds, Sukuk) and foreign sources (mostly sovereign bonds for different periods of time), with public debt rising from QR209 billion in 2015 to QR297 in 2017, being equivalent to 49% of nominal GDP. The increase in the public debt (domestic and external) during the year 2017 came from the increase in the domestic debt component, which increased by QR46.3 billion (US$12.7 billion) with a growth rate of 32.7%, resulting from the issuance of QR14.6 billion in treasury bills, QR15.4 billion in Sukuk instruments, and QR18.5 in bonds. The Qatar Central Bank repaid treasury bills of QR9.5 billion, while there were no obligations on the Ministry of Finance for repayment of any bonds or Sukuk. Accordingly, the net debt flow from securities instruments in 2017 was QR38.9 billion. Furthermore, the MOF borrowed about QR7.36 billion in direct loans from commercial banks to render a total domestic indebtedness of about QR188.1 billion by December 2017.
Figure 2.38: Development of total public debt up to November 2018
$20.2
73.4
116.2 108.9 145.3
135.9
141.8 188.1
188.3
$31.9 $29.9 $39.9
$37.3
$39.0 $51.7
$51.7
209.3
258.0
297.0 333.5
$57.5=
$70.9=
$81.6= $91.6=
0
50
100
150
200
250
300
350
2015 2016 2017 Up to Nov. 2018
QR
billi
on =
USA
$
Foreign Domestic Total
Note: Source Ministry of Finance - Preliminary estimates of the PSA in the light of QCBdata on sukuk issuance, bonds and treasury bills (see Figure 2.22), but not including government and semi-government debt
As for the level of public debt in 2018, the PSA based on the most recent data of QCB estimated the total public debt to reach QR333.5 billion (US$91.6 billion) by November 2018. Most of the increase came from the issuance of international sovereign bonds in April 2018 at QR43.7 billion (US$12 billion), which increased the total external debt by 33% to QR145 billion compared to QR108.9 billion at the end of 2017, but at the same time the MOF repaid about QR7.3 billion (US$2 billion) to foreign creditors.
As for the initial estimates of local debt, despite the issuance of securities during (January- November 2018) about QR35.5 billion, distributed on QR10.1 billion of treasury bills, QR8.8 billion of Sukuk, and QR16.65 billion of bond. However, Qatar Central Bank has repaid treasury bills at QR11.84 billion, while the Ministry of Finance has so far paid about QR23.45 billion (distributed over QR8.4 billion of sukuk and QR15.05 billion of bonds). Consequently, the net flow of domestic debt will be QR0.2 billion, which would be added to the 2017’s domestic debet of QR188.1 billion to become QR188.3 billion by November 2018.
Concerning loans to Government-Related Entities (GRE) was estimated by MOF to be QR169.6 billion (US$46.6 billion) in November 2018. The GRE in Qatar are classified into four categories: the first category comprises the government institutions with direct government shares owned by either the Ministry of Finance or Qatar Central Bank. The second category consists of those government institutions with indirect government shares, such as companies related to Qatar Petroleum. Similarly, the third category is the government institutions with indirect government shares such as companies related to Qatar Investment Authority. The fourth category is made of institutions and companies that do not fall within the previous categories
Furthermore, the overall debt situation can also be highlighted from a monetary point view by examining and scrutinizing commercial banks’ claims on government entities. The Monthly Monetary Bulletin issued by Qatar Central Bank indicates that in Sept 2018, net claims, which express total indebtedness, fell from QR256.8 billion in January 2018 to QR221.4 billion in Sept 2018. The government’s net debt, which is reflected by the difference between government credit and total government deposits, is down from QR103.7 billion in January 2018 to QR78.4 billion in Sept 2018. However, it is appropriate to put a caveats on using the QCB’s claim data to be used as an indicative.

59
Part 2- Economic Performance 2017
Fiscal policy and public finance accountsThe public finance in Qatar witnessed positive developments during the period 2014-2018 as a result of financial and administrative reforms, combined with rising oil and gas prices, which helped to reduce the budget deficit within safe boundaries. As is widely known, public finance in Qatar, like other countries in the region, has suffered from a shortage of financial resources since mid-2014, resulting in a budget deficit of 9% in 2016 and 5.8% in 2017 due to lower oil prices, and coinciding with the government’s commitment to continue the pace of public investment in basic infrastructures, especially those related to preparations for hosting the World Cup in 2022, as well as the additional financial burdens required by the
circumstances facing the repercussions of the economic blockade by neighboring countries since mid-2017.
To overcome the financial challenges, the Qatari government adopted several legislative and administrative measures since 2015. The most important among these are the promulgation of the Financial Law No. 2 of 2015, which has become the legal framework for the implementation of the state budget, in conjunction with the adoption of a number of administrative procedures to mobilize public revenues for the purpose of diversifying income sources as well as reducing dependency on oil and gas revenues. As of the beginning of 2018, the MOF studied the possibility of establishing a government entity for Tax Authority and accordingly to redraft tax laws for income, value-added,
Box 2-2: The consequences of the blockade and its role in re-adjusting the Qatari economic path
The lowering of Qatar’s credit rating by the three credit rating agencies (S&P, Fitch Ratings and Moody’s) and placing it on the CreditWatch list with its negative implications constituted one of the most serious consequences of the economic blockade imposed on Qatar by the neighboring countries. The new rating contributed to the rising costs of insurance on Qatari sovereign debt against risk of default. The prices of credit default swap (CDS) - which represent the cost of insurance against sovereign debt - rose from an average of 64 points in May 2017 to 95 in June 2017 and to 108 points in August 2017 before retreating in November 2018 to about 74.3 points (Figure 1 of Box 2-2). In their evaluation reports issued in June and July 2018, Fitch and Moody’s indicated that the outlook has changed from negative to stable. Similarly, the S&P has upgraded Qatar’s outlook in December 2018 from negative to stable. This is attributed to the ability of the Qatari economy to overcome the repercussions of the economic, financial and diplomatic boycott of the Arab Quartet, as well as its ability to endure consequences for an extended period. The International
Monetary Fund report issued at the end of May 2018 suggested that a number of Qatari economic indicators had returned to normal, such as the increase of international reserve rate and the fall in the cost of insurance to levels close to the pre-blockade level.
The monetary policies adopted by the Qatari government to confront the repercussions of the blockade have been concentrated in international reserves swap and transfer. QCB , in coordination with Qatar Investment Authority, withdrew part of their investments abroad, either in the form of foreign bonds or treasury bills, and deposited them in local banks(as shown in Figure 2 of Box 2-2) in order to stimulate the domestic credit process of the private sector to revive the economy. However, it is remarkable that QCB since January 2018 has made reverse operations that contributed to increasing its assets with foreign banks through the purchase of foreign bonds and treasury bills, which will increase the external reserves of the State.
Figure 1 for Box 2-2: Qatar’s credit default swap index (CDS points)
82.86
74.00
25.45
19.08
10-
10
30
50
70
90
110
130
1 Year CDS5 Year CDS
Cred
it D
efau
lt S
wap
Poi
nts
Dec
-16
Jan-
17
Feb-
17
Mar
-17
Apr-
17
May
-17
Jun-
17
Jul-1
7
Aug-
17
Sep-
17
Oct
-17
Oct
-18
Nov
-17
Dec
-17
Jan-
18
Feb-
18
Mar
-18
Apr-
18
May
-18
Jun-
18
Jul-1
8
Aug-
18
Sep-
18
Source: Thomson Reuter and PSA
Figure 2 for Box 2-2: The trend of the Qatar Central Bank’s foreign assets development
35
50
65
80
95
110
125
140
155
2012
2013
2014
2015
2016
Years 2017 2018
QR
Billi
on
Net Foreign assets with Qatar Central BankAsset balances with local banks
Jan
Feb
Mar
Apr
May Jun Jul
Aug
Sep
Oct
Nov Dec Jan
Feb
Mar
Apr
May Jun Jul
Aug
Sep
Source: Monthly Monetary Bulletin of the QCB and analysis of PSA

60
Qatar Economic Outlook 2018-2020
and excise which aim to be implemented during the coming years. Furthermore, the coordination mechanism between MOF and QCB has been intensified with regard to the adoption of fiscal and monetary policy measures, thus financing the budget deficit through non-inflationary sources including both domestic and foreign borrowing, in conjunction with measures taken to reduce current expenditures while maintaining capital expenditures so as to ensure the sustainability of economic and social development.
It is notable that since 2016 the MOF has applied a system for economic and functional tabulation of the state budget in concordance with the standards of the international system of Government Finance Statistics of 2014, which will combine with the financial law to form an integrated framework for the process of preparation and implementation of the state budget. The MOF has also initiated the preparation of a medium-term budget framework and the adoption of a mechanism to set fiscl policy outline and expenditure limits as a reference for government institutions when preparing their budgets.
General Fiscal Balance
The MOF anticipated the overall fiscal balance of the 2018 Budget to record a deficit of about QR28.1 billion ($7.7 billion), which equals 4.1% of GDP, at the end of the year. However, thanks to the policy of rationalizing expenditures, improving the efficiency and effectiveness of government spending, and with the positive impact of the increase in oil and gas prices in the international market, the overall fiscal balance during the first half of 2018 has instead achieved a surplus of about 2.1% of respective GDP, a trend that is expected to continue until the end of 2018 (see Part-1).
Figure 2-39: State Budget Balance (as percentage of GDP)
13.6 1.2 (9.0)
(5.8)
0.6 3.5
(20.0) (10.0)
- 10.0 20.0 30.0 40.0 50.0 60.0 70.0
2014 2015 2016 2017 2018
Revenue Expenditure Budget Balance
Q1 Q2 Q3 Q4 2014 Q1 Q2 Q3 Q4 2015 Q1 Q2 Q3 Q4 2016 Q1 Q2 Q3 Q4 2017 Q1 Q2
Source: Monthly Monetary Bulletin of the QCB and analysis of PSA staff There is very little difference between the deficit figures by quarters versus the annual total of 5.8 percent versus 5.7 percent of GDP
Regarding implementation of the state budget during 2017, preliminary financial data indicate that the overall
fiscal balance amounted to about QR34.6 billion, which constituted 5.69% of nominal GDP, compared to the deficit achieved in 2016 of about QR51 billion, which equaled 9.24% of nominal GDP. As for the overall fiscal balance of 2015, it reached a surplus of 1.2% of nominal GDP as shown in Figure 2-39.
In calculating the primary fiscal balance, which equals the overall fiscal balance minus interest payments of the public debt, it amounted to about QR26.4 billion, which constituted 4.3% of nominal GDP. On the other hand, the primary fiscal balance for the non-hydrocarbon account, which equals the primary fiscal balance plus the total gross revenue less revenues from the income tax on oil companies and the income of Qatar Petroleum’s investments, equalled 27% of the total non-hydrocarbon GDP compared to 32% in 2016, mainly due to the decrease in non-hydrocarbon revenues and the growth in non-hydrocarbon GDP.
Government Revenues
The preliminary data of actual revenues for the Fiscal Year 2017 indicate that total revenue amounted to QR160.5 billion (US$44 billion), down about 6.1% from 2016 (QR171 billion or US$47 billion), and also down by 6% compared with what was planned during 2017’s budget preparation. The decline of 2017’s revenue was due to lower returns from Qatar Petroleum’s investments of around 18% and non-oil revenues by about 7.7% as indicates in Table 2-6. However, the decline in 2017 of about 6% was lower than the rate of decline in 2016, which was 33.4%. In other words, QP’s reinvestment of part of its annual income in the operation, maintenance, and expansion of oil production capacity and gas liquefaction effectively reduced government revenues and decreased the surplus achieved during the year. The oil and gas revenue data produced an excess of 3.2% in the form of royalties and income taxes on oil and gas companies, as well as the exploitation and extraction
Table 2-6: Fiscal Revenues by Economic Classification (QR billion)QR Billion 2016 2017 2018
Actual Pre-actual Budget BudgetOil and Gas Revenues 81.1 83.8 81.0 84.0 Dividend income (QP) 59.6 48.9 49.1 49.1 Non-oil revenue 30.14 27.82 40.08 42.03 Total Revenus 170.9 160.5 170.1 175.1 Nomina GDP 552 608 608 689
As % of Nominal GDPOil and Gas Revenues 14.7 13.8 13.3 12.2 Dividend income (QP) 10.8 8.1 8.1 7.1 Non-oil revenue 5.5 4.6 6.6 6.1 Total Revenus 30.9 26.4 28.0 25.4
Source: Ministry of Finance and analysis of PSA

61
Part 2- Economic Performance 2017
gas revenues by 3.8%, resulting solely from a projected growth in oil production rather than from a rise in international oil prices. The increase in non-oil revenues was estimated at 4.9% to reflect the efforts of the MOF to mobilize non-oil resources such as initiating the collection of taxes and fees on some goods and services.
Government expenditures
As a result of the drop in public revenues over the past few years, the government, represented by the Ministry of Finance, has introduced a package of reforms to rationalize public spending. The total preliminary actual public expenditure for 2017 was about QR196 billion ($53.8 billion), that is, a limited reduction (1.3%) when compared with what was planned in the 2017 budget (QR198 billion). The rationalization process has decreased total public spending by around 11.8% vis-à-vis the amount spent in 2016 (QR222 billion), which came from a decrease in current expenditures by 5.7% and in investment expenditures by about 18.8%.
Figure 2-41: Ratios of fiscal expenditure’ main components and total rate of change (%)
20 18 18 26 27 24 26
32 25 33
46 43 49 48
22.4
0.7- 10.8-11.8-
1.3 2.4
-20
0
20
40
60
80
100
2013 2014 2015 2016 2017
As %
of T
otal
Exp
endi
ture
s
Wages and salariesGoods and services
Interest paymentsOther expenseCapital ExpenditureExpenditure (change %)
2017 (budget)
2018 (budget)
7 4 7 7
6 7 6 6 4 4 4 4
4 4
37 47 38 18 19
17 17
Source: Ministry of Finance and analysis of PSA
The decline in current expenditures in 2017 was mainly due to a significant decrease in payroll and wage spending, which fell by 8% compared to the previous year, while the remaining items of current expenditures fell by 5.3% during the year, as opposed to 2016, when the decrease in current spending was a result of a lowering of public expenditure on goods and services.
It is quite challenging to make a numerical comparison for 2017 with 2016 because some items in the public budget were redefined in 2016 as a result of the implementation of the Government Financial Statistics System 2014 (see Introduction of this section and Box 2-3). It is also difficult to compare 2017 with fiscal year 2015, which was (nominally) only nine months’ duration (not twelve months) as a result of adjusting the fiscal year to run from January - December of each year
fees resulting from the increase in oil and gas prices in the international market.
The total public revenue of the State of Qatar in 2017 was about 26.4% of GDP, the majority of which derived from oil and gas revenues, whose relative importance is estimated at 52% of the total public revenues in 2017. It was followed by the relative importance of the investment income of Qatar Petroleum at 30%, while the contribution of other revenues was 17%.
It is worth noting that the relative importance of oil and non-oil revenues to total public revenues fluctuated during the period 2013-2017 because of changes in oil prices as well as the changes in the reinvestment rates in Qatar Petroleum. In addition, the amendments by the MOF to redefine and reclassify some items in the general budget 2016 (see Box 2-3 Page 62) have changed the relative importance of revenue components since, under these amendments, income taxes of companies engaged in extractive industries were transferred to oil and gas revenues and Qatar Petroleum investments income (dividends).
Figure 2-40: Ratios of fiscal revenues’ main components and total rate of change (%)
2013 2014 2015 2016 2017 Budget 2017 Budget 2018
As %
of T
otal
Rev
enue
s
Dividend income QPOthers RevenuesOil and Gas Revenues
Total Revenues (change %)
0.3-
25.2-33.4-
6.1-
6.0 2.9
40-
20-
0
20
40
60
80
100
25.9 31.6 39.9 34.9 30.5 28.8 28.0
17.2 16.8
19.4 17.6 17.3 23.6 24.0
56.0 50.9 40.1 47.5 52.2 47.6 48.0
Source: Ministry of Finance and analysis of PSA
On the non-oil revenue side, customs revenues decreased in 2016 and 2017 by 25% and 52.6%, respectively. However, the collection of miscellaneous income imposed on non-oil sector entities, which accounts for the most significant item in the “Non-Oil Revenues” Chapter, picked up from QR7.7 billion in 2015 to QR16 billion in 2016, before falling to QR14.6 billion in 2017, representing about 9% of total public revenues in 2017. This is attributed - in part - to raising the fees for public utilities (water and electricity), which began in the fourth quarter of 2016.
During the year 2018, the State budget estimated total public revenues to be QR175 billion, an increase of 2.9% compared to the State Budget of 2017 as shown in Figure 2-40. This revenue was calculated under the assumption of an average price of crude oil to be $45 per barrel and thus had an expectation for an increase in oil and

62
Qatar Economic Outlook 2018-2020
instead of, as previously defined, from April – March. Thus, Figure 2-41 is to be considered as only indicative of the ratios of relative changes in fiscal expenditures during 2017-2018.
Concerning the implementation of the general budget indicates that actual government expenditures recorded in 2017 were lower by 1.3% from the budget estimates of the same year. This is mainly due to a decrease in investment expenditure, which amounted to 43% of actual total spending, compared to a 49% share of planned expenditures. Despite rationalization policies adopted by the government during the past years, it is evident from Figure 2-41 that some categories of actual current expenses exceeded planned spending in the framework of the 2017 budget.
For the year 2018, the State budget estimated total public expenditure to be approximately QR203 billion, an increase of 2.4% over the State budget of 2017, with anticipated increases in current spending by 4.7% due to the rises of its components, particularly the absolute values of wages and salaries by 8.7%, and other parts of current expenditures by 1.3%, while capital expenditures remained at the same level as in the 2017 budget.
Regarding the distribution of expenditure by functional classification as indicated in Table 2-7, investment expenditure accounted for 42.5% of total public expenditures in 2017, compared with 46% in 2016. The current expenditures of 2017 have increased to 57.5% of total expenditures compared to its level in 2016; this increase was mainly due to an increase in the operational and maintenance expenses of public services including education and health, balanced by a decrease in government entities related to economic affairs, entertainment, and culture.
In relation to expenditures by economic classification in 2016, those government institutions related to general public services accounted for 36.4% of total public spending, followed by government institutions related to economic affairs which accounted for 25.8% of total public expenditures. Public expenditures for Health and education accounted for 21.3% of total expenditures, followed by recreation, entertainment and housing by 16.5%. Some of the increase in current public spending in 2017 reflects the level of support provided by government to cope with the repercussions of the blockade on the one hand, and on the other side because of the reclassification of current expenditures (Table 2-7).
Box 2-3: Ministry of Finance’s efforts to implement the GFS Manual
The MOF has stepped up its efforts to complete the implementation of the GFS Manual 2014, which aims at enhancing transparency in public finances and facilitate monitoring, tracking and auditing. Some of the budget items were reclassified since 2016 as follows:1. The definition of “salaries and wages” item has been
amended to include both the employees of central government and employees of government agencies, such as independent schools and some health-care facilities. This has led to a clear rise in “salaries and wages” item and a significant reduction in “other current
expenditure” item in 2016, where the payments to such employees were previously grouped into this item.2. Transfer of the “secondary capital expenditure” item,
which used to include expenditure on goods and services from current expenditures item to the “capital expenditure” item. This resulted in a rise in investment expenditure item in 2016 and a contraction of secondary capital expenditure item.
3. Transfer of the income taxes imposed on oil and gas companies to the “oil and gas revenues” item, which also includes the royalties and QP investments income.
Table 2-7: Fiscal expenditure according to economic and functional classifications (%)
2016 2017
As % of Total Expenditure
As % of Total Economic
classification
As % of Total Functional
classificationAs % of Total Expenditure
As % of Total Economic
classification
As % of Total Functional
classification
Current Capital Current Capital Current Capital Current Capital
Public services 36.4 39.0 33.4 57.7 42.3 37.1 45.5 25.7 70.5 29.5
Economic and Environmental affairs
25.8 9.9 44.3 20.8 79.2 27.0 8.9 51.6 18.8 81.2
Education 10.5 14.8 5.4 76.1 23.9 8.9 12.0 4.7 77.6 22.4
Health 10.8 15.7 5.1 78.3 21.7 10.7 15.2 4.6 81.6 18.4
Recreation, culture and religion
10.0 13.6 5.7 73.6 26.4 9.7 12.1 6.4 71.9 28.1
Housing and community amenities
6.5 6.9 6.0 57.1 42.9 6.6 6.3 7.0 54.7 45.3
Total 100 100 100 53.9 46.1 100 100 100 57.5 42.5
Source: Ministry of Finance and Analysis of PSA
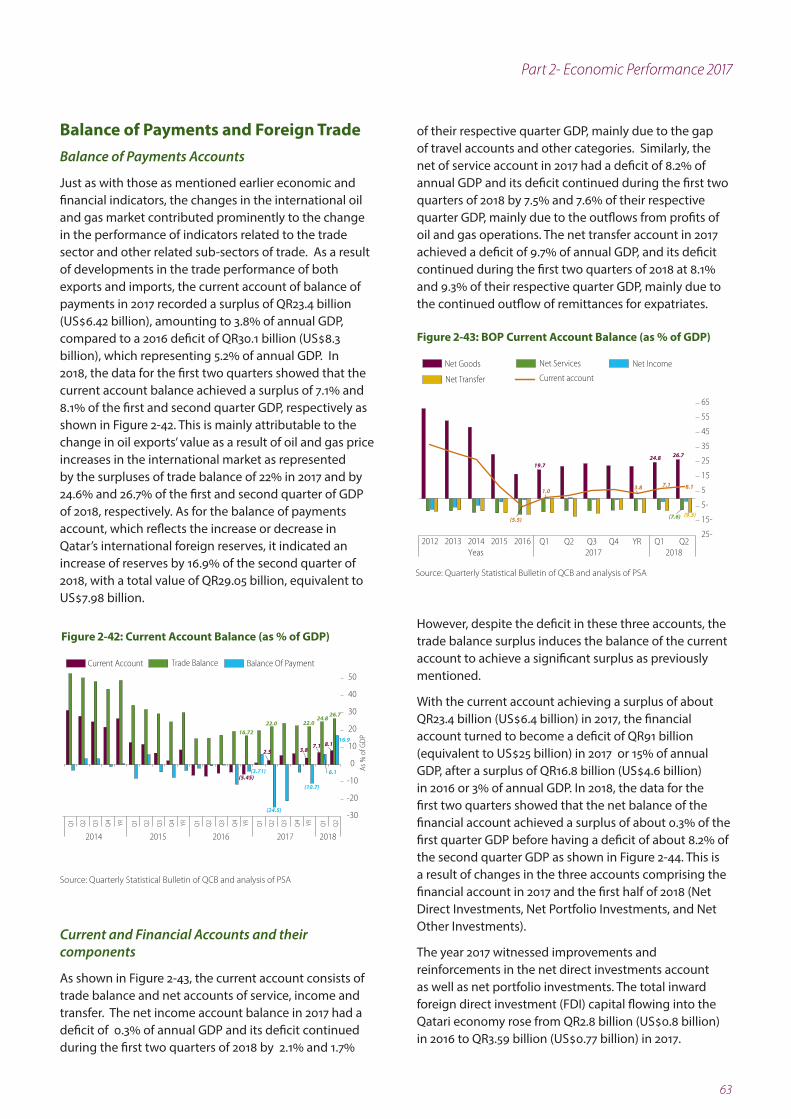
63
Part 2- Economic Performance 2017
Balance of Payments and Foreign TradeBalance of Payments Accounts
Just as with those as mentioned earlier economic and financial indicators, the changes in the international oil and gas market contributed prominently to the change in the performance of indicators related to the trade sector and other related sub-sectors of trade. As a result of developments in the trade performance of both exports and imports, the current account of balance of payments in 2017 recorded a surplus of QR23.4 billion (US$6.42 billion), amounting to 3.8% of annual GDP, compared to a 2016 deficit of QR30.1 billion (US$8.3 billion), which representing 5.2% of annual GDP. In 2018, the data for the first two quarters showed that the current account balance achieved a surplus of 7.1% and 8.1% of the first and second quarter GDP, respectively as shown in Figure 2-42. This is mainly attributable to the change in oil exports’ value as a result of oil and gas price increases in the international market as represented by the surpluses of trade balance of 22% in 2017 and by 24.6% and 26.7% of the first and second quarter of GDP of 2018, respectively. As for the balance of payments account, which reflects the increase or decrease in Qatar’s international foreign reserves, it indicated an increase of reserves by 16.9% of the second quarter of 2018, with a total value of QR29.05 billion, equivalent to US$7.98 billion.
Figure 2-42: Current Account Balance (as % of GDP)
(5.45)
2.5 3.8 7.1 8.1
16.72 22.0 22.0
24.8 26.7
(3.71)
(24.5)
(10.7)
6.1
16.9
-30
-20
-10
0
10
20
30
40
50
2014 2015 2016 2017 2018
As %
of G
DP
Current Account Trade Balance Balance Of Payment
Q1
Q2
Q3
Q4 YR Q1
Q2
Q3
Q4 YR Q1
Q2
Q3
Q4 YR Q1
Q2
Q3
Q4 YR Q1
Q2
Source: Quarterly Statistical Bulletin of QCB and analysis of PSA
Current and Financial Accounts and their components
As shown in Figure 2-43, the current account consists of trade balance and net accounts of service, income and transfer. The net income account balance in 2017 had a deficit of 0.3% of annual GDP and its deficit continued during the first two quarters of 2018 by 2.1% and 1.7%
of their respective quarter GDP, mainly due to the gap of travel accounts and other categories. Similarly, the net of service account in 2017 had a deficit of 8.2% of annual GDP and its deficit continued during the first two quarters of 2018 by 7.5% and 7.6% of their respective quarter GDP, mainly due to the outflows from profits of oil and gas operations. The net transfer account in 2017 achieved a deficit of 9.7% of annual GDP, and its deficit continued during the first two quarters of 2018 at 8.1% and 9.3% of their respective quarter GDP, mainly due to the continued outflow of remittances for expatriates.
Figure 2-43: BOP Current Account Balance (as % of GDP)
19.7 24.8 26.7
(7.6) (9.3)(5.5)
1.0 3.8 7.1 8.1
25-
15-
5-
5
15
25
35
45
55
65
2012 2013 2014 2015 2016Yeas 2017 2018
Net Goods Net Services Net Income
Net Transfer Current account
Q1 Q2 Q3 Q4 YR Q1 Q2
Source: Quarterly Statistical Bulletin of QCB and analysis of PSA
However, despite the deficit in these three accounts, the trade balance surplus induces the balance of the current account to achieve a significant surplus as previously mentioned.
With the current account achieving a surplus of about QR23.4 billion (US$6.4 billion) in 2017, the financial account turned to become a deficit of QR91 billion (equivalent to US$25 billion) in 2017 or 15% of annual GDP, after a surplus of QR16.8 billion (US$4.6 billion) in 2016 or 3% of annual GDP. In 2018, the data for the first two quarters showed that the net balance of the financial account achieved a surplus of about 0.3% of the first quarter GDP before having a deficit of about 8.2% of the second quarter GDP as shown in Figure 2-44. This is a result of changes in the three accounts comprising the financial account in 2017 and the first half of 2018 (Net Direct Investments, Net Portfolio Investments, and Net Other Investments).
The year 2017 witnessed improvements and reinforcements in the net direct investments account as well as net portfolio investments. The total inward foreign direct investment (FDI) capital flowing into the Qatari economy rose from QR2.8 billion (US$0.8 billion) in 2016 to QR3.59 billion (US$0.77 billion) in 2017.
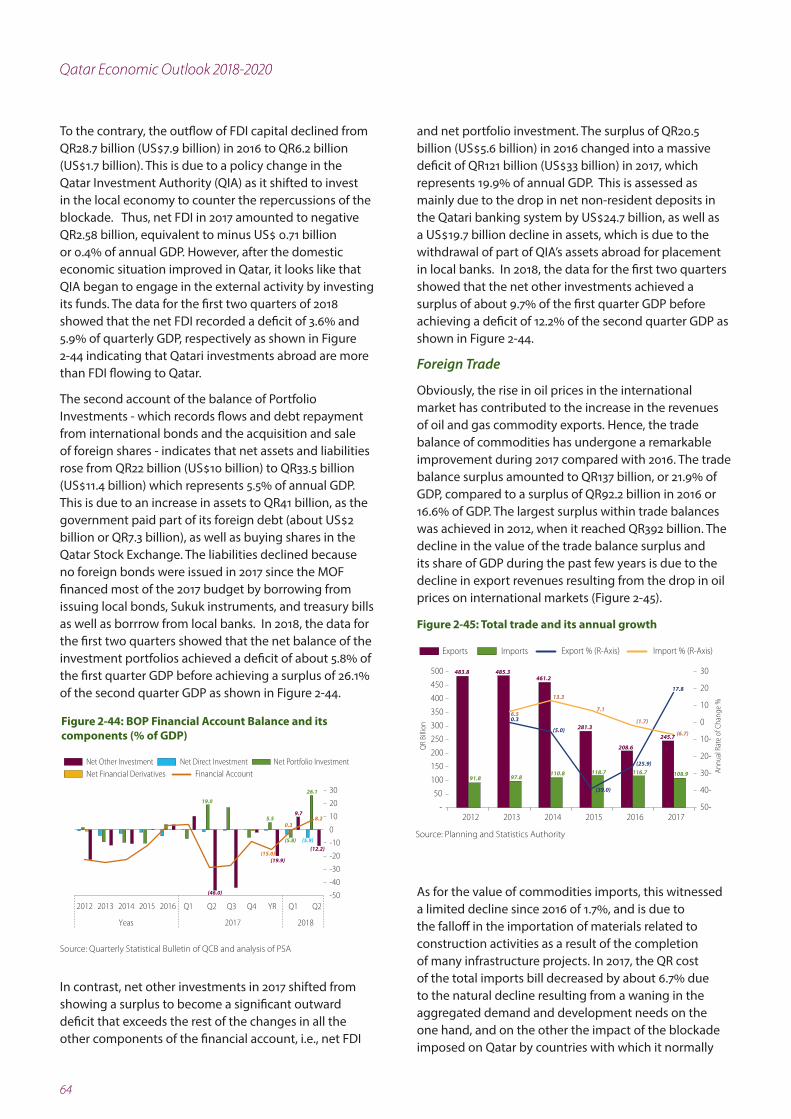
64
Qatar Economic Outlook 2018-2020
To the contrary, the outflow of FDI capital declined from QR28.7 billion (US$7.9 billion) in 2016 to QR6.2 billion (US$1.7 billion). This is due to a policy change in the Qatar Investment Authority (QIA) as it shifted to invest in the local economy to counter the repercussions of the blockade. Thus, net FDI in 2017 amounted to negative QR2.58 billion, equivalent to minus US$ 0.71 billion or 0.4% of annual GDP. However, after the domestic economic situation improved in Qatar, it looks like that QIA began to engage in the external activity by investing its funds. The data for the first two quarters of 2018 showed that the net FDI recorded a deficit of 3.6% and 5.9% of quarterly GDP, respectively as shown in Figure 2-44 indicating that Qatari investments abroad are more than FDI flowing to Qatar.
The second account of the balance of Portfolio Investments - which records flows and debt repayment from international bonds and the acquisition and sale of foreign shares - indicates that net assets and liabilities rose from QR22 billion (US$10 billion) to QR33.5 billion (US$11.4 billion) which represents 5.5% of annual GDP. This is due to an increase in assets to QR41 billion, as the government paid part of its foreign debt (about US$2 billion or QR7.3 billion), as well as buying shares in the Qatar Stock Exchange. The liabilities declined because no foreign bonds were issued in 2017 since the MOF financed most of the 2017 budget by borrowing from issuing local bonds, Sukuk instruments, and treasury bills as well as borrrow from local banks. In 2018, the data for the first two quarters showed that the net balance of the investment portfolios achieved a deficit of about 5.8% of the first quarter GDP before achieving a surplus of 26.1% of the second quarter GDP as shown in Figure 2-44.
Figure 2-44: BOP Financial Account Balance and its components (% of GDP)
19.0
5.5
26.1
9.7
(12.2)
0.3 8.2
-50
-40
-30
-20
-10
0
10
20
30
2012 2013 2014 2015 2016
Yeas 2017 2018
Net Direct Investment Net Portfolio InvestmentNet Financial DerivativesNet Other Investment
Financial Account
(46.0)
(15.0)(19.9)
(5.8) (5.9)
Q1 Q2 Q3 Q4 YR Q1 Q2
Source: Quarterly Statistical Bulletin of QCB and analysis of PSA
In contrast, net other investments in 2017 shifted from showing a surplus to become a significant outward deficit that exceeds the rest of the changes in all the other components of the financial account, i.e., net FDI
and net portfolio investment. The surplus of QR20.5 billion (US$5.6 billion) in 2016 changed into a massive deficit of QR121 billion (US$33 billion) in 2017, which represents 19.9% of annual GDP. This is assessed as mainly due to the drop in net non-resident deposits in the Qatari banking system by US$24.7 billion, as well as a US$19.7 billion decline in assets, which is due to the withdrawal of part of QIA’s assets abroad for placement in local banks. In 2018, the data for the first two quarters showed that the net other investments achieved a surplus of about 9.7% of the first quarter GDP before achieving a deficit of 12.2% of the second quarter GDP as shown in Figure 2-44.
Foreign Trade
Obviously, the rise in oil prices in the international market has contributed to the increase in the revenues of oil and gas commodity exports. Hence, the trade balance of commodities has undergone a remarkable improvement during 2017 compared with 2016. The trade balance surplus amounted to QR137 billion, or 21.9% of GDP, compared to a surplus of QR92.2 billion in 2016 or 16.6% of GDP. The largest surplus within trade balances was achieved in 2012, when it reached QR392 billion. The decline in the value of the trade balance surplus and its share of GDP during the past few years is due to the decline in export revenues resulting from the drop in oil prices on international markets (Figure 2-45).
Figure 2-45: Total trade and its annual growth
483.8 485.3 461.2
281.3
208.6
245.7
91.8 97.8 110.8 118.7 116.7 108.9
0.3
(5.0)
(39.0)
(25.9)
17.8
6.5
13.3
7.1
(1.7)
(6.7)
50-
40-
30-
20-
10-
0
10
20
30
-
50
100
150
200
250
300
350
400
450
500
2012 2013 2014 2015 2016 2017
Exports Imports Export % (R-Axis) Import % (R-Axis)
Annu
al R
ate
of C
hang
e %
QR
Billi
on
Source: Planning and Statistics Authority
As for the value of commodities imports, this witnessed a limited decline since 2016 of 1.7%, and is due to the falloff in the importation of materials related to construction activities as a result of the completion of many infrastructure projects. In 2017, the QR cost of the total imports bill decreased by about 6.7% due to the natural decline resulting from a waning in the aggregated demand and development needs on the one hand, and on the other the impact of the blockade imposed on Qatar by countries with which it normally

65
Part 2- Economic Performance 2017
trades, either as a transit port or as the country of origin of some goods. The Qatari importation from blockade countries was averaged around 13% of total commodity imports during the period 2012-2016. Because of the role played by the blockading countries in obstructing the flow of imports through land and seaports, the State of Qatar acted promptly change the ways and means of transporting imports and finding other source countries from which to import its needed goods. Consequently, the proportion of imports from neighboring blockading countries dropped by about 50%. As Figure 2-46
Figure 2-46: Total value of monthly imports of commodities (QR billion)
11.1
8.5
5.9
12.7
11.0
10.0 9.7
8.9
11.4
9.8
5
6
7
8
9
10
11
12
132016 2017 2018
اثر الحصار
Jan
Feb
Mar
Apr
May Jun Jul
Aug
Sep
Oct
Nov Dec
Source: Planning and Statistics Authority
attests, the trajectory of imports in 2017 compared to 2016 indicates that the State of Qatar has successfully overcome the negative consequences of the blockade. Furthermore, the pace of imports since the beginning of
August 2017 has recovered to return to its previous level, and in some months exceeded the concomitant level in 2016
In order to determine which imports fell due to the blockade, Figure 2-47 shows that capital goods (transport machinery and equipment) - which account for the largest proportion of total imports - are relatively affected by the blockade due to the nature of their shipment and transport, which require large vessels. Thus, the process of finding appropriate alternative means of shipment and transportation required time, and arrived at a compensatory stage only in Q4 (Quarter four), after falling significantly in Q2 and Q3. Total imports recovered more during the first three quarters of 2018, rising by 4.2% in the first quarter of 2018 compared to the first quarter of 2017. The second quarter of 2018 increased by 15.8% compared to the second quarter of 2017, and the third quarter rose by about 29.5% compared to the third quarter of 2017.
Figure 2-47: Value of Quarterly imports by its main groups (QR billion)
3.1 2.9 2.6 2.8 2.7 2.9 3.1 3.1 2.9 1.5 1.8 1.6 1.8 2.2 1.5 1.8 1.8 1.9 2.4 2.5 2.2 2.5 2.0 2.2 2.6 2.5 2.6
4.6 4.6 4.5 4.0 3.5 3.4 4.3 4.0 4.5
14.0 12.0 12.0 11.8 9.3 9.3
12.2 12.4 13.2
5.2 4.9
4.4 4.1
4.2 3.5
4.1 3.9 4.4
(3.0)
2.0
7.0
12.0
17.0
22.0
27.0
32.0
2016 2017 2018
QR
Billi
on
Food & Beverage
Crude materials and mineral fuelsChemical
Manufactured
Machinery
Others
Q1 Q2 Q3 Q1 Q2 Q3 Q1 Q2 Q3
Source: Planning and Statistics Authority


Gross domestic productGross domestic product (GDP) is a fundamental macroeconomic aggregate that plays a central role in macroeconomic analysis, although it has limitations (see below).
What is GDP?GDP is widely used as a measure of economic output, as it represents the value of final goods and services produced in a given period of time, usually one year. Another way of looking at it is as the sum of value added across all sectors in the economy over a period.
How is GDP measured?There are three main approaches to measure GDP, which should give the same results.
• Production approach: GDP is equal to the sum of value added across all sectors i.e. the gross output minus the value of intermediate consumption of goods and services summed across all sectors.
• Expenditure approach: GDP is the sum of final consumption of goods and services by the government and private sector; of gross investment (additions to physical stock of capital in the economy, including changes in inventories); and of net exports of goods and non-factor services (exports minus imports).
• Income approach: GDP is the sum of all income generated from the production process. This includes compensation of employees, and the gross operating surplus of enterprises such as profits, rents and interest.
What is the difference between GDP valued at factor cost and at market prices? GDP at factor cost is the sum of all factor-of-production incomes generated from the production process (such as wages, profits, rents and interest), while GDP valued at market prices is GDP at factor cost plus indirect output taxes, less subsidies to businesses, which creates
Glossary—Key economic and finance concepts
a wedge between the incomes earned by factors of production and the price paid for output in the market.
What is the difference between nominal and real GDP?Nominal GDP values economic output using current prices, the prices prevailing over the period during which GDP is measured. Accordingly, changes in nominal GDP will reflect changes in prices as well as changes in the volume of output. Real GDP values output at constant prices by using the prices of a selected year called the “base year”. When relative prices change, the choice of the base year can influence measured real GDP growth.
What is the GDP deflator?This is simply the ratio of nominal and real GDP, and hence it can be considered a measure of the aggregate price level of all domestically produced goods and services in the economy.
What is GDP per capita?This is total GDP divided by the resident population of the country. While it is commonly used as a proxy for standard of living, GDP per capita is not a measure of personal income nor necessarily of the representative well-being of the population.
What are the limitations of GDP as a measure for economic output and income?GDP measures do not normally capture the value of goods and services that are not traded in the market, such as volunteer and charitable services and goods and services produced for own use. Similarly, the existence of a large underground economy or black-market activities (which are not that important in Qatar) would result in a GDP measure that underestimates the true size of the economy.
What is final consumption?This consists of goods and services used by the household and government sectors to satisfy their current needs or wants.
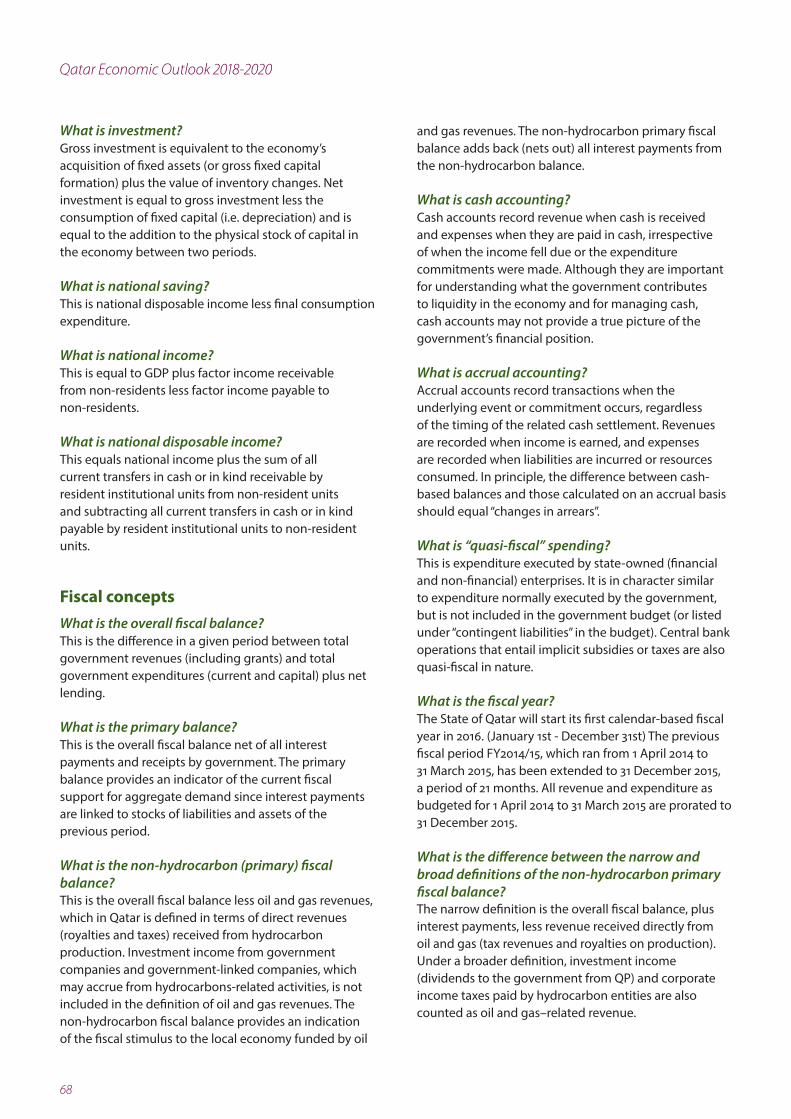
68
Qatar Economic Outlook 2018-2020
What is investment? Gross investment is equivalent to the economy’s acquisition of fixed assets (or gross fixed capital formation) plus the value of inventory changes. Net investment is equal to gross investment less the consumption of fixed capital (i.e. depreciation) and is equal to the addition to the physical stock of capital in the economy between two periods.
What is national saving?This is national disposable income less final consumption expenditure.
What is national income?This is equal to GDP plus factor income receivable from non-residents less factor income payable to non-residents.
What is national disposable income?This equals national income plus the sum of all current transfers in cash or in kind receivable by resident institutional units from non-resident units and subtracting all current transfers in cash or in kind payable by resident institutional units to non-resident units.
Fiscal conceptsWhat is the overall fiscal balance?This is the difference in a given period between total government revenues (including grants) and total government expenditures (current and capital) plus net lending.
What is the primary balance? This is the overall fiscal balance net of all interest payments and receipts by government. The primary balance provides an indicator of the current fiscal support for aggregate demand since interest payments are linked to stocks of liabilities and assets of the previous period.
What is the non-hydrocarbon (primary) fiscal balance?This is the overall fiscal balance less oil and gas revenues, which in Qatar is defined in terms of direct revenues (royalties and taxes) received from hydrocarbon production. Investment income from government companies and government-linked companies, which may accrue from hydrocarbons-related activities, is not included in the definition of oil and gas revenues. The non-hydrocarbon fiscal balance provides an indication of the fiscal stimulus to the local economy funded by oil
and gas revenues. The non-hydrocarbon primary fiscal balance adds back (nets out) all interest payments from the non-hydrocarbon balance.
What is cash accounting?Cash accounts record revenue when cash is received and expenses when they are paid in cash, irrespective of when the income fell due or the expenditure commitments were made. Although they are important for understanding what the government contributes to liquidity in the economy and for managing cash, cash accounts may not provide a true picture of the government’s financial position.
What is accrual accounting?Accrual accounts record transactions when the underlying event or commitment occurs, regardless of the timing of the related cash settlement. Revenues are recorded when income is earned, and expenses are recorded when liabilities are incurred or resources consumed. In principle, the difference between cash-based balances and those calculated on an accrual basis should equal “changes in arrears”.
What is “quasi-fiscal” spending?This is expenditure executed by state-owned (financial and non-financial) enterprises. It is in character similar to expenditure normally executed by the government, but is not included in the government budget (or listed under “contingent liabilities” in the budget). Central bank operations that entail implicit subsidies or taxes are also quasi-fiscal in nature.
What is the fiscal year?The State of Qatar will start its first calendar-based fiscal year in 2016. (January 1st - December 31st) The previous fiscal period FY2014/15, which ran from 1 April 2014 to 31 March 2015, has been extended to 31 December 2015, a period of 21 months. All revenue and expenditure as budgeted for 1 April 2014 to 31 March 2015 are prorated to 31 December 2015.
What is the difference between the narrow and broad definitions of the non-hydrocarbon primary fiscal balance?The narrow definition is the overall fiscal balance, plus interest payments, less revenue received directly from oil and gas (tax revenues and royalties on production). Under a broader definition, investment income (dividends to the government from QP) and corporate income taxes paid by hydrocarbon entities are also counted as oil and gas–related revenue.

69
Glossary
The non-hydrocarbon primary fiscal balance is an indicator of the stimulus that government spending provides to the non-oil and gas economy. Cyclically adjusted measures can be used to gauge the fiscal stance of government. A non-hydrocarbon fiscal deficit (inclusive of interest charges) larger than the budgetary resources that oil and gas resources can yield implies future charges on fiscal resources.
Financial market conceptsWhat is a secondary market?A secondary market is one where investors can trade assets or securities with others, as opposed to simply purchasing them from the issuing entities themselves.
What are second-lien bond offerings?Second-lien debts are subordinate to the rights of other, more senior debts issued against the same collateral, or a portion of the same collateral. In the event of a default, second-lien debts stand behind higher-lien debts in terms of rights to collect proceeds from the debt’s underlying collateral. For this reason, second-lien debt is usually considered riskier than higher-lien debt and often comes with a higher interest rate. Issuing such securities usually points to financing difficulties, meaning the issuer is unable to obtain funds via traditionally established avenues.
Monetary conceptsWhat is reserve money or M0?Reserve money is a liability of the central bank. It is the sum of (i) currency issued by and held outside the central bank; (ii) banks’ deposits at the central bank to satisfy reserve requirements and for clearing purposes; and (iii) in the case of Qatar, other reserves including bank deposits at the central bank in excess of requirements. Reserve money can also be expressed in terms of the central bank’s counterpart assets, which fall into two main categories: net foreign assets, which comprise the net official international reserves plus any other net foreign assets that are less liquid and hence are not included in the net official international reserves; and net domestic assets, which include central bank net claims on government (claims minus deposits) and claims on other sectors.
What is narrow money or M1?This is currency in circulation plus demand deposits. Narrow money is considered “liquid”. Narrow money typically pays zero or relatively low rates of interest.
What is “quasi money”?This is the less liquid part of the money supply and includes savings deposits and all deposits denominated in foreign currency.
What is “broad money” or M2?This is the sum of quasi-money and M1.
What are official foreign reserves?These are the central bank’s liquid foreign assets that can be used to secure the country’s external payments at any moment. Reserves include gold, foreign exchange, and the reserve position at the International Monetary Fund. Reserves are usually presented in net terms by excluding from the gross official foreign reserves the central bank’s foreign liabilities.
What is “credit”? Credit creation involves the provision of resources by the lender (such as banks or any other financial institution) to the borrower. In this way the lender acquires a financial claim and the borrower incurs a liability to repay in the future. Credit to non-financial sectors (such as government, private businesses and households) is mainly used to finance production, consumption and capital formation.
What is the trailing price-to-earnings ratio?This is calculated by taking the current stock price and dividing it by a company’s trailing earnings per share for the past 12 months. This measure differs from the forward price-to-earnings ratio, which uses earnings estimates for the next four quarters.
What is the price-to-book ratio?This ratio compares a stock’s market value to its book value, calculated by dividing the current closing price of the stock by the latest quarter’s book value per share.
Balance-of-payments conceptsWhat is the trade balance? This is the difference between a nation’s imports and exports of merchandise measured over a specified period (normally a calendar year). The trade balance is part of the wider current account balance.
What is the free on board (f.o.b.) price?The f.o.b. price of exports and imports of goods is the market value of the goods at the point of uniform valuation (the customs frontier of the economy from which they are exported). It is equal to the cost, insurance, freight (c.i.f.) price less the costs of transport

70
Qatar Economic Outlook 2018-2020
and insurance charges, between the customs frontier of the exporting (importing) country and that of the importing (exporting) country.
What is the c.i.f. price? The c.i.f. price is the price of a good delivered at the frontier of the importing country, including any insurance and freight charges incurred to that point, or the price of a service delivered to a resident, before the payment of any import duties or other taxes on imports or trade and transport margins within the country.
What is the income and services balance?This is the sum of net income received from non-residents and the balance in services trade measured over a specified period. The income account comprises flows derived from labour (wages paid to non-resident employees) and from net investment income. The services balance consists mainly of payments for travel, transport, communications, construction, housing rentals and financial services.
What is the current account balance?This is the sum of the trade, income and services balances, plus net current transfers, which include cash transfers, gifts in kind and remittances (which are sizeable in Qatar) sent by foreign workers to families back home. It is termed the current account because goods and services are generally consumed in the current period.
What is the capital and financial account balance?This records purchases or sales of financial assets or transactions related to international borrowing and lending. It also includes capital transfers.
What is the international investment position and the capital accountThe international investment position of a country is a financial statement presenting both the composition and value of a country’s external financial assets and liabilities. The difference between these assets and liabilities is its net international investment position.
What is external debt?This is the stock of outstanding contractual liabilities, issued by the public and private sector to non-residents, that have been disbursed.
Exchange rate conceptsWhat is the bilateral exchange rate? This is the price of one currency measured in units of another. The nominal US dollar exchange rate for the Qatari riyal is pegged at QR3.64 = $1.
What is the nominal effective exchange rate (NEER)?Unlike the bilateral exchange rate, the NEER is not a market price but an index number that measures the weighted average of the country’s bilateral exchange rate against a basket of trading partners’ currencies over a given period. The size of the weights normally reflects their relative importance in the country’s international trade or in its overall foreign transactions, including external financial transactions. Movement of the NEER provides an indication of changes in the value of the domestic currency against the currencies in the basket. An appreciation occurs when a domestic currency unit can buy more of the basket of currencies.
What is the real effective exchange rate (REER)?This is the NEER adjusted for differential inflation rates between a home country (Qatar, for example) and its trading partners. An appreciation of the REER can occur either because the NEER is appreciating or because domestic inflation in the home country (Qatar) is higher than that in its trading partners. Changes in the REER provide a measure of the change in the currency’s purchasing power and of the price competitiveness of the country’s tradeable goods and services against trading partners’ goods and services.
