qmc development capital fund plc - rns submit · qmc development capital fund public limited...
TRANSCRIPT

QMC Development Capital Fund Public Limited Company
(A closed-ended investment Company with variable capital incorporated with limited liability under the laws of Ireland, registered number 375367)
UNAUDITED INTERIM REPORT AND CONDENSED FINANCIAL STATEMENTS
FOR THE PERIOD ENDED
30 JUNE 2012

QMC Development Capital Fund Public Limited Company
2
CONTENTS General Information 3 Investment Manager’s Report 4 - 11 Condensed Statement of Assets and Liabilities 12 Condensed Statement of Operations 13 Condensed Statement of Changes in Net Assets Attributable to 14 Participating Shareholders Condensed Cash Flow Statement 15 Notes to the Financial Statements 16 - 24 Schedule of Investments 25 Geographic & Economic Division of Investments 26 Schedule of Portfolio Changes 27

QMC Development Capital Fund Public Limited Company
3
GENERAL INFORMATION Directors Oscar Garcia Aguilera (Spanish-Irish Resident)* John Broughan (Irish)* Jose Manuel Romay de la Colina (Spanish)* David Hammond (Irish)* Company Secretary Tudor Trust Limited, 33 Sir John Rogerson's Quay, Dublin 2, Ireland. Registered Office George’s Quay House, 43 Townsend Street, Dublin 2, Ireland. Investment Manager Nmás1 Asset Management, S.G.I.I.C., S.A. Padilla, 17, 28006 Madrid, Spain. Custodian RBC Investor Services Bank S.A., Dublin Branch, (effective 27 July 2012, formerly RBC Dexia Investor Services Bank S.A. Dublin Branch) George’s Quay House, 43 Townsend Street, Dublin 2, Ireland. Listing Sponsor Dillon Eustace, 33 Sir John Rogerson's Quay, Dublin 2, Ireland. *Independent Non Executive Director
Independent Auditors Deloitte & Touche, Chartered Accountants and Registered Auditors, Deloitte & Touche House, 29 Earlsfort Terrace, Dublin 2, Ireland. Legal Advisers Ireland Dillon Eustace, 33 Sir John Rogerson's Quay, Dublin 2, Ireland. Legal Advisers Spain Clifford Chance, Paseo de la Castellana, 110, 28046 Madrid, Spain. Administrator & Paying Agent RBC Investor Services Ireland Limited, (effective 27 July 2012, formerly RBC Dexia Investor Services Ireland Limited) George’s Quay House, 43 Townsend Street, Dublin 2, Ireland.

QMC Development Capital Fund Public Limited Company
Investment Manager Report 30 June 2012
General Information General Information
4
Source: RBC Dexia, Bloomberg and QMC
Summary of drawdowns / capital refunds
Source: RBC Dexia, Bloomberg and QMC
(*) Adjusted to eliminate the effect of the capital refunds of €15 M (February 2007), €30 M (December 2007), €15 M (July 2008), €15 M (October 2008), €12 M (December 2008) and €6 M (December 2009). This involves a total NAV reduction of €0.72564 (0.11704, 0.23408, €0.11704, €0.11704, €0.09369 and €0.04682 respectively).
Capital commitment: €160.000.000 Launch date: 28 October 2003 Investment vehicle: Irish SICAV
(Non-UCITS) Fiscal year ends: 31 December
Investment manager: N+1 AM ISIN: IE0033665054 Custody and Trustee: RBC Dexia Bloomberg ticket: QMCDVCA ID Auditor: Deloitte & Touche SEDOL number: 3-366-505 Headquarters: Ireland Currency: Euro
Capital commitment: €160,000,000 Pay-outs: % capital commitment:
29 October 2003 31 March 2004
9 June 2004 22 September 2004 17 December 2004
10 February 2005 16 March 2005
5 April 2006
€146,000,000 91.25%
€16,000,000 €18,000,000 €14,500,000 €14,500,000 €20,000,000 €20,000,000 €18,000,000 €25,000,000
Capital refunds: % pay-outs:
9 February 2007 14 December 2007
25 July 2008 30 October 2008
12 December 2008 21 December 2009
€93,000,000 63.7%
€15,000,000 €30,000,000 €15,000,000 €15,000,000 €12,000,000
€6,000,000
NAV Class A (29-06-2012): €0.55449 NAV Class A adjusted (29-06-2012) (*): €1.28013

QMC Development Capital Fund Public Limited Company
Investment Manager Report 30 June 2012 (continued)
Portfolio breakdown
CIE Autom.; 50%
Campofrio; 26%
Unipapel; 14%
Azkoyen; 7%
Mota Engil; 4%
Source: RBC Dexia, QMC
NAV Performance
0
50.000.000
100.000.000
150.000.000
200.000.000
250.000.000
300.000.000
oct-0
3
feb-
04
jun-
04
oct-0
4
feb-
05
jun-
05
oct-0
5
feb-
06
jun-
06
oct-0
6
feb-
07
jun-
07
oct-0
7
feb-
08
jun-
08
oct-0
8
feb-
09
jun-
09
oct-0
9
feb-
10
jun-
10
oct-1
0
feb-
11
jun-
11
oct-1
1
feb-
12
jun-
12
Net investment NAV total Class A
Hidden capital gains: €18MPending capital: €53MTotal NAV of the Fund: €71MPerformance June 2012: +0.5%Performance 2012: -3.4%
2nd refund€30M
4th refund €15M
3rd refund €15M
5th refund€12M
Total investment: €146M
1st refund€15M
6th refund€6M
Source: RBC Dexia, Bloomberg and QMC
Divestments completed
CIE Automotive
Unipapel Azkoyen Other
Divestment (€m) 106,6 25,0 11,1 6,7 7,9 157,2Capital gains (€m) 17,0 17,0 6,0 2,6 (5,4) 37,2
Times money (x) 1,2x 3,1x 2,2x 1,6x 0,6x 1,3x
TOTAL DIVESTMENTS
PARTIAL DIVESTMENTSTOTAL
Source: QMC
5

QMC Development Capital Fund Public Limited Company
Investment Manager Report 30 June 2012 (continued)
Second quarter of 2012
1. Macro update
During the second quarter of the year there has been a change in the world macro economic trends with a slowdown in the main economies such as US or Germany (recent ISM manufacturing data indicating contraction) which has also been extended to some emerging countries such as China or Brazil. All this in a context on which Europe is in recession and its strongest economies are already contaminated by the austerity measures undertaken in the weakest, ultimately leading to a negative growth spiral.
Slowdown in main world economies
and clear recession in Europe
At a European level, it is worth highlighting that during the last few weeks the EU has made relevant decisions for its future sustainability which confirms our constructive outlook for the Euro’s future. These measures show the commitment of the euro zone move forward united despite the eventual need to cede sovereignty or mutualize losses. Specifically, the announced measures in the last summit are: i) direct help to Spanish banks by EU rescue mechanisms; ii) possibility for these mechanisms to buy peripheral debt in the secondary market; iii) creation of a plan to stimulate growth amounting to €120m; and iv) consolidation of the Central European Bank as the European banking regulator.
Europe is fighting for the survival of the Monetary and Economic Union
During this quarter, the capital markets have been intently focused on Spain due to the possibility of an eventual rescue as the risk premium has almost reached 700bp. Market tensions have eased after the announcement of direct help to the Spanish banks which implies a breakup of the correlation between the sovereign risk and the banking risk. This, together with the rest of the measures that the Spanish government is carrying out, such as the labor market reform, VAT rises, cuts of unemployment benefits or public employees’ salary, will lay the foundations for a flexible and competitive economy in the medium term. Having said this, short term forecasts continue to be sluggish due to high debt levels (families and businesses) of the economy, increasing tax pressure over consumers and high unemployment rates.
Spain: adjustment measures in order
to improve competitiveness in
the long term despite sluggish
short term situation
We maintain the same macro scenario for the coming years as in previous reports. In Europe, we expect slight drops of the aggregated GDP for 2012 (due to the strong austerity measures and the impact of euro uncertainties in the real economy) and a next phase of modest growth (once current systemic risks fade away) in which the recent structural measures implemented in the main economies with problems will gradually impact positively in the economy. In US we expect that the recent recovery of the economy will slow down due to the performance of the euro zone. However, at a global level, we continue to bet for a reasonable positive growth in the medium term led by the emerging countries (especially BRICs) where we consider the governments have enough flexibility to implement new policies to eventually face potential episodes of economic slowdown.
For 2012 we expect GDP drops
in Europe and slowdown in US,
although at a global level we
consider that the emerging
economies will continue to boost economic growth
6

QMC Development Capital Fund Public Limited Company
Investment Manager Report 30 June 2012 (continued)
2. Recent market trends and relative QMC performance
Current macro situation together with the intense pessimism and cautious outlook of investors regarding the euro zone have dragged the main indexes during the second quarter of the year. Having said this, it is worth highlighting that the EU Summit decisions have slightly eased the tension in the markets during the last weeks.
Generalized drops during 2Q 12. Recent EU Summit decisions
have slightly eased the tension in the
markets
Taking into account the above, the Spanish indexes have been the worst performers during the second quarter of the year. Specifically, the IBEX 35 has dropped 11% and the IBEX small cap has fallen even more (19%) as a reflection of the increasing aversion of investors to the lack of liquidity in markets with low visibility.
Strong penalization of the Spanish indexes
during the second quarter of the year
The quality of our investment portfolio (highly concentrated in solid companies, exposed to global markets and with ambitious M&A development plans) continues to be shown in its relative outperformance. The QMC Fund fell -5.2% during the 2Q12 and -3.4% YTD, versus the IBEX Small Cap (-19% in 2Q 2012 and -28% YTD).
Outperformance (-3.4% YTD vs -28% of
IBEX Small Cap)
Large part of our active management during the last years has been focused on the internationalization processes of our companies, thus, nowadays the international markets are their main source of organic growth (70% of sales come from abroad Spain and Portugal), which makes our portfolio highly defensive. In addition, our companies are exposed to markets less exposed to the cycle (automobile, food), they have a solid financial strength (85% of our portfolio with ND/EBITDA lower than 2.5x), and a strong cash-flow generation capacity (94% of our portfolio in historical maximum levels of EBITDA and free cash flow generation in 2011).
Defensive portfolio exposed to global
growth
Our portfolio is mainly concentrated in 3 companies (CIE Automotive, Unipapel and Campofrío) with positive forecasts (improve or repeat 2011 results), despite the difficult macro situation and thanks to its international exposure. Taking into account these good estimates, we believe our portfolio still has a strong revaluation potential higher than the market. Specifically:
Undervalued portfolio despite good
forecasts for 2012 due to its strong
internationalization
CIE (trades <5x EV/EBITDA 12 vs. historical levels of 6x): its direct exposure to the Spanish market in its main business of automotive components has always been symbolic (lower than 5% of sales). Moreover, more than 50% of its EBITDA comes from its quoted Latin-American subsidiary Autometal (despite the recent slowdown of the automotive market in Brazil, structural perspectives continue to be positive in the medium term). Additionally, we do not rule out potential corporate transactions which will generate value and increase its international exposure (especially in Asian markets).
Unipapel (trades at 6X PER 12): in hardly 4 years the company has been transformed from a pure domestic company with exposure to declining businesses into a pan-European leader in the wholesale of office consumables, services and solutions after the recent transformational acquisitions of Adimpo and Spicers. Currently, 80% of the EBITDA comes from abroad Spain. The group now faces domestic European competitors with strong competitive advantages.
Campofrío (trades at EV/EBITDA < 6x vs. its peers 7-8x). It has become the leading European meat processor with a strong growth potential, after its merger with Smithfield in 2008, in a highly defensive sector. Nowadays, nearly 60% of its EBITDA comes from other European countries such as France, Germany, Italy or the Netherlands.
7

QMC Development Capital Fund Public Limited Company
Investment Manager Report 30 June 2012 (continued)
3. Investment strategy
A capital reduction was carried out on the 4 of July for a total amount of €9m. We continue to work on the total divestment of the fund in order to meet our commitment with investors.
Capital reduction of €9m in July 2012
During this final phase of the divestment of the fund, we are highly focused in releasing hidden value of our companies once completed and communicated to the market the value creation plans of our companies (already executed or in process):
Final phase: unlock value in our
investments in the shortest time possible
CIE Automotive (50% of the portfolio): we are actively supporting CIE’s management team to develop new growth markets and to analyze possible corporate transactions that may contribute to release value and, eventually, allow for an organized restructuring of the capital.
Campofrio Food Group (26% of the portfolio): we are developing close relations with other financial shareholders in order to boost value creation and reorganize the capital structure.
Unipapel (14% of the portfolio): once completed successfully the transformational acquisition of Spicers and the Group’s conversion into a pan-European leader in the wholesale of office consumables, we are promoting new initiatives to optimize the financial structure of the Group, improve liquidity and favor shareholder rotation.
Azkoyen (7% of the portfolio): we have actively boosted and supported an ambitious industrial and operating restructuring plan in Azkoyen during the last year which should contribute to significant cost savings and efficiency improvement in 2012. This, together with the recovery of the core business of payment systems, will lay the foundations for our exit, coordinated with the interests of other long-term shareholders.
Mota Engil (4% of the portfolio): our pressures to focus the Group on working capital optimization, ROCE maximization and leverage reduction should bear fruits in the coming months. In any case, QMC’s presence in the company is insignificant and we recently communicated to the Portuguese regulator the reduction of our holding below the threshold of 2%.
8

QMC Development Capital Fund Public Limited Company
Investment Manager Report 30 June 2012 (continued)
Core positions Cie Automotive (50% of the portfolio) Recent events Our investment thesis
Despite the 5% drop of sales and EBITDA in 1Q 12, margins have remained stable (14%) thanks to cost savings (mainly in Europe)
9
Source: Bloomberg CampofrÍo (26%)
Recent events Our investment thesis Sales in 1Q 12 +3.1% LFL (+20.5% including Fiorucci). By regions, Southern Europe +7.8% LFL and North +1.5% thanks to the optimization plan of the product portfolio and focus on branded products
EBITDA in 1Q 12 of €34m (vs. €33m in Q1 11) with margin drops (7.6% vs 8.8% in Q1 11) due to the annual 4% rise of the raw material prices which can only be corrected gradually via price increases
Despite the difficult environment and the inflationary pressure of raw materials, the company expects to grow in sales and optimize its costs during 2012 in the context of the new strategic plan announced at the beginning of the year (main target is the optimization of the product portfolio focused on most profitable products, improvement of the operating efficiency and ROCE maximization)
We consider that the new strategic plan is focused on creating value for shareholders. Considering it is a difficult replicable model by its competitors, it will allow to consolidate CFG as the leading pan European of the branded processed meat producer
Share performance
3.0
4.0
5.0
6.0
7.0
8.0
9.0
10.0
Campofrío IBEX Small Cap
Plan Become the largest Pan-European player in the fragmented market of branded processed meat with a leading position across all its markets
Next steps Implement and achieve the main targets of the new strategic plan for 2012-15: i) 3-5% sales growth; ii) 12% EBITDA margin; iii) 13-15% ROCE; iv) <3x NFD/EBITDA
Align the interests of financial shareholders (47% of the capital)
Value EV/EBITDA < 6.0x whilst peers with double-digit EBITDA margin trade at 7-8x
Increasing speculative and corporate angle due to rotation of the shareholding structure after the failed takeover by Smithfield: higher interest to divest by financial investors
Risks Rising raw material costs and difficult transfer to selling prices
Delay of the capital rotation process
Source: Bloomberg
By geographies, slight sales growth in 1Q 12 in Europe (+1%) with an important EBITDA margin improvement (15% vs 13% in 1Q 11). In Latam, sales have fallen 14% and margins 180bp, due to the destocking in the Brazilian market during 1Q 12 and the effect of the cancelation of a specific non-profitable order in Mexico in 3Q 11
Despite macro uncertainties, we expect that CIE will end up 2012 with a slight drop in sales and a stable EBITDA. We expect a recovery of sales during 2S 12 in Latam and new cost savings to come through. Structurally, the business faces an attractive growth due to its current strong exposure to emerging economies (Brazil, NAFTA, Eastern EU, etc.) and its bet to continue growing in new markets
Plan Consolidation as Tier II player with leading presence in Europe and Latin-America Internationalization towards RICs (Russia, India and China) Use of the proceeds from the IPO (of the Brazilian business) for acquisitions
Next steps Assist in eventual corporate transactions
Boost the sale of non-core assets
Help to improve communication/ share liquidity
Value Share performance The share trades at very attractive multiples (4-5x EV/ EBITDA12). Discount vs. its historical multiples and its sector (c. 6X EBITDA)
2.02.53.03.54.04.55.05.56.06.57.0
Cie Automotive IBEX Small Cap
Risks Slowdown of global growth / emerging countries
Currencies volatility (Brazil, Mexico and USD)
Problems in the execution of new acquisitions
QMC Development Capital Fund Public Limited Company
Investment Manager Report 30 June 2012 (continued) Unipapel (14%) Recent events Our investment thesis
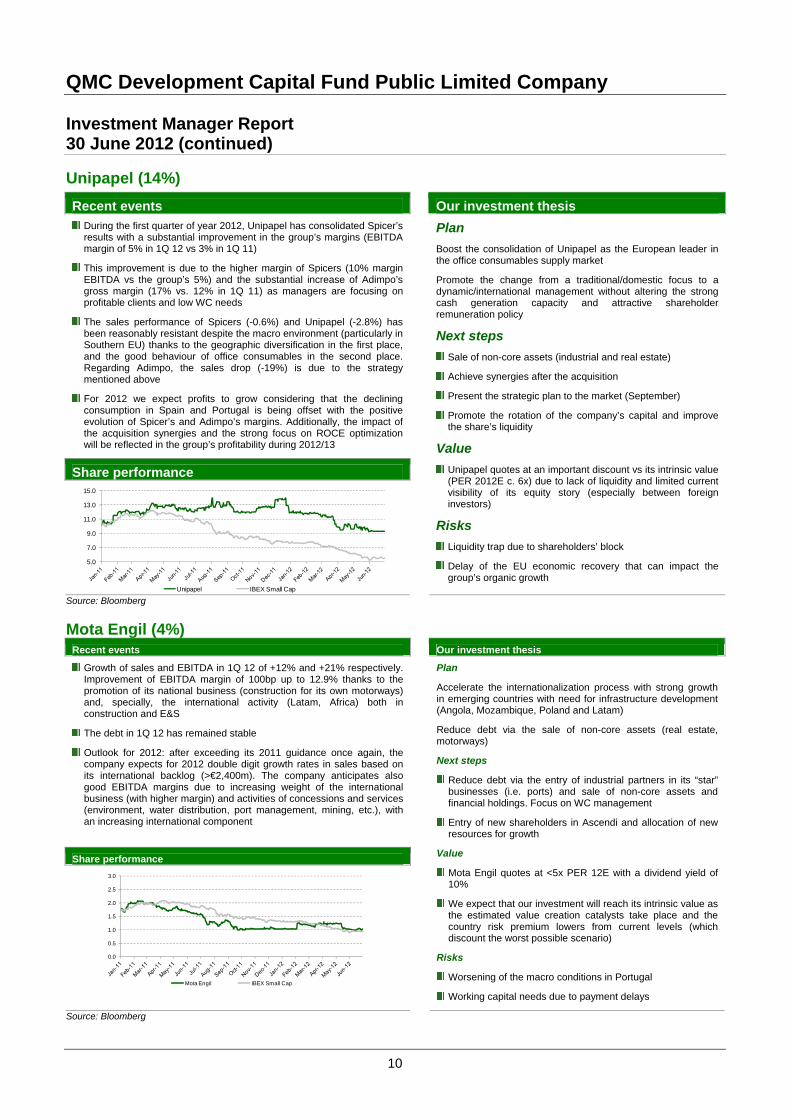
During the first quarter of year 2012, Unipapel has consolidated Spicer’s results with a substantial improvement in the group’s margins (EBITDA margin of 5% in 1Q 12 vs 3% in 1Q 11)
10
Source: Bloomberg Mota Engil (4%)
Recent events Our investment thesis
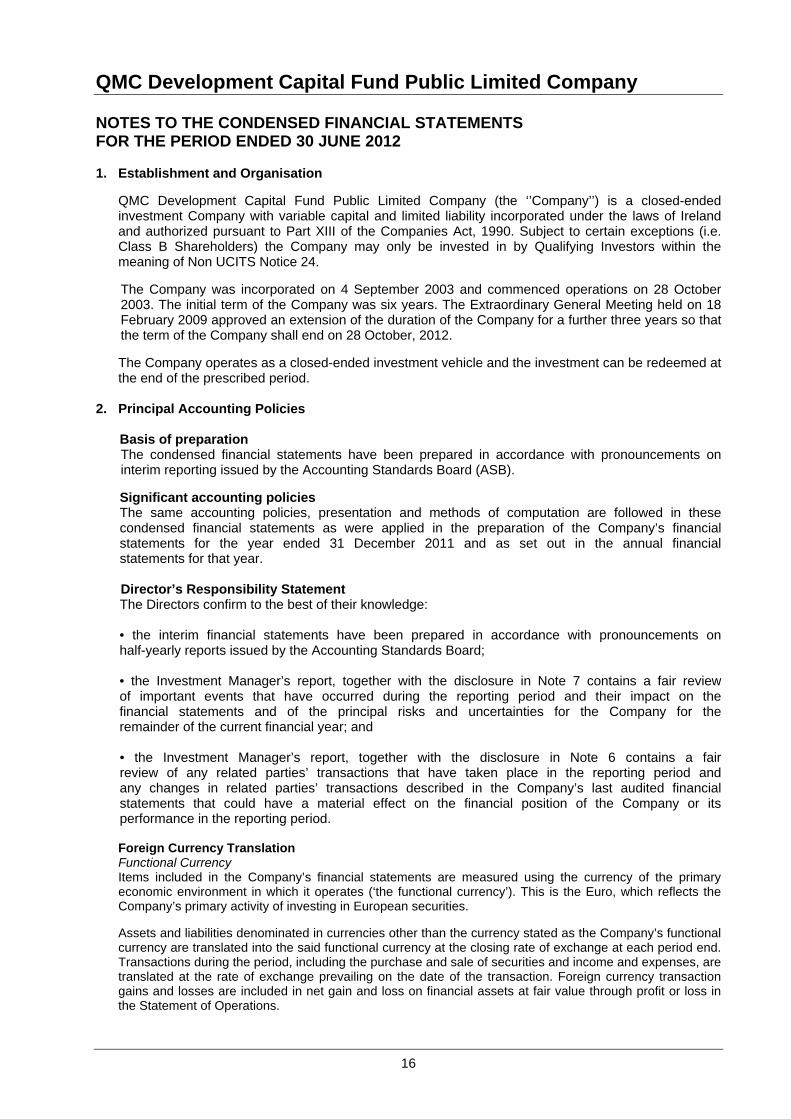
Growth of sales and EBITDA in 1Q 12 of +12% and +21% respectively. Improvement of EBITDA margin of 100bp up to 12.9% thanks to the promotion of its national business (construction for its own motorways) and, specially, the international activity (Latam, Africa) both in construction and E&S
The debt in 1Q 12 has remained stable
Outlook for 2012: after exceeding its 2011 guidance once again, the company expects for 2012 double digit growth rates in sales based on its international backlog (>€2,400m). The company anticipates also good EBITDA margins due to increasing weight of the international business (with higher margin) and activities of concessions and services (environment, water distribution, port management, mining, etc.), with an increasing international component
Share performance
0.0
0.5
1.0
1.5
2.0
2.5
3.0
Mota Engil IBEX Small Cap
Plan
Accelerate the internationalization process with strong growth in emerging countries with need for infrastructure development (Angola, Mozambique, Poland and Latam)
Reduce debt via the sale of non-core assets (real estate, motorways)
Next steps
Reduce debt via the entry of industrial partners in its “star” businesses (i.e. ports) and sale of non-core assets and financial holdings. Focus on WC management
Entry of new shareholders in Ascendi and allocation of new resources for growth
Value
Mota Engil quotes at <5x PER 12E with a dividend yield of 10%
We expect that our investment will reach its intrinsic value as the estimated value creation catalysts take place and the country risk premium lowers from current levels (which discount the worst possible scenario)
Risks
Worsening of the macro conditions in Portugal
Working capital needs due to payment delays
Source: Bloomberg
This improvement is due to the higher margin of Spicers (10% margin EBITDA vs the group’s 5%) and the substantial increase of Adimpo’s gross margin (17% vs. 12% in 1Q 11) as managers are focusing on profitable clients and low WC needs
The sales performance of Spicers (-0.6%) and Unipapel (-2.8%) has been reasonably resistant despite the macro environment (particularly in Southern EU) thanks to the geographic diversification in the first place, and the good behaviour of office consumables in the second place. Regarding Adimpo, the sales drop (-19%) is due to the strategy mentioned above
For 2012 we expect profits to grow considering that the declining consumption in Spain and Portugal is being offset with the positive evolution of Spicer’s and Adimpo’s margins. Additionally, the impact of the acquisition synergies and the strong focus on ROCE optimization will be reflected in the group’s profitability during 2012/13
Plan Boost the consolidation of Unipapel as the European leader in the office consumables supply market
Promote the change from a traditional/domestic focus to a dynamic/international management without altering the strong cash generation capacity and attractive shareholder remuneration policy
Next steps Sale of non-core assets (industrial and real estate)
Achieve synergies after the acquisition
Present the strategic plan to the market (September)
Promote the rotation of the company’s capital and improve the share’s liquidity
Value
Share performance Unipapel quotes at an important discount vs its intrinsic value (PER 2012E c. 6x) due to lack of liquidity and limited current visibility of its equity story (especially between foreign investors)
5.0
7.0
9.0
11.0
13.0
15.0
Unipapel IBEX Small Cap
Risks Liquidity trap due to shareholders’ block
Delay of the EU economic recovery that can impact the group’s organic growth

QMC Development Capital Fund Public Limited Company
11
Investment Manager Report 30 June 2012 (continued) Azkoyen (7%)
Source: Bloomberg
Recent events Our investment thesis The first quarter of year 2012 Azkoyen has been marked by two different
first place, a consistent improvement of the gross margin .4% in 1Q 11) as a consequence of the successful
trends, on the(40.4% vs 38restructuring program; and in the second place, a drop of sales (-6% in 1Q 12) due to the generalized economic slowdown in Europe
Despite the improvement of the gross margin, EBITDA in 1Q 12 has dropped down to €3.0m (vs. €3.7m) due to the strong increase of R&D (additional €0.8m in 1Q 12 vs 1Q 11) which will be concentrated on the
rm for the development of new first half of the year and serve as a platfoproducts/technologies in order to boost organic growth
Despite the current macro situation of economic uncertainty, we expect 2012 will gradually improve as i) the downward trend of sales has reverted during April/May; ii) the results still not incorporate totally the positive impact of the restructuring plan, which in divisions such as Primion, will make margins converge to reasonable historical averages (much higher than current). Having sagroup’s growth target sales for 2012 (+6%
id this, in order to meet the ), we still should see an
important increase of the activity in Spain and a continuation of the t trend of Coges (electronic payment systems) and current improvemen
Coffetek (coffee vending in UK)
Share performance
1.0
1.5
2.0
2.5
3.0
IBEX Small Cap
Plan
om an industrial, diversified and low e holding to a group specialized in its high-tech and ded niche businesses in a pan-European context
Reconversion of AZK frprofitablvalue ad
Next steps
Achievement of the new strategic targets and consolidation of the industrial restructuring
Shareholding structure simplification
Search alternatives for low ROCE contribution businesses
Value
The star business (payment systems) trades below 4x
ng process of the group
EV/EBITDA if we strip out the market value of the rest of the assets: hidden value which we expect will be unlocked with the industrial restructuri
Risks
Late recovery of the demand in vending and payment systems due to clients’ financing restrictions
Delay in the development of the designed corporate strategy
Azkoyen

QMC Development Capital Fund Public Limited Company
CONDENSED STATEMENT OF
12
ASSETS AND LIABILITIES
Notes Jun-30 2012 Dec-31 2011EUR EUR
AS AT 30 JUNE 2012 ASSETS
Financial Assets at Fair Value through Profit or Loss (Cost 2012: €75,550,421; Cost 2011: €107,254,292) Investment in Subsidiary Amount Receivable on Sale of Securities
9,476,603 1,932,875
74,101,682
12 58,013,931 71,955,427 13 128,956 212,900
73,311 -Cash at Bank Interest and Dividend Receivable Other Assets
TOTAL ASSETS
9 1,288 450 863 30
67,694,952 LIABILITIES Payables for Investment Purchased Administration and Transfer Agency Fees Custodian Fees Investment Management Fees Payable Audit Fees Payable Legal Fees Payable Directors’ Fees Payable
6,063 -
,387 9,563 5,495
ry Fees
5 15,491 10,356 5 16,194 10,844 5 109,659 444,330 9,400 19
5 20,574 53,370 5 47,485 47,857 Investment Adviso
Other Fees 16,698 11,352 TOTAL LIABILITIES (excluding Net Assets Attributable to
Participating Shareholders) 251,127 602,991 Net Assets Attributable to Participating Shareholders 4 67,443,825 73,498,691 NET ASSET VALUE Net Assets 67,443,825 73,498,691 Fair Value Adjustment 15 3,609,292 -Dealing/Prospectus Net Assets Value 71,053,117 73,498,691 Class A 71,019,992 73,465,566Class B 33,125 33,125Investment Manager Incentive 16 - - Shares In Issue Class A 128,081,896.205 128,081,896.205Shares In Issue Class B 30,237.400 30,237.400 Net Asset Value Per Share Class A €0.55 €0.57Net Asset Value Per Share Class B €1.10 €1.10 The accompanying notes on pages 16 to 24 form an integral part of the Financial Statements.

QMC Development Capital Fund Public Limited Company
13
ED 30 JUNE 2012
d ndedNotes Jun-30 20 c-31 20 11
EUR EUR EUR
CONDENSED STATEMENT OF OPERATIONS FOR THE PERIOD END Period Ended Year En
12ed Period E11 Jun-30 20 De
INCOME/(LOSS)
1,998, ,814 4,457 5,960 2,017 39,0 - 125
ts at Fair (7,034,568) ,633,742) 11,245,117
T (LOSS)/INCOME (4,992,9 (363,417 ,073
Dividends Gross 149 2,264,365 810Interest Income Other Income 57Net (Loss)/Gain on Financial Asse
Profit or Loss 14 Value through (2TOTAL INVESTMEN 05) ) 12,058 E
501,783 1,102,953 582,2795 135,627 158,634 5 26,458 60,590 ,6625 19,429 38,831 ,2605 20,733 111,057 ,953
s’ Liability Insurance 9,055 14,480 gency Fees 5 11,956 23,896 ,852
5 9,693 36,271 10,244 1,784
es 16,948 36,385 ,338 761,926 1,584,881
XPENSES Investment Manager's Fees 5 Advisory Fees 134,882
34Custodian and Trustee Fees Administration Fees 19Directors’ Fees 35Directors’ and Officer 5,350Registrar and Transfer AAudit Fees
117,165
Transaction Costs 1,231Other Charg 19TOTAL OPERATING EXPENSES 851,972Withholding Tax on Dividends 300,035 443,958 ,783
(6,054,8 ,392,256 ,318
167
NET (LOSS)/INCOME 66) (2 ) 11,038
ASE IN NET ASSETS ATTRIBUTABLE (DECREASE)/INCRETO PARTICIPATING SHAREHOLDERS (6,054,8 ,392,256 ,31866) (2 ) 11,038 The Company has no recognised gains or losses other than the amounts re orted abov
sses were generated by continuing operations.
he accompanying notes on pages 16 to 24 form an integral part of the Financial Statements.
p e. All gains and lo T

QMC Development Capital Fund Public Limited Company
14
T ASSETS ATTRIBUTABLE TO
OR THE PERIOD ENDED 30 JUNE 2012
eriod Ye PJun-30 2012 Dec-31 201 Jun-30
EUR EUR EURRIBUTABLE TO PARTICIPATING
CONDENSED STATEMENT OF CHANGES IN NEPARTICIPATING SHAREHOLDERS F
P Ended ar Ended1
eriod Ended 2011
NET ASSETS ATTSHAREHOLDERS AT THE BEGINNING OF THE
73,498,691 75,890,9 75,89
le to (6,05 (2,
PERIOD 47 0,947 (Decrease)/Increase in Net Assets attributabParticipating Shareholders 4,866) 392,256) 11,038,318
apital TransactionsCSubscriptions Class A - - -
BUTABLE TO PARTICIPATING
Subscriptions Class B Distributions Class A
--
--
--
Distributions Class B - - - NET ASSETS ATTRISHAREHOLDERS AT THE END OF THE PERIOD 67,443,82 73,49 86,95 8,691 29,265 NUMBER O NUMBER NUMB
SHARES SHAR SH201 20
f the period Class A 1 ,081,896.2 ,081,8 28,081the period Class B 30,237.4 30,2 30
at the beginning of the period 1 ,112,133.6 ,112,13 28,112
F OF ER OF ES ARES 2 11 2011 Shares in issue at the beginning o
ing of 28 05 128 96.205 1
3,896.205
Shares in issue at the beginnarticipating shares in issue
0005 1 8
7.4003.605 1
,237.400,133.605P 28 2
hares Issued during thS e period Class A
- - -
period Class A 1 ,081,89 8,081 28,
- - -Shares Issued during the period Class B
hares in issue at the beginning of the S 28 6.205 12 ,896.205 1 081,896.205Shares in issue at the beginning of the period Class B 30,237.400 30,237.400 30,237.400
articipating shares in issue at the end of the period 128,112,133.605 128,112,133.605 128,112,133.605P

QMC Development Capital Fund Public Limited Company
15
12
Period Year Period Notes Ended Ended Ended 12 R
TING ACTIVITIES 63 5) )
- - -
ECREASE) IN CASH 18 7,543,728 1,701,817 646,869
CONDENSED CASH FLOW STATEMENT FOR THE PERIOD ENDED 30 JUNE 20
Jun-30 20 Dec-31 2011 Jun-30 2011 EU EUR EUR
NET CASH INFLOW/(OUTFLOW) FROM OPERA 7,843,7 2,145,775 814,652 Taxation (300,03 (443,958 (167,783)
Distributions NET INCREASE/(D
QMC Development Capital Fund Public Limited Company
16
OR THE PERIOD ENDED 30 JUNE 2012 1 Establishment and Organisation
QMC Development Capital Fund Public Limited om c investment Company with variable capital and limited liability incorporated unde laws of I and authorized pursuant to Part XIII of the Companies Act, 1990. Subject to certain exceptions (i.e.
any may only b invested in by Qualifying Investors within the S Notice 24.
ompany was incorporated on 4 September 2003 and ced o n 2 The initial term of the Company was six yea Gen he
2009 approved an extension of the duration of the Company for a further th e years so that of the Company shall end on 28 October, 2012.
-ended investm vehicl invest be red t
the end of the prescribed period.
. Principal Accounting Policies
Basis of preparation The condensed financial statements have been prepared in accordance with pronouncements on interim reporting issued by the Accounting Standards Board (ASB). Significant accounting policies The same accounting policies, presentation and methods of computation are followed in these condensed financial statements as were applied in the preparation of the Company’s financial statements for the year ended 31 December 2011 and as set out in the annual financial statements for that year. Director’s Responsibility Statement The Directors confirm to the best of their knowledge: • the interim financial statements have been prepared in accordance with pronouncements on half-yearly reports issued by the Accounting Standards Board; • the Investment Manager’s report, together with the disclosure in Note 7 contains a fair review of important events that have occurred during the reporting period and their impact on the financial statements and of the principal risks and uncertainties for the Company for the remainder of the current financial year; and • the Investment Manager’s report, together with the disclosure in Note 6 contains a fair review of any related parties’ transactions that have taken place in the reporting period and any changes in related parties’ transactions described in the Company’s last audited financial statements that could have a material effect on the financial position of the Company or its performance in the reporting period. Foreign Currency Translation Functional Currency Items included in the Company’s financial statements are measured using the currency of the primary economic environment in which it operates (‘the functional currency’). This is the Euro, which reflects the Company’s primary activity of investing in European securities. Assets and liabilities denominated in currencies other than the currency stated as the Company’s functional currency are translated into the said functional currency at the closing rate of exchange at each period end. Transactions during the period, including the purchase and sale of securities and income and expenses, are translated at the rate of exchange prevailing on the date of the transaction. Foreign currency transaction gains and losses are included in net gain and loss on financial assets at fair value through profit or loss in the Statement of Operations.
NOTES TO THE CONDENSED FINANCIAL STATEMENTS F
.
Company (the ‘’C pany’’) is a losed-endedr the reland
Class B Shareholders) the Comp emeaning of Non UCIT
The C2003.
commenordinary
perations oeral Me
8 Octoberld on rs. The Extra eting 18
February the term
re
The Company operates as a closed ent e and the ment can eemed a
2
QMC Development Capital Fund Public Limited Company
17
continued)
ntinued)
3.
withholding taxes imposed by such countries.
ration between Ireland and other countries. The Company may not, lding tax suffered by it in particular countries.
hares
rther Management Shares shall be
ount of €3,000,000, subject to the Directors’ discretion to accept commitments in sser amounts, of not less than €250,000 if such commitment were fully drawn.
11: €160,000,000) have been received, of which 146,000,000 (2011: €146,000,000) has been called up. €145,908,750 (2011: €145,908,750) has been
tors were released from any obligation to eet calls on undrawn Committments on the expiry of the Investment Period in October 2007, except
e rights to Net Asset Value ascribed to each class of share.
the Investment Manager after application of the following order of
and Class B shareholders, until aggregate amounts returned to them equal the total
mounts returned under i above) returned to
vestment Manager (80%); and
NOTES TO THE CONDENSED FINANCIAL STATEMENTS FOR THE PERIOD ENDED 30 JUNE 2012 ( 2. Principal Accounting Policies (co
Earnings per Share FRS 22 requires disclosure of earnings per share but since the Company has limited life therefore units are classified as liabilities rather than ordinary shares. Therefore FRS 22 is not applicable. Taxation Under current Irish law and practice the Company qualifies as an investment undertaking under Section 739B (1) of the Taxes Consolidation Act, 1997 (as amended) and is not therefore chargeable to Irish tax on its relevant income or relevant gains. No stamp, transfer or registration tax is payable in Ireland on the issue, redemption or transfer of shares in the Company. Distributions and interest on securities issued in
untries other than Ireland may be subject to taxes including coThe Company may not be able to benefit from a reduction in the rate of withholding tax by virtue of the double taxation agreement in ope
erefore, be able to reclaim withhoth
. Share Capital and Participating S4 The Company has authorised capital of 5,000,000,000 Class A participating shares of no par value, 5,000,000,000 Class B participating shares of no par value and 3 non-participating Management Shares of €1.00 each. No additional classes of shares shall be created and no fuissued. The share capital of the Company shall at all times equal the Net Asset Value. The minimum commitment for each Investor (other than Nmás Uno IBG SA, which shall commit €900,000) in Class A shares is an amle As at 30 June 2012 commitments of €160,000,000 (20€called up for Class A and €91,250 (2011: €91,250) has been called up for Class B. Distributions have been made to the Investors to date in the amount of €93,000,000. Invesmwhere amounts may be drawn down for the remaining term of the Fund to pay the Investment Manager’s fees, if any, and Fund Costs. Class A and Class B shares enjoy rights to variable amounts of capital, as determined by the Net Asset
alue of the Company from time to time and thVManagement Shares have no rights to returns as they are non-participating shares only. Class A shares will possess full economic and voting rights in the Company in accordance with the provisions of the Articles of Association. Class B shares will be offered solely to the Investment Manager and/or Knowledgeable Employees, and will possess similar economic and voting rights to Class A shares, except that Class B shares are entitled to different levels of return as detailed below. Investment proceeds will be paid to investors and (as its incentive fee) to priority on each payment date: i. pro rata to Class Aamount of their Capital Contributions at such date; ii. to Class A shareholders, until aggregate amounts (to include athem equal the Basic Return, as defined in the Company’s prospectus; iii. to Class B shareholders and to the Investment Manager (as the first instalment of its incentive fee) until they have, in the aggregate, received an amount equal to 15% of total amounts distributed (including the amounts paid to Class A shareholders, Class B shareholders and the Investment Manager) in excess of all Capital Contributions at such date. This amount will be distributed on a pro rata basis between Class B shareholders (20%) and the In
QMC Development Capital Fund Public Limited Company
18
ued)
shareholders (85%), Class B shareholders (3%) and to the Investment Manager (as
ayments will be made to shareholders in proportion to the number of shares of each class held by them on payment date and in such manner (e.g. electronic transfer) as may be agreed with each of
em.
sets of the Company after nd management share capital.
5. Fees
fee described in Note 16. The annual fee is equal to the sum of Advisory fee (i) i.e. 0.40% of ross Commitments payable quarterly in advance provided that, during the Disinvestment Period, Gross
ect of which Investors have een released and by any amounts (subject to a maximum amount equal to the Capital Contributions
ly in arrears. Where the vestment Manager's fee is paid in advance but, in the quarter in respect of which that fee is paid, the
dditional investments, other than Follow-On Investments, will be made and e net total (i.e. after discounting commissions and expenses payable by the Company and any losses on
, the net total (i.e. after discounting commissions and expenses payable by
a case by case basis by the Investment Manager), make
NOTES TO THE CONDENSED FINANCIAL STATEMENTS FOR THE PERIOD ENDED 30 JUNE 2012 (continued) 4. Share Capital and Participating Shares (contin
iv. pro rata to Class Athe second instalment of its incentive fee) (12%). Pthe relevantth Irish Stock Exchange rules require disclosure of the interests of any person other than a director or investment manager in 10% or more of the units of any class of capital carrying rights to vote at general meetings of the listed Company. As at 30 June 2012 Casagrande de Cartagena SA held 25.01% of the commitments and Called up share capital of the Company (2011: 25.01%). The liability to participating shareholders is presented in Statement of Assets and Liabilities as “Net Assets Attributable to Participating Shareholders” and is defined based on the residual asdeducting the Company’s other liabilities a
Investment Manager and Advisory Fees The Company pays the Investment Manager an annual investment management fee in addition to the incentiveGCommitments are reduced by the amount of undrawn Commitments in respbalready made to the relevant date) that have been returned to Investors during the Disinvestment Period (but not during the Investment Period), plus Investment Management fee (ii) i.e. 1.35% of the Net Asset Value of the Company, calculated and accrued daily and payable quarterInGross Commitments in respect of which that fee was paid falls below that amount, the Investment Manager shall repay the Company the amount of the excess payment (if any) or set it off against subsequent quarterly fees. In addition, the Company will be reimbursed for that portion of any advance fee received for any unexpired period in the event that the Investment Management Agreement is terminated. Disinvestment Period refers to the period from 28 October 2007 until the end of life of the Fund (October 2012). During this period no athinvestments of the Company) of any dividends received, any capital gains generated and any amount used in making the investments of the Company which are liquidated during this period or, to the extent not re-invested, prior to this period will be distributed to Investors. Investment Proceeds which have not been returned to Investors may be used subsequently for Follow-On Investments (up to a maximum of €15 million), for Investment Manager's fees and Fund Costs. Undrawn Commitments may be used subsequently for the Investment Manager's fees and Fund Costs. During the Disinvestment Periodthe Company and any losses on investments of the Company) of any dividends received and any capital gains received, but not the amount used in making the investments of the Company which are liquidated during this period (unless otherwise determined on up the Investment Proceeds. Investment Proceeds will be paid to Investors and (as its incentive fee) to the Investment Manager after application of the order of priority on each payment date, as set out in Note 4. Investment Management fees charged for the period amounted to €501,783 (June 2011: €582,279 and December 2011: €1,102,953). Investment Management fees payable at 30 June 2012 amounted to €109,659 (2011: €444,330).

QMC Development Capital Fund Public Limited Company
19
dvisory fees charged for the period amounted to €135,627 (June 2011: €134,882 and December 2011:
istrator’s Fees he Company pays the Administrator, out of the assets of the Company, an annual fee of €36,000 (plus
expenses incurred on behalf of e Company, including but not limited to couriers' fees and telecommunication costs and expenses.
n annual fee accrued, calculated nd payable monthly in arrears of up to 0.1% of the total assets under custody at market value, subject to a
fee payable annually in arrears of €20,000 per annum in respect of the Company as a whole, plus ansaction charges at normal commercial rates. This rate will include any fees and expenses (at normal
any sub-custodian appointed by it. The Custodian is entitled to
) a monthly maintenance fee of €600 for register services
nciliation (including reconciliation of money flows and bundling of ansfers). Bank charges are not included and will be charged individually.
NOTES TO THE CONDENSED FINANCIAL STATEMENTS FOR THE PERIOD ENDED 30 JUNE 2012 (continued) 5. Fees (continued)
Investment Manager and Advisory Fees (continued) A€158,634). Advisory fees payable at 30 June 2012 amounted to €47,485 (2011: €47,857). AdminTVAT, if any) which shall be accrued daily and payable monthly in arrears. Administrator’s fees are charged for the period amounted to €19,429 (June 2011: €19,260 and December 2011: €38,831). Administrator’s fees payable at 30 June 2012 amounted to €9,590 (2011: €6,410). The Administrator is also entitled to be repaid out of the assets of the Company all of its reasonable out-of-pocket th Custodian’s Fees The Company pays the Custodian, out of the assets of the Company, aaminimumtrcommercial rates) paid by the Custodian tobe reimbursed any expenses incurred by it on behalf of the Company. The Company also pays the Custodian, out of the assets of the Company, for Trustee Services, an annual fee accrued, calculated and payable monthly in arrears of 0.02% of the Net Asset Value of the Company, subject to a minimum fee of €12,000 per annum. Custodian’s fees charged for the period amounted to €26,458 (June 2011: €34,662 and December 2011: €60,590). Custodian’s fees payable at 30 June 2012 amounted to €16,194 (2011: €10,844). Directors’ Fees The Company pays annual fees to the Directors for services as directors, the aggregate of which will not exceed €15,000 per annum per Director, which are apportioned between the Directors as the Directors see fit. No other remuneration is payable by the Company to the Directors other than for out-of-pocket expenses reasonably incurred by them in the performance of their duties to the Company. Directors’ fees charged for the period amounted to €20,733 (June 2011: €35,953 and December 2011: €111,057). Directors’ fees payable at 30 June 2012 amounted to €20,574 (2011: €53,370). Registrar and Transfer Agent Fees The Company pays to the Administrator out of the assets of the Company the following fees: (a (b) a monthly fee of €100 per additional class of shares on the register
) an annual shareholder servicing fee (electronic file exchange), payable monthly in arrears, of: (c i) up to €30 per shareholder account for individual shareholders. ii) €150 per shareholder register for Nominee\Omnibus shareholders (d) a transaction fee of up to €32 per transaction for individual shareholders (regardless of the amount or number of shares) (e) a transaction fee of up to €32 per wire transfer/cheque payment per payment order. All of the above are subject to a minimum fee of €12,000 per period, in total. f) a fee of €2 per settlement for cash reco(
tr

QMC Development Capital Fund Public Limited Company
20
amounted to
6.
ated parties to the Company. During the period, RBC Dexia Investor Services Bank S.A and RBC Dexia
reland Limited earned fees for provision of custody and administration services to the
7.
statements. An analysis of the types of securities held at period hedule of Investments. Investments held at period end are
the type of investments held during the period.
nd other price risks. The vestments, as a result of their very nature, involve uncertainty (and therefore risk) as to
e an adverse Return.
pany has been investing the cash in Repos There were no Repos in 2012.
arkets. e risk arising from uncertainties about
he small cap equities of the Spanish market, the correlation with the index is low.
NOTES TO THE CONDENSED FINANCIAL STATEMENTS FOR THE PERIOD ENDED 30 JUNE 2012 (continued) 5. Fees (continued)
Registrar and Transfer Agent Fees (continued) Registrar and Transfer Agent fees charged for the period amounted to €11,956 (June 2011: €11,852 and December 2011: €23,896). Registrar and Transfer Agent fees payable at 30 June 2012€5,901 (2011: €3,946). Related Parties Although not deemed to be related parties under Irish GAAP as they do not exercise significant influence over the activities of the Company, Non UCITS Notice 2 also deems a “Custodian” and its “associated or group companies” to be related parties to the Company. As such, RBC Dexia Investor Services Bank S.A, the Custodian, and RBC Dexia Investor Services Ireland Limited, the Administrator, are rel
Investor Services ICompany as disclosed in Profit and Loss Account. There are no other related parties transactions. All the transactions executed on behalf of the Company were entered into in the ordinary course of business and normal commercial terms. Risk Statement The Company is exposed to varying risks, including market risk (interest rate risk, currency risk and price risk), liquidity and credit/counterparty risk. A description of the specific risks and the policies for managing these risks are included below. All financial assets at fair value through profit or loss are held at market value, which approximates fair value. Market value is determined in accordance with the accounting policies in Note 2 of these end is contained in the Company’s Screpresentative of Market Price Risk Market risk is the risk that the fair value or cashflows of a financial instrument will fluctuate due to changes in market prices. Market risk reflects interest rate risk, currency risk aCompany's intheir effective realization value. Although the aim of the Company is to invest in listed securities, the absence of an adequate market to realise them during the Disinvestment Period could havmaterial effect on the Basic Credit Risk Credit risk is the risk that an issuer or counterparty will be unable to meet a commitment that it has entered into with the Company. Since October 2008, Comwith a weekly duration (maximum two weeks) with fixed interest rates. Equity Price Risk QMC Capital Development Fund Plc invests in equities listed in Spanish and Portuguese stock mThe Company’s equity securities are susceptible to market pricfuture prices.
Our most comparable benchmark would be the Spain Small Cap Index. However, considering the QMC Company is composed of a portfolio of between 7-10 companies and therefore it does not have a broad representation of t Currency Risk
12 all the Company’s assets were held in Euro. At 30 June 20

QMC Development Capital Fund Public Limited Company
21
ntinued)
sk is the risk that the value of a financial instrument will fluctuate because of changes in
ssets t materially exposed to interest rate risk.
8.
Observable inputs are those that market participants es independent of the
based ows:
ecisions, including assumptions about risk.
observable data to be that market data which is readily available, regularly distributed or updated, reliable and verifiable, not proprietary, and provided by independent
t are actively involved in the relevant market. The categorisation of a financial instrument
NOTES TO THE CONDENSED FINANCIAL STATEMENTS FOR THE PERIOD ENDED 30 JUNE 2012 (continued) 7. Risk Statement (Co
Interest Rate Risk Interest rate rimarket interest rates. The amount of income receivable from bank balances will be also affected by fluctuations in interest rates. Interest Rate Risk Profile of Financial AThe Company is no Fair Value Measurement Financial Instruments The Company adopted the amendments to FRS 29, “Financial Instruments: Disclosures”, effective 1 January 2009. FRS 29 establishes a fair value hierarchy for inputs used in measuring fair value that maximizes the use of observable inputs and minimises the use of unobservable inputs by requiring that the most observable inputs be used when available.
ould use in pricing the asset or liability based on market data obtained from sourcwCompany. Unobservable inputs reflect Company management’s assumptions, made in good faith, about the inputs market participants would use in pricing the asset or liability developed based on the best
formation available in the circumstances. The fair value hierarchy is categorised into three levels inon the inputs as foll
Level 1 – Valuations based on quoted prices in active markets for identical assets or liabilities; Level 2 - Valuations based on quoted prices in markets that are not active or for which all significant inputs are observable, either directly (as prices) or indirectly (derived from prices); and Level 3 - Valuations based on inputs that are unobservable and significant to the overall fair value measurement. Inputs are used in applying the various valuation techniques and broadly refer to the assumptions that market participants use to make valuation d
Inputs may include price information, volatility statistics, specific and broad credit data, liquidity statistics, and other factors. A financial instrument’s level within the fair value hierarchy is based on the lowest level of any input that is significant to the fair value measurement. However, the determination of what constitutes “observable” requires significant judgment by Company management. Company management considers
sources thawithin the hierarchy is based upon the pricing transparency of the instrument and does not necessarily correspond to Company management’s perceived risk of that instrument.

QMC Development Capital Fund Public Limited Company
22
tinued)
presents information about the Company’s assets and liabilities measured at fair
Quoted
NOTES TO THE CONDENSED FINANCIAL STATEMENTS FOR THE PERIOD ENDED 30 JUNE 2012 (continued)
8. Fair Value Measurement (con The following table value on a recurring basis as of 31 December 2012:
prices Significant other Significant in active observable unobservable
ts inputs inputs Balance at
Jun-30, markeAssets and Liabilities 2012 (Level 1) (Level 2) (Level 3) EUR EUR EUR EUR
58,142,887 58,013,931 128,956 -
Quoted
Financial assets at fair valuethrough profit or lossInvestments in transferablesecurities, at fair value 58,013,931 58,013,931 - - Investments in Subsidiary, at fair value 128,956 - 128,956 -
*Assets shown as level 2 are relating to investments in subsidiary as disclosed in Note 13. The following table presents information about the Company’s assets and liabilities measured at fair value on a recurring basis as of 31 December 2011: prices Significant other Significant ble A
Balance at in active observable unobservaDec-31, markets inputs inputs
ssets and Liabilities 2011 (Level 1) (Level 2) (Level 3) Fi thInseInfai 212,900 - 212,900 - *A
V W s or binding dede
9. C
Th S.A., Dublin Branch at 30 June 2012 represented 14.05% (2011: 2.63%) of the Net Asset Value of the Company.
10. Soft Commissions There were no soft commission transactions during the period (December 2011: nil). Soft commission
n be defined as type of fee arrangement in which the commission fee is paid on a non-cash basis.
11. Net Assets – Historical Information
Jun 2012 Dec 2011 Dec 2010 € € €Dealing/Prospectus Net Assets Value 71,053,117 73,498,691 77,416,614Net Asset Value Per Share Class A €0.55 €0.57 €0.60Net Asset Value Per Share Class B €1.10 €1.10 €1.10
EUR EUR EUR EURnancial assets at fair value rough profit or loss 72,168,327 71,955,427 212,900 - vestments in transferable curities, at fair value 71,955,427 71,955,427 - - vestments in financial r value
ssets shown as level 2 are relating to investments in subsidiary as disclosed in Note 13.
aluation Techniques
en fair values of listed equity at the reporting date are based on quoted market pricehaler price quotations (bid price for long positions and ask price for short positions), without any duction for transaction costs, the instruments are included within level 1 of the hierarchy.
ash at Bank
e cash held on current account with RBC Dexia Investor Services Bank
ca

QMC Development Capital Fund Public Limited Company
23
profit or loss
58,013,931 71,955,427inancial Assets at Fair Value through Profit or Loss 58,013,931 71,955,427
NOTES TO THE CONDENSED FINANCIAL STATEMENTS FOR THE PERIOD ENDED 30 JUNE 2012 (continued)
12. Financial Assets at Fair Value through
Total EUR Total EUR Jun-30 2012 Dec-31 2011
quities EF
13. Investment in Subsidiary
subsidiary Com QMC Dire , S.L. wa rated in h the 7, 28006 M , Spain.
is to acqu in and representative stmen to be appo ted to the board of these
represents all of the d ended 30 June 2012
fair value of each share held based on its listed rice and adding the cash balance held by the sub s en d as vel 2.
he opinion that ilities of the subsidiary are o e Company’s financial statements and have decided consolidated financial statements
14. ial Assets through Pr Loss
Total EU
In December 2004, a pany, ctorships s incorpo Spain witregistered office at Padilla, 1 a ridd The subsidiary’s purpose ire a nominal holding in the companies the Company investstherefore to allow a of the Inve t Manager incompanies. The Company holds 3,006 shares in QMC Directorships, S.L. at 30 June 2012. Thisauthorised and issued share capital of QMC Directorships, S.L. During the periothe subsidiary Company had a net asset value of €128,956 (2011: €133,372). The fair value of the subsidiary is calculated taking the p sidiary. On thi basis the investm t is classifiele The Directors are of t the results, assets and liab insignificant tth not to preparefor the Company.
Net Gain/Loss on Financ at F ir Value a ofit or R Total EUR R
Period nded d Period EndedJun-30 201
Total EU E Year Ende 2 Dec-31 2011 Jun-30 2011
6) (2,924,824)Net movement Unrealised Gain on Investments 17,678,490 8,636,564 14,169,941
ial Assets at
Net Realised Loss on Investments (24,713,058) (11,270,30
Net (Loss)/Gain on FinancFair Value through Profit or Loss (7,034,568) (2,633,742) 11,245,117
15.
A the Company’s prospectus the assets of the Company are valued at the last closing price on change in the market for such investment, as at close of business on the relevant
er the Statement nciles the two valuation principles.
Total EUR Total EUR
Period Ended Year EndedJun De
otal Net Assets for financial statement purposes 6 73,498,691
aling/
Fair Value Reconciliation
s perthe principal exValuation Day. The Valuation principles adopted for the purpose of preparing these financial statements as disclosed in this period’s accounting policies in Note 2 to the accounts are in accordance with the financial reporting standards issued by the ASB. The fair value adjustment undof Assets and Liabilities reco
A reconciliation of the valuation of the financial assets at fair value through profit or loss as per FRS 26 versus the methodology in the Company prospectus is depicted in the below table:
-30 2012
7,443,825c-31 2011
T FRS 26 valuation adjustment
e3,609,292 -
Total Net Assets for shareholder dprospectus 71,05 73,498,691 3,117

QMC Development Capital Fund Public Limited Company
24
here were no Investment Management Incentive fees due or paid in 2012 (2011: Nil).
pany is alloc ifferent shar f s, this allocation ludes an inc
the investment manager. The capital allocation process only begins after the NAV of the Company unt of the subscribed shares. The calculations of the allocation process are
17.
18. Anal n Net Cash
NOTES TO THE CONDENSED FINANCIAL STATEMENTS FOR THE PERIOD ENDED 30 JUNE 2012 (continued) 16. Investment Management Incentive
T On a daily basis, the Net Asset Value (NAV) of the Comthe Company. In line with the Company’s prospectu
ated to the d e classes oprocess inc entive fee to
exceeds the aggregate amooutlined above in Note 4.
istributions D There were no distributions made during 2012 (2011: Nil).
ysis of Changes i
At Beginning of Period Movements At End of Period EUR EURCash at bank and in hand 1,932,875 7,543,728 9,476,603
otal 1,932,875 7,543,728 9,476,603T
19. Post Balance Sheet Events
lace of the entire holding of 2,620,699 units in Campofrio Food Group SA, in four t 2012.
9m.
20. Material changes to
1. Date of Approval
There were two events after the period end which require disclosure in the financial statements as follows: 1. The sale took ptranches, for proceeds of €14,937,099 on various dates up to and including 8 Augus2. A Capital Reduction was carried out on 4 July 2012 for a total amount of €
the prospectus
spectus as at 30 JThere were no material changes to Pro une 2012.
2 The financial statements were approved and authorised for issue by the Directors on 21 August 2012.

QMC Development Capital Fund Public Limited Company
25
SCHEDULE OF INVESTMENTS AS AT 30 JUNE 2012
Quantity/ Acquisition Market % netFace value CurrencDescription y cost Value assets
F
A) T
LIS
PO2,287,407 EUR 10,090,219 2,346,880 3.48
10,090,219 2,346,880 3.48
SPAEUR 13,952,633 3,020,807 4.48EUR 26,068,726 14,099,361 20.90
5,715,614 EUR 14,339,406 30,407,066 45.09934,537 EUR 11,099,437 8,139,817 12.07
55,6
IES 1 58,013,931
OTAL TRANSFERABLE SECURITIES ADMITTED TO AN 75,550,421 58,013,931 86.02FICIAL STOCK EXCHANGE LISTING
IES DEALT ON AN OTHER REGULATED MARKET
B) IN
SPA0.19
128,956 0.19
3,006 128,956 0.19
TOTAL FINANCIAL ASSETS AT FAIR VALUE THROUGHPRO 75,553,427 58,142,887 86.21
TS 9,476,603 14.05
OTH
TAL NET ASSETS 75,553,427 67,443,825 100.00
1) INANCIAL ASSETS AT FAIR VALUE THROUGH PROFIT OR LOSS
RANSFERABLE SECURITIES ADMITTED TO AN OFFICIAL STOCK EXCHANGE LISTING
TED SECURITIES : EQUITIES
RTUGALMota-Engil SGPS SA
INAzkoyen SA 2,560,006Campofrio Food Group SA 2,620,699Cie Automotive SAAdveo Group International SA
65,460,202 67,051 82.54
TOTAL LISTED SECURIT 75,550,42 86.02
TOF
B) OTHER TRANSFERABLE SECURIT
VESTMENT IN SUBSIDIARY
IN128,956QMC Directorship Co 3,006 EUR 3,006
3,006
TOTAL INVESTMENT IN SUBSIDIARY
FIT OR LOSS
CASH AND TIME DEPOSI
ER ASSETS LESS LIABILITIES (175,665) (0.26)
TO

QMC Development Capital Fund Public Limited Company
26
G S AS AT 30 JUNE 2012
M
MI
.72
TT
T
EOGRAPHIC & ECONOMIC DIVISION OF INVESTMENT
% of net % of netassets assets
Jun-30 2012 Dec-30 2011
PORTUGALConstruction and Building Material 3.48 7.03
3.48 7.03SPAIN
ines, Heavy Industries 45.09 47.78Food And Distilleries 20.90 22.94Forest Products And Paper Industry 12.07 15.19
echanics, Machinery 4.48 3.89nvestment Funds 0.19 0.29
Other Services - 0Healthcare Education & Social Services - 0.35
82.73 91.16
OTAL FINANCIAL ASSETS AT FAIR VALUEHROUGH PROFIT & LOSS 86.21 98.19
CASH AND TIME DEPOSITS 14.05 2.63
OTHER ASSETS LESS LIABILITIES (0.26) (0.82)
OTAL NET ASSETS ATTRIBUTABLE TO HOLDERS OFPARTICIPATING SHARES 100.00 100.00
QMC Development Capital Fund Public Limited Company
27
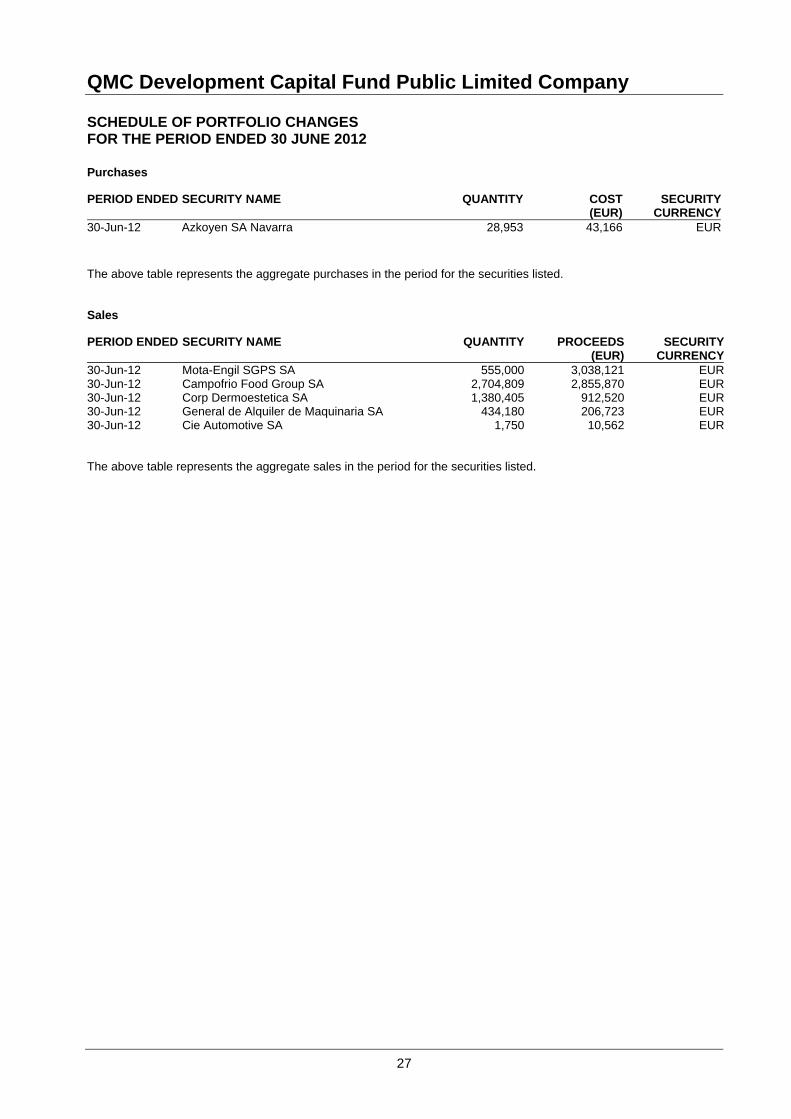
ED 30 JUNE 2012 SCHEDULE OF PORTFOLIO CHANGES FOR THE PERIOD END Purchases PERIOD ENDED SECURITY NAME QUANTITY COST SECURITY (EUR) CURRENCY30-Jun-12 Azkoyen SA Navarra 28,953 43,166 EUR The above table represents the aggregate purchases in the period for the securities listed. Sales PERIOD ENDED SECURITY NAME QUANTITY PROCEEDS SECURITY (EUR) CURRENCY30-Jun-12 Mota-Engil SGPS SA 555,000 3,038,121 EUR30-Jun-12 Campofrio Food Group SA 2,704,809 2,855,870 30-Jun-12 Corp Dermoestetica SA 1,380,405 912,520 30-Jun-12 General de Alquiler de Maquinaria SA 434,180 206,723 30-Jun-12 Cie Automotive SA 1,750 10,562 The above table represents the aggregate sales in the period for the securities listed.
EUREUREUREUR