qt quality visualization - theseus
TRANSCRIPT

Juha Sippola
QT QUALITY VISUALIZATION

QT QUALITY VISUALIZATION
Juha Sippola Bachelor's Thesis Autumn 2013 Information Technology Oulu University of Applied Sciences

3
ABSTRACT
Oulu University of Applied Sciences Degree Programme in Information Technology, Software Development Author: Juha Sippola Title of thesis: Qt Quality Visualization Supervisors: Timo Vainio, Marjo Heikkinen, Tony Sarajärvi (Digia) Term and year when the thesis was submitted: Autumn 2013 Pages: 95 + 1 appendix The idea for this Bachelor’s thesis came from Digia, which develops Qt, a cross-platform application and UI framework for software developers, together with the Qt Project, a meritocratic consensus-based open source developer community. The main objective of this thesis was to improve the visualization and communication of the Qt quality by creating a web portal to collect and display metrics on required Qt process areas, focusing on continuous integration. Raw results are available from many process areas already, but the problem is that the results are not very valuable without better visualization. In addition, manual work is required to report some key information from the results. The Qt teams in Digia and the global Qt developer community, i.e. those individuals and teams that develop the Qt library components and the Qt tools, are the target audience. Requirements to the web portal solution included a specification of some key metrics, recommendation to use open source solutions, to enable anyone in Qt developer community to modify the content or create new, and to document the design and implementation. The work started by studying and analyzing some of the most promising solutions for web, database and report development against the portal requirements and needed competence as well as against the existing server environment and current processes and practices used in the Qt Project. The system architecture consists of the report builder as the front-end, and the parser and the database as the back-end. The selected technical solutions were Perl for the parser, MySQL for the database, and HTML, CSS, PHP and AJAX for the report builder. The thesis project used the same contribution practices and tools that are used for the actual Qt software implementation. The result was the Qt metrics system which was launched and taken into public use as planned. The system is running on the existing Qt testresults server on the qt-project.org domain. The functionality as well as the guidelines to further develop the system was documented into Qt Project wiki. The system was utilized already during the implementation phase by the key users in their daily operations. Received and requested user feedback, both before and after the launch, has been positive. The development proposals to the Qt metrics system are related to adding new content and functionality to the current metrics page, adding new metrics pages for some identified process areas, and improving the overall performance of the system still further. The thesis project itself was kept on schedule, and the effort was well under control.
Keywords: Web portals, Databases, Reports, Metrics, Quality, Software, Open source
4
ACKNOWLEDGEMENTS
First I want to thank the commissioner of the thesis, Digia Oulu, for this great opportunity. Special
thanks go to my supervisor Tony Sarajärvi in Digia for his excellent support and energetic team
work during the whole project. In addition, I would like to thank Mikko With, Olli Hirvonen, Janne
Anttila and Nico Vertriest in Digia for their support and effort along the way. I express my
appreciation to Marjo Heikkinen and Timo Vainio in Oulu University of Applied Sciences for
supervising the thesis work. I would like to thank also Veijo Väisänen, Pekka Alaluukas, Karoliina
Niemelä and Mikko Ruotsalainen for the inspiring learning experience.
Finally, I want to dedicate this thesis to my wife and children, and thank them for their
unconditional support and understanding during this challenging thesis project.
September 2013, Oulu.
Juha Sippola

5
CONTENTS
ABSTRACT 3
ACKNOWLEDGEMENTS 4
CONTENTS 5
LIST OF TERMS AND ABBREVATIONS 7
1 INTRODUCTION 10
2 QT 11
2.1 Open Source Software 11
2.2 Qt and Qt Project 14
2.3 Qt Governance Model 16
2.4 Qt Contribution 18
2.5 Qt Continuous Integration 20
3 WEB AND DATABASE DEVELOPMENT FRAMEWORKS 26
3.1 Web Development 26
3.1.1 Tools and Frameworks 28
3.1.2 Development Process 29
3.1.3 Quality Assurance 31
3.1.4 Evaluation of Solutions 34
3.2 Database Development 37
3.2.1 Database Design 40
3.2.2 SQL 42
3.2.3 Evaluation of DBMSs 43
3.3 Reporting Tools 47
3.3.1 Evaluation of Solutions 49
4 QT METRICS SYSTEM 51
4.1 Requirements 51
4.2 Target Audience and Use Cases 52
4.3 Framework and Tool Selection 52
4.4 System Overview 53
4.5 Using the System 54
4.5.1 Report Builder Overview 54
4.5.2 Use Cases 57

6
4.6 Implementation 61
4.6.1 Report Builder 61
4.6.2 Database and Parser 64
4.6.3 Key Functionality 65
4.7 Development and Maintenance 68
4.7.1 Directory Structure and Naming Conventions 68
4.7.2 Modifying the Existing Metrics 70
4.7.3 Create New Metrics Box 71
4.7.4 Add New Data to Database 72
4.7.5 Quality Assurance 72
4.7.6 Submitting Code 74
4.7.7 Security and Data Validation 74
4.8 Project Management Practices 75
5 QT METRICS IN USE 79
5.1 Feedback 79
5.2 Requirements Validation 80
5.3 Future Development 81
6 RESULTS AND CONCLUSIONS 83
7 DISCUSSION 85
LIST OF REFERENCES 88
APPENDICES
Appendix 1 Qt Metrics System Change Backlog (10-Aug-2013)

7
LIST OF TERMS AND ABBREVATIONS
.NET A software framework by Microsoft
AJAX Asynchronous JavaScript and XML
AMP Apache, MySQL and Perl/PHP/Python; a software bundle
Apache An open source HTTP web server software
API Application Programming Interface
ASP Active Server Pages
BI Business Intelligence
BSD Berkeley Software Distribution
CAPTCHA Completely Automated Public Turing test to tell Computers and Humans Apart
CI Continuous Integration
CMF Content Management Framework
CMS Content Management System
CSS Cascading Style Sheets
DBMS Database Management System
DOM Document Object Model
DST Daylight Saving Time
DW Data Warehouse
ER Entity Relationship
EWS Early Warning System
FTP File Transfer Protocol

8
GD Graphics Draw (or GIF Draw)
GIF Graphic Interchange Format
Git A distributed version control and source code management system
Gitorious A web site hosting collaborative for open source projects using Git
GPL General Public License
GQM Goal/Question/Metric
GUI Graphical User Interface
HTML Hypertext Markup Language
HTTP Hypertext Transfer Protocol
ICT Information and Communications Technology
IDE Integrated Development Environment
JavaScript A scripting language for web development
Jenkins An open source continuous integration tool
JPEG Joint Photographic Experts Group
JSON JavaScript Object Notation
LGPL Lesser General Public License
MIKKO “Mittauskehikko”, a software measurement framework
MPL Mozilla Public License
MySQL An open source relational database management system
ODBC Open Database Connectivity
OSI Open Source Initiative

9
Oulu UAS Oulu University of Applied Sciences
PDF Portable Document Format
PHP Hypertext Preprocessor
PNG Portable Network Graphics
Puppet An open source system configuration management tool
QML Qt Meta Language
Qt A cross-platform application and UI development framework
RDBMS Relational Database Management System
RTA Release Test Automation
Solaris A computer operating system by SUN
SQL Structured Query Language
SSH Secure Shell
TDD Test-Driven Development
UI User Interface
URL Uniform Resource Locator
W3C World Wide Web Consortium
WAMP A software bundle of Apache, MySQL and Perl/PHP/Python for Windows
WYSIWYG What You See Is What You Get
XML Extensible Markup Language
XP Extreme Programming
XSLT Extensible Stylesheet Language Transformations
10
1 INTRODUCTION
Qt is a cross-platform application and UI framework for software developers. It is developed by
Digia together with the Qt Project, a meritocratic consensus-based open source developer
community interested in Qt. Digia owns all Qt trademarks and is responsible for the commercial
and open source licensing of Qt. The idea for this thesis came from Digia in Oulu to improve the
visualization and communication of the Qt quality and its progress by creating a web portal to
collect and display metrics on required Qt process areas, focusing on continuous integration (CI).
The target audience of the portal includes the Qt development and CI teams in Digia and the
global Qt developer community, i.e. those individuals and teams that develop the Qt library
components and the Qt tools.
Raw results are available from the most of the process areas already, but the problem is that the
results are not very valuable without better visualization. In addition, manual work is required to
report some key information for instance in the CI release cycle. On the other hand, there are
web pages for results visualization for some of the areas already, but the speed, quality or
features of the visualization are not on satisfactory level.
To fulfill the visualization need, a new web portal was required to display statistics and metrics
about the Qt quality. Objective was to automate laborious manual work and to provide real-time
information with good performance. It was required that the web portal is hosted on the public
Internet under the Qt Project web site. The scope of the development project was to implement
the front-end web pages and the back-end data storage, as well as to document the design and
implementation into Qt Project wiki. The ultimate goal was to have one entry point which can
collect all metric and report information for example for Qt continuous integration, code coverage,
autotest, release test automation and manual test, by showcasing at least one of these areas as
a result of the thesis project.
This document starts with an introduction to the Qt and the Qt Project, continuing with the most
promising frameworks and solutions for web, database and report development in the defined
context. Then, the requirements for the Qt metrics system are detailed and the selected solutions
are described. Finally, the Qt metrics system design and implementation is explained both to
understand how the solution works and how to expand the system in the future. The document
closes with an analysis of the thesis subject, its execution and learning experience.

11
2 QT
This section gives a brief introduction to the open source development as well as to the Qt
framework and the Qt Project in general, and then details the governance, contribution and
continuous integration practices used in the Qt Project.
2.1 Open Source Software
In brief, open source software means software that can be freely used, modified, and shared, with
an access to the source code. It must be noted that “free” here means “freedom”, not necessarily
“gratis”. It is similarly important to distinguish the freedom from obligation. That is, users of open
source software can modify it, if they feel it is appropriate, but they are not forced to do so. In the
same way, they can redistribute it, but in general, they are not forced to do so. Hence generally
anyone is allowed to use open source software as they wish for whatever and wherever it is
technically appropriate, modify it with fixes and extended functionality, create forks or branches of
it, port it to new operating systems and processor architectures, and share it with others, who
again could themselves use it according to their own needs. (1)
Development of open source software is based on community cooperation. These communities
are typically a combination of individual voluntary programmers and large companies. Some of
the characteristic activities in such communities include, in addition to software development
itself, for example internationalization and localization, integration, quality and usability activities.
The development environments in open source communities usually include a source code
repository with version control, error management system, servers and integration machines, as
well as different communication means. Typically these all use open source solutions as well. The
development model may vary from cathedral-like model to bazaar-like model, as described by
Eric Raymond. Cathedral-like development is characterized by a clearly defined management
structure, and a rigorous plan for code releases, as well as by a relatively strong control on
design and implementation with a control on who can submit patches to the code and how they
are integrated, while the bazaar-like development is based on informal communication and
several small and medium coding efforts that can be chosen at will by the volunteers. Open
source software projects can use almost any model between those two extremes, whereas
proprietary software projects must select more or less a cathedral-like model, and thus cannot
12
benefit from the features of a bazaar-like one. While the cathedral-like development releases only
from time to time by using higher quality assurance procedures, the bazaar-like development
releases with high frequency so that programmers and users willing to test and improve those
versions can do it. This process can even be extended to the code management system so that a
snapshot of what the programmers are working on at any given time is publicly available.
Furthermore, open source development is characterized by cooperation and competition.
Developers within open source projects usually cooperate at levels higher than those in
proprietary software projects and are therefore more committed to the project. On the other hand,
most projects organize themselves to use some kind of meritocracy, where the developer who
does more for the project deserves more credit, and is given more weight in decisions. Open
source projects and companies are compelled to collaborate by fixes and improvements to the
same source code. Motivation may come from the fact that if they tried to avoid assisting their
competitors, they would have to move away from the open source model, which would usually
give them more problems than benefits. At the same time, open source projects also compete
between themselves. Projects must fight for their survival by maintaining high levels of quality, or
they will start losing users and developers, which creates a chance that some of the developers
will branch a new independent development project to compete with the old one. In fact, this is
one of the mechanisms to ensure good quality in open source development. (1)
There are many advantages when using open source software. The companies, communities or
individual users can install the software in as many devices or machines as wanted with reduced
or zero license fees and without a need to track license compliance. The quality of open source
software is expected to be better than in proprietary software because anyone can fix bugs
without having to wait for the next release. If the group that originated the code decides to stop
development, the code still exists and it is possible to continue the maintenance and improvement
by another group without legal or practical limitations. Because of the free availability of the
source code, users or for example an IT department can study the software in detail and make
modifications that they find appropriate to suit their needs. In addition, support from the
development community is typically available at any time. However, there are some
disadvantages or considerations for using open source software as well. Ongoing parallel
development effort may create confusion on what functionalities are present in which versions.
On the other hand, there is no guarantee that development will happen, and it may be difficult to
know the current status or even existence of the development project. Open source software may
not be entirely free, in that it may involve unanticipated implementation, administration, support or

13
training costs. Although the development community is there for the support, no one is obligated
to help in case of questions or problems. In addition, there may be problems connected to
intellectual property rights. (1)
The Open Source Initiative (OSI) defines the criteria for open source distribution license. The
definition says for example that there are no restrictions, royalties or other fees to any party from
selling or giving away the software, that the program must include source code, or it must be
freely available without charge, that modifications and derived works and their distributions are
allowed under the same terms as the original software, that there are no restrictions from making
use of the program in a specific field of endeavor, and that the license must not set provision on
any individual technology or style of interface. For example, the Apache license, the Berkeley
software distribution (BSD) license, the GNU general public license (GPL), the GNU lesser
general public license (LGPL), the MIT license and the Mozilla public license (MPL) are popular
OSI-approved open source licenses. A software product can also be distributed using multi-
licensing, a combination of both open source and commercial license, where the commercial
license typically includes additional functionalities and product support. The terms free open
source software and commercial open source software are used correspondingly. (2) (3)
It can be said that the history of open source software goes back about as far as the history of
software itself. In the 1960s, when IBM and others sold the first large-scale commercial
computers, the computers came with some software which could be freely shared among users.
It came with source code, and it could be improved and modified. Later on, proprietary software
was born, and it quickly dominated the software landscape. In the early 1980s Richard Stallman
launched the Free Software Foundation and the GNU Project to build a free operating system. As
a legal tool, the GNU GPL was designed not only to ensure that the software produced by GNU
will remain free, but to promote the production of more and more free software. In the early 1990s
Bill Jolitz made a version of BSD Unix that was free of copyrighted code, and Linus Torvalds
implemented the first versions of the Linux kernel, later completed as the Linux operating system
with GNU GPL license. The OSI was formed in 1998 to maintain the open source definition and to
review and approve licenses that conform to that definition. In the late 1990s open source
systems were gaining public acceptance and became a real alternative to proprietary systems. In
2010 an increase was reported in demand for open source based on quality, reliability and speed,
not just cost savings. The survey behind the report showed that 78 percent of enterprise
companies were either using or experimenting open source software in their business, led by the
14
financial services sector while the public sector lagged behind. 76 percent of respondents
considered quality, not the cost, to be the major selling point of open source, followed by 71
percent for improved reliability, and 70 percent for stronger security and bug fixes. 20 percent of
software developments were in open source (in 2009), and expected to rise. One finding,
however, was that only 29 percent of the companies were willing to contribute their own solutions
back to the community. (1) (3) (4)
Today open source is applied in numerous fields of software, for instance GIMP graphics editor,
Mozilla Firefox web browser, OpenOffice.org office suite and WordPress web publishing platform
in application software, Linux based Android in operating systems, Perl and PHP (hypertext
preprocessor) in programming languages, and Apache HTTP (hypertext transfer protocol) web
server, Drupal content management system and MongoDB and MariaDB databases in server
software. MySQL database and Qt development framework are examples of open source
software utilizing multi-licensing. One recent newcomer, and a typical case of developing
something on top of something, is the Sailfish operating system for the new Jolla smartphones.
Sailfish is built on top of the Mer project and Qt version 5, and is based on MeeGo operating
system and software platform by Nokia and Intel, which again was based on the Mer branch in
Maemo, an earlier Linux based software platform by Nokia (5).
2.2 Qt and Qt Project
People are increasingly using multiple devices with different screen sizes for personal and
enterprise use. Users begin to expect the same user experience, performance and flexibility
across all the devices they use. Developers, on the other hand, are looking for means to target
multiple operating systems quickly to make their applications available everywhere. (6)
Qt is a cross-platform application and UI development framework. With Qt, developers are able to
create one graphical user interface (GUI) application and run it on multiple desktop, embedded
and mobile platforms. In practice, application is first created for one platform and then built and
run to deploy on other platforms. Qt accesses the native features of a device and lets user
interface (UI) designers and developers design and render highly-performing graphically-rich user
interfaces. Qt provides a seamless developer experience and consistent performance across all
operating systems and processor architectures. Qt is used by market-leading companies in tens
of industries, for example in systems such as mobile platforms, industrial automation, TVs, set-

15
top boxes and in-vehicle infotainment, and in applications like enterprise, deep-sea advanced
visualization, Hollywood film animation and air traffic control. (6)
Using the Qt development framework will enable developers to decrease the development and
maintenance effort, as well as cost, due to the cross-platform support, speed up time to market
with easy prototyping, and to improve quality for instance with the native user experience in the
platform it is deployed.
The complete Qt development framework consists of the Qt Framework application programming
interfaces (API) for C++ and Qt meta language (QML), Qt Creator integrated development
environment (IDE) including UI designer tools and on-device debugging, and tools for example for
internationalization support. Qt supports all major desktop, embedded and mobile platforms.
Development is supported on Windows, Linux/X11 and Mac OS X desktop platforms, on
Embedded Linux, Windows Embedded, and on several embedded Real-Time Operating
Systems. In addition, the Windows 8 (WinRT) and BlackBerry 10 mobile platforms are supported,
and most recently, Qt 5.1 introduces support for Android and iOS platforms with technology
preview status. Qt is available under a commercial and open source license (using GNU
LGPL/GPL) designed to accommodate the needs of various users. (7) (8) (9) (10)
The history of Qt goes back to 1991 when the original developers Haavard Nord and Eirik
Chambe-Eng began development of the first versions under their company that was later named
as Trolltech. The first two versions of Qt had support for Unix and Windows. Nokia acquired
Trolltech in 2008 and turned Qt into one of their main application development platform for its
devices, including a port to the Symbian S60 platform. The source code was made available over
Gitorious, a community oriented Git source code repository, to gather a broader community to
help improving Qt. In 2011 Nokia announced the sale of Qt commercial licensing business to
Digia. All remaining Qt business was transferred to Digia in September 2012. The latest Qt
version 5.1 was released in July 2013. (11) (12)
Qt is developed by Digia together with the Qt Project, a meritocratic consensus-based open
source community interested in Qt. Anyone can join the community, participate in its decision
making processes, and contribute to the development of Qt. Qt community has over 500,000
developers worldwide. The Qt Project is not a separate legal entity or organization. Digia retains
all Qt trademarks and is responsible for commercial and open source licensing. The Qt Enterprise
commercial license offers varied licensing terms and includes additional functionality, support and
16
product updates. Digia provides support for its commercial customers in their Qt projects by
working hand-in-hand with the Digia Qt R&D developers in areas of architecture and design, user
experience, platform integration, application development, and Qt customization. (13) (14) (15)
(16) (17) (18)
Digia is a Finnish software solutions and service company and has nearly 1,000 employees. It
delivers information and communications technology (ICT) solutions and services to various
industries, focusing especially on finance, public sector, trade, services and telecommunications.
Digia operates in Finland, Russia, China, Sweden, Norway and in the U.S. The company is listed
on the NASDAQ OMX Helsinki exchange. (19)
2.3 Qt Governance Model
In general, a governance model describes the roles for project participants and the decision
making process within the project. In addition, it describes the ground rules for project
participation and the processes for communicating and sharing within the project team and
community. Especially in the context of an open source project, the governance model prevents
the project from descending into chaos. In a meritocratic governance model the participants gain
influence over a project through the recognition of their contributions. That is, the more merit, the
more influence. Hence a meritocracy is not a democracy. Only those who have earned the
recognition through positive contribution have a binding vote. This allows project leaders to
ensure that only those that share a common vision and, just as importantly, are willing to work
towards that shared vision, are given decision making authority. A notable aspect is also the fact
that the governance model in a project will evolve over time as the project and its community
develop. (20) (21)
The governance model in the Qt Project is based on the meritocratic governance model template
by OSS-Watch. The objective of the governance model is to put decision power in the hands of
the community, i.e. the people who contribute to the success of the project, and to make it easy to
understand how to get involved and make a difference. The documented model describes five
levels of participation and how community members get involved in making decisions. (14)
The five levels of involvement, or roles, within the project are Users, Contributors, Approvers,
Maintainers and Chief Maintainer. Users are community members who have a need for the

17
project. They typically raise the awareness of the project and give feedback from a user
perspective. Anyone can be a User. Those who continue to engage with the community will often
become more and more involved, and may find themselves becoming Contributors. Contributors
are community members who provide significant input to the project. Although their typical
contribution is programming, there are numerous other ways of contribution, for example
suggesting future developments, reporting and fixing bugs, commenting on others’ code in
reviews, writing documentation, participating in the release process, providing graphics and web
design, supporting and coaching new Users, improving the Qt contribution process, and being
active in the community for instance on mailing lists, forums, IRC, and at events. The profile of
the Contributor will increase as he or she gains experience with the project and makes significant
contributions to it. As a result they may be nominated as an Approver. Approvers are community
members who have shown that they are committed to the project and its objectives, and perform
an essential role safeguarding its long-term success. Approvers review all code contributions and
decide which are accepted for commitment based on technical and logical fit. Approvers are
expected to provide constructive feedback, participate on relevant mailing lists, and coach
Contributors. Maintainers are recognized leaders in their area, and have been identified as
owners of a component, and to be responsible for the overall quality of it. Maintainers are
expected to participate in strategic planning, approve changes to the governance model, manage
intellectual property rights discussions within the community, and review code contributions which
have not been reviewed by others. The process of becoming an Approver or Maintainer works on
nomination basis. The Chief Maintainer leads the Maintainer group by coordinating and facilitating
its activities, and will also oversee contributions from a strategic and roadmap perspective. When
the Chief Maintainer decides to step down, the Maintainers will arrange a vote to choose a
successor. (14)
Any community member can make a proposal for consideration. This is done either by submitting
an implementation patch to the review tool, or by sending an email to the project Contributor
mailing list. The goal of the review or discussion is to gain approval for the contribution. The
decision making process is based on a policy of lazy consensus. That is, as long as nobody
explicitly opposes a patch or proposal, it is recognized as having the support of the community.
This allows large group of people to make decisions without formal consensus, as well as without
lengthy discussions among the large number of involved people. Lazy consensus, however, still
needs a reasonable amount of time before assuming no objections to ensure everyone is given
enough time to read, digest and respond to the proposal. The Maintainers or the Chief Maintainer

18
will make the decision in those cases where consensus is not reached through review or
discussion. (14)
2.4 Qt Contribution
The Qt developer community is created around the development of Qt libraries, Qt related tools
and add-ons (22). The contribution process is explained here to the extent that is applicable in the
scope of the implemented Qt metrics system.
The servers, database, and tools related to the Qt open governance code contribution process as
well as their interactions are illustrated in FIGURE 1.
FIGURE 1. The servers, database, and tools related to the Qt code contribution process (23)
19
The process has been designed to provide transparency and quick pass-through for code
contributions. The core of the process is the code review tool, Gerrit. The tool is available for
everybody, and it supports both automated quality checks and human reviews. It is used for the
contributions and their documentation as well as for review notes and possible fix patches. In
addition, it can be utilized for studying the code of other contributors and contributions as well.
The code is pushed into its Qt library repository, also called as a project in the Qt metrics system,
for example QtBase, QtConnectivity, QtMultimedia, QtDoc or QtTools. The repository includes
the entire history of all its files. (22)
The staging area is a powerful concept, making it easy to work on multiple files simultaneously
while still creating small incremental changes. By using staging areas the changes can be studied
and reviewed before becoming a part of the code base in the related branch. Dedicated branches
are useful to gain more flexibility during development, without risking the quality of the other
branches. Qt Project uses one or several branches for its projects, for example development,
stable and release branches. (24) (25)
Continuous Integration (CI) system is used for building and testing. The CI system fetches
reviewed and staged changes from Gerrit, builds the related project branches, and runs tests for
the changes. Then it merges the changes with the corresponding branch in the Git repository of
Gerrit. In addition, the repository is pushed to Gitorious repository on qt.gitorious.org, which can
be used to download the latest Qt source code to develop UI and applications with Qt. (23)
This first-commit-then-review process is efficient, as it allows everyone to make direct
contributions into the review system. It levels the field between Contributors and Approvers,
ensures that all contributions are reviewed, and allows all reviews and their comments to be
tracked by the community as a whole (14). Below, the overall activity in the Qt Project is
illustrated by the contributing organization (FIGURE 2), as well as by the number of contributors
(FIGURE 3). It can be noticed that currently the majority of contributions come from Digia, while
there are dozens of individual contributions each week as well.

20
FIGURE 2. Overall activity in the Qt Project by contributing organization (26)
FIGURE 3. Overall activity in the Qt Project by number of contributors (26)
2.5 Qt Continuous Integration
Shortening the time between a defect injection and its detection and correction has significant
cost benefits. First introduced as part of extreme programming (XP), the continuous integration
(CI) introduces a practice where everyone on the team integrates their new or changed code
frequently, usually daily, against a controlled source code repository, leading to multiple
integrations per day. Each of the integration is verified by an automated build, combined with
automated unit tests as highlighted in the test-driven development (TDD) process, to detect
integration problems as quickly as possible. Many teams find that this approach leads to

21
significantly reduced integration problems and allows a team to develop cohesive software more
rapidly. (25) (27)
It is important to notice that there are a few key practices that make up an effective CI. The use of
a source code management system is essential to maintain a common and well known source
code repository. Building and launching the system should be automated to the level that only a
single command is required. In addition to compiling, linking and building an executable program,
the automated build scripts usually generate also the related documentation, statistics, reports
etc. Then, the build should be made self-testing by including automated tests in the build process.
The automated tests must be updated together with the new or changed source code. As a rule
of thumb, every developer should commit to the repository every day. The benefit of frequent
commits is that the possible conflicting changes are detected early, and that it encourages
developers to break down their work into small deliverables. It should also be ensured that
regular builds happen on an integration machine, and only if this integration build succeeds,
should each commit be considered to be done. For its part, it again ensures that development
can happen on a known stable code base, or in case the build does break, however, it is
important that it gets fixed fast. Since CI requires frequent commits and builds, it is important that
the builds themselves are fast. The XP guideline is a ten minute build. A common practice is
setting up a deployment pipeline, or staged builds, where in fact multiple builds are done in
sequence. The point of testing is to detect and remove, under controlled conditions, any problems
that the system would have in production. Therefore the test environment should be as exact a
mimic of the production environment as possible. The use of virtualized machines can
furthermore simplify the establishment of multiple test environments. (27)
The agile development processes expect and take advantage of the fact that it is easier to see
something that is not quite right and say how it needs to be changed by using a running system
instead of specifying all in advance. Therefore the latest executable should be made easily
available for anyone to run it for testing, demonstrations, or just to see what changed this week.
In addition, it is important to automate the deployment by having scripts that will allow deploying
an application into any environment easily because the executable applications are moved
between these environments multiple times a day. Continuous Integration is all about
communication, and one of the most important things to communicate is the state of the builds. In
fact, this CI practice is in key focus for the development of the Qt metrics system. (27)

22
The goals of the CI system in the Qt Project are to implement an automated quality gate that
blocks poor quality changes from being merged to the stable codebase, to run an exhaustive set
of configuration tests in a nightly fashion, and to make test results available to developer in a
clear, concise, and user friendly way. Qt Project builds and tests Qt on the so-called reference
configurations on a frequent basis. A reference configuration is a combination of an operating
system version, a compiler version, and a graphics system. The TABLE 1 lists the current
reference configuration platforms. In addition to the reference platforms, Qt is occasionally tested
on other configurations in which it is known to run well. (8) (25)
TABLE 1. Qt 5.1 reference configuration platforms and compilers (8)
The CI setup is aligned with the Qt 5.1 repository structure. Git module repositories exist for each
Qt submodule (for example QtBase, QtConnectivity, QtMultimedia), while a superproject
repository (for instance Qt5) contains several Git submodules. The modules may use one or
several branches to gain more flexibility during development. The module-branch pair is referred
also as project in the Qt metrics system. Qt Project uses Jenkins, an open source continuous
integration tool, as the server setup for building the projects and running of autotests
continuously. Jenkins allows builds to be started by various means, including being triggered by
commit in a version control system, scheduling via a cron-like mechanism, building when other
builds have completed, or by requesting a specific build manually. Jenkins is used both in
physical and virtual machines for the Qt CI. There are approximately 20 physical machines in use
for the Mac operating system, and roughly 200 virtual machines for the other operating systems.
CI builds are triggered by approved change reviews when an Approver changes the status of the
change commit to Staged. The CI system collects the staged commits for each repository and
their branch so that each new commit starts or restarts a five minute timer. The build starts

23
automatically if no further commits are staged within those five minutes. Prior to the change
approval some automatic checks are executed by an early warning system (EWS) tool as part of
the CI system. Its purpose is to provide immediate and early feedback to developer regarding for
example line ending characters, big file additions and common spelling mistakes. Although the
check messages are advisory and may be overridden by the Approvers, it is recommended to
provide a corrective patch to the commit, and the CI process to continue. The major part of the CI
machine setup is maintained under source control, in the “qtqa/sysadmin” repository which holds
metadata about the test machines and servers such as the set of installed packages and
configuration of tools used in the test process. Most of the CI machines are controlled by a
system administrator tool called Puppet. (25) (28) (29) (30)
The simplified Qt contribution and continuous integration process flow is illustrated in FIGURE 4.
It combines the steps to contribute a commit, the main steps in the CI system, the commit
statuses as seen in the code review tool and the specific results that are available and used from
the Qt CI system for reporting and analysis. (31)

24
FIGURE 4. Qt contribution and continuous integration process flow.
FIGURE 4 indicates the main results that are used from the Qt CI system to compile the data into
visual and easy-to-read report format for the CI metrics page of the implemented Qt metrics
system. The CI builds are done in a hierarchy of first building each applicable configuration for a
project branch, and then combining those configuration builds into one project branch build.
However, not all the builds are always done in practice. To optimize the use of the CI machine
processing capacity, a project branch build is stopped in case one configuration build fails, and at
the same time the remaining configuration builds are aborted. As a result, the autotests, a set of
test cases dedicated to a project, are also skipped for the aborted builds. This all means that the
result of every configuration build for every project branch is not always available, and that the
number of autotest runs depends on the success of other configuration builds for the project
branch. In addition, only the information of failed autotests is available in detail in the CI build log
files.
25
From the whole CI point of view the configuration build result indicates both the result of the build
process itself and the result of the autotests that were run. Therefore, in an ideal case, a
successful build requires that both the build process and all the autotests are successful. In
addition, a successful project branch build requires that each configuration build is successful.
However, such a strict criterion may not always be reasonable in reality. For example, in case of
a new or an immature configuration, it is not reasonable to let the whole project branch build fail
because of that. To put flexibility to the CI process, a few flags are used for autotests and
configurations. An autotest can be tagged as "insignificant" so that possible failure will not lead to
configuration build failure. Also a configuration can be tagged as "insignificant" so that the
configuration build will not fail even though some significant autotests would fail. In addition, a
configuration can be tagged as "force success" so that even if the configuration build failed, it is
forced to succeed, and therefore a failed configuration build will not block the whole project
branch build. The final result of a build is a combination of the build and autotest results and the
use of the flags. A typical case that needs attention, and corrective actions, is where a failed
autotest blocks a configuration build and also the whole project branch build. Studying these
cases continuously from the thousands of build log files is very laborious, or practically impossible
considering the time and resources available. The Qt metrics system automates this data
collection work and visualizes the problem areas as clearly and detailed as possible. The raw log
files from the Qt CI system are available at http://testresults.qt-project.org/ci/.
To get an overall picture about the size of the Qt CI system, here are some statistics during a
period of one month from mid-June to mid-July in 2013. Totally round 1,000 builds, with a
success rate of 52%, had been made in 67 project branches. Some project branches has been
built only once, while for instance the Qtbase stable branch has been built 182 times. The Qtbase
stable branch had 21 active configurations, and those had been built about 3,800 times in total.
There were approximately 18 configurations per project branch, and by multiplying it with the
round 1,000 configuration builds, the total number of builds during this time period was roughly
18,000. However, this number includes both the run and the aborted builds. The number of failed
autotests was approximately 300 during this time period. (32)

26
3 WEB AND DATABASE DEVELOPMENT FRAMEWORKS
This section introduces web, database and report development, as well as their most promising
frameworks and solutions in the context of the thesis project target setting.
3.1 Web Development
Web development, in general, is about developing a web site to be available in the Internet, or in
company intranet for example. The use and purpose of a web page or pages can range from
publishing static information to applications and services with interactive operations and dynamic
data searches. A list of tasks related to the web development typically consists of user interface
or usability design, content development, client and server side scripting and web server
configuration. This section focuses on the techniques, tools and methods that are applicable in
the scope of the implemented Qt metrics system.
Architecture for a web application or service usually follows a three-tier model, where
presentation tier, a browser or user interface of an operating system, is connected to logic tier,
where the detailed processing is performed as functionality of the application. The third tier, data
tier, consists of database server or servers where the data is stored and retrieved from. FIGURE
5 illustrates a generic web application architecture using the three-tier model. (33 p. 274) (34)
FIGURE 5. Three-tier model
A web page contains for example the content as plain text, and images, page layout and
formatting as hypertext markup language (HTML), visual appearance as cascading style sheets
(CSS), and interaction and functionality as JavaScript. Web pages reside on a web server, which
is a piece of hardware and software that can be accessed through the Internet. To display a web

27
page on a browser, user enters a web location as uniform resource locator (URL), after which the
browser sends a request to the server, and the server responses with an HTML document. Web
browser is a software application that retrieves, interprets and presents the requested web
content, which is in the format of tagged markup language such as HTML or scripting language
such as JavaScript. There are several web browsers available, for example Google Chrome,
Mozilla Firefox and Microsoft Internet Explorer, and they all have their own implementation to
interpret the HTML and other web documents. As for web servers, they use both scripting
languages and computer programming languages. The common behavior of markup and
scripting languages is that they are interpreted run-time in the browser or in the server, while the
computer programming languages must be compiled into an executable program before they can
be run. Web uses the HTTP protocol to send the requests from client, a web browser for
example, to server, and the responses from server back to the client. The HTTP itself is a
stateless protocol where each communication is an individual request-response event and there
is not any connection to previous communications. However, HTTP provides several methods to
send data and to implement page or application logic for a web site. (35)
Web development can be split to client-side, server-side and database technologies and to their
programming techniques. Client-side programming refers to the scripts that are executed client-
side by the web browser of the user. In addition to HTML, CSS and JavaScript, client-side
technologies include for example JQuery, which is a JavaScript library, and AJAX (asynchronous
JavaScript and XML), an asynchronous connection to the server to update only a part of a page.
As for server-side programming, it refers to the scripts or programs that are executed on the web
server upon web page request to generate usually an HTML document with the requested
content. Server-side development can utilize for example open source languages such as Perl,
Python, Ruby and PHP, computer programming language Java, and proprietary technologies
such as active server pages (ASP) and .NET. Using server-side implementation has an additional
security aspect that may be beneficial in some cases: user is not able to see the server-side
script code as such via the browser, but only the resulting HTML code. Database is typically the
third component in a web service. It is the core of the service around which the user interface is
built to fulfill the purpose of the web site, and eventually to justify the existence of it. Database
connection is made by the server-side script or program. Commonly used database management
systems (DBMS) include MySQL, which is an open source system, and Microsoft SQL Server
and Oracle Database, which are proprietary. (35)

28
It is important both for web users and web developers that the web technologies are
standardized. Users are able see and use the web pages in a similar fashion regardless of the
browser they use, and developers can build web sites that work with any browser or server
environment. In reality, however, web development is not as easy as it could be. The latest
versions of HTML and CSS standards, HTML5 and CSS3, are still in progress, and the support of
the new features varies between the browsers although the browser developers continue to add
new features to their latest browser versions. The web standards are created and maintained by
the World Wide Web Consortium (W3C). They also provide validation service for web developers
to be able to check their web pages against the web standards. (36)
3.1.1 Tools and Frameworks
Web pages can be created with a great variety of tools from basic text editors to online web site
builders, depending on the size and needs of the web service or application, on company
infrastructure and guidelines, and also on personal preferences of the developer.
Simple HTML scripts can be created using a text editor, like WordPad for example, and then the
file or files can be transferred to the web server with a file transfer protocol (FTP) tool. Dedicated
and often free source code editors like CoffeeCup HTML Editor, Notepad++ and NetBeans IDE,
for example, improve the programming experience by including functionalities such as syntax and
structure highlighting, real-time syntax checking, code completion for objects and functions,
wizards to create HTML elements, built-in FTP upload, and working with multiple files at the same
time. Using a text editor or a source code editor requires deep knowledge of the scripting or
programming language used. (37)
Word processors and spreadsheet applications like Microsoft Word and Excel are able to export
the documents created with them to HTML format, either manually or automatically with scripts.
However, for example Microsoft Word is not recommended for web programming itself because
the resulting file may include extra characters or formatting that was not the original intent, and
therefore different browsers may display the content differently. (37)
WYSIWYG (what you see is what you get) editors raise the development experience from mere
programming to visual user interface design by generating HTML code from the design. They do
not necessarily require deep knowledge of the programming language generated. Pages created

29
with these editors may be stored in a proprietary format and then exported as HTML format. The
proprietary Adobe Dreamweaver features rapid layout design and code generation, preview pane
together with the HTML code window for previewing the HTML as seen by the browser, support
for JavaScipt and AJAX, extensions from simple rollover effects to full-featured shopping carts by
the developer community, built-in FTP upload and support for version control system. (37) (38)
Web site builders are tools that allow constructing web sites without manual coding, and many
companies also provide web server hosting. Online web site builders typically require developers
to sign up to the web server, and may also include user access control to manage different roles,
for example editors to edit or add pages, modifiers to modify the web site structure, and the web
site owners to maintain the user access control itself. The main advantage of a web site builder is
that it is easy to use and often does not require experience on the scripting languages, although it
may allow direct editing of source code and styling. Examples of web site builders are WordPress
and Microsoft SharePoint Designer. WordPress is a free and open source blogging tool and a
content management system (CMS) based on PHP and MySQL. It is currently the most popular
blogging system used on the web (39). Creating a web site is heavily based on the use of
available components like themes and widgets via the browser, although the generated PHP and
CSS code can be edited directly as well. The components are developed also by the WordPress
community. Microsoft SharePoint, a content and document management platform, is used by
78% of Fortune 500 companies (40). Designing SharePoint sites with Microsoft SharePoint
Designer is done online to the web server. SharePoint includes user access control and a
workflow management for example to first create draft documents or pages, and to publish them
later. (41) (42)
The size of the code generated by WYSIWYG editors and web site builders is typically bigger
than when writing code by hand. In addition, the manual coding effort may be justified for
example in performance critical environments. (37)
3.1.2 Development Process
A web site is actually never ready. It may be realized during the development that the initial list of
functionality is neither correct nor complete. The developers or the users may also identify
improvement needs for instance to navigation or performance. Everything cannot be known
beforehand, nor everything can be expected to be perfect, the site just needs to be published,

30
after which feedback is collected to continue the development. In addition, web sites are typically
used in changing environments where the content changes, priorities change, developers
change, and so forth. Hence the traditional waterfall development model, with its long lead times,
is not suitable in a fast pace environment. Web development therefore often follows some kind of
iterative and incremental, or agile, development models. Their characteristic features are for
example not defining everything in advance, creating prototypes, delivering small portion of
functionality at a time, delivering in short cycles of time, and using the learnings from previous
delivery in next deliveries. Project management is still an essential part of a project, but it uses
different practices than in a waterfall project.
Development process can be widely different depending on the environment, activities and
projects. Jennifer Fleming describes a fairly generic six-phase approach. The phases are:
information gathering, strategy, prototyping, implementation, launch, and maintenance & growth.
The information gathering phase focuses on collecting the background information such as
project goals and mission, target audience and their needs, and the resources available. In
addition, the communication methods in the team and project are put in place. The scope of the
strategy phase is to identify problems, explore real-world examples, brainstorm possible
solutions, define the concept and scope, organize content, and finally select the design and
technical solution. Here it is very important to distinguish the problems from the solutions, not to
jump into a solution before understanding the problem and its cause first. In the prototyping
phase it is identified how the site will work and how to move through the information, for example.
It is also important to test the solution with the users, using anything from a rough text-only
walkthrough to a working live demo, to show the information design and interface features.
Additionally, the final architecture plan is created and the product specifications are outlined. The
user or customer should be involved throughout the strategy and prototyping phase. After the
revised solution from the prototyping phase, the site is then built in the implementation phase.
The content is prepared and edited, interface design is completed, the back-end system
developed, and eventually all these are integrated together. Most likely new problems will arise,
which then need to be prioritized and solved in a timely manner. The launch covers the period of
just before and after the public premiere. Here the final quality assurance testing is conducted to
have a final look for example to the usability, consistency and content validity, preferably with the
people who have not been directly involved in the development. The launch itself may be for
example an informative email or classroom introduction. Web marketing includes also submitting
the site to search engines and directories using the HTML meta tags. The development continues

31
next to the maintenance phase, which can actually be a cycle of repeating some or all the
previous phases. In this phase new content or features need to be managed, either as items
intentionally left out from the launch or as new items surfacing for example from user feedback or
because of changes in the back-end solutions. (43 pp. 75-103)
The user experience of a web site does not happen by accident and without conscious, explicit
intent. Jesse James Garrett introduces practices to break the job of crafting user experience
down into separate elements, or planes or layers as they are also called. The layers, when
starting to peel them away from the most visual and concrete level, are: surface, skeleton,
structure, scope and strategy. On the contrary, building a web site starts from the most abstract
level: the strategy. Strategy plane defines and balances both the user needs and the site
objectives. The user needs to include for example what the audience wants from the web site.
The site objectives mean the objectives from the developer point of view, like business goals for
example. The list of features and functions, defined in the form of functional specifications and
content requirements, constitutes the scope plane. The structure plane defines the way in which
the various features and functions of the site fit together through information architecture, and
how the system behaves in response to the user through interaction design. The skeleton is
designed to optimize the arrangement of elements, like buttons, tabs, photos, and blocks of text,
for maximum effect and efficiency, for example through navigation design. The surface finally
defines the visual design, including colors, fonts, icons, graphics, images and so forth. The
decisions, which are made on each level, build upon each other and influence all the aspects of
the user experience. (44 pp. 21-34)
3.1.3 Quality Assurance
Web users and developers usually perceive quality in a different way. Users may expect accurate
information, easy navigation and quick downloading. Developers, on the other hand, value simple
implementation, quick delivery, manageable development environment and easy maintenance.
These expectations should still not be contradictory. In fact, there are several commonly used
practices to improve the quality of web sites from both perspectives.
Web site should be verified with all major browsers and, if possible, with their mostly used
versions. Web site should work regardless of the browser option selections, like cookie or
JavaScript settings, and the client computer platform, like Windows or Mac. The increasing use of

32
smartphones and tablets makes it important that the web pages either show correctly with
different screen resolutions or, in its extreme, follow a responsive design to automatically adjust
according to the client screen resolution. For the same reason, it is vital that, in addition to
powerful computers and connections, the pages work fluently enough also when used by
computers with lower performance and smaller memory size. Like mentioned earlier, the pages
should be validated against the HTML and CSS standards. When using the latest features of
HTML5 and CSS3 it must be taken into account that all browsers may not support their
functionality. For example, date or email input field validation is not yet supported in all major
browsers. If the site requires certain browser to be used, it must be stated clearly. (45 pp. 376-
377)
Performance is one the most critical factor for a web site. Navigating in the web site, and
especially loading the home page, should follow the common five or seven second rule within
with the pages should be usable. The speed comes from restricting the size of images and
content, and from loading the content from their sources, from databases for example. Images
should be downsized to the shown resolution, content should be available while the images are
still loading, the length of scrollable content should be considered, the server-side scripts should
not be used for stable content, and implementing the page layout using HTML tags and CSS
styling instead of tables. These are all good practices to improve the web site performance. In
addition, the database design and the related server-side script implementation have great
influence on the speed. (45 pp. 376-377)
The style inside a page and across the pages should be consistent, for example with the layout,
navigation and links. Navigation is another essential factor for the user experience. In addition to
being consistent, a successful navigation can be easily learned, uses clear and understandable
labels, provides feedback and clear visual messages, offers alternatives, requires an economy of
action and time, appears in context and is appropriate to the purpose of the site, and supports the
goals and behaviors of the users (43 pp. 13-14). The audience of the web site should be
understood and defined prior to web design. Different audience has different expectations,
experience and wishes. Furthermore, a web site to be really beneficial must have correct content.
The content must be targeted to its audience, it must be trustworthy, and it must be kept up-to-
date according to the agreed procedure. It is useful to show the date and time of last update.
Users also value the general appearance of the web site. The colors used, the contrast between
text and background, and the fonts and font sizes have big impact to usability. If the audience

33
includes disabled users, the font size, for example, should be adjustable via the browser instead
of being fixed, or the web design should consider the use of voice browsers as well. In case of
international use, the meaning of colors, symbols and images shall be understood, as well as the
length of supported languages in the page layout. (43 p. 30) (45 pp. 376-377)
Web security is a set of procedures, practices, and technologies to protect web users, web
servers and the organizations surrounding them. Web as an environment poses security risks
that are usually not present in other publishing environments. Internet is a two-way network from
servers to users and vice versa. Web is increasingly being used for instance by corporations to
distribute important information and conduct business transactions, and web servers and
browsers are exceedingly complicated pieces of software with many potential security flaws.
Once their security is compromised, web browsers and servers can be used by attackers as a
launching point for conducting further attacks against users and organizations. The web security
consists of the security of the web server and the data on it, information travelling through a
network, the computer of the user, and the applications used. Web server security ensures that
the server can continue its operation, the information on the server is not modified without
authorization, and the information is only distributed to those individuals to whom wanted it to be
distributed. One good strategy for securing the information on the web server is to restrict access
to the web server, by restricting login access for example with the use of passwords or secure
shell (SSH) protocol, and by using a firewall which is a device that isolates the internal network of
an organization from the Internet allowing only specific connections to pass and blocking others.
Security of information in transit is about assuring that information the user supplies to the web
server, like usernames, passwords and bank account data, cannot be read, modified, or
destroyed by others. Encrypting the information as it travels between the web server and the user
is a practical technique so that the information cannot be decoded by any party who does not
possess the proper key. User computer security is to assure users that information, data, or
programs downloaded to their systems will not cause damage. Typical practices to ensure
computer security is using the latest versions of the browser and operating system combined with
a well-known security and anti-virus software. Application security focuses on actions taken to
prevent security related flaws and vulnerabilities by incorporating security controls into whole
software development process. Common application security vulnerability is the so-called
structured query language (SQL) injection, which is used to attack data driven applications. (46)
(47)

34
Testing is a common quality assurance practice in all software development. However,
unstructured testing without actions does not improve the quality of the software. Instead, test
design, which may be done even before software implementation, improves understanding the
scope and the functionality of the software, followed by test execution phase which documents
the test results and helps considering additional or ad-hoc test cases. Finally, the error correction
cycles after the testing then actually improve the quality of the software itself.
It is good practice to include means to contact the author to give comments and feedback. In
order to avoid possible automatically sent junk messages, a CAPTCHA (completely automated
public Turing test to tell computers and humans apart) image validation technique can be used. In
addition, there may be company guidelines and style guides for the web and intranet design and
implementation in their environment.
3.1.4 Evaluation of Solutions
One common requirement set for the Qt metrics system was that, because Qt Project is heavily
based on open source, it would be good to use open source technologies also on metrics system
front-end and back-end solutions. Hence the solutions evaluated here are scoped to open source
technologies or frameworks, and are mostly free of charge. Evaluation is done by introducing the
solutions in the context of the developed Qt metrics system. The actual solution selection is
described and explained later in this document.
Apache, PHP and AJAX
PHP is currently the most popular server-side language for developing web sites (48). A
commonly used approach for a dynamic web application implementation is the combination of
HTML, PHP and AJAX languages running on Apache web server, together with a MySQL
database. PHP has certain benefits compared to other script languages because it has been
originally designed for web development, although it is also used as a general-purpose
programming language. PHP code is interpreted by a PHP processor in web server, which then
generates the resulting, typically HTML, script for the web page. The simple basic language
structure, loose typing discipline, and the fact that PHP scripts can be embedded directly into

35
HTML, make it also easy to learn, especially for those who have prior experience on C or C++
languages. The syntax is versatile, yet not as complicated as in Perl. PHP supports both the
procedural and object-oriented programming styles. The data and structures, like forms, cookies
and headers, from the browser can be accessed directly. PHP runs efficiently as an Apache
module. There are plenty of function libraries and extensions available for example for date, string
and array manipulation, file system and database access. Because of its popularity,
documentation and support is widely available. For the same reason however, the more software
code is written the more software bugs are written as well. It has been reported that about 29% of
all web application security vulnerabilities are linked to PHP, although the vulnerabilities are
caused mostly by inexperienced developers or those not following best practice programming
rules (49). In addition, pieces of code and code examples are easily available in different forums,
but their quality or performance often cannot be guaranteed. The flexibility of the language has its
downsides as well. Because there are tens of ways to implement a feature or functionality, the
refactoring and maintenance of the software may become difficult in the long run. (33 p. 13)
AJAX is not a technique as itself, but a group of interrelated client-side web development
techniques for creating asynchronous web applications. They are: HTML and CSS for standards-
based presentation, document object model (DOM) for dynamic display and interaction,
extensible markup language (XML) and extensible stylesheet language transformations (XSLT)
for data interchange and manipulation, XMLHttpRequest for asynchronous data retrieval, and
JavaScript to bind everything together. Developing with AJAX requires certain level of knowledge
of all the previously mentioned techniques, but JavaScript experience is needed the most. With
AJAX, web applications can communicate with a server in the background, without interfering
with the current state of the web page. User observes this so that only a part or parts of a web
page change at a time, without the whole page being reloaded. AJAX use cases could be for
example retrieving and showing movie details when moving cursor above a poster, or validating
user input by dynamically changing selection list values according to previous selections in a
form. The dynamic behavior, however, brings some usability related concerns. One problem is
how the user gets visible enough indication that some content in a page is updating or has
updated. Another issue is that, when browsing through AJAX generated content, the states are
not saved in browser history, which means the “back” button does not return the browser to the
earlier state of the AJAX page. In addition, because the URL does not change, it is not possible to
bookmark a certain page state or content, or to send it to a friend as a link. Performance and the
general user experience of many parts of a page updating simultaneously may become a

36
challenge as well, especially with slow or unstable server connection, together with how fluently
the server-side script is executed. Pages built with AJAX require that the browser used supports
the JavaScript, and that it is not disabled by the user. In addition to the JavaScript support, the
increasing use of smartphones and tablets highlights the design issue that touch screen devices
are operated in a different way than the traditional mouse or pointer operated devices, for
example regarding to the mouse-over action. Nevertheless, there are technical solutions and
design guidelines available to solve these issues. (50 pp. 13-18) (51)
PHP is not limited to output just HTML. It can also be used to create image files in different image
formats, such as GIF (graphic interchange format), JPEG (Joint Photographic Experts Group) and
PNG (portable network graphics) among others. The dynamic image creation capabilities can be
included by integrating a GD (graphics draw) open source code library. The most common
applications of GD involve web site development to generate charts, graphics and thumbnails on
the fly. To be able to use the GD library, PHP needs to be compiled with it and with possible
additional libraries, depending on which image formats are needed. (52) (53)
There are many free web development environments available as a bundle of web server,
database server and server-side script language that supports PHP, for example WAMP
(Apache, MySQL and Perl/PHP/Python for Windows). The selection of the editor to actually edit
the scripts, can be done according to personal preferences. However, compared to a basic text
editor, a source code editor helps for example in language syntax checking.
WordPress
Like mentioned, WordPress is a popular blogging tool and a CMS based on PHP and MySQL. It
features a plug-in architecture and a template system. The themes allow developers to change
the look and functionality of a web site without altering the information content or structure of the
site itself. Some themes support responsive design for small screens. The plug-in architecture
extends WordPress abilities beyond the core installation to customize the developed sites with
additional plug-ins like widgets and navigation bars. A widget can be a web form, an event
calendar or an image carousel, for example. By using the provided themes and widgets, building
a simple web site or blog should be quick and easy. On the other hand, implementing a web site
with strictly defined layout, navigation and content may need deep knowledge of the WordPress
web site builder itself and the HTML, CSS and PHP languages, as well as some experience on
37
programming. Some concerns have been expressed towards security vulnerabilities, for example
regarding the SQL injection. (42)
Other Systems and Frameworks
Joomla is an open source CMS for publishing content. It is written in PHP, uses object-oriented
programming techniques, and stores data for example in a MySQL database. Joomla is
estimated to be the second most used CMS on the Internet after WordPress (39). In addition to
common web sites and applications, Joomla framework enables developers to build for example
inventory control systems and data reporting tools. (54) (55)
Ruby on Rails is an open source web application framework which runs on the Ruby
programming language. It is a full-stack framework: it allows creating pages and applications that
gather information from the web server, talk to or query the database, and render templates out of
the box. Ruby on Rails is typically not connected to the Internet directly, but through some front-
end web server like Passenger or Apache. In addition, Ruby on Rails has a built-in support for
AJAX through its extensive use of JavaScript libraries. (56)
Drupal is an open-source content management framework (CMF) written in PHP. It is also
described as a web application framework to develop dynamic websites, web applications and
web services. It is used for knowledge management and business collaboration as well. Drupal
runs on any platform that supports both a web server capable of running PHP (Apache for
instance) and a database (such as MySQL, MongoDB or MariaDB). Drupal has received criticism
for example on its learning curve, performance, and the usability of the administration interface.
(57)
3.2 Database Development
A database is an organized collection of uniform data. Database is designed, built and filled with
data for a certain purpose for a certain audience. Many web applications use databases as their
data storage. Two types of databases exist according to their usage: operational databases and
analytical databases. Operational databases are used in situations where there is a need to
collect, modify and maintain data on continuous basis. The data changes constantly and always

38
reflects the latest information. Analytical database, or data warehouse (DW), is used for reporting
and data analysis. It is a central and typically read-only repository of data which is created by
including historical data and by integrating data from one or more different sources, and is a
valuable asset when there is a need to track trends and view data over a long period of time for
tactical of strategic business decisions. Analytical databases often use data that passes through
an operational database before they are used for reporting, so these two types of databases are
somehow associated, although their design methodologies are quite different. This thesis utilizes
certain aspects from both operational and analytical databases. (58) (59 pp. 4-5)
DBMS is software designed to allow definition, update, retrieval and administration of databases.
Data definition includes defining new data structures for a database, removing data structures
from the database, and modifying the structure of existing data. Data update means inserting,
modifying, and deleting the data. Retrieval is obtaining data either for end-user queries and
reports, or for processing by applications. Administration includes registering and monitoring
users, enforcing data security, monitoring performance, maintaining data integrity, dealing with
concurrency control, and recovering information in case of system failures. Many databases have
application software that accesses the database on behalf of end-users, without exposing the
DBMS interface directly. Application developers, on the other hand, use databases through their
API. Database designers and database administrators interact with the DBMS through command-
line interface to database server or by using dedicated tools to build and maintain the databases,
and thus need some more knowledge and understanding about how the DBMS operates and
what are the DBMS tuning parameters, for example. Physically, database servers are dedicated
computers that hold the actual databases and run the DBMS and related software. The same
DBMSs may be used both for operational and analytical databases. (58) (60)
Both a database and its DBMS conform to the principles of a particular database model. Common
database models include for example relational model, object model and document model. (60)
In a relational database, a relation is usually described as a table, which is organized into rows
and columns, also referred as records and attributes respectively. Each table must identify a
unique primary column, called the primary key, used for identifying a row of data. Tables can
relate to other tables by using a foreign key, a link to the primary key in another table. Primary
key may be one column, a numeric id for example, or multiple columns where the combination of
the column values creates a unique row. Retrieving data from multiple tables is done by joining
the needed tables in the query command. In addition to the use of the primary keys, relational

39
databases emphasize data integrity by minimizing the redundancy and the dependency of the
data. Each piece of data appears only once and is therefore updated only to one place, and the
data is allocated to tables so that a table includes only interdependent data. These and other
related practices are called database normalization, which usually involves dividing large tables
into smaller ones and defining relationships between them instead. The most popular relational
database management systems (RDBMS) are Oracle Database, Microsoft SQL Server and
MySQL. (61) (62)
While the use of relational databases maintains a clear division between the database model and
application, using object-oriented databases combines database capabilities with object-oriented
programming language capabilities. Hence the programmers can maintain consistency within one
environment, in that both the Object-Oriented Database Management System OODBMS and the
programming language, such as C#, C++, Ruby, Python, Perl and Java, will use the same model
of representation. Compared to RDBMS, access to data can be faster because joins are often not
needed, because an object can be retrieved directly without a search. However, because of
industry disagreements, less stable standards and reduced availability of support and OODBMS
tools, the object-oriented databases have not replaced the relational databases, at least yet. The
most popular OODBMS currently is Intersystems Caché. (62) (63)
An object-relational database can be said to provide a middle ground between relational
databases and object-oriented databases. Object-Relational Database Management System
(ORDBMS) is similar to RDBMS, but with an object-oriented database model; objects, classes
and inheritance are directly supported in database schemas and in the query language.
PostgreSQL is an open source ORDBMS available in supplied packages of vast majority of Linux
distributions, although supported also for example in Solaris, Windows and Mac. (64) (65)
A document-oriented database is designed for storing, retrieving, and managing document-
oriented data, around an abstract notion of a document. Document-oriented databases are one of
the main categories of so-called NoSQL (Not only SQL) databases. NoSQL databases provide a
mechanism for storage and retrieval of data that uses looser consistency models than the
relational databases, and they are finding growing industry use in big data and real-time web
applications. While each document-oriented database implementation differs on the details, in
general they all assume documents encapsulate and encode data in some standard format or
encoding. Encodings in use include XML and JavaScript object notation (JSON), as well as
binary forms like portable document format (PDF) and Microsoft Office documents (Word, Excel,

40
and so on). MongoDB is currently the leading open-source document-oriented database. It is
available for Windows, Linux, Mac, and Solaris, and supports all major programming languages.
(62) (66)
A database transaction is a group of operations with atomic, consistent, isolated, and durable
(ACID) properties. Atomic means that either all of the operations in the transaction succeed or
none of the operations persist, consistency ensures that if the data is consistent before the
transaction begins, then it will be consistent after the transaction finishes, isolation is that the
effects of a transaction that is in progress are hidden from all other transactions, and durability is
defined so that when a transaction finishes, its results are persistent and will survive a system
crash. Most DBMSs support transactions, at least in some of their storage engines. A database
storage engine is the underlying software component that the DBMS uses to create, retrieve,
update and delete data from a database. The storage engine is selected when creating a
database, although DBMS may allow it to be changed also while in operation, like in MySQL for
example. (58) (67)
3.2.1 Database Design
The database management systems include wizards to automate the definition and creation
process for a database and its tables. However, before that the database designer must go
through a logical design process by himself or herself to design the data model for the database.
There are certain qualities for a well-designed operational relational database: it shall support the
retrieval of both the required and ad hoc or unpredictable information, it includes effective table
structures where each table defines only one purpose and each record can be identified by a
unique attribute or combination of them, it takes care of data integrity in attribute, table and
relationship levels, it can adjust to future growth, it is easy to modify and maintain the database
structure so that changes in one attribute or table do not damage other attributes or tables, it is
easy to modify the data so that for example changing a value is done only once into one place, it
is easy to retrieve the data, and it is easy to develop and build the applications using the
database. The analytical databases address data retrieval, analysis and reporting. Hence they
have different key qualities, such as storing the history data for trend generation, standardizing
the data from different operational systems by using standard ids and keys, defining clear and
intuitive data structure to make the retrievals easy, creating derived data for most commonly used

41
information needs, storing the data in fine enough granularity, and ensuring fast enough response
time for the retrievals. In addition, regardless of the database type, it is important that the
database supports business rules relevant to the organization by providing valid and accurate
information, and that the database lends itself to future growth as the business information
requirements change and grow . (58) (59 p. 33) (68 p. 134)
The database design process includes both logical and physical steps, regardless of the actual
methods used. Logical, product independent, phases are typically requirements analysis, data
structure definition and normalization. In the requirements analysis phase the company or
community is examined, by interviewing the users and management to analyze and understand
needs in general, both in short and long term. Next, the data structure is defined, for example
using so-called entity relationship (ER) diagrams, by visualizing the tables, table attributes, table
relationships and their properties, as well as the use of primary and foreign keys for the
relationships, see FIGURE 6. Some DBMS administration tools support this phase, although this
can be done simply on paper or whiteboard as well. In the normalization phase the defined
database structure is verified against a list of few normalization rules, and modified in case of
problems found. The goal is to remove the possible problems that would have been run into later
when using the database. This usually involves dividing large tables into smaller ones and
removing duplicate data attributes between the tables. However, some selective denormalization
can subsequently be done for example for performance reasons. The physical phases in the
database design process are database implementation and performance tuning, and their
implementation depend on DBMS and its language. The DBMS is selected in the database
implementation phase at latest, and the database is actually created according to the defined
database structure. This can be done using the query language, like SQL, on the database
server, or utilizing the DBMS wizards for example directly from the ER diagrams. The
performance tuning phase usually means indexing, but may include also sorting the order of table
rows, refining the structure definitions, modifying database parameters, denormalization, adding
tables for derived data, analyzing the server memory, processor and disk solutions, and
prioritizing processes at the operation system level. Index is a copy of a part of a table, like a
sorted index of a book. Purpose of an index is to improve the speed of data retrieval from a table,
although the costs are slower write operations and use of more storage space. Indexing alone
can significantly improve the performance of the use of the database, without touching the
application, but finding the optimal and best index is not a simple task. Indexing can be done or
refined both before and after the launch of the database and its application. In addition, the
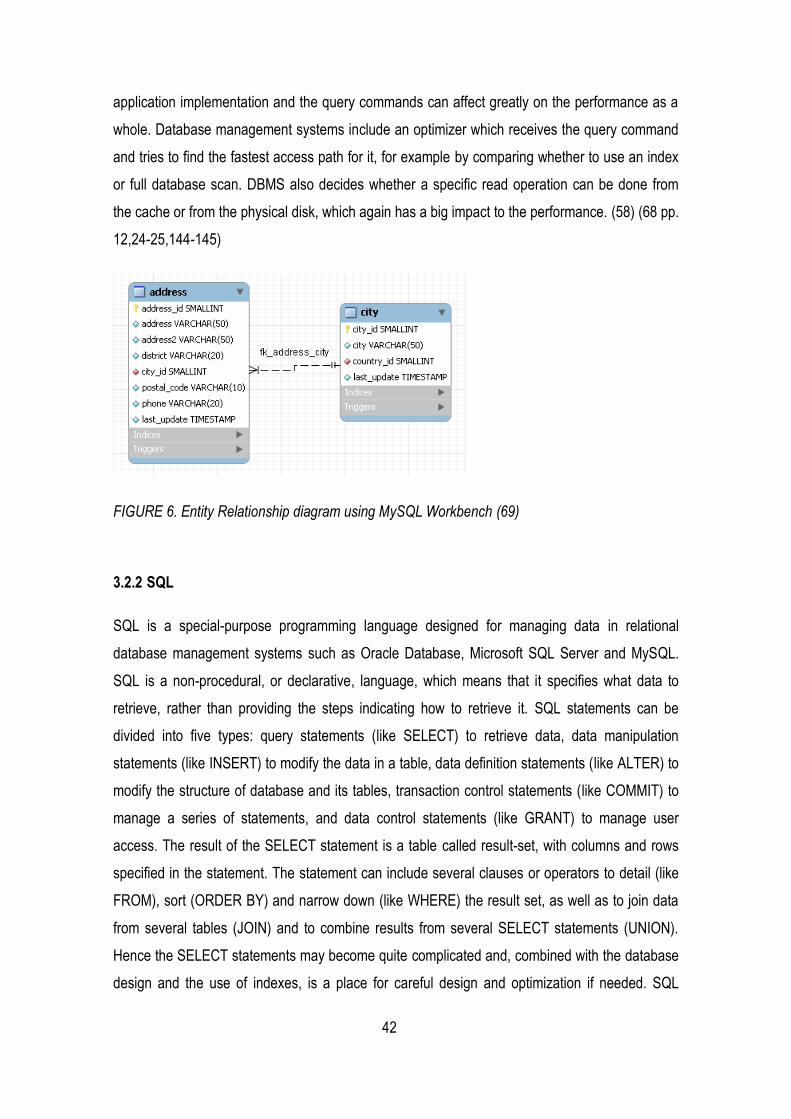
42
application implementation and the query commands can affect greatly on the performance as a
whole. Database management systems include an optimizer which receives the query command
and tries to find the fastest access path for it, for example by comparing whether to use an index
or full database scan. DBMS also decides whether a specific read operation can be done from
the cache or from the physical disk, which again has a big impact to the performance. (58) (68 pp.
12,24-25,144-145)
FIGURE 6. Entity Relationship diagram using MySQL Workbench (69)
3.2.2 SQL
SQL is a special-purpose programming language designed for managing data in relational
database management systems such as Oracle Database, Microsoft SQL Server and MySQL.
SQL is a non-procedural, or declarative, language, which means that it specifies what data to
retrieve, rather than providing the steps indicating how to retrieve it. SQL statements can be
divided into five types: query statements (like SELECT) to retrieve data, data manipulation
statements (like INSERT) to modify the data in a table, data definition statements (like ALTER) to
modify the structure of database and its tables, transaction control statements (like COMMIT) to
manage a series of statements, and data control statements (like GRANT) to manage user
access. The result of the SELECT statement is a table called result-set, with columns and rows
specified in the statement. The statement can include several clauses or operators to detail (like
FROM), sort (ORDER BY) and narrow down (like WHERE) the result set, as well as to join data
from several tables (JOIN) and to combine results from several SELECT statements (UNION).
Hence the SELECT statements may become quite complicated and, combined with the database
design and the use of indexes, is a place for careful design and optimization if needed. SQL
43
queries can be executed on the server with a command line interface, on workstation using the
DBMS administrations tools, and as embedded piece of code with application programming
languages such as PHP, C# or Java. (58) (68 p. 10)
SQL has been adopted as a standard by the American National Standards Institute (ANSI) and
the International Organization for Standardization (ISO). That said, SQL has received criticism
about the incompatible implementations between database systems. In particular date and time
syntax, string concatenation, NULLs, and comparison case sensitivity vary from vendor to vendor.
As a result, SQL code can rarely be ported between database systems without modifications.
There are several reasons for this lack of portability. The SQL standard is big and complex, and
that is why most vendors do not support the entire standard. The standard leaves several
database behaviors and language constructs open or less well-defined for vendors to decide the
implementation of the behavior. Many database vendors have large existing customer bases and
may therefore be unwilling to break backward compatibility. The incompatibilities may also be
business decisions to provide a strong incentive for their existing users to remain loyal. (70)
3.2.3 Evaluation of DBMSs
Like in the evaluation for web development solutions, the evaluation here is scoped to open
source systems. Evaluation is done by introducing the solutions in the context of the developed
Qt metrics system. The actual solution selection is described and explained later in this
document.
MySQL
MySQL is one of the most widely used relational database management system in the world. It is
named after the daughter, My, of the co-founder Michael Widenius. MySQL is a popular choice of
database for use in web applications, and is a central component of the widely used AMP
(Apache, MySQL, Perl/PHP/Python) open source web application software bundles. MySQL is
available as open source community edition and as several commercial editions with additional
functionality by Oracle. MySQL is often used by free-software and open source projects which
require a full-featured database management system. MySQL is used in many high-profile

44
website companies for one or several content types, including Wikipedia, Facebook, Twitter and
YouTube, and in large organizations such as NASA and CERN. (62) (71) (72)
MySQL ships without GUI tools to administer MySQL databases or manage data contained within
the databases. Users may use the included mysql and mysqladmin command line clients, or
MySQL front-end desktop software or web applications. MySQL Workbench by Oracle is a visual
database design desktop tool that integrates SQL editor, database design and database
administration into a single IDE for the MySQL database system. It supports also database
migration as well as export and import functionalities. MySQL Workbench is available as open
source community edition and commercial edition. Another commonly used administration tool is
phpMyAdmin. It is an open source web application and IDE intended to handle the administration
of MySQL. It can perform various tasks such as executing SQL statements, importing and
exporting data, managing users and permissions, and to monitor MySQL server activity like
connections, processes, CPU/Memory usage. The phpMyAdmin is included in many web
development environments or software bundles, like in EasyPHP DevServer WAMP. (73) (74)
The MySQL pluggable storage engine architecture enables a database designer to select a
specialized storage engine for a particular application need. Commonly used engines with a
MySQL database are MyISAM and InnoDB. They have certain differences according to their
targeted use. MyISAM has been designed for need of speed while InnoDB has been designed for
maximum performance when processing large data volumes. Use of MyISAM is optimal if the
table is more static with more data retrieval and less update and delete. MyISAM uses full table-
level locking while InnoDB has row-level locking, which increases multi-user concurrency and
performance. To maintain data integrity, InnoDB supports foreign key constraints so that inserts,
updates, and deletes are all checked to ensure they do not result in inconsistencies across
different tables. InnoDB supports transactions to be able to commit and rollback, while in MyISAM
once a statement is issued it is done. MyISAM supports fulltext search indexes, and InnoDB
doesn't. InnoDB has crash-recovery capabilities to protect user data. InnoDB tables arrange data
based on primary keys, while MyISAM organizes data by default in storage order. InnoDB stores
its tables and indexes in a tablespace, MyISAM stores its tables, data and indexes in diskspace
using three different files. Backup of InnoDB tables can be done just by taking a snapshot of the
file system, while MyISAM requires using the mysqldump client but the result is not guaranteed to
be consistent. (58) (75) (76)

45
Many programming languages with language-specific APIs include libraries for accessing MySQL
databases. These include for example C# and Java, and languages that support the open
database connectivity (ODBC) interface to communicate with a MySQL database, such as PHP
and Perl. Like other SQL databases, MySQL does not currently comply with the full SQL standard
for some of the implemented functionality, including foreign key references when using some
storage engines other than the InnoDB. MySQL, like most other transactional relational
databases, is strongly limited by hard disk performance. This is especially true in terms of write
latency. (77)
MariaDB
MariaDB database is truly open source and is compatible with the MySQL while providing new
extensions and features. Customers and users value MariaDB for its performance. In addition to
MySQL, it is capable of interfacing with NoSQL database systems like Cassandra and LevelDB
as well as to access data in other formats thanks to its pluggable storage engines. Hence the
customers are able to leverage the capabilities of the latest database technologies as well as to
access data in legacy systems without expensive and risky database migrations. MariaDB is a
community-developed fork, a source code branch, of the MySQL database. What this means is
that the developers have taken the freely available MySQL code and then added to it. One major
objective is the community maintenance of its free status under GPL as opposed to any
uncertainty of MySQL license status under its current ownership by Oracle. The intent is also to
maintain compatibility with the MySQL, ensuring a drop-in replacement capability with library
binary equivalency and exact matching with MySQL commands, for example. Regarding the
ports and sockets, the client APIs and protocols that MariaDB uses are all the same as in
MySQL. All MySQL connectors, those bits of code which allow programming languages like Java,
C, PHP, .Net, Perl, Python, and Ruby to talk directly to a MySQL database, all work unchanged
with MariaDB. All client programs that can talk to MySQL databases can also talk to MariaDB
databases without any changes. In addition, the on-disk format of the databases is the same,
which allows MySQL to open a database created with MariaDB just like MariaDB is able to open
one created with MySQL. This all means that in most cases, uninstalling MySQL and installing
MariaDB is enough to continue operations. Every project which works with MySQL also works
with MariaDB. Specifically documented tools to support MariaDB are front-end applications such

46
as HeidiSQL and phpMyAdmin, and web site builders such as WordPress and Drupal. (78) (79)
(80) (81) (82)
The benefit of MariaDB, in addition to being truly open source, comes from new features,
performance improvements, better testing, and bug fixes which are not found in MySQL. Some of
these were developed in-house by the core MariaDB developers, and others come from individual
contributors and companies such as Facebook, Twitter, Google, and others. New features include
extended user statistics to better understand the server activity and to identify the sources of
database load, progress messages from the server for long running commands, faster joins and
sub-queries, as well as NoSQL-style features like dynamic and virtual columns, and so-called
HandlerSocket to provide fast and direct access to InnoDB tables by skipping the SQL layer.
Several enhancements found in MariaDB are performance related, including improved optimizer
which performs significantly faster than the MySQL one on complex workloads, enhanced
replication, and co-called table elimination to optimize the use of views to access highly
normalized data. Regarding the better testing, many improvements have been made to the
testing infrastructure of MariaDB. That together with the deep knowledge and experience of the
MariaDB developers and the focus on compiler warnings has already resulted in reduction in the
overall number of bugs and compiler warnings. MariaDB includes pluggable storage engines like
XtraDB as a replacement for InnoDB, and new transactional storage engine Aria to enable faster
complex queries than MyISAM. MariaDB version numbers followed the MySQL version numbers
until 5.5. Thus, all features from MySQL 5.5 were available in MariaDB 5.5. After version 5.5 it
was decided to start a branch numbered as 10.0 to make clearer that MariaDB will not import all
features from MySQL 5.6 into MariaDB 10.0. (81) (83) (84)
The MariaDB Foundation promotes, protects, and advances the MariaDB codebase, community,
and ecosystem. The Monty Program is a center of engineering excellence for MariaDB, the Aria
storage engine, MySQL, and other associated technologies. This Finnish based company was
founded by Michael "Monty" Widenius, the founder and creator of MySQL; MariaDB is named
after the younger daughter of Monty, Maria. Significant arrangements have been made lately
when SkySQL, a Finnish based company which provides open source database solutions for
MySQL and MariaDB users in the enterprise and cloud, announced in April 2013 that they are
merging with Monty Program Ab. This merger reunited key members of the original MySQL AB
developer and services teams, and their aim is to bring cloud and big data capabilities together,

47
and to develop MariaDB into a truly interoperable, NewSQL open source database in
collaboration with its customers, partners and the community. (80) (85) (86)
One remarkable achievement was made in April 2013 when Wikipedia announced the completion
of the migration of the English and German Wikipedias to MariaDB 5.5. They prepared the
change from late 2011, first upgraded from MySQL 4.0 to 5.1 and then to 5.5, and finally changed
to MariaDB 5.5, with the help of the MariaDB team regarding a pair of bugs. (87)
3.3 Reporting Tools
A database stores data, but the data must be processed in some manner before it turns into
meaningful information. Data itself is static while information is dynamic in the sense that it
constantly changes to reflect the latest data, and also as data can be processed and presented in
innumerable ways. Information can be provided only if the data is valid, accurate and appropriate,
and if the database is well structured to support the required information. Information can be
presented in many ways, from spreadsheet reports and prepared slideshows to interactive
applications and complete business intelligence (BI) solutions. (59 pp. 45-46,129-130)
On-line reports are commonly accessed via a browser application or web portal. Essential quality
for a web based solution is the usability. Jakob Nielsen defines usability as five components:
learnability, efficiency, memorability, errors and satisfaction (88). Learnability is that how easy it is
for users to accomplish basic tasks the first time they encounter the design. Efficiency means that
how quickly users can perform tasks once they have learned the design. Memorability is that how
easily users can reestablish proficiency when returning to the design after a period of not using it.
Errors relate to how many errors users do make, how severe those errors are, and how easily
they can recover from the errors. Satisfaction identifies how pleasant it is to use the design. If the
usability of the system is poor, the users may spend a considerable amount of time trying to
figure out how to use the system, or they may become frustrated or may not be able to really use
the system at all, and eventually simply stop using it. Additionally, there are other desirable
features for web portals in general and report portals in particular. The portal should be rich in
content, instead of pure report printing tool, in that it should contain additional functionality such
as advice, help, support information and documentation. The portal should be clean i.e. designed
so that it is easily understandable and not over complex as to confuse the users. The portal must
reflect the latest available data and hence shall be updated regularly. The portal should be

48
interactive to make it easy for the users to use its functionality and encourage them to use the
portal. Scalability and customization give means to fit the portal to each user. It is important that
the portal is value oriented so that the users have the feeling that the application is a valuable
resource that is worth working on. (88) (89)
In its general meaning, a dashboard in a vehicle is a panel located in front of the driver to help
him or her to control the vehicle. In the information technology, a digital dashboard is a view to
the key indicators of an organization at one glance to enable instantaneous and informed data-
based decisions. A good dashboard is easy to read, often single-page graphical view with a real-
time user interface, showing a presentation of the current status (snapshot) and historical trends.
Typically, users see first the high-level summary and are then able to drill down into low level
information. The use of red-yellow-green color coding is a very common approach. A dashboard
can be a stand-alone software application, a web application, or a so-called desktop widget
driven by a widget engine. FIGURE 7 illustrates a sample digital dashboard. (90)
FIGURE 7. A digital dashboard (91)
It must be remembered though that any dashboard or metrics reporting solution is only as good
as the metrics defined in it.

49
3.3.1 Evaluation of Solutions
In addition to open source systems, evaluation scope includes few commercial applications.
Again, evaluation is done by introducing the solutions in the context of the developed Qt metrics
system, and the actual solution selection is described and explained later in this document.
Spreadsheet
A spreadsheet application, such as Microsoft Excel, supports creating charts, graphs, or
histograms from specified table of data. The pivot table functionality in the Excel is useful
especially for analyzing purposes. The Excel allows to read data from an ODBC supported
database and to build a set of reports with bar charts or history trend graphs. Sheets or areas of
sheets can be saved in HTML format in to network disk or web server for viewing. In addition, it is
possible to utilize the Visual Basic for Applications (VBA) language to automate for example the
data retrieval, operations to update the report sheets, and to save the reports as HTML into
specified location. This way it is possible to generate up-to-date information to the users.
However, users are not able to tailor or customize the views, unless the views are separately
implemented for each usage and purpose.
Reporting software
There is also open source and commercial reporting and querying software available to extract,
sort, summarize, and present selected information. (92)
Pentaho offers an open source BI product called Pentaho Business Analytics. It provides
operational and interactive reporting, data discovery and interactive analysis, interactive
dashboards and visualization, data access and integration, predictive analytics, Online Analytical
Processing (OLAP), and mobile experience. However, not all functionality is available in the
community edition but only in the commercial edition. Pentaho can be deployed on-premise, in
the cloud, or embedded into other software applications. (93)
50
QlikView is a commercial BI tool, with a free personal edition, for building dynamic reporting
services. It provides consolidating relevant data from multiple sources into a single application,
exploring the associations in the data, enabling social decision making through secure and real-
time collaboration, visualizing the data with engaging graphics, searching across all data,
interacting with dynamic applications, dashboards and analytics, and accessing, analyzing and
capturing the data from mobile devices. The ability to drill down the view from the graphs is a
valuable feature from the user point of view. (91)
Tableau Software produces a family of interactive data visualization products focused on BI, for
example desktop and server versions are available. In their BI solution they emphasize speed,
self-reliance, visual discovery, large and diverse data, ubiquitous collaboration, and flexible
configurations. Tableau features typical BI functionality, it is able to query multiple sources, such
as relational databases, cubes, cloud databases and spreadsheets, and to generate a number of
graph types that can be combined into dashboards and shared over a computer network or the
Internet. Tableau shows its strength in visualizing data for analysis purposes. (94) (95)
Self-made application
It may also be viable to create a self-made application, most likely a web-based one. Application
would consist of user interface, data retrieval and publication capabilities, and the database
solution together with the practices to store required data to the database, which in this case
would be some component to read the various source data and to store it into database in a
uniform format. The same report portal qualities mentioned above still apply for this reporting
solution as for any reporting product.

51
4 QT METRICS SYSTEM
Introduction to the Qt metrics system is divided here to first list the needs and requirements to the
system, its target audience and their key use cases. The selected solution is described with the
rationale to the selection. Then the Qt metrics system itself is described from both the user and
developer point of view. Lastly the project team is introduced and the development process used
is summarized.
4.1 Requirements
The following requirements were set for the metrics system in the beginning of the development.
1. The web page should be hosted on public Internet under the qt-project.org domain.
2. Since Qt Project is heavily based on open source, it would be good to use open source
technologies on both metrics system front-end and the back-end solutions.
3. The selected technologies and technical solutions should fit also to the areas that will be
implemented later on. The first phase will focus on CI reports (where stored data size is
reasonable), but the next ones will focus for instance on RTA reports (where stored data
size might be very big), and code coverage reports (where results would be integrated
from third parties).
4. Anyone in the Qt developer community should be able to create new reports on the
metrics pages. By combining the efforts it would be possible to get more running reports
than the initial development team alone would be able to make.
5. The user of the web page should be able to filter the information based on different
criteria, and to browse relevant information for his or her needs. The performance of
these operations should be in good enough level to provide positive user experience.
6. The web site design should be documented in such a level that the Qt community can
take responsibility of the site maintenance.

52
4.2 Target Audience and Use Cases
Target audience for the CI metrics part of the Qt metrics system includes the Qt development and
CI teams in Digia and the global Qt developer community, i.e. those individuals and teams that
develop the Qt library components and the Qt tools.
Although many information needs are common to the both user groups, there are also some
needs and use cases for the system that are specific to either one.
The CI team is interested for example in how the CI coverage, for example in terms of
repositories, has progressed, how the CI pass/fail rate has progressed, what breaks the CI in
general, what projects or autotests failed most often thus affecting the CI stability, which CI build
machines failed most often, and which CI builds and phases take the longest time to execute. In
addition, data could be collected about the configurations that are flagged insignificant, and hence
it would be possible to analyze whether the flag could be removed for some of those
configurations. The same case is for the autotests.
A developer or development team is interested in the components and the autotests on their
responsibility. One may want to check if an autotest failed in the latest builds or in all the builds
during the last two weeks, for example. After possible corrections or changes to the autotests, it is
important to see that the previous failures now result success, or that the autotests continue to be
successful, in all affected projects and configurations. It may also be interesting to check the
execution time of builds and autotests.
4.3 Framework and Tool Selection
The solutions for the web, database and report development were selected by analyzing the
system requirements and the development competence needs. Easy integration to the existing
server environment and to the current processes and practices in the Qt Project were also very
important factors for the selection of the implementation framework.
The target system was considered to orient more to information than to visual appearance, which
resulted to selecting the PHP and AJAX approach for web development to enable dynamic
functionality and full customization, as well as to guarantee wide competence space for
maintenance and future development. Using the WordPress or any other web site builder would

53
have been an overkill compared to the needs for the system and to the estimated effort to get a
demo version up-and-running and to develop and maintain the system, based on limited
experience however.
A natural choice for the database solution, to accompany PHP scripting language, was MySQL
for its popularity and availability of development environments. The database could be replaced
later with MariaDB if needs arise for example regarding performance and database size.
A separate reporting tool was not considered necessary as the PHP and AJAX approach allows
building the reports and views needed at this point. The QlikView tool has been in use in Digia,
but it was not considered as a viable option in this case because of its licensing costs with the
expected number of users.
4.4 System Overview
The implemented Qt metrics system consists of three main components: the parser, the report
builder and the database, see FIGURE 8. The parser reads the build logs, test results or other
files that are created in the development process, and pushes the data into the database. The
report builder reads the data from the database, and shows predefined metrics and reports on a
web interface where the user is able to scope and filter the information based on his or her
interests and needs. The parser is implemented with Perl, and the report builder with HTML,
CSS, PHP and AJAX. The database is a MySQL database. The system is running on the existing
Qt testresults server.

54
FIGURE 8. Generic system architecture
The tool and the documentation can be found at:
Qt metrics system: http://testresults.qt-project.org/qtmetrics/
Documentation: http://qt-project.org/wiki/Qt_Metrics_Page_Description
Change backlog: http://qt-project.org/wiki/Qt_Metrics_Page_Backlog. An extract is
available in Appendix 1.
4.5 Using the System
This section introduces the Qt metrics system from the user point of view.
4.5.1 Report Builder Overview
The report builder is a collection of PHP files which reside on the existing Qt testresults server
(Solaris running Apache) on the qt-project.org domain. It utilizes AJAX, JavaScript, and
HTML/CSS (HTML5/CSS3 for some visual appearance). The FIGURE 9 below describes the
logical elements and functionality of the report builder.

55
FIGURE 9. Report builder elements and functionality
The data that is shown in the metrics boxes can be selected with the filters. The data can be
studied on different levels: for instance, list of projects, one project, or one configuration in a
project with the Project dashboard. In addition to using filters for selecting the desired level, the
navigation can be done by clicking for example a project or configuration in a metrics box.
The status box shows the time when the data was updated (scanned) from the log files to the
database, and the session start time identifying when the data displayed was updated from the
database. In addition, the status box will notify if the database is being updated.
The metrics box title row shows the current navigation level, and the links in that row can be used
to navigate back to the previous level as illustrated in FIGURE 10 below.

56
FIGURE 10. Levels and navigation in the Project dashboard
There is a description of each metrics box available (the “i” icon), including the purpose, detailed
description and the data used in the metrics. The description is adjusted to the currently selected
level describing the details on that specific level. FIGURE 11 shows a sample metrics description,
which opens as a new browser window when clicking the “i” icon.

57
FIGURE 11. Metrics description
4.5.2 Use Cases
This section shows how to use the Qt metrics page for a couple of CI analysis and information
study cases.

58
Check what breaks the CI
First, a filter may be defined by selecting recent builds, for example, the builds of this month.
FIGURE 12 below shows an example of the resulting Project dashboard view.
FIGURE 12. Use case: Check what breaks the CI
The following can be noticed:
1. Several builds have a fail percentage higher than 50 %
2. The latest QtConnectivity_dev_Integration build have failed with significant autotests
a. One blocking configuration has failed (and caused several builds to be aborted)
b. The build failed because the autotest tst_qnearfieldtagtype2 failed
c. The latest build 14 was a failure after several successful builds. Note that all
builds have been made during the past few days
3. The latest QtJsonDb_master_Integration build has failed without any failed autotests
a. Three configurations have failed

59
b. The failure reasons can be found in the project log file. To check the log file for
each configuration, click each configuration (3a)
Which autotests failed most recently
First, a filter may be defined by selecting recent builds, for example, the builds of the past two
weeks. Then the list can be sorted by builds having failure category 1. FIGURE 13 lists the failure
categories based on “insignificant” and “force success” flags explained in 2.5 Qt Continuous
Integration.
FIGURE 13. Failure category description

60
FIGURE 14 below shows a sample of the resulting autotest dashboard view.
FIGURE 14. Use case: Check which autotests failed most recently
The following can be noticed:
1. The list is sorted by failure category 1 for all the builds since the selected date
a. See detailed description for failure categories
2. The top three failed autotests during the last two weeks
3. The tst_qmltest is studied here in more detail because it blocked the latest build
a. The configuration build that this autotest blocked (dark red); the other on-going
or waiting builds were aborted and the autotest itself does not have a result
(white)
b. This autotest blocked the previous configuration build but was successful in the
latest one
c. The autotest failed also in another configuration build but did not block it because
the configuration has been flagged as insignificant (red); note that the
61
configuration build itself may have failed or been successful depending on other
criteria
d. The successful configuration builds (green)
e. These builds have been made before the selected date (grey text)
f. See detailed description for the notation used in the table
4.6 Implementation
This section discusses the Qt metrics system components and their implementation into a certain
level of detail in the developer point of view.
4.6.1 Report Builder
Logically the report builder implementation has two separate components. One is controlling the
page layout, including header, footer and metrics pages menu, as well as the AJAX functionality
on a single metrics page. The other is the metrics box generating the report or metrics content
itself, and it is called by using the AJAX. One metrics page can include several metrics boxes,
and the system has been designed so that it is easy to add new metrics boxes, basically just by
listing a metrics box source code file into a configuration file.
The initial report builder implementation consists of one metrics page, CI metrics, having a filter
box, status box and two metrics boxes, Project dashboard and Autotest dashboard. The file
structure of the implementation is illustrated in FIGURE 15 and FIGURE 16.

62
FIGURE 15. Report builder file structure, the default web view (level 1)

63
FIGURE 16. Report builder file structure, a project selected in the Project dashboard (level 2)
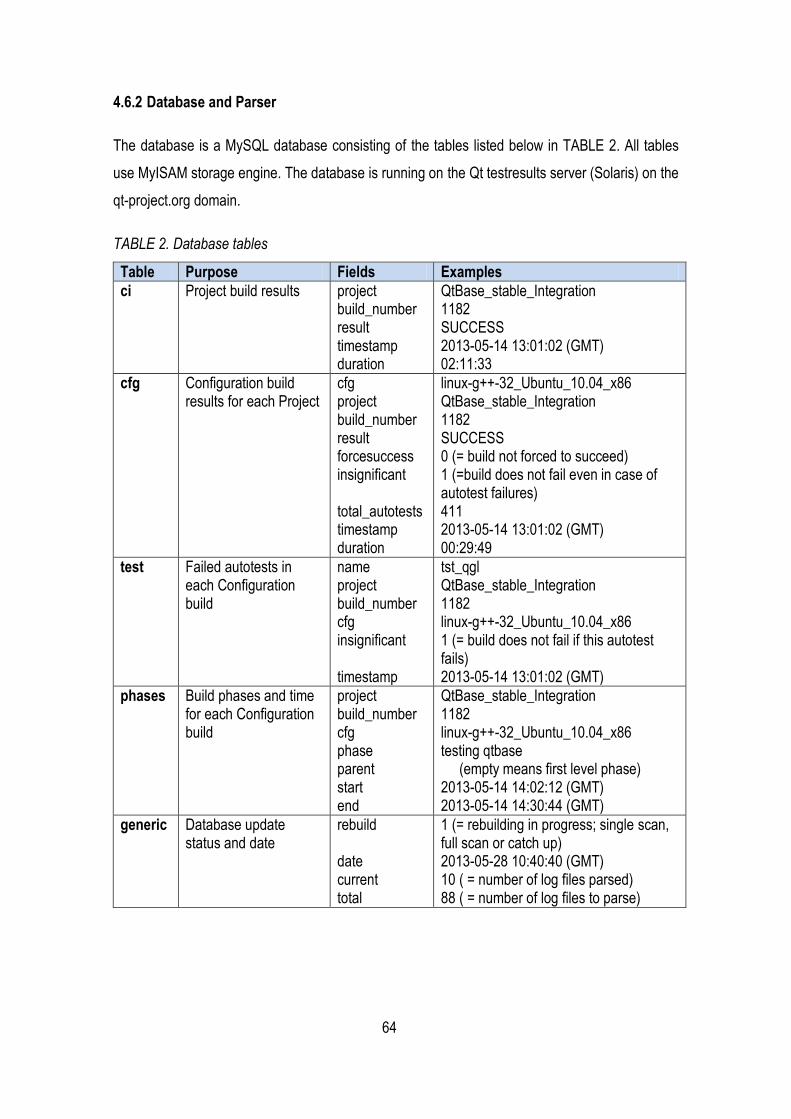
64
4.6.2 Database and Parser
The database is a MySQL database consisting of the tables listed below in TABLE 2. All tables
use MyISAM storage engine. The database is running on the Qt testresults server (Solaris) on the
qt-project.org domain.
TABLE 2. Database tables
Table Purpose Fields Examples
ci Project build results project build_number result timestamp duration
QtBase_stable_Integration 1182 SUCCESS 2013-05-14 13:01:02 (GMT) 02:11:33
cfg Configuration build results for each Project
cfg project build_number result forcesuccess insignificant total_autotests timestamp duration
linux-g++-32_Ubuntu_10.04_x86 QtBase_stable_Integration 1182 SUCCESS 0 (= build not forced to succeed) 1 (=build does not fail even in case of autotest failures) 411 2013-05-14 13:01:02 (GMT) 00:29:49
test Failed autotests in each Configuration build
name project build_number cfg insignificant timestamp
tst_qgl QtBase_stable_Integration 1182 linux-g++-32_Ubuntu_10.04_x86 1 (= build does not fail if this autotest fails) 2013-05-14 13:01:02 (GMT)
phases Build phases and time for each Configuration build
project build_number cfg phase parent start end
QtBase_stable_Integration 1182 linux-g++-32_Ubuntu_10.04_x86 testing qtbase (empty means first level phase) 2013-05-14 14:02:12 (GMT) 2013-05-14 14:30:44 (GMT)
generic Database update status and date
rebuild date current total
1 (= rebuilding in progress; single scan, full scan or catch up) 2013-05-28 10:40:40 (GMT) 10 ( = number of log files parsed) 88 ( = number of log files to parse)

65
The database table fields and their types are shown in FIGURE 17.
FIGURE 17. Database tables, and their fields and field types
The tables are independent and not linked with each other. This denormalization is done on
purpose for performance reasons and for the sake of simplicity. The combination of multiple
primary keys in each table uniquely identifies each row in the tables to ensure that there is no
duplicate data in the database. The data consistency between the tables is taken care by the
parser. The database is not indexed at the moment, apart from the use of the primary keys.
New data is added to the database only by the parser. For CI, data is inserted from the new log
files when a new build has completed. This method is called a “single scan”. The data already in
the database is never updated since build results never change after a build. However, if there is
a need for example to add a new database field or to change a field type, the whole database
must be rebuilt from the log files. This method is referred as a “full scan”. There is also a “catch
up” method to compare the database against the build log files residing in the server, and to add
the possibly missing data. This is needed for example if single scan operations failed for some
reason.
4.6.3 Key Functionality
The implementation details for following functionalities are explained below:
Initial loading of the page
Selecting a filter to update metrics box(es)

66
Database status indication
Flat vs. nested metrics boxes
More explanations are available at http://qt-project.org/wiki/Qt_Metrics_Page_Description with
their code samples.
Initial loading of the page
The initial loading of the page for the first time is processed in the following chronological order:
1. The database status displays a welcome text. If a database update is in progress, it is
indicated.
2. Filters are loaded with their values from the database. The project, configuration and autotest
filter values are read from the database and stored into session variables. In addition,
detailed data is read and stored for each project (for example latest build number, result and
timestamp). Session variables are used to improve performance so that it is not required to
read all the basic data every time the page is loaded (in other words, when the user selects a
filter or item link to update his/her view). If the session variables already exist, the filters are
not read from the database again.
3. Metrics boxes are loaded with their content. The metrics boxes are loaded only after the filter
box is ready in order to ensure that the project, configuration and autotest values are
available in the session variables. Unfortunately this causes some waiting time when loading
the page for the first time. However, the subsequent page updates are then faster.
4. The database status is updated with session start time and database update time.
Selecting a filter to update metrics box(es)
The metrics boxes are updated whenever a filter value is changed, without a separate
confirmation button. The defined metrics boxes are looped and if set to apply the selected filter,
an AJAX request is sent to load the metrics box content.
Content is loaded by content generating PHP files (here ci/showprojectdashboard.php and
ci/showautotestdashboard.php) which read the required data from the database and arrange the

67
information into readable report format. The filter parameters (project, configuration, autotest etc.)
are passed to the content generating PHP files with the HTML GET method where the variable
and its value are sent in the URL with the requested PHP page. The content generating PHP file
can use these parameters to scope the database searches. When the content is ready the related
metrics box div is updated.
The database status box is updated after every metrics box update to show the possible status
change in the database to the user during her or his session.
It is up to the metrics box definition and implementation what data is needed and in what layout
and appearance to use. The table format used in the initial dashboard PHP files is recommended
for similar type of reports.
Database status indication
The last database update time as well as a possible ongoing update is stored into a generic table
in the database. In addition to the welcome text in the database status box three different cases
are indicated to the user.
In the normal case the session start time and the database update time are shown. First special
case is when the database has been updated after a user session start, for instance a single scan
update was done while the user was studying the metrics box information. Here the database
update time is compared with the session start time. The session start time and database update
time are displayed, together with a “New data available” message.
Second special case is when the database update is in progress, either during the initial loading
of the page or when the Qt metrics page is used. Here the generic table holds the flag that an
update is in progress, and records the timestamp of the update. The database update progress is
shown as a currently ongoing step compared to the total number of steps, with a link to refresh
the progress information.
68
Flat vs. nested metrics boxes
The difference between a “flat” and a “nested” metrics box is mostly about usability. A “flat” box
uses filters from the filter box only, while a “nested” box has item links that can be used to drill
down to the next level for more detailed information on that specific item. Currently both Project
dashboard and Autotest dashboard use the “nested” style where clicking an item link is actually
the same as selecting a value from the filter. The only difference is that the filters have all the
values listed that are available in the database while the boxes list only a portion of the items that
valid only for that specific view. A clickable link is added to the each item name which calls the
related filtering function like when using the filter selection boxes.
4.7 Development and Maintenance
As listed in 4.1 Requirements, one important goal for the metrics system was to enable anyone in
the Qt developer community to able to create new reports to the metrics pages. The report builder
implementation follows that principle in its design, directory and file structure, and in the
components that were built, many of which were already described in 4.6.3 Key Functionality.
This section describes a few typical development and maintenance cases as a supplement to the
detailed implementation description in 4.6 Implementation.
4.7.1 Directory Structure and Naming Conventions
To keep the system manageable the following rules of directory usage and file naming
conventions are recommended, as used in FIGURE 15 and FIGURE 16.
The common files like header.php, menu.php, commondefinitions.php and styles.css are located
in the main level directory, as well as the metrics page files that collect the page payout (here the
metricspageci.php). Images and common components, the calendar for example, use their own
subfolders. The files that are specific to a metrics page should be stored into a dedicated
subfolder, like “ci” for the CI Metrics page here.
A few file naming conventions should be followed. Metrics page files should use name
“metricspageTITLE.php”, where TITLE indicates the page content and purpose. Metrics box files

69
should be named “showBOXNAME.php”, where BOXNAME indicates the content and usage of
the related metrics box. If the metrics box has been implemented using several files, it may be
practical to use files names like “listSECTIONNAME” for those. Files that get the data for the
filters from the database are called “getFILTERFIELD.php”. The metrics description files use
format “msgBOXORDESCRIPTIONNAME.html”. Note that all file names are written in lower
case. The file extension depends naturally on the implementation of each file.
The detailed list of current directories and files is shown in TABLE 3.
TABLE 3. List of directories and files
Folder/File Purpose
(main folder) Common implementation files
ajaxrequest.js JavaScript file for sending and receiving the AJAX requests
commondefinitions.php Definitions for common flags and values
connect.php To establish the MySQL connection
connectionclose.php To close the MySQL connection (code currently commented out)
connectiondefinitions.php Database server definitions and flags for MySQL API and connection type
footer.php Footer area
header.php Header area
index.php Default file redirecting to metricspageci.php
menu.php Main menu of metrics pages
metricspageci.php CI Metrics page implementation
styles.css Common style definitions
calendar/ Calendar component from http://www.triconsole.com/php/calendar_datepicker.php
ci/ CI Metrics page implementation files
ci/calendar/ Directory for one calendar component image
ci/functions.php Common functions used in CI Metrics implementation
ci/getautotestvalues.php To load all the autotest values from database
ci/getconfvalues.php To load all the configuration values from database
ci/getdatabasestatus.php To load the database status, for example the time of update, from the database
ci/getfilters.php To layout the filters and call files to load the filter values
ci/getprojectvalues.php To load all the project values from database
ci/listbuilds.php To show the project and configuration build history in project dashboard (level 2 and 3)
ci/listconfigurations.php To show the configurations in project dashboard (level 2)
ci/listfailingautotests.php To show the failed autotests in project dashboard (level 2 and 3)
ci/listgeneraldata.php To show the general data for project and configuration build in project dashboard (level 2 and 3)
ci/listprojects.php To show the projects in project dashboard (level 1)

70
ci/metricsboxdefinitions.php To list the metrics boxes and define their functionality regarding to the filters
ci/msgautotestdashboardlevel1.html Metrics description for autotest dashboard (level 1)
ci/msgautotestdashboardlevel2.html Metrics description for autotest dashboard (level 2)
ci/msgautotestresultdescription.html Description for autotest result history notation used in autotest dashboard (level 2)
ci/msgfailuredescription.html Description for autotest failure categories used in autotest dashboard (level 1 and 2)
ci/msgprojectdashboardlevel1.html Metrics description for project dashboard (level 1)
ci/msgprojectdashboardlevel2.html Metrics description for project dashboard (level 2)
ci/msgprojectdashboardlevel3.html Metrics description for project dashboard (level 3)
ci/showautotestdashboard.php Autotest dashboard metrics box implementation (all sections in the same file)
ci/showprojectdashboard.php Project dashboard metrics box implementation (separate sections implemented in their own files)
images/ Directory for common images like logos and icons
4.7.2 Modifying the Existing Metrics
Cases may arise where the content or the layout of an existing metrics box report needs to be
changed. The file to locate the implementation can be found in TABLE 3. Generally, the change
may typically be involved with a request to include new or changed information to the data tables,
or to include new data from the database. In the first case special attention is needed to keep the
resulting HTML script for the data table in order, for example a new column must be added to
every row of the table. In the latter case, the MySQL command needs to be changed. A good
practice is to test the refined MySQL command with a live database connection first. If metrics
box content is changed the affected description HTML file, if any, should be updated accordingly.
The layout of the data is defined by the selection of the columns in the table and by the common
CSS style definitions. It is recommended to use the HTML5 approach to make the style
definitions in the CSS file instead of in the PHP (or HTML) code. The HTML markup validator
(http://validator.w3.org/) and the CSS validator (http://jigsaw.w3.org/css-validator/) should be
utilized for the resulting HTML code.
The report builder version in the footer (footer.php) should be updated on every change.

71
4.7.3 Create New Metrics Box
The current metrics boxes, ci/showprojectdashboard.php or ci/showautotestdashboard.php, can
be used as a basis for a new metrics box implementation. The difference between those current
implementations is that the project dashboard uses an approach of multiple files, while the
autotest dashboard is implemented to a single file.
There are a few recommendations to ensure a common look’n’feel:
1. Close to the title, there should be link to a description window (the “i” icon).
2. The filtered value(s) that affects the content should be shown in the title row in case of a
nested metrics box. In addition, the filtered value(s) should appear as table as the first
part of the content. This may include also other common information related to the
metrics box.
3. It is recommended to use a table format for the information.
4. A nested metrics box should have the values and filter links in the leftmost column.
5. Defined green and red text colors and backgrounds (in styles.css) should be used to
indicate “ok” and “not ok” data.
6. Rows in a table are colored differently on every other row for better readability.
7. The length of the content in a box, when initially loading the page, should not be too long,
in order not to hide the other metrics boxes. The consequent page loadings may show
the full content.
A new metrics box requires only the implementation file(s) and its definition in the
ci/metricsboxdefinitions.php. As discussed earlier, the definition includes the behavior regarding
the filter changes. Here a new metrics box, implemented in ci/showsomenewbox.php, will be
automatically updated when the project filter is changed but will not react to the other filters:
$arrayMetricsBoxesCI = array (
// Fields: File path and name, Applied filters, Filters to clear when other applied ones change
array("ci/showprojectdashboard.php" ,"Project,Configuration,Timescale", ""),
array("ci/showautotestdashboard.php", "All", "Autotest"),
array("ci/showsomenewbox.php", "Project", "")
);

72
4.7.4 Add New Data to Database
Only the parser adds data into the database. If new data fields are needed to the database while
specifying or implementing new content of the existing or new metrics boxes or pages, a change
request to the parser is needed. The change request should include information as to whether the
new data is already available, for example in some log files, or whether the change requires a
change to the log files.
One issue for the current MySQL database is the size. The size of the database tables should be
kept under control. Change requests should take this into account. In addition, as new data is
added to the database on a daily basis, the database size increases continuously. This issue is
solved by cleaning old data from the database regularly because the metrics system use cases
do not require long history trends as such. In practice, this means that a history of only four
months should be kept in the database. The parser takes care of this functionality.
4.7.5 Quality Assurance
The following actions have been identified, and used in the current implementation, to ensure the
quality of the change commits.
Qt Commit Policy (http://qt-project.org/wiki/Commit_policy), Qt Coding Style (http://qt-
project.org/wiki/Qt_Coding_Style) and Qt Coding Conventions (http://qt-project.org/wiki/Coding-
Conventions) should be used where applicable for the PHP, HTML and CSS implementation, and
for others if used.
As a general rule for all Qt contributions, it is important to make atomic commits. That means that
each commit should contain exactly one self-contained change. Unrelated changes, or new
functionality and error corrections, must not be mixed. Likewise, unrelated small fixes, for
example to coding style, should not be hidden in bigger commits, but to should be handled in a
separate commit. Small changes also make the review process easier so that a single person is
able to approve a change to a single component, compared to a change touching multiple parts
of code which requires multiple approvers as well because a single person does not feel
comfortable to approve the changes that are not in his or her responsibility.

73
It is recommended to follow the HTML5 standard and use the HTML5/CSS3 approach for
example to make the style definitions in the CSS file instead of in the PHP or HTML code. The
HTML markup validator (http://validator.w3.org/) and the CSS validator (http://jigsaw.w3.org/css-
validator/) by the W3C should be utilized for the resulting HTML code. As the metrics boxes are
filled by AJAX functionality, the direct page URL cannot be used in this case. Instead, for the
HTML markup validator, the “Validate by Direct Input” option must be used for the resulting HTML
code. It must be noted that the validation is made to the exact content visible on the page.
Therefore all applicable views must be validated separately to make the validation coverage as
high as possible.
The Gerrit early warning system will make certain checks to the code (29). It is a good practice to
make the check before pushing the changes to Gerrit to avoid unnecessary fix patches. A
sanitizer tool, a script made with Perl, can be used for that.
The development of the Qt metrics system can be done using any available web development
environment that supports PHP and MySQL, like XAMPP, LAMP or WAMP via EasyPHP, for
example. Sample data should be stored into MySQL database tables. It is important to use
different variations of data to cover all the cases and paths in the implementation. This typically
requires modifications or additions to the real data to simplify the testing. In addition, the changes
can be verified on the Qt testresults server in a specific verification folder before submitting
changed code.
Verification in all major browsers is essential for any web based service. The Qt metrics system
has been designed for large screen web browsers, although the visible content area has been
defined to be as narrow as possible for the content used. All changes should be verified at least
with the following browsers: Chrome, Firefox, Opera, IE and Safari. Use of different operating
systems and browser versions, as well as mobile browsers, is also recommended. However, it
must be noted that the Qt metrics system implementation does not follow responsive design to
adjust to different screen resolutions. Hence, still keeping the functionality available, some minor
imperfections for instance in the layout may be allowed in small screen browsers. It is proposed
to list the verified browsers in the Gerrit commit description.

74
4.7.6 Submitting Code
The development of the Qt metrics system can be done on any server environment that supports
PHP and MySQL. A Qt repository is then used to make the implemented open source code
publically available, in this case the master branch of the qtqa/sysadmin repository in the
sysadmin/non-puppet/qtmetrics folder. The submissions follow the common Qt contribution
guidelines (http://qt-project.org/wiki/Qt-Contribution-Guidelines) including the use of the Gerrit
code review tool (https://codereview.qt-project.org). Once the approved changes in a commit
have been merged in Git, the changes will be pushed to the Qt testresults server on the qt-
project.org by the CI team, and finally become visible to the users of the Qt metrics system. To
summarize, the development environment, the controlled source code repository and the server
running the Qt metrics system are all isolated from each other. This ensures that only approved
changes will be integrated and that the running system remains stable.
The steps to make changes and submit Qt metrics system code to the Gerrit code review tool are
as follows (31):
1. Get the latest code from the Qt repository used to local work area
2. Make the changes in the local work area
3. Add files to Git change tracking
4. Make the commit package including a change description
5. Run the sanitizer to check the early warning system messages before pushing the
changes forward. Fix the errors, if any, and re-run the sanitizer.
6. Push changes to Gerrit
7. Request contribution feedback by adding reviewers to the change in the Gerrit code
review tool. In case corrections are needed, create a fix patch by repeating the steps 2 to
6 until the change is approved and moved to Staged status.
4.7.7 Security and Data Validation
The source data used in the Qt metrics system is publicly available. The log files for the CI
metrics page, for example, can be found at http://testresults.qt-project.org/ci/. Hence the data
itself does not need any additional user access control. The report builder of the Qt metrics
system uses one user id to read the data from the database. This user has only a read access to

75
the database. The parser uses the Qt integrator user id, with a SSH private key, to store the data
to the database. The database cannot be accessed outside the Qt testresults server, where both
the report builder and the parser reside. Because the data is not confidential and it is never
modified by the user, the current level of security is considered sufficient. This could be changed
if needs arise.
The parser takes care of the data validation when reading the log files for example by repairing
the data to be stored in case of possible errors or corrupted data in the logs. The data
consistency between the database tables is taken care of by the parser as well. The MySQL
DBMS ensures that duplicate data is not stored into the database by using primary keys in the
database tables.
4.8 Project Management Practices
The development team, or pair, consisted of Tony Sarajärvi, the CI Technical Lead in Digia, and
Juha Sippola, student at Oulu University of Applied Sciences (Oulu UAS). Tony was responsible
for the back-end solutions, including the parser and the database, as well as required server set-
ups and configurations. He also introduced the used practices and tools, and acted as the
commissioner supervisor of the thesis work. Student Juha Sippola was responsible for the front-
end solutions, including the report builder and the web interface, as well as the database
structure and its refactoring. In addition, Juha created the required documentation into the Qt
Project wiki.
The development process used in the project followed the six-phase approach, described in 3.1.2
Development Process, where applicable. The information gathering phase was mostly already
done in the form of target setting for the metrics system. Original idea had been to implement the
system by Digia employees, but there was not high enough priority nor budgetary sponsorship
available for that plan. The first meeting in Digia focused on sharing the background information,
target audience and the resources available. After the official project start the communication
methods were agreed to cover discussions, weekly reports via email, and general information
sharing towards Digia and the school. However, major part of the work itself planned be done in
Digia premises.

76
In the strategy phase the CI process and the available source data were studied and the possible
solutions were brainstormed within the project team. The system architecture was defined and
split to front-end and back-end solutions. Finally, the technical solutions were selected (see 4.3
Framework and Tool Selection).
The prototyping phase was done by implementing a live demo system, separately and
concurrently for the front-end and back-end. The front-end report builder implementation used
the Oulu UAS web and database server environment while the back-end used a local WAMP
environment with real data from the CI build log files. Partial real data was exported from the
WAMP and imported to Oulu UAS environment to stay in synch with the database table and data
structures. The metrics system web interface was publicly available both to the project team and
to key stakeholders in Digia for testing as well as for commenting the information design and the
interface features. The user controls in the UI and the content of the reports and metrics were
refined during the prototyping phase based on the user comments. For example, the concept of
nested metrics box was invented. The metrics system was called a “demo” at this phase. The
selected solution was evaluated with the key users and it was agreed to proceed and to move the
system to the production environment. Further development and improvement needs were listed
and prioritized into a change backlog document, which was moved later before the launch to the
Qt Project wiki to maintain it there.
The implementation phase started by installing the MySQL database server and PHP support to
the Qt testresults server, by creating the MySQL database, and by saving the report builder
implementation to a Git repository using the normal Qt contribution process including the use of
Gerrit code review tool. The focus moved from showcasing the technical solution to improving the
usability and the content of the reports. While the development continued with the agreed items
from the change backlog, the Qt metrics system, which now used the complete real-time data
from the CI, was already utilized by the key users in their daily operations where possible. In
addition, the metrics system was introduced to selected Digia Qt development teams for
gathering feedback. The metrics system was called a “pilot” at this phase. A progress review and
retrospective meeting was held with the supervisors from the Oulu UAS and Digia to demonstrate
the system and to collect feedback about the system and the project execution so far. In addition
to the technical solution, another focus area was to document the metrics definitions using a
structured approach (see FIGURE 11) derived from the principles of several measurement

77
frameworks, like GQM (goal/question/metric) and MIKKO (mittauskehikko) for example. All in all,
green light was shown to start preparations for launching the system.
The launch preparation was started by documenting the Qt metrics system to the Qt Project wiki,
and by creating a mechanism into the metrics system itself to show the definitions of each report
and metrics visible in the web interface. The purpose was to isolate the metrics system
documentation from the metrics documentation so that the definition and implementation of each
metric were tied together in the source code files. Final testing was conducted, including data
validation testing and overall usability testing by the project team and couple of persons outside
the project team. Some minor improvements were made for example regarding how the system
indicates the asynchronous AJAX operations. The launch itself was made with an email to the Qt
developer community and with a post to the Qt Project announcements forum.
The development continued, and is supposed to continue, in the maintenance phase according to
the Qt metrics system change backlog. Some items that were intentionally left out from the launch
version, such as database status information and time scale filtering, were implemented, as well
as improvements to the autotest dashboard based on the user feedback. The guidelines to add
new metrics were also documented to the metrics system description in the Qt Project wiki, to
enable and promote community wide contributions.
FIGURE 18 summarizes the development project schedule including the thesis documentation
phase. The work was actually started a little earlier than originally estimated. This was because
the thesis subject was found early and some preliminary studying was done at the same time
when proceeding with the subject approval towards Oulu UAS. On the other hand, finishing the
paperwork took some extra calendar time. The prototyping was started early as well, but
changing to implementation phase was delayed about a week due to challenges in the target
server environment. The launch preparations were started early with the documentation, while the
launch itself was delayed a couple of days to follow the common Qt releasing calendar. Thesis
documentation started already in May 2013 but was mostly done during the July and August
timeframe. The estimates are based on the approved plan in the beginning of April 2013. Overall,
the project was kept well on schedule, major reason being that the content and functionality was
a variable when managing the project to keep the schedule and quality fixed, with the fixed
resources.

78
FIGURE 18. Project schedule.
FIGURE 19 shows the effort used in the different project phases. The information gathering and
strategy phase did not require as much effort as originally estimated, thanks to the clear and
detailed enough target setting. On the other hand, the documentation required more effort than
originally anticipated. Like the schedule, the effort was well under control overall.
FIGURE 19. Project effort
79
5 QT METRICS IN USE
This section summarizes the requested and received feedback after the launch of the Qt metrics
system, as well as analyzes the requirements set to the system in the beginning of the project. In
addition, a few items are listed how to develop and improve the system in the future.
5.1 Feedback
In addition to the instant and continuous feedback from the key users during the development,
some feedback was received from Qt development teams in Digia and from Qt community
developers. For example, one Qt developer proposed to have the number of builds configurable
that are shown in the build history, instead of the current fixed amount. In addition, it was
requested to have a mechanism to be able to see what went wrong with the autotests, and then
assigning a corrective task to the right person to fix it. Neither of these two cases has been
analyzed in detail yet, although the first one would be easy to implement. Another Qt developer
requested a simple "fix these autotests to make CI smoother" type of list. The autotest dashboard
had been improved at that point so a partial solution could already be provided to that request,
including a documentation update to instruct how to use the Qt metrics system in that kind of use
case. One Qt developer from the community had noticed that there was some irrelevant data for
certain configurations in the system, reason being that the branch structure for a few
configurations had been changed at some point making certain branches obsolete for them. A
database cleaning operation solved that issue. Another comment was received about infrequent
database updates from the build log files. Activating the parser must be done manually in the
launch version of the system, and the updates are therefore done only on a daily basis currently.
Solution is planned and implementation for automatic frequent updates is already in progress.
Another developer highlighted the missing possibility of using URLs and browser back button.
Like discussed earlier, the URL does not change when filtering or navigating the data because of
the use of AJAX functionality. This is a known issue among the web developers. However,
detailed solution has not yet been studied for the Qt metrics system.
All in all, like in many reporting systems, once an answer is found to a certain data oriented
question, several new questions appear to be answered. Hence the development of the Qt
metrics system should continue based on those new detailed questions and needs.

80
5.2 Requirements Validation
In general, the validation (coming from the Latin word “valere” meaning “to be worth”)
demonstrates that a software or product is fit for purpose and fulfills its operational mission and
intended use when placed in its intended environment. It answers the questions like are we
building the right product, does the system achieve the business goals, and does the system
satisfy the stated and implied needs of the end user. (96) (97)
Validation was actually done throughout the development cycle with the demo and pilot
implementation, and therefore it was guiding the development effort all the way. Nevertheless, the
requirements set to the system in the beginning of the project, as listed in 4.1 Requirements, are
recapped next. The Qt metrics system is hosted under the qt-project.org domain as planned. The
system back-end (parser and database) and front-end (report builder) are implemented with free
and open source tools and solutions (Perl, MySQL, HTML, CSS, PHP, AJAX and JavaScript) as
recommended. It was required that, in addition to the CI reports as the first focus, the selected
technologies and technical solutions fit also to the areas that will be implemented later on. Other
areas like RTA reports and code coverage reports were not demoed or tested, in that how the
implemented system supports large data size or results integrated from third parties in practice,
but the selected solutions were evaluated at least not to restrict these features either. A quick trial
on showing an external web page in a metrics box was made, and the result was promising
although issues like relative directory paths for instance to CSS files should be solved first.
The requirement to enable anyone from the Qt developer community to be able to create new
reports to the metrics system was used as the basis in the system design and implementation,
and hence resulting to the modular structure of the implementation. How easy this finally is,
remains still to be seen.
The user experience related requirements to be able to filter the information based on different
criteria and to browse relevant information with high enough performance guided the design and
implementation as well. The filtering works well based on the received feedback, although some
additional filtering possibilities were identified, some of them were ideas in the original sketches
and some were new during the development. The rationale of using an external calendar
component in the time scale filter was to make the input validation easy and to ensure the
functionality in all browsers; direct input field would have required an extra validation code, and

81
the HTML5 date component is not supported in all browsers yet. However, integrating the
component code into Git repository required some minor editorial changes, like replacing
tabulator characters with spaces, and unfortunately the component included some HTML5
markup validation errors and warnings. The performance was considered to be mostly on a very
good level even though some specific cases were discovered where the response to the user
action was not satisfactory as such. One case was when many users opened the initial page
simultaneously just after the launch, which made the system to look very slow and maybe giving
a wrong first expression of it. Although this was quite as expected, the launch message could
have explained that a bit better. In addition, loading the page during database rebuild process
appeared to be slow. The quick solution to this was that the possible database update activity is
clearly indicated in the status box.
The requirement to document the web site design in such a level that the Qt community can take
responsibility of the site maintenance was fulfilled. The site design and implementation is
documented into Qt Project wiki, and used also in this document as much as it was found
reasonable. In addition, the code is documented in the source files.
5.3 Future Development
The items for future development are related to the new content and functionality in the CI metrics
page, the new metrics pages for example for RTA and code coverage, and the overall
performance improvement of the system.
The development items to the CI metrics page that were identified during the development cycle
are listed in the Qt metrics system change backlog in the Qt Project wiki, see Appendix 1 for an
extract. The use of analyzed lists as described in 5.1 Feedback is also a good improvement
opportunity. The use cases about which CI build machines failed most often and which CI builds
and phases take the longest time to execute, as mentioned in 4.2 Target Audience and Use
Cases, are already supported in the parser and the database implementation, and hence the
report builder implementation for those could be quite at the top for future development. The build
history information in the dashboards is currently shown in a table format. A graphics solution
could provide additional readability and improved visual appearance, both in the current build
histories and in new trend graphs where needed. Another idea is to detail the results of the
autotest sets into test case level, which would make it easier to point out the detailed failure

82
reasons and therefore to get the corrections faster as well. In addition, by analyzing the so-called
flaky tests, those autotests or test cases that first fail but then pass on second round without any
changes, could help to decrease the overall build times.
The metrics page menu support was not implemented as a part of the project because of the
focus only to the CI metrics page. Therefore, when adding new pages to the Qt metrics system,
the main menu support must be built as well.
Performance is a vital issue. In order to increase the performance when using the CI metrics
page, some key data is read from the database to browser session variables. This, on the other
hand, creates a small delay when loading the page for the first time. However, this initial page
loading may take more time than loading the page next time even when closing the session or
browser in between the usage, which leads to clearing the session variables as well. This
performance issue needs further studies. Another performance issue is when loading the page
during a database rebuild. The database write operations slow down the read operations. For a
quick single scan update this is not a big problem, especially when not done during the office
hours. However, the planned automatic database updates may make this issue more visible. The
current update progress indication in the status box does not solve the cause of this problem. In
addition, the first read operations after a database update may be slow because the DBMS must
read the data from the disk instead of from the cache. Again, the planned automatic database
updates may make this issue more severe. Hence the performance issues need further analysis
regarding the database server and its configurations, the database parameters, structure and
possible indexing, as well as the report builder application logic, as discussed in the database
performance tuning phase in 3.2.1 Database Design.

83
6 RESULTS AND CONCLUSIONS
The main objective of this thesis was to improve the visualization and communication of the Qt
quality and its progress by creating a web portal to collect and display metrics on required Qt
process areas, focusing on continuous integration. The target audience of the portal included the
Qt development and continuous integration teams in Digia and the global Qt developer
community, i.e. those individuals and teams that develop the Qt library components and the Qt
tools. The objective was to automate laborious manual work and to provide real-time information
with good performance. It was required that the web portal is hosted on the public Internet under
the Qt Project web site, as well as to document the design and implementation into Qt Project
wiki. It was required to enable anyone in the Qt developer community to create new metrics or
pages to the portal. Because Qt itself is open source, there was a recommendation to use open
source solutions in the metrics web portal implementation as well. In addition, there was a
specification of some key metrics for the continuous integration to guide the implementation.
The implemented Qt metrics system, running on the existing Qt testresults server on the qt-
project.org domain, was launched publicly and taken into use as planned. The system
architecture was designed to consist of front-end (report builder) and back-end (parser and
database) solutions. The selected technical solutions were Perl for the parser, MySQL for the
database, and HTML, CSS, PHP and AJAX for the report builder. Two developers took care of
the implementation, me as a thesis worker for the front-end and a Digia employee, who also
acted as the thesis supervisor from the commissioner side, for the back-end. All the three
components were first implemented in their own development environments and integrated when
the required level of maturity was reached. The integration itself to the target server environment
was painless, thanks to frequent synchronization of the component implementation and
continuous communication between the developers. The Qt metrics system was utilized already
during the implementation phase by the key users in their daily operations where possible. The
development continued after the public launch according to the prioritized items in the Qt metrics
system change backlog. The Qt metrics system functionality as well as the guidelines to further
develop the system was documented into Qt Project wiki.
The selected technical solutions, based on the feedback to the functionality and user experience
of the implemented system, seem to fit for purpose and are an acknowledged and stable basis for
further development. However, it must be recognized that the system is still in its early stages to a

84
complete quality metrics portal on all Qt development process areas, and its ultimate benefit
depends on the use and the effort put to its development. During the project there was an idea to
be able to show and demonstrate some evidence on improved quality by the aid of using the
metrics system, although it soon became apparent that the time the system was in use after the
launch, combined with the summer vacation season, was too short for that.
Although the original target setting was clear and detailed enough, there are always cases where
the original specification cannot be implemented as such. One example of this with the metrics
system implementation was the concept of top-five most often failed autotests. While the CI
environment was studied deeper it was realized that the number of autotest failures were not
comparable between the builds, and hence identifying the most often failed autotests from the
complicated project, configuration and branch structure was not as straightforward as originally
thought. The approach was therefore changed to a dashboard solution to first understand current
state better, and then to develop the solution later based on the knowledge that will be gained
during the use of the dashboard solution. Hence the metrics should be considered dynamic in a
sense that they must be adjusted to the needs of a specific moment and situation. And like stated
earlier, any metrics reporting solution is only as good as the metrics defined in it.
More detailed feedback, requirements recap and further development proposals to the Qt metrics
system are available in 5 QT METRICS IN USE.

85
7 DISCUSSION
As a student at Oulu UAS I was upgrading my previous B.Sc. degree, after about 25 years of
experience in software development in the product development industry. I took courses from the
School of Engineering and from the School of Music, Dance and Media. My course selections
were based on personal interest to web and database development. Therefore the thesis subject
proposed by Digia to build a web portal to visualize CI and other operational data was a perfect
match with my studies.
The project started in March 2013 with a couple of meetings regarding the scope of the work and
the required competences, resulting to approval from both the Oulu UAS and Digia as the
commissioner. The development process followed a common study-prototype-implement-launch-
maintain approach. The system architecture was defined and split to front-end and back-end
solutions, and the work split to two persons followed the same principle, me as a thesis worker
took care of the front-end and a Digia employee, who also acted as the thesis supervisor from the
commissioner side, took care of the back-end. The technical solution selection was based mostly
on the development competence needs and on easy integration to the existing server
environment and to the current processes and practices in the Qt Project. Prototyping the front-
end and back-end implementations were done separately and concurrently in their own
development environments. Integration of the front-end and back-end implementation to the
target server environment was painless. The UI and the content of the CI metrics were improved
further, and finally green light was shown to start preparations to launch the system which
included documentation to the Qt Project wiki and to the Qt metrics system itself. After final
verification, the system was launched publicly to the Qt developer community on 4-Jun-2013. The
development continued as a maintenance effort according to the Qt metrics system change
backlog.
Part of the success of this thesis comes from the fact that the original target setting was clear and
detailed enough but, on the other hand, it allowed freedom in the design and implementation.
During the demo prototyping the front-end and backend implementation was synchronized
frequently. That, together with continuous communication between the developers, ensured
smooth integration to the target server environment. Positive feedback was received for example
about the first demo implementation being up-and-running fast, and that the pilot implementation
could already be used for production issues, for instance to identify newly failed autotests. The
86
weekly reporting email combined with the report and plan update via the thesis web page in the
Oulu UAS environment was also found beneficial. Overall, the schedule and the effort used in the
project were kept well compared to the original estimates.
There were also some items that could be improved if repeating a same kind of project in the
future. Ramping up the database and the web and PHP support in the target server took more
calendar time than first estimated. This was because the target server needed a memory
increase and new disk partitioning to ensure good performance. In addition, it was noticed that
the PHP support and new Perl version installations were needed before the integration to the
target server could happen. These both installation issues should have been identified and
requested beforehand. The server environment is taken care of by a third party company in Oslo.
The parser implementation took much longer than initially anticipated, although the initial estimate
of few hours included only extracting first sample data while the final implementation included
also for example data validity checking in addition to parsing itself. The Qt Project releasing
process, which defines the releasing cycle and days, should have been investigated already
when planning the releases although applied for other kind of deliveries in this case. Therefore
the launch date was delayed a few days from its initial plan to follow the weekly
Tuesday/Thursday cycle, to ensure office hours for instant feedback and support after a release.
The launch itself was not as smooth as it could have been. It should have been realized that an
email to a large group of developers would create at least tens or hundreds of simultaneous page
loads and therefore a peak in the server usage, which now resulted the system to look very slow
and maybe giving a wrong first expression of it. In addition, all the other processes in the same
server were slowed down. If nothing else, at least the launch message could have explained that
a bit better.
This thesis project provided increased technical knowledge on web and database design, both on
high level regarding the development process and different technical solutions, and on detailed
level regarding for example PHP and MySQL implementation. One example of the latter is the
calculation of local time and time zone with the daylight saving time (DST) which was planned to
the status box. Although there are mechanisms in PHP to read the time zone and DST of the user
and server, a foolproof solution was not found in reasonable amount of time, and hence the
approach was changed to show the local time with the time difference to GMT instead. Apart from
the technical knowledge, experience was gained on planning and executing a bachelor’s thesis
project. By using prior experience on project management, the planning and tracking itself was

87
not a new issue, but to describe what a thesis project is and to investigate the project scope,
activities and required deliveries appeared not to be a simple task. A new bachelor’s thesis one-
slider document was created for the commissioner in order to be able to describe what a thesis
project is and what it does require from the commissioner perspective. A need for that kind of
document could be investigated. In addition, a clear but detailed enough project planning
template does not exist. Although thesis projects vary a lot, a template collected from the
experiences of successful projects could help students that may be juniors to project
management practices to execute their thesis project better.
More detailed information on the used development process and the project schedule and effort
is available in 4.8 Project Management Practices.

88
LIST OF REFERENCES
1. González-Barahona, Jesús M. - Daffara, Carlo. Free Software / Open Source: Information
Society Opportunities for Europe. 2000. Date of retrieval Aug 16, 2013.
http://eu.conecta.it/paper/paper.html.
2. Open Source Initiative. The Open Source Definition. 2013. Date of retrieval Aug 16, 2013.
http://opensource.org/osd.
3. —. Open Source Licenses. 2013. Date of retrieval Aug 16, 2013.
http://opensource.org/licenses.
4. Accenture. Investment in Open Source Software Set to Rise. 2010. Date of retrieval Aug 16,
2013. http://newsroom.accenture.com/article_display.cfm?article_id=5045.
5. Sailfish OS. Overview. 2013. Date of retrieval Aug 16, 2013.
https://sailfishos.org/wiki/Overview.
6. Digia. Qt Benefits. 2013. Date of retrieval Jul 11, 2013. http://qt.digia.com/Product/Benefits/.
7. Qt Project. Qt 5.1. 2013. Date of retrieval Jul 11, 2013. http://qt-project.org/doc/qt-
5.1/qtdoc/index.html.
8. —. Documentation. Supported Platforms. 2013. Date of retrieval Jul 11, 2013. http://qt-
project.org/doc/qt-5.1/qtdoc/supported-platforms.html.
9. —. Documentation. What's New in Qt 5.1. 2013. Date of retrieval Jul 11, 2013. http://qt-
project.org/doc/qt-5.1/qtdoc/whatsnew51.html.
10. —. Documentation. Qt Licensing. 2013. Date of retrieval Jul 11, 2013. http://qt-
project.org/doc/qt-5.1/qtdoc/licensing.html.
11. Wikipedia. Qt (framework). 2013. Date of retrieval Jul 11, 2013.
https://en.wikipedia.org/wiki/Qt_(framework).
12. Digia. Qt Blog. Qt 5.1 Released. 2013. Date of retrieval Jul 11, 2013.
http://blog.qt.digia.com/blog/2013/07/03/qt-5-1-released/.

89
13. Qt Project. Contribute to Qt. 2013. Date of retrieval Jul 11, 2013. http://qt-
project.org/contribute.
14. —. The Qt Governance Model. 2013. Date of retrieval Jul 11, 2013. http://qt-
project.org/wiki/The_Qt_Governance_Model.
15. Wikipedia. Qt Project. 2013. Date of retrieval Jul 11, 2013.
https://en.wikipedia.org/wiki/Qt_Project.
16. Digia. About Us. 2013. Date of retrieval Jul 11, 2013. http://qt.digia.com/About-us/.
17. —. Services. 2013. Date of retrieval Jul 11, 2013. http://qt.digia.com/Services/.
18. Qt Project. Downloads. 2013. Date of retrieval Jul 11, 2013. http://qt-project.org/downloads.
19. Digia. Digia in Brief. 2013. Date of retrieval Jul 11, 2013. http://digia.com/en/Company/.
20. OSS Watch. Governance Models. 2013. Date of retrieval Jul 13, 2013. http://www.oss-
watch.ac.uk/resources/governanceModels.
21. —. Meritocratic Governance Model. 2013. Date of retrieval Jul 13, 2013. http://www.oss-
watch.ac.uk/resources/meritocraticGovernanceModel.
22. Qt Project. Qt Contribution Guidelines. 2013. Date of retrieval Jul 16, 2013. http://qt-
project.org/wiki/Qt-Contribution-Guidelines.
23. —. Code Reviews. 2013. Date of retrieval Jul 16, 2013. http://qt-
project.org/wiki/Code_Reviews.
24. —. Developing and maintaining patches on top of Qt with Git. 2013. Date of retrieval Jul 16,
2013. http://qt-project.org/wiki/Git_Introduction.
25. —. CI Overview. 2013. Date of retrieval Jul 16, 2013. http://qt-project.org/wiki/CI_Overview.
26. Macieira, Thiago. Blog. Qt Project Statistics. 2013. Date of retrieval Jul 16, 2013.
http://www.macieira.org/blog/qt-stats/.
27. Fowler, Martin. Continuous Integration. May 1, 2006. Date of retrieval Jul 20, 2013.
http://www.martinfowler.com/articles/continuousIntegration.html.
90
28. Wikipedia. Jenkins (software). 2013. Date of retrieval Jul 20, 2013.
https://en.wikipedia.org/wiki/Jenkins_(software).
29. Qt Project. Early Warning System. 2013. Date of retrieval Jul 20, 2013. http://qt-
project.org/wiki/Early-Warning-System.
30. —. CI Machine Configuration. 2013. Date of retrieval Jul 20, 2013. http://qt-
project.org/wiki/CI_Machine_Configuration.
31. —. Introduction to Gerrit. Continuous integration and staging. 2013. Date of retrieval Jul 20,
2013. http://qt-project.org/wiki/Gerrit_Introduction.
32. —. CI Metrics. Qt Metrics System. 2013. Date of retrieval Jul 20, 2013. http://testresults.qt-
project.org/qtmetrics/.
33. Rantala, Ari. PHP. Porvoo : Docendo Finland Oy, 2002. ISBN 951-846-147-3.
34. Tarhini, Ali. Concepts of Three-Tier Architecture. 2011. Date of retrieval Jul 30, 2013.
http://alitarhini.wordpress.com/2011/01/22/concepts-of-three-tier-architecture/.
35. Väisänen, Veijo. T788706D Internet Programming, 6 cr. Course material spring 2013. Oulu :
Oulu University of Applied Sciences, School of Engineering, 2013.
36. w3schools.com. Web Standards. 2013. Date of retrieval Jul 30, 2013.
http://www.w3schools.com/web/web_standards.asp.
37. Wikipedia. List of HTML Editors. 2013. Date of retrieval Jul 30, 2013.
http://en.wikipedia.org/wiki/List_of_HTML_editors.
38. —. Adobe Dreamweaver. 2013. Date of retrieval Jul 30, 2013.
http://en.wikipedia.org/wiki/Adobe_Dreamweaver.
39. W3Techs. Usage of content management systems for websites. 2013. Date of retrieval Jul
30, 2013. http://w3techs.com/technologies/overview/content_management/all.
40. Microsoft. SharePoint 2010 : The First 10 Years. 2013. Date of retrieval Jul 30, 2013.
http://technet.microsoft.com/en-us/magazine/gg981684.aspx.
91
41. Wikipedia. Website Builder. 2013. Date of retrieval Jul 30, 2013.
http://en.wikipedia.org/wiki/Website_builder.
42. —. WordPress. 2013. Date of retrieval Jul 30, 2013. http://en.wikipedia.org/wiki/WordPress.
43. Fleming, Jennifer. Web Navigation: Designing User Experience. Sebastopol : O'Reilly &
Assiciates, Inc, 1998. ISBN: 1-56592-351-0.
44. Garrett, Jesse James. The elements of user experience: User-Centered Design for the Web.
s.l. : New Riders, 2002. ISBN 0-7357-1202-6.
45. Kolehmainen, Kauko. PHP & MySQL – Teoriasta Käytäntöön. Jyväskylä : Readme.fi, 2006.
ISBN 952-5592-93-6.
46. Spafford, Simson - Garfinkel, Gene. Web Security & Commerce. 1997. Date of retrieval Jul
30, 2013. http://oreilly.com/catalog/websec/chapter/ch01.html.
47. Microsoft. Improving Web Application Security: Threats and Countermeasures. 2003. Date of
retrieval Jul 30, 2013. http://msdn.microsoft.com/en-us/library/ff649432.aspx.
48. W3Techs. Usage of Server-Side Programming Languages for Websites. 2013. Date of
retrieval Jul 30, 2013. http://w3techs.com/technologies/overview/programming_language/all.
49. Coelho, Fabien. PHP-related vulnerabilities on the National Vulnerability Database. 2013.
Date of retrieval Jul 30, 2013. http://www.coelho.net/php_cve.html.
50. Asleson, Ryan - Scutta Nathanael T. Ajax - Tehokas Hallinta. [trans. Mikko Kamppila.
Jyväskylä : Readme.fi, 2007. ISBN 10: 952-5655-08-3.
51. Garrett, Jesse James. Ajax: A New Approach to Web Applications. 2005. Date of retrieval
Jul 30, 2013. http://www.adaptivepath.com/ideas/ajax-new-approach-web-applications.
52. gdLibrary. What is the GD library. 2013. Date of retrieval Jul 30, 2013.
http://libgd.bitbucket.org/pages/about.html.
53. The PHP Group. GD Introduction. 2013. Date of retrieval Jul 30, 2013.
http://fi1.php.net/manual/en/intro.image.php.

92
54. Joomla. What Is Joomla. 2013. Date of retrieval Jul 30, 2013. http://www.joomla.org/about-
joomla.html.
55. Wikipedia. Joomla. 2013. Date of retrieval Jul 30, 2013. http://en.wikipedia.org/wiki/Joomla.
56. —. Ruby on Rails. 2013. Date of retrieval Jul 30, 2013.
http://en.wikipedia.org/wiki/Ruby_on_Rails.
57. —. Drupal. 2013. Date of retrieval Jul 30, 2013. http://en.wikipedia.org/wiki/Drupal.
58. Alaluukas, Pekka. T740803 Tietokannat, 3cr. Course material spring 2013. Oulu : Oulu
University of Applied Sciences, School of Engineering, 2013.
59. Hernandez, Michael J. Database Design for Mere Mortals: A Hands-On Guide to Relational
Database Design. s.l. : Addison-Wesley Professional, 2003. ISBN 0-201-75284-0.
60. Wikipedia. Database. 2013. Date of retrieval Aug 02, 2013.
http://en.wikipedia.org/wiki/Database.
61. —. Relational Database. 2013. Date of retrieval Aug 02, 2013.
http://en.wikipedia.org/wiki/Relational_database.
62. DB-Engines. DB-Engines Ranking. 2013. Date of retrieval Aug 02, 2013. http://db-
engines.com/en/ranking.
63. Wikipedia. Object Database. 2013. Date of retrieval Aug 02, 2013.
http://en.wikipedia.org/wiki/Object_database.
64. —. Object-Relational Database. 2013. Date of retrieval Aug 02, 2013.
http://en.wikipedia.org/wiki/Object-relational_database.
65. —. PostgreSQL. 2013. Date of retrieval Aug 02, 2013.
http://en.wikipedia.org/wiki/PostgreSQL.
66. —. MongoDB. 2013. Date of retrieval Aug 02, 2013. http://en.wikipedia.org/wiki/MongoDB.
67. Microsoft. What is a Transaction. 2013. Date of retrieval Aug 02, 2013.
http://msdn.microsoft.com/en-us/library/aa366402(VS.85).aspx.

93
68. Hovi, Ari - Huotari, Jouni - Lahdenmäki, Tapio. Tietokantojen Suunnittelu & Indeksointi.
Porvoo : Docendo, 2005. ISBN 951-846-262-3.
69. Oracle. Adding an EER Diagram. 2013. Date of retrieval Aug 02, 2013.
http://dev.mysql.com/doc/workbench/en/wb-creating-eer-diagram.html.
70. Wikipedia. SQL. 2013. Date of retrieval Aug 02, 2013. https://en.wikipedia.org/wiki/SQL.
71. Oracle. MySQL Editions. 2013. Date of retrieval Aug 02, 2013.
http://www.mysql.com/products/.
72. —. MySQL Customers by Industry. 2013. Date of retrieval Aug 02, 2013.
http://www.mysql.com/customers/industry/.
73. Wikipedia. MySQL Workbench. 2013. Date of retrieval Aug 02, 2013.
http://en.wikipedia.org/wiki/MySQL_Workbench.
74. —. phpMyAdmin. 2013. Date of retrieval Aug 02, 2013.
http://en.wikipedia.org/wiki/PhpMyAdmin.
75. Oracle. Overview of MySQL Storage Engine Architecture. 2013. Date of retrieval Aug 02,
2013. http://dev.mysql.com/doc/refman/5.7/en/pluggable-storage-overview.html.
76. —. The InnoDB Storage Engine. 2013. Date of retrieval Aug 02, 2013.
http://dev.mysql.com/doc/refman/5.7/en/innodb-storage-engine.html.
77. Wikipedia. MySQL. 2013. Date of retrieval Aug 02, 2013.
https://en.wikipedia.org/wiki/MySQL.
78. Computerworld. Dead database walking: MySQL's creator on why the future belongs to
MariaDB. 2013. Date of retrieval Aug 02, 2013.
http://www.computerworld.com.au/article/457551/dead_database_walking_mysql_creator_why_f
uture_belongs_mariadb/.
79. Monty Program. MariaDB versus MySQL - Compatibility. 2013. Date of retrieval Aug 02,
2013. https://kb.askmonty.org/en/mariadb-versus-mysql-compatibility/.

94
80. SkySQL. SkySQL Merges With MariaDB Developers To Create ‘Next Generation Open
Source’ Database Company. 2013. Date of retrieval Aug 02, 2013. http://www.skysql.com/news-
and-events/press-releases/skysql-merges-with-mariadb-developers.
81. Monty Program. MariaDB vs MySQL. 2012. Date of retrieval Aug 02, 2013.
http://montyprogram.com/whitepapers/mariadb-vs-mysql/.
82. —. Works With MariaDB. 2013. Date of retrieval Aug 02, 2013.
https://kb.askmonty.org/en/works-with-mariadb/.
83. —. MariaDB versus MySQL - Features. 2013. Date of retrieval Aug 02, 2013.
https://kb.askmonty.org/en/mariadb-versus-mysql-features/.
84. MariaDB Foundation. What comes in between MariaDB now and MySQL 5.6. 2012. Date of
retrieval Aug 02, 2013. http://blog.mariadb.org/what-comes-in-between-mariadb-now-and-mysql-
5-6/.
85. —. About the MariaDB Foundation. 2013. Date of retrieval Aug 02, 2013.
https://mariadb.org/en/foundation/.
86. Monty Program. http://montyprogram.com/about/. 2013. Date of retrieval Aug 02, 2013.
http://montyprogram.com/about/.
87. Wikimedia Foundation. Wikipedia Adopts MariaDB. 2013. Date of retrieval Aug 02, 2013.
https://blog.wikimedia.org/2013/04/22/wikipedia-adopts-mariadb/.
88. Nielsen, Jakob. Usability 101: Introduction to Usability. 2012. Date of retrieval Aug 05, 2013.
http://www.nngroup.com/articles/usability-101-introduction-to-usability/.
89. Wikipedia. Business Intelligence. 2013. Date of retrieval Aug 05, 2012.
http://en.wikipedia.org/wiki/Business_intelligence.
90. —. Dashboard (management information systems). 2013. Date of retrieval Aug 05, 2013.
http://en.wikipedia.org/wiki/Dashboard_(management_information_system).
91. QlikTech International AB. QlikView Overview. 2013. Date of retrieval Aug 05, 2013.
http://www.qlikview.com/explore/products/overview.
95
92. Wikipedia. List of Reporting Software. 2013. Date of retrieval Aug 05, 2013.
http://en.wikipedia.org/wiki/List_of_reporting_software.
93. Pentaho Corporation. Pentaho Products. 2013. Date of retrieval Aug 05, 2013.
http://www.pentaho.com/explore/products/.
94. Wikipedia. Tableau Software. 2013. Date of retrieval Aug 05, 2013.
http://en.wikipedia.org/wiki/Tableau_Software.
95. Tableau Software. Whitepaper: A new approach to business intelligence. 2013. Date of
retrieval Aug 05, 2013. http://cdnlarge.tableausoftware.com/sites/default/files/whitepapers/rapid-
fire-bi_0.pdf.
96. Chambers & Associates Pty Ltd. Verification & Validation. 2013. Date of retrieval Aug 10,
2013. http://www.chambers.com.au/glossary/verification_validation.php.
97. CMMI Institute. CMMI for Development, Version 1.3. 2010. Date of retrieval Aug 10, 2013.
http://cmmiinstitute.com/resource/cmmi-for-development-version-1-3/.
98. Qt Project. Qt Open Governance Code Review. 2013. Date of retrieval Jul 22, 2013.
https://codereview.qt-project.org.

QT METRICS SYSTEM CHANGE BACKLOG (10-Aug-2013) APPENDIX 1/1
1 The Backlog
STATUS VERSION PRIORITY GROUP ITEM
Idle *** Usability Project dashboard to show the data (general, builds
etc.) for any build (by clicking e.g. the build number);
now the shows only the latest build
Idle *** Usability Enable filtering via URL parameters (e.g. to mail
direct link to a specific report)
Idle *** Filters Add Branch filter (dev, release, stable) to filter e.g.
Project and Autotest list at the 1st level (maybe the
current Project filter must be renamed)
Idle ** Filters Add ‘search’ filter to Configuration filter (alternative
would be a static grouping of Configurations)
Idle ** Functionality Add a new metric/page for the build phases data
(metric report to be specified first)
Idle ** Functionality Project dashboard: When only Conf selected show
the Project list for that Conf (instead of a note to
select a Project)
Idle ** Look’n‘feel The filtered values that appear in green in
dashboards is a one big green box, white borders
might improve the readability
Idle ** Security Store the database login information to a secured file
(currently the user has only read access and login is
restricted by the server)
Idle ** Usability Autotest dashboard to include number of executed
autotests (passed/failed)
Idle ** Usability Study the slow page loading issues (first load and
load during rebuild)
Idle ** Usability Browser Back button does not work with nested
metrics (you must use the top links in a box instead)
Idle ** Implementation Solve the URL encoding issue with correct PHP
functions instead of the current string manipulation
Idle * Usability Error handling for cases where e.g. Project, Conf or
Autotest drops from the database (due to database
rebuild); unsure how frequently these kind of
situations would happen
Idle * Usability Project dashboard to include number of significant
and insignificant vs. total autotests in latest Build ->
both in 1st (Project list) and 2nd (Conf list) level
idle * Usability Check log file availability (it may not always be
available)

QT METRICS SYSTEM CHANGE BACKLOG (10-Aug-2013) APPENDIX 1/2
2 Done Items
STATUS VERSION PRIORITY GROUP ITEM
DONE v1.4 *** Usability Autotest dashboard: Sorting based on any column in
the list (in level 1 view)
DONE v1.3 *** Functionality Autotest dashboard: Add result history for
Project/Conf builds
DONE v1.2 **** Filters Add timescale filter (e.g. since a date) and apply it to
Project dashboard and Autotest dashboard
DONE v1.1.1 *** Usability Change the order in which the boxes are loaded on
initial page load to indicate the possible database
rebuild progress instead of welcome text when
loading the page during rebuild
DONE v1.1 **** Usability Show database status (last update time); compare
session start time to database rebuild time and show
rebuild progress (if ongoing) or reload proposal text
(when done) to the user; status is updated when
surfing through the filters