quadrennial technology review-2015 chapter 1: energy
TRANSCRIPT
S4
Quadrennial Technology Review-2015 Chapter 1: Energy Challenges
Public Webinar Draft Notional Content Under Discussion

• Due to the large number of expected participants, the audio and video portions of this webinar will be a “one way” broadcast. Only the organizers and QTR authors will be allowed to speak.
Webinar Logistics
• You are encouraged to submit questions using GoToWebinar’s “Questions” functionality. The moderators will respond, via audio broadcast, to as many appropriate questions as time allows.
Type your questions here and click “send”
2
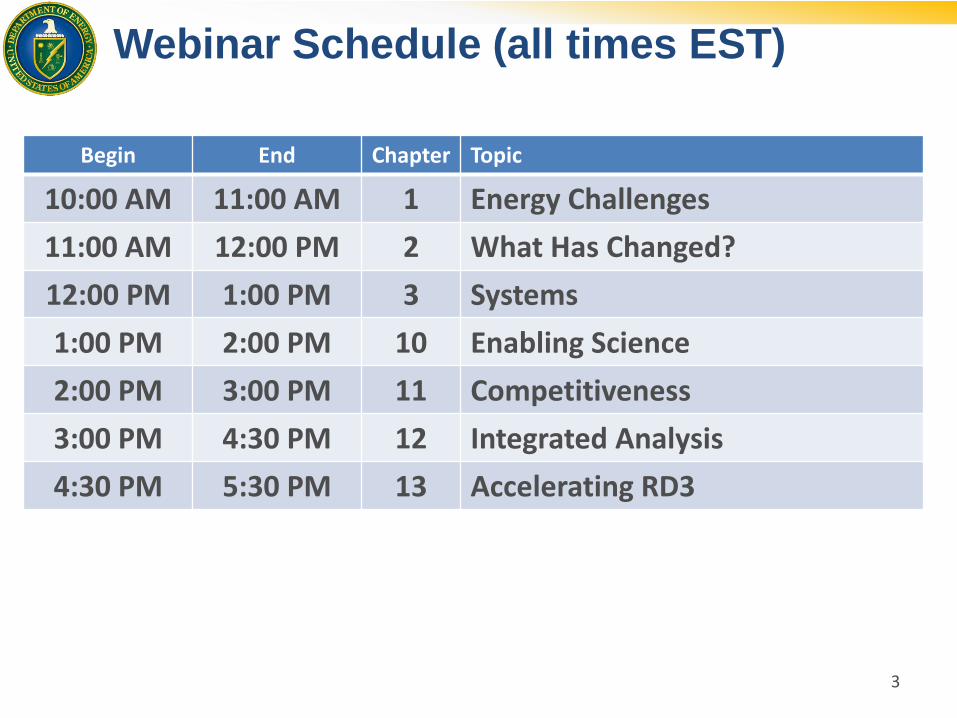
Webinar Schedule (all times EST)
Begin End Chapter Topic
10:00 AM 11:00 AM 1 Energy Challenges
11:00 AM 12:00 PM 2 What Has Changed?
12:00 PM 1:00 PM 3 Systems
1:00 PM 2:00 PM 10 Enabling Science
2:00 PM 3:00 PM 11 Competitiveness
3:00 PM 4:30 PM 12 Integrated Analysis
4:30 PM 5:30 PM 13 Accelerating RD3
3
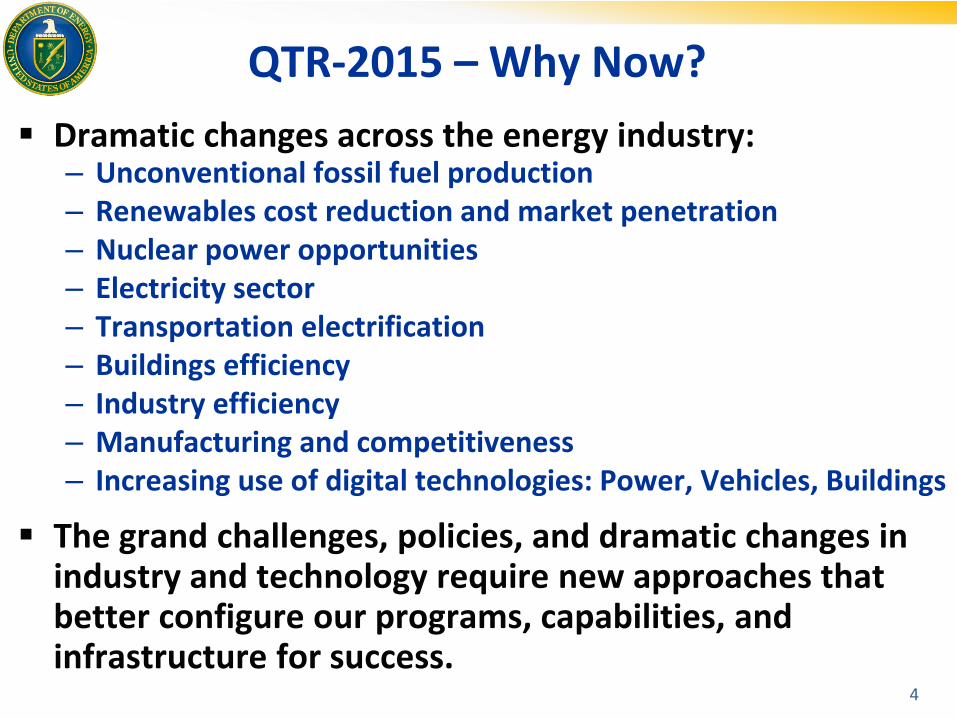
Dramatic changes across the energy industry: – Unconventional fossil fuel production – Renewables cost reduction and market penetration – Nuclear power opportunities – Electricity sector – Transportation electrification – Buildings efficiency – Industry efficiency – Manufacturing and competitiveness – Increasing use of digital technologies: Power, Vehicles, Buildings
The grand challenges, policies, and dramatic changes in industry and technology require new approaches that better configure our programs, capabilities, and infrastructure for success.
4
QTR-2015 – Why Now?
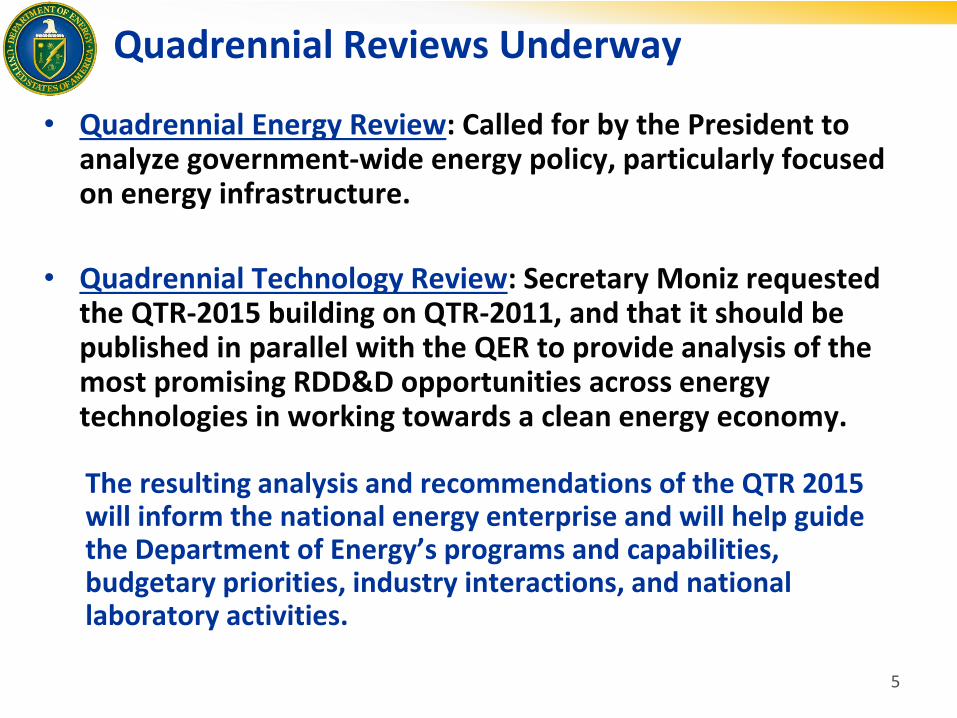
Quadrennial Reviews Underway
• Quadrennial Energy Review: Called for by the President to analyze government-wide energy policy, particularly focused on energy infrastructure.
• Quadrennial Technology Review: Secretary Moniz requested the QTR-2015 building on QTR-2011, and that it should be published in parallel with the QER to provide analysis of the most promising RDD&D opportunities across energy technologies in working towards a clean energy economy.
The resulting analysis and recommendations of the QTR 2015 will inform the national energy enterprise and will help guide the Department of Energy’s programs and capabilities, budgetary priorities, industry interactions, and national laboratory activities.
5
Expanded Scope of QTR 2015
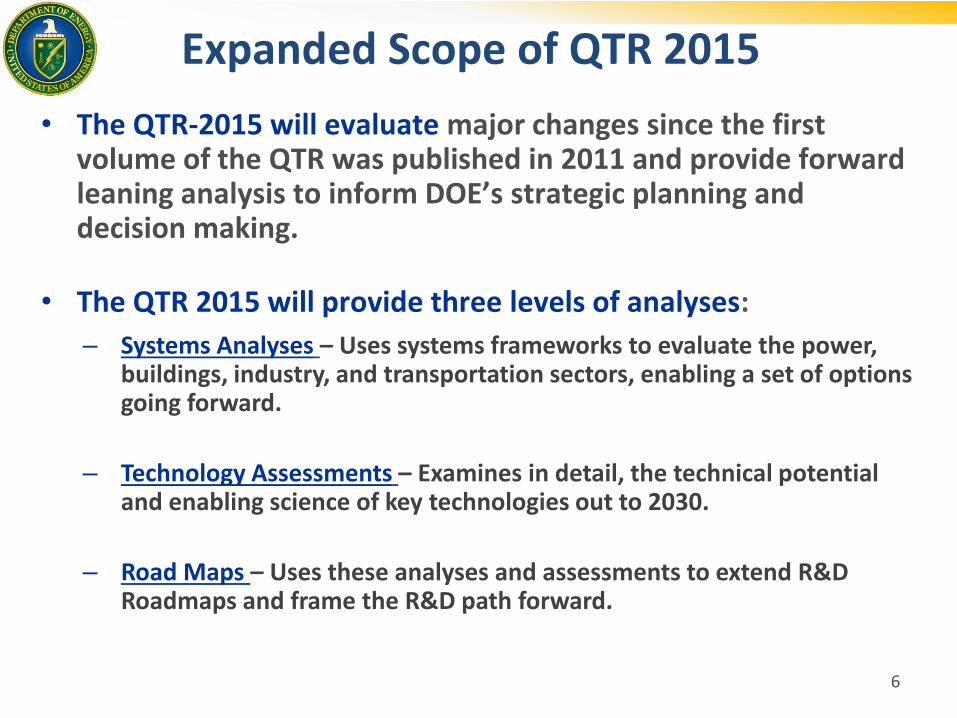
• The QTR-2015 will evaluate major changes since the first volume of the QTR was published in 2011 and provide forward leaning analysis to inform DOE’s strategic planning and decision making.
• The QTR 2015 will provide three levels of analyses:
– Systems Analyses – Uses systems frameworks to evaluate the power, buildings, industry, and transportation sectors, enabling a set of options going forward.
– Technology Assessments – Examines in detail, the technical potential and enabling science of key technologies out to 2030.
– Road Maps – Uses these analyses and assessments to extend R&D Roadmaps and frame the R&D path forward.
6
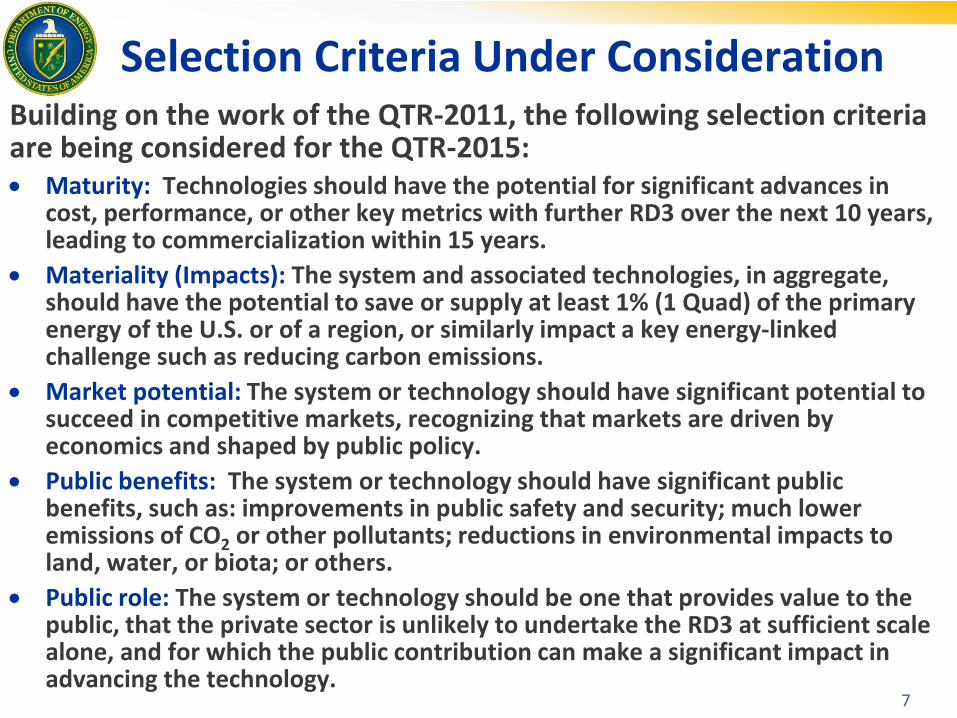
Selection Criteria Under Consideration Building on the work of the QTR-2011, the following selection criteria are being considered for the QTR-2015: Maturity: Technologies should have the potential for significant advances in
cost, performance, or other key metrics with further RD3 over the next 10 years, leading to commercialization within 15 years.
Materiality (Impacts): The system and associated technologies, in aggregate, should have the potential to save or supply at least 1% (1 Quad) of the primary energy of the U.S. or of a region, or similarly impact a key energy-linked challenge such as reducing carbon emissions.
Market potential: The system or technology should have significant potential to succeed in competitive markets, recognizing that markets are driven by economics and shaped by public policy.
Public benefits: The system or technology should have significant public benefits, such as: improvements in public safety and security; much lower emissions of CO2 or other pollutants; reductions in environmental impacts to land, water, or biota; or others.
Public role: The system or technology should be one that provides value to the public, that the private sector is unlikely to undertake the RD3 at sufficient scale alone, and for which the public contribution can make a significant impact in advancing the technology.
7
Selection Criteria, continued
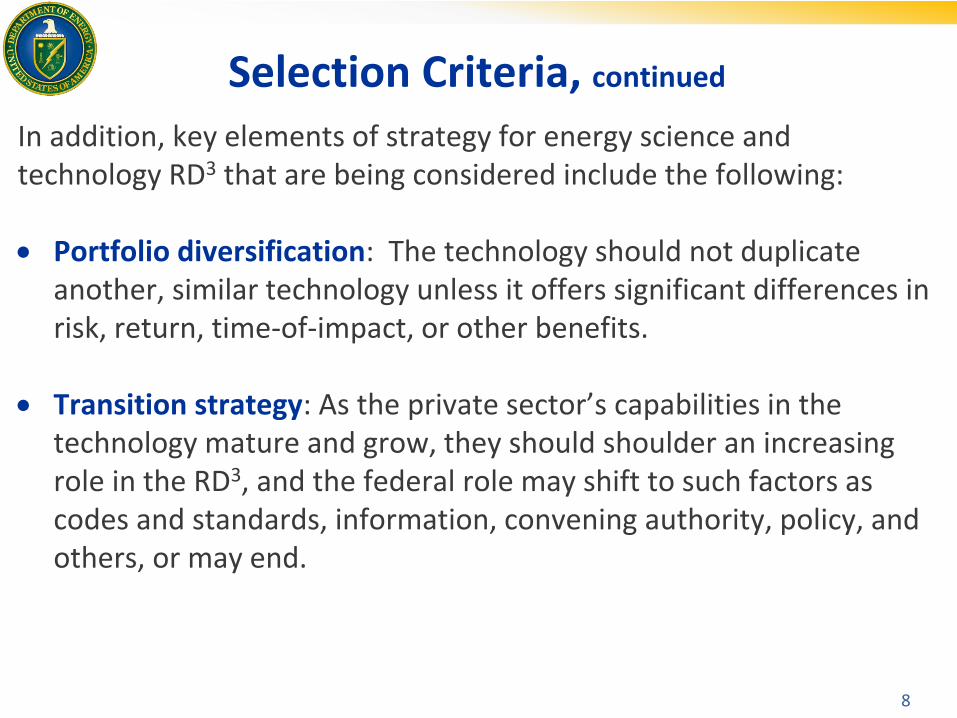
In addition, key elements of strategy for energy science and technology RD3 that are being considered include the following: Portfolio diversification: The technology should not duplicate
another, similar technology unless it offers significant differences in risk, return, time-of-impact, or other benefits.
Transition strategy: As the private sector’s capabilities in the
technology mature and grow, they should shoulder an increasing role in the RD3, and the federal role may shift to such factors as codes and standards, information, convening authority, policy, and others, or may end.
8
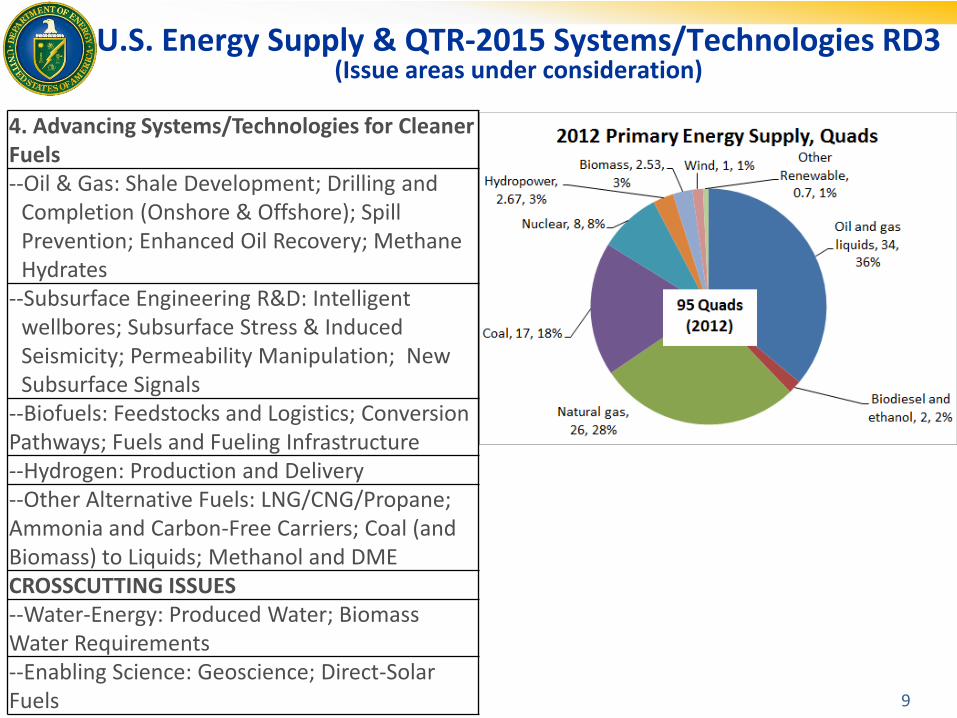
U.S. Energy Supply & QTR-2015 Systems/Technologies RD3 (Issue areas under consideration)
4. Advancing Systems/Technologies for Cleaner Fuels --Oil & Gas: Shale Development; Drilling and
Completion (Onshore & Offshore); Spill Prevention; Enhanced Oil Recovery; Methane Hydrates
--Subsurface Engineering R&D: Intelligent wellbores; Subsurface Stress & Induced Seismicity; Permeability Manipulation; New Subsurface Signals
--Biofuels: Feedstocks and Logistics; Conversion Pathways; Fuels and Fueling Infrastructure --Hydrogen: Production and Delivery --Other Alternative Fuels: LNG/CNG/Propane; Ammonia and Carbon-Free Carriers; Coal (and Biomass) to Liquids; Methanol and DME CROSSCUTTING ISSUES --Water-Energy: Produced Water; Biomass Water Requirements --Enabling Science: Geoscience; Direct-Solar Fuels 9
U.S. Energy Supply & QTR-2015 Systems/Technologies RD3 (Issue areas under consideration)
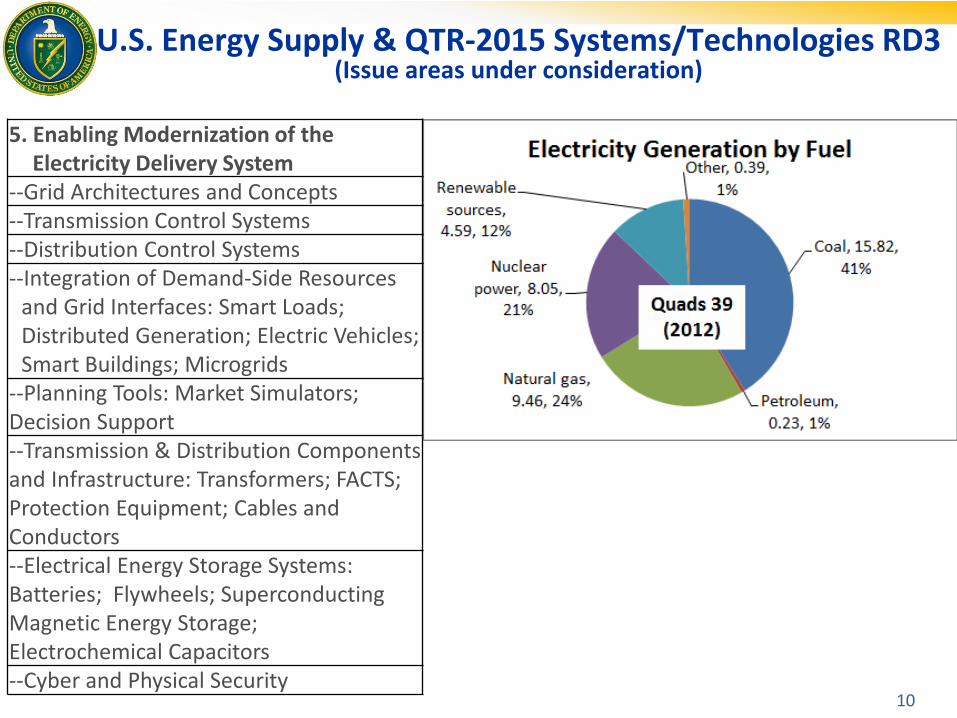
5. Enabling Modernization of the Electricity Delivery System
--Grid Architectures and Concepts --Transmission Control Systems --Distribution Control Systems --Integration of Demand-Side Resources
and Grid Interfaces: Smart Loads; Distributed Generation; Electric Vehicles; Smart Buildings; Microgrids
--Planning Tools: Market Simulators; Decision Support --Transmission & Distribution Components and Infrastructure: Transformers; FACTS; Protection Equipment; Cables and Conductors --Electrical Energy Storage Systems: Batteries; Flywheels; Superconducting Magnetic Energy Storage; Electrochemical Capacitors --Cyber and Physical Security
10
U.S. Energy Supply & QTR-2015 Systems/Technologies RD3 (Issue areas under consideration)
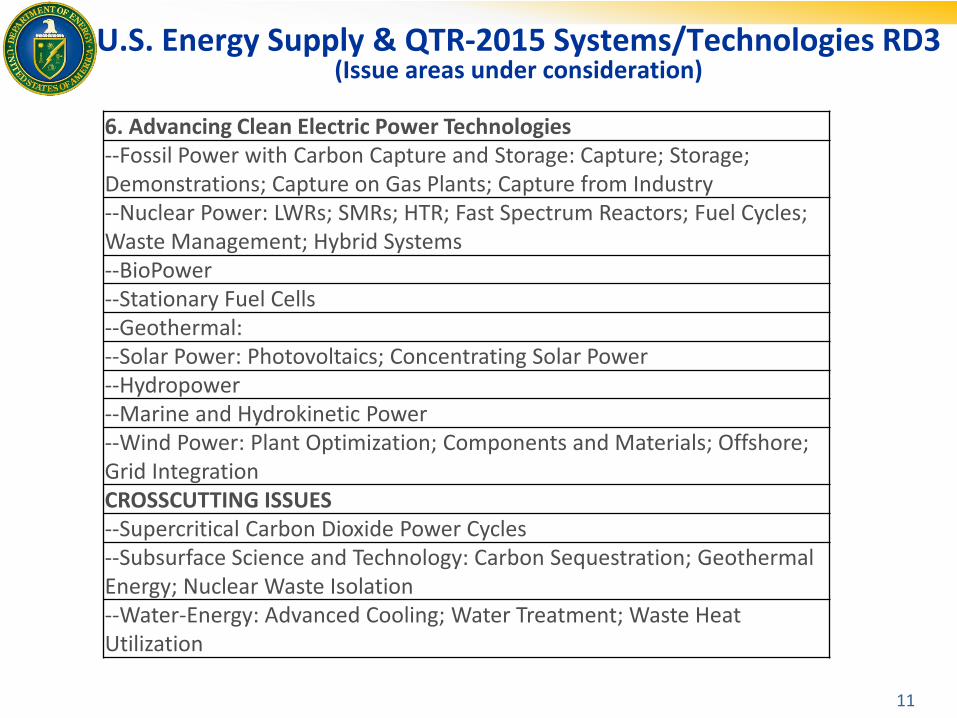
6. Advancing Clean Electric Power Technologies --Fossil Power with Carbon Capture and Storage: Capture; Storage; Demonstrations; Capture on Gas Plants; Capture from Industry --Nuclear Power: LWRs; SMRs; HTR; Fast Spectrum Reactors; Fuel Cycles; Waste Management; Hybrid Systems --BioPower --Stationary Fuel Cells --Geothermal: --Solar Power: Photovoltaics; Concentrating Solar Power --Hydropower --Marine and Hydrokinetic Power --Wind Power: Plant Optimization; Components and Materials; Offshore; Grid Integration CROSSCUTTING ISSUES --Supercritical Carbon Dioxide Power Cycles --Subsurface Science and Technology: Carbon Sequestration; Geothermal Energy; Nuclear Waste Isolation --Water-Energy: Advanced Cooling; Water Treatment; Waste Heat Utilization
11
U.S. Energy End-Use & QTR-2015 Systems/Technologies RD3 (Issue areas under consideration)
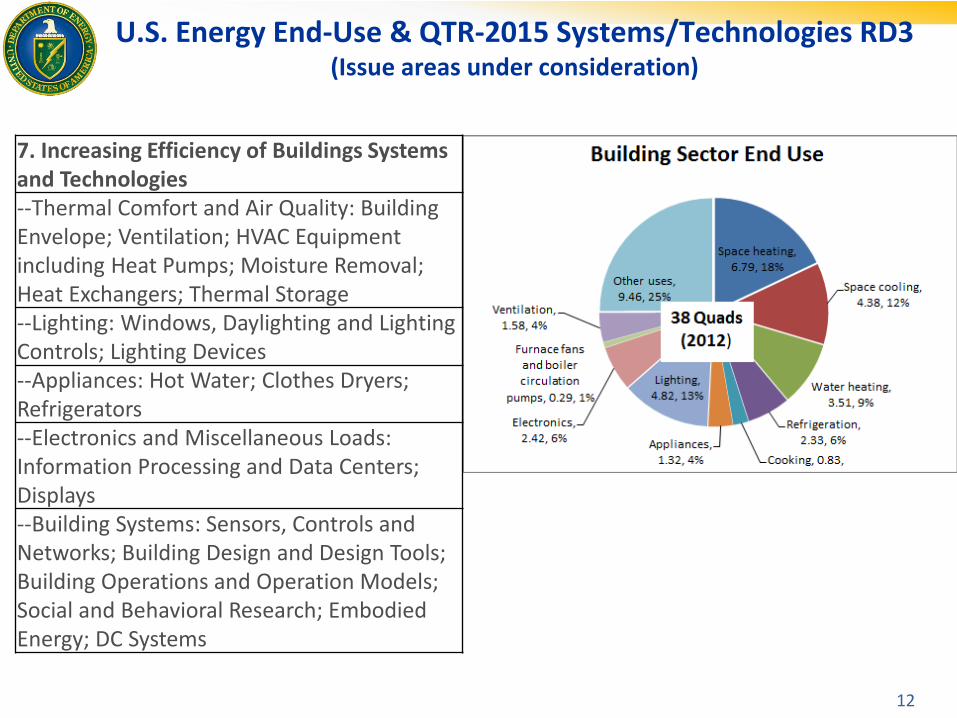
7. Increasing Efficiency of Buildings Systems and Technologies --Thermal Comfort and Air Quality: Building Envelope; Ventilation; HVAC Equipment including Heat Pumps; Moisture Removal; Heat Exchangers; Thermal Storage --Lighting: Windows, Daylighting and Lighting Controls; Lighting Devices --Appliances: Hot Water; Clothes Dryers; Refrigerators --Electronics and Miscellaneous Loads: Information Processing and Data Centers; Displays --Building Systems: Sensors, Controls and Networks; Building Design and Design Tools; Building Operations and Operation Models; Social and Behavioral Research; Embodied Energy; DC Systems
12

U.S. Energy End-Use & QTR-2015 Systems/Technologies RD3 (Issue areas under consideration)
8. Energy Technologies in Advanced Manufacturing --Existing Unit Operations: Process Heating Systems; Motor Driven Systems --New Manufacturing Approaches: Process Intensification; Roll-to-Roll Processing; Additive Manufacturing --Facility-level Energy Management: Combined Heat and Power (CHP); Waste Heat Recovery --Data and Automation: Smart Manufacturing; Demand-side Management (DSM) --Managing Material Demand: Critical Materials and their Alternatives; Sustainable Manufacturing; Manufacture of Novel Materials --Manufacturing of Clean Energy Products: Thermoelectrics; Materials for Harsh Service; Wide Bandgap; Composites
13
U.S. Energy End-Use & QTR-2015 Systems/Technologies RD3 (Issue areas under consideration)
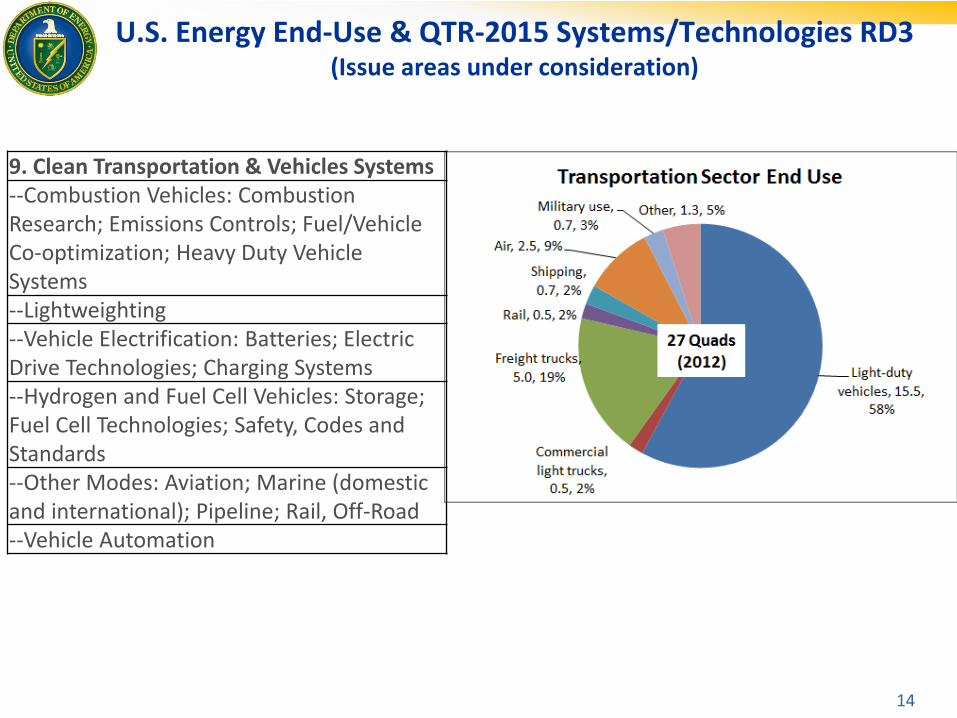
9. Clean Transportation & Vehicles Systems --Combustion Vehicles: Combustion Research; Emissions Controls; Fuel/Vehicle Co-optimization; Heavy Duty Vehicle Systems --Lightweighting --Vehicle Electrification: Batteries; Electric Drive Technologies; Charging Systems --Hydrogen and Fuel Cell Vehicles: Storage; Fuel Cell Technologies; Safety, Codes and Standards --Other Modes: Aviation; Marine (domestic and international); Pipeline; Rail, Off-Road --Vehicle Automation
14
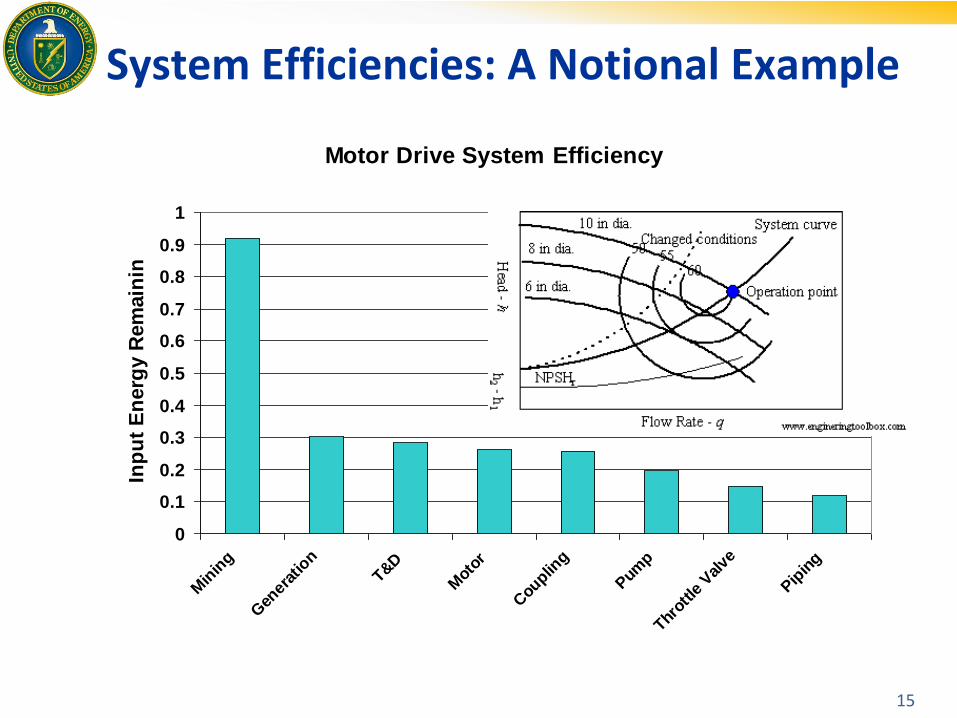
System Efficiencies: A Notional Example
15
23
Motor Drive System Efficiency
0
0.1
0.2
0.3
0.4
0.5
0.6
0.7
0.8
0.9
1
Min
ing
Gen
erat
ion
T&D
Mot
or
Cou
pling
Pum
p
Throt
tle V
alve
Pip
ing
Inp
ut
En
erg
y R
em
ain
ing
Uncertainties
0
10
20
30
40
50
60
70
80
90
100
110
120
19
85
19
87
19
89
19
91
19
93
19
95
19
97
19
99
20
01
20
03
20
05
20
07
20
09
20
11
20
13
20
15
20
17
20
19
20
09
Do
lla
rs p
er
Ba
rre
l
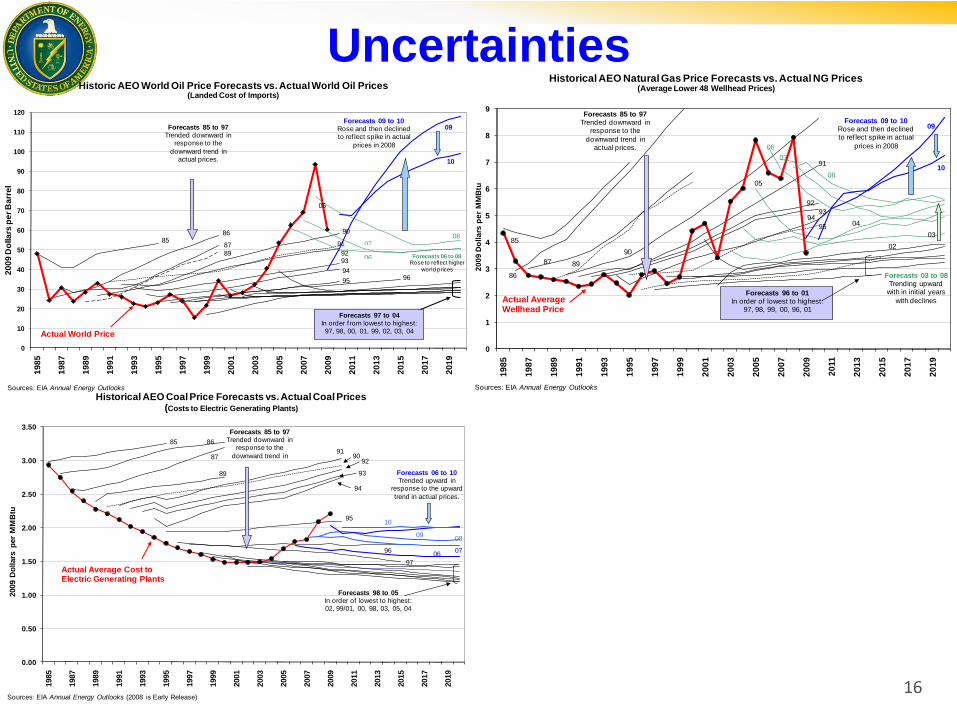
Historic AEO World Oil Price Forecasts vs. Actual World Oil Prices(Landed Cost of Imports)
Actual World Price
8586
87
89
90
91
9293
94
95 96
05
Forecasts 97 to 04In order f rom lowest to highest:97, 98, 00, 01, 99, 02, 03, 04
Forecasts 85 to 97Trended downward in
response to the
downward trend in actual prices.
Sources: EIA Annual Energy Outlooks
0807
06 Forecasts 06 to 08Rose to reflect higher
world prices
09
10
Forecasts 09 to 10Rose and then declined to ref lect spike in actual
prices in 2008
0
1
2
3
4
5
6
7
8
9
19
85
19
87
19
89
19
91
19
93
19
95
19
97
19
99
20
01
20
03
20
05
20
07
20
09
20
11
20
13
20
15
20
17
20
19
20
09
Do
lla
rs p
er
MM
Btu
Historical AEO Natural Gas Price Forecasts vs. Actual NG Prices(Average Lower 48 Wellhead Prices)
Actual Average Wellhead Price
Sources: EIA Annual Energy Outlooks
85
86
87 89
90
91
92
9394
95
05
04
03
02
Forecasts 96 to 01In order of lowest to highest:
97, 98, 99, 00, 96, 01
Forecasts 85 to 97Trended downward in
response to the
downward trend in actual prices.
08
06
07
Forecasts 03 to 08Trending upward
with in initial years
with declines
09
10
Forecasts 09 to 10Rose and then declined to ref lect spike in actual
prices in 2008
0.00
0.50
1.00
1.50
2.00
2.50
3.00
3.50
1985
1987
1989
1991
1993
1995
1997
1999
2001
2003
2005
2007
2009
2011
2013
2015
2017
2019
2009 D
ollars
per
MM
Btu
Historical AEO Coal Price Forecasts vs. Actual Coal Prices(Costs to Electric Generating Plants)
85 86
87
89
9091
92
93
94
96
97Actual Average Cost to Electric Generating Plants
95
Forecasts 85 to 97Trended downward in
response to the
downward trend in
Forecasts 98 to 05In order of lowest to highest:02, 99/01, 00, 98, 03, 05, 04
Sources: EIA Annual Energy Outlooks (2008 is Early Release)
08
0607
09
10
Forecasts 06 to 10Trended upward in
response to the upward
trend in actual prices.
16
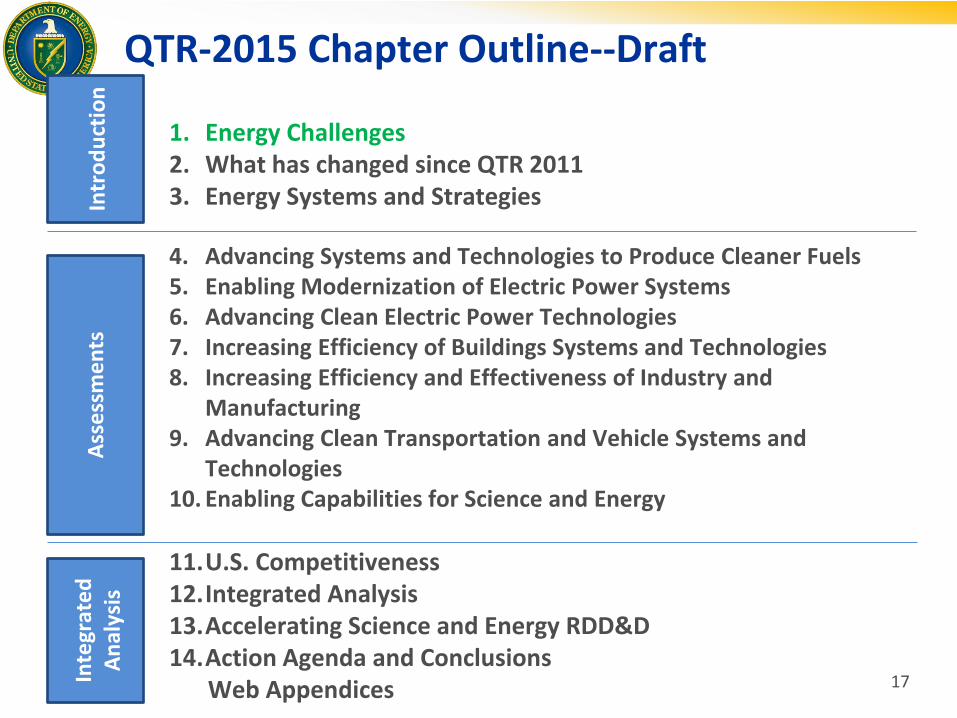
QTR-2015 Chapter Outline--Draft
1. Energy Challenges 2. What has changed since QTR 2011 3. Energy Systems and Strategies
4. Advancing Systems and Technologies to Produce Cleaner Fuels 5. Enabling Modernization of Electric Power Systems 6. Advancing Clean Electric Power Technologies 7. Increasing Efficiency of Buildings Systems and Technologies 8. Increasing Efficiency and Effectiveness of Industry and
Manufacturing 9. Advancing Clean Transportation and Vehicle Systems and
Technologies 10. Enabling Capabilities for Science and Energy
11.U.S. Competitiveness 12.Integrated Analysis 13.Accelerating Science and Energy RDD&D 14.Action Agenda and Conclusions Web Appendices
Inte
grat
ed
A
nal
ysis
In
tro
du
ctio
n
Ass
ess
me
nts
17
Web Appendices
• Overview. An extensive set of web appendices will be linked through the .pdf of the main report. This will allow additional material to be presented, extending the discussion in the main volume. The content to be included or linked to in these appendices potentially includes: – QTR Technology Assessments – Technology Roadmaps and their updates, and other key RD3 information. – Workshops – Webinars – Program In-Progress Peer Reviews and other Reviews
• Updates. A significant advantage of supplying these materials on the web is that
they can be updated over the next several years so that this can be an ongoing central source of information for the DOE science and energy programs.
• Additional Information. Another potential advantage of this web-based approach is that more complex materials, such as visualizations, analytical tools, and other materials can potentially be developed over time and linked.
18
QTR-2015 Notional Goals
Frame the energy-linked challenges that the United States faces and identify key energy science and technology RD3 that could help meet these challenges.
Assess technology opportunities, and identify approaches for evaluating the strengths, weaknesses, and tradeoffs among them, and the development of a portfolio for RD3 balanced across key dimensions of investment, return, timeframe, risk, and others.
Identify cross-cutting activities that link the energy science and technology programs on strategically important RD3, and strengthen the analytic underpinnings for these in DOE work.
Examine roles that the DOE, national labs, private sector, and academia can fill on energy RD3 and how they can better leverage the best strengths of each to meet our energy challenges.
19
What the QTR-2015 Will Not Do
• The QTR is not a budget document and does not itself systematically prioritize specific activities; instead it intends to frame a broad range of important RD3 opportunities and provides key data and analysis about them.
• The QTR is not a strategic plan; instead it intends to build on the DOE strategic plan and focus in more depth on key energy science and technology RD3 opportunities going forward.
• The QTR is not a programmatic roadmap; instead it intends to provide detail and analysis of the overall RD3 options space and provide links to the QTR Technology Assessments, roadmaps, and other documents to provide detailed inputs to specific programmatic work.
• The QTR does not develop scenarios or projections of how energy systems will evolve; instead it intends to map energy RD3 options and broadly frame their potential returns and other important metrics.
• The QTR is not a policy document; instead it intends to focus on RD3. Energy policy issues are primarily addressed by the QER.
20
• The United States faces serious energy-linked challenges: – Economic – Environmental – Security
• Research, development, demonstration and deployment (RD3) of innovative energy technologies will be critical to achieving these objectives.
• The QTR-2015 will examine a broad range of energy science and technology RD3 opportunities to provide information useful for decision-makers.
QTR-2015 -- Challenges
21
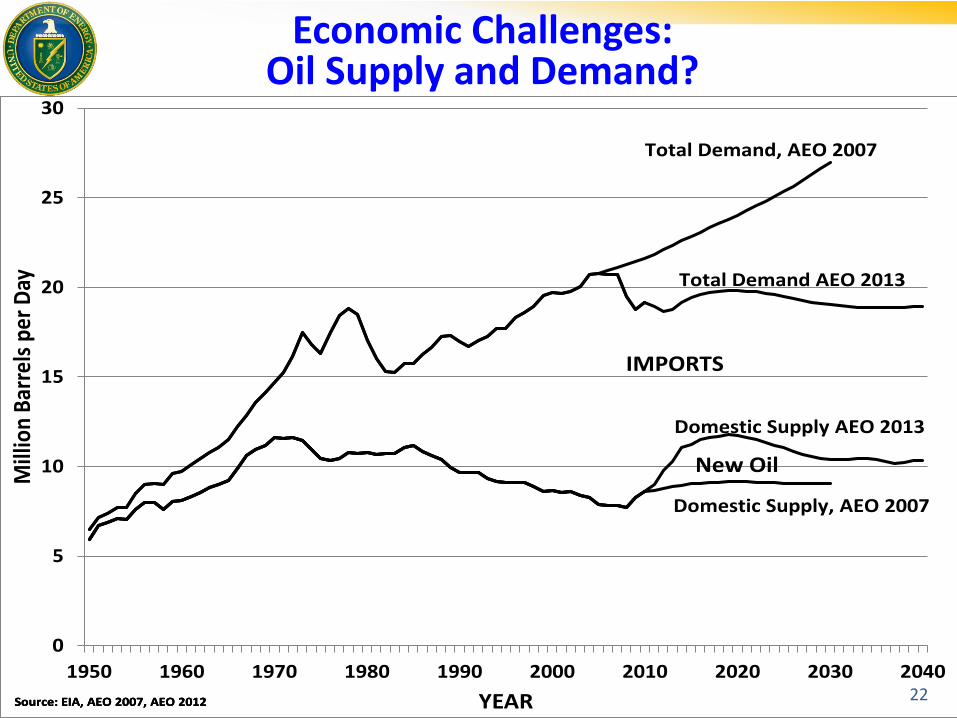
Economic Challenges: Oil Supply and Demand?
0
5
10
15
20
25
30
1950 1960 1970 1980 1990 2000 2010 2020 2030 2040
Mill
ion
Bar
rels
per
Day
YEARSource: EIA, AEO 2007, AEO 2012Source: EIA, AEO 2007, AEO 2012Source: EIA, AEO 2007, AEO 2012
IMPORTS
Total Demand, AEO 2007
Total Demand AEO 2013
Domestic Supply, AEO 2007
Domestic Supply AEO 2013
New Oil
22
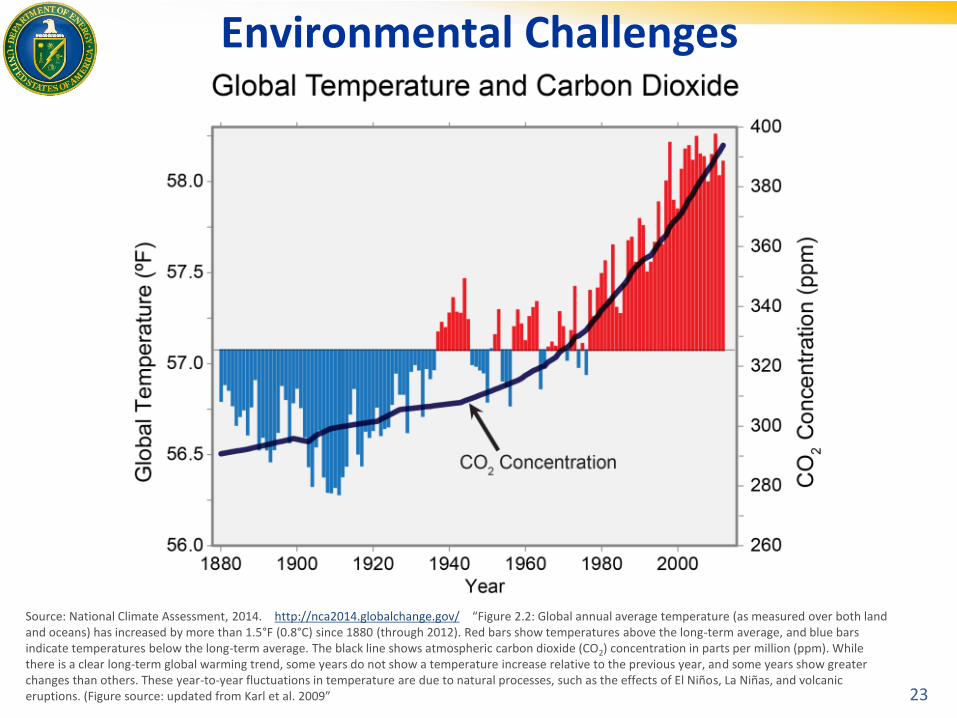
Environmental Challenges
23
Source: National Climate Assessment, 2014. http://nca2014.globalchange.gov/ “Figure 2.2: Global annual average temperature (as measured over both land and oceans) has increased by more than 1.5°F (0.8°C) since 1880 (through 2012). Red bars show temperatures above the long-term average, and blue bars indicate temperatures below the long-term average. The black line shows atmospheric carbon dioxide (CO2) concentration in parts per million (ppm). While there is a clear long-term global warming trend, some years do not show a temperature increase relative to the previous year, and some years show greater changes than others. These year-to-year fluctuations in temperature are due to natural processes, such as the effects of El Niños, La Niñas, and volcanic eruptions. (Figure source: updated from Karl et al. 2009”
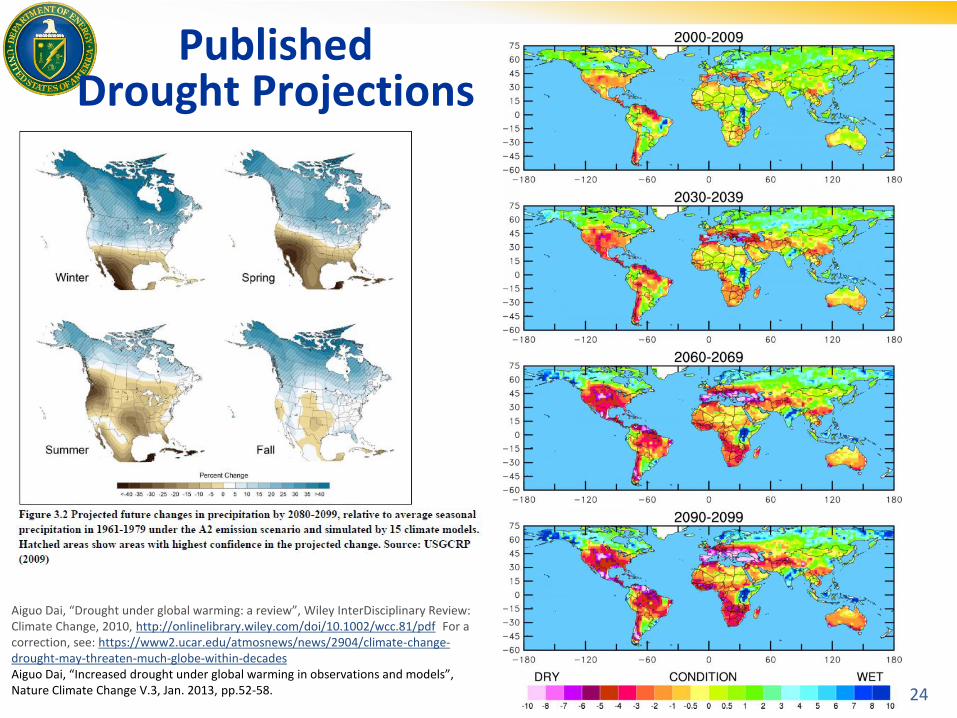
Published Drought Projections
24
Aiguo Dai, “Drought under global warming: a review”, Wiley InterDisciplinary Review: Climate Change, 2010, http://onlinelibrary.wiley.com/doi/10.1002/wcc.81/pdf For a correction, see: https://www2.ucar.edu/atmosnews/news/2904/climate-change-drought-may-threaten-much-globe-within-decades Aiguo Dai, “Increased drought under global warming in observations and models”, Nature Climate Change V.3, Jan. 2013, pp.52-58.
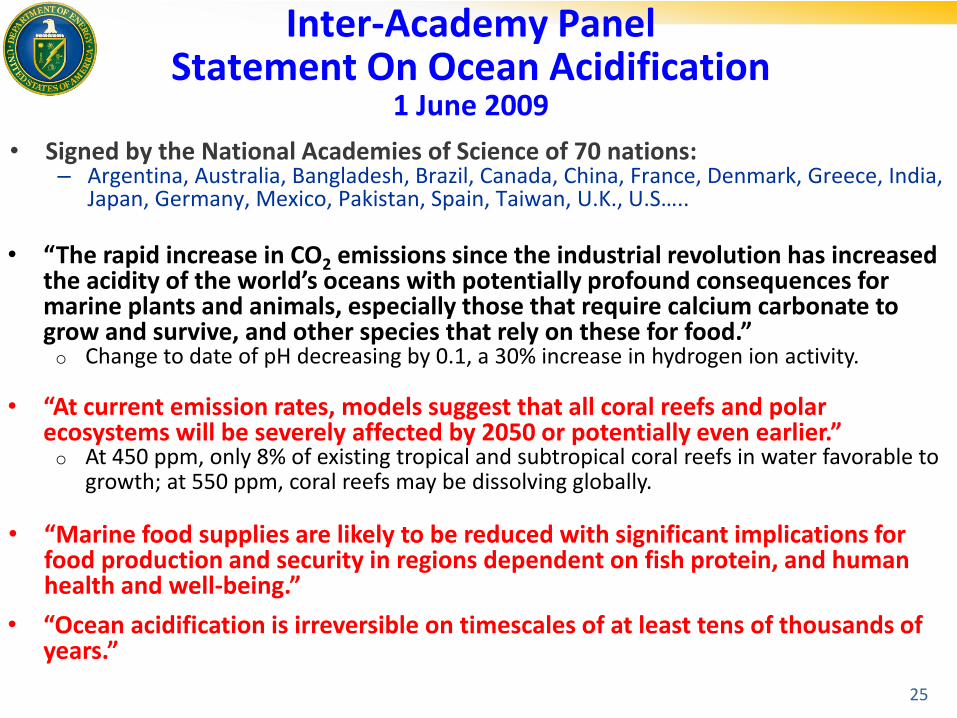
Inter-Academy Panel Statement On Ocean Acidification
1 June 2009
• Signed by the National Academies of Science of 70 nations: – Argentina, Australia, Bangladesh, Brazil, Canada, China, France, Denmark, Greece, India,
Japan, Germany, Mexico, Pakistan, Spain, Taiwan, U.K., U.S…..
• “The rapid increase in CO2 emissions since the industrial revolution has increased the acidity of the world’s oceans with potentially profound consequences for marine plants and animals, especially those that require calcium carbonate to grow and survive, and other species that rely on these for food.” o Change to date of pH decreasing by 0.1, a 30% increase in hydrogen ion activity.
• “At current emission rates, models suggest that all coral reefs and polar ecosystems will be severely affected by 2050 or potentially even earlier.” o At 450 ppm, only 8% of existing tropical and subtropical coral reefs in water favorable to
growth; at 550 ppm, coral reefs may be dissolving globally.
• “Marine food supplies are likely to be reduced with significant implications for food production and security in regions dependent on fish protein, and human health and well-being.”
• “Ocean acidification is irreversible on timescales of at least tens of thousands of years.”
25
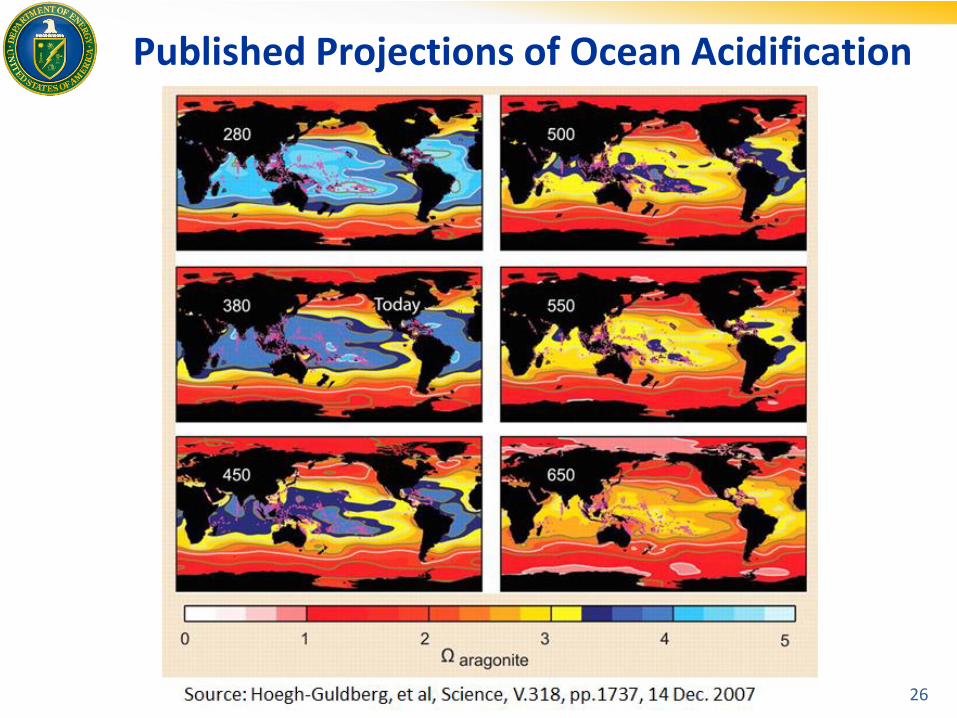
Published Projections of Ocean Acidification
26
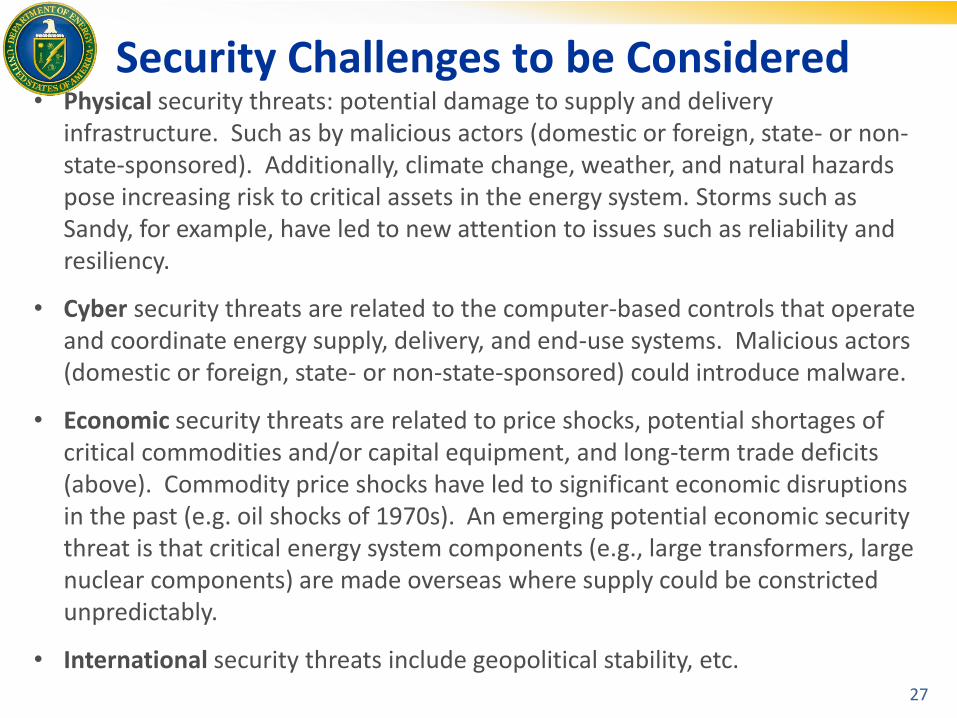
Security Challenges to be Considered
27
• Physical security threats: potential damage to supply and delivery infrastructure. Such as by malicious actors (domestic or foreign, state- or non-state-sponsored). Additionally, climate change, weather, and natural hazards pose increasing risk to critical assets in the energy system. Storms such as Sandy, for example, have led to new attention to issues such as reliability and resiliency.
• Cyber security threats are related to the computer-based controls that operate and coordinate energy supply, delivery, and end-use systems. Malicious actors (domestic or foreign, state- or non-state-sponsored) could introduce malware.
• Economic security threats are related to price shocks, potential shortages of critical commodities and/or capital equipment, and long-term trade deficits (above). Commodity price shocks have led to significant economic disruptions in the past (e.g. oil shocks of 1970s). An emerging potential economic security threat is that critical energy system components (e.g., large transformers, large nuclear components) are made overseas where supply could be constricted unpredictably.
• International security threats include geopolitical stability, etc.
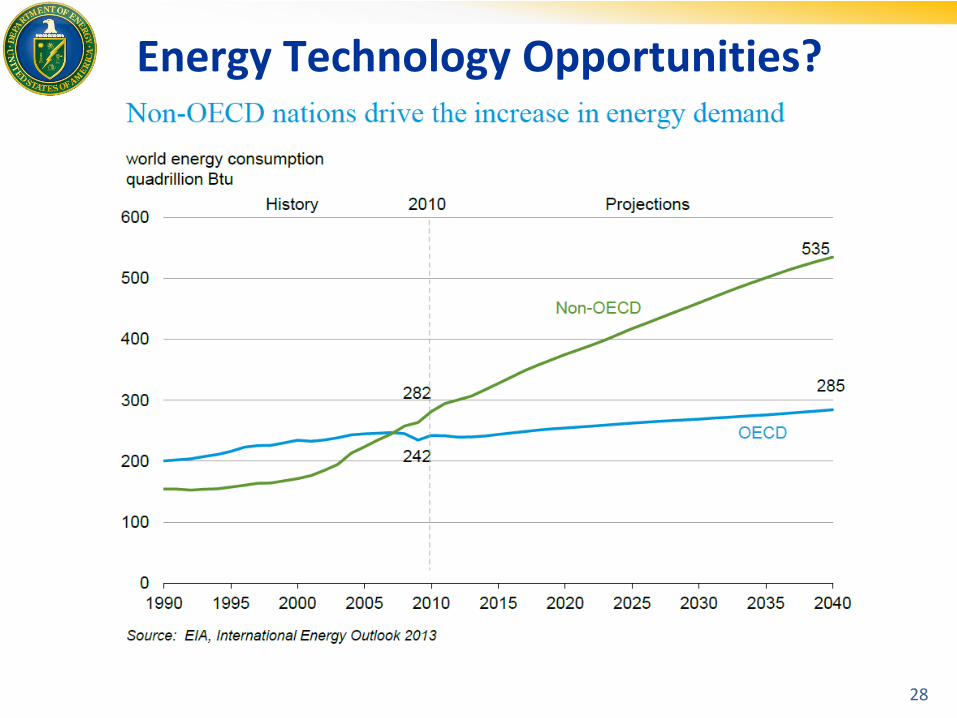
Energy Technology Opportunities?
28
The QTR-2015 Team Encourages Your Input
• More Information is at: http://www.energy.gov/qtr
• Email: [email protected]
29

• Due to the large number of expected participants, the audio and video portions of this webinar will be a “one way” broadcast. Only the organizers and QTR authors will be allowed to speak.
Webinar Logistics
• You are encouraged to submit questions using GoToWebinar’s “Questions” functionality. The moderators will respond, via audio broadcast, to as many appropriate questions as time allows.
Type your questions here and click “send”
30