qualification tests for the air sampling system at the 296
TRANSCRIPT

PNNL-13775
Qualification Tests for the Air Sampling System at the 296-Z-7 Stack, Addendum 1 J. A. Glissmeyer A. D. Maughan January 2002 Prepared for the U.S. Department of Energy under Contract DE-AC06-76RL01830

DISCLAIMER This report was prepared as an account of work sponsored by an agency of the United States Government. Neither the United States Government nor any agency thereof, nor Battelle Memorial Institute, nor any of their employees, makes any warranty, express or implied, or assumes any legal liability or responsibility for the accuracy, completeness, or usefulness of any information, apparatus, product, or process disclosed, or represents that its use would not infringe privately owned rights. Reference herein to any specific commercial product, process, or service by trade name, trademark, manufacturer, or otherwise does not necessarily constitute or imply its endorsement, recommendation, or favoring by the United States Government or any agency thereof, or Battelle Memorial Institute. The views and opinions of authors expressed herein do not necessarily state or reflect those of the United States Government or any agency thereof. PACIFIC NORTHWEST NATIONAL LABORATORY operated by BATTELLE for the UNITED STATES DEPARTMENT OF ENERGY under Contract DE-AC06-76RL01830
This document was printed on recycled paper. (8/00)

PNNL-13775
Qualification Tests for the Air Sampling System at the 296-Z-7 Stack, Addendum 1 J. A. Glissmeyer A. D. Maughan January 2002 Prepared for the U.S. Department of Energy under Contract DE-AC06-76RL01830 Pacific Northwest National Laboratory Richland, Washington 99352

iii
Summary This addendum report documents tests performed by Fluor Hanford to verify that the stack flow monitoring system for the 296-Z-7 ventilation exhaust stack meets the applicable regulatory criteria regarding stack flow measurement accuracy. These criteria ensure that the stack flow measurements have sufficient accuracy for use in estimating stack emissions. The required tests address the • continuous operability of the flow measurement system • drift in calibration parameters over a 1-week period • accuracy of flow measuring system relative to standard EPA method results • sensitivity of the flow sensor to errors caused by inadvertent rotation of the sensor. The tests performed demonstrated that operability and accuracy requirements were met. The cali-bration parameter drift tests were not conducted because the safety of the plant would be compromised; however, the flow measurements were shown to be highly repeatable. The rotational sensitivity test was not conducted, but data from the manufacturer show that such sensitivity meets the EPA requirements. The 296-Z-7 stack vents the process area and gloveboxes constructed in the Plutonium Stabilization and Handling (W-460) Project. The process area is housed in the 2736-ZB Building, adjacent to the Plutonium Finishing Plant in the 200 West Area of the Hanford Site.

v
Acknowledgments This work was supported by the U.S. Department of Energy under Contract DE-AC06-76RL01830, with project funding from the Plutonium Stabilization and Handling Project (W-460) managed by Fluor Hanford, Inc. The authors wish to acknowledge the technical assistance of Johnny D. Dick, Clint D. Stuart, James T. Lilly, and craft services of the Plutonium Finishing Plant, Fluor Hanford, Inc. for invaluable technical assistance.

vii
Contents Summary ............................................................................................................................................ iii Acknowledgments .............................................................................................................................. v 1.0 Introduction................................................................................................................................ 1.1 1.1 Background........................................................................................................................ 1.1 1.2 Acceptance Criteria ........................................................................................................... 1.2 1.3 Ventilation Exhaust Stack Description.............................................................................. 1.3 2.0 Qualification Test Methods........................................................................................................ 2.1 2.1 Stack Flow Measurement System Relative Accuracy ....................................................... 2.1 2.2 Continual Operability Test ................................................................................................ 2.2 2.3 Zero and Calibration Drift Tests........................................................................................ 2.4 2.4 Orientation Sensitivity Test ............................................................................................... 2.4 3.0 Conclusions................................................................................................................................ 3.1 4.0 References.................................................................................................................................. 4.1 Appendix A – EPA Interpretation of Rotational Sensitivity Criterion of 40 CFR 52 Appendix E................................................................................................................. A.1 Appendix B – Work Sequence Plan OTP-2Z-01-1257-24A-168 Hour Operational Test Procedure for the 296-Z-7 Stack Task 1 – 168-Hour Test Procedure ........................ B.1 Appendix C – Sample Run for Run 14............................................................................................... C.1

viii
Figures 1.1 296-Z-7 Ventilation Exhaust Stack............................................................................................ 1.4 1.2 Interior of the Air Monitoring Cabinet ...................................................................................... 1.5 2.1 Stack and Temporary Scaffold................................................................................................... 2.1 2.2 Velocity Ratio versus Sensor Rotation Angle............................................................................ 2.5
Tables 1.1 Flow-Rate Performance Specifications...................................................................................... 1.2 2.1 Relative Accuracy Data and Calculations.................................................................................. 2.3 3.1 Conclusions on Stack Flow Accuracy ....................................................................................... 3.1
1.1
1.0 Introduction This report is an addendum to an earlier report (Glissmeyer and Maughan 2001). The earlier report presented the results of tests showing that the air sampling system for the new 296-Z-7 stack meets standards for single point sampling, ANSI/HPS N13.1-1999, “Sampling and Monitoring Releases of Airborne Radioactive Substances from the Stacks and Ducts of Nuclear Facilities” (ANSI 1999). This report addendum presents the results of recent tests to verify the accuracy of the stack flow sensor for the 296-Z-7 stack. The performance criteria, test methods, results, and conclusions are discussed. The detailed test procedures and data sheets are included in the appendices. These tests were conducted by Fluor Hanford Ventilation and Balance Staff, with some data reduction performed by Fluor Hanford staff. Further data reduction and reporting are by Pacific Northwest National Laboratory1 staff. The method used for the tests is based on 40 CFR 52, Appendix E, which contains acceptance criteria for relative accuracy, continuous operability, zero and calibration drift, and orientation sensitivity. These are described later in the report. Only the tests for relative accuracy and continuous operability were conducted. Calibration drift results are inferred from the accuracy tests. Orientation sensitivity data from the instrument manufacturer is also presented. The 296-Z-7 stack was recently constructed as part of Project W460, Plutonium Stabilization and Handling. The new stack discharges ventilation air from a new process area in the 2736-ZB Building where stabilized Special Nuclear Material is packaged into the latest DOE standard containers. The 2736-ZB Building is located in the 200 West Area at the U.S. Department of Energy’s (DOE) Hanford Site. 1.1 Background Process offgas emission monitoring for radionuclides in DOE facilities is required under federal and state law. A Notice of Construction2 (NOC) was submitted to the Washington State Department of Health describing the process, the offgas treatment system, and the offgas radionuclide monitoring system. The NOC also describes the standards to which the offgas treatment and monitoring must adhere. Included in the NOC was the requirement to demonstrate the accuracy of the stack flow system using the method outlined in 40 CFR 52, Appendix E. This method, first published in 1975, provides a good basis for testing the calibration of stack flow instrumentation. However, it is dated and its approach is, in part, inappropriate for modern digital instrumentation. A discussion of acceptance criteria and the approach used in the tests is given in the next subsection.
1 Pacific Northwest National Laboratory is operated by Battelle for the U.S. Department of Energy. 2 NOTICE OF CONSTRUCTION. DOE/RL-2000-42, Rev. 2 – titled: Radioactive Air Emissions Notice of Construction for Plutonium Finishing Plant. Project W0460, “Plutonium Stabilization and Handling.”
1.2
1.2 Acceptance Criteria According to 40 CFR 52, Appendix E, the stack flow measurement system must meet five acceptance criteria. These are summarized in Table 1.1.
Table 1.1. Flow-Rate Performance Specifications
Parameter Specifications
Relative accuracy <10 percent mean reference value Continual operability 168 hours minimum Zero drift (24 hours) <3 percent of span Calibration drift (24 hours) <3 percent of span Orientation sensitivity <4 percent of mean reference value when
rotated ±10 degrees
The accuracy of the flow measurement system is determined by comparing a series of flow readings paired to simultaneous manual flow measurements made during a one-week period using EPA’s Method 2 (40 CFR 60, Appendix A, Method 2). Zero and calibration drift is determined from changes in the measurement system output before and after a daily (or more frequent) system calibration. Zero drift is the change in measurement system output when the stack flow is zero. Calibration drift is the change in measurement system output when the stack flowrate is at 67% of the measurement system’s span. These drift determinations are to be made from observations during a 168-hr period of continuous system operation. This is one way to assess the stability of the measurement system’s calibration. Because of the inability to vary stack flow from zero to maximum flow without triggering alarms, the drift tests were not conducted. Instead, the repeatability of the stack flow measurement will be evaluated. Orientation sensitivity is the angular tolerance to which the sensor can be misaligned from its correct orientation before the specified error occurs relative to the reference manual measurement method. As used in Appendix E, the relative error must be within 4% over an angular rotation of ±10º. Because this requirement is more stringent than the one for the relative accuracy test, it appeared that the wording of the EPA method may be in error. According to a communication with the method’s cognizant EPA staff member, the intent was that the variability over the range of rotation angle be <4% of the instrument’s own reading at 0º rotation (see Appendix A). The orientation test was not conducted on this system because the results have little practical value other than meeting a criterion. Once installed, the sensor is fixed, leaving any effect of orientation sensitivity incorporated into the overall relative accuracy result. To satisfy the criterion, orientation sensitivity data provided by the sensor’s manufacturer is presented instead.

1.3
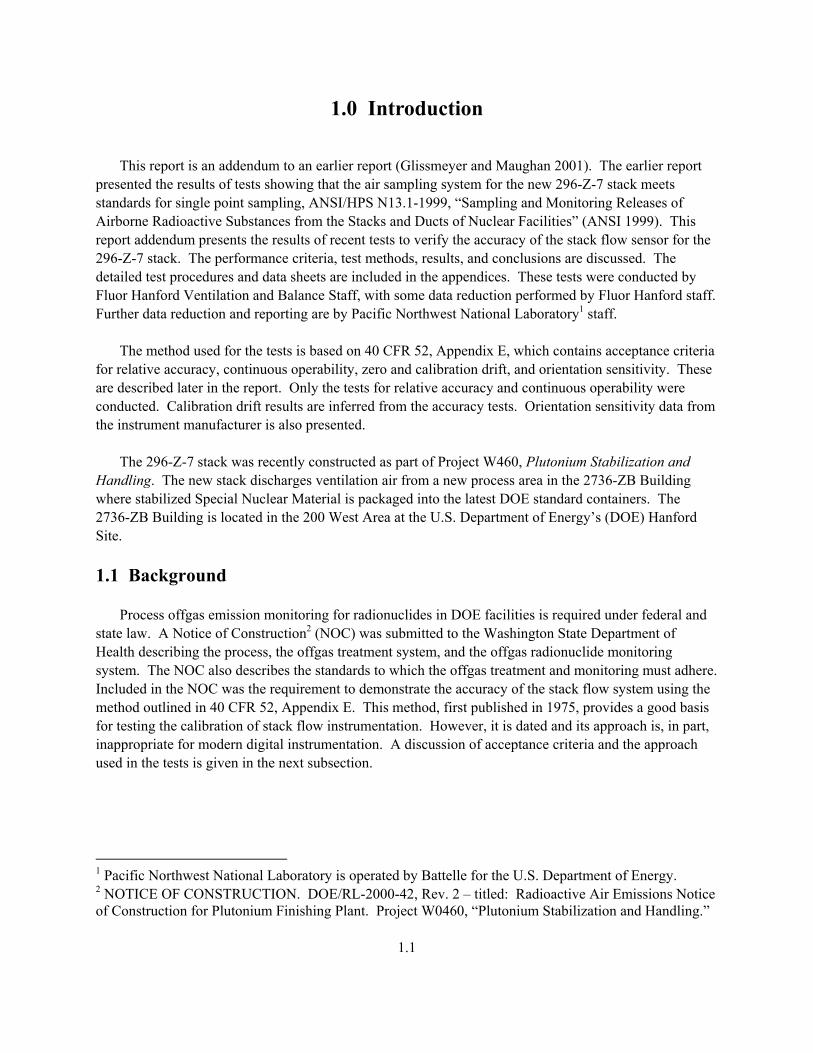
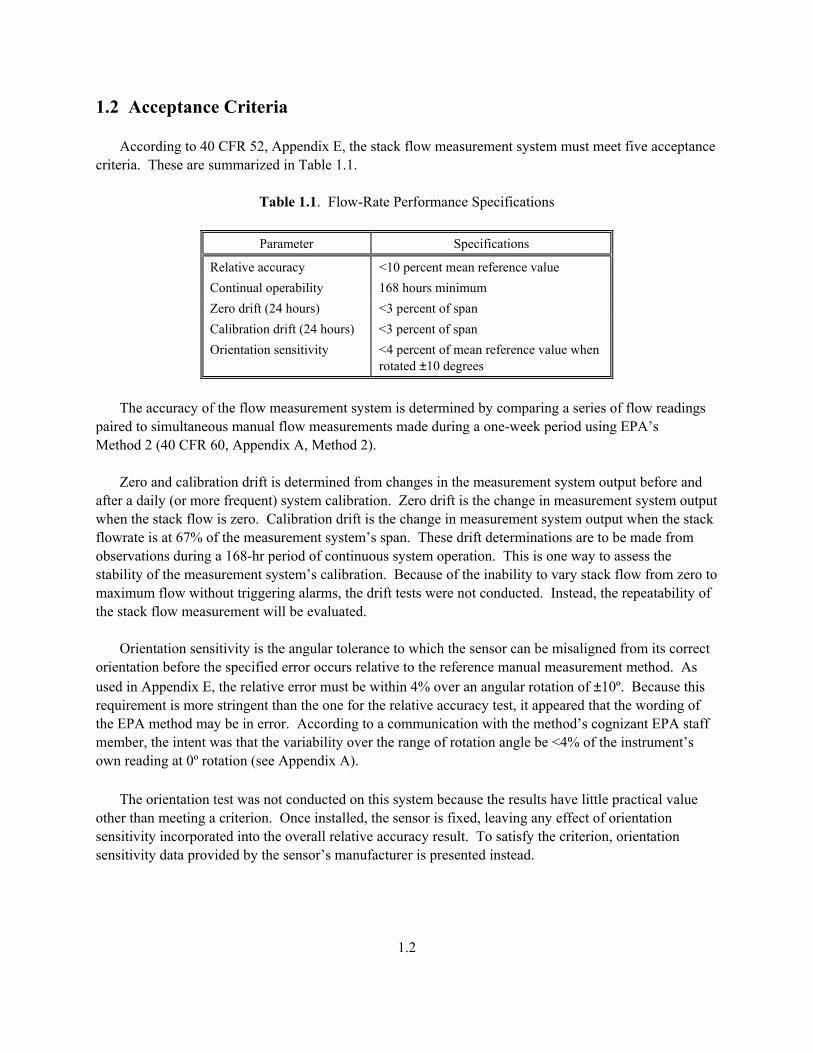
1.3 Ventilation Exhaust Stack Description The 296-Z-7 stack exhausts emissions from the process glovebox offgas and the general ventilation air from room 642 of the 2736-ZB Building. The design air flow is about 1550 to 1800 cfm. All exhaust air is filtered through two stages of high-efficiency particulate air (HEPA) filters prior to discharge. The ventilation flow is powered by one of two fans located next to the 296-Z-7 stack. Fan speed and flow are automatically controlled to maintain a set vacuum level in the process ventilation system. The stack has an internal diameter of 15.25 inches and is about 50-feet tall. Figure 1.1 diagrams the stack, duct leading to the stack, the location of the air sampling probe, flow element, and the location of the test ports used for manual flow measurements. Figure 1.2 shows the interior of the air monitoring probe cabinet. Shown are the sample lines, record sample filter holder, and the alpha continuous air monitor. The flow sensor is an insertion mass flow sensor on the end of a 1-inch diameter support tube that is 12-inches long3. It is mounted on the stack at the location shown in Figure 1.1 using a compression fitting. The signal is linearized, scaled, and displayed4 in the instrument cabinet shown in Figure 1.2. The signal can be used by the stack sampling system for controlling record sample flow in proportion to stack flow. There is a second separate ventilation flow sensor with readout located inside the 2736-ZB Building.
3 Model 452-16-MT, Kurz Instruments Incorporated, Monterey, California. 4 Model Adam Jr. 155™ Mass Flow Computer, Kurz Instruments Incorporated, Monterey, California.
1.4
Figure 1.1. 296-Z-7 Ventilation Exhaust Stack
1.5
Figure 1.2. Interior of the Air Monitoring Cabinet
CAM Sampling Line
CAM
Stack Flow Computer
Record Filter Holder

2.1
2.0 Qualification Test Methods The relative accuracy of the 296-Z-7 stack flow measurement system was assessed using the methods given in 40 CFR 52, Appendix E. This method was chosen because it was cited in the NOC. Measurements were made at the test ports shown in Figure 1.1. A temporary scaffold facilitated access to the test ports as shown in Figure 2.1. All tests were performed with one fan operating, the normal condition for the facility.
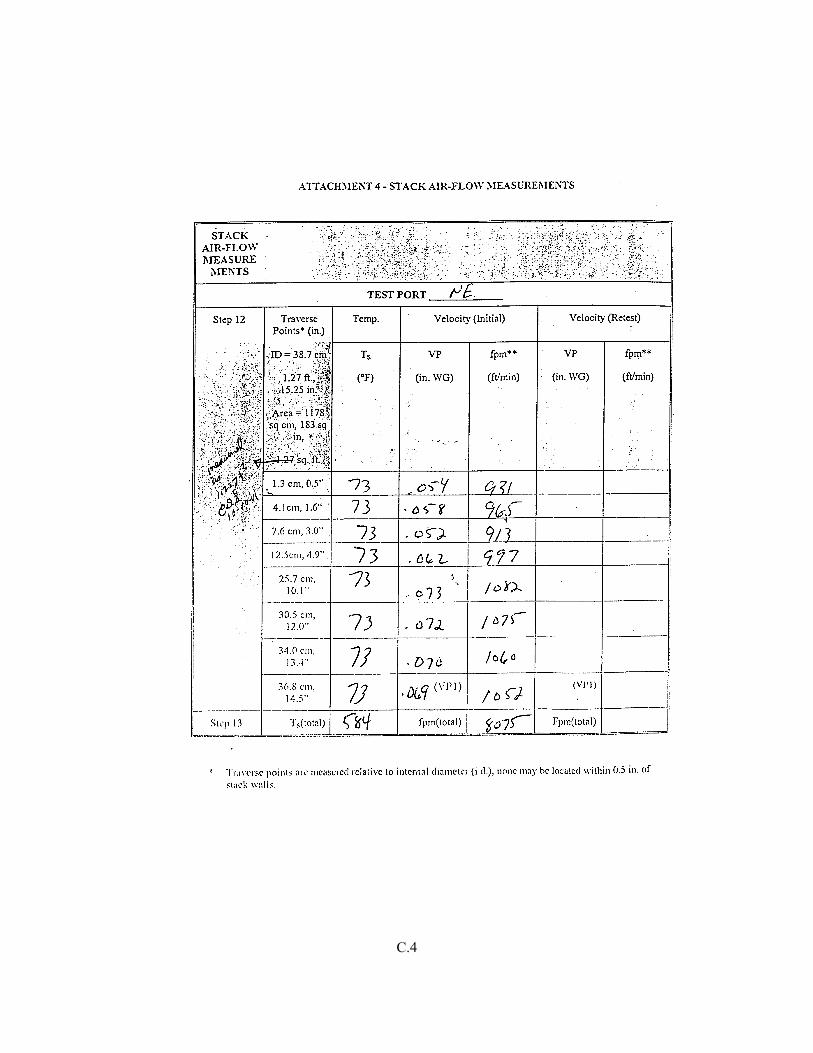
Figure 2.1. Stack and Temporary Scaffold During the 168-hour test period, the measurement system must continuously monitor the stack flowrate. During this field test period, 14 pairs of flow readings are obtained. The 14 determinations can be made at any time, one or more hours apart, during the 168-hour period. At least one determination is made on five different days, and one determination is made on the last day of the test period. Each measurement pair consisted of the flow measurements obtained by the manual reference method and the readout of the stack flow measurement system. The tests should be conducted over the range of volumetric flow rates expected during normal operations of the source stack. 2.1 Stack Flow Measurement System Relative Accuracy Fluor’s Vent and Balance Staff performed the manual flow traverses and recorded the stack flow readings. The manual flow traverses were conducted following Work Sequence Plan OTP-2Z-01-1257-24A-168 Hour (shown in Appendix B) which follows the EPA method given in 40 CFR 60, Method 2. The equipment included a standard prandtl pitot tube and a calibrated electronic manometer. The grid of measurement points was laid out in accordance with the EPA procedure for eight points on each of two linear traverses, arranged perpendicular to each other. The center point was added for additional

2.2
information between points 4 and 5. Thus, there were nine points along the north-east/ south-west direction and also along the south-east/north-west direction. The fourteen pairs of readings were obtained over a 168-hour period starting on October 3 and ending on October 10, 2002. Vent and Balance staff recorded velocity pressures at each test point and converted the readings to approximate velocity using a look-up table (ACGIH 1984), which performs the calculation of
Velocity, fpm = 4005 x Sqrt (Velocity pressure, inches of water) and assumes that the measurement conditions are dry air at 70ºF and 29.92 inches mercury pressure. The point-wise velocity measurements were averaged. The average velocity was multiplied by the stack cross-sectional area to calculate flowrate. These values were later corrected for stack pressure, humidity and temperature to calculate actual volumetric stack flow. A sample data sheet and calculation for Run 14 is included in Appendix C. Before each manual measurement, the stack flow reading from the measurement system in the instrument cabinet at the stack base was recorded. The flow computer interprets the output of the flow sensor and is programmed with a number of factors including stack area and a correction factor. During this test, the correction factor was set at 1. An additional purpose for performing the relative accuracy test was to determine the needed correction factor. The observed reading was multiplied by the correction factor to determine the measurement system reading used for this test. After the test was completed, the correction factor was programmed into the flow computer so subsequent readings would not need additional correction. The readouts are in terms of standard conditions of 25ºC and 29.92 inches mercury pressure. The recorded data and calculation of relative accuracy are shown in Table 2.1. The correction factor of 0.8 was used to correct the measurement system data. The differences between the two flow measure-ments and the square of the differences was calculated. The sum and mean of the differences and the sum of squares of differences were calculated. The 95% confidence interval was then calculated and added to the absolute value of the mean of differences. The percent ratio of this value to the mean reference flow was the percent relative accuracy. The resulting value was 1.35%, meeting the <10% criterion given in the regulation. 2.2 Continual Operability Test During the above 168-hour test period, the measurement system should undergo no corrective maintenance, repair, replacement or adjustment other than that clearly specified as required in the manufacturer’s operation and maintenance manual. Failure of the measurement system to meet this requirement results in a repetition of the 168-hour test period. However, portions of the test which were satisfactorily completed need not be repeated. Any maintenance and system alterations performed shall be noted on pertinent readings before and after all adjustments. The measurement system operated successfully all during the 168-hour test period.
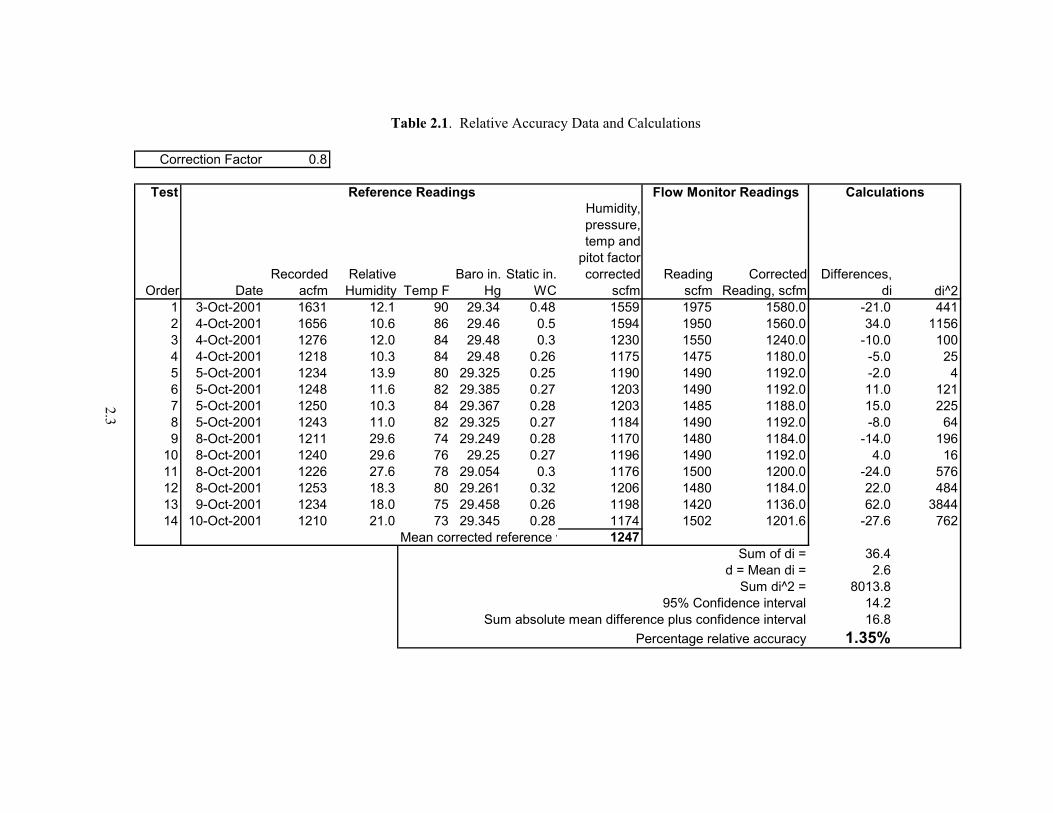
2.3
Table 2.1. Relative Accuracy Data and Calculations
Correction Factor 0.8
Test
Order DateRecorded
acfmRelative Humidity Temp F
Baro in. Hg
Static in. WC
Humidity, pressure, temp and
pitot factor corrected
scfmReading
scfmCorrected
Reading, scfmDifferences,
di di^21 3-Oct-2001 1631 12.1 90 29.34 0.48 1559 1975 1580.0 -21.0 4412 4-Oct-2001 1656 10.6 86 29.46 0.5 1594 1950 1560.0 34.0 11563 4-Oct-2001 1276 12.0 84 29.48 0.3 1230 1550 1240.0 -10.0 1004 4-Oct-2001 1218 10.3 84 29.48 0.26 1175 1475 1180.0 -5.0 255 5-Oct-2001 1234 13.9 80 29.325 0.25 1190 1490 1192.0 -2.0 46 5-Oct-2001 1248 11.6 82 29.385 0.27 1203 1490 1192.0 11.0 1217 5-Oct-2001 1250 10.3 84 29.367 0.28 1203 1485 1188.0 15.0 2258 5-Oct-2001 1243 11.0 82 29.325 0.27 1184 1490 1192.0 -8.0 649 8-Oct-2001 1211 29.6 74 29.249 0.28 1170 1480 1184.0 -14.0 196
10 8-Oct-2001 1240 29.6 76 29.25 0.27 1196 1490 1192.0 4.0 1611 8-Oct-2001 1226 27.6 78 29.054 0.3 1176 1500 1200.0 -24.0 57612 8-Oct-2001 1253 18.3 80 29.261 0.32 1206 1480 1184.0 22.0 48413 9-Oct-2001 1234 18.0 75 29.458 0.26 1198 1420 1136.0 62.0 384414 10-Oct-2001 1210 21.0 73 29.345 0.28 1174 1502 1201.6 -27.6 762
Mean corrected reference v 1247Sum of di = 36.4
d = Mean di = 2.6Sum di^2 = 8013.8
95% Confidence interval 14.2Sum absolute mean difference plus confidence interval 16.8
Percentage relative accuracy 1.35%
Reference Readings CalculationsFlow Monitor Readings
2.4
2.3 Zero and Calibration Drift Tests The EPA procedure is to perform the flow system calibration procedure at least daily during the 168-hour test period and to record the measurement system’s zero and span readings before and after the calibration at zero flow and 67% of maximum flow. The drift in zero and span readings are then calcu-lated in a manner similar to the relative accuracy calculations. This test was not performed because the stack flowrate could not be reduced without triggering a low flow alarm and risking plant safety by eliminating process area vacuum. However, the flow element and sensor are factory calibrated. The only field calibration methods recommended by the manufacturer are to compare flow readout to manual flow measurements, such as those made during the relative accuracy test or to gas tracer methods. No attempt was made to adjust zero and span settings before or after the fourteen manual flow measurements made. The relative standard deviation of the readings from Table 2.1 taken following sealing the process gloveboxes (Runs 4 – 14) is 1.5%, giving good indication of the repeatability in indicated flowrate and stability of the calibration. This value may also include any drift in the ventilation flowrate. It is recommended that the measurement system maintenance required in the ANSI N13.1-1999 standard be implemented to monitor for changes in calibration and obstruction of the flow element. 2.4 Orientation Sensitivity Test In the orientation sensitivity test, the flow element is rotated at -10, -5, 0, 5, and 10 degrees relative to the axis of the stack. The stack flow readout is recorded at each rotation. This is repeated three times at three different stack flowrates, 100%, 67%, and 33% of maximum operating stack flowrate. Before each series of rotations, a manual reference flow measurement is obtained. Thus, there would be nine sets of readings consisting of a manual flow measurement and five measurement system readings. The orientation test was not conducted on this system. It was felt that the results have little practical value other than meeting a criterion. Once it is installed with the sensor window aligned parallel with the stack flow, any residual orientation effect caused by misalignment with the flow angle becomes part of the overall relative accuracy. If the sensor later becomes loose and rotates, it is unlikely that the flow readings will be corrected because the time of and degree of rotation would be unknown. It is recom-mended that the orientation of the sensor be inspected as part of an annual accuracy audit (see ANSI/ HPS N13.1 Clause 6.2.1). Orientation sensitivity data has been obtained by the manufacturer under controlled conditions (about 1000 fpm air velocity) in a wind tunnel. Figure 2.2 shows normalized sensor response as function of pitch angle on the x-axis for the flow sensor. The maximum deviation is 1.3% which meets the EPA criterion.

2.5
Figure 2.2. Velocity Ratio versus Sensor Rotation Angle
0.986
0.9880.99
0.9920.994
0.996
0.9981
1.002
-40 -30 -20 -10 0 10 20 30 40
Rotation angle
Velo
city
Rel
ativ
e to
Zer
o R
otat
ion

3.1
3.0 Conclusions The tests conducted on the stack flow measurement system demonstrate that the flow measurements are sufficiently accurate. The test results are summarized in Table 3.1. The continual operability and relative accuracy criteria were fully met. The rotational sensitivity test was not conducted; however, the manufacturer’s data shows that the sensitivity criterion is met. The zero and calibration drift tests were not conducted; however, the flow system shows excellent repeatability.
Table 3.1. Conclusions on Stack Flow Accuracy
Parameter Runs/Configuration Test Results Criteria Meets
Rotational Sensitivity
Nine runs. Three reference readings for each of three flow settings, one system reading per five rotational settings per run
Not performed Manufacturer’s data shows 1.3% maximum deviation out to 30º rotation
± 4% of reference value
Yes, per manufacturer’s data
Continual operability
168-hour period of continual operation
Operated continuously 168-hours minimum
Yes
Relative accuracy
14 paired readings of system and reference measurements over 168-hour period
1.35% <10% of mean reference value
Yes
Calibration and zero drift
Minimum of five sensor calibration runs
Not performed Repeatability 1.5% relative standard deviation
<3% of span Not tested
4.1
4.0 References 40 CFR 52. 1998. Appendix E, Performance Specifications and Specification Test Procedures for Monitoring Systems for Effluent Stream Gas Volumetric Flowrate. U.S. Code of Federal Regulations. 40 CFR 60. 1998. Appendix A, Method 2, as amended. U.S. Environmental Protection Agency, Method 2 - Determination of Stack Gas Velocity and Volumetric Flow Rate. U.S. Code of Federal Regulations. ACGIH. 1984. Industrial Ventilation, A Manual of Recommended Practice, 18th Edition. American Conference of Governmental Industrial Hygienists, Cincinnati, Ohio. American National Standards Institute. 1999. Sampling and Monitoring Releases of Airborne Radioactive Substances From the Stacks and Ducts of Nuclear Facilities. ANSI/HPS N13.1 – 1999, American National Standards Institute, New York. Glissmeyer, J.A. and Maughan, A.E. 2001. Qualification Tests for the Air Sampling System at the 296-Z-7 Stack. PNNL-13687, Pacific Northwest National Laboratory, Richland, Washington.

Appendix A
EPA Interpretation of Rotational Sensitivity Criterion of 40 CFR 52 Appendix E

A.1

Appendix B
Work Sequence Plan OTP-2Z-01-1257-24A-168 Hour Operational Test Procedure for the 296-Z-7 Stack
Task 1 – 168-Hour Test Procedure

B.1

B.2

B.3
B.4

B.5

B.6

B.7

B.8

B.9
B.10

B.11
B.12
B.13

Appendix C
Sample Test Data for Run 14

C.1

C.2

C.3
C.4

C.5

C.6

C.7
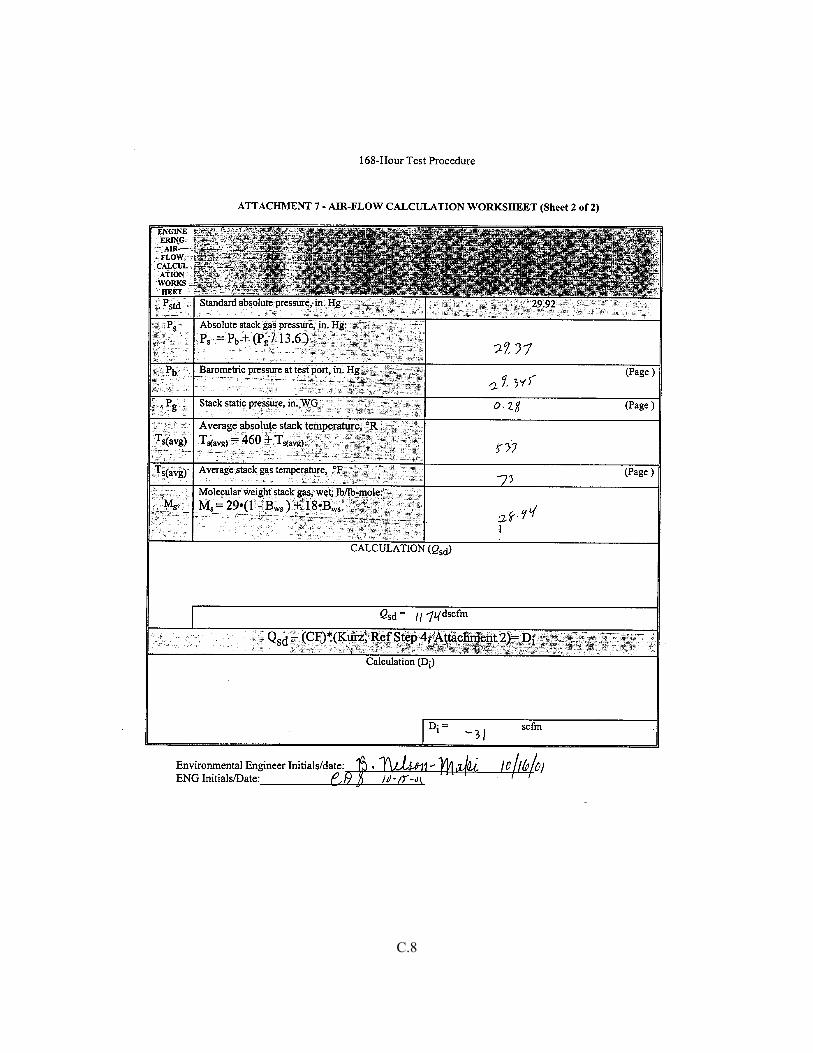
C.8

PNNL-13775
Distr.1
Distribution No. of Copies ONSITE 8 DOE Richland Operations Office G. Dragseth A6-33 L. R. Fitch T5-57 J. T. Lilly (2) R3-56 B. B. Nelson-Maki T5-54 C. D. Stuart T4-50 Public Reading Room (2) H2-53
No. of Copies 9 Pacific Northwest National Laboratory J. G. Droppo, Jr. K6-80 J. A. Glissmeyer (5) K6-80 A. D. Maughan K6-80 Hanford Technical Library (2) P8-55