quality accounts 2011 – 2012 - porthosp.nhs.uk · nhs trust (pht) quality accounts...
TRANSCRIPT
PORTSMOUTH HOSPITALS NHS TRUST
QUALITY ACCOUNTS 2011 – 2012
Our annual report to the public on the quality of services we deliver

Portsmouth Hospitals NHS Trust QUALITY ACCOUNTS 2011/2012
Portsmouth Hospitals NHS Trust – Quality Accounts 2011/2012
TABLE OF CONTENTS PART 1: STATEMENT ON QUALITY FROM CHIEF EXECUTIVE .. .................................................. 4 PART 2: QUALITY IMPROVEMENT PRIORITIES IN 2012/13.. ......................................................... 5
Development of the Quality Account ................. ......................................................................... 5 Identification of quality improvement priorities ... ...................................................................... 5 Patient Safety..................................... ........................................................................................... 6
Data collection and submission to the Patient Safety Thermometer (falls, pressure ulcers, VTE and urinary catheter infections) ..................................................................................................6 Reduce high risk medication errors ............................................................................................6 Implement the National CQUIN for Dementia.............................................................................6 Compliance with the National Emergency Department Clinical Quality Indicators ......................7
Patient Experience ................................. ...................................................................................... 7
Patient feedback ........................................................................................................................7 Patient and public involvement in practice and service development .........................................8 Patient experience in adult NHS services (NICE Quality Standard)............................................8 Staff engagement.......................................................................................................................8
Clinical Effectiveness............................. ...................................................................................... 9
Benchmarking clinical outcomes. ...............................................................................................9 Reduce readmissions.................................................................................................................9 Ensure all National Confidential Enquiries recommendations are implemented as appropriate..9 To monitor and improve Hospital Standardised Mortality Ratio (HSMR) and the Summary Hospital-level Mortality (SHMI) indicators.................................................................................10
QUALITY IMPROVEMENT PRIORITIES 2011/2012 – HOW WE DID.............................................. 11 Patient Safety..................................... ......................................................................................... 11
Venous-thrombo-emolism (VTE). .............................................................................................11 Falls. ........................................................................................................................................11 Medication. ..............................................................................................................................11
Patient Experience ................................. .................................................................................... 12
Patient Experience. ..................................................................................................................12 Privacy and Dignity. .................................................................................................................12 Engagement and Involvement..................................................................................................12 Improving the patient journey. ..................................................................................................12
Clinical Effectiveness............................. .................................................................................... 13
Hospital Standardised Mortality Ratio (HSMR).........................................................................13 National Clinical Audit. .............................................................................................................13 Cancer Peer Review. ...............................................................................................................14
Statement of assurance from the Board .............. ......................................................................... 15
Review of services ...................................................................................................................15 Participation in clinical audits ...................................................................................................15 Research: participation in clinical research ..............................................................................18 Goals agreed with Commissioners...........................................................................................19 Statements from the Care Quality Commission........................................................................20 Data quality..............................................................................................................................21
PART 3: REVIEW OF QUALITY PERFORMANCE.............. ............................................................ 24 Patient Safety..................................... ......................................................................................... 24
Patient Safety Incidents (adverse incidents).............................................................................24 Serious Incidents requiring investigation (SIRI) ........................................................................25

Portsmouth Hospitals NHS Trust QUALITY ACCOUNTS 2011/2012
Portsmouth Hospitals NHS Trust – Quality Accounts 2011/2012
Falls .........................................................................................................................................25 Venous Thrombo-Embolism (VTE)...........................................................................................26 Pressure Ulcers .......................................................................................................................27 Medication ...............................................................................................................................27 Reducing HealthCare Associate Infection (HCAIs)...................................................................28 Nutrition ...................................................................................................................................30 Productive Series.....................................................................................................................30
Patient Experience ................................. .................................................................................... 32
Patient feedback ......................................................................................................................32 National In-Patient Survey........................................................................................................32 National Outpatient Survey ......................................................................................................33 Engagement and Involvement..................................................................................................33 Supporting volunteers ..............................................................................................................34 Complaints...............................................................................................................................35 Plaudits ....................................................................................................................................36
CLINICAL EFFECTIVENESS............................. .......................................................................... 37
Hospital Standardised Mortality Ratio (HSMR).........................................................................37 Summary Hospital Standardised Mortality Ratio (SHMI) ..........................................................38 Early Recognition of the Deteriorating Patient ..........................................................................39 Patient Reported Outcome Measures (PROMs).......................................................................39
NATIONAL QUALITY TARGETS (PERFORMANCE)............. ..................................................... 41 WORKFORCE ............................................................................................................................. 41
National Staff Survey ...............................................................................................................41 Planning and developing the workforce....................................................................................45 Health and Wellbeing ...............................................................................................................46
2011/2012 CLINICAL SERVICE CENTRE QUALITY IMPROVEME NT HIGHLIGHTS................. 47
Theatres, Anaesthetics and Critical Care .................................................................................47 Clinical Support Services .........................................................................................................47 Emergency and Acute Medicine...............................................................................................48 Head and Neck ........................................................................................................................48 Medicine ..................................................................................................................................48 Medicine for Older People, Rehabilitation and Stroke ..............................................................48 Trauma, Orthopaedics, Rheumatology and Pain......................................................................49 Renal and Transplantation .......................................................................................................49 Surgery and Cancer .................................................................................................................49 Women and Children ...............................................................................................................50
Statement of Directors’ responsibilities in respect of the Quality Account ............................ ... 51 Portsmouth Local Involvement Network (LINk) Comment ary on Portsmouth Hospitals NHS Trust (PHT) Quality Accounts 2011/2012 ............. ......................................................................... 52 SHIP Commentary on Portsmouth Hospitals NHS Trust ( PHT) Quality Accounts 2011/2012 ... 53 Portsmouth Health Overview and Scrutiny Committee C ommentary on Portsmouth Hospitals NHS Trust (PHT) Quality Accounts 2011/2012......... ..................................................................... 56 Hampshire Health Overview and Scrutiny Committee Co mmentary on Portsmouth Hospitals NHS Trust (PHT) Quality Accounts 2011/2012......... ..................................................................... 56 Limited Assurance report ........................... ................................................................................... 57 Glossary of terms .................................. ......................................................................................... 59

Portsmouth Hospitals NHS Trust Statement on quality from Chief Executive
Portsmouth Hospitals NHS Trust – Quality Accounts 2011/2012 Page 4 of 60
PART 1: STATEMENT ON QUALITY FROM CHIEF EXECUTIVE It is with great pleasure that I introduce our third Quality Account. The quality and safety of patient care is at the centre of all we do at Portsmouth Hospitals NHS Trust and remains a key focus for the Trust Board and all staff. This account will evidence the progress made since publishing our first Quality Account in June 2010. Ensuring we keep our patients safe is crucial to providing both high quality and effective care. This has been another challenging year our staff, and therefore, I am particularly pleased to be able to report further improvements in the quality of care our patients have received. By way of example, we have achieved a 33% reduction in hospital acquired grade 3 and 4 pressure ulcers and a 11% reduction in patient falls resulting in moderate or severe harm. In relation to our performance against key National targets, we have consistently achieved the cancer targets and 90% of our patients with a suspected stroke are now being directly admitted to our specialist unit. We have seen a significant improvement in the experiences of our staff as reported by our latest staff survey results. Listening to and learning from our patients and their families/carers, enables us to continually improve the quality of services. We very much value the feedback they provided over the last year and we have introduced additional ways in which we can gain feedback. We are now focussing on ensuring that all of our local communities are involved, not only in feedback about our services, but also in planning our services for the future. Our quality priorities for the coming year will help drive further improvements for patients. This will include the implementation of a key piece of work focussing on improving the care of people with dementia, and that of their families and carers. All of our Clinical Service Centres can demonstrate improvement in quality and some key achievements can be found within this report. The Care Quality Commission carried out an inspection at Queen Alexandra Hospital in January this year. We are delighted to see that the significant progress we have made in respect of medicines management was recognised together with improvements in how people have their dignity and privacy respected, how they are kept informed about their care and treatment and that our service users experience safe and appropriate care, treatment and support. The one compliance action relating to documentation is being addressed to ensure that we become compliant with the standard and that this will be maintained.
We acknowledge that there is no room for complacency and will use the momentum gained over the past two years to drive forward the transformation of services and deliver enhanced experiences and outcomes for all our patients, relatives and carers. Our Quality Improvement Strategy has been a key focus for this past year and will support the delivery of our quality initiatives as we move towards Foundation Trust status. To the best of my knowledge the information and data contained within this Quality Account is accurate.
Ursula Ward, Chief Executive, Portsmouth Hospitals NHS Trust

Portsmouth Hospitals NHS Trust QUALITY ACCOUNTS 2011/2012
Quality Improvement Priorities in 2012/2013
Portsmouth Hospitals NHS Trust – Quality Accounts 2011/2012 Page 5 of 60
PART 2: QUALITY IMPROVEMENT PRIORITIES IN 2012/13 DEVELOPMENT OF THE QUALITY ACCOUNT
In 2010/11 we undertook a consultation exercise to help inform the content of the Quality Account (the Account). To build on this, we undertook a much wider consultation exercise this year, writing and meeting with a number of ‘difficult to reach’ groups to actively seek their feedback and input. These groups included:
• The Alzheimer’s Association • Carers UK
• Chrysalis (Trans-gender group) • Community Forums
• Learning disability groups • Sensory Impairment team
The feedback received has been invaluable and has been taken into consideration in the creation of this Account. As a result of the feedback received we have:
• included a glossary to explain some of the technical terms, • included more information about nutrition, • made an ‘easy read’ version available: to address feedback about making the Account accessible
to more groups. This will be available through the Portsmouth Hospitals NHS Trust website or by request.
IDENTIFICATION OF QUALITY IMPROVEMENT PRIORITIES
Quality is at the heart of everything we do at Portsmouth Hospitals NHS Trust, and in December 2011 we introduced a Quality Improvement Strategy to ensure continuous improvement in patient care. This strategy sets out specific key goals and priorities, which have helped to inform the quality priorities for the coming year, and to which this Quality Account links. We have adopted the common definition of quality used by the NHS, which comes from Lord Darzi’s NHS Next Stage Review (June 2008) and is defined in three parts:
We understand that quality care is not achieved by focusing on one or two aspects, but that high quality care encompasses all three aspects with equal importance being placed on each. Therefore, we have broken our priorities down into these three categories.
The Trust developed it’s priorities for quality improvement by consulting with patients and staff, and through access to data and information available through a variety of internal and external sources. These included complaints, incident reporting, Dr Foster, national patient surveys, clinical audit, National Patient Safety Agency and NICE guidance. To demonstrate the importance we place on delivering high quality care and to ensure regular and robust monitoring, we have established three groups for each of the domains of quality; the Patient Safety Working Group (PSWG), the Clinical Effectiveness Steering Group (CESG) and the Patient Experience Steering Group (PESG). These groups have identified the quality priorities for 2012/2013, contained within this Account, and will monitor these throughout the year. The Trust’s overarching Governance and Quality Committee, along with the Trust Board, has also been involved in the development of the priorities and fully endorse these.

Portsmouth Hospitals NHS Trust QUALITY ACCOUNTS 2011/2012
Quality Improvement Priorities in 2012/2013
Portsmouth Hospitals NHS Trust – Quality Accounts 2011/2012 Page 6 of 60
PATIENT SAFETY
Data collection and submission to the Patient Safet y Thermometer (falls, pressure ulcers, VTE and urinary catheter infections) Rationale: Included as a National Commissioning for Quality and Innovation (CQUIN) indicator for the 2012/13 contract year, we will use the NHS Safety Thermometer to collect, and report, data on four outcomes; pressure ulcers, falls, urinary tract infections in patients with catheters and Venous Thrombo-embolism (VTE). This also supports our local safety priorities as outlined in our Quality Improvement Strategy. Target: We aim to submit monthly survey data to meet the national requirement. Monitoring: Through the Patient Safety Working Group and reported to the Board on a regular basis.
Reduce high risk medication errors Rationale: Incidents involving medicines are the third largest group of adverse incidents reported nationally and learning from medication incidents remain a high priority for all NHS Trusts. 11 out the 25 Department of Health "never events" are related to medication issues and there is currently a regional Patient Safety Federation 'No Needless Medication Errors' group in South Central, in which we participate. This group is working to reduce medication errors and their consequences. This is included as a key quality indicator within the Quality Contract for 2012/13 and supports our local safety priorities, as outlined in our Quality Improvement Strategy. Target: • 10% reduction in medication incidents that result in moderate/severe harm or death based on
2011/12 data. • Improve medicines management, in particular in relation to warfarin, heparin, insulin and missed
doses. Monitoring: Through the Patient Safety Working Group and reported to the Board on a regular basis.
Implement the National CQUIN for Dementia Rationale: There is a concern about the care of people with dementia in the general hospital setting. It is estimated that one in four adult general hospital beds are being occupied by someone with dementia. People with dementia stay in hospital an average of seven extra days compared to patients with similar diagnosis but no dementia, 45% of people over 75 admitted to hospital have dementia alongside their other conditions and half of these have not been diagnosed before admission. A National CQUIN indicator for dementia has been developed to ensure there is additional focus on practice within this area and to raise the profile of dementia care. This is also included as a priority in the NHS Operating Framework 2012/13, is included as a NICE Quality Standard and as a local priority to develop and improve the dementia care pathway. Target: We will submit data in line with the national requirement: • Screen 90% of all patients aged 75 and over for dementia within 72 hours of admission, • Undertake a risk assessment of 90% of patients aged 75 and over who have been screened for
dementia; and

Portsmouth Hospitals NHS Trust QUALITY ACCOUNTS 2011/2012
Quality Improvement Priorities in 2012/2013
Portsmouth Hospitals NHS Trust – Quality Accounts 2011/2012 Page 7 of 60
• Refer for specialist diagnosis 90% of patients aged 75 and over who have been identified as being at risk of having dementia.
Monitoring: Through the Patient Safety Working Group and reported to the Board on a regular basis.
Compliance with the National Emergency Department C linical Quality Indicators Rationale: Achieving these indicators will ensure that our patients have an earlier initial assessment, prompt treatment interventions, for example, pain relief, and will improve patient flow through the Emergency Department. It is recognised that not seeing patients in a timely manner within the Emergency Department results in poor patient experience and can increase clinical risk as a result of increased transfers between clinical areas and multiple handovers of care. Target: • We will submit data in line with the national requirements and aim to achieve compliance with the
indicators within the three domains of effectiveness of care, patient experience and patient safety. Monitoring: Through the Emergency Department and Acute Medicine CSC Governance Committee and reported to the Board on a regular basis.
PATIENT EXPERIENCE
Patient feedback Rationale: We aim to provide the highest quality services to our patients, relatives and carers, and to improve continuously their experience of using our services. We value the feedback provided by them and use this to enhance the services we provide. However, we recognise that the traditional methods of getting patient experience feedback can exclude a large proportion of the community. This includes people with specific communication needs e.g. visual or hearing impairment, learning disabilities and those for whom English is not their first language. In 2012/2013 we wish to continue to build on the improvements we have seen in national and local patient surveys and other feedback from our services users, their families and carers. To ensure that the feedback we get truly represents the overall experience of our local community we need to develop a more inclusive approach. The National CQUIN for Patient Experience continues in 2012/2013. The indicator is a measure of patients’ experience against 5 issues known to be important to them and where past data indicates that there is room for improvement across England. Those issues are: 1. Involvement in decisions about treatment/care. 2. Hospital staff being available to talk about worries/concerns. 3. Privacy when discussing condition/treatment. 4. Being informed about side effects of medication. 5. Being informed who to contact if worried about their condition after leaving hospital. Patient feedback is also included as a priority in the NHS Operating Framework 2012/13, and supports our local patient experience priorities as outlined in our Quality Improvement Strategy. Target: • To demonstrate an improvement in our score on the national in-patient 5 key questions and those
questions reported in the lowest performing 20% of Trusts, in 2012/2013 compared to 2011/2012. • To increase CSC survey participation rate to an agreed target (to be agreed by 30th June 2012) to
ensure accurate reflection of local experience.

Portsmouth Hospitals NHS Trust QUALITY ACCOUNTS 2011/2012
Quality Improvement Priorities in 2012/2013
Portsmouth Hospitals NHS Trust – Quality Accounts 2011/2012 Page 8 of 60
Monitoring: Through the Patient Experience Steering Group and reported to the Board on a regular basis.
Patient and public involvement in practice and serv ice development Rationale: We aim to ensure that people who use our services are actively involved in discussions and decisions about their care, treatment and how services are developed and run. We will further increase the opportunity for feedback from a wide variety of people who use our services, respond in a more timely manner when feedback suggests change is needed and demonstrate improvements in response to that feedback. We shall focus on the implementation of a more robust system of patient and public involvement. Further enhancing patient involvement are key quality indicators within the Quality Contract for 2012/2013. Target: • Increase the number of patient and public representatives on Trust, Clinical Service Centre (CSC)
and Speciality Groups and Committees. These people will more fairly represent the hospital population and local community.
Monitoring: Through the Patient Experience Steering Group and reported to the Board on a regular basis.
Patient experience in adult NHS services (NICE Qual ity Standard) Rationale: The NICE Quality Standards are a set of measures which provide markers of high quality, cost effective patient care. In February 2012 NICE published the ‘patient experience in adult NHS services’ quality standard, which provides clear guidance on what comprises a good patient experience. Improving the overall patient, relative and carer experience is a key quality indicator within the Quality Contract for 2012/2013 and is a local priority identified within the Quality Improvement Strategy. It is also a priority within the NHS Operating Framework 2012/2013. Target: • To implement the Patient Experience in adult NHS Services NICE Quality Standard. Monitoring: Through the Patient Experience Steering Group and reported to the Board on a regular basis. Staff engagement Rationale: Our staff continue to be our most vital resource and we will continue to use the results from the National Staff Survey and our own local surveys to improve continuously staff experience and the services to our patients. This is included as a priority in the NHS Operating Framework 2012/13 and is one of the key quality indicators within the Quality Contract for 2012/2013. Target: Develop and implement action plans to deliver improvements to the key findings of the 2012 National Staff Survey relating to: • Staff satisfaction with the quality of work and patient care they are able to deliver. • Staff feeling their role makes a difference to patients.

Portsmouth Hospitals NHS Trust QUALITY ACCOUNTS 2011/2012
Quality Improvement Priorities in 2012/2013
Portsmouth Hospitals NHS Trust – Quality Accounts 2011/2012 Page 9 of 60
• Staff recommending the Trust as a place to work or receive treatment. • Overall staff engagement. Monitoring: Through the Workforce Governance Committee and reported to the Board on a regular basis. CLINICAL EFFECTIVENESS
Benchmarking clinical outcomes. Rationale: We need continually to monitor how we are performing against our clinical quality priorities and key indicators. It is important that the Trust is aware of how it is performing against comparison organisations, and therefore, needs to improve on benchmark reporting. This is a local priority identified within the Quality Improvement Strategy and is contained as a priority within the NHS Operating Framework 2012/13 and NHS Outcomes Framework 2012/13. Target: • Improve analysis of our clinical performance against key quality indicators, benchmarked against
national and local comparisons and against our own performance. Monitoring: Through the Clinical Effectiveness Steering Group and reported to the Board on a regular basis.
Reduce readmissions. Rationale: To understand reasons for re-admission to include the impact of reduction of length of stay, change in clinical practice and to ensure improvements in patient safety, experience and outcomes. This is a key quality priority within the Quality Contract for 2012/13, a local priority identified within the Quality Improvement Strategy and is contained as a priority within the NHS Operating Framework 2012/13. Target: • Collect and analyse readmission data. • Learn lessons and reflect on the quality of patient care. Monitoring: Through the Clinical Effectiveness Steering Group and reported to the Board on a regular basis.
Ensure all National Confidential Enquiries recommen dations are implemented as appropriate Rationale: The National Confidential Enquiry into Patient Outcome and Death (NCEPOD) assists in maintaining and improving standards of medical and surgical care for the benefit of the public by reviewing the management of patients. It enables Trusts to learn lessons and to reflect on their own quality of patient care. This is a key quality priority within the Quality Contract for 2012/13 and a local priority identified within the Quality Improvement Strategy. Target: • Ensure all appropriate NCEPOD recommendations are implemented. Monitoring: Through the Clinical Effectiveness Steering Group and reported to the Board on a regular basis.

Portsmouth Hospitals NHS Trust QUALITY ACCOUNTS 2011/2012
Quality Improvement Priorities in 2012/2013
Portsmouth Hospitals NHS Trust – Quality Accounts 2011/2012 Page 10 of 60
To monitor and improve Hospital Standardised Mortal ity Ratio (HSMR) and the Summary Hospital-level Mortality (SHMI) indicators Rationale: HSMR and SHMI are indicators of healthcare quality, measuring whether the death rate at a hospital is higher or lower than that which would be expected. These indicators require monitoring as high mortality rates can provide a warning sign that things are going wrong within an organisation. This is a local priority identified within the Quality Improvement Strategy and the Operating Framework 2012/13. Target: • To monitor HSMR and SHMI rates on a monthly basis and to scrutinise underlying data to ensure
action is taken where appropriate. Monitoring: Through the Clinical Effectiveness Steering Group and reported to the Board on a regular basis.

Portsmouth Hospitals NHS Trust QUALITY ACCOUNTS 2011/2012
Quality Improvement Priorities 2011/12 – How we did
Portsmouth Hospitals NHS Trust – Quality Accounts 2011/2012 Page 11 of 60
QUALITY IMPROVEMENT PRIORITIES 2011/2012 – HOW WE DID The Quality Account published in 2011/2012 identified areas of quality improvement to focus on during 2011/2012. A brief summary is outlined below, with further detail contained in part 3 of this account.
PATIENT SAFETY
Venous-thrombo-emolism (VTE). To sustain the risk assessment practice in line wit h the requirement of the CQUIN indicator.
����Achieved The Trust achieved the 90% VTE risk assessment target for all adult patients on admission to hospital for quarters 3 and 4 and achieved a year end total of 90.1% compliance.
Improve the implementation of appropriate treatment following the risk assessment (target is to aim for 100% initiation of Thromboprophylaxis fo r all clinically appropriate patients identified as being at risk of thrombosis, with a m inimum compliance of 98%).
����Achieved The Trust has been undertaking audits to measure compliance and we have achieved the 98% target for this year. We will be looking at more detailed audits for the coming year.
Continue to report and carry out Root Cause Analysi s (RCA) on all cases of Hospital Associated Thrombosis (HAT).
����Achieved We have been reporting and carrying out RCA on hospital associated VTE events since February 2010. In order to achieve a complete data set, improvements have been made in both the method of collection and the process of investigation. A VTE review group has been established to critically review all HAT events.
Falls. To reduce the number of ‘moderate’ and ‘severe’ in- patient falls by 10% compared to 2010/11.
����Achieved We have over achieved the 10% reduction target, with 37 moderate/severe falls incidents reported, against a maximum of 39.
Medication. Increase documentation of patients’ allergy status (target 100% documentation of allergy status on all patients drug charts, with an initial minimum increase of 5%).
���� Achieved 78% of patients had their allergy status documented on their drug chart, against a minimum target of 71%
Aim for 100% patients having had a Level 2 Medicine s Reconciliation within 24 hours, with an initial minimum increase of 5% per annum.
����Not achieved We did not achieve the minimum target of 77% of medicines being reconciled within 24 hours, achieving 69%. However, an improvement has been seen during January to March 2012 with more pharmacy staff working in the clinical areas.

Portsmouth Hospitals NHS Trust QUALITY ACCOUNTS 2011/2012
Quality Improvement Priorities 2011/12 – How we did
Portsmouth Hospitals NHS Trust – Quality Accounts 2011/2012 Page 12 of 60
PATIENT EXPERIENCE
Patient Experience. Improve the response rate to local and national sur veys by ensuring surveys are accessible to all.
����Achieved We have seen an increase in the number of responses for our local surveys:
• April – June 2011: 276 responses • July – September 2011: 307 responses • October – December 2011: 240 responses • January – March 2012: 644 responses
Response rates to the National In-patient survey increased by 8% in 2011, compared to 2010. Responses to the National Out-patient survey have also increased, in 2009 (the last time the survey was conducted), the response rate was 57% and in 2011 this rose to 61%. The national average response rate for the National Out-patient survey is 53%, which puts us well are above the national average.
Privacy and Dignity. Achieve 90% or above compliance with Privacy and Di gnity audit standards.
����Achieved We achieved 92% compliance with privacy and dignity standards in the national surveys (In-patient and Out-patient). A review of the local audit tool has been completed and amended to better reflect the national survey. This will enable the direct comparison of our local results with those provided nationally.
Deliver the new Department of Health Single Sex Acc ommodation requirements and monitoring of any breaches.
����Not achieved We continue to work to ensure we are meeting the requirements of providing single sex accommodation for our patients. However, 46 mixed sex accommodation breaches have been reported this year, against a target of zero.
Engagement and Involvement. Improve engagement and involvement of service users .
����Achieved We have further developed the number and type of feedback systems we provide for our patients and their families. We are further developing the work to ensure that everyone, no matter what their communication needs, is enabled to provide us with feedback. We have formed a group with representatives from the black and minority ethnic community, representatives of older people, people with dementia and other mental health issues and people with a learning disability to improve how they can feedback their experiences.
Improving the patient journey. Improve patient discharge experience.
����Achieved We have seen an improvement in 23 of the 30 questions in the national in-patient survey in relation to the discharge experience; of these 18 showed a significant improvement. The areas of greatest improvement include: • Provision of a predicted discharge date within 24 hours of admission. • Appropriateness of area whilst waiting for discharge. • Provision of information on illness-related danger signals to watch for and act upon.

Portsmouth Hospitals NHS Trust QUALITY ACCOUNTS 2011/2012
Quality Improvement Priorities 2011/12 – How we did
Portsmouth Hospitals NHS Trust – Quality Accounts 2011/2012 Page 13 of 60
• How to feedback to the Trust including complaints procedures, comments and compliments and PALS.
The Integrated Discharge Bureau has been re-designed to provide a single point of referral for Rehabilitation, Social and Community Services. This enables a more streamlined process which reduces delays in discharge’.
Reduce waiting time in the Emergency Department (ED ).
����Achieved The National In-patient experience survey reports a significant improvement in the amount of time patients waited in ED before being admitted, and we performed above the national average. All patients requiring admission were admitted within the 4 hour timescale as required by the national standard.
Reduce the number of patients remaining in the Medi cal Assessment Unit (MAU) for longer than 48 hours.
����Not achieved We did not achieve a reduction in the number of patients remaining in MAU for longer than 48 hours. The introduction of a new assessment service in October 2011, for frail older people may have contributed to this. The new service is designed to avoid unnecessary hospital admissions by detailed clinical and social assessment being undertaken on arrival to establish whether the patient would be more appropriately cared for at home, or in the community with the relevant support. As a result, patients are spending longer in the assessment area.
Reduce the number of medical outliers. ����Achieved
It is important to minimise the number of medical outliers as this leads to additional patient moves, higher risk (e.g. medical patients being looked after by non-medical nursing staff), reduced patient satisfaction and extended length of stay. This information has been monitored by Medicine and as can be seen from the table below, there has been a reduction in the numbers.
Medical Outliers (outside of the medical beds) Quarter 1 2,915 Quarter 2 1,982 Quarter 3 1,898 Quarter 4 384
CLINICAL EFFECTIVENESS
Hospital Standardised Mortality Ratio (HSMR). Develop the monitoring of HSMR by conducting in-dep th analysis of Dr Foster data.
����Achieved HSMR and Dr Foster data is analysed on a regular basis at the Clinical Effectiveness Steering Group and reported to the Board quarterly.
National Clinical Audit. Improve follow-up and implementation of recommendat ions to improve service provision.
����Achieved We have achieved an increase in the number of national audits we have participated in, seen an improvement in the overall participation rates and continue to review published reports to learn important lessons on how we may improve our services. This continues to be the focus of our Clinical Effectiveness agenda.

Portsmouth Hospitals NHS Trust QUALITY ACCOUNTS 2011/2012
Quality Improvement Priorities 2011/12 – How we did
Portsmouth Hospitals NHS Trust – Quality Accounts 2011/2012 Page 14 of 60
Cancer Peer Review. Monitor peer review reports and Trust action plans to increase scrutiny.
����Achieved This was the first year of the modified Cancer Peer Review Programme. We undertook 7 tumour site Multi-Disciplinary Team (MDT) reviews and plans have been developed to address any required improvements, most notably in Acute Oncology. There was one external review of the Children’s MDT which received predominantly positive feedback. The appointment of new post holders to the roles of Lead Cancer Nurse and Lead Cancer clinician will assist in addressing the required improvements.

Portsmouth Hospitals NHS Trust QUALITY ACCOUNTS 2011/2012
Statement of assurance from the Board
Portsmouth Hospitals NHS Trust – Quality Accounts 2011/2012 Page 15 of 60
Statement of assurance from the Board
Review of services During 2011/2012 the Portsmouth Hospitals NHS Trust provided and sub-contracted 36 NHS services. The Portsmouth Hospitals NHS Trust has reviewed all the data available to them on the quality of care in all 36 of these NHS services. We review the quality of service provision in a number of ways:
• Performance reviews. • National screening reviews. • Peer reviews. • Quality indicators (Clinical Dashboards). • Clinical Effectiveness Steering Group. • Patient Safety Working Group. • Patient Experience Steering Group. • CQC internal assessments.
The income generated by the NHS services reviewed in 2011/2012 represents 86% of the total income generated from the provision of NHS services by the Portsmouth Hospitals NHS Trust for 2011/2012. Participation in clinical audits During 2011/2012, 43 national clinical audits and 4 national confidential enquiries covered NHS services that Portsmouth Hospitals NHS Trust provides. During that period Portsmouth Hospitals NHS Trust participated in 95% (41/43) national clinical audits and 100% (4/4) national confidential enquiries of the national clinical audits and national confidential enquiries which it was eligible to participate in. Portsmouth Hospital Trust participated in all eligible National Audits in 2011/12 except:
• Stroke Improvement National Audit Programme (SINAP). There were two Stroke audits running concurrently and the Trust decided to participate in the Sentinel Stroke National Audit. These two audits have now been combined and we will be participating in the joint audit in 2012.
• Risk Factors (National Health Promotion in Hospitals) audit.
The national clinical audits and national confidential enquiries that Portsmouth Hospitals NHS Trust participated in, and for which data collection was completed during 2011/2012, are listed below alongside the number of cases submitted to each audit or enquiry as a percentage of the number of registered cases required by the terms of that audit or enquiry.
National clinical audits and national confidential enquiries that Portsmouth Hospitals NHS Trust participated in during 2011/2012
Audit Participation % cases submitted
National Clinical Audits
British Thoracic Society - Adult Asthma � 100%
British Thoracic Society - Adult Community acquired Pneumonia � 100%
British Thoracic Society - Bronchiectasis � 100%
British Thoracic Society - Non Invasive Ventilation (NIV) � 100%
British Thoracic Society - Paediatric Asthma � 100%
British Thoracic Society - Paediatric Pneumonia � 100%

Portsmouth Hospitals NHS Trust QUALITY ACCOUNTS 2011/2012
Statement of assurance from the Board
Portsmouth Hospitals NHS Trust – Quality Accounts 2011/2012 Page 16 of 60
Audit Participation % cases submitted
British Thoracic Society - Pleural Procedures � 100%
British Thoracic Society - Emergency use of Oxygen � 100%
Bedside Transfusion � 100%
Medical Use of Blood � 100%
Bowel Cancer (NBOCAP) � 100%
Head & Neck Cancer (DAHNO) � 100%
National Lung Audit - (LUCADA) � 100%
National Oesophago-Gastric Cancer Audit (NOGCA) Organisational � 100%
Severe sepsis and septic shock � 100%
Cardiac Rhythm Mgt (pacing/implantable defibrillators) � 100%
Coronary Interventions - BCIS (e.g. angioplasty, opening up heart artery) � 100%
Heart Failure � 51%
National Neonatal Audit Programme (NNAP) � 100%
ICNARC - Cardiac Arrest � 100%
Paediatric Diabetes audit (RCPCH) � 100%
National Joint Registry (NJR) � 50%
National Pain Database Audit � 100%
Seizure Management in Hospitals (NASH) � 100%
UK IBD (Inflammatory Bowel Disease) � 95%
Renal Registry - Renal Replacement Therapy � 100%
Childhood Epilepsy (RCPCH) � 100%
Parkinson's Disease � 100%
National Care of the Dying Audit - Hospitals � 100%
Patient Related Outcome Measures – Hip � 66.6%
Patient Related Outcome Measures – Knee � 70.2%
Patient Related Outcome Measures – Hernia � 88%
Patient Related Outcome Measures – Varicose Veins � 106.3%
National Hip Fracture Database (NHFD) � 100%
Severe Trauma (Trauma Audit & Research Network) � 100%
Renal Transplantation (Transplant Registry) � 100%
Potential Donor Audit (NHSBT) � 100%
Heavy Menstrual Bleeding � 100%
Myocardial Infarction Project (MINAP) � 99%
Perinatal Mortality (MPMN) � 100%
ICNARC - Adult Critical Care � 100%
Carotid Interventions � >95%
Peripheral Vascular Surgery � >95%
Pain Management (College of Emergency Medicine) � 100%
National Confidential Enquiry into Patient Outcome and Death (NCEPOD)

Portsmouth Hospitals NHS Trust QUALITY ACCOUNTS 2011/2012
Statement of assurance from the Board
Portsmouth Hospitals NHS Trust – Quality Accounts 2011/2012 Page 17 of 60
Audit Participation % cases submitted
Bariatric Surgery � 100%
Cardiac Arrest Procedures � 100%
Peri-operative Care � 100%
Surgery In Children � 100%
The reports of 44 national clinical audits were reviewed by the provider in 2011/2012 and examples of national audits and actions to improve quality can be seen in the table below:
National clinical audits
Audit 1Reviewed by Trust Board Actions taken
British Thoracic Society – Non Invasive Ventilation. This audit was set against the Guideline of Non-invasive Positive Pressure Ventilation (NIPPV) in Acute Respiratory Failure: British Thoracic Society Standards of Care.
September 2011
Our results were very much in line with national data. Key improvement actions included: • Referral for pulmonary rehabilitation after
admission, and • Issue of an oxygen card. An oxygen card for South Central is now under development. Pulmonary rehabilitation is being addressed through the appointment of a new Chronic Obstructive Pulmonary Disease (COPD) nurse specialist.
Sentinel Stroke Audit To audit against the National Clinical Guidelines for Stroke
April 2011 We have developed a stroke unit which has significantly improved patient care and have an action plan to further improve the direct admissions to this unit to 90%: as required by the audit standards.
Dementia The aim of the audit was to examine the quality of care received by people with dementia in a general hospital.
February 2012 The results from this national audit demonstrated improvements were required. We have set up a dementia strategy group to further improve on the recommendations and have developed an action plan and a dementia strategy to progress the work required.
The National Hip Fracture Database An audit of hip fracture and secondary care prevention.
September 2011
Audit results show that we provide one of the best clinical services for patients with a fractured neck of femur in the UK. We provide: • A rapid access and multi-disciplinary
service of the very highest quality. • The highest quality medical and surgical
expertise to a population of patients with a high co-morbidity and still provides good outcomes.
• Nursing care that has resulted in the lowest incidence of pressure ulcers in the SHA in spite of the co-morbidity of the patients.
In addition, we achieved one of the lowest lengths of acute hospital stay for this group of patients and can demonstrate that more
1 The Board has delegated the responsibility of reviewing national and local clinical audits to the Audit Committee and Clinical Effectiveness Steering Group.

Portsmouth Hospitals NHS Trust QUALITY ACCOUNTS 2011/2012
Statement of assurance from the Board
Portsmouth Hospitals NHS Trust – Quality Accounts 2011/2012 Page 18 of 60
National clinical audits
Audit 1Reviewed by Trust Board Actions taken
patients returned to their own home following discharge than nearly any other hospital in the UK.
Emergency Use of Oxygen The audit was set against the British Thoracic Society Emergency Use of Oxygen guidelines.
January 2012 An issue was identified with the prescription of oxygen therapy. As a result an updated oxygen prescription chart has been developed and is being piloted. Staff competencies have also been developed to roll out with the new prescription chart.
The reports of 64 local clinical audits were reviewed by the provider in 2011/2012 and Portsmouth Hospitals NHS Trust intends to take the following actions to improve the quality of healthcare provided. Examples of local audits and actions taken to improve quality can be seen in the table below.
Local clinical audits
Audit Reviewed by Trust Board
Actions to be taken
Antipsychotic use in acute confusion and behavioural disturbance in elderly patients in hospital
February 2012
Regular anti-psychotics were found to be prescribed in appropriate doses and routes. Our guideline on the drug management of acute confusion in older persons has been reviewed and updated as a result of the audit. A link to the guidance will be included on the junior doctor information cards. Information from this audit was positively received at SHA level (very few Trusts had specific information around anti-psychotic use). Re-audit planned for 2012.
Laparoscopic cholecystectomy in the obese patient
October 2011
This audit has been presented at the British Association of Day Surgery Annual Conference and published in the Journal of One Day Surgery 2011. This confirmed that our policy to operate on obese patients as day cases to be correct and safe, with no difference in outcomes compared to non-obese patients. We have now revised our criteria for day-case surgery so as not to exclude patients on weight alone.
Acutely ill patients in hospital – NICE Clinical Guideline (50)
June 2011 Local audit of 190 emergency admissions to the Intensive Care Unit identified the following actions: All patients to have an early warning score done on admission and better documentation of a monitoring plan. Improved documentation of actions taken for those patients triggering above a score of 6. A trust-wide audit to be undertaken in 2012.
Research: participation in clinical research Commitment to research as a driver for improving th e quality of care and patient experience The number of patients receiving NHS services provided or sub-contracted by Portsmouth Hospitals NHS Trust in 2011/2012, that were recruited during that period to participate in research approved by a research ethics committee was 3,897. Of these patients, 3,305 (84%) were recruited into clinical studies adopted onto the National Institute for Health Research (NIHR) Portfolio, with 592 (15%) recruited into other, non-Portfolio research projects. Participation in clinical research demonstrates Portsmouth Hospitals NHS Trust’s commitment to improving the quality of care that we offer and to making our contribution to wider health

Portsmouth Hospitals NHS Trust QUALITY ACCOUNTS 2011/2012
Statement of assurance from the Board
Portsmouth Hospitals NHS Trust – Quality Accounts 2011/2012 Page 19 of 60
improvement. Our clinical staff stay abreast of the latest possible treatment possibilities and active participation in research leads to successful patient outcomes. During 2011/2012, Portsmouth Hospitals NHS Trust has participated in a total of 338 clinical research studies, which is an overall increase of 18% compared with 2010/2011. 242 (72%) of these studies were NIHR Portfolio adopted studies which shows that an increased proportion of our activity is now adopted by the NIHR (66%% 2010-2011). There was a total of 303 clinical staff participating in research approved by a research ethics committee at Portsmouth Hospitals NHS Trust during 2011/2012. These staff participated in research covering 26 medical specialties and a number of clinical support departments. Our involvement in NIHR research shows our commitment to high-quality, NHS-focussed research, and our desire to improve patient outcomes and experience across the NHS. Our engagement with clinical research also demonstrates Portsmouth Hospitals NHS Trust commitment to offering patient’s opportunities to help evaluate the very latest medical treatments and techniques. This commitment is affirmed in our 5 strategic goals, which were approved by the Trust’s Senior Management Team in January 2011. In November 2011 the Trust was highly commended in the Health Services Journal Awards for its step-change in research culture.
Research activity summary
Total NIHR Supported (*As % of total)
Research Activity 2009 -
2010
2010 -
2011
2011 -
2012
Increase 10-11: 11-12
2009 -
2010*
2010 -
2011
2011 -
2012
Increase 10-11: 11-12
New Projects Submitted to PHT R&D
114 104 115 10.5% Unknown Unknown 76
(66%) Unknown
Total Projects Approved to Start 74 93 87 -6.5% 49 (66%) 66 (71%) 73
(83%) 10.6%
Total Projects Ongoing 243 287 338 18% 142 (57%)
190 (66%)
242 (72%) 27%
Currently Active and Open to Recruitment at the end of the year
179 187 205 9.6% 98 (55%) 124 (66%)
162 (79%) 30.6%
Currently Active and in Follow-Up @ end of the year 49 49 65 32.6% 44 (90%) 39 (80%)
44 (67%) 13%
Active but Completed during the year 15 51 68 33% 1 (7%) 27 (53%)
36 (53%) 33%
Accruals/Recruitment
Actual Accruals 3268 5482 3897 -29% 3136 (96%)
3764 (69%)
3305 (85%)
-12%
Goals agreed with Commissioners Portsmouth Hospitals NHS Trust income in 2011/2012 was not conditional on achieving quality improvement and innovation goals agreed through the Commissioning for Quality and Innovation (CQUIN) payment framework. In exchange for us accepting a limit on the funding available for activity carried out, it was agreed that financial penalties attached to CQUINs would not be enacted. However, we continue to target improvements in quality.

Portsmouth Hospitals NHS Trust QUALITY ACCOUNTS 2011/2012
Statement of assurance from the Board
Portsmouth Hospitals NHS Trust – Quality Accounts 2011/2012 Page 20 of 60
Statements from the Care Quality Commission Portsmouth Hospitals NHS Trust is required to register with the Care Quality Commission and its current registration status is ‘registered’. Portsmouth Hospitals NHS Trust has no conditions upon its registration. The Care Quality Commission has not taken any enforcement action against Portsmouth Hospitals NHS Trust during 2011/12. Following the publication of the Parliamentary and Health Service Ombudsman report ‘Care and compassion?’ (February 2011), the CQC undertook an inspection programme – dignity and nutrition for older people. We received an unannounced visit on the 12th April 2011 as part of this programme. This looked at Outcome 1 (respecting and involving people) and Outcome 5 (meeting nutritional needs). Overall the CQC found that Queen Alexandra Hospital was meeting both of the essential standards reviewed but to maintain compliance the CQC recommended improvements. As a result, we developed and implemented an action plan to address the recommended improvements and this was monitored through the Governance and Quality Committee. On the 23rd and 26th May 2011, the CQC undertook a responsive review of compliance. The table below shows the outcomes reviewed and the compliance awarded:
Outcome CQC Assessed compliance
Care and welfare of people who use services (outcome 4) Moderate concern
Co-operating with other providers (outcome 6) Compliant *
Safeguarding people who use services from abuse (outcome 7) Compliant *
Cleanliness and infection control (outcome 8) Compliant
Management of medicines (outcome 9) Moderate concern
Staffing (outcome 13) Compliant *
Assessing and monitoring the quality of service provision (outcome 16) Compliant * Compliant with improvement actions to ensure on-going compliance
The CQC action plan was further updated to reflect the additional actions required to ensure on-going compliance and, again this was monitored through the Governance and Quality Committee. Following our earlier CQC inspections a follow-up inspection was undertaken on the 3rd and 4th January 2012. This inspection focused on outcomes 1 (respecting and involving people who use services), 4 (care and welfare of people who use services), 5 (meeting nutritional needs), 9 (medication) and 21 (records). The table below shows the outcomes reviewed and the compliance awarded:
Compliance
Outcome CQC Comment Initial visit 2011
Follow-up visit
2012 1 People should be treated with
respect, involved in discussions about their care and treatment and able to influence how the service is run
People have their dignity and privacy respected and are kept informed about their care and treatment.
Minor concerns
Compliant
4 People should get safe and appropriate care that meets their needs and supports their rights
People generally experience safe and appropriate care, treatment and support that meet their needs and protect their rights. People's needs are assessed and care implemented however the outcomes from risk assessments are not always used to inform care needs
Moderate concerns
Minor concerns

Portsmouth Hospitals NHS Trust QUALITY ACCOUNTS 2011/2012
Statement of assurance from the Board
Portsmouth Hospitals NHS Trust – Quality Accounts 2011/2012 Page 21 of 60
Compliance
Outcome CQC Comment Initial visit 2011
Follow-up visit
2012 5 Food and drink should meet
people's individual dietary needs
People are generally supported to receive adequate nutrition and hydration. There is a planned menu and the patients are able to make choices. However, dietary assessments are not consistently completed and used to inform plans of care to ensure that people's needs are met.
Minor concerns
Minor concerns
9 People should be given the medicines they need when they need them, and in a safe way
On the basis of the evidence provided and the views of people using the services we found the Queen Alexandra Hospital to be compliant with this outcome; however the improvements currently being implemented must continue.
Moderate concerns
Compliant
21 People's personal records, including medical records, should be accurate and kept safe and confidential
People's records are maintained securely and are available when required. Records do not always contain adequate information on assessments and care provided that may put people at risk of their identified needs not being fully met.
Not previously assessed
Moderate concerns
Our action plan has been submitted to the CQC and will be monitored monthly through the Governance and Quality Committee. Data quality Portsmouth Hospitals NHS Trust submitted records during 2011/2012 to the Secondary Uses Service (SUS) for inclusion in the Hospital Episode Statistics (HES) which are included in the latest published data. The percentage of records in the published data:
Monitoring the accuracy of data on our electronic systems is recognised as critical as this supports other quality reporting, monitoring and assurance mechanisms. There is a dedicated Executive Lead for data quality to ensure that this remains high profile. We will be taking the following actions to improve data quality: • An ongoing programme of continuous monitoring of data quality with daily, weekly and monthly
data reviews and reports. A Data Quality Group meets regularly and there is representation from this group on the Trust's Information Governance Steering Group
• A member of the Business Intelligence Team is assigned to lead on data quality and is
responsible for maintaining the Trust Data Quality Policy.
Which included the patient’s valid NHS number was: • 98.2% for admitted patient care (national average 98.8%) • 99.4% for out patient care (national average 99%) • 97.1% for accident and emergency care (national average 93.3%)
Which included the patient’s valid General Medical Practice Code was: • 99.4% for admitted patient care (national average 99.8%)

Portsmouth Hospitals NHS Trust QUALITY ACCOUNTS 2011/2012
Statement of assurance from the Board
Portsmouth Hospitals NHS Trust – Quality Accounts 2011/2012 Page 22 of 60
• 98.6% for out-patient care national average 99.7%) • 99.9% for accident and emergency care (national average 99.4%)
We were subject to a Payment by Results (PbR) clinical coding audit by the Audit Commission and the error rates reported for diagnoses and treatment coding (clinical coding) were:
• Primary Diagnoses Incorrect: 11% (89% accuracy) • Secondary Diagnoses Incorrect: 5.5% (94.5% accuracy) • Primary Procedures Incorrect: 11.1% (88.9% accuracy) • Secondary Procedures Incorrect: 12.2% (87.8% accuracy) • Number of episodes affecting the HRG 10.5%.
We have also achieved 100% completed coding every month since February 2011. At the time of producing this Account, benchmarking data is not available.
Information Governance Toolkit attainment levels Information Governance is concerned with the way we handle or “process” our information. It covers personal information (relating to patients/service users and employees) and corporate information (such as financial and accounting records) and provides a framework for employees to deal consistently with the many different rules about how information is handled. The Information Governance Toolkit is a performance tool produced by the Department of Health. It draws together the legal rules and central guidance and presents them in one place as a set of information governance requirements. We are required to carry out self-assessments of compliance against the requirements. The purpose of the assessment is to enable us to measure our compliance against the law and central guidance and to see whether information is handled correctly and protected from unauthorised access, loss, damage and destruction. Our Information Governance Assessment Report overall score for 2011/2012 was 75% and was graded “Not Satisfactory”. Attainment in the various areas was:
• Information Governance Management 73% • Confidentiality and Data Protection Assurance 92% • Information Security Assurance 62% • Clinical Information Assurance 80% • Secondary Use Assurance 79% • Corporate Information Assurance 77%
The prime requirement for the latest version of the Toolkit was the attainment of Level 2 against all standards, which is needed to achieve “Satisfactory” status. We achieved the necessary Level 2 or Level 3 attainment against 36 of the 45 standards, with one standard at Level 0 and 8 standards at level 1. However, we have increased our compliance from 65% in 2010/11 to 75% in 2011/12, and have identified areas of further improvement for 2012/13:
• Increase in the provision of Information Governance training for staff. • Increased assessment and review of Information Governance (data protection) contractual
clauses with third party ‘data processors’. • Introduction of network security controls for all ‘Information Assets’. • Specific business continuity assessments and user access governance for all ‘Information
Assets’. • Increased audits on the accuracy of service user key data items.

Portsmouth Hospitals NHS Trust QUALITY ACCOUNTS 2011/2012
Statement of assurance from the Board
Portsmouth Hospitals NHS Trust – Quality Accounts 2011/2012 Page 23 of 60
In January 2012, an audit was undertaken on 19 of the 45 standards from the Information Governance Toolkit. The audit focussed on those standards that the Trust had self-assessed as meeting the minimum level of compliance during its mid-year submission (31st October 2011). The audit opinion was Substantial Assurance and noted that “a well controlled system of managing the toolkit completion process was found to be in place, with defined responsibilities for each requirement, as well as each individual action associated with the requirement and projected timescales for completion.” The audit identified seven recommendations. These have either been already completed or planned for completion by the end of May 2012 at the latest.

Portsmouth Hospitals NHS Trust QUALITY ACCOUNTS 2011/2012
Review of quality performance in 2010/2011
Portsmouth Hospitals NHS Trust – Quality Accounts 2011/2012 Page 24 of 60
PART 3: REVIEW OF QUALITY PERFORMANCE This part of the Quality Account provides an overview of the quality improvements achieved by us in 2011/2012. This provides more detail on how we have performed against the priorities set in our 2010/2011 and additional service and quality improvements. We use a variety of ways to monitor quality within the Trust and have linked with the East Midlands Quality Observatory which produces comparative benchmarking quality data. This information provides insight into the quality of services for the public and local NHS. All data contained within this section is correct at the time of producing the Account, but may be subject to change following year-end validation.
PATIENT SAFETY Patient Safety is the process by which an organisation makes patient care safer. This involves: risk assessment; the identification and management of patient-related risks; the reporting and analysis of incidents; and the capacity to learn from and follow-up on incidents and implement solutions to minimise the risk of them recurring.
Patient Safety Incidents (adverse incidents) The reporting of all adverse incidents is vital to help us analyse the type, frequency and severity of incidents and to use that information to make changes to improve care. By learning from adverse incidents we are able to put processes in place to reduce the risk of these being repeated. The table below shows the number of incidents reported, including by severity of harm, in 2011/2012. A comparison is also made to the number of incidents reported in 2010/2011. As can be seen we have seen a reduction in the number of patient safety incidents reported in the year from 9,014 to 8,618. We have also seen a reduction in the number of incidents reported as having had a moderate level of harm (amber) from 407 to 326. TOTAL TRUST - INCIDENTS
Number of Incidents (excluding SIRI) Number of Incidents by Severity 10/11
Period 2011/2012 2010/2011 Near
Miss Green Yellow Amber Amber
April – June 2011 2,118 2,010 164 1,217 644 87 99
July – September 2011 2,111 2,079 191 1,182 670 63 107
October – December 2011 2,327 2,390 188 1,304 719 116 93
January – March 2012 2,062 2,535 140 1,206 656 60 108
Total 8,618 9,014 683 4,909 2,689 326 407
We encourage all staff to report adverse incidents through our incident reporting system and monitor the numbers of patient safety incidents and themes on a monthly and quarterly basis through our Board Quality reports. The CSCs also monitor incidents through their Governance meetings. To make the process of reporting incidents easier and to enable more timely data collection and reporting, we are currently implementing a web-based reporting system: DatixWeb. This will make the reporting of incidents much easier and ‘real-time’, as it will no longer require the completion of paper forms. It will also enable us to gather more in-depth data, which can be used to improve patient and staff safety. The system has been successfully piloted in the Medicine for Older People, Rehabilitation and Stroke Clinical Service Centre, and full roll-out across the organisation is expected to be completed this year.

Portsmouth Hospitals NHS Trust QUALITY ACCOUNTS 2011/2012
Review of quality performance in 2010/2011
Portsmouth Hospitals NHS Trust – Quality Accounts 2011/2012 Page 25 of 60
Serious Incidents requiring investigation (SIRI) Any patient safety incident that is classified as a potentially serious ‘red’ incident is subject to a panel review, within 48 hours of the incident occurring. If the panel determines that a serious incident has occurred a full investigation is undertaken and the report presented to the Serious Incident Review Group (SIRG), where the learning from the incident can be discussed and disseminated. Following SIRG review, the reports and appropriate action plans are submitted to our Commissioners who provide an independent review of the investigation to ensure appropriate actions have been taken. The total number of SIRIs in 2011/2012 is 81 (excluding those relating to infection control) compared to 67 compared in 2010/2011. TOTAL TRUST – SERIOUS INCIDENTS REQUIRING INVESTIGATION
Period 2011/2012 2010/2011
April – June 2011 18 19
July – September 2011 13 12
October – December 2011 20 19
January – March 2012 30 17
Total 81 67
The increase in total SIRI numbers is the impact of reporting pressure ulcers and VTEs as SIRIs. We are not seeing an increase in the number of SIRIs (excluding pressure ulcers and VTE) with 2-3 SIRIs being reported monthly.
A summary on the status of all serious incidents is presented to the Board on a monthly and quarterly basis through our Board Quality reports. This provides the Board with a comprehensive picture of our serious incidents and enables them to consider any further actions or assurance which may be required. Falls Each year around 282,000 patient falls are reported throughout the NHS. Our staff are encouraged to report patient slips/trips and falls as part of the incident reporting system. As part of our priorities for 2011/2012 we said that we would deliver a 10% reduction in falls that result in moderate/severe harm, based on the 2010/2011 data. This meant that we could have no more than 39 amber and red falls incidents in 2011/2012. As can be seen in the table below, there have been 6 less amber and red falls incidents in 2011/12 and therefore, we have achieved the 10% reduction target.
TOTAL TRUST FALLS
Number of falls
incidents Number of Incidents by level of harm
2011/12 2010/11
Period 11/12 10/11 Near Miss Green Yellow Amber Red Amber Red
April – June 2011 573 599 3 385 172 10 1 10 0
July – September 2011 590 658 4 379 202 3 0 11 2
October – December 2011 555 639 2 359 180 10 2 9 0
January – March 2012 596 672 4 356 187 9 2 9 2
TOTAL 2,314 2,568 13 1,479 741 32 5 39 4

Portsmouth Hospitals NHS Trust QUALITY ACCOUNTS 2011/2012
Review of quality performance in 2010/2011
Portsmouth Hospitals NHS Trust – Quality Accounts 2011/2012 Page 26 of 60
A focus on the reduction in falls will continue in 2012/13, with the aim to achieve a further 10% reduction. This means that in 2012/2013 we can have no more than 33 falls (subject to validation) which result in moderate/severe harm. The numbers of patient falls and actions being taken are reported to the Board on a monthly and quarterly basis.
Venous Thrombo-Embolism (VTE) Hospital associated VTE has been identified as a major patient safety issue by the Department of Health (DH). One of the our quality improvement priorities for 2011/12 was to ensure that, in line with the CQUIN indicator requirement, 90% of adult in-patients will receive a risk assessment upon admission. Following the roll-out of the new VitalPac VTE module in May 2011, a dip in compliance with VTE risk assessment was seen. However, from September 2011 we have consistently met the target of 90% compliance with VTE risk assessment for all adult patients on admission to hospital and achieved an overall year end figure of 90.1%.
In 2012/2013 we aim to sustain the risk assessment practice in line with the requirement of CQUIN indicators of 90% compliance with VTE risk assessment and 90% compliance with the provision of appropriate thromboprophylaxis in quarter 1, moving to 92% in quarters 2, 3 and 4. Risk assessment figures will continue to be monitored via Vitalpac apart from Maternity, the Emergency Department where a paper based risk assessment system is in place and in the Critical Care Department which has it’s own electronic data collection system. It is hoped that in time we will also be able to monitor the provision of appropriate thromboprophylaxis via Vitalpac and systems are currently being put in place to initiate this. For the time being however, the CSCs are completing monthly spot check audits to monitor prophylaxis. As well as risk assessment and the provision of thromboprophylaxis, we are required to report on and investigate all cases of hospital associated deep vein thrombosis (DVT) or pulmonary embolism (PE) that is diagnosed on an inpatient or on a patient that has been discharged from hospital within the previous 90 days. We have been collecting Hospital Acquired Thrombosis (HAT) data since January 2010 and in order to achieve a complete data set, improvements have been made in both the method of collection and the process of investigation. Recent guidance from the South Central Medical Director has also initiated a change in the way HAT events are categorised. Now all events where there is not a complete VTE risk assessment documented on admission or where no appropriate thromboprophylaxis was prescribed, are graded as SIRIs. Although this will mean an increase in the overall number of VTE SIRIs reported, it does not mean that the number of events has increased. In order to comply with this guidance a weekly VTE panel has been set up to critically review all HAT events. If appropriate risk assessments and prophylaxis were provided, the event is categorised as unavoidable and no further investigation is necessary. If appropriate care was not provided, the event is reported as a SIRI and a full investigation takes place, the final report is then signed off at the monthly VTE Review Group and learning / action points are disseminated. This new process should enable us to establish both the percentage of hospital associated versus community associated events and the percentage of avoidable versus unavoidable. There are plans to carry out an audit of the events that were classed as unavoidable at the end of the initial six month period to test the reliability of the new process.

Portsmouth Hospitals NHS Trust QUALITY ACCOUNTS 2011/2012
Review of quality performance in 2010/2011
Portsmouth Hospitals NHS Trust – Quality Accounts 2011/2012 Page 27 of 60
Pressure Ulcers A pressure ulcer is damage that occurs on the skin and underlying tissue and is detrimental to patients in terms of their physical, psychological and social wellbeing resulting in a reduction of quality of life. The frequency and incidence of pressure ulcers are recognised as key indicators of the quality of care delivered, and staff are encouraged to report pressure ulcers, including their grade, as part of the incident reporting system. The table below demonstrates that there has been a significant increase in the reporting of all pressure ulcers since the increase in focus from October 2009. Despite an increase in overall total of reported pressure ulcers, there has been a reduction in the incidents of severity of harm. We have seen less variation this year in relation to the number of reported pressure ulcers each month with most months averaging 4. February 2012 saw higher levels reported, this is related to an increase in overall activity within the Trust. We have successfully met the required 25% reduction target for grade 3 and 4 pressure ulcers (Grade 3 and 4 pressure ulcers are reported as reds), with a total of 44 being reported against a maximum of 57.
TOTAL TRUST PRESSURE ULCERS
Number of
pressure ulcer incidents
Number of Incidents by level of harm 10/11
Period 11/12 10/11 Near Miss Green Yellow Amber Red Amber Red
April – June 2011 231 212 0 4 216 0 11 19 10
July – September 2011 190 179 0 3 182 0 5 15 5
October – December 2011 231 229 0 5 215 0 11 0 11
January – March 2012 192 289 0 1 174 0 17 0 15
TOTAL 844 909 0 13 787 0 44 34 41
We have worked hard this year to ensure greater availability of pressure relieving mattresses to vulnerable patients, this has proved very successful and as a result of improved processes there is currently no wait time for these mattresses. These improvements will particularly benefit emergency patients within the crucial first 24 hours of their stay. A plan is in place for a review of our Pressure Ulcer Prevention and Management Strategy to ensure the continued focus on early identification of patients at risk and appropriate prevention strategies. The review will be focused on the early identification and treatment of pressure ulcers graded and 1 and 2. We will continue to focus on reducing the numbers of grade 3 and 4 pressure ulcers and aim to deliver a 15% reduction in 2012/13. This means that in 2012/2013 we can have no more than 38 hospital acquired grade 3 and 4 pressure ulcers. Compliance will be monitored and reported to the Board monthly.
Medication Unintended errors in the prescription, administration and reconciliation of medicines account for a significant proportion of harm caused to patients within the healthcare environment. An increase in reporting of all types of medication related incidents has been seen over 2011/2012. This is thought to be due to an increased awareness of medication safety issues and heightened awareness of the need to report following focussed work in particular areas. Medication errors will continue to be monitored closely to ensure detailed analysis of any further increase in reporting.
Portsmouth Hospitals NHS Trust QUALITY ACCOUNTS 2011/2012
Review of quality performance in 2010/2011
Portsmouth Hospitals NHS Trust – Quality Accounts 2011/2012 Page 28 of 60
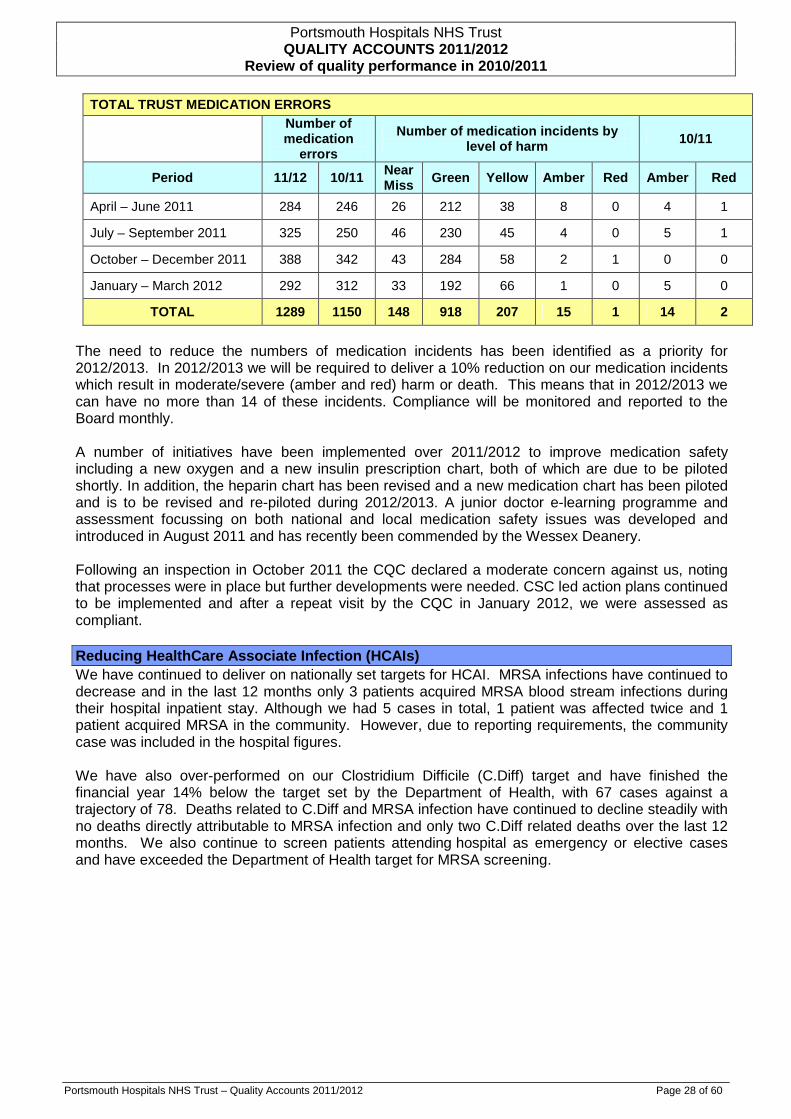
TOTAL TRUST MEDICATION ERRORS
Number of medication
errors
Number of medication incidents by level of harm 10/11
Period 11/12 10/11 Near Miss Green Yellow Amber Red Amber Red
April – June 2011 284 246 26 212 38 8 0 4 1
July – September 2011 325 250 46 230 45 4 0 5 1
October – December 2011 388 342 43 284 58 2 1 0 0
January – March 2012 292 312 33 192 66 1 0 5 0
TOTAL 1289 1150 148 918 207 15 1 14 2
The need to reduce the numbers of medication incidents has been identified as a priority for 2012/2013. In 2012/2013 we will be required to deliver a 10% reduction on our medication incidents which result in moderate/severe (amber and red) harm or death. This means that in 2012/2013 we can have no more than 14 of these incidents. Compliance will be monitored and reported to the Board monthly.
A number of initiatives have been implemented over 2011/2012 to improve medication safety including a new oxygen and a new insulin prescription chart, both of which are due to be piloted shortly. In addition, the heparin chart has been revised and a new medication chart has been piloted and is to be revised and re-piloted during 2012/2013. A junior doctor e-learning programme and assessment focussing on both national and local medication safety issues was developed and introduced in August 2011 and has recently been commended by the Wessex Deanery. Following an inspection in October 2011 the CQC declared a moderate concern against us, noting that processes were in place but further developments were needed. CSC led action plans continued to be implemented and after a repeat visit by the CQC in January 2012, we were assessed as compliant.
Reducing HealthCare Associate Infection (HCAIs) We have continued to deliver on nationally set targets for HCAI. MRSA infections have continued to decrease and in the last 12 months only 3 patients acquired MRSA blood stream infections during their hospital inpatient stay. Although we had 5 cases in total, 1 patient was affected twice and 1 patient acquired MRSA in the community. However, due to reporting requirements, the community case was included in the hospital figures. We have also over-performed on our Clostridium Difficile (C.Diff) target and have finished the financial year 14% below the target set by the Department of Health, with 67 cases against a trajectory of 78. Deaths related to C.Diff and MRSA infection have continued to decline steadily with no deaths directly attributable to MRSA infection and only two C.Diff related deaths over the last 12 months. We also continue to screen patients attending hospital as emergency or elective cases and have exceeded the Department of Health target for MRSA screening.
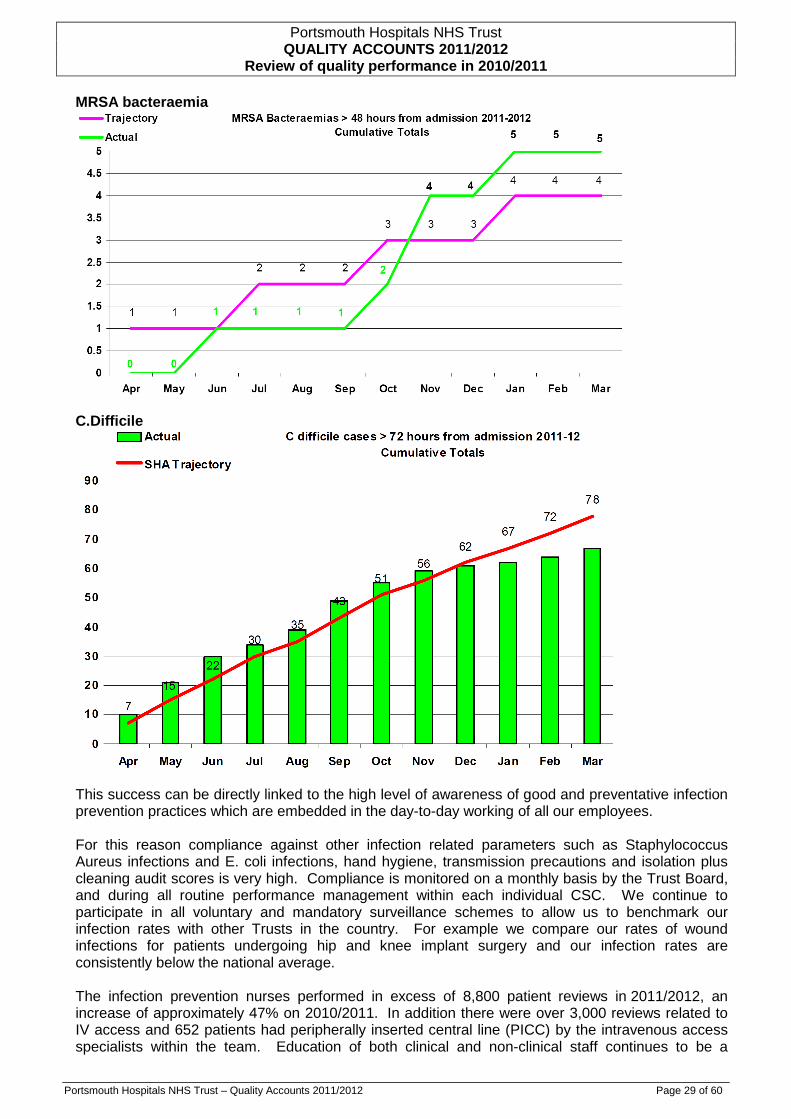
Portsmouth Hospitals NHS Trust QUALITY ACCOUNTS 2011/2012
Review of quality performance in 2010/2011
Portsmouth Hospitals NHS Trust – Quality Accounts 2011/2012 Page 29 of 60
MRSA bacteraemia
C.Difficile
This success can be directly linked to the high level of awareness of good and preventative infection prevention practices which are embedded in the day-to-day working of all our employees. For this reason compliance against other infection related parameters such as Staphylococcus Aureus infections and E. coli infections, hand hygiene, transmission precautions and isolation plus cleaning audit scores is very high. Compliance is monitored on a monthly basis by the Trust Board, and during all routine performance management within each individual CSC. We continue to participate in all voluntary and mandatory surveillance schemes to allow us to benchmark our infection rates with other Trusts in the country. For example we compare our rates of wound infections for patients undergoing hip and knee implant surgery and our infection rates are consistently below the national average. The infection prevention nurses performed in excess of 8,800 patient reviews in 2011/2012, an increase of approximately 47% on 2010/2011. In addition there were over 3,000 reviews related to IV access and 652 patients had peripherally inserted central line (PICC) by the intravenous access specialists within the team. Education of both clinical and non-clinical staff continues to be a

Portsmouth Hospitals NHS Trust QUALITY ACCOUNTS 2011/2012
Review of quality performance in 2010/2011
Portsmouth Hospitals NHS Trust – Quality Accounts 2011/2012 Page 30 of 60
fundamental function of the team, with participation in mandatory and voluntary education programmes and study days. There continues to be a strong culture of innovation within the Infection Prevention and Control (IPC) Team. The innovative work in terms of IV access carried out by the team in the last 7 years has now been embedded as standard practice within most IV access teams throughout the country. The development of real-time infection prevention management software has resulted in a commercially viable product called ‘IPC- Manager’. This software was developed by our IPC Team in collaboration with ‘The Learning Clinic’ based in London. The software works alongside VitalPAC and allows the real time integration of laboratory results with patient data gathered at the bedside. The software flags any individual with a positive result and the IPC Team can rapidly review the patient and ensure prompt isolation, reducing the spread of infection and closure of wards due to outbreaks. The end of the year saw the Infection Prevention and Control Team featured in a number of media clips that reported on the team’s new Central Bed Cleaning Service. Every day in excess of 100 beds are deep cleaned to allow every patient admitted to receive a sparkling clean bed. This has done much to increase patient and staff satisfaction and peace of mind. Nutrition Over the last twelve months we have improved malnutrition screening rates in all adult admissions from 75% to 90% with re-screening rates having increased from 77% to 82%. This is a reflection of the number of training events and opportunities provided for staff and the strong audit cycle provided by dietitians and clinical nutrition nurses. We use the Malnutrition Universal Screening Tool (MUST) to screen our adult patients, the Wessex Renal Screening tool for our renal patients and the Screening Tool for the Assessment of Malnutrition in Paediatrics (STAMP) for our paediatric patients. Over the last 12 months an electronic version of the screening tool for adults has been developed and it is anticipated that this will be established in practice during 2012. Other initiatives to support improvement in nutritional status include: an increased number of volunteers who assist at mealtimes; the introduction of a photographic menu for patients who have communication difficulties; and, in conjunction with neighbouring NHS providers and Commissioners we have entered into a new three year contract for specialised dietary products. Productive Series The Productive Series, run through the NHS Institute for Innovation and Improvement, supports NHS teams to redesign and streamline the way they manage and work. This helps achieve significant and lasting improvements, predominately in the extra time given to patients, as well as improving the quality of care delivered whilst reducing costs. Improvements are driven by staff themselves, by empowering them to ask difficult questions about practice and to make positive changes to the way they work. The process promotes a continuous improvement culture leading to real savings in materials, reducing waste and vastly improving staff morale. We have two key Productive work streams: The Productive Operating Theatres (TPOT) and The Productive Ward Releasing Time to Care Bundle (RTtCB). These work streams enable wards and theatres to redesign and streamline the way they manage their area so they improve direct care, quality of care and safe care for the patient. The Releasing Time to Care Bundle over the last year has achieved an overall improvement in the time spent directly caring for patients of 12% for a registered nurse. In addition the wards continue to make changes to their processes and monitor the effectiveness using an electronic clinical dashboard, which reviews the safe quality of care for patients.

Portsmouth Hospitals NHS Trust QUALITY ACCOUNTS 2011/2012
Review of quality performance in 2010/2011
Portsmouth Hospitals NHS Trust – Quality Accounts 2011/2012 Page 31 of 60
The Productive Operating Theatre has continued throughout 2011 and work on the team-working module is currently being undertaken. The team are in the process of organising human factors training and a video for best practice for the World Health Organisation (WHO) surgical checklist, to support safe care. To improve the patient experience of preparing for theatre an electronic pre-assessment is being developed, due for launch in 2012. This work stream has enabled the Theatre teams to improve productivity, stock management and the general safe environment for patients.

Portsmouth Hospitals NHS Trust QUALITY ACCOUNTS 2011/2012
Review of quality performance in 2010/2011
Portsmouth Hospitals NHS Trust – Quality Accounts 2011/2012 Page 32 of 60
PATIENT EXPERIENCE
Patient feedback We have further developed the number of types of feedback systems we can provide for patients and their families. Traditional surveys continue to be used but simpler and quicker methods have been introduced. Our comment cards have been redesigned and provide an opportunity for people to feedback on concerns and compliments. We have also introduced instant feedback systems where people use counters to vote on their experience and are further developing the work to ensure that everyone, no matter what their communication needs are, is enabled to provide us with feedback. We have formed a group with representatives from the black and minority ethnic community, representatives of older people, people with dementia and other mental health issues and people with a learning disability to help us improve how they can feedback their experiences and to support this we were successful in getting a grant to help us buy some computer hardware and software.
National In-Patient Survey The national In-patient survey is carried out each year and measures our performance on patient experience. In 2011, 850 patients were surveyed with 62% responding. This was an increase of 8% on last year’s response rate. The report has provided us with the following results:
How we compare to other Trusts Summary for In-patient survey questions
2010 2011
Our Performance 2 2011 v 2010
For questions about the emergency department answered by emergency patients only About the same About the same
Maintained �
For questions about waiting list and planned admission, answered by those referred to hospital.
About the same About the same Maintained
�
For questions about waiting to get a bed on the ward About the same Better than Improvement
�
For questions about the hospital and ward About the same About the same Improvement
�
For questions about doctors About the same About the same Improvement
�
For questions about nurses About the same About the same Improvement
�
For questions about care and treatment About the same About the same Deterioration
� For questions about operations and procedures, answered by patients who had an operation or procedure
About the same Better than Improvement
�
For questions about leaving hospital About the same Worse than Improvement
�
The National CQUIN for Patient Experience in 2011/2012 required us to increase the scores from 5 key questions contained with the National In-patient survey. These questions are those which are known to be important to patients and where past data indicates that there is room for improvement across England. Our results for 2011 can be seen below, these will be used as a baseline for the 2012/2013 Patient Experience CQUIN indicator.
Question 2011 Q41 Were you involved as much as you wanted to be in decisions about your care and
treatment?
69.3
2 This describes how our performance has changed since the last survey. It is important to note that we may have made an improvement in our own score but may not have made as much improvement as other Trusts and therefore, be worse than them.

Portsmouth Hospitals NHS Trust QUALITY ACCOUNTS 2011/2012
Review of quality performance in 2010/2011
Portsmouth Hospitals NHS Trust – Quality Accounts 2011/2012 Page 33 of 60
Question 2011 Q44
Did you find someone on the hospital staff to talk to about your worries and fears 57.8
Q46 Were you given enough privacy when discussing your condition and treatment? 84.8
Q65 Did a member of staff tell you about medication side effects to watch for when you went home?
45.1
Q70 Did hospital staff tell you who to contact if you were worried about your condition or treatment after you left hospital?
72.5
National Outpatient Survey The CQC national outpatient survey asked patients’ for their experiences following a visit to an outpatient department, between June to October 2011. The survey includes questions on waiting times, hospital facilities, seeing a doctor or other members of staff, tests and treatments and prescribed medications. Responses were received from 510 patients. The last survey was undertaken in 2009. Compared to the 2009 results, of the 34 patient experience questions asked, there was an improvement in 9 questions; deterioration in 2, and 23 remained the same. Deterioration occurred in the questions relating to choice of appointments and doctors answering questions in an understandable way. Answers to two questions showed us to be in the bottom 20% of performing Trusts: choice of appointments and patients receiving copies of letters between hospital doctors and GPs. An action plan to address the areas requiring improvement has been agreed and work is in progress.
How we compare to other trusts Summary for out-patient survey questions
2009 2011 Our Performance 3 2011 v 2009
Before the appointment About the same About the same Maintained �
Waiting About the same About the same Maintained �
Hospital environment and facilities About the same Better than Improved �
Tests and treatment About the same About the same Maintained �
Seeing a doctor About the same About the same Maintained �
Seeing another professional About the same About the same Maintained �
Overall about the appointment About the same About the same Maintained �
Leaving the outpatients department About the same About the same Improved �
Overall impression About the same About the same Maintained �
Engagement and Involvement Our 2011/201 Account detailed specific focus areas: • Improve responses to local and national surveys for questions relating to engagement and
involvement. Our local survey reported an increase from 72% in April 2011 to 91% in February 2012. However, this was not reflected in the initial national report where there was a reduction from 79% to 77% of people feeling involved in decision related to treatment and care.
3 This describes how our performance has changed since the last survey. It is important to note that we may have made an improvement in our own score but may not have made as much improvement as other Trusts.

Portsmouth Hospitals NHS Trust QUALITY ACCOUNTS 2011/2012
Review of quality performance in 2010/2011
Portsmouth Hospitals NHS Trust – Quality Accounts 2011/2012 Page 34 of 60
• Undertake a detailed stakeholder analysis. The stakeholder analysis was completed as part of an overall review of the way we engage with service users, their families and other members of the local community. This led to development of a new framework which aims to ensure more effective and meaningful participation in service and practice development. Recruitment to the new groups which include a Carers Forum and a Patient and Public Involvement Forum has started and the groups are expected to be in place by the end of the summer 2012.
• Increase patient representation on key committees. There has been an increase in requests by the Clinical Service Centres for patient representation on committees. A review to establish which groups require patient representation is scheduled for June 2012.
• Enable difficult to reach groups to participate by adopting different methods of involvement. We have taken advice from representatives from our local community about how best to involve them. For example, adult mental health service users are actively involved in our Mental Health and Learning Disability Committee and will be providing training sessions for clinical staff. Carers of people with a learning disability and those with a physical disability are represented in a working group exploring how we can improve our car parking experience; in response to concerns expressed about the process. People from the Black and Minority Ethnic (BME) community are involved in our accessible surveys project.
• Improve staff and patient communication: The Information Prescription Programme commenced in January 2012. Working with five teams who care for cancer patients and their families, we are using a system which allows for patient specific information to be provided using the national information system. The effectiveness of the programme is being measured and results will be available in July/August 2012. Each month the Chief Executive produces a ‘Team Brief’, designed to inform all staff of key Trust messages. We have implemented a cascade system for this to be distributed to all staff and this process will be further developed to ensure this is fully cascaded. We have worked with the Aston Business School to enhance team working through their ‘high performing team’ programme. Unfortunately, this has not made as much progress as had been hoped and will be re-launched to become a major part of our employee engagement strategy going forward. The Chief Executive also produces a weekly message which is delivered to all staff via e-mail and is also available on the Intranet.
Supporting volunteers We are committed to supporting people from all areas of our local population and one way we have done that is volunteering. We have over 1,000 registered volunteers and have recently recruited a number of volunteers who have specialist mental health or learning disability needs. Our volunteers have supported us in a number of ways, including:
• Hospital guides. • Help with breast feeding mothers. • Assisting patients at mealtimes. • Introducing the use of ‘PAT’ dogs as a form of therapy for
specific patients.
In the coming year, we will be providing specific training for a number of volunteers to support patients with dementia. We aim to achieve the personal objectives of the volunteer alongside enhancing our patient and service user experience. We provide a thorough induction programme and also more specialist training for some voluntary roles. Our volunteers provide a really valuable

Portsmouth Hospitals NHS Trust QUALITY ACCOUNTS 2011/2012
Review of quality performance in 2010/2011
Portsmouth Hospitals NHS Trust – Quality Accounts 2011/2012 Page 35 of 60
contribution to the Trust, and we hope to support them in finding permanent employment, gaining skills and experience for the future, and also simply providing appropriate opportunities for those who just have some spare time and wish to help others. Complaints 579 complaints were received in the year (the final annual report will be published in May 2012). This is a reduction of 344 complaints compared to the same period in 2010/2011 where 923 complaints were received. The table below shows a summary of how we have managed complaints throughout the year:
Indicator Q1 11/12
Q2 11/12
Q3 11/12
Q4 11/12
Number of complaints acknowledged within 3 working days 134 150 154 141
Percentage of complaints acknowledged within 3 working days 100% 100% 100% 100%
Number of complaints by category, CSC/speciality and outcome 134 150 154 141
Number of complaints resolved within the timescale agreed with the complainant 134 150 154 141
Number of complaints referred onto Ombudsman (%) 4 (2.9%)
5 (3.3%)
2 (1.3%)
7 (5%)
Number of complaints upheld by the Ombudsman 0* 0* 0* 0*
Number of complaints not resolved with the complainant within the agreed timescale 0 0 0 0
Percentage of complaints resolved within the timescale agreed with the complainant 100% 100% 100% 100%
* Subject to final validation from the Ombudsman
Complaints Received 2010 - 2011 & 2011 - 2012
0
20
40
60
80
100
120
140
April
May
June Ju
ly
Augus
t
Septe
mber
Octobe
r
Novem
ber
Decem
ber
Janu
ary
Febru
ary
Mar
ch
2011 - 2012
2010 - 2011

Portsmouth Hospitals NHS Trust QUALITY ACCOUNTS 2011/2012
Review of quality performance in 2010/2011
Portsmouth Hospitals NHS Trust – Quality Accounts 2011/2012 Page 36 of 60
Plaudits The collection and analysis of plaudits is an important element of understanding the experience of patients and their families. There has been a consistent effort over the past year to more effectively gather that evidence and the number of plaudits recorded has increased from no formal reporting to reporting on a monthly basis. It has been recognised that there may be some inconsistency in the definition of a plaudit which is defined as praise or enthusiastic approval. A Trust-wide definition has now been developed to ensure a consistent approach. Three key sources of plaudit data are now used: national surveys, the optimum survey system and plaudit correspondence.
National Surveys 2011 • “Staff were sensitive and put themselves out to give individualised care”. • “The care received from my consultant was particularly good. The empathy of the specialist nurse.
The efficiency of the admissions unit. The lovely staff”. • “Informative and friendly communication from the doctor. Good aftercare in the unit”. • “The nursing staff were lovely and very caring”. • “I was very grateful for a smooth operation and excellent care from the department”.
Optimum Survey System • “I was thoroughly impressed with every stage of my treatment. From the paramedics who came to
the scene where I was hit by the car to the nurses in the ward I stayed in. The doctors and nurses in the trauma were extremely helpful and calming. Every single member of staff I encountered was faultless, they were professional, kind, efficient, helpful and knowledgeable”.
• “Apart from the fact that I was in hospital for surgery I can honestly say that it was a pleasant
experience. Having heard from others about QA I was apprehensive about my visit, however on reflection at home it turned out to be an extremely worry free procedure right across the board. Many thanks”
• “I live in the North West of England, however I was working at Portsmouth shipyard when I was
admitted to the hospital as an emergency patient that required surgery. I cannot fault any of the staff that dealt with me during my stay from the Consultant through to the staff who provided tea trolley service, as everyone was very approachable and if asked a question to which they didn't know the answer they would find out or ask someone to speak to me who did know the answer. Excellent hospital”.
• “I was extremely impressed with the excellent service I received from Portsmouth Hospital trust
staff at QA. The Porters were very friendly, considerate and chatty The speed of access to ultra sound scan , Ct scan, xray and to final endoscope treatment was a credit to everyone especially as it was around the festive period. All Staff made every effort to make me feel relaxed and comfortable and fully informed about the diagnosis and treatment which enabled me to be home for Christmas. I would like to thank everyone and hope that somehow through this survey you will be able to communicate my praises and compliments. Thank you”.
Plaudit correspondence
To the nurses and doctors, “Thank you all for your care and attention when I was admitted to Yellow ward on Friday last week (3rd Feb) It turned out to be nothing too serious and I didn’t come in a wheelchair or bed, and I was able to leave in there afternoon, but I was given all the attention as for a more serious case and I am so grateful, as I was worried at the time, You made me feel secure. Even lunch was provided in amongst all the tests and my husband was made welcome too. I’m not very good with remembering names, so forgive me for only remembering Rachel and Louise’s names – But thank you to you all”. Dear Madam “My husband and I are presently attending appointments at your Renal Unit after his kidney transplant and my kidney donation operation two weeks ago. The quality of care we received from

Portsmouth Hospitals NHS Trust QUALITY ACCOUNTS 2011/2012
Review of quality performance in 2010/2011
Portsmouth Hospitals NHS Trust – Quality Accounts 2011/2012 Page 37 of 60
every single person – from student nurse to consultant surgeon/physicians has been exemplary. The whole team are truly wonderful and you have every right to be incredibly proud of the service they give”. Dear Mrs Ward “My sister *** and I would like to thank those concerned at the QA who looked after our 91 year old father – **** – During his stay at the hospital last week. The staff in the Emergency Department, MAU Orange and C5 were most helpful and professional and, throughout his stay Dad was treated with dignity and care. His problem was quickly investigated, a diagnosis was reached and he was released within a few days. We feel very fortunate in having these medical facilities on our doorstep for when they are needed. Thanks also to the ambulance crew involved”. Dear Sir or Madam “I recently underwent a knee replacement operation at the QA hospital and felt I must write and thank everyone involved in my care. The kitchen and cleaning staff, porters and X-Ray team, the physiotherapist and last but not least Mr Ghandi, theatre staff and nurses on D5 ward. All of whom were professional, kind, cheerful and encouraging. I would also like to say how invaluable my “Joint Pathways Guide” has been both while in hospital and since returning home”. Dear Ms Ward “The Skin Cancer Teams – Portsmouth Hospitals NHS Trust. I write to convey my sincere thanks and appreciation to the members of these teams for the excellent level of care and attention I have received from them during the past few months, they are a credit to Portsmouth Hospitals and the NHS. I refer in particular to Dr. S.G Keohane, Dr. Alice Rudd and the other members of this team and Mr Hurren, Dr. Christina Summerhayes, Carol Coley and the other members of this team. My thanks to them all”.
CLINICAL EFFECTIVENESS
Hospital Standardised Mortality Ratio (HSMR) HSMR compares the expected rate of death in a hospital with the actual rate of death. Dr Foster looks at those patients with diagnoses that most commonly result in death, for example, heart attacks, strokes or broken hips. For each group of patients Dr Foster can work out how often, on average, across the whole country, patients survive their stay in hospital, and how often they die. When calculating the rates certain factors are taken into consideration such as the patient’s age, the severity of their illness and other factors, such as whether they live in a more or less deprived area. Dr Foster then compares this with the number of patients that actually die. If the two numbers are the same, the hospital gets a score of 100. If the number of patients who have died is 10% less than expected they get a score of 90. If it is ten per cent higher than expected, they score 110. Care is needed in interpreting HSMR results. HSMRs can be affected by factors such as data quality, coding or the underlying health of different populations. However, trusts with high HSMRs must investigate these to provide assurance that the rate is not linked to issues with care and treatment. Hospitals which have made efforts to improve the safety of care have been shown to succeed in reducing their HSMRs. The graph below shows our HSMR rate for the period April 2011 – January 2012. It can be seen that we have been consistently below the national average.

Portsmouth Hospitals NHS Trust QUALITY ACCOUNTS 2011/2012
Review of quality performance in 2010/2011
Portsmouth Hospitals NHS Trust – Quality Accounts 2011/2012 Page 38 of 60
The Clinical Effectiveness Steering group will continue to monitor HSMR rates in 2012/2013, scrutinising underlying data to ensure action is taken where appropriate. Summary Hospital Standardised Mortality Ratio (SHMI ) Produced by Dr Foster, the SHMI is a hospital-level indicator which reports mortality across the NHS in England using a standard and transparent methodology. Using HSMR and SHMI together can provide a powerful insight into hospital mortality. The key differences in methodology between the two indicators are: • HSMRs reflect only deaths in hospital care whereas SHMI also includes deaths occurring outside
of hospital care within 30 days of discharge. • HSMR focuses on 56 diagnosis groups (about 80 per cent of in hospital deaths) whereas SHMI
includes all diagnosis groups (100 per cent of deaths). • The HSMR makes allowances for palliative care where as the SHMI does not. • Because the SHMI includes deaths up to 30 days after discharge the HSMR is available for a more
recent time period. Hence the previous HSMR chart demonstrating a lower figure (different time period).
The chart below demonstrates our SHMI and HSMR when compared to the national average. The national average is 100 and we are currently 98.85 for SHMI and 99.43 for HSMR; below the national average for both measurements.

Portsmouth Hospitals NHS Trust QUALITY ACCOUNTS 2011/2012
Review of quality performance in 2010/2011
Portsmouth Hospitals NHS Trust – Quality Accounts 2011/2012 Page 39 of 60
In accordance with the NHS Operating Framework for 2012/2013, we will continue to monitor both our HSMR and SHMI rates. Where concerns have been identified, or performance is falling short, we will take appropriate action. This will be monitored through the Clinical Effectiveness Steering Group, and reported to the Board on a quarterly basis.
Early Recognition of the Deteriorating Patient In 2011 the focus has been on understanding the benefits that the roll out of the VitalPAC system across all adult inpatient areas has provided, and to establish systems to measure compliance with the Trust's protocol on monitoring sick patients. Analysis of inpatient mortality between 2004 and 2011 has shown a 10% reduction in mortality associated with the roll out of VitalPAC at the end of 2009. This equates to approximately 150 avoided deaths in a year. However, other work has shown that there is still significant room for improvement, as there is wide variation in compliance with our escalation protocol for sick patients. The plan is now that ward compliance will be tracked quarterly and fed back via the Clinical Service Centres. Expected developments in 2012 include the upgrading of VitalPAC hardware to allow the introduction of VitalPAC Doctor. This would enable nurses to escalate the patient electronically directly to a doctor's mobile device and for the doctor to record their response and actions taken. This should be a major advance for us in providing evidence that we are developing safe systems of care for patients. In the summer 2012 we are expecting an upgraded pain module, which will improve the recording of appropriate and timely responses to ongoing clinically significant pain. Later in the year modules for paediatric and maternity patients should become available. Integration of the automated continuous observations recorded on the Drager monitoring system will be integrated into the VitalPAC vital signs charts later this year. This development should in particular benefit surgical patients on their route through theatres, but it will also mean that the vital signs of any patients on continuous monitoring will be retained in the VitalPAC database as part of the patient's medical record and ensure a more seamless view of the patient's condition.
Patient Reported Outcome Measures (PROMs) PROMs are an opportunity for us to receive direct feedback from our patients on their health gains as a result of surgical intervention. This covers four surgical procedures:
• Hip replacement • Knee replacement
• Groin hernia repair • Varicose vein repair.
A pre-operative questionnaire administered by us is distributed to patients. A follow up questionnaire is administered by the data coordination centre after surgery to measure the outcome or improvements in the patient’s health. The Trust is participating in the national pilot of e-based PROMS reporting in January 2012. This national project will enable the more timely and effective reporting by patients by using the local real-time patient feedback system Optimum. Validated PROMS outcome data is reported annually. The results below are for the period April 2010 – March 2011, published in November 2011. In the charts below, the red dot denotes Trust performance and as can be seen for each procedure, the Trust outcome performance is on or above the national average.

Portsmouth Hospitals NHS Trust QUALITY ACCOUNTS 2011/2012
Review of quality performance in 2010/2011
Portsmouth Hospitals NHS Trust – Quality Accounts 2011/2012 Page 40 of 60
Varicose veins are not reported due to the low number of procedures being undertaken.

Portsmouth Hospitals NHS Trust QUALITY ACCOUNTS 2011/2012
Review of quality performance in 2010/2011
Portsmouth Hospitals NHS Trust – Quality Accounts 2011/2012 Page 41 of 60
NATIONAL QUALITY TARGETS (PERFORMANCE) In 2011/2012 we improved our operational performance on all national and local standards including cancer, stroke and 18 week referral to treatment. Our previously reported waiting time back-log of patients on a waiting list for admitted care for over 18 weeks has been dramatically reduced, from a peak of 1,600 in June 2011 to 480 at the end of March 2012. This was achieved through pro-active management, with all teams supporting the additional work. The numbers of patients waiting over 18 weeks for admitted care has continued to fall, but we acknowledge there remains work to do. By the end of year we were successfully meeting the national target of 90% for those patients requiring in-patient treatment as well as the target of 95% for those needing out-patient treatment within 18 weeks. We strive to ensure that patients coming into the Emergency Department are seen within 4 hours of arrival and we surpassed the 95% target during April to December. However, between January and March 2012, the performance was 89.8%, reflecting a 10% higher attendance rate and the severity of some patients’ conditions.
WORKFORCE
National Staff Survey All healthcare Trusts are mandated to administer the CQC Annual National Staff Survey (NSS) amongst a sample of their workforce. This survey took place between October and December 2011. The NSS measures staff responses to a range of questions relating to different aspects of their working lives. The responses are presented within a report of 38 Key Findings (KF), which are structured around the four pledges to staff contained with the NHS Constitution, plus 2 additional themes:
Staff Pledge 1: To provide all staff with clear roles and responsibilities and rewarding jobs for teams and individuals that make a difference to patients, their families and carers and communities (KF 1 to 9).
Staff Pledge 2: To provide all staff with personal development, access to appropriate training for their jobs and line management support to succeed (Key Findings 10 to 15).
Staff Pledge 3: To provide support and opportunities for staff to maintain their health, well-being and safety (KF 16 to 29).
Staff Pledge 4:
To engage staff in decisions that affect them and the services they provide, individually, through representative organisations and through local partnership working arrangements. All staff will be empowered to put forward ways to deliver better and safer services for patients and their families (KF 30 and 31).
Additional theme: Staff satisfaction (KF 32 to 35).
Additional theme: Equality and diversity (KF 36 to 38).
There have been no changes to the questions between 2010 and 2011 and therefore results can be directly compared. The NSS outcomes provide a measure of the effectiveness of our people management and development practices, staff well-being interventions and overall staff satisfaction and engagement. There is considerable research which demonstrates a direct correlation between these measures and the quality of patient care and service provision, in that highly motivated, engaged and well developed staff will provide a higher quality of service to our patients.

Portsmouth Hospitals NHS Trust QUALITY ACCOUNTS 2011/2012
Review of quality performance in 2010/2011
Portsmouth Hospitals NHS Trust – Quality Accounts 2011/2012 Page 42 of 60
Staff Survey Outcomes 2011 509 Trust staff took part in the 2011 survey. This is a response rate of 63%, which is in the highest 20% of acute Trusts in England, and compares with a response rate, for the Trust, of 59% in 2010, and 46% in 2009. The table below shows our ranking against all acute Trusts in both 2011 and 2010 and a comparison of our own performance between 2010 and 2011. The coloured rating in the 2011 column shows whether our ranking against all acute trusts has improved (green), stayed the same (amber) or deteriorated (red) between the 2010 and 2011 results. In the final column, the table shows our 2011 raw results compared with our raw results for 2010, with a Red, Amber and Green (RAG) rating identifying where there has been a statistically significant improvement, as measured by the CQC.
STAFF SURVEY OUTCOMES 2011
Title Description Ranking - acute Trusts 2011
Ranking – acute Trusts
2010
PHT change in score/rating since
last survey Response
rate 509 staff responses = 63% Best 20% Best 20% ↑ 59% to 63%
KF 1 Staff feeling satisfied with quality of work/patient care able to deliver
Worst 20% Worst 20% ↑ 64% to 68%
(acute Trust average = 74%)
KF 2 Staff agreeing their role makes a difference to patients
Worse than average Worst 20%
→ 89% (acute Trust average =
90%)
KF 3 Staff feeling valued by work colleagues
Average Better than
average ↓ 78% to 76%
KF 4 Quality of job design Average Worse than
average ↑ 3.38 to 3.42 scale
score
KF 5 Work pressure felt by staff Worst 20% Worst 20%
↓ 3.38 to 3.24 scale score
(acute Trust average 3.12)
KF 6 Effective team working Best 20% Average ↑ 3.7 to 3.76 scale
score
KF 7 Trust commitment to work-life balance
Average Worst 20% ↑ 3.3 to 3.33 scale
score
KF 8 Staff working extra hours Best 20% Better than
average ↓ 61% to 59%
KF 9 Staff using flexible working options Average Worse than
average → 61%
KF 10 Staff feeling there are good opportunities to develop potential
Best 20% Worse than
average ↑ 38% to 44%
KF 11 Receiving job-relevant training, learning or development in last 12 months
Better than average
Worse than average
↑ 74% to 79%
KF 12 Staff appraised in last 12 months Better than
average Better than
average ↑ 81% to 84%
KF 13 Well-structured appraisals in last 12 months
Better than average
Worse than average
↑ 30% to 37%
KF 14 Staff appraised with personal development plans
Better than average
Better than average
↑ 68% to 70%
KF 15 Support from immediate managers Better than
average Best 20%
↓ 3.69 to 3.63 scale score
KF 16 Receiving health & safety training in last 12 months
Worse than average
Worse than average
↑ 78% to 79%
KF 17 Staff suffering work-related injury in last 12 months
Best 20% Worse than
average ↓ 18% to 13%
KF 18 Staff suffering work-related stress in last 12 months Best 20%
Worse than average ↓ 31% to 23%
KF 19 Staff saying hand-washing materials always available
Best 20% Worse than
average ↑ 63% to 72%
KF 20 Staff witnessing potentially harmful errors, near misses or incidents
Better than average
Worse than average
↓ 39% to 33%

Portsmouth Hospitals NHS Trust QUALITY ACCOUNTS 2011/2012
Review of quality performance in 2010/2011
Portsmouth Hospitals NHS Trust – Quality Accounts 2011/2012 Page 43 of 60
STAFF SURVEY OUTCOMES 2011
Title Description Ranking - acute Trusts 2011
Ranking – acute Trusts
2010
PHT change in score/rating since
last survey
KF 21 Staff reporting errors, near misses or incidents
Best 20% Average ↑ 97% to 99%
KF 22 Fairness and effectiveness of reporting procedures
Best 20% Average ↑ 3.44 to 3.53 scale
score
KF 23 Experiencing physical violence from patients/relatives
Better than average Average ↓ 8% to 7%
KF 24 Experiencing physical violence from staff
Average Best 20% → 1%
KF 25 Experiencing harassment, bullying or abuse from patients/relatives
Average Worse than
average ↓ 17% to 15%
KF 26 Experiencing harassment, bullying or abuse from staff
Better than average
Best 20% ↑ 12% to 14%
KF 27 Perceptions of effective action from employer towards violence and harassment
Average Better than
average ↑ 3.58 to 3.59 scale
score
KF 28 Impact of health and well-being on ability to perform work or daily activities
Best 20% Better than
average ↓ 1.54 to 1.5 scale
score
KF 29 Staff feeling pressure to attend work when unwell
Average Worst 20% ↓ 31% to 25%
KF 30 Staff reporting good communication between senior management and staff
Average Worse than
average ↑ 24% to 27%
KF 31 Staff able to contribute to improvements at work Average Average ↓ 62% to 61%
KF 32 Staff job satisfaction Average Worse than
average ↑ 3.42 to 3.46 scale
score
KF 33 Staff intention to leave jobs Average Worst 20% ↓ 2.65 to 2.59 scale
score
KF 34 Staff recommendation of the Trust as a place to work or receive treatment
Worse than average
Worst 20%
↑ 3.12 to 3.42 scale score
(acute Trust average 3.5)
KF 35 Staff motivation at work Worse than
average Worst 20%
↑ 3.75 to 3.78 scale score
KF 36 Staff having equality and diversity training
Average Average ↑ 41% to 46%
KF 37 Staff believing Trust provides equal opportunities for career progression
Average Average ↑ 89% to 91%
KF 38 Staff experiencing discrimination at work
Best 20% Average ↓ 13% to 10%
Overall staff engagement Worse than
average Worst 20% ↑ 3.47 to 3.57 scale
score *Deemed to be statistically significant as measured by CQC. An increase or decrease in score in itself may not be statistically significant.
Analysis of Findings compared to 2010 For each of the 38 key findings compared to the 2010 NSS:
• 31 have improved raw scores. • 3 scores have remained unchanged. • 4 scores have deteriorated. • 9 of the 31 scores that improved were deemed to be statistically significant, as measured by the
CQC.

Portsmouth Hospitals NHS Trust QUALITY ACCOUNTS 2011/2012
Review of quality performance in 2010/2011
Portsmouth Hospitals NHS Trust – Quality Accounts 2011/2012 Page 44 of 60
The key findings where staff experience has most significantly improved against the 2010 results are:
• Percentage of staff suffering work-related stress. • Percentage of staff suffering work-related injury. • Percentage of staff witnessing potentially harmful errors, near misses or incidents. • Staff recommendation of the Trust as a place to work or receive treatment.
The remaining 5 key findings that showed a statistically significant improvement are:
• Staff feeling there are good opportunities to develop their potential. • Work pressure felt by staff. • Staff considering they have well-structured appraisals. • Staff saying hand-washing materials are always available. • Perceived fairness and effectiveness of reporting procedures.
There are no key findings where there has been a statistically significant deterioration. Analysis of findings compared to other acute trusts in 2011 For each of the 38 key findings the Trust was ranked as follows:
• Best 20% in ten key findings (compared to three in 2010). • Better than average in eight key findings (compared to six in 2010). • Average in fourteen key findings (compared to eight in 2010). • Worse than average in four key findings (compared to twelve in 2010). • Worst 20% in two key findings (compared to nine in 2010).
The most favourable key findings when compared with other acute Trusts were:
• Percentage of staff reporting errors, near misses or incidents witnessed. • Percentage of staff suffering work-related stress. • Percentage of staff working extra hours. • Percentage of staff suffering work-related injury.
The least favourable key findings when compared with other acute trusts were:
• Percentage of staff feeling satisfied with the quality of work and patient care they are able to deliver; an improvement of 4% on 2010.
• Work pressure felt by staff; an improvement on the scale score of 0.14, which is deemed to be a statistically significant improvement.
• Percentage of staff agreeing that their role makes a difference to patients; no change on 2010. • Staff recommendation of the Trust as a place to work or receive treatment; an improvement on
the scale score of 0.3, which is deemed to be a statistically significant improvement. Overall Staff Engagement The overall indicator of staff engagement is calculated using the questions that make up key findings 31 (staff perceived ability to contribute to improvements at work), 34 (their willingness to recommend the Trust as a place to work or receive treatment) and 35 (the extent to which they feel motivated). In 2011 we scored 3.57, compared to 3.47 in 2010. This is deemed to be a statistically significant improvement and means we are no longer in the lower 20% of Trusts. Conclusion There has been significant improvement in the 2011 NSS performance, compared to our results in 2010, and other acute Trusts. The specific actions designed to address the outcomes of the 2010 survey have clearly had a positive impact. The Trust has performed best against staff pledges 2 and 3: personal development, access to job-relevant training and line management support, and providing support and opportunities for staff to improve their health, well-being and safety. Clearly, there is still room for improvement in other areas, on which our action plan will focus.

Portsmouth Hospitals NHS Trust QUALITY ACCOUNTS 2011/2012
Review of quality performance in 2010/2011
Portsmouth Hospitals NHS Trust – Quality Accounts 2011/2012 Page 45 of 60
Next steps • Analyse, present and communicate survey findings by CSC and corporate functions. • CSCs and corporate functions to hold facilitated group sessions with staff to identify the key
actions that need to be undertaken in order to make us a great place to work and learn.
• CSC action plans to be reviewed at monthly performance reviews with the Executive Management Team (EMT).
• Further development of the Team Brief cascade to ensure ongoing review and update of CSC
action plans; utilising internal pulse survey results to help facilitate this dialogue with staff.
• CSC feedback on action plans and deployment to be presented to Trust Board. Planning and developing the workforce We have a workforce planning process in place as part of the business planning cycle, in order to ensure our high quality and affordable services are maintained. These plans have been developed by CSC Management teams and supported by the HR Business Partners and the Workforce Intelligence and Planning function of the Workforce Directorate. They incorporate the workforce element of Cost Improvement Plans (CIPs). These plans are to be approved by the EMT and Trust Board; CSCs will then be monitored and managed as appropriate against their achievement of these plans. This will form part of our performance review process. The chart below shows temporary workforce expenditure over the past year. Temporary workforce expenditure increased in January, February and March 2012 as a result of additional winter beds opened to manage the higher seasonal demand placed upon medical services at this time and also in order to meet our Referral to Treatment targets. Workforce budgets have been aligned to reflect the anticipated activity levels, to enable services to recruit substantively within budget, thereby reducing expensive temporary expenditure further.
Temporary Workforce Expenditure in Portsmouth Hospi tals NHS Trust 2011/12 (£000s)
0
500
1,000
1,500
2,000
2,500
Mar-11
Apr-11
May-11
Jun-11
Jul-11
Aug-11
Sep-11
Oct-11
Nov-11
Dec-11
Jan-12
Feb-12
Mar-12
Date
£000
s
The chart below shows turnover rate. Turnover has decreased from 9.2% in March 2010 to 8.1% in March 2011. Workforce information is collated primarily through the Electronic Staff Record, with additional systems in place for measuring temporary workforce expenditure, including finance information, exception reporting, and external reporting systems such as NHS Professionals. This information is developed into a workforce dashboard and indicators which display staffing levels, both substantive and temporary, staff costs, absence levels, turnover, appraisal rates and essential skills at CSC level and Trust level. This is used to monitor and performance manage the progress of individual CSCs and is challenged at Performance Review Meetings with the EMT on a monthly basis. Progress is reported monthly to the Board.

Portsmouth Hospitals NHS Trust QUALITY ACCOUNTS 2011/2012
Review of quality performance in 2010/2011
Portsmouth Hospitals NHS Trust – Quality Accounts 2011/2012 Page 46 of 60
Turnover Rate in Portsmouth Hospitals NHS Trust 201 1/12 (%)
0.0%
5.0%
10.0%
15.0%
20.0%
Mar-11
Apr-11
May-11
Jun-11
Jul-11
Aug-11
Sep-11
Oct-11
Nov-11
Dec-11
Jan-12
Feb-12
Mar-12
Date
Tur
nove
r R
ate
%
Staff appraisal The percentage of staff appraised in the last 12 months has increased to 86%, from 72% in 2011.
Health and Wellbeing A Management of Attendance Action group (MAAG) was instigated in April 2010 to address the high levels of absence related to staff health and well-being. The objective was to support staff to return to work, reduce absence levels and empathetically exit those staff who could no longer work for us. Support is through making reasonable adjustments to the workplace, through family friendly policies and fast tracking for musculoskeletal and stress related illness. In February 2012 absence is reporting at 3.2% compared with the 4% national NHS target.
Absence Rate in Portsmouth Hospitals NHS Trust 2011 /12 (%)
3.0%
3.2%
3.4%
3.6%
3.8%
4.0%
Mar-11
Apr-11
May-11
Jun-11
Jul-11
Aug-11
Sep-11
Oct-11
Nov-11
Dec-11
Jan-12
Feb-12
Mar-12
Date
Abs
ence
Rat
e %
The Trust has a whistleblowing policy and encourages staff to raise any concerns. We had one whistleblowing letter between 1st April 2011 – 31st March 2012 from a non staff member regarding a member of staff. The case was referred to Counter Fraud but no evidence was found and the case closed. There have been no whistleblowing calls or emails.

Portsmouth Hospitals NHS Trust QUALITY ACCOUNTS 2011/2012
Review of quality performance in 2010/2011
Portsmouth Hospitals NHS Trust – Quality Accounts 2011/2012 Page 47 of 60
2011/2012 CLINICAL SERVICE CENTRE QUALITY IMPROVEME NT HIGHLIGHTS Each of our CSCs has made a number of service improvements over the year some of these are highlighted below:
Theatres, Anaesthetics and Critical Care Critical Care Continues to participate in a number of local, national and international research studies to improve patient care and outcomes. A small multidisciplinary team facilitates these studies but everyone; patients, their relatives and all staff, contribute. We enrolled the first patient nationally on a study evaluating the best way to feed patients in Critical Care. The Hospital Sterilisation and Disinfection Unit (H SDU) The HSDU passed its Medical Device Directive and ISO accreditation following assessment visits from BSI, with no non-conformities raised against their performance. This demonstrates that safe and effective decontamination processes that are established within the unit. Theatres, Pre-Operative Assessment, Theatre Admissi ons and Day Surgery The Productive Operating Theatre Programme (TPOT), a national project from the Institute of Innovation, was launched in Theatres in October 2010, and is supported by the Strategic Health Authority (SHA). The programme is designed to improve the patient experience through quality, efficiency and staff engagement initiatives. The pilot across the Head and Neck Theatres is now being rolled out across the Orthopaedic Theatres. Examples where staff have made changes include:
• A better organised working environment with improved equipment storage and reduced consumable stock levels.
• Introduction of a twice daily meeting for theatre co-ordinators to improve communication and management of day-to-day issues, thereby avoiding delays or cancellations of surgery.
Department of Anaesthesia Association of Paediatric Anaesthetists: The Association of Paediatric Anaesthetists peer review team, visited the department on the 14th October 2011, to complete an assessment of the standards of care for children having surgery. Feedback was very positive and demonstrated good organisation, leadership, appropriate training and governance. The dedicated paediatric waiting room, two operating theatres and 'excellent' recovery room environment were particularly commended.
Clinical Support Services Non-Clinical Quality achievements The CSC has consistently achieved 100% in completion of coding and a typing turnaround of 5 days or under over the last financial year. The availability of patient medical records has averaged in excess of 99% for the 2011/12 Clinical Quality Achievements • Imaging: Consistent achievement of stroke CT scanning targets: 50% in 1 hour and 95% in 24
hours. • VTE: Introduction of a new reporting and management process for hospital acquired thrombosis
that increases the effectiveness of the process and improves learning. • Pressure Ulcers: Achievement of an organisation-wide 25% reduction in pressure ulcers at
grade 3 and 4. • Dietetics: Successful delivery of tier 3 obesity services. • Diagnostics: A reduction in month end diagnostic breaches: 145 per month in April 2011 to 0 in
January 2012. • CSC overall – Achieved a 50% reduction in complaints

Portsmouth Hospitals NHS Trust QUALITY ACCOUNTS 2011/2012
Review of quality performance in 2010/2011
Portsmouth Hospitals NHS Trust – Quality Accounts 2011/2012 Page 48 of 60
Emergency and Acute Medicine The Emergency Department was successful in winning the Nursing Times and critical care award for a simple method of improving the experience of bereaved relatives. The department introduced a display of pictures of butterflies as a way of creating calm in a busy environment for those who have just lost a relative. The idea, which was inspired by the personal experience of one staff nurse, has proved to be extremely effective, receiving positive feedback from relatives and staff. The idea is easily transferable to other wards and departments for little or no cost and has helped to enhance this fundamental aspect of nursing care. Head and Neck The CSC had a lot of issues raised through the Patient Advice and Liaison Service (PALS) relating to communication. These related from people being unable to get through on the telephone to poor communication skills generally. Following this the CSC implemented a central telephone service for all specialties within the CSC. There are three telephones which are manned 08.30 to 4.30 daily. Patients contacting the department all use the same number and are given options to guide them to the correct line. Staff now answer the calls in a more timely way and this has led to a significant reduction in their PALS contacts relating to communication. Customer care training has also been undertaken by the team. Following a very kind and generous donation from a patient’s family, the CSC set up a quiet room, which provides a quiet area away from the clinical setting to break bad news and discuss treatment options. Medicine Alcohol Specialist Nursing Service: In-line with patient need, a model has been developed to deliver a 7 day per week nurse-led outpatient service for patients with alcohol dependency, and for supporting inpatients during their admission. The team also provide a significant amount of formal and informal staff training across the hospital. To support the increase of referrals, Portsmouth City has funded the development of VitalPac to incorporate alcohol screening. The total number of registered referrals to the team in the first year was 1,482, 52 of which are regular attenders. The team have delivered a significant reduction in length of stay and high numbers of admissions have been avoided. There has been the initiation of a Hampshire pilot to accelerate the discharge process for patients at the end of their life, ensuring that patients who wish to die out of hospital are quickly transferred to the most appropriate setting.
Medicine for Older People, Rehabilitation and Strok e The Older People's Partnership project continues working towards the goal of providing comprehensive care for older people with complex needs. Older Persons Assessment Service : A pilot project ran between October 2011 and end of March 2012 with a geriatrician and nurse specialist working 8am-8pm alongside the Emergency Department community and Medical Assessment Unit teams, adult social care and therapy colleagues to:
• Increase the number of frail older patients who receive a comprehensive geriatric assessment at the point of admission to hospital.
• Help avoid inappropriate admissions to hospital. • Reduce the length of stay for some patients. • Transfer patients to appropriate wards (MOPRS/speciality) earlier. • Facilitate transfer of patients to more appropriate care (e.g. rehabilitation, community wards,
home with virtual ward management).

Portsmouth Hospitals NHS Trust QUALITY ACCOUNTS 2011/2012
Review of quality performance in 2010/2011
Portsmouth Hospitals NHS Trust – Quality Accounts 2011/2012 Page 49 of 60
Older Persons Mental Health: A three month trial of an Older Persons Mental Health liaison service was launched on the 3rd January 2012. The team worked from 0830am to 6.00pm, 7 days per week providing a proactive and responsive service to all wards. Stroke: We are now achieving the following targets:
• 90% of our patients with a suspected stroke are now being directly admitted to our specialist unit. Work is on-going to maintain this.
• 80% of our patients remaining for 90% of their stay within our specialist stroke service for the duration of their hospital stay.
• High risk patients with a suspected TIA are being seen within 24 hours. • At least 40% of stroke patients are discharge home with the support of our Community Stroke
Rehabilitation Team, Patients receive CT brain scans, assessment for swallowing problems and appropriate management of abnormal heart rhythms in line with national targets. Trauma, Orthopaedics, Rheumatology and Pain The past year has seen the further development of the Enhanced Recovery Pathway for elective patients undergoing joint replacement. This pathway encompasses the patients’ journey from first appointment to discharge and incorporates pre-operative assessment, patient and relative education, day of surgery admission, early post-operative mobilisation and a follow up telephone call. The Specialist Hip Fracture team continues to provide specialist care for this group of patients and has had some really heartfelt thanks from relatives. Rheumatology led by Dr Hull and Matron Beevor has continued to be well regarded by their patients and their peer group and have been short listed for several national awards over the past 12 months. Since October 2011 much effort has been taking place to reduce the backlog and to achieve the Referral To Treatment (RTT) targets set by the SHA. This has meant weekend and evening operating sessions and the entire team focussed on efficient and effective patient pathways. As a result patient waiting time has been reduced considerably. Renal and Transplantation
• There are now two surgeons trained in laparascopic living nephrectomy. This type of procedure improves recovery time, reduces length of stay and hopefully will increase numbers of living donors.
• The CSC is on target to achieve 70 transplants by April 2012. • Commencement of ABOi transplantation – this allows people with differing blood groups to
donate and receive kidneys which has increased the number of available donors for individual patients.
• A nurse manager has been appointed to support the home haemodialysis programme. Surgery and Cancer
• The breast unit has treated over 1,000 patients using intra-operative Sentinel Lymph Node Biopsy and assessment. This treatment enables patients to have the full surgical treatment in a single trip to theatre, rather than having to return for a second operation. This is the biggest series in the UK and probably in Europe.
• Nursing staff in haematology/oncology service have secured support to run a programme of patient education sessions, ‘Demystifying Chemotherapy’. These sessions have been positively evaluated by patients and have reduced anxiety at their first attendance.
• 69% of Laparoscopic Cholecystectomies are being performed as Day Cases: the highest percentage in the country.
• We are the only centre on the South Coast offering the Rapid Access Biopsy service. Men suspected of having Prostate Cancer are assessed for appropriateness of referral and where appropriate/necessary are biopsied at this clinic, where necessary initial treatment is started.

Portsmouth Hospitals NHS Trust QUALITY ACCOUNTS 2011/2012
Review of quality performance in 2010/2011
Portsmouth Hospitals NHS Trust – Quality Accounts 2011/2012 Page 50 of 60
• The One Stop Haematuria clinic is the longest running service of its kind on the South Coast and is now an entirely Nurse Led Service. Patients are referred by GPs, the Emergency and other Departments and are seen, investigated and diagnosed in one and a half hours and where necessary treated. These two services have been identified as 'areas of exemplary practice' by the Cancer Peer Review.
• The Rapid Access service is the only Urological service of this kind in the Country. In 2010 it won 'Best Abstract Presentation' at the National Meeting for the British Association of Urological Nurses.
• There is only one other unit in the South of the Country (Guys and Thomas) that can offer the services available in our dedicated Urology Outpatients Department, where 80% of the activity is nurse led. We are very proud of the care and service available in his department.
Women and Children Neonatal and Intensive Care Unit (NICU) and Materni ty:
• In November 2011 maternity services successfully achieved compliance with the Clinical Negligence Scheme for Trusts (CNST) Level 1 assessment, with a score of 50 out of 50. The assessor recommended us as an “Exemplar Site” for Level 1 assessment.
• We have an excellent neonatal death rate (2.1/1000 live births) compared to latest published national rates of 4.7 and 4.2 for level 3 units. The Neo-natal Intensive Care Unit (NICU) have been rated as having the lowest neonatal mortality rate for level three units.
• The Maternity service mortality statistics for 2012 show the lowest stillbirth rate yet achieved (3.7 /1000 births).
• Maternity Service won an award for achieving the ‘You’re Welcome Standards’ at the Haven Children’s Centre, Gosport.
• In a recent national Neonatal survey NICU Unit demonstrated very favourable results, with most areas in the top 10: an exceptionally favourable outcome when compared to other trusts.
GU Medicine Department (GUM):
• GUM working with NHS Hampshire, Solent Healthcare and Inscape to provide outreach sexual health service to 'hard to reach' clients.
• GUM have been awarded ‘You're Welcome’ accreditation in recognition of achieving the quality criteria for making health services young people friendly.
Paediatric Unit and Safeguarding Children’s Team:
• In May 2011 Portsmouth City Council and partner agencies were involved in a Joint Ofsted/CQC inspection of Safeguarding Children and Looked After Children Services. The purpose of the inspection was to evaluate the contribution made by relevant services in the local area towards ensuring that children and young people are properly safeguarded and to determine the quality of service provision for looked after children and care leavers. Findings were that the overall effectiveness of the safeguarding services were adequate and capacity for improvement was good.
• The BBC filmed a cochlear procedure being performed in Paediatrics by Mike Pringle which will be shown in the spring on BBC1.
CSC Outcomes:
• 15 clinical research trials are actively recruiting with more in the pipeline. In 2012 the CSC recruited over 1,200 patients into trials throughout all its specialties, contributing significantly to our overall research performance.
• Patient Diaries have been introduced into two areas.
All data contained within this Quality Account was correct at the time of publication.

Portsmouth Hospitals NHS Trust QUALITY ACCOUNTS 2011/2012
Statement of Directors’ responsibilities in respect of the Quality Account
Portsmouth Hospitals NHS Trust – Quality Accounts 2011/2012 Page 51 of 60
Statement of Directors’ responsibilities in respect of the Quality Account

Portsmouth Hospitals NHS Trust QUALITY ACCOUNTS 2011/2012
Portsmouth LINk commentary
Portsmouth Hospitals NHS Trust – Quality Accounts 2011/2012 Page 52 of 60
Portsmouth Local Involvement Network (LINk) Comment ary on Portsmouth Hospitals NHS Trust (PHT) Quality Accounts 2011/2012

Portsmouth Hospitals NHS Trust QUALITY ACCOUNTS 2011/2012
SHIP Commentary
Portsmouth Hospitals NHS Trust – Quality Accounts 2011/2012 Page 53 of 60
SHIP Commentary on Portsmouth Hospitals NHS Trust ( PHT) Quality Accounts 2011/2012

Portsmouth Hospitals NHS Trust QUALITY ACCOUNTS 2011/2012
SHIP Commentary
Portsmouth Hospitals NHS Trust – Quality Accounts 2011/2012 Page 54 of 60

Portsmouth Hospitals NHS Trust QUALITY ACCOUNTS 2011/2012
SHIP Commentary
Portsmouth Hospitals NHS Trust – Quality Accounts 2011/2012 Page 55 of 60

Portsmouth Hospitals NHS Trust QUALITY ACCOUNTS 2011/2012
Portsmouth and Hampshire Health Overview and Scrutiny Committee commentary
Portsmouth Hospitals NHS Trust – Quality Accounts 2011/2012 Page 56 of 60
Portsmouth Health Overview and Scrutiny Committee C ommentary on Portsmouth Hospitals NHS Trust (PHT) Quality Accounts 2011/2012 The Portsmouth Health & Overview Scrutiny Panel (HOSP) works to continuously monitor service delivery at Portsmouth Hospitals which serve the residents of Portsmouth and its environs. Hampshire Health Overview and Scrutiny Committee Co mmentary on Portsmouth Hospitals NHS Trust (PHT) Quality Accounts 2011/2012

Portsmouth Hospitals NHS Trust QUALITY ACCOUNTS 2011/2012
Limited assurance report
Portsmouth Hospitals NHS Trust – Quality Accounts 2011/2012 Page 57 of 60
Limited Assurance report

Portsmouth Hospitals NHS Trust QUALITY ACCOUNTS 2011/2012
Limited assurance report
Portsmouth Hospitals NHS Trust – Quality Accounts 2011/2012 Page 58 of 60

Portsmouth Hospitals NHS Trust QUALITY ACCOUNTS 2011/2012
Glossary of terms
Portsmouth Hospitals NHS Trust – Quality Accounts 2011/2012 Page 59 of 60
Glossary of terms
Term Description Aston Business School Aim to provide support and solutions to organisations while
providing students with practical experience and opportunities to develop research and apply the latest theories.
Audit Commission A public corporation set up in 1983 to protect the public purse. They appoint auditors to councils, NHS bodies, police authorities and other local public services in England, and oversee their work.
National Cancer Peer review (NCPR)
A national quality assurance programme for NHS cancer services. The programme involves both self-assessment by cancer service teams and external reviews of teams conducted by professional peers, against nationally agreed “quality measures”.
Care Quality Commission (CQC) The independent regulator of all health and social care services in England. Their job is to make sure that care provided by hospitals, dentists, ambulances, care homes and services in people’s own homes and elsewhere meets government standards of quality and safety.
Clinical Negligence Scheme for Trusts (CNST)
The Clinical Negligence Scheme for Trusts handles all clinical negligence claims against member NHS bodies where the incident in question took place on or after 1 April 1995 (or when the body joined the scheme, if that is later). Although membership of the scheme is voluntary, all NHS Trusts (including Foundation Trusts) and Primary Care Trusts (PCTs) in England currently belong to the scheme.
Clinical Service Centre (CSC) Key centres within which the Trust’s services are delivered to patients. Each CSC has a Chief of Service, General Manager and Head of Nursing. There are 10 CSCs.
Commissioners Commissioners (i.e. health authorities/Primary Care Trusts) have a statutory responsibility to buy the best health care for a defined population with a defined amount of money.
Commissioning for Quality and Innovation (CQUIN)
The CQUIN payment framework enables Commissioners to reward excellence, by linking a proportion of Providers' income to the achievement of local quality improvement goals.
DatixWeb A web-based incident reporting system. When a member of staff witnesses an incident or near miss, they can access the website and complete a form on-line, which is then sent to their line manager for review and completion of additional action taken.
Dr Foster The UK's leading provider of comparative information on health and social care services.
Malnutrition Universal Screening Tool (MUST)
MUST’ is a five-step screening tool to identify adults, who are malnourished, at risk of malnutrition (under nutrition), or obese.
National Audit A National quality improvement process that seeks to improve patient care and outcomes through the systematic review of care.
National Institute for Health and Clinical Effectiveness (NICE)
Provide independent, authoritative and evidence-based guidance on the most effective ways to prevent, diagnose and treat disease and ill health, reducing inequalities and variation.
National Patient Safety Agency (NPSA)
Leads and contributes to improved, safe patient care by informing, supporting and influencing the health sector.
NHS Institute for Innovation and Improvement
Support the transformation of the NHS, through innovation, improvement and the adoption of best practice.
NHS Operating Framework for the NHS in England 2012/13
Sets out the planning, performance and financial requirements for NHS organisation in 2012/13 and the basis on which they

Portsmouth Hospitals NHS Trust QUALITY ACCOUNTS 2011/2012
Glossary of terms
Portsmouth Hospitals NHS Trust – Quality Accounts 2011/2012 Page 60 of 60
Term Description will be held to account.
Patient Safety incidents No harm (near miss) Low (green): Any patient safety incident that required extra observation or minor treatment and caused minimal harm, to one or more persons receiving NHS-funded care. Moderate (amber): Any patient safety incident that resulted in a moderate increase in treatment and which caused significant but not permanent harm, to one or more persons receiving NHS-funded care. Severe (amber): Any patient safety incident that appears to have resulted in permanent harm to one or more persons receiving NHS-funded care. Death (red): Any patient safety incident that directly resulted in the death of one or more persons receiving NHS funded care.
Pressure ulcers Pressure ulcers are also known as ‘pressure sores, bed sores and decubitus ulcers’. A pressure ulcer is defined as “An area of localised damage to the skin and underlying tissue caused by pressure, shear, friction and/or a combination of these”. Pressure ulcers occur when a bony prominence is in contact with a surface. The most common sites include the buttocks, hips and heels but they can occur over any bony prominence Grade 1: Discolouration of intact skin not affected by light finger pressure Grade 2: Partial thickness skin loss or damage involving epidermis. The pressure ulcer is superficial and presents clinically, as an abrasion, blister or shallow crater. Grade 3: Full thickness skin loss, involving damage of tissue. The pressure ulcer present clinically as a deep crater, but bone, tendon or muscle are not exposed. Grade 4: Full thickness skin loss, with exposed tendon or muscle.
Serious Incident Requiring Investigation (SIRI)
There is no single definition of a SIRI but in general terms, it is any event which: a) Involves a patient, a service user, a member of the public,
contractors, NHS staff or other providers of healthcare involved in the process of treatment, care or consultation on NHS premises.
b) Results in, or could have resulted in, one or more of the following: • Serious Injury • Unexpected death • Permanent harm • Significant public concern • Significant media concern • Significant disruption to health care services. • A serious situation which is associated with, or is a result
of, an infection control / communicable disease. Screening Tool for the Assessment of Malnutrition in Paediatrics (STAMP)
STAMP is a validated nutrition screening tool for use in hospitalised children aged 2-16 years.