quality assurance project plan …itepsrv1.itep.nau.edu/itep_course_downloads/met...quality...
TRANSCRIPT

BISHOP PAIUTE TRIBE Environmental Management Office
QUALITY ASSURANCE PROJECT PLAN Meteorological Station
Bishop Paiute Tribe Environmental Management Office
Prepared for The Bishop Tribal Council
50 Tu Su Lane Bishop, CA 93514
Prepared by The Environmental Management Office
Bishop Paiute Tribe 50 Tu Su Lane
Bishop, CA 93514
Wednesday, November 25, 2009
For additional information, contact Toni Richards, Ph.D., Air Quality Specialist at 760 873 7845 or [email protected]

Bishop Paiute Tribe Page 1 of 31 November 25, 2009 QAPP Meteorological Monitoring
ACKNOWLEDGEMENTS We would like to express our appreciation to a number of people who provided assistance with this report. The staff of the Great Basin Air Pollution Control District helped with a number of aspects. Chris Lanane and Mike Horn carefully reviewed drafts and provided detailed comments and helpful suggestions. They also provided many hours of technical support, answering detailed questions about calibration. We also want to thank Melinda Ronca-Battista from US EPA, the Institute for Tribal Environmental Professionals at Northern Arizona University and the Tribal Air Monitoring Support Center for providing us with a valuable template and for her helpful comments. This work was supported by the General Assistance Program Grant # GA-97962701-0 and Clean Air Grant # XA-97967201-0 from US EPA Region 9.

Bishop Paiute Tribe Page 2 of 31 November 25, 2009 QAPP Meteorological Monitoring
1.0 QA PROJECT PLAN IDENTIFICATION AND APPROVAL (Element A1) Title: Quality Assurance Plan for the Bishop Paiute Tribe Environmental Management Office Meteorological Station (QAPP). This QAPP commits the Bishop Tribe’s Air Quality Program, housed in the Environmental Management Office (EMO) to follow the procedures described and referenced in this plan. Plan development was supported by the General Assistance Program grant # GA-97962701-0 and Clean Air Act grant # XA-97967201-0 from the U.S. Environmental Protection Agency. Environmental Management Office Signature: __________________________________________ Date:________
Donna Vasquez, Tribal Environmental Agency, Chair (regulatory oversight)
Signature: __________________________________________ Date:________
Brian Adkins, Environmental Manager (supervisor)
Signature: __________________________________________ Date:________
Toni Richards, Ph.D., Air Quality Specialist (field operations)
EPA Region 9 Signature: __________________________________________ Date:________
Name _________________________________________________ Title __________________________________________________ Branch ________________________________________________
Bishop Paiute Tribe Page 3 of 31 November 25, 2009 QAPP Meteorological Monitoring
2.0 TABLE OF CONTENTS (Element A2) ACKNOWLEDGEMENTS......................................................................................................... 1 1.0 QA PROJECT PLAN IDENTIFICATION AND APPROVAL ................................................. 2 2.0 TABLE OF CONTENTS................................................................................................ 3 3.0 DISTRIBUTION LIST ................................................................................................. 5 4.0 PROJECT / TASK ORGANIZATION .............................................................................. 5
4.1 The Role of the Environmental Management Office 4.2 The Role of the EPA Region 9 Office
5.0 PROBLEM DEFINITION / BACKGROUND ..................................................................... 7 6.0 PROJECT DESCRIPTION ...........................................................................................10 7.0 QUALITY OBJECTIVES AND CRITERIA FOR MEASURING DATA ...................................13 8.0 SPECIAL TRAINING REQUIREMENTS / CERTIFICATION..............................................14 9.0 DOCUMENTATION AND RECORDS.............................................................................15
9.1 Standard Operating Procedures 9.2 Logbooks 9.3 Files 9.4 Reports 9.5 Data Transmittal
10.0 SAMPLING DESIGN ..................................................................................................16
10.1 Location 10.2 Schedule
11.0 SAMPLING METHODS ...............................................................................................17 12.0 SAMPLE HANDLING..................................................................................................17 13.0 ANALYTICAL METHODS ............................................................................................17 14.0 QUALITY CONTROL REQUIREMENTS.........................................................................17 15.0 INSTRUMENT / EQUIPMENT TESTING, INSPECTION AND MAINTENANCE ...................18 16.0 INSTRUMENT CALIBRATION AND FREQUENCY ..........................................................19 17.0 SUPPLIES & CONSUMABLES INSPECTION / ACCEPTANCE REQUIREMENTS .................19

Bishop Paiute Tribe Page 4 of 31 November 25, 2009 QAPP Meteorological Monitoring
18.0 DATA ACQUISITION REQUIREMENTS........................................................................19 19.0 DATA MANAGEMENT ................................................................................................19
19.1 Data Recording 19.2 Data Processing 19.3 Data Validation 19.4 Data Assessment 19.5 Data Archiving
20.0 ASSESSMENTS AND RESPONSE ACTIONS..................................................................21 21.0 REPORTS TO MANAGEMENT.....................................................................................21 22.0 DATA REVIEW, VALIDATION AND VERIFICATION REQUIREMENTS.............................22 23.0 VALIDATION AND VERIFICATION METHODS .............................................................22 24.0 RECONCILIATION WITH USER REQUIREMENT...........................................................22 REFERENCES ......................................................................................................................23 APPENDIX A – STANDARD OPERATING PROCEDURES...........................................................24
SOP 1. Data Verification and Management SOP 2. Instrument Maintenance and Calibration
LIST OF MAPS Map 1. Owens Valley Topographic Map....................................................................... 8 Map 2. Environmental Management Office and the Bishop Paiute Reservation............... 9 LIST OF PHOTOGRAPHS Photographs 1 and 2. Meteorological Equipment Platform and Location.................................. 9 LIST OF TABLES Table 1. Distribution List .............................................................................................. 5 Table 2. Quality Assurance Schedule for Meteorological Monitoring ...............................10 Table 3. Field Measurements.......................................................................................12 Table 4. System Accuracy and Resolution ....................................................................14 Table 5. Response Characteristics ...............................................................................14 Table 6. Quality Control verification Limits (Audit) ........................................................18 Table 7. Instrument Maintenance ................................................................................19 Table 8. Data Screening Criteria ..................................................................................20 Table A1. Accuracy and Specifications of Meteorological Calibration Instruments..............26

Bishop Paiute Tribe Page 5 of 31 November 25, 2009 QAPP Meteorological Monitoring
3.0 DISTRIBUTION LIST (Element A3) Paper copies of this QAPP have been distributed to the people listed in Table 1. As portions of this QAPP are revised, revised sections or the entire QAPP will sent to the people on this list. Table 1. Distribution List
Name Position Address and email Environmental Management Office
Donna Vasquez Chair, Tribal Environmental Protection Agency
437 Winuba Lane Bishop, CA 93514
Brian Adkins Environmental Manager Environmental Management Office Bishop Paiute Tribe 50 Tu Su Lane Bishop, CA 93514 [email protected]
Chris Lanane Air Monitoring Specialist, GBUAPCD
157 Short Street Bishop, CA 93514 [email protected]
EPA Region 9 Sean Hogan Manager US EPA Region 9
Air Division Technical Support Office – Air 7 75 Hawthorne St San Francisco, CA 94105 [email protected]
Asia Yeary CAA Project Officer US EPA Region 9 – Air 8 75 Hawthorne St San Francisco, CA 94105 [email protected]
4.0 PROJECT/TASK ORGANIZATION (Element A4) 4.1 The Role of the Environmental Management Office This tribal office incorporates quality assurance activities as an integral part of any program that gathers environmental data, including work in the field, their own data analysis and reporting, and work from any consulting and contractor laboratories used. The following sections list the responsibilities of staff from the Bishop Paiute Tribe’s Environmental Management Office involved in the Air Quality Program. Environmental Manager – Brian Adkins The Environmental Manger has overall responsibility for managing the Environmental Management Office’s Air Quality Program. Ultimately, the Environmental Manager is responsible for establishing quality assurance (QA) policy and for resolving QA issues that are identified. Major QA-related responsibilities of the Environmental Manager include: Reviewing acquisition packages (contracts, grants, cooperative agreements, inter-
agency agreements) to determine necessary QA requirements;

Bishop Paiute Tribe Page 6 of 31 November 25, 2009 QAPP Meteorological Monitoring
Assuring that the Environmental Management Office develops and maintains this QAPP and ensuring adherence to the document by staff, outside contractors and consultants as appropriate;
Maintaining regular communication with the field, and other technical staff; Ensuring that all personnel involved in this program have access to any training or QA
information needed to be knowledgeable in QA requirements, protocols, and technology; Reviewing and approving this QAPP; Ensuring that this program is covered by appropriate QA planning documentation (e.g.,
QA project plans and data quality objectives); Ensuring that reviews, assessments and audits are scheduled and completed, and at
times, conducting or participating in these QA activities; Recommending required management-level corrective actions; and Serving as the program QA liaison with EPA regional QA Managers or QA Officers and
the EPA regional Project Officer. Air Quality Specialist – Toni Richards, Ph.D. The Air Quality Specialist is responsible for carrying out the work in the field and ensuring that the data gathered meet the requirements of this QAPP. Responsibilities include: Developing and maintaining this QAPP; Developing QA documentation and providing answers to technical questions; Participating in training and certification activities; Writing and modifying standard operating procedures (SOPs); Verifying that all required QA activities are performed and that measurement quality
standards are met as required in this QAPP; Following all manufacturer's specifications; Performing and documenting preventative maintenance; Documenting deviations from established procedures and methods; Reporting all problems and corrective actions to their supervisor; Assessing and reporting data quality; Preparing and delivering reports to their supervisor; and Flagging suspect data.
Outside Auditor – Chris Lanane, GBUAPCD The auditor from the Great Basin Unified Air Pollution Control District conducts and reviews quality assurance, quality assessment, and quality control activities and ensures that meteorological data meet or exceed the data quality objectives of the tribe. The auditor is responsible for certifying standards used in the field and generating audit reports. 4.2 The Role of the EPA Region 9 Office EPA Regional Offices have been developed to address environmental issues related to the Environmental Management Offices within their region. EPA's Region 9 Office is responsible for the following activities in support of this program: Reviewing, providing assistance with, and approving this QAPP; Responding to requests for technical and policy information and interpretations;

Bishop Paiute Tribe Page 7 of 31 November 25, 2009 QAPP Meteorological Monitoring
Evaluating quality system performance through technical systems audits, performance evaluations and network reviews, as appropriate for each grant and the Environmental Management Office; and
Making available the technical and quality assurance information developed by EPA to the tribal agencies, and making the tribe aware of any unmet quality assurance needs of the tribal agencies.
5.0 PROBLEM DEFINITION/BACKGROUND (Element A5) The Bishop Paiute Tribe is initiating regular meteorological monitoring as part of an integrated, Reservation-wide environmental protection effort. Tribal goals for environmental protection are to protect human health and natural resources. The objective of the Meteorological Monitoring Program is to characterize ambient meteorological conditions where ambient air quality measurements are made. The meteorological data from this station are used only for public information and as a back-up for other more sophisticated and precise equipment. Meteorological data collected from instruments located on an adjacent 10m tower are used in support of the air quality monitoring program and are reported to the EPA Air Quality Subsystem data base and the National Weather Service. In addition to meteorological monitoring, the tribe carries out particulate monitoring for PM-10 and PM-2.5 and is initiating ozone monitoring. This QAPP describes project methods, establishes data quality objectives, and defines data quality assurance and control methods for meteorological monitoring by the Bishop Paiute Tribe. The QAPP was developed to ensure consistent, repeatable results and to improve the reliability and comparability of data collected. The meteorological monitoring station is located on the roof of the Environmental Management Office at 50 Tu Su Lane, on the Bishop Paiute Reservation (N37°22’, W118°25’ at an elevation of 4,226 ft.). The instrument platform is approximately 22ft (6.7m) above the ground and the wind sensors are approximately 28ft (8.5m) above the ground. The location of the monitoring site is shown in Maps 1 and 2 and in the photograph below. As shown in Map 1, the Bishop Paiute Reservation is located in the Owens Valley in eastern California, near the Nevada border. The reservation itself comprises 875 contiguous acres and is flanked by the City of Bishop to the East. It is surrounded by private lands and by lands owned by the Los Angeles Department of Water and Power. Approximately 1,350 people live on the Reservation. Map 2 shows the location of the Environmental Management Office on the Bishop Paiute Reservation. Photographs 1 and 2 show the equipment and location. Access is via a ladder to the roof.

Bishop Paiute Tribe Page 8 of 31 November 25, 2009 QAPP Meteorological Monitoring
Map 1. Owens Valley Topographic Map

Bishop Paiute Tribe Page 9 of 31 November 25, 2009 QAPP Meteorological Monitoring
Map 2. Environmental Management Office and the Bishop Paiute Reservation.
Photographs 1 and 2. Meteorological Equipment Platform and Location
While there is no other air quality monitoring in the immediate Bishop and Bishop Reservation vicinity, there is a National Weather Service meteorological station at Bishop Airport. In addition GBUAPCD maintains a portable monitoring station that includes a meteorological and air quality instrument. This portable station is typically located at the nearby community of Laws. Other air monitoring by GBUAPCD is concentrated in the non-attainment areas of the Owens Dry Lake, 60 miles to the South and in the Town of Mammoth Lakes, 45 miles to the North. A new meteorological station is located on the Big Pine Reservation, 15 miles to the South. The Ft. Independence Reservation, 45 miles to the South, carries out meteorological and PM-10 monitoring, and the Lone Pine Reservation, 60 miles to the South, carries out meteorological, PM-10 and PM-2.5 monitoring. The Big Pine, Ft. Independence and the Lone Pine Reservation share their data on the web using the IPS MeteoStar LEADS system and this is

Bishop Paiute Tribe Page 10 of 31 November 25, 2009 QAPP Meteorological Monitoring
information is available in real time for comparative purposes. In addition to these tribally-operated meteorological stations, there are a number of RAWS stations in the Owens Valley.
6.0 PROJECT DESCRIPTION (Element A6)
The objective of the Meteorological Monitoring Project is to characterize ambient meteorological conditions on the Bishop Paiute Reservation. The meteorological data are used to support environmental planning, particularly air quality. Data from this station are used for public information only. Data from an adjacent 10m tower supporting more sophisticated and precise instrumentation are used to support air quality monitoring. Parameters measured are listed below: Ambient air temperature Relative humidity Wind speed and direction Barometric pressure Precipitation Solar radiation
Site visits are conducted at least once every two weeks as part of routine calibration of the air monitoring equipment. Maintenance is conducted according to the schedule and audits are conducted annually as shown in Table 2 below. Data are transmitted directly to a computer located on the Air Quality Specialist’s desk via a serial port and are automatically downloaded every 24 hours to a data base. Data verification occurs daily. Table 2. Quality Assurance Schedule for Meteorological Monitoring Item Daily Monthly Quarterly Semi
annually Annually
Verify that displays on all instruments have values that are reasonable for current meteorological conditions.
X
Print out plot of wind speed and direction to file with PM-10 information as needed
X
Printout and file NOAA reports. X X Back up data to CD X Check instruments on roof for insects, dust, etc., and clean as necessary.
X X X
Calibrate instruments. Repair / replace as necessary.
X X
Schedule audit with GBUAPCD and calibrate / repair / replace instruments as needed based on audit findings.
X
Field measurements are described in Table 3 below. Because the instrument is used only for public information, all measurements are collected in English units so that current conditions

Bishop Paiute Tribe Page 11 of 31 November 25, 2009 QAPP Meteorological Monitoring
can be posted daily on bulletin boards located at the Environmental Management Office and the Tribal Administration building.

Bishop Paiute Tribe Page 12 of 31 November 25, 2009 QAPP Meteorological Monitoring
Table 3. Field Measurements Parameter Parameter Code Frequency Units Comment Date Date Every 30 minutes Month/Day/Year Time Time Every 30 minutes Hour:Minutes AM or PM Pacific standard time Temperature Air Temp Every 30 minutes Degrees (F) Temperature during the sampling interval Maximum Temperature
Air Hi Every 30 minutes Degrees (F) Maximum temperature in the sampling interval
Minimum Temperature
Air Low Every 30 minutes Degrees (F) Minimum temperature in the sampling interval
Evapo Transpiration
ET Every hour on the hour
Inches Calculated by the data logger using a standard turf model.
Solar Radiation
Solar Rad Every 30 minutes Watts / Square meter
Solar Energy Solar Energy Every 30 minutes Langleys Solar radiation integrated over a day. Barometric Pressure
Bar Every 30 minutes Inches of mercury
Wind Speed Wind Speed Every 30 minutes Miles / hour Wind speed during the sampling interval Maximum Speed
Wind Hi Every 30 minutes Miles / hour Maximum wind speed in the sampling interval
Wind Direction
Wind Dir Every 30 minutes Compass direction Direction is indicated in 1/16ths of the compass rose (e.g. ESE, WNW).
Wind Chill Wind Chill Every 30 minutes Degrees (F) Calculated in the data logger. Wind Run Wind Run Every 30 minutes Miles Wind speed integrated over a day. Precipitation Rain Every 30 minutes Inches Precipitation Rate
Hi Rate Every 30 minutes Inches / hour Calculated in the data logger.
Humidity Hum Every 30 minutes Percent relative humidity Daytime relative humidity is extremely low in this high desert environment, ranging from 10 to 15%.
Dew Point Dew Point Every 30 minutes Degrees (F) Calculated in the data logger. Temperature Humidity Index
T.H. Index Every 30 minutes Degrees (F) Calculated in the data logger.
Free Form Notes
Make a Note As needed Text Notes can be appended to any record.

Bishop Paiute Tribe Page 13 of 31 November 25, 2009 QAPP Meteorological Monitoring
7.0 QUALITY OBJECTIVES AND CRITERIA FOR MEASURING DATA (Element A7) The meteorological data from this project are used only for public information and as a back-up for other meteorological measurements taken using more sophisticated equipment. Characterize weather conditions at the site Qualitatively and quantitatively assess weather conditions influencing the tribal land and
inform tribal members of current conditions on a daily basis Correlate weather conditions with other resource data to inform a variety of programs
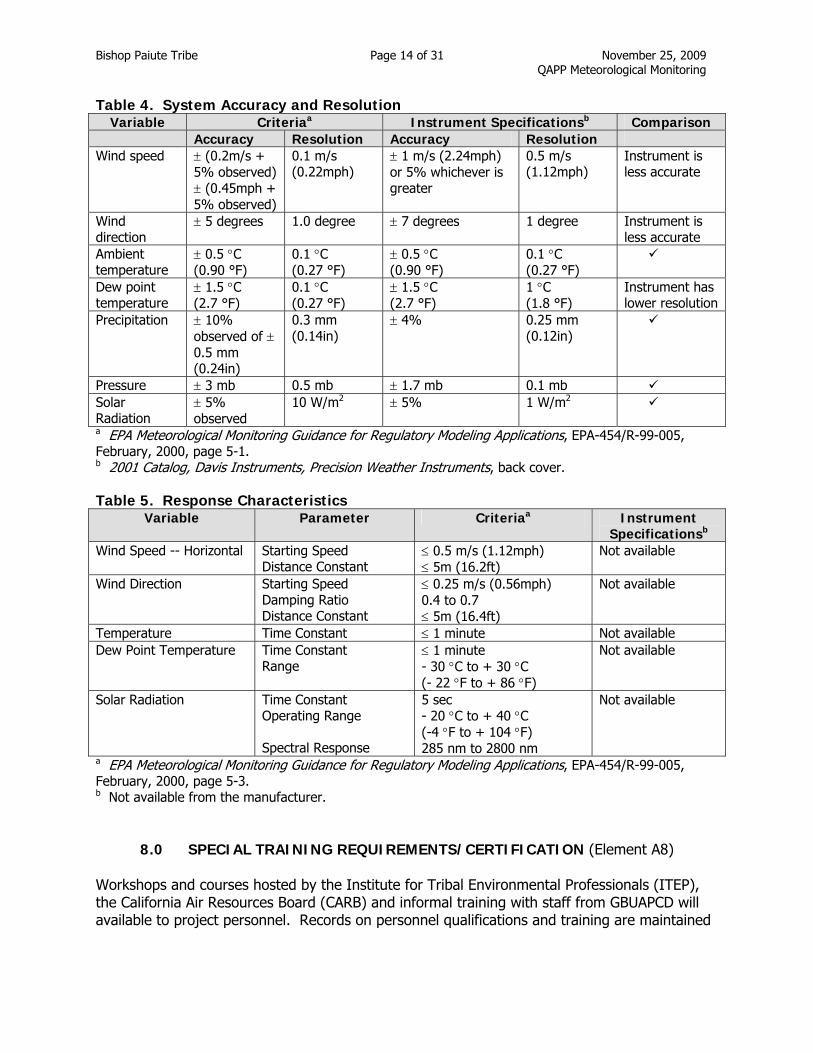
and departments managing multiple resources. Quality assurance (QA) procedures are required to insure that the data collected meet standards of reliability and allowable error. QA procedures include site inspections, independent audits, calibrations as necessary, data screening, data review and validation, and preventive maintenance. Data review and validation is a process in which suspect data are identified and flagged for additional review, possible screening and corrective action as necessary. The data validation process provides an additional level of quality assurance for the monitoring program. Although the data collected are used only for public information, they are also part of the ambient air-monitoring program. Thus, instrument characteristics are compared a stringent set of criteria for meteorological data, recommended by EPA for modeling purposes (EPA Meteorological Monitoring Guidance for Regulatory Modeling Applications, EPA-454/R-99-005, February, 2000). However, because the primary intent of this meteorological station is public information, not all meteorological instruments comply with the most stringent criteria. A second meteorological station collects data using more precise instruments that meet modeling standards. The results of the comparison of instrument specifications to criteria are shown in Tables 4 and 5. As shown in Table 4, the sensors for wind speed and wind direction do not meet EPA standards for accuracy and the dew point sensor does not meet EPA standards for resolution. However, this information is believed to be of sufficient accuracy to meet public information goals.
Bishop Paiute Tribe Page 14 of 31 November 25, 2009 QAPP Meteorological Monitoring
Table 4. System Accuracy and Resolution Variable Criteriaa Instrument Specificationsb Comparison
Accuracy Resolution Accuracy Resolution Wind speed (0.2m/s +
5% observed) (0.45mph + 5% observed)
0.1 m/s (0.22mph)
1 m/s (2.24mph) or 5% whichever is greater
0.5 m/s (1.12mph)
Instrument is less accurate
Wind direction
5 degrees 1.0 degree 7 degrees 1 degree Instrument is less accurate
Ambient temperature
0.5 C (0.90 °F)
0.1 C (0.27 °F)
0.5 C (0.90 °F)
0.1 C (0.27 °F)
Dew point temperature
1.5 C (2.7 °F)
0.1 C (0.27 °F)
1.5 C (2.7 °F)
1 C (1.8 °F)
Instrument has lower resolution
Precipitation 10% observed of 0.5 mm (0.24in)
0.3 mm (0.14in)
4% 0.25 mm (0.12in)
Pressure 3 mb 0.5 mb 1.7 mb 0.1 mb Solar Radiation
5% observed
10 W/m2 5% 1 W/m2
a EPA Meteorological Monitoring Guidance for Regulatory Modeling Applications, EPA-454/R-99-005, February, 2000, page 5-1. b 2001 Catalog, Davis Instruments, Precision Weather Instruments, back cover. Table 5. Response Characteristics
Variable Parameter Criteriaa Instrument Specificationsb
Wind Speed -- Horizontal Starting Speed Distance Constant
0.5 m/s (1.12mph) 5m (16.2ft)
Not available
Wind Direction Starting Speed Damping Ratio Distance Constant
0.25 m/s (0.56mph) 0.4 to 0.7 5m (16.4ft)
Not available
Temperature Time Constant 1 minute Not available Dew Point Temperature Time Constant
Range 1 minute - 30 C to + 30 C (- 22 F to + 86 F)
Not available
Solar Radiation Time Constant Operating Range Spectral Response
5 sec - 20 C to + 40 C (-4 F to + 104 F) 285 nm to 2800 nm
Not available
a EPA Meteorological Monitoring Guidance for Regulatory Modeling Applications, EPA-454/R-99-005, February, 2000, page 5-3. b Not available from the manufacturer.
8.0 SPECIAL TRAINING REQUIREMENTS/CERTIFICATION (Element A8) Workshops and courses hosted by the Institute for Tribal Environmental Professionals (ITEP), the California Air Resources Board (CARB) and informal training with staff from GBUAPCD will available to project personnel. Records on personnel qualifications and training are maintained

Bishop Paiute Tribe Page 15 of 31 November 25, 2009 QAPP Meteorological Monitoring
in the Environmental Management Office as a part of grant records and are accessible for review during audit activities. Adequate education and training are integral to any monitoring program that strives for reliable and comparable data. Training is aimed at increasing the effectiveness of employees and the Environmental Management Office. All personnel directly involved with this project will have adequate time to read this document and relevant references (16 hours minimum).
9.0 DOCUMENTATION AND RECORDS (Element A9) 9.1 Standard Operating Procedures (SOPs) These SOPs describe data verification and management and proper instrument maintenance and calibration. They follow the quality assurance schedule given in Table 2 above. The procedures are included as Appendix A. SOP 1. Data Verification and Management – describes the procedures for
scheduling routine downloads, daily verification, monthly and yearly NOAA reports, and monthly back-ups.
SOP 2. Instrument Maintenance and Calibration – describes routine inspections,
maintenance and calibration for all instruments. 9.2 Logbooks A log of all site activities is a major component of the quality procedures. All maintenance and record keeping will be logged with date, time, and initials. This logbook will be kept in the Environmental Management Office, at the Air Quality Specialist’s desk when it is not in the field during site visits. 9.3 Files Files are maintained at the Air Quality Specialist’s desk and include logbooks, maintenance records, audit reports, summary reports and CD data back-ups. Data backups include the creation of an export file that can be read by any standard spreadsheet or text processing software. 9.4 Reports Daily reports of current conditions are posted at the Environmental Management Office and at the Tribal Administration buildings. Plots of wind speed and direction are printed as needed to inform air quality analyses. Monthly and yearly reports in the National Oceanic and Atmospheric Administration (NOAA) format are printed using manufacturer-supplied software and filed chronologically. Corrections to the database are documented in text notes attached to the relevant records and in corrected monthly NOAA format reports. Hard copies are maintained with other NOAA reports.

Bishop Paiute Tribe Page 16 of 31 November 25, 2009 QAPP Meteorological Monitoring
As needed, special reports are generated relating current weather conditions as recorded at the EMO meteorological station to historical patterns from data collected by the National Climatic Data Center. These reports are used to inform other tribal programs regarding resource management. Quarterly progress reports are provided to the appropriate Project Officer for the duration of relevant grant. 9.5 Data Transmittal All data transmittal is automated. Data are downloaded every 24 hours using manufacturer-supplied software. Data are backed up monthly on the system server and on a second external hard drive. Other data transfer is accomplished electronically by transferring the data directly into spreadsheets. Any editing is specifically documented directly in notes appended to the affected records and in the electronic mail accompanying the data transfer. Accuracy of data transmittal is evaluated by the auditor during the course of comprehensive annual system audits.
10.0 SAMPLING DESIGN (Element B1) 10.1 Location(s) The meteorological equipment is located on the roof of the Environmental Management Office. This location was chosen because it is representative of conditions on the Bishop Paiute Reservation and meets the majority of EPA siting requirements. The platform is approximately 22 ft (6.7m) above ground level and the wind sensors are approximately 28ft (8.5m) above ground level. In addition, the site offers the following benefits: It is typical of the weather conditions influencing the Bishop Reservation and wider
Bishop community’s airshed, It allows the Bishop Paiute Tribes’ Environmental Management Office to evaluate the 24-
hour and seasonal wind speed and direction of pollution sources likely to affect the tribal community;
It provides data suitable for evaluating factors that help evaluate potential pollutant deposition effects on the community;
It helps us to inform tribal departments about local weather conditions that may impact planned activities;
In the future, it may allow the use of meteorological data to assess health exposure effects from off-site pollution sources.
The locations for the met station will be re-evaluated annually or more frequently, if important new information is obtained from the met stations or from outside sources such as GBUAPCD or the National Weather Service (NWS).

Bishop Paiute Tribe Page 17 of 31 November 25, 2009 QAPP Meteorological Monitoring
10.2 Schedule Equipment was purchased and installed in the fall of 2001, with support from EPA’s General Assistance Program grant. At that time, data collection was experimental and the tribe was evaluating whether a more fully developed air program was warranted. The station has been in continuous operation since then. In the spring of 2003, PM-10 monitoring was added to the network, in the spring of 2004, PM-2.5 monitoring was added, and in the fall of 2004 a second, more sophisticated and precise meteorological station was incorporated into the system. Because the current meteorological station was purchased to evaluate program potential, a simple, inexpensive system was purchased. This system does not fully comply with all EPA requirements for modeling (as discussed in section 7.0). An upgraded meteorological station is located on a 10m tower next to the current station. Currently, data are collected and verified daily, maintenance is conducted according to the schedule given in Table 2, and audits are conducted quarterly by the Great Basin Unified Air Pollution Control District. Reports are posted daily, monthly and annually as described in Table 2 and in section 9.4.
11.0 SAMPLING METHODS (Element B2) Sensor data are collected automatically and 30-minute summaries are computed by the data logger, stored as described in Table 3. This information is later used for reporting. Data are automatically downloaded every 24 hours to the Air Quality Specialist’s computer using the manufacturer’s software. The station and computer have direct A/C power and battery backup. Data verification follows the procedures described in SOP 1, included in Appendix A.
12.0 SAMPLE HANDLING (Element B3) The meteorological data does not require laboratory or chain of custody handling procedures. Data handling is completely automated. Monthly back-ups include the creation of an export file that can be read by any standard spreadsheet or word processing software. The files are self-documenting through the creation dates that are automatically stored in the computer system.
13.0 ANALYTICAL METHODS (Element B4) The instruments used to gather meteorological data are self-contained and do not require any actual analyses by the operator other than the creation of daily, monthly and annual reports which are generated automatically using the manufacturer’s software. Special reports are generated from existing data bases as needed.
14.0 QUALITY CONTROL REQUIREMENTS (Element B5) Qualilty Control (QC) verification checks are conducted both by the Air Quality Specialist and by the GBUAPCD during the course of annual audits. Because the equipment is intended primarily

Bishop Paiute Tribe Page 18 of 31 November 25, 2009 QAPP Meteorological Monitoring
for public information, it is calibrated on site by the Air Quality Specialist. Necessary repairs, replacements are carried out by the manufacturer. Audit reports are maintained at the Air Quality Specialist’s desk. The verifications performed and their limits and frequencies are described in Table 6. Table 6: Quality Control Verification Limits (Audit) Sensor Parameter Ranges for
verification / audit
Acceptance Criteria
Frequency of Verification Conducted by Site Operator
Frequency of audit by GBUAPCD
Wind Speed Speed Accuracy
Six speeds (including zero)
± 1.00 mph (0.45m/s); ws ≤ 11.2 mph (5m/s) ± 5%; ws ≥ 11.2 mph (5m/s)
6 months Annually
Wind Direction
Orientation Accuracy Linearity
East-West alignment on mounting arm Four cardinal points
± 7° from True East-West ± 7° from “known”
6 months Annually
Temperature Accuracy Comparison to collocated standard at ambient conditions
± 1.7° F (1 °C))
6 months Annually
Relative Humidity
Accuracy Comparison to collocated standard at ambient conditions
± 5% RH 6 months Annuallya
Barometric Pressure
Accuracy Comparison to collocated standard at ambient conditions
± 0.3 in Hg (10mb)
6 months Annually
Precipitation Accuracy Compared to a known volume dripped slowly into the funnel
± 10% of input 6 months Annually
Solar Radiation
Accuracy Zero Zero when covered
6 months Annually
a Daytime relative humidity is low in this high desert environment, typically ranging from 10 to 15%. This is at the low extreme of the operating range of most instruments.
15.0 INSTRUMENT/EQUIPMENT TESTING, INSPECTION AND MAINTENANCE (Element B6)
Instruments will be tested upon receipt for proper operation and achievement of the limits in Table 6. Instrument inspections occur at least quarterly and when the instruments appear to be producing erratic or wrong data. Instrument verification occurs every 6 months and audits are conducted annually. Maintenance will follow the schedule in Table 7.

Bishop Paiute Tribe Page 19 of 31 November 25, 2009 QAPP Meteorological Monitoring
Table 7: Instrument Maintenance Sensor Manufacturer/Supplier Recommended Action and Frequencya
Wind Speed Davis Instruments Replace when cups will not rotate freely or after audit findings
Wind Direction Davis Instruments Replace when vane will not rotate freely or after audit findings
Temperature Davis Instruments Replace following verification or audit findings Relative Humidity Davis Instruments Replace following verification or audit findings Precipitation Davis Instruments Replace following verification or audit findings Barometric Pressure Davis Instruments Replace following verification or audit findings a Manufacturer does not specify replacement interval.
16.0 INSTRUMENT CALIBRATION AND FREQUENCY (Element B7) Calibration is defined as changing the response of a sensor by adjustment. The manufacturer calibrates the meteorological sensors at the time of purchase. Continued sensor stability is assessed through site visits, routine maintenance and verifications. If the performance of any sensor is out of the range specified in Table 6, or if the equipment is moved or damaged, verification is conducted to determine if the instrument is still operating within limits or if it should be sent to the manufacturer for calibration and/or repair. Verification by the Air Quality Specialist occurs every 6 months and by GBUAPCD during annual audits. Instruments are then calibrated as needed.
17.0 SUPPLIES & CONSUMABLES INSPECTION/ACCEPTANCE REQUIREMENTS (Element B8)
Instrument and/or equipment supplies are inspected and tested on receipt. The Air Quality Specialist is responsible for routine preventive and corrective maintenance. Replacement parts are available within less than a week from the manufacturer.
18.0 DATA ACQUISITION REQUIREMENTS (Element B9) Data from other sources is not required to support this project. Where data is obtained from other sources and referenced in relation to this project, the data are obtained from the National Weather Service or the National Climatic Data Center.
19.0 DATA MANAGEMENT (Element B10) 19.1 Data Recording Site logbooks shall record site inspections, instrument maintenance, repair and replacement; 6 month instrument verifications and annual audit, and instrument calibration, as described in Section 9.

Bishop Paiute Tribe Page 20 of 31 November 25, 2009 QAPP Meteorological Monitoring
Electronic downloaded data records are maintained in a database supplied by the manufacturer and in export files that can be read by any spreadsheet or word processing software. Any edits are documents with notes attached to the relevant records and are documented on hard copy with the monthly NOAA reports. 19.2 Data Processing Sensor data capture is automated and recorded electronically at the site to the data logger. The data logger information is transferred to the Air Quality Specialist’s computer and recorded to the hard-drive. Monthly, files are exported to a standard format and the directory backed up to CD. 19.3 Data Validation The site operator conducts data daily screening of the downloaded data, reviews the data against the values listed in Table 8, and identifies missing data, unacceptable shifts in values, and records the problems or errors encountered. The data verifications and reports are reviewed by the auditor and validated during annually system audits. Validated data are documented using electronic notes appended to the relevant records and handwritten on the relevant NOAA reports. Table 8. Data Screening Criteria Sensor Screening Criteria for Investigation Wind Speed Between 0 & 100 mph (any exceedances verified with nearby NWS
station) Varies by more than 1mph for 3 consecutive hours Varies by more than 3mph for 12 consecutive hours
Wind Direction Between 0 and 360 (on console) Varies by at least than 1/16th of compass quadrant in 12 consecutive hours
Temperature Exceedances of local records independently verified by nearby NWS station Changes do not exceed 10 F from the previous hour Varies by more than 1 F for 12 consecutive hours
Relative Humidity Between 0 and 100% Varies by more than 1% from one hour to the next
Precipitation Not greater than 1 inch per hour Never greater 4 inches per 24 hours
Barometric Pressure Always between 28 and 32 in Hg Varies by 0.01 in 3 hours
Solar Radiation (Pyronometer) Daily peaks between 50 & 1,400 W/m2 Night is at but not below 0 W/m2
19.4 Data Assessment Data assessment is conducted on an ongoing basis, when the data are downloaded, when reports are produced, when verifications are conducted, and during site visits when specific parameters are visible on screen in the units. In general, the major criterion for data

Bishop Paiute Tribe Page 21 of 31 November 25, 2009 QAPP Meteorological Monitoring
assessment is reasonableness. The data screening values in Table 8 are used as benchmarks for data reasonableness. Data errors are evaluated during formal and informal instrument verifications. The percent difference between the “known” value and the instrument reading, prior to any adjustments, is used as an estimate of the measurement error from the time of the verification to the last previous verification. Data completeness is determined for each parameter and expressed as a percentage. The data completeness goal is 90% for all parameters. Percent valid data are documented quarterly and represent a gauge of the amount of valid data obtained from a sensor compared with ideal conditions (24 hours per day, 365 days per year). 19.5 Data Archiving Site logbooks, all associated forms, and reports are grouped by calendar year and kept a minimum of five years before archiving. All electronic data is stored by calendar year. All archived records are stored indefinitely at the Environmental Management Office or in storage procured specifically for this purpose.
20.0 ASSESSMENTS AND RESPONSE ACTIONS (Element C1) The meteorological parameters are automatically measured and electronically logged and stored in the monitoring station’s data logger. The site’s data logger is automatically downloaded every 24 hours to the Air Quality Specialist’s computer. The downloaded records are captured in the computer’s hard-drive and records are backed up monthly. The station is visited every 2 weeks during regular verifications of the air monitoring equipment and is examined quarterly to inspect the equipment and sensors, or more frequently as needed. Semi-annual verifications are performed by the Air Quality Specialist at the station for all equipment and sensors. External audits are performed annually by GBUAPCD. The Air Quality Specialist is responsible for inspecting, testing and accepting instruments and supplies, and for reporting to the Environmental Manager equipment and supply needs. The Air Quality Specialist, with approval by the Environmental Manger, is responsible for procurement. The Air Quality Specialist is responsible for performing routine preventive and corrective maintenance. Calibration is performed by the Air Quality Specialist semi-annually or more frequently depending on audit findings. The Air Quality Specialist is responsible for working with the manufacturer on any other major maintenance and/or repair needs.
21.0 REPORTS TO MANAGEMENT (Element C2) Monthly summaries in NOAA format are generate and hard copies, kept at the Air Quality Specialist’s desk are available for inspection.

Bishop Paiute Tribe Page 22 of 31 November 25, 2009 QAPP Meteorological Monitoring
Semi-annual verification reports (conducted by the Air Quality Specialist) and Annual audit reports (conducted by GBUAPCD) are be filed at the Air Quality Specialist’s desk and are available for inspection. Annual audit reports are provided to the Project officer. Quarterly progress reports are provided to the funding Project Officer for the duration of initial funding period. Special reports are developed to discuss data acquisition results and sources of error, assess seasonal trends, and recommend further investigation of site operations as necessary. The may include assessments of trends and comparison with historic data. They may be used for program evaluation and to identify recommendations for future equipment modification and/or acquisition.
22.0 DATA REVIEW, VALIDATION AND VERIFICATION REQUIREMENTS (Element D1)
The meteorological instrumentation are verified and operated according to standard operating procedures identified herein and in Appendix A. The data are accompanied by appropriate verification forms, operating and analytical reports. More complete descriptions of the standard operating procedures are included in the Appendix A. The Air Quality Specialist, as identified in Section 4, is responsible for conducting data review and validation. All data verification and internal and external reports are reviewed and approved by the Outside Auditor. The files will contain the indication of the review and approval of the Auditor either as a handwritten note on the top of the page or as a separate page attached to the report.
23.0 VALIDATION AND VERIFICATION METHODS (Element D2) The Air Quality Specialist conducts data screening and control checks of the downloaded data, review the data against the limits listed in Table 6 and identify missing data, unacceptable shifts in values, and record the acceptance, qualification or rejection of data. The data checks will be reviewed by the Outside Auditor. Validated data will be documented with the reviewer’s initials, dates and notes on the margin or header of the paper copy, in a comment field in the computer file, and retained.
24.0 RECONCILIATION WITH USER REQUIREMENTS (Element D3) The project results and associated variability, accuracy, and precision will be compared with project objectives. If results do not meet criteria established at the beginning of the project, this will be explicitly stated in appropriate reports. Based upon data accuracy some data may be discarded. If so the problems associated with data collection and analysis, reasons data were discarded, and potential ways to correct sampling problems will be reported. In some cases accuracy project criteria may be modified. In this case the justification for modification, problems associated with collecting and analyzing data, as well as potential solutions will be reported.

Bishop Paiute Tribe Page 23 of 31 November 25, 2009 QAPP Meteorological Monitoring
REFERENCES EPA, Meteorological Monitoring Guidance for Regulation Modeling Applications, EPA-454/R-99-005. EPA Quality Assurance Handbook for Air Pollution Measurement Systems:, Volume 1 – Principles and Volume 4 – Meteorological Measurements. 2001 Catalog, Davis Instruments, Precision Weather Instruments.

Bishop Paiute Tribe Page 24 of 31 November 25, 2009 QAPP Meteorological Monitoring
APPENDIX A STANDARD OPERATING PROCEDURES
SOP 1. Data Verification and Management This SOP describes the procedures for scheduling routine downloads, daily verification, monthly and yearly NOAA reports, and monthly back-ups. Routine Downloads are scheduled every 24-hours at 9:00AM local time, using auto download function in the manufacturer-supplied software, GrowWeatherLink for Windows Version 2.1, as described in the Software User’s Guide. Daily Verification occurs daily when reports of current conditions are printed for posting on bulletin boards at the Environmental Management Office and the Tribal Administration Buildings. The steps are as follows:
1. Following the automated 8:00 AM PST download, use the GrowWeather “Display” function and select “Bulletin.
2. Using the right click on the mouse, print two copies of the display to a color printer. 3. Verify that current conditions meet common sense criteria. 4. Using the GrowWeather “Database” function and display “Browse” 5. Note any deviations in the database using the “Edit” function, select the appropriate
record, and use the “Make a Note” option. Monthly and Annual NOAA reports are created at the end of each month and at the end of each calendar year using the “Reports” function on the GrowWeather software and selecting the appropriate month. The resulting data are compared to NWS long term records. Any deviations are noted using the “Edit” function and selecting the appropriate record(s), then using the “Make a Note” option. The reports are printed and file. Monthly Back-Ups are completed within one week following the end of each month. Data are exported using the “Data Base” and “Browse” functions on the GrowWeather Software, then exporting all records to a file in the GROW directory, using the nomenclature “Wyy” to indicate data for year yy and “Wyyall” to indicated data from the inception of data collection to the current calendar year. Monthly, data are backed up on the system server which is in turn automatically backed up on an external hard drive. Corrections and Edits to the data base are made only after the current version of the data base has been backed up to CD, and a hard copy of the NOAA monthly report has been printed and filed. Any deletions or corrections to records are indicated using the “Make a Note” feature for the appropriate records. Appropriate notes are made in the instrument log. A corrected NOAA monthly report is then printed with appropriate annotations indicating any changes. Corrected data are subsequently backed up using the file nomenclature Wyyc to indicate corrected data.

Bishop Paiute Tribe Page 25 of 31 November 25, 2009 QAPP Meteorological Monitoring
SOP 2. Instrument Maintenance and Calibration This SOP describes routine inspections, maintenance and calibration for all instruments. Quarterly Inspections include a visual inspection of all instruments for insect and bird damage, and / or loose parts due to vibration or wind. The results of quarterly inspections are recorded on the form “Meteorological Instrument Quarterly Inspection,” attached.
1. All instruments – verify that all attachments are secure. Check nuts and bolts for tightness and tighten as necessary.
2. Radiation shield – visually verify that the louvers are free of any debris and that air can circulate freely. Clean with compressed air if necessary.
3. Windspeed and direction – verify that cups on anemometer turn freely and that wind vane moves freely.
4. Rain gauge – remove cover and verify that tipping bucket is free of debris. Clean with compressed air if necessary. Reinstall cover securely.
Semi-Annual Calibrations are simplified because this instrument is used primarily for public information. They follow the procedures established by GBUAPCD for the annual audit and include the following:
1. Side-by-side temperature comparisons with Omega Handheld Thermometer. Standard: input ± 1.8 ° F.
2. Side-by-side relative humidity comparisons with Oakton Themohygrometer. Standard: input ± 5 %.
3. Side-by-side verification of barometric pressure with StreamlinePro. Standard: input ± 1 %.
4. Verification of orientation of mounting arm of wind vane using Brunton Transit. Standard: input ± 2 °.
5. Manual verification of 4 cardinal points using a compass to orient wind vane. Standard: input ± 7 ° per manufacturer’s specifications.
6. Verification of wind speed using RM Young Selectable Speed Anemometer Drive for 6 speeds (0.0, 5.62, 7.50, 11.25, 13.12, and 15.00 MPH). Standard: ± 1 MPH for wind speeds ≤ 11.2 MPH; and ± 5 % for wind speeds > 11.2 MPH.
7. Verification of precipitation gauge using Texas Electronics Calibration Kit. Standard: input ± 10 %
8. Verification of zero on pyranometer by covering completely. No Standard.
The accuracy and specifications of the calibration instruments are listed in the Table A1 below.

Bishop Paiute Tribe Page 26 of 31 November 25, 2009 QAPP Meteorological Monitoring
Table A1. Accuracy and Specifications of Meteorological Calibration Instruments Measurement Instrument Model Range Resolution Accuracy Temperature Omegon
Handheld Thermometer
HH204A -50°C to 150°C -58°F to 302°F
0.1° @ 23°C ± 0.05°C
Relative Humidity
Oakton Thermohygrometer
35612-00 0 to 99.99 % RH
0.1% RH ± 2% from 0 to 95% RH at room temperature ± 3% from 95 to 100% RH
Barometric Pressure
Streamline Pro MultiCal System
0.6 to 1.02 atm (608 to 1,033mb)
0.001 atm (1mb)
< ± 3 % full scale
Wind Direction Brunton Transit 5006LM 0 to 360° 1° ± 0.5° Wind Speed RM Young
Selectable Speed Anemometer Drive
18811 20 to 990.0 RPM
0.1 RPM n/a
Precipitation Texas Electronics Calibration Kit
FC-525 n/a n/a Factory calibrated at 100 tips per hour
Solar Radiation Cover n/a n/a n/a n/a The results of the calibration are recorded on the form “Meteorological Instrument Semi-Annual Calibration” attached. Annual Audit in August of each year, contact GBUAPCD to schedule an audit in September. Annual Calibration Instrument Certification in January of each year, contact GBUAPCD to schedule instrument certification in December.

Bishop Paiute Tribe Page 27 of 31 November 25, 2009 QAPP Meteorological Monitoring
BISHOP PAIUTE TRIBE
ENVIRONMENTAL MANAGEMENT OFFICE
METEOROLOGICAL INSTRUMENT QUARTERLY CHECK
Operator Toni Richards Date Start Time
(PST) End Time
(PST)
All Instruments Check Bolts
Comments
Radiation Shield Check louvers for debris
Clean with compressed air if needed
Wind Speed and Direction Verify anemometer cups rotate freely
Verify wind vane moves freely
Visually verify orientation on support arm (parallel to railing is West)
Rain Guage Remove cover and ensure that tipping bucket is clean of debris
Clean with compressed air if needed and replace cover securely.
Annotate data base to indicate records during which maintenance was performed. Print out appropriate NOAA monthly report. Delete or correct appropriate records as necessary and annotate data base as needed. Printout corrected NOAA monthly report and indicate any changes. Comments

Bishop Paiute Tribe Page 28 of 31 November 25, 2009 QAPP Meteorological Monitoring
BISHOP PAIUTE TRIBE
ENVIRONMENTAL MANAGEMENT OFFICE
METEOROLOGICAL INSTRUMENT SEMI-ANNUAL CALIBRATION
Operator Toni Richards Date Start Time
(PST) End Time
(PST)
Temperature – Side-by-side comparison Reading on Omega Handheld Thermometer
Reading on GrowWeather Console
Comparison
Standard
°F
°F
°F
± 1.8 °F
Relative Humidity – Side-by-side comparison Reading on Oakton Thermohygrometer
Reading on GrowWeather Console
Comparison
Standard
%
%
%
± 5 %
Barometric Pressure – Side-by-side comparison Reading on Streamline Pro
Reading on GrowWeather Console
Comparison
Standard
atm
atm
%
± 1 %
Verification of Orientation of Mounting Arm of Wind Vane True West Reading on Brunton
Transit Comparison
Standard
270°
initial ° final °
% %
± 2 ° for final
Adjust mounting arm orientation until orientation is true West ± 2°.

Bishop Paiute Tribe Page 29 of 31 November 25, 2009 QAPP Meteorological Monitoring
Wind Direction – 4 Cardinal Points Reading on GrowWeather Console
True Orientationt Comparison
Standard
°
0° / 360° °
± 7 °
°
90° °
± 7 °
°
180° °
± 7 °
°
270° °
± 7 °
Wind Speed – 6 Audit Points Audit Point Reading on
GrowWeather Console Comparison
Standard
0 RPM 0 MPH MPH
MPH
± 1 MPH
150 RPM 5.62 MPH MPH
MPH
± 1 MPH
200 7.50 MPH MPH
MPH
± 1 MPH
300 11.25 MPH MPH
%
± 5 %
350 13.12 MPH MPH
%
± 5 %
400 15.00 MPH MPH
%
± 5 %
Precipitation – use brass #65 nozzle Expected reading Reading on
GrowWeather Console Comparison
Standard
87 ± 2 counts 1 inch
inches
%
± 10 %
Each tip is 0.1 inches of rain. Solar Radiation – verify zero Expected reading Reading on
GrowWeather Console Comparison
Standard
0 Watts/m2
%
n/a
Complete quarterly maintenance as needed. Annotate data base to indicate records during which maintenance was performed. Print out appropriate NOAA monthly report. Delete or correct appropriate records as necessary and annotate data base as needed. Printout corrected NOAA monthly report and indicate any changes. If instrument does not meet calibration standard, follow the following steps:
1. Repeat calibration, if instrument continues to fail to meet standard;

Bishop Paiute Tribe Page 30 of 31 November 25, 2009 QAPP Meteorological Monitoring
2. Verify calibration device against audit device used by GBUAPCD, if calibration device is accurate
3. Request audit from GBUAPCD to re-check instrument, if instrument continues to fail to meet standrard
4. Repair and / or replace if necessary. Comments