quality assurance project plan climatronics...
TRANSCRIPT

BISHOP PAIUTE TRIBE Environmental Management Office
QUALITY ASSURANCE PROJECT PLAN Climatronics Meteorological Station
Bishop Paiute Tribe Environmental Management Office
Prepared for The Bishop Tribal Council
50 Tu Su Lane Bishop, CA 93514
Prepared by The Environmental Management Office
Bishop Paiute Tribe 50 Tu Su Lane
Bishop, CA 93514
Wednesday, November 25, 2009
For additional information, contact Toni Richards, Ph.D., Air Quality Specialist at 760 873 7845 or [email protected]

Bishop Paiute Tribe Page 1 of 32 November 25, 2009 QAPP Meteorological Monitoring
ACKNOWLEDGEMENTS We would like to express our appreciation to a number of people who provided assistance with this report. The staff of the Great Basin Air Pollution Control District helped with a number of aspects. Chris Lanane and Mike Horn provided many hours of technical support, answering detailed questions about calibration. We also want to thank Melinda Ronca-Battista from US EPA, the Institute for Tribal Environmental Professionals at Northern Arizona University and the Tribal Air Monitoring Support Center for providing us with a valuable template. This work was supported by the General Assistance Program Grant # GA-97962701-0 and Clean Air Grant # XA-97967201-0 from US EPA Region 9.

Bishop Paiute Tribe Page 2 of 32 November 25, 2009 QAPP Meteorological Monitoring
1.0 QA PROJECT PLAN IDENTIFICATION AND APPROVAL (Element A1) Title: Quality Assurance Plan for the Bishop Paiute Tribe Environmental Management Office Climatronics Meteorological Station (QAPP). This QAPP commits the Bishop Tribe’s Air Quality Program, housed in the Environmental Management Office (EMO) to follow the procedures described and referenced in this plan. Plan development was supported by the General Assistance Program grant # GA-97962701-0 and Clean Air Act grant # XA-97967201-0 from the U.S. Environmental Protection Agency. Environmental Management Office Signature: __________________________________________ Date:________
Donna Vasquez, Tribal Environmental Agency, Chair (regulatory oversight)
Signature: __________________________________________ Date:________
Brian Adkins, Environmental Manager (supervisor)
Signature: __________________________________________ Date:________
Toni Richards, Ph.D., Air Quality Specialist (field operations)
EPA Region 9 Signature: __________________________________________ Date:________
Name _________________________________________________ Title __________________________________________________ Branch ________________________________________________
Bishop Paiute Tribe Page 3 of 32 November 25, 2009 QAPP Meteorological Monitoring
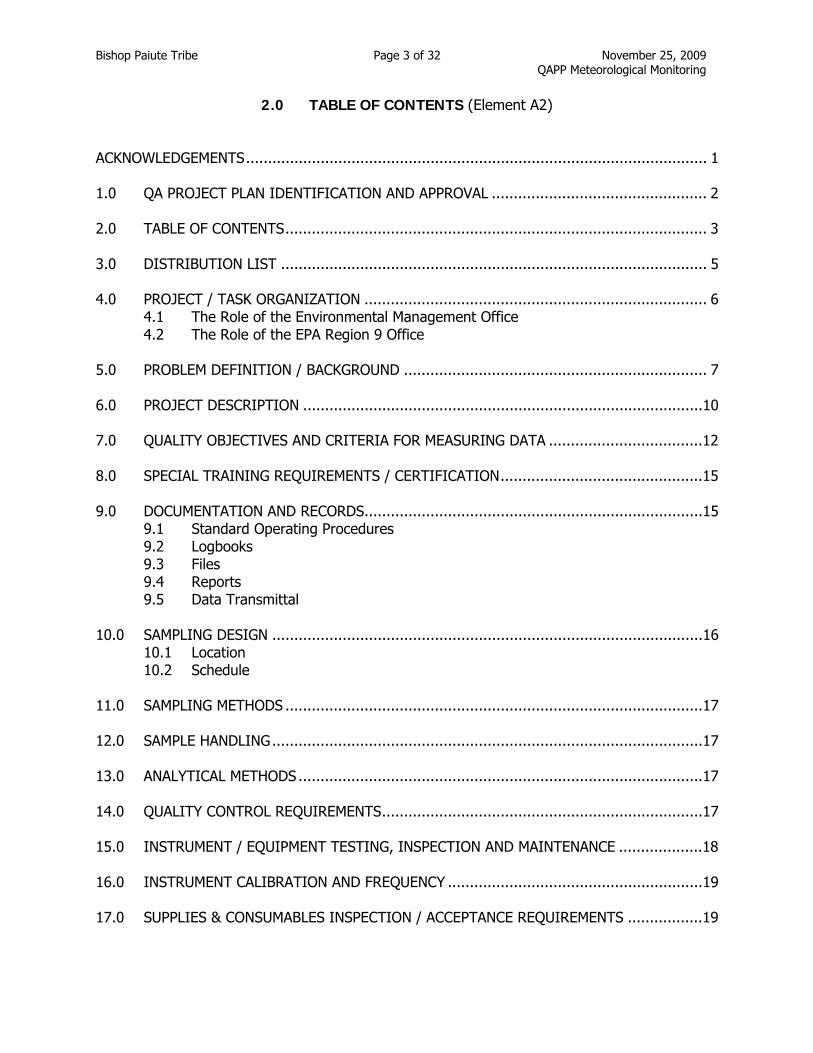
2.0 TABLE OF CONTENTS (Element A2) ACKNOWLEDGEMENTS......................................................................................................... 1 1.0 QA PROJECT PLAN IDENTIFICATION AND APPROVAL ................................................. 2 2.0 TABLE OF CONTENTS................................................................................................ 3 3.0 DISTRIBUTION LIST ................................................................................................. 5 4.0 PROJECT / TASK ORGANIZATION .............................................................................. 6
4.1 The Role of the Environmental Management Office 4.2 The Role of the EPA Region 9 Office
5.0 PROBLEM DEFINITION / BACKGROUND ..................................................................... 7 6.0 PROJECT DESCRIPTION ...........................................................................................10 7.0 QUALITY OBJECTIVES AND CRITERIA FOR MEASURING DATA ...................................12 8.0 SPECIAL TRAINING REQUIREMENTS / CERTIFICATION..............................................15 9.0 DOCUMENTATION AND RECORDS.............................................................................15
9.1 Standard Operating Procedures 9.2 Logbooks 9.3 Files 9.4 Reports 9.5 Data Transmittal
10.0 SAMPLING DESIGN ..................................................................................................16
10.1 Location 10.2 Schedule
11.0 SAMPLING METHODS ...............................................................................................17 12.0 SAMPLE HANDLING..................................................................................................17 13.0 ANALYTICAL METHODS ............................................................................................17 14.0 QUALITY CONTROL REQUIREMENTS.........................................................................17 15.0 INSTRUMENT / EQUIPMENT TESTING, INSPECTION AND MAINTENANCE ...................18 16.0 INSTRUMENT CALIBRATION AND FREQUENCY ..........................................................19 17.0 SUPPLIES & CONSUMABLES INSPECTION / ACCEPTANCE REQUIREMENTS .................19

Bishop Paiute Tribe Page 4 of 32 November 25, 2009 QAPP Meteorological Monitoring
18.0 DATA ACQUISITION REQUIREMENTS........................................................................19 19.0 DATA MANAGEMENT ................................................................................................19
19.1 Data Recording 19.2 Data Processing 19.3 Data Validation 19.4 Data Assessment 19.5 Data Archiving
20.0 ASSESSMENTS AND RESPONSE ACTIONS..................................................................21 21.0 REPORTS TO MANAGEMENT.....................................................................................21 22.0 DATA REVIEW, VALIDATION AND VERIFICATION REQUIREMENTS.............................22 23.0 VALIDATION AND VERIFICATION METHODS .............................................................22 24.0 RECONCILIATION WITH USER REQUIREMENT...........................................................22 REFERENCES ......................................................................................................................23 APPENDIX A – STANDARD OPERATING PROCEDURES...........................................................24
SOP 1. Data Verification and Management SOP 2. Instrument Maintenance and Calibration
LIST OF MAPS Map 1. Owens Valley Topographic Map....................................................................... 8 Map 2. Environmental Management Office and the Bishop Paiute Reservation............... 9 LIST OF PHOTOGRAPHS Photograph 1. Meteorological Equipment Platform and Location............................................. 9 LIST OF TABLES Table 1. Distribution List .............................................................................................. 5 Table 2. Quality Assurance Schedule for Meteorological Monitoring ...............................11 Table 3. Field Measurements.......................................................................................11 Table 4. Calculated Parameters ...................................................................................12 Table 5. System Accuracy and Resolution ....................................................................13 Table 6. Response Characteristics ...............................................................................14 Table 7. Quality Control verification Limits (Audit) ........................................................18 Table 8. Instrument Maintenance ................................................................................19 Table 9. Data Screening Criteria ..................................................................................20 Table A1. Parameters Collected.....................................................................................24 Table A2. Codes on Manual Validation Software .............................................................25 Table A3. Accuracy and Specifications of Meteorological Calibration Instruments..............27

Bishop Paiute Tribe Page 5 of 32 November 25, 2009 QAPP Meteorological Monitoring
3.0 DISTRIBUTION LIST (Element A3) Paper copies of this QAPP have been distributed to the people listed in Table 1. As portions of this QAPP are revised, revised sections or the entire QAPP will sent to the people on this list. Table 1. Distribution List
Name Position Address and email Environmental Management Office
Donna Vasquez Chair, Tribal Environmental Protection Agency
437 Winuba Lane Bishop, CA 93514
Brian Adkins Environmental Manager Environmental Management Office Bishop Paiute Tribe 50 Tu Su Lane Bishop, CA 93514 [email protected]
Chris Lanane Air Monitoring Specialist, GBUAPCD
157 Short Street Bishop, CA 93514 [email protected]
EPA Region 9 Sean Hogan Manager US EPA Region 9
Air Division Technical Support Office – Air 8 75 Hawthorne St San Francisco, CA 94105 [email protected]
Asia Yeary CAA Project Officer US EPA Region 9 – Air 8 75 Hawthorne St San Francisco, CA 94105 [email protected]

Bishop Paiute Tribe Page 6 of 32 November 25, 2009 QAPP Meteorological Monitoring
4.0 PROJECT/TASK ORGANIZATION (Element A4) 4.1 The Role of the Environmental Management Office This tribal office incorporates quality assurance activities as an integral part of any program that gathers environmental data, including work in the field, their own data analysis and reporting, and work from any consulting and contractor laboratories used. The following sections list the responsibilities of staff from the Bishop Paiute Tribe’s Environmental Management Office involved in the Air Quality Program. Environmental Manager – Brian Adkins The Environmental Manger has overall responsibility for managing the Environmental Management Office’s Air Quality Program. Ultimately, the Environmental Manager is responsible for establishing quality assurance (QA) policy and for resolving QA issues that are identified. Major QA-related responsibilities of the Environmental Manager include: Reviewing acquisition packages (contracts, grants, cooperative agreements, inter-
agency agreements) to determine necessary QA requirements; Assuring that the Environmental Management Office develops and maintains this QAPP
and ensuring adherence to the document by staff, outside contractors and consultants as appropriate;
Maintaining regular communication with the field, and other technical staff; Ensuring that all personnel involved in this program have access to any training or QA
information needed to be knowledgeable in QA requirements, protocols, and technology; Reviewing and approving this QAPP; Ensuring that this program is covered by appropriate QA planning documentation (e.g.,
QA project plans and data quality objectives); Ensuring that reviews, assessments and audits are scheduled and completed, and at
times, conducting or participating in these QA activities; Recommending required management-level corrective actions; and Serving as the program QA liaison with EPA regional QA Managers or QA Officers and
the EPA regional Project Officer. Air Quality Specialist – Toni Richards, Ph.D. The Air Quality Specialist is responsible for carrying out the work in the field and ensuring that the data gathered meet the requirements of this QAPP. Responsibilities include: Developing and maintaining this QAPP; Developing QA documentation and providing answers to technical questions; Participating in training and certification activities; Writing and modifying standard operating procedures (SOPs); Verifying that all required QA activities are performed and that measurement quality
standards are met as required in this QAPP; Following all manufacturer's specifications; Performing and documenting preventative maintenance;

Bishop Paiute Tribe Page 7 of 32 November 25, 2009 QAPP Meteorological Monitoring
Documenting deviations from established procedures and methods; Reporting all problems and corrective actions to their supervisor; Assessing and reporting data quality; Preparing and delivering reports to their supervisor; and Flagging suspect data.
Outside Auditor – Chris Lanane, GBUAPCD The auditor from the Great Basin Unified Air Pollution Control District conducts and reviews quality assurance, quality assessment, and quality control activities and ensures that meteorological data meet or exceed the data quality objectives of the tribe. The auditor is responsible for certifying standards used in the field and generating audit reports. 4.2 The Role of the EPA Region 9 Office EPA Regional Offices have been developed to address environmental issues related to the Environmental Management Offices within their region. EPA's Region 9 Office is responsible for the following activities in support of this program: Reviewing, providing assistance with, and approving this QAPP; Responding to requests for technical and policy information and interpretations; Evaluating quality system performance through technical systems audits, performance
evaluations and network reviews, as appropriate for each grant and the Environmental Management Office; and
Making available the technical and quality assurance information developed by EPA to the tribal agencies, and making the tribe aware of any unmet quality assurance needs of the tribal agencies.
5.0 PROBLEM DEFINITION/BACKGROUND (Element A5) The Bishop Paiute Tribe is initiating regular meteorological monitoring as part of an integrated, Reservation-wide environmental protection effort. Tribal goals for environmental protection are to protect human health and natural resources. The objective of the Meteorological Monitoring Program is to characterize ambient meteorological conditions where ambient air quality measurements are made. The meteorological data are used for public information and to support the air monitoring program for particulate matter – PM-10 and PM-2.5, burn permit procedures, fire management and smoke control. The meteorological data are available on-line in real time through the IPS MeteoStar LEADS system and on the Air Program’s website www.bishoptribeemo.com. The meteorological data may be used in conjunction with ambient air quality data for particulate matter to obtain a better understanding of the relationship of pollutant levels and weather patterns. This QAPP describes project methods, establishes data quality objectives, and defines data quality assurance and control methods for meteorological monitoring by the Bishop Paiute Tribe. The QAPP was developed to ensure consistent, repeatable results and to improve the reliability and comparability of data collected.

Bishop Paiute Tribe Page 8 of 32 November 25, 2009 QAPP Meteorological Monitoring
The meteorological monitoring station(s) are located on a 10m tower next to the Environmental Management Office at 50 Tu Su Lane, on the Bishop Paiute Reservation (N37°22’, W118°25’ at an elevation of 4,226 ft.), shown in Maps 1 and 2 and in the photograph below. As shown in Map 1, the Bishop Paiute Reservation is located in the Owens Valley in eastern California, near the Nevada border. The reservation itself comprises 875 contiguous acres and is flanked by the City of Bishop to the East. It is surrounded by private lands and by lands owned by the Los Angeles Department of Water and Power. Approximately 1,350 people live on the Reservation. Map 2 shows the location of the Environmental Management Office on the Bishop Paiute Reservation. Photograph 1 shows the equipment and location. All instruments are located at approximately 10m, with the exception of the barometric pressure sensor which is located on the side of the building at approximately 1.5m and the tipping bucket for precipitation which is mounted on the railing of the air quality platform. Access for maintenance is accomplished by lowering the tower. The platform houses two TEOM/FDMS samplers for particulate matter, one for PM-10 and one for PM-2.5. Map 1. Owens Valley Topographic Map

Bishop Paiute Tribe Page 9 of 32 November 25, 2009 QAPP Meteorological Monitoring
Map 2. Environmental Management Office and the Bishop Paiute Reservation.
Photographs 1. Meteorological Equipment and Air Monitoring Platform and Location

Bishop Paiute Tribe Page 10 of 32 November 25, 2009 QAPP Meteorological Monitoring
While there is no other air quality monitoring in the immediate Bishop and Bishop Reservation vicinity, there is a National Weather Service meteorological station at Bishop Airport. Information from the Bishop Tribe’s air monitoring and meteorological equipment is picked by the National Weather Service in Reno and used in local forecasts. In addition GBUAPCD maintains a portable monitoring station that includes a meteorological and air quality instrument. This portable station is typically located at the nearby community of Laws. Other air monitoring by GBUAPCD is concentrated in the non-attainment areas of the Owens Dry Lake, 60 miles to the South and in the Town of Mammoth Lakes, 45 miles to the North. A new meteorological station is planned to be located on the Big Pine Reservation, 15 miles to the South. The Ft. Independence Reservation, 45 miles to the South, carries out meteorological and PM-10 monitoring, as does the Lone Pine Reservation, 60 miles to the South. Both the Ft. Independence and the Lone Pine Reservation share their data on the web using the IPS MeteoStar LEADS system and this is information is available in real time for comparative purposes.
6.0 PROJECT DESCRIPTION (Element A6)
The objective of the Meteorological Monitoring Project is to characterize ambient meteorological conditions on the Bishop Paiute Reservation. The meteorological data are used to support environmental planning, particularly air quality. Data are available in real time on the web using the IPS Meteostar LEADS software and can be accessed via the Bishop Tribe’s Air Program website www.bishoptribeemo.com . This software enables simultaneous analyses of wind speed and direction and pollutants using wind and pollution rose technology. Parameters measured are listed below: Ambient air temperature Relative humidity Wind speed and direction Barometric pressure Precipitation Solar radiation
Site visits are conducted at least once every two weeks as part of routine calibration of the air monitoring equipment. Maintenance is conducted according to the schedule and audits are conducted annually as shown in Table 2 below. Data are transmitted directly to a computer located on the Air Quality Specialist’s desk via a ZENO 3200 data logger and are automatically sent to the TREX server. Data verification occurs daily and the data are manually validated monthly to ensure proper flagging for proposed AQS submission.

Bishop Paiute Tribe Page 11 of 32 November 25, 2009 QAPP Meteorological Monitoring
Table 2. Quality Assurance Schedule for Meteorological Monitoring Item Daily Monthly Quarterly Semi
annually Annually
Verify that displays on all instruments have values that are reasonable for current meteorological conditions.
X
Print out PM-10 and PM-2.5 pollution and wind roses of wind speed and direction as needed
X
Check instruments for insects, dust, etc., and clean as necessary.
X X X
Calibrate instruments. Repair / replace as necessary.
X X
Schedule audit with GBUAPCD and calibrate / repair / replace instruments as needed based on audit findings.
X X
Field measurements are described in Table 3 below. Because the information is sent to a publicly available website and is widely used by the public, all measurements are collected in English units so that current conditions. The ZENO data logger collects information every 2 seconds and combines it into 5-minute averages. The LEADS system polls the data logger every 15 minutes retrieving three 5-minute packets of information. This information is then combined into 1-hour averages. The one-hour averages are posted on the publicly-available web-pages. The original 5-minute data are available for manual validation. Table 3. Field Measurements Parameter Frequency Units Comment Date Collected by the ZENO
data logger every 2 seconds for 5-minute and 1-hour averages
Month/Day/Year
Time Collected by the ZENO data logger every 2 seconds for 5-minute and 1-hour averages
Hour:Minutes AM or PM
Pacific standard time
Temperature Collected by the ZENO data logger every 2 seconds for 5-minute and 1-hour averages
Degrees (F)
Solar Radiation Collected by the ZENO data logger every 2 seconds for 5-minute and 1-hour averages
Langleys per minute
Barometric Pressure
Collected by the ZENO data logger every 2 seconds for 5-minute and 1-hour averages
Millibars

Bishop Paiute Tribe Page 12 of 32 November 25, 2009 QAPP Meteorological Monitoring
Parameter Frequency Units Comment Wind Speed Collected by the ZENO
data logger every 2 seconds for 5-minute and 1-hour averages
Miles / hour
Wind Direction Collected by the ZENO data logger every 2 seconds for 5-minute and 1-hour averages
Compass direction in degrees
Precipitation Collected by the ZENO data logger every 2 seconds for 5-minute and 1-hour averages
Inches (cumulative for relevant interval)
Relataive Humidity
Collected by the ZENO data logger every 2 seconds for 5-minute and 1-hour averages
Percent relative humidity
Daytime relative humidity is extremely low in this high desert environment, ranging from 10 to 15%.
In addition, to the basic measurements listed in Table 3, the software calculates the following additional parameters, listed in Table 4. Table 4. Calculated Parameters Parameter Units Definition Resultant Wind Speed Miles per hour 5-minute wind speeds and directions for the hour are
converted into a single hourly vector. Resultant wind speed is the magnitude of this vector.
Resultant Wind Direction Degrees 5-minute wind speeds and directions for the hour are converted into a single hourly vector. Resultant wind direction is the direction of this vector.
Maximum Wind Gust Miles per hour Peak wind speed during the hour. Standard Deviation of Horizontal Wind Direction
Degrees A measure of the variability of the direction from which the wind is blowing.
Finally for the monthly summaries of each parameter, the software calculates the following summary statistics: Maximum value Second highest value Minimum value Average value Standard deviation Data capture (data completeness)
7.0 QUALITY OBJECTIVES AND CRITERIA FOR MEASURING DATA (Element A7) The meteorological data from this project are used for public information and to support the air quality particulate monitoring program for PM-10 and PM-2.5, burn permit procedures, fire and smoke management. Information is available in real time on the web at the Bishop Tribe’s Air Quality Program website www.bishoptribeemo.com and unedited data are picked by AIRNOW and the National Weather Service. Validate data will be submitted to AQS in the near future.

Bishop Paiute Tribe Page 13 of 32 November 25, 2009 QAPP Meteorological Monitoring
Characterize weather conditions at the site Qualitatively and quantitatively assess weather conditions influencing the tribal land and
inform tribal members of current conditions on a daily basis Correlate weather conditions with other resource data to inform a variety of programs
and departments managing multiple resources Combine wind speed and direction with particulate pollutant concentrations to develop
wind and pollutant roses to obtain a better understanding of on- and off-reservation sources
Provide information to outside agencies for a variety of applications, such as GBUAPCD (to assist in evaluating compliance issues), the National Forest Service (for the management of controlled burns and wildfire use), AIRNOW (for the calculation of the AQI and other measures) and the National Weather Service (for local forecasting)
Determine if there is a need for further actions to ensure human health and welfare and ecological integrity are protected.
Quality assurance (QA) procedures are required to insure that the data collected meet standards of reliability and allowable error. QA procedures include site inspections, independent audits, calibrations as necessary, data screening, data review and validation, and preventive maintenance. Data review and validation is a process in which suspect data are identified and flagged for additional review, possible screening and corrective action as necessary. The data validation process provides an additional level of quality assurance for the monitoring program. The data collected are used for public information and are also part of the ambient air-monitoring program whereby meteorological information is combined with particulate monitoring information. Thus, instrument characteristics are compared a stringent set of criteria for meteorological data, recommended by EPA for modeling purposes (EPA Meteorological Monitoring Guidance for Regulatory Modeling Applications, EPA-454/R-99-005, February, 2000). The results of the comparison of instrument specifications to criteria are shown in Tables 5 and 6. Table 5. System Accuracy and Resolution
Variable Criteriaa Instrument Specificationsb Comparison Accuracy Resolution Accuracy Resolution Wind speed Climatronics F460
0.2m/s (0.45mph) or 1% whichever is greater
0.1m/s (0.22mph)
0.07m/s (0.15mph) or 1% whichever is greater
0.2m/s (0.45mph)
Specifications meet or exceed criteria
Wind direction Climatronics F470
5 degrees 1.0 degree 2 degrees 1 degree Specifications meet or exceed criteria
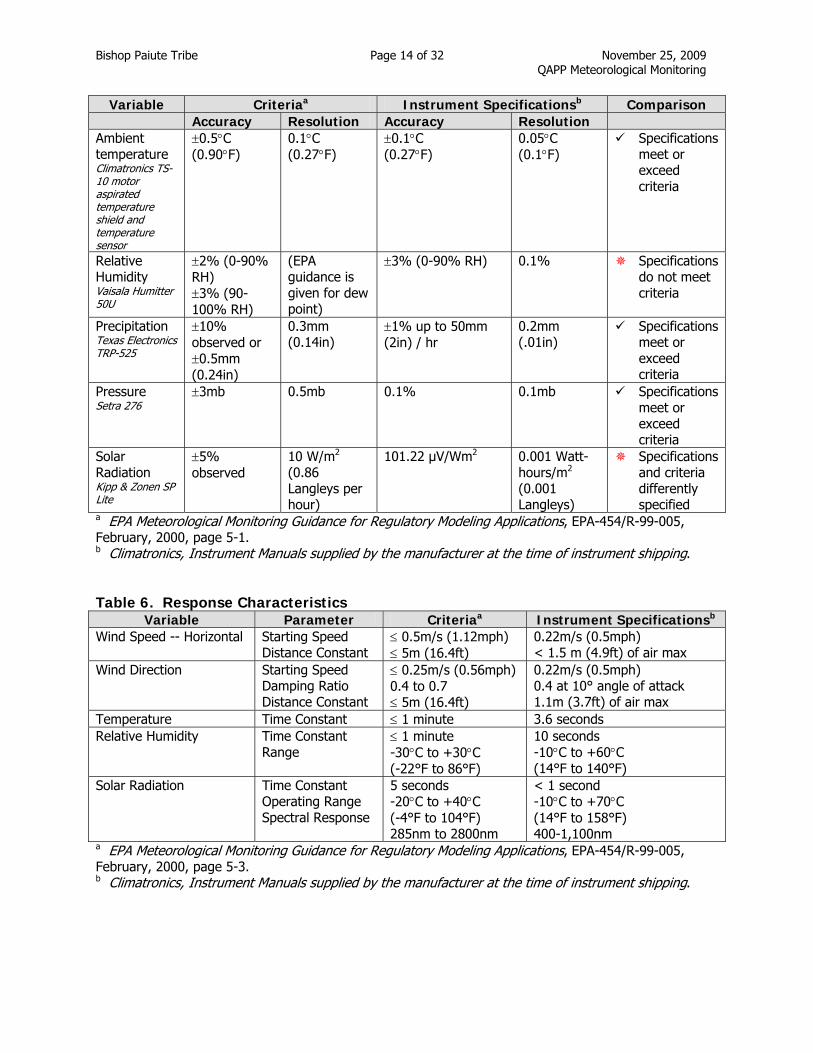
Bishop Paiute Tribe Page 14 of 32 November 25, 2009 QAPP Meteorological Monitoring
Variable Criteriaa Instrument Specificationsb Comparison Accuracy Resolution Accuracy Resolution Ambient temperature Climatronics TS-10 motor aspirated temperature shield and temperature sensor
0.5C (0.90F)
0.1C (0.27F)
0.1C (0.27F)
0.05C (0.1F)
Specifications meet or exceed criteria
Relative Humidity Vaisala Humitter 50U
2% (0-90% RH) 3% (90-100% RH)
(EPA guidance is given for dew point)
3% (0-90% RH) 0.1% Specifications do not meet criteria
Precipitation Texas Electronics TRP-525
10% observed or 0.5mm (0.24in)
0.3mm (0.14in)
1% up to 50mm (2in) / hr
0.2mm (.01in)
Specifications meet or exceed criteria
Pressure Setra 276
3mb 0.5mb 0.1% 0.1mb Specifications meet or exceed criteria
Solar Radiation Kipp & Zonen SP Lite
5% observed
10 W/m2
(0.86 Langleys per hour)
101.22 µV/Wm2 0.001 Watt-hours/m2
(0.001 Langleys)
Specifications and criteria differently specified
a EPA Meteorological Monitoring Guidance for Regulatory Modeling Applications, EPA-454/R-99-005, February, 2000, page 5-1. b Climatronics, Instrument Manuals supplied by the manufacturer at the time of instrument shipping. Table 6. Response Characteristics
Variable Parameter Criteriaa Instrument Specificationsb Wind Speed -- Horizontal Starting Speed
Distance Constant 0.5m/s (1.12mph) 5m (16.4ft)
0.22m/s (0.5mph) < 1.5 m (4.9ft) of air max
Wind Direction Starting Speed Damping Ratio Distance Constant
0.25m/s (0.56mph) 0.4 to 0.7 5m (16.4ft)
0.22m/s (0.5mph) 0.4 at 10° angle of attack 1.1m (3.7ft) of air max
Temperature Time Constant 1 minute 3.6 seconds Relative Humidity Time Constant
Range 1 minute -30C to +30C (-22°F to 86°F)
10 seconds -10C to +60C (14°F to 140°F)
Solar Radiation Time Constant Operating Range Spectral Response
5 seconds -20C to +40C (-4°F to 104°F) 285nm to 2800nm
< 1 second -10C to +70C (14°F to 158°F) 400-1,100nm
a EPA Meteorological Monitoring Guidance for Regulatory Modeling Applications, EPA-454/R-99-005, February, 2000, page 5-3. b Climatronics, Instrument Manuals supplied by the manufacturer at the time of instrument shipping.

Bishop Paiute Tribe Page 15 of 32 November 25, 2009 QAPP Meteorological Monitoring
8.0 SPECIAL TRAINING REQUIREMENTS/CERTIFICATION (Element A8) Workshops and courses hosted by the Institute for Tribal Environmental Professionals (ITEP), the California Air Resources Board (CARB) and informal training with staff from GBUAPCD will available to project personnel. Records on personnel qualifications and training are maintained in the Environmental Management Office as a part of grant records and are accessible for review during audit activities. Adequate education and training are integral to any monitoring program that strives for reliable and comparable data. Training is aimed at increasing the effectiveness of employees and the Environmental Management Office. All personnel directly involved with this project will have adequate time to read this document and relevant references (16 hours minimum).
9.0 DOCUMENTATION AND RECORDS (Element A9) 9.1 Standard Operating Procedures (SOPs) These SOPs describe data verification and management and proper instrument maintenance and calibration. They follow the quality assurance schedule given in Table 2 above. The procedures are included as Appendix A. SOP 1. Data Verification and Management – describes the procedures for daily
verification and monthly manual validation. Data back up is handled through the IPS MeteoStar LEADS system during the course of routine server back-ups.
SOP 2. Instrument Maintenance and Calibration – describes routine inspections,
maintenance and calibration for all instruments. 9.2 Logbooks A log of all site activities is a major component of the quality procedures. All maintenance and record keeping is logged with date, time, and initials. The logbook is kept in the Environmental Management Office, at the Air Quality Specialist’s desk when it is not in the field during site visits. 9.3 Files Files are maintained at the Air Quality Specialist’s desk and include logbooks, maintenance records, audit reports, summary reports and analyses. Data backups are completed through the IPS MeteoStar LEADS system as a part of routine server back-ups. 9.4 Reports Data are available on the Bishop Tribe’s Air Program website www.bishoptribeemo.com. This website contains daily and monthly information summarized in hourly averages, along with summary statistics.

Bishop Paiute Tribe Page 16 of 32 November 25, 2009 QAPP Meteorological Monitoring
As needed, special reports are generated relating current weather conditions as recorded at the EMO meteorological station to historical patterns from data collected by the National Climatic Data Center. These reports are used to inform other tribal programs regarding resource management. As needed wind speed and direction information is combined with particulate pollutant information in the form of wind and pollution roses to obtain a better understanding of sources on and off the Reservation. Quarterly progress reports are provided to the appropriate Project Officer for the duration of relevant grant. 9.5 Data Transmittal All data transmittal is automated. Data are collected automatically from all sensors by the ZENO data logger and assembled into 5-minute averages. The IPS MeteoStar LEADS system polls the ZENO every 5 minutes and collects the 5-minute averages. The 5-minute averages are then combined into 1-hour averages for posting on the publicly available web pages. Detailed 5-minute and 1-hour data are available electronically for manual validation. Any editing is specifically documented directly in notes appended to the affected records and in the electronic mail accompanying the data transfer. Validated data may be transferred to the AQS data system using the LEADS software. Accuracy of data transmittal is evaluated by the auditor during the course of comprehensive annual system audits.
10.0 SAMPLING DESIGN (Element B1) 10.1 Location(s) The meteorological equipment is located on a 10 meter tower next to the Environmental Management Office. This location was chosen because it is representative of conditions on the Bishop Paiute Reservation and meets the majority of EPA siting requirements. In addition, the site offers the following benefits: It is typical of the weather conditions influencing the Bishop Reservation and wider
Bishop community’s airshed, It allows the Bishop Paiute Tribes’ Environmental Management Office to evaluate the 24-
hour and seasonal wind speed and direction of pollution sources likely to affect the tribal community;
It provides data suitable for evaluating factors that help evaluate potential pollutant deposition effects on the community;
It helps us to inform tribal departments about local weather conditions that may impact planned activities;
In the future, it may allow the use of meteorological data to assess health exposure effects from off-site pollution sources.

Bishop Paiute Tribe Page 17 of 32 November 25, 2009 QAPP Meteorological Monitoring
The locations for the met station will be re-evaluated annually or more frequently, if important new information is obtained from the met stations or from outside sources such as GBUAPCD or the National Weather Service (NWS). 10.2 Schedule Equipment was purchased and installed in the fall of 2004, with support from EPA’s General Assistance Program grant. The station has been in continuous operation since then. The meteorological station supports PM-10 and PM-2.5 monitoring. A second, small meteorological station, installed in fall 2001 is used for public information purposes.
11.0 SAMPLING METHODS (Element B2) Sensor data are collected automatically every 2 seconds by the ZENO data logger, which compiles 5-minute averages. The LEADS system collects the 5-minute averages every 15 minutes and assembles them into 1-hour averages for website posting. 5-minute and 1-hour data are available for manual validation. Data verification follows the procedures described in SOP 1, included in Appendix A.
12.0 SAMPLE HANDLING (Element B3) The meteorological data does not require laboratory or chain of custody handling procedures. Data handling is completely automated. Data are automatically backed up through routine IPS MeteoStar server back-ups.
13.0 ANALYTICAL METHODS (Element B4) The instruments used to gather meteorological data are self-contained and do not require any actual analyses by the operator other than the creation of daily, monthly and annual reports which are generated automatically using the IPS MeteoStar LEADS software and are available on the web. Special reports are generated from existing data bases as needed.
14.0 QUALITY CONTROL REQUIREMENTS (Element B5) Qualilty Control (QC) verification checks are conducted both by the Air Quality Specialist and by the GBUAPCD during the course of semi-annual audits. Because the equipment is intended primarily for public information, it is calibrated on site by the Air Quality Specialist. Necessary repairs, replacements are carried out by the manufacturer. Audit reports are maintained at the Air Quality Specialist’s desk. The verifications performed and their limits and frequencies are described in Table 7.

Bishop Paiute Tribe Page 18 of 32 November 25, 2009 QAPP Meteorological Monitoring
Table 7. Quality Control Verification Limits (Audit) Sensor Parameter Ranges for
verification / audit
Acceptance Criteria
Frequency of Verification by Site Operator
Frequency of Audit by GBUAPCD
Wind Speed Speed Accuracy Starting threshold
Six speeds (including zero)
At WS ≤ 5m/s (11.18mph) ±0.25m/s (0.56mph) At WS > 5m/s (11.18 mph) ±5% 0.25m/s (0.56 mph)
6 months 6 months
Wind Direction
Accuracy Linearity Starting threshold
East-West alignment on mounting arm Four cardinal points
Orientation verified Input ±5° 0.5m/s (1.12mph)
6 months 6 months
Temperature Accuracy Three temperatures Input ±0.5°C (0.9°F)
6 months 6 months
Relative Humidity
Accuracy Comparison to collocated standard at ambient conditions
± 5% RHa 6 months 6 months
Barometric Pressure
Accuracy Comparison to collocated standard at ambient conditions
Input ± 1% 6 months 6 months
Precipitation Accuracy Compared to a known volume dripped slowly into the funnel
Input ± 10% 6 months 6 months
Solar Radiation
Accuracy Zero Zero when covered 6 months 6 months
a Daytime relative humidity is low in this high desert environment, typically ranging from 10 to 15%. This is at the low extreme of the operating range of most instruments.
15.0 INSTRUMENT/EQUIPMENT TESTING, INSPECTION AND MAINTENANCE (Element B6)
Instruments will be tested upon receipt for proper operation and achievement of the limits in Table 7. Instrument inspections occur at least quarterly and when the instruments appear to be producing erratic or wrong data. Instrument verification occurs every 6 months and audits are conducted annually. Maintenance will follow the schedule in Table 8.

Bishop Paiute Tribe Page 19 of 32 November 25, 2009 QAPP Meteorological Monitoring
Table 8. Instrument Maintenance Sensor Supplier Recommended Action and Frequency
Wind Speed Climatronics Replace when cups will not rotate freely or after audit findings
Wind Direction Climatronics Replace when vane will not rotate freely or after audit findings
Temperature Climatronics Replace following verification or audit findings Relative Humidity Climatronics Replace following verification or audit findings Precipitation Climatronics Replace following verification or audit findings Barometric Pressure Climatronics Replace following verification or audit findings
16.0 INSTRUMENT CALIBRATION AND FREQUENCY (Element B7) Calibration is defined as changing the response of a sensor by adjustment. The manufacturer calibrates the meteorological sensors at the time of purchase. Continued sensor stability is assessed through site visits, routine maintenance and verifications. If the performance of any sensor is out of the range specified in Table 6, or if the equipment is moved or damaged, verification is conducted to determine if the instrument is still operating within limits or if it should be sent to the manufacturer for calibration and/or repair. Verification by the Air Quality Specialist occurs every 6 months and by GBUAPCD during semi-annual audits. Instruments are then calibrated as needed.
17.0 SUPPLIES & CONSUMABLES INSPECTION/ACCEPTANCE REQUIREMENTS (Element B8)
Instrument and/or equipment supplies are inspected and tested on receipt. The Air Quality Specialist is responsible for routine preventive and corrective maintenance. Replacement parts are typically available within less than a week from the manufacturer.
18.0 DATA ACQUISITION REQUIREMENTS (Element B9) Data from other sources is not required to support this project. Where data is obtained from other sources and referenced in relation to this project, the data are obtained from the National Weather Service or the National Climatic Data Center.
19.0 DATA MANAGEMENT (Element B10) 19.1 Data Recording Site logbooks shall record site inspections, instrument maintenance, repair and replacement; 6 month instrument verifications and semi-annual audit, and instrument calibration, as described in Section 9.

Bishop Paiute Tribe Page 20 of 32 November 25, 2009 QAPP Meteorological Monitoring
Electronic downloaded data records are maintained in a database supported by IPS MeteoSTar. Any edits are documents with notes attached to the relevant records and are documented on hard copy. 19.2 Data Processing Sensor data capture is automated and recorded electronically at the site to the ZENO data logger and from there to the IPS MeteoStar server where the electronic records are maintained. 19.3 Data Validation The site operator conducts data daily screening of the downloaded data, reviews the data against the values listed in Table 9, and identifies missing data, unacceptable shifts in values, and records the problems or errors encountered. The data verifications and reports are reviewed by the auditor and validated during annually system audits. Data on the IPS MeteoStar LEADS system are manually validated and flagged monthly. Table 9. Data Screening Criteria Sensor Screening Criteria for Investigation Wind Speed Between 0 & 44.7m/s (0 & 100mph) (any exceedances verified with nearby NWS
station) Varies by more than 0.45m/s (1mph) for 3 consecutive hours Varies by more than 1.34m/s (3mph) for 12 consecutive hours
Wind Direction Between 0° and 360° Varies by > 1° in 3 hours; and by >10° in 18 hours
Temperature Exceedances of local records independently verified by nearby NWS station Changes do not exceed 5.5°C (10°F) from the previous hour Varies by more than 0.5°C (1°F) for 12 consecutive hours
Relative Humidity Between 0 and 100% Varies by more than 1% from one hour to the next
Precipitation Not greater than 0.25mm (1 inch) per hour Never greater 101mm (4 inches) per 24 hours
Barometric Pressure Always between 850 and 890 mb Varies by 5mb in 3 hours
Solar Radiation Daily peaks below 1.5 Langleys Night is at but not below 0 W/m2
19.4 Data Assessment Data assessment is conducted on an ongoing basis, during daily validations and more extensive monthly validations, when reports are produced, when verifications are conducted, and during site visits. In general, the major criterion for data assessment is reasonableness. The data screening values in Table 8 are used as benchmarks for data reasonableness. Data errors are evaluated during formal and informal instrument verifications. The percent difference between the “known” value and the instrument reading, prior to any adjustments, is used as an estimate of the measurement error from the time of the verification to the last previous verification.

Bishop Paiute Tribe Page 21 of 32 November 25, 2009 QAPP Meteorological Monitoring
Data completeness is determined for each parameter and expressed as a percentage. The data completeness goal is 90% for all parameters. Percent valid data are documented on the IPS MeteoStar LEADS system and represent a gauge of the amount of valid data obtained from a sensor compared with ideal conditions (24 hours per day, 365 days per year). 19.5 Data Archiving Site logbooks, all associated forms, and reports are grouped by calendar year and kept a minimum of five years before archiving. All electronic data is stored on the IPS MeteoStar Server and routinely backed-up. All archived records are stored indefinitely at the Environmental Management Office or in storage procured specifically for this purpose.
20.0 ASSESSMENTS AND RESPONSE ACTIONS (Element C1) The meteorological parameters are automatically measured and electronically logged and stored in the monitoring station’s data logger. The site’s data logger is polled by the LEADS system and records are stored on the IPS MeteoStar Server. The downloaded records are captured on the Bishop Tribe’s Air Program website. The station is visited every 2 weeks during regular verifications of the air monitoring equipment and is examined quarterly to inspect the equipment and sensors, or more frequently as needed. Semi-annual verifications are performed by the Air Quality Specialist at the station for all equipment and sensors. External audits are performed semi-annually by GBUAPCD. The Air Quality Specialist is responsible for inspecting, testing and accepting instruments and supplies, and for reporting to the Environmental Manager equipment and supply needs. The Air Quality Specialist, with approval by the Environmental Manger, is responsible for procurement. The Air Quality Specialist is responsible for performing routine preventive and corrective maintenance. Calibration is performed by the Air Quality Specialist semi-annually or more frequently depending on audit findings. The Air Quality Specialist is responsible for working with the manufacturer on any other major maintenance and/or repair needs.
21.0 REPORTS TO MANAGEMENT (Element C2) Monthly summaries are automatically generated by the IPS MeteoStar LEADS software and are available on-line. Semi-annual verification reports (conducted by the Air Quality Specialist) and semi-annual audit reports (conducted by GBUAPCD) are filed at the Air Quality Specialist’s desk and are available for inspection. Semi-annual audit reports are provided to the Project officer. Quarterly progress reports are provided to the funding Project Officer for the duration of initial funding period.

Bishop Paiute Tribe Page 22 of 32 November 25, 2009 QAPP Meteorological Monitoring
Special reports are developed to discuss data acquisition results and sources of error, assess seasonal trends, and recommend further investigation of site operations as necessary. These may include assessments of trends and comparison with historic data and they may include integrated analyses of meteorological and particulate pollution information. They may be used for program evaluation and to identify recommendations for future equipment modification and/or acquisition.
22.0 DATA REVIEW, VALIDATION AND VERIFICATION REQUIREMENTS (Element D1)
The meteorological instrumentation are verified and operated according to standard operating procedures identified herein and in Appendix A. The data are accompanied by appropriate verification forms, operating and analytical reports. More complete descriptions of the standard operating procedures are included in the Appendix A. The Air Quality Specialist, as identified in Section 4, is responsible for conducting data review and validation. All data verification and internal and external reports are reviewed and approved by the Outside Auditor. The files will contain the indication of the review and approval of the Auditor either as a handwritten note on the top of the page or as a separate page attached to the report.
23.0 VALIDATION AND VERIFICATION METHODS (Element D2) The Air Quality Specialist conducts data screening and control checks of the downloaded data, review the data against the limits listed in Table 6 and identify missing data, unacceptable shifts in values, and record the acceptance, qualification or rejection of data. The data checks will be reviewed by the Outside Auditor. Monthly manual validations using the IPS MeteoStar LEADS software contain electronic notes indicating the reasons behind any flagged data points. Data are flagged using standard EPA AQS qualifiers.
24.0 RECONCILIATION WITH USER REQUIREMENTS (Element D3) The project results and associated variability, accuracy, and precision will be compared with project objectives. If results do not meet criteria established at the beginning of the project, this will be explicitly stated in appropriate reports. Based upon data accuracy some data may be discarded. If so the problems associated with data collection and analysis, reasons data were discarded, and potential ways to correct sampling problems will be reported. In some cases accuracy project criteria may be modified. In this case the justification for modification, problems associated with collecting and analyzing data, as well as potential solutions will be reported.
Bishop Paiute Tribe Page 23 of 32 November 25, 2009 QAPP Meteorological Monitoring
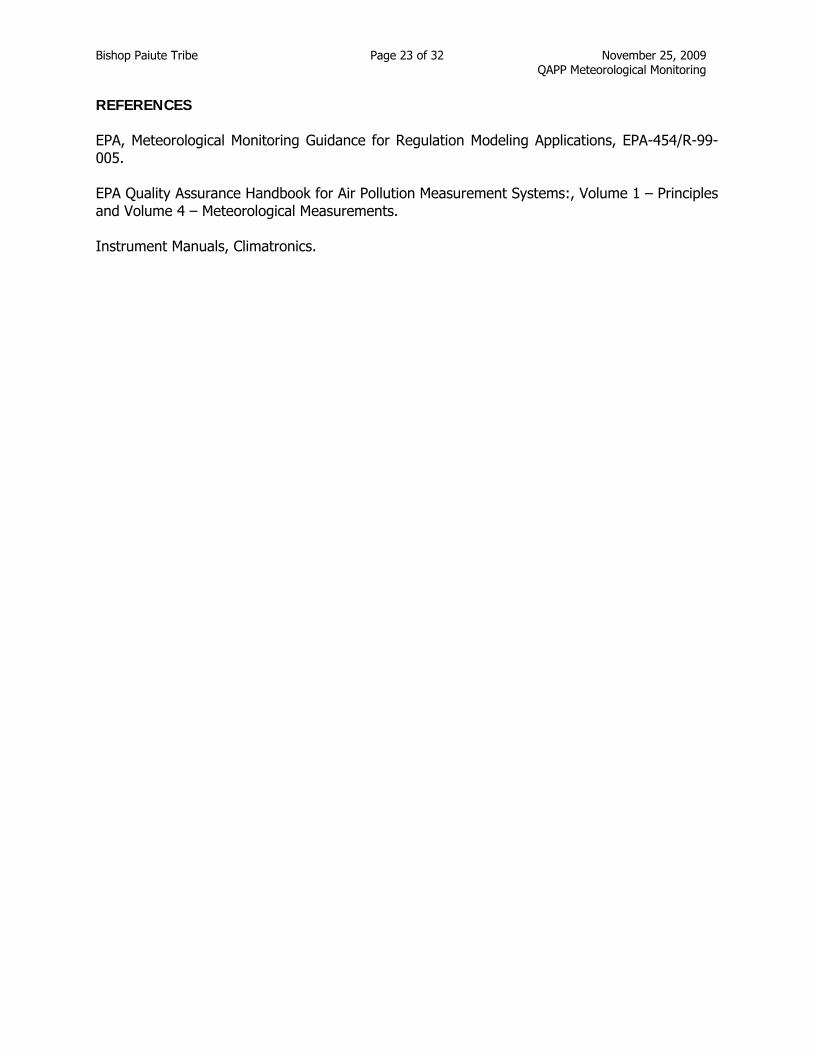
REFERENCES EPA, Meteorological Monitoring Guidance for Regulation Modeling Applications, EPA-454/R-99-005. EPA Quality Assurance Handbook for Air Pollution Measurement Systems:, Volume 1 – Principles and Volume 4 – Meteorological Measurements. Instrument Manuals, Climatronics.

Bishop Paiute Tribe Page 24 of 32 November 25, 2009 QAPP Meteorological Monitoring
APPENDIX A STANDARD OPERATING PROCEDURES
SOP 1. Data Verification and Management This SOP describes the procedures for data transfer and manual validation. All data are in analog form and are collected as voltages and digitized in the ZENO data logger. Data Transfer – Analog and contact closure information is automatically transferred to the ZENO data logger. This data logger is connected to a dedicated computer which automatically transfers data to the remotely-located server, using the LEADS software developed by IPS MeteoStar. Data are automatically transferred to the US EPA AirNow data base and to the National Weather Service. The parameters transferred are listed in Table A.1 below. Table A.1. Parameters Collected Parameter Frequency Units Comment Date Collected by the ZENO
data logger every 2 seconds for 5-minute and 1-hour averages
Month/Day/Year
Time Collected by the ZENO data logger every 2 seconds for 5-minute and 1-hour averages
Hour:Minutes AM or PM
Pacific standard time
Temperature Collected by the ZENO data logger every 2 seconds for 5-minute and 1-hour averages
Degrees (F)
Solar Radiation Collected by the ZENO data logger every 2 seconds for 5-minute and 1-hour averages
Langleys per minute
Barometric Pressure
Collected by the ZENO data logger every 2 seconds for 5-minute and 1-hour averages
Millibars
Wind Speed Collected by the ZENO data logger every 2 seconds for 5-minute and 1-hour averages
Miles / hour
Wind Direction Collected by the ZENO data logger every 2 seconds for 5-minute and 1-hour averages
Compass direction in degrees
Precipitation Collected by the ZENO data logger every 2 seconds for 5-minute and 1-hour averages
Inches (cumulative for relevant interval)

Bishop Paiute Tribe Page 25 of 32 November 25, 2009 QAPP Meteorological Monitoring
Parameter Frequency Units Comment Relataive Humidity
Collected by the ZENO data logger every 2 seconds for 5-minute and 1-hour averages
Percent relative humidity
Daytime relative humidity is extremely low in this high desert environment, ranging from 10 to 15%.
Validation is carried out monthly using the Manual Validation software developed by IPS MeteoStar (MeteoStar LEADS Training Manual). Standard AQS validation codes are appended to the data at the end of each month. Table A.3 below contains these codes. Because this software is designed to accommodate many different types of monitors, only certain codes are regularly used. The codes most commonly used are highlighted in light blue. Table A.3. Codes on Manual Validation Software Flag Code Priority Description NOL 9987 14 Instrument not on line – seen before first successful calibration of a parameter AQI 9979 13 Manually set to invalidate data QRE 9985 12 Manually set to invalidate data CAL 9995 11 Calibration in progress – automatically set by the ZENO-based communications with Dasibi
SPN 9998 10 Span check in progress – automatically set by the ZENO-based communications with
Dasibi SPZ 9998 9 Span-Zero check in progress – automatically set by the ZENO-based communications with
Dasibi MAL 9978 8 Instrument malfunction – this is manually set to invalidate data QAS 9992 7 Quality Assurance check in progress – manually set during verifications and audits PMA 9993 6 Instrument in preventative maintenance mode – manually set LIM 9980 5 Data failed one or more automatic quality checks – automatically set FEW 9975 4 Not enough samples to create an hourly average – automatically set NEG 9979 3 Data failed NEG test – automatically below established minimum MUL 9979 2 Related parameters do not balance – automatically set LST 9983 1 Lost or missing data – insufficient data for sample period VAL N/A 0 Data if valid Analysis – A variety of analytic files are created in web pages available on the IPS MeteoStar LEADS. The web pages most commonly used for analysis are the “Monthly Summary” and “CAMS Data Printout” (MeteoStar LEADS Training). Pollution roses that combine meteorological and air quality data from the Bishop Tribe’s monitoring stations are also available using the Manual Validation software and are created as necessary, at a minimum at the end of each month summarizing the previous month. AQS Submission will be initiated in Spring 2005 using the Manual Validation software.

Bishop Paiute Tribe Page 26 of 32 November 25, 2009 QAPP Meteorological Monitoring
SOP 2. Instrument Maintenance and Calibration This SOP describes routine inspections, maintenance and calibration for all instruments. Quarterly Inspections include a visual inspection of all instruments for insect and bird damage, and / or loose parts due to vibration or wind. The results of quarterly inspections are recorded on the form “Meteorological Instrument Quarterly Inspection,” attached.
1. All instruments – verify that all attachments are secure. Check nuts and bolts for tightness and tighten as necessary.
2. Radiation shield – visually verify that the louvers are free of any debris and that air can circulate freely. Clean with compressed air if necessary.
3. Windspeed and direction – verify that cups on anemometer turn freely and that wind vane moves freely.
4. Rain gauge – remove cover and verify that tipping bucket is free of debris. Clean with compressed air if necessary. Reinstall cover securely.
Semi-Annual Calibrations follow the procedures established by GBUAPCD for the semi-annual audit and include the following:
1. Three-point temperature comparisons with Omega Handheld Thermometer. Standard: input ± 1°C (1.8°F).
2. Side-by-side relative humidity comparisons with Oakton Themohygrometer. Standard: input ± 5 %.
3. Side-by-side verification of barometric pressure with Streamline Pro MultiCal. Standard: input ± 1%.
4. Verification of orientation of mounting arm of wind vane using Brunton Transit. Standard: record information.
5. Manual verification of 4 cardinal points for wind direction relative to mounting arm. Standard: input ± 5° per manufacturer’s specifications.
6. Verify wind direction starting threshold using RM Young Anemometer Torque Disk. Standard: 5.0 g/cm = 4.1 mph starting threshold on direction.
7. Verification of wind speed using RM Young Selectable Speed Anemometer Drive for 6 speeds. Standard: At WS ≤ 5 m/s (11.18mph) ±0.25 m/s (0.56mph); at WS > 5 m/s (11.18mph) ±5%.
8. Verify of wind speed starting threshold using RM Young Anemometer Torque Disk. Standard: 0.2 g/cm = .38 mph starting threshold on speed.
9. Verification of precipitation gauge using Texas Electronics Calibration Kit. Standard: input ±10%
10. Verification of zero on pyranometer by covering completely. No Standard.
The accuracy and specifications of the calibration instruments are listed in the Table A3 below.
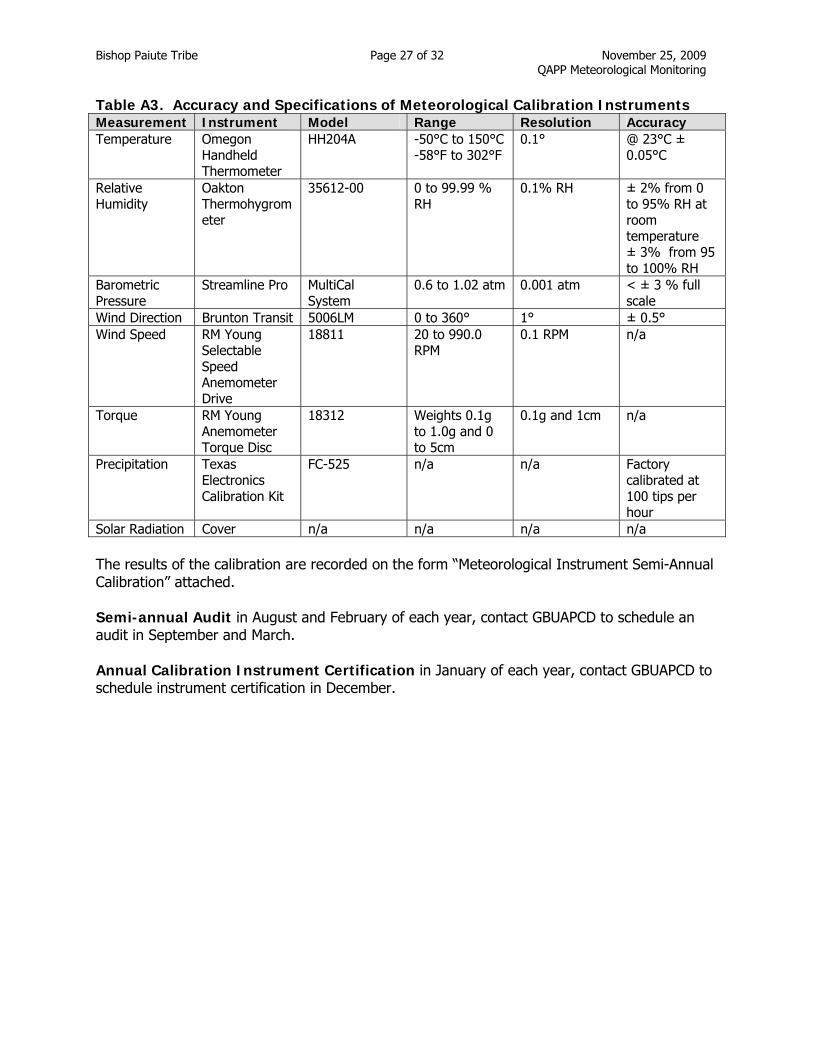
Bishop Paiute Tribe Page 27 of 32 November 25, 2009 QAPP Meteorological Monitoring
Table A3. Accuracy and Specifications of Meteorological Calibration Instruments Measurement Instrument Model Range Resolution Accuracy Temperature Omegon
Handheld Thermometer
HH204A -50°C to 150°C -58°F to 302°F
0.1° @ 23°C ± 0.05°C
Relative Humidity
Oakton Thermohygrometer
35612-00 0 to 99.99 % RH
0.1% RH ± 2% from 0 to 95% RH at room temperature ± 3% from 95 to 100% RH
Barometric Pressure
Streamline Pro MultiCal System
0.6 to 1.02 atm 0.001 atm < ± 3 % full scale
Wind Direction Brunton Transit 5006LM 0 to 360° 1° ± 0.5° Wind Speed RM Young
Selectable Speed Anemometer Drive
18811 20 to 990.0 RPM
0.1 RPM n/a
Torque RM Young Anemometer Torque Disc
18312 Weights 0.1g to 1.0g and 0 to 5cm
0.1g and 1cm n/a
Precipitation Texas Electronics Calibration Kit
FC-525 n/a n/a Factory calibrated at 100 tips per hour
Solar Radiation Cover n/a n/a n/a n/a The results of the calibration are recorded on the form “Meteorological Instrument Semi-Annual Calibration” attached. Semi-annual Audit in August and February of each year, contact GBUAPCD to schedule an audit in September and March. Annual Calibration Instrument Certification in January of each year, contact GBUAPCD to schedule instrument certification in December.

Bishop Paiute Tribe Page 28 of 32 November 25, 2009 QAPP Meteorological Monitoring
BISHOP PAIUTE TRIBE
ENVIRONMENTAL MANAGEMENT OFFICE
METEOROLOGICAL INSTRUMENT QUARTERLY CHECK
Operator Toni Richards Date Start Time
(PST) End Time
(PST)
All Instruments Check Bolts
Comments
Fan Aspirated Temperature Shield Check for debris
Clean with compressed air if needed
Wind Speed and Direction Verify anemometer cups rotate freely
Verify wind vane moves freely
Visually verify orientation on support arm (magnetic North)
Rain Guage Remove cover and ensure that tipping bucket is clean of debris
Clean with compressed air if needed and replace cover securely.
Annotate data base to indicate records during which maintenance was performed. Comments

Bishop Paiute Tribe Page 29 of 32 November 25, 2009 QAPP Meteorological Monitoring
BISHOP PAIUTE TRIBE
ENVIRONMENTAL MANAGEMENT OFFICE
METEOROLOGICAL INSTRUMENT SEMI-ANNUAL CALIBRATION
Operator Toni Richards Date Start Time
(PST) End Time
(PST)
Temperature – Three point comparison Reading on Omega Handheld Thermometer
Reading on ZENO data logger
Comparison
Standard
°F
°F
°F
± 1.8°F
°F
°F
°F
± 1.8°F
°F
°F
°F
± 1.8°F
Relative Humidity – Side-by-side comparison Reading on Oakton Thermohygrometer
Reading on ZENO data logger
Comparison
Standard
%
%
%
± 5%
Barometric Pressure – Side-by-side comparison Reading on Streamline Pro
Reading on ZENO data logger
Comparison
Standard
atm
atm
%
± 1%
Verification of Orientation of Mounting Arm of Wind Vane Magnetic North Reading on Brunton
Transit Comparison
Standard
0° with no adjustment for declinations
°
%
Record result

Bishop Paiute Tribe Page 30 of 32 November 25, 2009 QAPP Meteorological Monitoring
Wind Direction – 4 Cardinal Points Reading on ZENO data logger
True Orientationt Comparison
Standard
°
0° / 360° °
± 5°
°
90° °
± 5°
°
180° °
± 5°
°
270° °
± 5°
Verify Threshold for Wind Direction Observed threshold Standard
g/cm
5.0 g/cm = 4.1 mph starting threshold on direction
Wind Speed – 6 Audit Points Audit Point Reading on ZENO data
logger Comparison
Standard
0 RPM 0 MPH MPH
MPH
± 1 MPH
150 RPM 8.19 MPH MPH
MPH
± 1 MPH
300 RPM 16.07 MPH MPH
MPH
± 1 MPH
600 31.84 MPH MPH
%
± 5 %
1200 63.38 MPH MPH
%
± 5 %
1500 79.16 MPH MPH
%
± 5 %
Verify Threshold for Wind Speed Observed threshold Standard
g/cm
0.2 g/cm = .38 mph starting threshold on speed
Precipitation – use brass #65 nozzle Expected reading Reading on ZENO data
logger Comparison
Standard
87 ± 2 counts 1 inch
inches
%
± 10%
Solar Radiation – verify zero Expected reading Reading on
GrowWeather Console Comparison
Standard
0 Watts/m2
%
n/a
Complete quarterly maintenance as needed.

Bishop Paiute Tribe Page 31 of 32 November 25, 2009 QAPP Meteorological Monitoring
Annotate data base to indicate records during which maintenance was performed. If instrument does not meet calibration standard, follow the following steps:
1. Repeat calibration, if instrument continues to fail to meet standard; 2. Verify calibration device against audit device used by GBUAPCD, if calibration device is
accurate 3. Request audit from GBUAPCD to re-check instrument, if instrument continues to fail to
meet standrard 4. Repair and / or replace if necessary.
Comments