quality, cost, delivery: measuring business performance
TRANSCRIPT

Published by the Department of Trade and Industry. www.dti.gov.uk
© Crown Copyright. URN 04/814; 03/05
ACHIEVING BEST PRACTICE
IN YOUR BUSINESS
Quality, cost, delivery:measuring businessperformance
Contents
Read the steps that are relevant to your business.
02 What is QCD?
04 Step 1: Not Right First Time – doesyour company end up with a high levelof defective products/waste?
06 Step 2: Delivery Schedule Achievement– would you like to deliver tocustomers on time, every time?
08 Step 3: People Productivity – wouldyou like to raise staff productivity?
10 Step 4: Stock Turns – do you need totighten stock control?
To stay ahead of the market, it’s crucial to monitor your company’sperformance, however big or small your business is. Once you’vegauged how well you are doing, you can start improving the wayyou do things – and boost your profits.
This brochure is for: Companies that want to take a fresh look attheir business processes, with the goal of increasing profitabilityand delivering exceptional customer service. Companies outsidemanufacturing can adapt the principles to their industry.
It covers: The key roles of quality, cost and delivery (QCD). Thisapproach puts your whole business under the microscope and aimsto raise standards in seven key areas: quality of finished products;on-time delivery; staff productivity; stock levels; efficiency ofequipment; added value and floor space utilisation.
12 Step 5: Overall EquipmentEffectiveness – are you using yourequipment to maximum capacity?
14 Step 6: Value Added Per Person – is each team member adding value to products?
16 Step 7: Floor Space Utilisation – are you making best use of your premises?
18 Case studies – read how othercompanies are reducing waste andcutting costs
24 Further help and advice
The DTI drives our ambition of‘prosperity for all’ by working tocreate the best environment forbusiness success in the UK.We help people and companiesbecome more productive bypromoting enterprise, innovation and creativity.
We champion UK business at homeand abroad. We invest heavily inworld-class science and technology.We protect the rights of workingpeople and consumers. And westand up for fair and open markets in the UK, Europe and the world.
Achieving best practice in your business is a key
theme within DTI’s approach to business support,
providing ideas and insights into how to improve
performance across your business. By showing
what works in other businesses, we can help you
see which approaches can help you, and then
support you in implementation. This brochure
focuses on these solutions.
0302
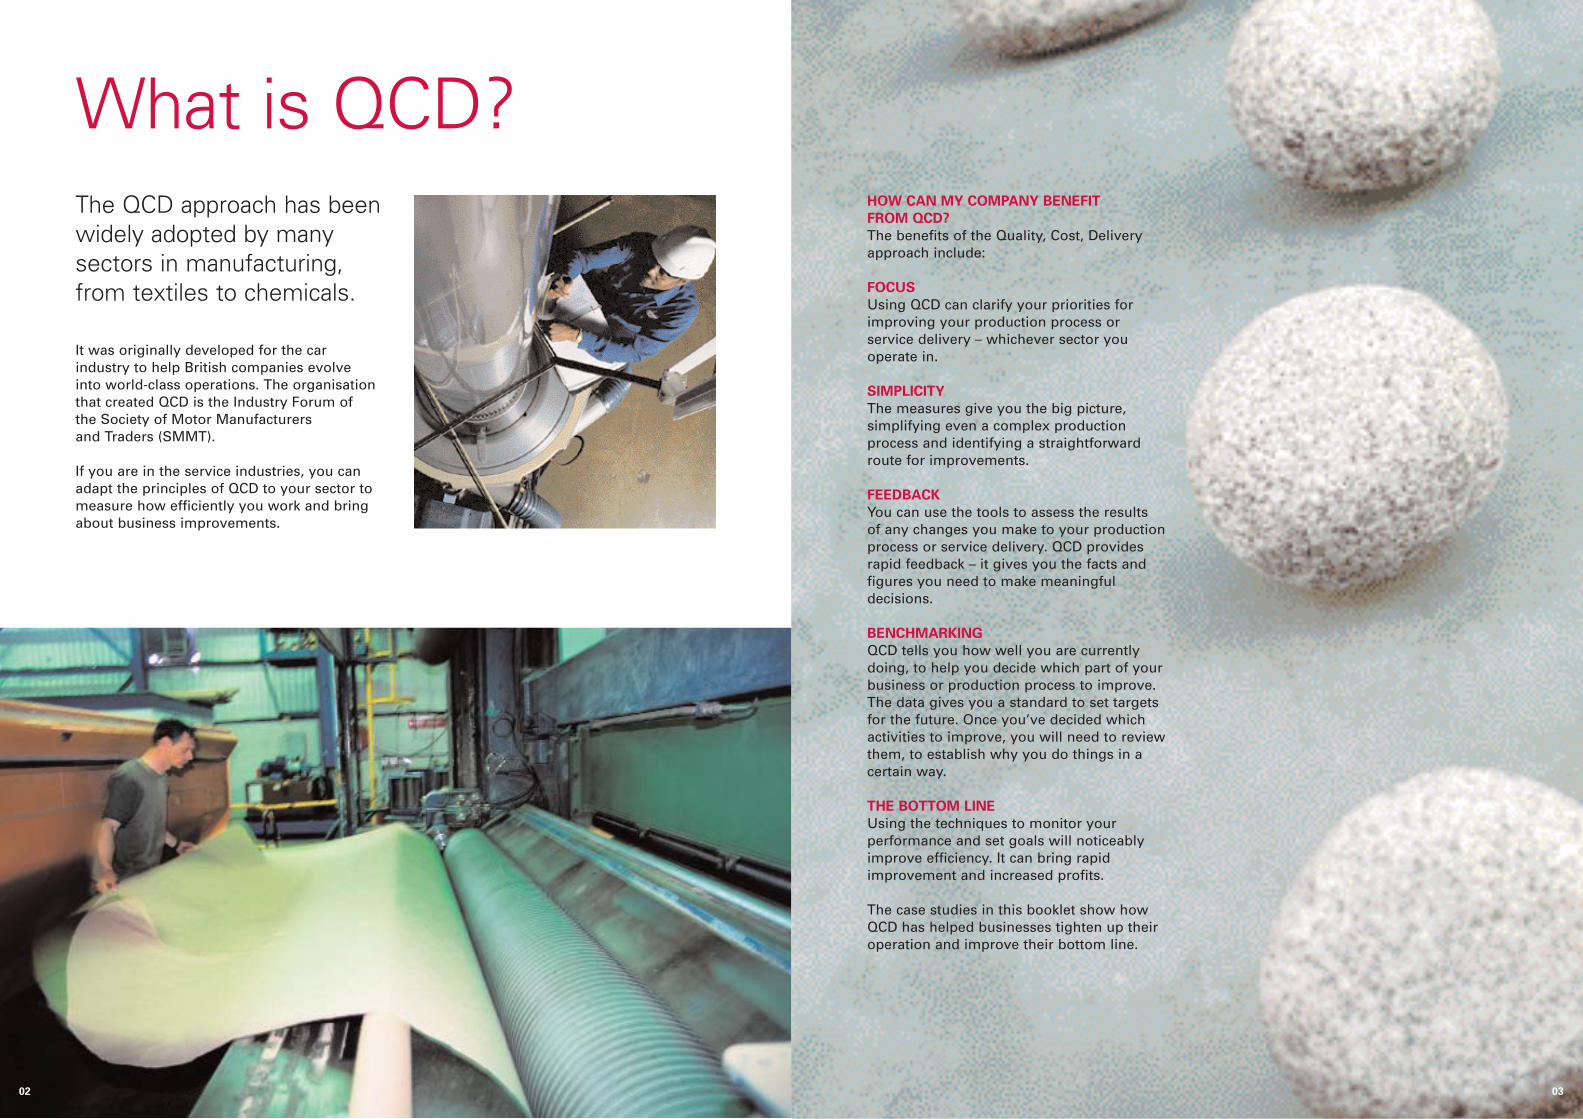
It was originally developed for the carindustry to help British companies evolveinto world-class operations. The organisationthat created QCD is the Industry Forum ofthe Society of Motor Manufacturers and Traders (SMMT).
If you are in the service industries, you canadapt the principles of QCD to your sector tomeasure how efficiently you work and bringabout business improvements.
What is QCD?The QCD approach has beenwidely adopted by manysectors in manufacturing, from textiles to chemicals.
HOW CAN MY COMPANY BENEFIT
FROM QCD?
The benefits of the Quality, Cost, Deliveryapproach include:
FOCUS
Using QCD can clarify your priorities forimproving your production process orservice delivery – whichever sector youoperate in.
SIMPLICITY
The measures give you the big picture,simplifying even a complex productionprocess and identifying a straightforwardroute for improvements.
FEEDBACK
You can use the tools to assess the results of any changes you make to your productionprocess or service delivery. QCD providesrapid feedback – it gives you the facts andfigures you need to make meaningfuldecisions.
BENCHMARKING
QCD tells you how well you are currentlydoing, to help you decide which part of yourbusiness or production process to improve.The data gives you a standard to set targetsfor the future. Once you’ve decided whichactivities to improve, you will need to reviewthem, to establish why you do things in acertain way.
THE BOTTOM LINE
Using the techniques to monitor yourperformance and set goals will noticeablyimprove efficiency. It can bring rapidimprovement and increased profits.
The case studies in this booklet show howQCD has helped businesses tighten up theiroperation and improve their bottom line.
You can put NRFT into figures, by measuringthe number of ‘defective parts per million’.Take the number of defective products anddivide it by the total quantity of productsyou supplied. Multiply this by 106 to get the number of parts per million – thestandard way that industry looks at thenumber of defects.
Companies in service industries need to lookat factors such as the number of customercomplaints, the number of returns orcancelled contracts.
MEASURING NOT RIGHT FIRST TIME
There are two points at which you canmeasure NRFT – before it reaches thecustomer (internally) and after it reaches the customer (externally).
If a company produces two defectivecomponents in every thousand, thistranslates into 2,000 parts per million.
See the working example below.
Once you know this figure, you can settargets for improvement – you should aimfor below 100 parts per million, which is theindustry best practice.
Regardless of which industry you are in,getting things right first time and every time,leads to a lower defect rate, improvingquality and customer satisfaction.
Not Right First TimeStep 1
Working example:
NOT RIGHT FIRST TIME = (2/1000) X 10 X 10 X 10 X 10 X 10 X 10 = 2,000 DEFECTIVE PARTS PER MILLION.
05
Not Right First Time (NRFT) looks at the quality of yourproducts or services – how often do they meet thecustomer’s specification?
Checklist
COLLECT DATA
• Measure the amount you waste – not just waste materials, but wasted time and effort.
• Do you have the right data to identifyproblems in the production cycle or thegeneral workflow?
• Consider getting external help and advice,for example from Business Link (or itsequivalent in Scotland, Wales and NorthernIreland), consultants or industry bodies.
COMMUNICATE
• Once you’ve identified where the problemlies, communicate this to all relevant staff– you need everyone to understand theimportance of getting it right first time andthe effect on the bottom line.
ANALYSE
• Brainstorm a solution. Ask yourselves why you carry out activities in a certainway. Is it simply because you’ve alwaysdone it that way?
• Consider an alternative way of doing things.
ACT
• Put in place improvement activities.
• Set goals – short term and long term.
• Make staff responsible for improvement.
MONITOR
• Monitor improvement activities.
• Take measurements to make sure they’re working.
• Set new goals for continuousimprovement.
See the case study on NRFT on page 18.
Checklist
MEASURE
• Collect data to measure the ratio of correctto incorrect deliveries.
ANALYSE
• Use brainstorming to identify bottlenecksand inefficiencies that are affectingdelivery.
• Ask staff to come up with solutions, not just problems.
COMMUNICATE
• Explain to staff the effect on the bottomline of bottlenecks and inefficiencies.
TEST
• Test new ways of working.
• Refine them with feedback.
• Formalise them in company policy.
06
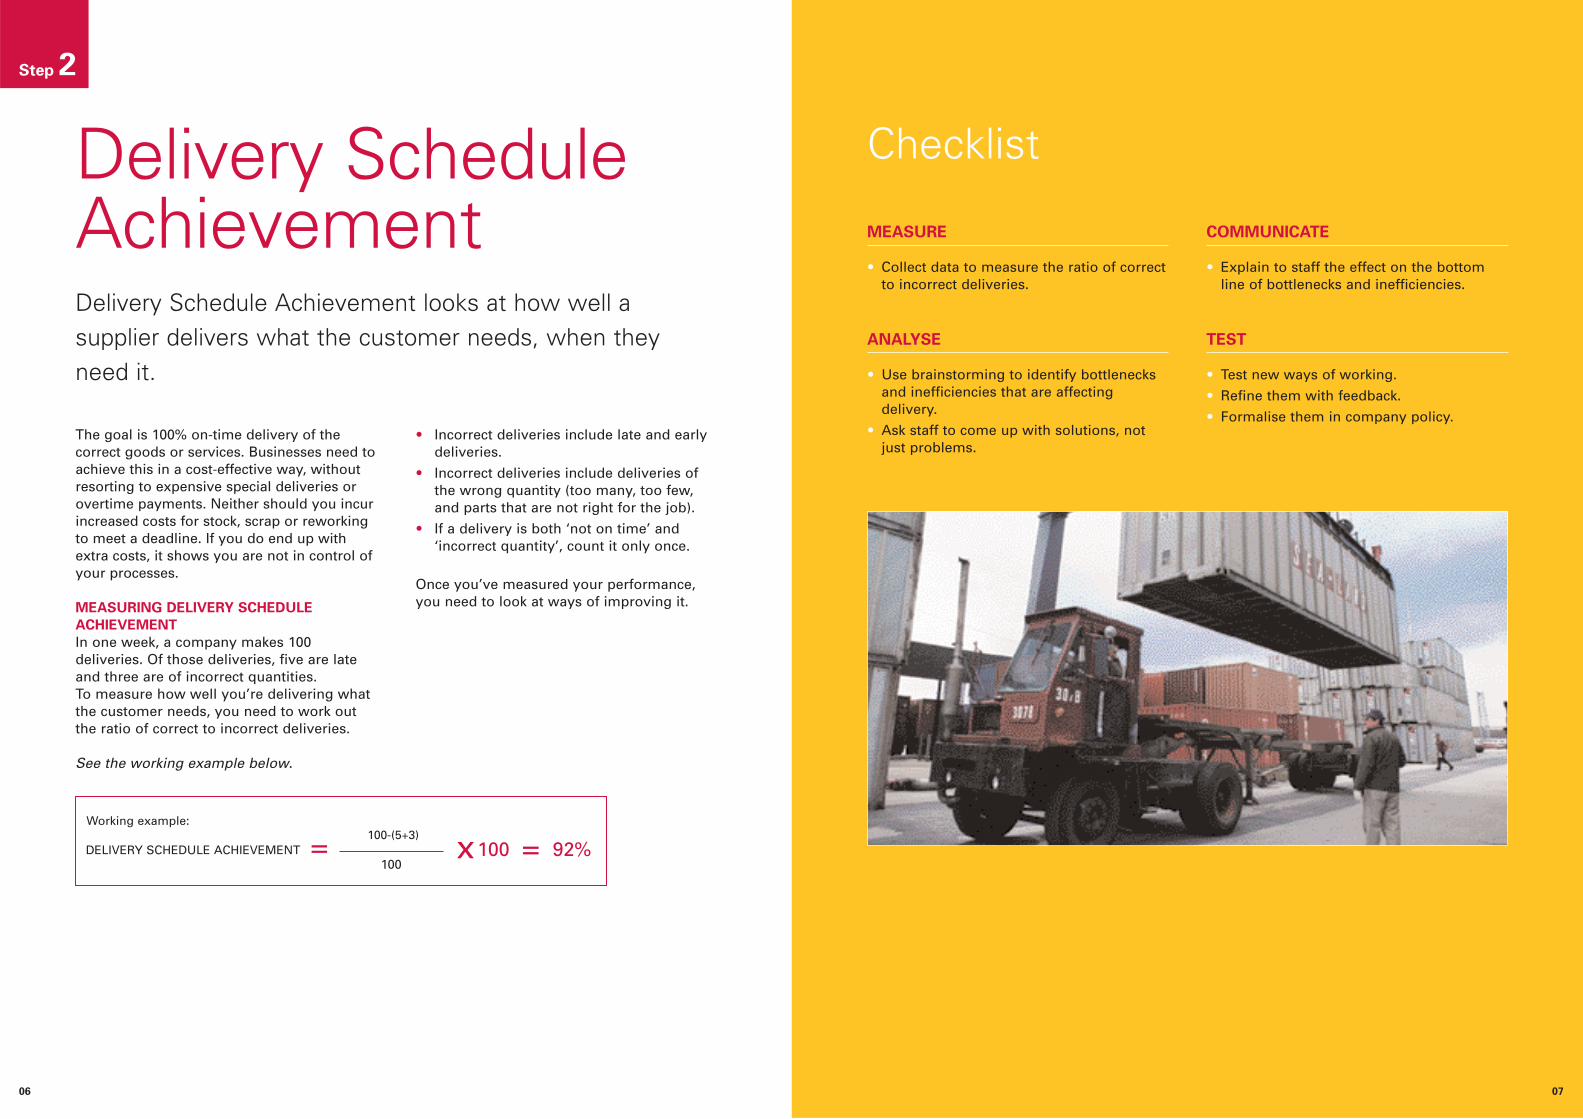
The goal is 100% on-time delivery of thecorrect goods or services. Businesses need toachieve this in a cost-effective way, withoutresorting to expensive special deliveries orovertime payments. Neither should you incurincreased costs for stock, scrap or reworkingto meet a deadline. If you do end up withextra costs, it shows you are not in control ofyour processes.
MEASURING DELIVERY SCHEDULE
ACHIEVEMENT
In one week, a company makes 100deliveries. Of those deliveries, five are lateand three are of incorrect quantities.To measure how well you’re delivering whatthe customer needs, you need to work outthe ratio of correct to incorrect deliveries.
See the working example below.
• Incorrect deliveries include late and earlydeliveries.
• Incorrect deliveries include deliveries ofthe wrong quantity (too many, too few,and parts that are not right for the job).
• If a delivery is both ‘not on time’ and‘incorrect quantity’, count it only once.
Once you’ve measured your performance,you need to look at ways of improving it.
Step 2
100-(5+3)
100x100 = 92%DELIVERY SCHEDULE ACHIEVEMENT =
Delivery ScheduleAchievementDelivery Schedule Achievement looks at how well asupplier delivers what the customer needs, when theyneed it.
07
Working example:
Checklist
MEASURE
• Get staff to record cycle times to provide abenchmark for improvement.
• Use a camcorder to capture the way staffcurrently do things.
ANALYSE
• Watch the video to spot wasteful actions.
• Use brainstorming techniques to question the traditional way of doing things and identify new ways of working to reduce waste.
TEST
• Test new ways of working e.g. build a mock-up of a production cell.
• Pilot new practices with one team, andmake modifications according to stafffeedback.
IMPLEMENT
• Roll out new ways of working across the factory.
• Set targets for speeding up cycle times,and make staff responsible for hittingtargets.
0908
To measure it, you need to take the numberof good units and divide it by the totalnumber of direct operator hours (directoperators are staff who are vital to theproduction process). This will give you ameasurement of the number of units peremployee per hour. Units could be physicalproducts, the number of sales or the numberof customers serviced.
Measuring PP helps you focus on a majorproduct cost – staff salaries. Once you knowhow long it takes to produce each product orcarry out a service, you can look at ways ofmaking staff more productive.
See the working example below, where amobile phone factory has 30 staff making 60 phones an hour.
To improve PP, you have two options. Youcan either increase the number of good unitseach member of staff makes (or the numberof sales they make, etc) or reduce theamount of time they need to make each unit.This could reduce your overtime bill, makingyour company more profitable.
You may need to reassess the way peoplework, making sure that every action counts;reducing wasteful work; avoidingoverproduction and standardising the waythings are done. If staff have spare timewhilst an automated process completes, lookat ways of using this time productively.
MEASURING PEOPLE PRODUCTIVITY
There are three kinds of work:• Work which adds value in line with the
customer’s requirement
• Work which does not add value, but isnecessary
• Work which is wasteful and counter-productive.
A high value for PP can only be obtainedwhen:• most of your employees’ work is adding
value to the process
• non-value added work is reduced to a minimum
• waste is eliminated.
Step 3
People ProductivityPeople Productivity (PP) looks at how long it takes (in staff hours) to produce a good quality product or deliver a satisfactory service – a necessary measurement for every business.
Working example:
PEOPLE PRODUCTIVITY = 60/30 = 2 UNITS PER OPERATOR HOUR
MONITOR
• Monitor the financial results of new ways of working and other improvementactivities.
• Use questionnaires to get feedbackfrom staff.
• Use the information to constantly improve,and communicate successes to staff.
Checklist
MEASURE
• Work out your ST ratio, to see if your cycle from raw materials to sales invoice is quick or slow.
ANALYSE
• Get staff together to brainstorm ways ofeliminating bottlenecks and driving fasterthroughput.
IMPLEMENT
• Consider implementing just-in-timemanufacturing to minimise the amount ofstock you hold. For this, you need tocultivate close relationships with suppliers.
• Consider investing in new systems such assupply chain management or enterpriseresource planning (ERP) software thathelps automate planning, forecasting andfinancial accounting.
For more information on just-in-time andsupply chains, visit the Achieving bestpractice in your business web presence atwww.dti.gov.uk/bestpractice/
MONITOR
• Take measurements to monitor the effect of any improvements you make.
10
Step 4
Stock Turns
11
Stock Turns (ST) looks at the ratio of raw materials to work-in-progress and finished goods. The more quickly youconvert raw materials into finished articles and sell them,the more quickly they bring in valuable sales revenue. It also frees up valuable storage space for the next job.
Your ST ratio will reveal how effectively youare using company funds and how muchcontrol you have over your productionprocess. If you have tight control over yourmanufacturing processes, you only need tokeep small quantities of raw materials andwork in progress. As your company becomesmore efficient, you may find you canrespond faster to customer demands andwork to tighter schedules.
You may want to look at moving to just-in-time manufacturing, where you keep theminimum amount of raw materials, work inprogress and finished products. You rely onsuppliers to provide materials as and whenneeded, and deliver goods to customers onlywhen needed.
MEASURING STOCK TURNS
There are three streams of stock to measure:• incoming materials from suppliers • work in progress flowing through
the factory • finished goods that are ready for delivery
to the customer.
To work out your ST ratio, you need to knowthe annual sales turnover of a product lineand the amount of stock you hold.
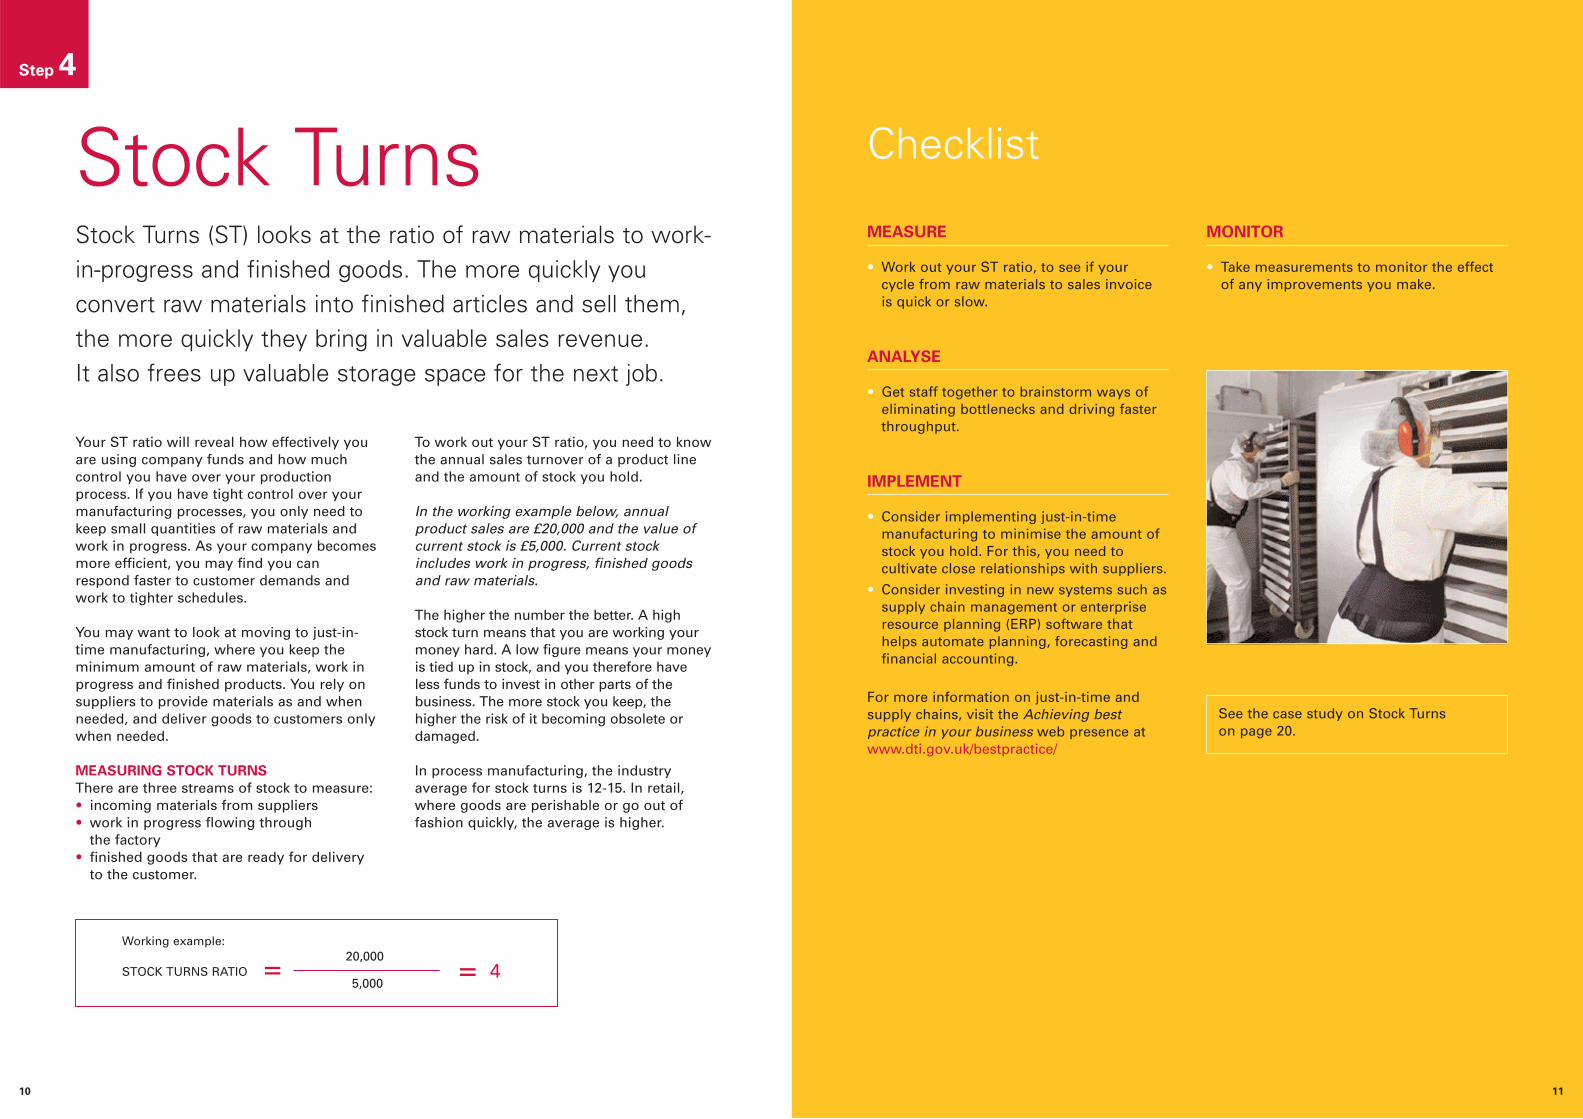
In the working example below, annualproduct sales are £20,000 and the value ofcurrent stock is £5,000. Current stockincludes work in progress, finished goodsand raw materials.
The higher the number the better. A highstock turn means that you are working yourmoney hard. A low figure means your moneyis tied up in stock, and you therefore haveless funds to invest in other parts of thebusiness. The more stock you keep, thehigher the risk of it becoming obsolete ordamaged.
In process manufacturing, the industryaverage for stock turns is 12-15. In retail,where goods are perishable or go out offashion quickly, the average is higher.
20,000
5,000= 4STOCK TURNS RATIO =
Working example:
See the case study on Stock Turns on page 20.
Checklist
MEASURE
• Ask staff to record cycle times, downtimeand output data.
• Use the information to identify variationsin cycle times, patterns in downtime andquality issues.
ANALYSE
• Assemble staff from across the businessand conduct a problem-solving session.
• Ask staff to identify bottlenecks, causes of downtime and factors that influencecycle times.
PRIORITISE
• Decide which problems are the main causeof downtime, and which solutions willbring the most benefit to the business.
ACT
• Set goals for efficiency improvements andmake staff responsible for achieving them.
• Get staff to make regular measurements tocheck goals are reached.
1312
MEASURING OVERALL EQUIPMENT
EFFECTIVENESS
There are three key points to look at:availability, performance and quality.
To work out availability for a machine,you need to look at the amount ofunplanned downtime. If you plan to run a machine for 100 hours a week, but it’sonly up and running for 50 hours,availability is 50% (50 hours divided by100 hours).
Performance compares the actual output with the ideal output. If a process is supposed to take five minutes, but instead takes ten minutes,then performance is running at 50% (5 minutes divided by 10 minutes).
To work out quality, you need to comparethe number of good parts produced with the total. If a company makes 40components per hour and only 20 are ofsaleable standard, this means quality isrunning at 50% (20 saleable componentsdivided by 40 components).
Including these three figures in the equationbelow will give you the overall equipmenteffectiveness, expressed as a percentage.The higher the percentage, the better.
See the working example below.
Ways to improve OEE include eliminatingdown time to improve the production flowand boosting quality by reducing rework and scrap.
Improving OEE could help your companytake on more customer orders, withoutneeding to invest in more machinery or staff.
Step 5
Overall EquipmentEffectiveness
1
2
3
Overall Equipment Effectiveness (OEE) tells you how wellyour business is using its equipment and staff.
OVERALL EQUIPMENT EFFECTIVENESS = (50/100) X (5/10) X (20/40) X100/1 = 12.5%
Working example:
To find out about tools and techniques for analysing performance andbrainstorming problems and solutions, see www.dti.gov.uk/bestpractice/operations/quality.htm.
Checklist
MEASURE
• Ask staff to fill in time sheets to show howlong they take to complete each cycle.
• Use a camcorder to record how staff carryout their jobs.
ANALYSE
• Analyse product cycles. Look at operatordowntime – whilst operators are waitingfor a machine to complete a task, can youget them to do another? Analyse the videoto spot wasteful activities, for exampleunnecessary movements.
TEST
• Test new ways of working before youchange the shopfloor layout – build amock-up of a cell and carry out asimulation.
• Make modifications according to stafffeedback.
IMPLEMENT
• Make sure all staff are on board.
• Communicate the reasons for new ways ofworking – the effect on the bottom line.
MONITOR
• Be open to feedback.
• Take measurements to assess howeffective new ways of working are, andcontinuously improve performance.
1514
MEASURING VALUE ADDED PER PERSON
In the working example below, a companymakes video recorders that sell at £60, thecomponents cost £10 and 20 staff are neededto assemble the products.
The higher the VAPP, the better. A high VAPP means you are making the most ofstaff time, minimising waiting time andmaking every action count. If you analyse the way staff work, you may be able tocombine certain tasks, or use time that staffwould normally spend waiting for anautomatic process to finish.
Step 6
Value Added Per PersonValue Added Per Person (VAPP) shows how well people areused to transform raw materials into the finished product.To calculate VAPP, you need to know the price tag of thefinished product and the cost of the raw materials. You alsoneed to know the number of direct employees – those whoare vital to the production process.
60 – 10
20= £2.50 per personVALUE ADDED PER PERSON =
Working example:
Checklist
ANALYSE
• Look at the layout and the way peoplework. Can you bring two processes closer,to link or merge them and save space?
• Look at what’s vital to the productionprocess and what you can get rid of ormove elsewhere.
• Use external expertise to help you see thebig picture.
DISCUSS
• Get staff together from the differentbusiness areas to generate ideas forimprovement.
• Can you introduce just-in-timemanufacturing to reduce the need forstocks, work in progress and finishedproduct?
TEST
• If practical, test a new layout beforehand –mock up a production cell and check thenew layout works.
MONITOR
• Take measurements to monitor the effectof improvements on the business – andkeep on improving.
16
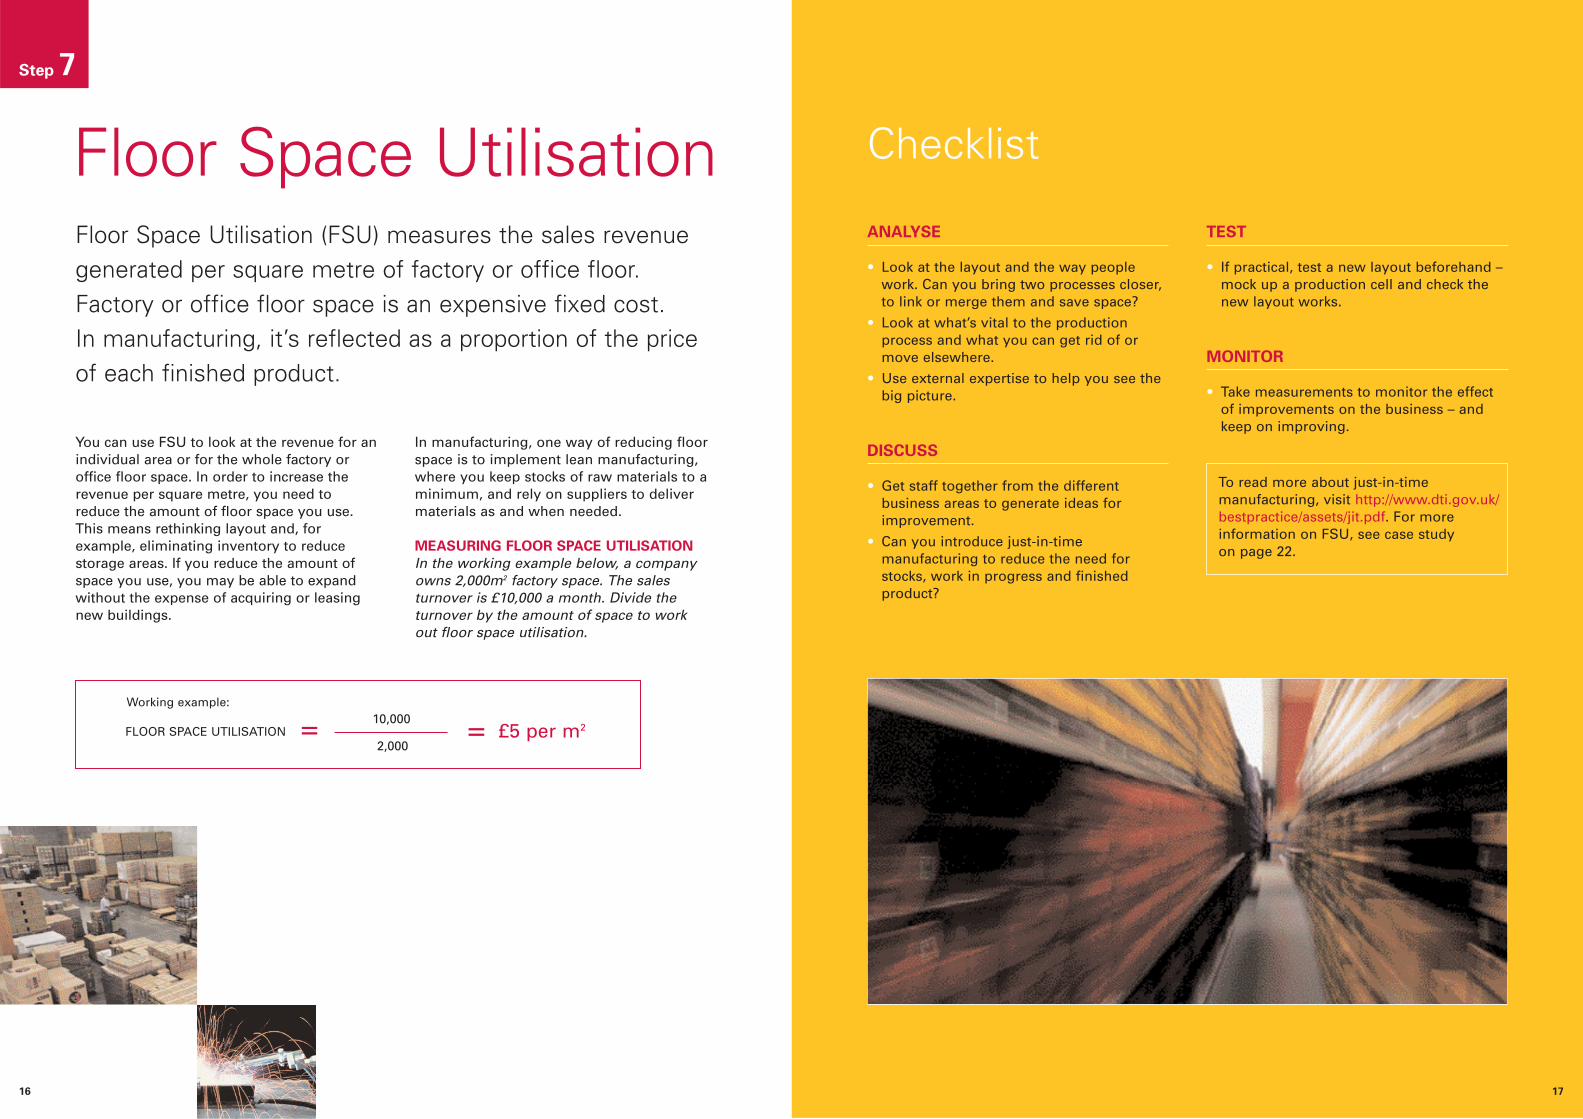
You can use FSU to look at the revenue for anindividual area or for the whole factory oroffice floor space. In order to increase therevenue per square metre, you need toreduce the amount of floor space you use.This means rethinking layout and, forexample, eliminating inventory to reducestorage areas. If you reduce the amount ofspace you use, you may be able to expandwithout the expense of acquiring or leasingnew buildings.
In manufacturing, one way of reducing floorspace is to implement lean manufacturing,where you keep stocks of raw materials to aminimum, and rely on suppliers to delivermaterials as and when needed.
MEASURING FLOOR SPACE UTILISATION
In the working example below, a companyowns 2,000m2 factory space. The salesturnover is £10,000 a month. Divide theturnover by the amount of space to work out floor space utilisation.
Step 7
Floor Space Utilisation
17
Floor Space Utilisation (FSU) measures the sales revenuegenerated per square metre of factory or office floor.Factory or office floor space is an expensive fixed cost. In manufacturing, it’s reflected as a proportion of the priceof each finished product.
10,000
2,000= £5 per m2FLOOR SPACE UTILISATION =
To read more about just-in-timemanufacturing, visit http://www.dti.gov.uk/bestpractice/assets/jit.pdf. For moreinformation on FSU, see case study on page 22.
Working example:
1918
Case studies
Innovia Films (formerly partof the UCB Group)Best practice in: QCD
Sector: ManufacturingSize of firm: 850 employees
Location: CumbriaWebsite: www.films.ucb-group.com
OBJECTIVES
Innovia’s factory in Cumbria makes plasticfilm for packaging and labels – it producesbrands such as Cellophane and Propafilm™.The raw material is wood pulp, which comesout at the other end as finished reels ofcellophane film.
Production methods haven’t changed sincethe 1930s, and the company was concernedthat a certain level of waste had become anaccepted part of the process.
The first step was to find out where thewaste was occurring and the reasons for it.The manufacturing team realised they didn’thave enough detail to pinpoint this andneeded outside help.
Innovia contacted PICME, a government-funded organisation dedicated to improvingprocess manufacturing. The organisation’sengineers worked with Innovia staff togather data and analyse it according to theNRFT method of measuring.
SOLUTION
The team identified where the biggest gainscould be made and where they should targettheir efforts. Two relatively simple changessignificantly reduced waste. Deciding onstandard settings for machines made iteasier to plan customer orders, andminimise the amount of finished productthat got thrown away. And getting twodepartments to liaise more closely meantcustomer orders were fed through promptlyand the sheet of film was cut to the rightsize, so less of the finished product gotthrown away.
Innovia’s team used problem-solvingtechniques to get this result. “Staff have tolearn how to measure and analyse data.They learn tools and techniques, such asbrainstorming and cause and effectdiagrams,” says Richard Story, WorksManager, “We put most staff through themaster class and they get an NCVQ inbusiness improvement techniques.”
Video has proved an ideal tool for analysingthe way things are done. “We can gothrough it second by second looking at everyaction, and look at what could be donedifferently,” says Richard.
RESULTS
Shop floor staff now understand the effect of waste on the bottom line, as they havecarried out teamwork exercises where theytalk to the company accountants and workout what the figures are themselves, ratherthan just being told by management.
The exercises have led to a change inattitude. Staff are now proactive, spottingproblems before they arise. “We did teamexercises to build staff confidence so theyfeel they can make suggestions forimprovement. It’s about making shopfloorstaff see that they can make a difference.Nine times out of ten, they think it’s up to themanagement to make a suggestion onimprovement. Our teamwork exercisesencourage good ideas,” says Richard. Anadded benefit is increased job satisfaction –staff feel empowered.
THE LAST WORD
The business’s waste reduction programmehas delivered continuous improvement overthe last two years, and has been introducedto a second plant in Bridgewater, Somerset.The company has reduced the amount ofmaterial being thrown away by 2% a month,saving several hundred thousand pounds.
“Getting outside advice helped us challenge and re-examine our
accepted performance norms,” he says. “Having implemented
the necessary changes, we’ve lifted our capability.”
RICHARD STORY – MANAGER
Innovia Films used Not Right First Time (NRFT) measurementto dramatically cut waste in its production process.
20 21
Marley Plumbing and Drainage
Best practice in: QCD
Sector: Manufacturing
Size of firm: 550 employees
Location: Lenham in Kent, Bedford and Uddingston
near Glasgow
Website: www.marley.co.uk
OBJECTIVES
Marley Plumbing and Drainagemanufactures plastics components for thebuilding trade. Unlike many other companiesin its sector, Marley produces and sells itsproduct on the open market, rather thanacting as a subcontractor for a client order.The company’s approach brings with it risks– if the company holds too much stock andinventory, it means cash is tied up and isunavailable for investment in other areas.
Marley’s goal was to change to a ‘pullsystem’, where customer demand drivesproduction. It stops overproduction as thecompany only makes what the customerneeds. This approach is known as leanmanufacturing – where everyone in thesupply chain delivers just in time. It reducesuncertainty in the supply chain and reducesthe need for expensive buffer stocks.
In addition, the company was aiming formore effective use of machinery. The goalwas to speed up changeovers on theinjection moulding production line,improving Overall Equipment Effectiveness.
SOLUTION
Marley got outside help from manufacturingindustry body PICME. An external teamworked with staff from across the businessto analyse current practice and brainstormsolutions.
Using historical and current data, Marleypredicted the likely demand for its products,so that shop floor staff could startmanufacturing products in line withcustomer demand and introduce leanmanufacturing.
RESULTS
The pull system has helped increase stockturns, increase value added activity andeliminate waste from the production cycle.Tool changeover time is now 46% quicker, afar more efficient use of equipment.
Cashflow has improved. Managing directorChris Nunn feels lean manufacturing is ofgreat benefit to the company as it releasescash for investment. He says: “Most peopletypically think of investment only in capitalterms – plant and machinery. But the truth isthat a pound invested in stock is the samepound that could be invested in machineryor plant. Investment in machinery and plantcan generally provide a return. Money tiedup in stock cannot.”
Chris believes the move to leanmanufacturing will help the companycompete in the marketplace. He says: “Asthe market changes, with a smaller numberof ever bigger buyers, it becomes ever morecompetitive for suppliers and increasinglydifficult to pass costs on.”
When profits are under pressure, the firstreaction can be to look for technicalsolutions – to try to produce better products
or achieve faster cycle times. Chris, however,believes it’s key to step back and see whereyou can achieve the most gains. He says:“The truth is that the pure injectionmoulding element is only a very small partof what lean manufacturing is about. Thetougher solutions of organisational andcultural change are those that provide thebiggest benefits.”
THE LAST WORD
The improvement activities have led to apositive change in company culture. “Mostof this work is about relationships betweenpeople, departments and job functions. Anumber of pleasing side benefits have arisenfrom this recent work: departments are muchmore aware of each other’s role now, and aquestioning attitude in our people is nowpresent, together with a desire for change,”says Chris.
He adds: “These early achievements areabout starting the business off in a newdirection, and we plan to provide a system oftraining and mentoring that will spread thepractice throughout the business. I amhoping that within a couple of years we shallhave captured most of the quick winsimmediately available to us.”
“The truth is that the pure injection moulding element is
only a very small part of what lean manufacturing is about.
The tougher solutions of organisational and cultural change
are those that provide the biggest benefits.”
CHRIS NUNN – MANAGING DIRECTOR
Marley Plumbing and Drainage used Stock Turns andOverall Equipment Effectiveness to cut costs andstrengthen its market position.
2322
Daniels HealthcareBest practice in: QCD
Sector: ManufacturingSize of firm: 52 employeesLocation: Kidlington, Oxfordshire and Tring,Hertfordshire
Website: www.daniels.co.uk
Daniels Healthcare used Floor Space Utilisation (FSU) toreorganise its factory layout and avoid a costly move.
Daniels Healthcare makes specialistcontainers for waste disposal in hospitalsand clinics. The company has two sites, amanufacturing plant in Kidlington,Oxfordshire and a head office in Tring,Hertfordshire.
OBJECTIVES
Due to increasing customer demand, thecompany needed to expand but had run outof space on its existing manufacturing site.The company was keen to make more of itsexisting space to avoid a costly expansion.Operations Director Shaun Hazlett says: “We had very pressing issues of spacemanagement, workflow and workorganisation to resolve. These concerns werepeople intensive, affecting nearly all on theshop floor.”
SOLUTION
The company set up a manufacturingimprovement team to look at the flow ofmaterials on the shop floor. The team foundit was key to take time out from day-to-dayissues and get outside help. A workshopwith manufacturing industry body PICMEhelped them see the big picture. QualityDirector, Salvatore Picillo explains: “Themaster class gave our team the time andspace to look at our concerns head-on andchart the full scale of activity around our 15moulding machines.”
First, the team went back to basics – theycleared the shop floor and cleaned, to get abetter idea of where the problems were.After decluttering, the team put back onlyitems vital to production. The goal was toorganise the space more effectively.
The team focused on the company’s twolargest moulding machines. New bincollectors were designed and built, andcolour coding was introduced for machinery,materials, packaging and ancillaryequipment. Colour coding helps staff keepeverything in its rightful place – with aknock-on effect of better use of space.
The issue was not just about space. Anyreorganisation of shop floor layout wouldaffect the way people worked, so all staffwould need to get on board. The companyrealised it needed to communicate effectivelyand win staff over.
RESULTS
Staff are now much more aware of how thebusiness works and how they impact upon iton a daily basis. They also accept theimportance of clear communication. “Theteam have learnt a lot about the power ofcommunication, in particular learning that itneeds to take place and that people need tobe won over. Much as we might want themto, commitment and enthusiasm don’t comeautomatically,” says Shaun.
Running improvement activities has givenstaff more confidence. Staff feel empoweredwhen they see their suggestions move frombrainstorm to reality. Shaun said: “Ourimprovement team is now its own authority,independent and empowered to change theworking environment.”
One key lesson learned is that staff producebetter solutions if management are notinvolved. Shaun says: “Many of the initial 25 improvement suggestions surprised me. I would have personally overlooked some inthe course of everyday work. All these initialproposals had to show some kind of materialbenefit – and all of them were approved onthe basis that they did.”
Outside help is key. “The outside facilitatorsare needed to remind our people about theirsuccesses, to recall where they’ve comefrom and to orientate them with tools andencouragement for the bigger improvementpicture ahead,” says Shaun.
THE LAST WORD
The improvements to the shop floor layouthave encouraged the company to look at theway it organises other parts of the business.Shaun says: “This is not just aboutmanufacturing. It can as much be applied tothe flow of orders, invoices, and otherinformation as it can materials andmachinery. At the end of the day it meansdoing a job of work the way you want to doit. The side benefits include saving your timeand saving the everyday frustrations thatcome from an inappropriate system.”
“Many of the initial 25 improvement suggestions surprised
me. To be honest I would have personally overlooked some in
the course of everyday work. All these initial proposals had to
show some kind of material benefit – and all of them were
approved on the basis that they did.”
SHAUN HAZLETT – OPERATIONS DIRECTOR
24
Further helpand adviceAchieving best practice in your business is akey theme within DTI’s approach to businesssupport, providing ideas and insights intohow to improve performance across yourbusiness. By showing what works in otherbusinesses, we can help you see whichapproaches can help you, and then supportyou in implementation.
ACHIEVING BEST PRACTICE
IN YOUR BUSINESS
To access free information and publicationson best practice:• visit our website at www.dti.gov.uk/
bestpractice
• call the DTI Publications Orderline on 0845 015 0010 or visit www.dti.gov.uk/publications
SUPPORT TO IMPLEMENT
BEST BUSINESS PRACTICE
To get help bringing best practice to yourbusiness, contact Business Link – thenational business advice service. Backed bythe DTI, Business Link is an easy-to-usebusiness support and information service,which can put you in touch with one of itsnetwork of experienced business advisers.• Visit the Business Link website at
www.businesslink.gov.uk
• Call Business Link on 0845 600 9 006.
TRAINING IN BUSINESS IMPROVEMENT
Industry specialists often run classes inbusiness improvement, to encourage staff tothink proactively on the shopfloor.
Contact your own industry forum and findout what training they offer for businessimprovement or achieving excellence inbusiness.
Constructing ExcellenceTel: 0845 605 5556Fax: 01923 664 690E-mail:[email protected]: www.constructingexcellence.org.uk
Construction Equipment AssociationTel: 01883 334 499Fax: 01883 334 490E-mail: [email protected]: www.coneq.org.uk
MICE (Metals Industry CompetitivenessEnterprise)Tel: 0114 244 6833Fax: 0114 256 2855E-mail: [email protected]: www.metalsindustry.co.uk
PICME (Purpose Industries for ManufacturingExcellence)Tel: 01642 430021Fax: 01642 430025E-mail: [email protected]: www.picme.org
Shipbuilders & Shiprepairers AssociationTel: 01784 223 770Fax: 01784 223 775E-mail: [email protected]: www.ssa.org.uk
SMMT Industry ForumTel: 0121 717 6600 Fax: 0121 717 6699E-mail: [email protected] Web: www.industryforum.co.ukIndustry Forum (Textile and Clothing)Tel: 020 7636 7788Fax: 020 7636 4418E-mail: [email protected]: www.industryforum.net
UK Lean Aerospace InitiativeTel: 07887 562 833Fax: 020 7227 1025E-mail: [email protected]: www.sbac.co.uk
Examples of products and companies included in this leaflet do not
in any way imply endorsement or recommendation by DTI. Bear in
mind that prices quoted are indicative at the time it was published.
GENERAL BUSINESS ADVICE
You can also get a range of general business advicefrom the following organisations:
England
• Call Business Link on 0845 600 9 006
• Visit the website at www.businesslink.gov.uk
Scotland
• Call Business Gateway on 0845 609 6611
• Visit the website at www.bgateway.com
Wales
• Call Business Eye/Llygad Busnes on 08457 96 97 98
• Visit the website at www.businesseye.org.uk
Northern Ireland
• Call Invest Northern Ireland on 028 9023 9090
• Visit the website at www.investni.com