quality education model - oregon department of education · quality education model impact analysis...
TRANSCRIPT

Quality
Education
Model
Final Report
August 2012
Quality
education
commission

www.ode.state.or.us Quality Education Commission Report 2012
2
Quality Education Model
Final Report
August 1, 2012
The Quality Education Commission
255 Capitol Street NE
Salem, OR 97310
Office: 503-947-5679
Fax: 503-378-5156

www.ode.state.or.us Quality Education Commission Report 2012
3
Quality Education Commission
Susan Massey, Chair
Retired Member and Chair, State Board of Education
Sarah Boly
Retired Deputy Superintendent, Beaverton Schools
Beth Gerot
Eugene School Board
Oregon School Boards Association, past president
Colt Gill
Superintendent, Bethel School District
Lynn Lundquist
Founding President, Oregon Business Association
Former Speaker of the Oregon House of Representatives
Frank McNamara
Retired President/CEO, Willamette View Inc.
Retired Director, Confederation of Oregon School Administrators
Gail Rasmussen
President, Oregon Education Association
Maryalice Russell
Superintendent, McMinnville School District
Julie Smith
CLASS Coach, Chalkboard Project
Peter Tromba
Principal, Monroe Middle School, Eugene School District
Doug Wells
COO/CFO, The Children’s Institute
Oregon Department of Education Staff
Brian Reeder
Oregon Department of Education, Staff to the Commission
Jenni Deaton
Oregon Department of Education, Support to the Commission

www.ode.state.or.us Quality Education Commission Report 2012
4
Table of Contents
Topic
Preface........................................................................................................................................... 6
Executive Summary...................................................................................................................... 7
Introduction................................................................................................................................... 10
The Prototype Schools………………………………………………….………......................... 13
The Best Practices Panel Report………………………………………………………………… 19
The Cost Panel Report…………………………………………………………………………... 30
The State of School Funding in Oregon…………………………………………………............ 34
The State of Student Achievement in Oregon………………………………………................... 38
Quality Education Model Impact Analysis and Student Performance Expectations...………….. 43
Alternative Strategies for Implementing the Quality Education Model…………………………. 50
Recommendations……………………………………………………………………………….. 52
Bibliography……………………………………………………………………………………... 54
Appendix: Best Practices Panel Survey Results…………………………………………………. 57
Exhibits
Exhibit 1: Quality Education Model Funding Requirements…………………………………... 7
Exhibit 2: Prototype Elementary School……………………………………………………….. 16
Exhibit 3: Prototype Middle School……………………………………………………………. 17
Exhibit 4: Prototype High School………………………………………………………………. 18
Exhibit 5: Distribution of Survey Respondents by Level………………………………………. 27
Exhibit 6: All Teacher Survey Results…………..……………………………………………… 28
Exhibit 7: Matched Pair Survey Results…………..………………………………………......... 29
Exhibit 8: Resource Allocation Model Estimation Results……………………………………... 33
Exhibit 9: Total School District Operating Revenue……………………………………………. 35
Exhibit 10: Inflation-Adjusted Revenue per Student……………………………………………. 36
Exhibit 11: State Portion of K-12 Education Funding………………………………………….. 37

www.ode.state.or.us Quality Education Commission Report 2012
5
Exhibit 12: History of Oregon School Funding Gap……………………………………………. 37
Exhibit 13: Percent Meeting Math Standard……………………………………………………. 39
Exhibit 14: Percent Meeting Reading Standard……………………………………………….... 39
Exhibit 15: Percent Meeting Math Standard by Subgroup 2010-11……………………………. 40
Exhibit 16: Percent Meeting Reading Standard by Subgroup 2010-11………………………… 40
Exhibit 17: Percent Meeting Science Standard…………………………………………………. 41
Exhibit 18: Percent Meeting Writing Standard…………………………………………………. 41
Exhibit 19: Oregon Graduation Rates………………………………………………………....... 42
Exhibit 20: Quality Education Model Impact Analysis………………………………………… 45
Exhibit 21: 3rd
Grade Reading Achievement Forecast………………………………………….. 46
Exhibit 22: 5th
Grade Reading Achievement Forecast………………………………………….. 46
Exhibit 23: 8th
Grade Reading Achievement Forecast………………………………………….. 47
Exhibit 24: High School Reading Achievement Forecast………………………………………. 47
Exhibit 25: 3rd
Grade Math Achievement Forecast……………………………………………... 48
Exhibit 26: 5th
Grade Math Achievement Forecast……………………..………………………. 48
Exhibit 27: 8th
Grade Math Achievement Forecast…………..…………………………………. 49
Exhibit 28: High School Math Achievement Forecast……………………..…………………… 49
Exhibit 29: State School Funding Required to Fully Phase-In QEM by 2021-23………….…... 50

www.ode.state.or.us Quality Education Commission Report 2012
6
Preface
he United States and much of the rest of the world currently are in the worst economic downturn since
the Great Depression. In most U.S. states, state and local revenues have declined dramatically and have
been slow to recover. The economic crisis has resulted in education budget cuts that have shortened the
school year, shrunken the education workforce, and eliminated many district classes and activities.
Students have borne the brunt of these cuts, experiencing more crowded classrooms, less opportunity for
individual attention, and fewer course and extra-curricular options in many cases. Districts have also laid
off teachers, support staff, and administrators, exacerbating the lack of demand and unemployment crisis
that are at the root of the sluggish economic recovery. Funding for Oregon’s public services depends on tax
revenue generated by a robust economy, but at the same time a robust economy depends on a well-
educated, productive workforce. The more innovative economy and higher incomes that come with a
better-educated population are likely to be the keys to Oregon’s long-term prosperity.
Led by Governor John Kitzhaber and the Oregon Legislature, Oregon has initiated a broad set of education
reforms that will affect all levels of education. Among the most significant reforms in 2011 were SB 250,
which impacted the governance and funding of Education Service Districts; SB 552, which eliminated the
elected State Superintendent of Public Instruction; and SB 909, which created the Oregon Education
Investment Board and a Chief Education Officer position as well as new governance bodies for higher
education and early learning. In 2012, SB 1581 required education entities to enter into achievement
compacts with the Oregon Education Investment Board; and HB 4165 defined the powers and
responsibilities of the Early Learning Council and created the Youth Development Council. These reforms
are intended to improve the educational outcomes at all levels of the education system and reduce the cost
of education delivery. The reforms build on actions already taken by the State Board of Education, raising
graduation requirements and changing the focus for earning a diploma to student demonstrations of
academic proficiency rather than credits and seat time. The board also adopted the national common core
educational standards, designed to establish a common set of rigorous standards in all states.
A dominant feature of these initiatives is the integration of all levels of education—from pre-kindergarten
through higher education—into a coherent system that provides a seamless continuum of education services
better tailored to individual student needs. Currently, a lack of shared expectations and poor information
flows make key transitions (Pre-school to kindergarten, elementary to middle school, middle to high
school, high school to higher education) more difficult than they need to be for students, and in the process
learning time can be lost and students can become disillusioned with the system.
The proposed reforms promote what Governor Kitzhaber has called a “tight-loose” approach to education
governance. This means the state will be “tight” on standards and expectations for student outcomes that it
requires of educational institutions, but “loose” on the methods the institutions may use to meet those
standards and expectations. In other words, the state sets expectations for student outcomes, and then gives
schools flexibility in deciding how to best achieve those outcomes. This approach recognizes that Oregon
students and schools will benefit by having a clear set of expectations and will also have enough flexibility
and local control to tailor programs to local circumstances and needs.
The Quality Education Commission looks forward to being a resource to policymakers as the education
reforms are developed and implemented. Under its current statutory charge, the Commission’s focus
remains on Oregon’s K-12 school districts and ESDs, but as the reforms proceed, promoting integration
across the entire education enterprise, a broadening of the charge will become necessary. The commission
looks forward to that challenge.
T

www.ode.state.or.us Quality Education Commission Report 2012
7
Executive Summary
s the U.S. struggles through its fifth year of the economic downturn, most state and local
governments continue to experience very slow revenue growth. Oregon relies heavily on the income
tax to fund its K-12 schools, and income tax revenues tend to recover more slowly than other taxes after a
recession. With slow income tax revenue growth, and with the limited ability of school districts to raise
additional revenue on their own, nearly all Oregon school districts have made budget cuts over the past five
years, and many are expecting to have to cut further in the coming year.
The funding gap—the amount by which actual school funding falls short of the level required to meet
Oregon’s educational goals—continues to grow. As Exhibit 1 shows, the gap of $2.277 billion in 2011-13
is expected to grow 7% to $2.439 billion in 2013-15 and another 7% to $2.609 billion in 2015-17 if the
state continues to base its funding on the Current Service Level.
Exhibit 1: Quality Education Model Funding Requirements
Billions of Dollars 2011-13 2013-15 2015-17
State Funding Requirement for Current Service Level $5.727 $6.315 $7.004
Percent Change from Prior Biennium 10.27% 10.90%
State Funding Requirement for Fully Implemented Model $8.005 $8.755 $9.613
Percent Change from Prior Biennium 9.37% 9.80%
Funding Gap: Fully Implemented Model above Current Service Level $2.277 $2.439 $2.609
Percent Change from Prior Biennium 7.11% 6.95%
Despite these funding trends, which have led to a decline in inflation-adjusted revenue per student, the
percentage of Oregon students meeting or exceeding the benchmarks on state assessments has continued to
increase, although the increases are slowing, particularly in science and writing. Of more concern are
Oregon’s graduation rates. Just 66.2% of students who started high school in 2005-06 graduated within 4
years, and that number rose only slightly to 66.4% for those starting in 2006-07 and to 67.2% for those
starting in 2007-08. Oregon’s ambitious 40-40-20 education goals, which require that 100% of students
graduate from high school, simply cannot be met without a significant closing of the funding gap along
with a more productive use of resources.
As part of its charge to identify best practices and evaluate funding requirements, the Quality Education
Commission formed two panels for its 2012 work: the Best Practices Panel and the Cost Panel. The Best
Practices Panel conducted a statewide survey and individual school interviews to characterize and compare
the use of formative assessments and teacher collaboration. Using data from the Oregon Department of
Education (ODE), the Panel was able to directly compare pairs of demographically similar schools that had
different performance levels to specifically identify which activities made a positive difference in student
learning. The Best Practices Panel found that formative assessments help teachers improve their instruction,
and effective data and communication systems improve the collection and use of formative assessment data
and lead to increased student achievement. Students also benefit when teachers spend more time analyzing
assessment data with colleagues, when parents and students are given regular feedback, and teachers use
proficiency-based grading systems derived from academic standards.
A

www.ode.state.or.us Quality Education Commission Report 2012
8
The Best Practices Panel also found that teacher collaboration is most effective when there is staff
ownership of the process. Collaborative activities that emerge from teachers themselves, often informally,
can be the most effective of all. Schools with a positive climate and a “can-do” attitude found ways to work
together, often outside of formal systems, which led to increased performance. Without staff buy-in,
additional time for collaboration is often unproductive or even counterproductive. District and building-
level leadership is a crucial pre-condition to good practice, and districts and schools with more
sophisticated understanding and application of educational initiatives responded more quickly to student
needs and changing state goals and showed increased performance.
The Cost Panel used a multi-year dataset to follow cohorts of students as they progressed through the
grades. By relating student achievement in each grade to prior achievement and to instructional
expenditures at the school level, the Panel looked for relationships between spending and student
achievement at different grade levels. Understanding how resources influence student achievement at
different grade levels, and how achievement carries over into later grades, can provide clues about how the
allocation of resources across the grades affects the level of achievement students are able to reach in high
school. While not definitive, our results suggest adding resources at the late elementary grades and the
middle school grades provides the most bang-for-the-buck. We do not, however, have adequate data at the
pre-school and kindergarten levels to include those students in the analysis, so more research is needed, and
it is critical that those data dovetail with the high-quality data we already have for K-12.
Recommendations
Since the passage of Measure 5 in 1990, funding for Oregon’s schools has been in decline. If Oregon is to
achieve it’s goal of having all students graduate from high school, with 40% of those graduates then
achieving an associate’s degree and another 40% achieving a bachelor’s degree or above, then the state
needs to reverse that decline.
To that end, the Quality Education Commission recommends that the state adopt a 10-year funding plan
that phases-in full funding of the Quality Education Model by the 2021-23 biennium. For the first phase, in
the 2013-15 biennium, the Commission recommends a State School Fund appropriation of $6.895 billion,
9% above the Current Service Level. The recommended State School Fund amounts for subsequent biennia
in the phase-in period can be found in Exhibit 29.
Based on the work of the Best Practices and Cost Panels, the Commission also makes the following
recommendations:
School districts should improve the collection and use of data from formative assessments. The
state can play a role by promoting effective tools, practices, and knowledge sharing.
School staff can get the most benefit from formative assessments by:
Spending at least 60 minutes per week analyzing assessment data with colleagues
Giving feedback to parents weekly
Giving feedback to students daily
www.ode.state.or.us Quality Education Commission Report 2012
9
School districts and individual schools should promote teacher collaboration and devote enough
time and resources so it is implemented well. Approaches that have a high level of teacher buy-in
hold the most promise for success.
Teacher collaboration activities should include setting specific goals for improving student
achievement.
Districts should take a fresh look at the resources they allocate to individual school buildings
relative to student performance. Allocating resources based on their effectiveness at increasing
student achievement and graduation rates, rather than on staff to student ratios (or their variants),
can help districts get the most out of their resources.
www.ode.state.or.us Quality Education Commission Report 2012
10
Introduction
Mission and Purpose of the Quality Education Commission
he Oregon Legislative Assembly established the Quality Education Commission in statute in 2001.
Under Oregon law (ORS 327.500 and ORS 327.506), the Commission’s responsibilities are to:
1) Determine the amount of monies sufficient to ensure that the state system of kindergarten through
grade 12 public education meets the quality goals established in statute.
2) Identify best practices based on education research, data, professional judgment, and public values, and
the cost of implementing those best practices in K-12 schools.
3) Issue a report to the Governor and Legislative Assembly in even-numbered years that identifies:
Current practices in the state’s system of K-12 public education
Costs of continuing those practices
Expected student performance under those practices
Best practices for meeting the quality goals
Costs of implementing the best practices
Expected student performance under the best practices
Two alternatives for meeting the quality goals
Oregon’s History of High Education Goals
Oregon has maintained its philosophy of setting high goals for its schools and students despite the
incentives inherent in the federal No Child Left Behind Act (NCLB) for states to lower their standards and
despite revenue shortfalls resulting from the economic downturns of 2003 and 2008. In the 1991 Oregon
Education Act for the 21st Century, legislators outlined challenging goals for the state’s K-12 system of
education. They called for a world-class school system in which all students are challenged by rigorous
academic content standards and have the opportunity to gain knowledge and skills to reach their full
potential. The State Board of Education has developed standards—guidelines for what students should
know and be able to do—to implement these legislative goals.
Oregon is also in the process of phasing-in the new standards established by the Oregon Diploma, which
were adopted in 2007-08. The new diploma provides greater clarity about what students in public schools
are expected to learn and be able to do by the end of high school and sets higher academic standards for
students, beginning with the graduating class of 2010. By 2014, when all of the new requirements have
been introduced, Oregon students will be required to complete more credits—in math, English/language
arts, and science—demonstrate proficiency in nine essential skills, and meet personalized learning
requirements in order to earn the Oregon Diploma.
In 2011, Oregon’s State Board of Education adopted the Common Core Standards, a set of rigorous
academic standards developed by a collection of states under the coordination of the Council of Chief State
School Officers (CCSSO). These common standards are intended to represent a national set of academic
standards for all K-12 public schools.
T

www.ode.state.or.us Quality Education Commission Report 2012
11
And most recently, the Oregon legislature adopted a set of education reforms proposed by Governor John
Kitzhaber that will integrate all levels of public education in Oregon—Pre-Kindergarten through higher
education—and emphasize student proficiency in mastering academic content rather than seat time. In
addition, the reforms seek to revise funding structures to provide incentives for desired outcomes rather
than simply paying for the number of students enrolled.
The proposed reforms also promote a “tight-loose” approach to education governance, where the state will
be “tight” on standards and expectations for student outcomes but “loose” on the methods the institutions
can use to meet those standards and expectations. This approach will allow individual school districts,
community colleges, and four-year universities to tailor their programs to the needs of their specific student
populations.
Previous Commission Recommendations
Since 2000, the Quality Education Commission’s reports have provided objective analyses of instructional
best practices, school funding, and Oregon’s quality education goals. The reports’ recommendations reflect
findings about student performance, per-student spending, demographic trends, class size, curriculum, and
Pre-K through higher education alignment. The 2010 report focused on math instruction and math course-
taking patterns in middle and high school and made the following recommendations:
Provide more time for new teacher induction and job-embedded professional development.
Provide adequate resources and staff so that schools can offer Algebra courses for high school
credit in the 7th or 8
th grade. Early introduction to Algebra concepts promotes higher achievement
in high school.
Align the timing of student course-taking with the timing of state assessments.
Include adequate classroom spaces, smaller class sizes, and early identification of struggling
students, and additional instruction time with licensed math teachers.
Allocate time and resources to districts to develop frameworks for the articulation of math
programs for 4th grade through high school.
Develop a strategic focus on practices that build a solid academic foundation in the early grades.
Invest in strategies and allocate additional resources where they will have the greatest impact on
student performance. Time and leadership are priority investment targets.
The recommendations above continue to be worthy goals, even in a time of severe funding constraints.
Many of these recommendations can be implemented by redeploying existing resources or at a modest cost
in added teacher and staff planning time. The Commission hopes that schools and districts continue to
incorporate these recommendations in order to improve educational opportunities for all Oregon students.
The Work of the 2012 Quality Education Commission
Oregon’s Quality Education Model (QEM) incorporates data and assumptions about school size,
demographics, staffing, professional development, technology, supplies, and other factors in order to
estimate the costs of meeting the education goals established in Oregon statute. Perhaps more importantly,
the model can also be used to predict the effects of supplying resources at different levels. In this way, the

www.ode.state.or.us Quality Education Commission Report 2012
12
QEM can be used to examine a variety of “what-if” policy questions and scenarios. For instance, what are
the costs of raising or reducing class sizes, providing additional reading and math specialists, offering more
professional development and collaboration time for teachers, or hiring more high school counselors? And
how might student achievement outcomes change in each such scenario? The Quality Education Model
allows policymakers to evaluate various policy scenarios in terms of their financial implications and
compare them with the costs of providing the current level of services in Oregon schools.
Every two years the Quality Education Commission conducts an extensive, broad-based review process to
examine and update the Quality Education Model. Prior reports have focused on the K-12 system’s
progress toward the goal of 90 percent of Oregon students meeting the state’s academic performance
benchmarks. In 2006, the Commission carefully examined the relationship between school funding and
student achievement. The 2008 report explored the practices, resources, accountability, and systems
improvement associated with implementing the new graduation standards that came with the creation of the
Oregon Diploma. In 2010, the Commission examined the challenges for math education presented by the
new Oregon Diploma requirements, and it also developed a capital cost model to supplement the operating
cost model that is the core of the QEM.
In 2012 the Quality Education Commission’s Best Practices Panel expanded upon the recommendation of
the 2010 Commission that the State “Invest in strategies and allocate additional resources where they will
have the greatest impact on student performance. Time and leadership are priority investment targets.”
In 2012 the Panel focused its research on professional collaboration and formative assessment. These were
the two areas of teacher practice where current educational research finds the most compelling evidence of
effectiveness in ensuring improved student achievement. The Panel used an on-line survey of all active
Oregon Teachers to evaluate the prevalence of teacher activities associated with professional collaboration
and formative assessment. The Panel also did a follow-up analysis of the effectiveness of these same
teacher activities using a second round of on-line surveying and on-site interviews of staff at higher
performing and lower performing schools with similar demographics.
The Cost Panel, in addition to its regular update of the model to reflect the most recent data available, also
evaluated how resource allocation among schools (elementary, middle, and high) can affect achievement as
students progress through the grades. By relating the pattern of student achievement to instructional
expenditures as cohorts of students progressed through the grades, the Panel sought to identify where, along
the K-12 spectrum, schools were getting the most bang-for-their-buck in achieving student learning. The
results have the potential to help school districts determine if they are allocating their resources across
schools in the most productive way possible.
This report presents the findings and recommendations of the Commission and also contains updated
estimates of the costs of operating a system of schools that can accomplish Oregon’s ambitious educational
goals. This report also includes current information about school funding and student achievement in the
state and discusses alternatives to full implementation of the Quality Education Model.
The Commission thanks all of the educators, school board members, parents, and community leaders across
the state who contributed their time, expertise, and insights to this report. Additional information about the
Commission and the Quality Education Model is available on the Oregon Department of Education website
at: http://www.ode.state.or.us/search/results/?id=166

www.ode.state.or.us Quality Education Commission Report 2012
13
The Prototype Schools
n the Quality Education Model, the school serves as the unit of analysis. In order to determine the
impact of statewide increases or decreases in funding, it is necessary to understand the effects on an
individual school’s operations and student academic performance. To focus on the school-level, the
Quality Education Model is structured around prototype elementary, middle, and high schools, each
designed to help students meet Oregon’s high academic standards and performance goals. Each prototype
school reflects the resources needed to implement best practices and research associated with effective and
high-performing schools and serves as a mechanism by which to evaluate the resource and cost
implications of proposed education programs, policies, and strategies. While the prototype schools are not
intended to be prescriptive, they can assist educators, policymakers, and citizens in understanding and
making informed decisions about school resources and funding.
Quality Indicators are non-fiscal traits that
indicate organizational functioning and
efficiency, which the prototype schools are
assumed to possess. These thirteen indicators
are based on research about effective schools and
serve as measures of whether a school employs
effective practices and uses resources efficiently.
The Quality Indicators fall into four broad
categories: school-level, teacher-related,
classroom-focused, and student-centered factors.
Best Practices are strategies and programs that
have been demonstrated by research and
experience to be effective in promoting high
levels of student achievement. The prototypes
demonstrate how schools of certain sizes and
characteristics may be designed to implement the
best practices. The Quality Education
Commission identified the following essential
characteristics that support best practices:
Each student has a personalized education
program.
Instructional programs and opportunities are focused on individual student achievement of high-quality
standards.
Curriculum and instructional activities are relevant to students’ lives.
Each student has access to a rich and varied elective co-curricular and extra-curricular program.
The school creates small learning environments that foster student connection.
The school provides and encourages connections with significant adults, including parents, mentors,
and other advisors to ensure that each student develops a connection to the greater community, along
with a strong sense of self.
I
Quality Indicators
Schools
Leadership that facilitates student learning
Parental/community involvement
Organizational adaptability
Safe and orderly learning environment
District policies to support learning
Teachers
Teacher and teaching quality
Teacher collaboration
Professional development program
Teacher efficacy
Classrooms
Effective instructional programs and methods
School database collection and analysis to
improve instructional programs
Students
Readiness to learn
Connectedness to school and engagement in
academics and extra-curricular programs

www.ode.state.or.us Quality Education Commission Report 2012
14
The school makes data-informed decisions about the capability of programs to foster individual student
achievement.
The school at upper grade levels uses community-based and worksite learning as integral components
of its instructional program.
The school has a comprehensive staff induction program that guides recruitment and employment and
provides ongoing professional development programs.
Cost-effective management of resources allows school districts to better meet the needs of the greatest
number of students.
The Individual Prototype Schools incorporate what research and best practices have shown to be most
important in improving student achievement and provide a level of resources that adequately promotes and
sustains that goal. Each prototype school includes:
Adequate staffing
Added instructional time and activities
for students having trouble meeting
standards
Curriculum development and
technology support
On-site instructional improvement
Professional development for teachers
and administrators
Collaboration time for teachers
Adequate classroom supplies
Adequate funds for building
maintenance
Prototype Resource Assumptions are
incorporated into each prototype school in
the Quality Education Model. The basic
assumptions include:
The size of each school is within a
range that research literature recognizes
as efficient.
The assumed level of teacher
experience is about average for schools
in Oregon.
Prototype Schools
Elementary School—340 Students All-day kindergarten
Class size average of 20 in primary grades
Class size of 24 in grades 4-5
4.5 FTE for specialists in areas such as art, music, PE,
reading, math, TAG, library, ESL, child
development/counselor
Middle School—500 Students Class size average of 22
1.5 additional teachers for math, English, and science
Alternative programs for special needs and at-risk
students
Volunteer coordinator and community outreach
worker
One counselor for every 250 students
Adequate campus security
High School—1,000 Students Class size average of 21
3.0 additional teachers for math, English, and science
Alternative programs for special needs and at-risk
students
Volunteer coordinator and community outreach
worker
One counselor for every 250 students
Adequate campus security
School-to-work coordinator

www.ode.state.or.us Quality Education Commission Report 2012
15
Each school has Internet access.
Teachers are using technology in the design and delivery of instruction.
The schools are located in close proximity to an urbanized area.
The schools are slightly below the state median in socioeconomic status (40th percentile).
The schools have approximately 13 percent of their students identified for special education.
Eleven percent of the students are recognized as speaking English as a second language.
The principal is knowledgeable about reform requirements and is supportive of the reform goals.
The principal is skilled as a leader and a manager.
Teachers are open to reform goals and the training necessary to support the reform requirements.
Teachers possess content knowledge necessary to teach to applicable state standards.
Changes in the Quality Education Model 2012
The following exhibits depict the Commission’s 2012 prototype elementary, middle, and high school.
They illustrate characteristics of the QEM’s prototype schools under the Current Service Level of funding
and the changes that would occur under full funding of the Quality Education Model. The changes that
have been incorporated are those recommended by the Commission’s Best Practices and Cost Panels.
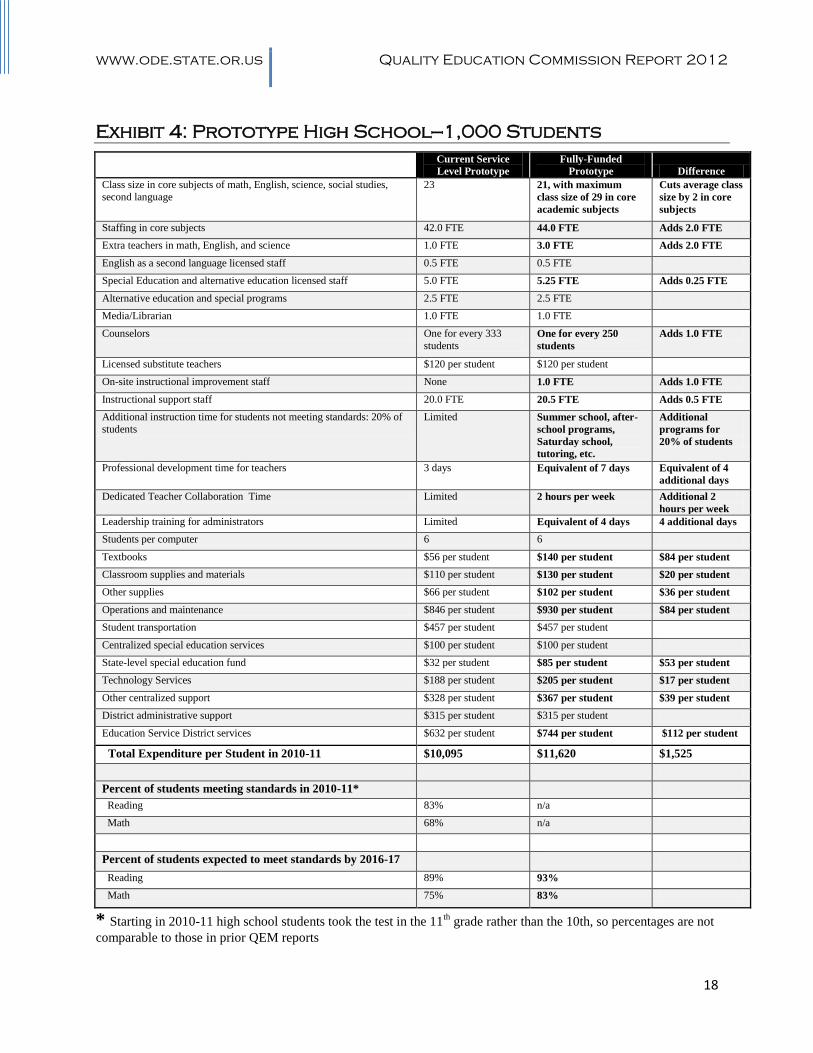
The Current Service Level Prototypes represented in Exhibits 2-4 show the characteristics of schools under
current funding levels, based on actual spending patterns in Oregon schools. The Fully-Funded Prototypes
show the Commission’s recommended level of funding required to implement a comprehensive Quality
Education Model, including all relevant resources and education programs.

www.ode.state.or.us Quality Education Commission Report 2012
16
Exhibit 2: Prototype Elementary School—340 Students
Current Service
Level Prototype
Fully-Funded
Prototype Difference
Kindergarten Half-day Full-day Doubles learning
time
Average class size 23 for grades K-3 25 for grades 4-5
20 for grades K-3
24 for grades 4-5
Cuts class size by
3 for grades K-3
and by 1 for
grades 4-5
K-5 classroom teachers 13.7 FTE 16.0 FTE Adds 2.3 FTE
Specialists for areas such as art, music, PE, reading, math, TAG,
library/media, second language, or child development
3.5 FTE 5.0 FTE Adds 1.5 FTE
Special education licensed staff 2.5 FTE 3.0 FTE Adds 0.5 FTE
English as a second language licensed staff 0.5 FTE 1.0 FTE Adds 0.5 FTE
Licensed substitute teachers $120 per student $120 per student
On-site instructional improvement staff None 0.5 FTE Adds 0.5 FTE
Instructional support staff 5.0 FTE 6.0 FTE Adds 1.0 FTE
Additional instruction time for students not meeting standards: 20% of
students
Limited Summer school, after-
school programs,
Saturday school,
tutoring, etc.
Additional
programs for
20% of students
Professional development time for teachers 3 days Equivalent of 7 days Equivalent of 4
additional days
Dedicated Teacher Collaboration Time Limited 2 hours per week Additional 2
hours per week
Leadership development training for administrators Limited Equivalent of 4 days 4 additional days
Students per computer 6 6
Textbooks $64 per student $107 per student $43 per student
Classroom materials & equipment $76 per student $89 per student $13 per student
Other supplies $54 per student $80 per student $26 per student
Operations and maintenance $742 per student $813 per student $71 per student
Student transportation $437 per student $437 per student
State-level special education fund $32 per student $85 per student $53 per student
Centralized special education services $100 per student $100 per student
Technology services $181 per student $205 per student $24 per student
Other centralized support $338 per student $360 per student $22 per student
District administrative support $305 per student $305 per student
Education Service District Services $632 per student $744 per student $112 per student
Total Expenditure per Student in 2010-11 $9,674 $11,886 $2,212
Percent of students meeting standards in 2010-11
Reading 3rd grade=83%
5th grade = 79%
n/a
Math* 3rd grade=63% 5th grade = 58%
n/a
Percent of students expected to meet standards by 2016-17
Reading 3rd grade=88% 5th grade = 85%
3rd grade=94%
5th grade = 91%
Math* 3rd grade=70%
5th grade = 66% 3rd grade=83%
5th grade = 74%
*The score required to meet the standard was raised in 2010-11, so percentages are not comparable to those in prior
QEM reports

www.ode.state.or.us Quality Education Commission Report 2012
17
Exhibit 3: Prototype Middle School—500 Students
Current Service
Level Prototype
Fully-Funded
Prototype Difference
Class size in core subjects of math, English, science, social studies, second language
23 22, with maximum
class size of 29 in core
academic subjects
Cuts average class
size by 1 in core
subjects
Staffing in core subjects 20.0 FTE 21.0 FTE Adds 1.0 FTE
Extra teachers in math, English, and science 0.5 FTE 1.5 FTE Adds 1.0 FTE
English as a second language licensed staff 0.5 FTE 0.75 FTE Adds 0.25 FTE
Special education and alternative education licensed staff 4.0 FTE 4.5 FTE Adds 0.5 FTE
Media/Librarian 1.0 FTE 1.0 FTE
Counselors One for every 333
students One for every 250
students
Adds 0.5 FTE
Licensed substitute teachers $120 per student $120 per student
On-site instructional improvement staff None 1.0 FTE Adds 1.0 FTE
Instructional support staff 11.0 FTE 11.0 FTE
Additional instruction time for students not meeting standards: 20% of students
Limited Summer school, after-
school programs,
Saturday school,
tutoring, etc.
Additional
programs for
20% of students
Professional development time for teachers 3 days Equivalent of 7 days Equivalent of 4
additional days
Dedicated Teacher Collaboration Time Limited 2 hours per week Additional 2
hours per week
Leadership training for administrators Limited Equivalent of 4 days of
training
4 additional days
Students per computer 6 6
Textbooks $51 per student $107 per student $56 per student
Classroom materials & equipment $72 per student $94 per student $22 per student
Other supplies $62 per student $91 per student $29 per student
Operations and maintenance $791 per student $868 per student $77 per student
Student transportation $439 per student $439 per student
Centralized special education services $100 per student $100 per student
State-level special education fund $32 per student $85 per student $53 per student
Technology Services $184 per student $205 per student $21 per student
Other centralized support $324 per student $347 per student $23 per student
District administrative support $315 per student $315 per student
Education Service District services $632 per student $744 per student $112 per student
Total Expenditure per Student in 2010-11 $9,957 $11,501 $1,544
Percent of students meeting standards in 2010-11
Reading 72% n/a
Math* 65% n/a
Percent of students expected to meet standards by 2016-17
Reading 80% 87%
Math* 70% 77%
* The score required to meet the standard was raised in 2010-11, so percentages are not comparable to those in prior
QEM reports
www.ode.state.or.us Quality Education Commission Report 2012
18
Exhibit 4: Prototype High School—1,000 Students
Current Service
Level Prototype
Fully-Funded
Prototype Difference
Class size in core subjects of math, English, science, social studies,
second language
23 21, with maximum
class size of 29 in core
academic subjects
Cuts average class
size by 2 in core
subjects
Staffing in core subjects 42.0 FTE 44.0 FTE Adds 2.0 FTE
Extra teachers in math, English, and science 1.0 FTE 3.0 FTE Adds 2.0 FTE
English as a second language licensed staff 0.5 FTE 0.5 FTE
Special Education and alternative education licensed staff 5.0 FTE 5.25 FTE Adds 0.25 FTE
Alternative education and special programs 2.5 FTE 2.5 FTE
Media/Librarian 1.0 FTE 1.0 FTE
Counselors One for every 333
students
One for every 250
students
Adds 1.0 FTE
Licensed substitute teachers $120 per student $120 per student
On-site instructional improvement staff None 1.0 FTE Adds 1.0 FTE
Instructional support staff 20.0 FTE 20.5 FTE Adds 0.5 FTE
Additional instruction time for students not meeting standards: 20% of
students
Limited Summer school, after-
school programs,
Saturday school,
tutoring, etc.
Additional
programs for
20% of students
Professional development time for teachers 3 days Equivalent of 7 days Equivalent of 4
additional days
Dedicated Teacher Collaboration Time Limited 2 hours per week Additional 2
hours per week
Leadership training for administrators Limited Equivalent of 4 days 4 additional days
Students per computer 6 6
Textbooks $56 per student $140 per student $84 per student
Classroom supplies and materials $110 per student $130 per student $20 per student
Other supplies $66 per student $102 per student $36 per student
Operations and maintenance $846 per student $930 per student $84 per student
Student transportation $457 per student $457 per student
Centralized special education services $100 per student $100 per student
State-level special education fund $32 per student $85 per student $53 per student
Technology Services $188 per student $205 per student $17 per student
Other centralized support $328 per student $367 per student $39 per student
District administrative support $315 per student $315 per student
Education Service District services $632 per student $744 per student $112 per student
Total Expenditure per Student in 2010-11 $10,095 $11,620 $1,525
Percent of students meeting standards in 2010-11*
Reading 83% n/a
Math 68% n/a
Percent of students expected to meet standards by 2016-17
Reading 89% 93%
Math 75% 83%
* Starting in 2010-11 high school students took the test in the 11th
grade rather than the 10th, so percentages are not
comparable to those in prior QEM reports

www.ode.state.or.us Quality Education Commission Report 2012
19
The Best Practices panel Report
n every iteration of the Quality Education Model report, the Commission has focused on identifying and
analyzing best practices in teaching and learning. The direction, scope, and method of these analyses
have been informed by reviews of educational research, data collection from Oregon educators, and
comparative academic performance. This year, the Commission determined that the Panel should focus on
two practices: Formative Assessment and Teacher Collaboration.
This focus is different from past years because the Panel is not attempting to discover new practices present
in higher-performing schools--based on past years’ school interviews and data analyses, the Panel started
already having a foundation of knowledge. For example, we examined coordinated teacher planning work
between grade levels and buildings that centered around standards and academic credit that benefitted the
students in those schools; investing in the development of teachers as effective instructional leaders to
promote student success; and a system of adequate resources and programming based on early
identification of struggling students, and appropriate interventions, which resulted in greater student
growth. The Panel analyzed this prior work and reviewed the literature with respect to these practices and
suggested two deeper areas of study: formative assessment and teacher collaboration. The Panel was
interested in analyzing, characterizing, and costing this work based on school performance data,
demographic data, surveys, and interviews.
Formative Assessment
What exactly is formative assessment? It is usually defined first as being distinguished from “summative”
assessment, with summative being “at the end” and formative being “along the way.” A common
misconception is that formative assessments are quizzes and summative assessments are tests, with the
quizzes given more frequently and in a manner that checks how the students are progressing and how they
will do on the upcoming test. Modern formative assessments go beyond the notion of a quiz in their
sophistication, and they are more often referred to as a “probe,” “measure,” or “curriculum-based
assessment.” In addition, unlike a quiz, formative assessments are not used for the purpose of student
accountability. They are important as measures that teachers use to assess and modify their own
instructional practice.
Effective teachers use the data from assessments to change their practice and improve student learning.
Frequent formative assessments provide a mechanism whereby teachers can get a constant and sensitive
data flow showing their students’ progress, allowing the teacher to monitor and adjust. Educational
research on this topic confirms that student learning increases when formative assessment and appropriate
teacher responses are present in the classroom. Furthermore, when the formative assessments are designed
from the content standards to assess key learning targets, they provide the best guidance for resource
allocations to meet school and district goals.
The Panel was specifically interested in determining how often activities associated with formative
assessment are used in successful schools and classrooms in Oregon. These activities need to be designed
and implemented by teachers, alone or in collaborative work structures. The assessments they use need to
be reliable and valid and aligned to the summative assessments that determine the degree to which students
are meeting State Standards. Most importantly, the classroom teachers and the school need to be able to
change practices and create interventions when the data show the need.
I

www.ode.state.or.us Quality Education Commission Report 2012
20
Teacher Collaboration
Unlike formative assessment, teacher collaboration is a much less well-defined practice. It is almost
universally true that teachers meet together in grade level teams, content area departments, data teams,
behavior support teams, Individualized Education Plan teams, and/or site councils. The goals and agendas
for these teams, as well as their membership, group agreements, and authority, differ widely, even in the
same school building. As an aggregate these meetings represent a significant investment in time and money
for the school. And although the nature of teacher collaboration is complex and to some degree site-
specific, it is also true that most case studies of higher performing districts and schools cite effective
teacher collaboration as a key factor to explain the performance.
One practice that has been widely adopted nationally, the “Professional Learning Community” or PLC, has
also been incorporated into many Oregon schools. As is true for many new ideas, PLCs are defined and
implemented differently in different schools and departments. Effective PLCs can improve teacher efficacy
and student learning in two fundamental ways. First, they become the natural extension of and fuel for
effective formative assessment. When teachers in PLCs regularly study the standards, create common
assessments, compare performance, modify and adjust curriculum together, and share resources, their time
and effort translates into higher learning. Second, the subject matter focus and open practice orientation of
PLCs are structured for meaningful, just-in-time professional development. When teachers in a PLC
request technical support, new learning, or resources, they have a high degree of focus and investment in
the process and the outcome.
Beyond Professional Learning Communities, other related structures to foster teacher collaboration have
been designed and implemented in schools. Critical Friends Networks have groups of teachers meet and
use protocols, of which the “consultancy protocol” is most common; Instructional Rounds groups learn
together the art of objective data collection and then help teachers and schools assess certain problems of
practice; Lesson Study participants co-develop lesson plans, observe each other teaching the lessons, and
modify and adjust as necessary.
The Best Practices Panel is specifically interested in how teacher collaboration is used in successful schools
in Oregon. Since time is such a precious resource, it is critical that the experience and effort is meaningful
for teaching and learning. In addition, teacher collaboration time can be a complex and political issue. The
amount of non-student contact hours, the question of whether there is a paid leadership structure to support
the teacher teams, and the role of the building and district administration in creating and fostering the teams
are all issues that must be negotiated, formally or informally.
Demographic and School Performance Data
The Oregon Department of Education (ODE) collects demographic and Oregon Assessment of Knowledge
and Skills (OAKS) data for all students and schools in the state. One way to analyze this conjunction of
data sets is to consider the different demographic characteristics students (special education, free and
reduced lunch, racial/ethnicity, English Language Learner, etc.) as independent variables and the school’s
assessment performance as the dependent variable. Using this construct, the ODE has done regression
analyses to determine how and to what extent these demographic variables tend to predict a school’s
performance. This method of statistically controlling for demographic influences protects the data from any
false assumptions about the effect of things like race or economic status. It personifies the mantra “all
children can learn at high levels.”

www.ode.state.or.us Quality Education Commission Report 2012
21
To identify high-performing (HP) and low-performing (LP) schools we use a statistical model that takes
into account the characteristics of the students in each school and the level of funding that each school has.
We use regression analysis to relate those variables to student performance, measured by individual student
OAKS scores. Research dating back to the early 1960s shows these variables to be correlated with student
success.
This analysis allows us to predict the performance of students in a school given the students’ characteristics
and the level of funding the school has available. We then compare how the students in each school
actually perform on the OAKS compared to how the statistical model predicts they will perform, given
student characteristics and funding levels. If a school performs well above the predicted level, it is
considered high-performing. If it performs well below the predicted level, then it is considered low-
performing. This method has the advantage of taking into account student characteristics and funding
levels, something that many of the other approaches to rating school performance do not.
Matched Pairs Analysis
From the group of high and low performing schools, 4 pairs of schools were selected for on-site interviews
(one pairs of elementary schools, one pair of middle schools, and two pairs of high schools). The pairs were
selected because they have comparable demographics but very different levels of academic performance on
OAKS. These four matched pairs are examined individually later in this report.
Interview Data
Panel members travelled to thirteen Oregon schools and conducted interviews with teachers and
administrators. Six of the schools were elementary, with three being in the high performing category, two
in the low performing, and one that scored close to its predicted score. Three of the schools were middle,
with two being high and one low. Four were high schools, with two high performers and two low
performers. One or two interviewers were present and they were encouraged to get direct quotes and to
offer their gestalt impressions. The interview questions focused on formative assessment and teacher
collaboration; sometimes the responses led to peripheral conversation and data gathering.
The schools interviewed represent all regions of the state and both rural and urban settings. However,
because larger school sizes make the predicted achievement more certain and the differences more
significant, small schools were not considered for the interviews. It is likely that studying small schools that
have high or low performance would be informative; however, it is harder to identify trends and generalize
from the small school data.
School Interviews
Panel members conducted thirteen school interviews. In every interview, school staff members were asked
the same set of questions. The interview teams contacted principals who, in turn, selected the other staff to
join them in the interview. The interview conditions therefore varied greatly from school to school with
regard to who attended the interview and the interviewee’s knowledge of school-wide practices. The
themes identified below are conclusions and conjectures of the panel members, based on the evidence
presented. In a later section, these themes will be compared to evidence from the teacher survey. These
themes are also areas for suggested future study using a more formalized research model.

www.ode.state.or.us Quality Education Commission Report 2012
22
Formative Assessment
Data and communication systems: Higher performing schools tended to use district or inter-district data
systems to track formative assessment progress, chronicle work sample information, and build electronic
portfolios. These schools were most aware of the importance of accessible progress data, and were most
likely to request more. There was particular interest in having more effective methods to offer achievement
data to parents in an accessible web-based format. Effective data systems made for more effective
formative assessment and teacher collaboration practices. This finding matches with what was found in the
two previous Best Practices Panel reports. Teachers and building administrators support regional and state
practices to improve data systems, especially to support meaningful classroom formative assessment and
progress monitoring. There is a continuing call for state leadership in this area.
Student as the key agent to learning: Higher performing schools tended to focus on having students be
conscious of and responsible for the learning targets in the classroom and on the progress they are making.
These include portfolios, student-led conferences, peer evaluation, and specific lessons where students were
taught the standards. Students facile with their own formative assessment data are better empowered and
directed to foster their own education.
Proficiency-based grading: This is an approach to classroom teaching and grading that is non-traditional in
two major ways: assessments are explicitly targeted to academic standards; and students have multiple
opportunities to reach or exceed the standard with extra time and revision being part of the process. Often
these teachers eschew letter grades (A-F) in favor of Exceeds/Meets/Nearly Meets/Does Not Meet or some
other scheme to have students focus on the learning, not the grade. In Panel interviews, secondary staff who
mentioned proficiency-based grading when they were answering questions about formative assessment was
found only in the higher performing schools interviewed. All of the grading schemes used in these high
performing schools had as their basis the state content standards and/or the Common Core Standards and
the school assessments were explicitly aligned to the content of the Oregon Assessment of Knowledge and
Skills. In general, proficiency-based grading appears to make students as well as staff more aware of their
progress towards specific learning targets and more effective in meeting those targets.
Teacher Collaboration
Effective collaboration is more than just teacher meetings: Both high and low performing schools report
that their teachers work together. The amount of time they spend meeting is not correlated with higher
student achievement. What does correlate with higher achievement is the extent to which these teacher
teams focus on achievement results and the amount of ownership or buy-in the teachers have with respect
to the teacher team structure. Teacher choice is an important variable for effective collaboration activities.
In addition, staff development activities that were requested by the teacher teams were found to be more
relevant and timely to the teacher. Here, it was crucial that the district directly support collaborative
activities that helped seed new practices that become engrained in the school culture.
Teachers need to own the agenda: One of the single most significant factors in high performing schools
with respect to teacher collaboration was the leadership of the school and district administration in
supporting the collaboration. The support that made a difference was not necessarily protected time nor
extra compensation; it was empowering the teachers to speak freely, make decisions, allocate staff
development resources, and have a voice in the master schedule. This supports earlier Panel findings that
teacher leaders and opinion makers matter a great deal. Without teacher leadership, building or district
initiatives that support student achievement have less chance of being successful.

www.ode.state.or.us Quality Education Commission Report 2012
23
Additional Findings
Work Ethic: Teachers and other staff appeared to be working hard in all schools, high and low performing.
Most school interviews reflected the fact that staff members work before and after traditional school hours
giving direct services to students. Additionally, many staff spend additional time meeting together to
collaborate during their lunch and beyond the school day.
School improvement sophistication: While the surface-level responses in high and low performing schools
were similar and many of the same terms were used in initial answers, higher performing schools tended to
have a deeper understanding of the nuances of school improvement and had more complex and adaptive
instructional systems in place. Some examples include: (1) on-going reevaluation of formative assessment
tools to make sure they are valid; (2) differentiated class sizes and differentiated core instructional time in
secondary schools; (3) early adoption of the Common Core Standards and common alignment of standards
among district schools; (4) meeting protocols to foster effective teacher collaboration; (5) attention to
creating an aligned spectrum of student interventions starting at the classroom level that allow schools to
intervene in the most cost-effective and least-restrictive manner to get a response. Much of the
sophistication observed in interviews is a credit to staff development work conducted over the last decade
on a statewide basis. Higher performing schools tended to use trained in-house experts (those who have
benefitted from the statewide initiatives), while lower performers continued to look for help regularly from
outside consultants.
School climate: While it is impossible to strictly identify cause and effect in this finding, higher performing
schools tended to speak more positively about their school and their effectiveness while lower performing
schools tended to see themselves as victims of their context. In particular, at some schools staff members
explicitly described themselves as triumphing over adversity and described this stance as a school credo.
Some schools had intentional processes to identify factors beyond their control, grieve them, and then focus
on the factors they can control. Schools with a positive climate and a “can-do” attitude found ways to work
together, sometimes outside of formal systems, which led to increased performance.
Matched Pairs
Case 1: Elementary Pair (HP = high performing, LP = low performing)
The elementary matched pair produced a stark contrast between two schools that serve high-poverty
student populations. One important condition to note is the very low quality of the facility at the LP school:
teachers work in portables and in the winter rarely venture out from their classrooms. The HP facility was
clean with walls filled with student work and affirming statements.
With regard to formative assessments, the HP school was notable for analyzing different formative
assessment types and their relative strengths and weaknesses. In the HP school, it was clear there was an
ongoing cycle of continuous improvement with regard to the building plan for formative assessment. The
LP school talked in more general terms about school and district alignment. The HP school utilized a
district database to submit work samples while the LP school collected writing samples and some physical
portfolio documents. The HP school was intent on finding a way to use the student information systems to
better communicate assessment data to parents online. The system of interventions in the HP school was
centered in the classrooms, while the LP school focused more on building consultants and additional
programs. The schools had a similar amount of intervention time daily for struggling students.

www.ode.state.or.us Quality Education Commission Report 2012
24
The HP school reported a number of staff collaborative activities, including lesson study, studio classes,
and professional learning communities. However, they were very conscious of the fact that they needed
more time to do the job right. The HP school had a half day every trimester, while the LP school had an
early release every week. With regard to meeting structure and effectiveness, the HP interview again was
notable because of the critical nature of the response: the HP staff valued meeting time and they wanted to
analyze how they were doing it and improve. The HP staff also specifically noted that they share student
work with each other to get detailed feedback for improvement. The interviewer noted that at the HP
school, the principal and lead teacher both were excited about the work they were doing together. At the LP
school the interviewer noted a lack of the feeling that the school was excelling.
Case Two: Middle School Pair (HP = high performing, LP = low performing)
Both middle schools in this pair are rural schools with enrollments of about 400 students. The HP school
was closer to other schools/districts than the LP school, which faced a setting with the challenge of great
geographic distance from other schools, or from “people resources.” Both faculties were well focused on
improving student achievement, and were working very hard.
Both schools reported on a variety of formative assessment practices. The HP school notably had a chart in
the gymnasium depicting the schools’ progress with regard to student achievement. The HP school also
reported that they had district alignment for the development of formative assessments and that they used
portfolios, while the LP school work was more localized and “fledgling.” The HP school had a once-a-
week advisory period, but the LP school had no time for extra help for students. In fact, at the LP school,
teachers did not have a prep period at all.
The answers with regard to teacher collaboration time were very similar between the schools. The HP
school reported more structured planning time, but both schools were using their time in ways that focused
on student achievement. One difference was that most of the HP school activities were organized by the
principal and conducted with the whole staff while the LP activities were more likely to be led by a teacher
and done in smaller groups. Teachers in both schools reported confidence and comfort with their leadership
structures.
Case Three: High School Pair (HP = high performing, LP = low performing)
The first pair of high schools are medium to large in size (500-1000) and are the only high school in their
district. Single high school districts can help create conditions that support more effective alignment. Both
schools had relatively new principals who each eagerly engaged at a deep level with their staff during the
interviews. However, their descriptions of the leadership styles of their predecessors and the history of
district mandates helped explain the differing performance of the two schools. In the HP school, the staff
fondly recalled how their last principal had given over to the staff a significant amount of decision-making
responsibility. They recounted how she had led a cathartic staff process to get everyone’s input into
creating an explicit list of the factors they could control with regard to their students and factors they could
not control. The HP school staff had come together, and with added responsibility and authority they were
functioning better as a staff. In contrast, the LP school staff had a different story of their recent past. They
had implemented a mandatory Professional Learning Community structure for all staff, which produced
immediate resistance and discontent with no real perceived progress for any but their math department.
With regard to formative assessments, the HP school reported that their departments had some limited
success with common assessment planning and review. At the LP school most of the groups had found the
PLCs “strained and uncollaborative.” The HP school specifically mentioned how important it was for
www.ode.state.or.us Quality Education Commission Report 2012
25
students to understand their formative assessment data and teachers used portfolios for that purpose. The
portfolio system at the LP school was limited to career standard work samples and documentation. The HP
school staff members were beyond the first stages in the process of common core alignment. At the LP
school, they had recently worked with an on-line curriculum-auditing program from their ESD to develop
power standards based on then current Oregon content standards. LP staff lamented that they needed just a
year later to start the process over again to align to the newly-adopted Common Core Standards. The HP
staff had specific examples of new course titles and reconfigurations that had resulted from teachers
studying data and suggesting interventions. For example, they differentiated the length of specific classes to
give more time on task to particular students and subjects. The LP staff commented that their freshman
intervention class was unsuccessful and that it would be changed. The LP staff also mentioned staff
resistance to administration suggestions that they develop more classroom interventions. The HP school
used OAKS, PSAT and grades to help guide student entry into and exit from intervention classes. The LP
school identified the fact that some staff feel there is a disconnect between those who need interventions
and those who are actually receiving them, but they did not have a data-based description of the problem.
The LP school has had a recent history of ostensibly well-supported PLCs that are given dedicated time and
guidance to help improve staff efficacy and student achievement. However, all staff agreed that these teams
are only in some cases productive while in most cases they appear to be unproductive or counter-
productive. The HP school had fewer formal structures than most high schools with an almost completely
flat leadership model. Their recent history since the last principal was to form ad-hoc committees to address
issues. Most of the productive teacher collaboration that the HP school described was squeezed in
whenever possible and made more possible by having teachers who are working together in adjacent
rooms. The HP teachers talked about the value of their collaboration with colleagues as being incredibly
satisfying. With regard to collaboration, this case study provides somewhat counter-intuitive results. In one
case a school is implementing a Professional Learning Community (although poorly) and its students are
under-performing. In the other case, a school is implementing a patchwork of approaches and somehow
doing that very well, creating a climate and culture of high staff and student achievement.
Case Four: High School Pair (HP = high performing, LP = low performing)
The second high school pair represents schools from large urban districts that have similar size and
demographics, but entirely different organizational structures. Each school serves a relatively diverse
population of over 1,300 students and a student community with a high percentage of families who qualify
for free and reduced lunch. The LP school is a traditional comprehensive high school; the HP schools are
part of a set of small schools that exist on the same physical campus. Three of these small schools scored in
the top six in the state with regard to doing better than predicted on the 10th grade OAKS reading and math
tests. The interviewers at the LP school noted that the school is recently turning around the impression that
they are a poor school, with particular emphasis on increasing rigor, staffing more AP courses, and
retaining high performing students. With regard to the school improvement process, the HP schools were
observed as being farther along in the process in a number of dimensions. The HP school has benefitted
from a large external funding source in the recent past that provided technical assistance; the LP school has
only recently been awarded with more staffing to account for the school’s higher needs.
Comprehensive formative assessment practices are rare in high schools. Of all the high schools interviewed
in this study, the HP schools were by far the most advanced with regard to a systematic approach to
ensuring student achievement. The HP schools use the same grading program and learning targets. In
almost every answer given with regard to alignment and assessment, the LP school listed activities (usually
teacher-specific), while the HP schools talked about frameworks and the ongoing improvement process,
and they were already aligning assessments to the Common Core Standards. The HP schools also put
www.ode.state.or.us Quality Education Commission Report 2012
26
emphasis on students being agents in understanding their assessment data and figuring out how to improve.
The HP staff was more critical of their current assessment practices: the balance between meeting as small
schools and meeting in building content areas; the fact that teachers need encouragement to share student
work in their PLC groups; and that teachers still need to improve with respect to how they use data. At the
LP school, staff noted that they have too many initiatives, which “suffocate the core of what we’re trying to
do.” They noted that it is easy to lose track of students when they focus on changes.
With regard to teacher collaboration, both the LP school and the HP schools noted how difficult this was
because of insufficient time and money. The best collaboration was often serendipitous and informal.
However, in the recent past the HP staff had had a tremendous amount of grant-funded time to develop
professionally and personally with each other and to produce important work products like common
assessments and group agreements with regard to work samples. This foundational work appears to make
the HP schools better able to use the time they do find to collaborate, with established norms, meeting
protocols, and a continuous improvement orientation.
Survey Data
The Best Practices Panel conducted two rounds of surveys between December of 2011 and May 31 of
2012, one for all teachers in Oregon and the second for teachers in the matched pair schools. The two
surveys were nearly identical and included questions designed to collect information from teachers about
their involvement in activities associated with the practice of combining formative assessment and
professional teacher collaboration in a system of continuous improvement. The Panel’s best practice
literature and research review pointed to this practice as “high leverage” for ensuring individual student
growth resulting in more equitable learning outcomes for all students.
The Best Practices Panel used the following definitions for teacher collaboration and formative assessment
for both rounds of the survey:
Teacher collaboration – Teachers working cooperatively together to continuously improve their
professional practice and the learning outcomes of their students through an analysis of student data and
the effectiveness of targeted interventions.
Formative Assessment – Classroom-based assessments providing timely information about student
learning that is used to adjust instruction to improve students’ achievement of intended learning
objectives/outcomes. Some examples of formative assessment techniques are an “exit slip” at the end of a
class period, use of “red/green” (stop/go) cards, “thumbs up/thumbs down” responses, analogy prompts,
and one- minute essays.
In the first round 3,072 Oregon teachers responded and in the second round, 287 responded. Of the 3,359
respondents, 659 were eliminated from the analysis of survey results because they: 1) did not answer
survey questions beyond the first two; 2) did not identify their school; or 3) identified a school not on the
survey list of schools. Also, duplicate records were eliminated for 21 respondents who responded in both
rounds of the survey.
The remaining 2,679 respondents comprise 10.6% of the total number of active K-12 classroom teachers in
Oregon and represent over 1,300 schools throughout the State. The distribution of respondents across
school level is shown below. The distribution is very similar to the distribution of students across the
school levels, so each school level is represented in proportion to the students it serves.

www.ode.state.or.us Quality Education Commission Report 2012
27
Exhibit 5: Distribution of Respondents by Level
Level of School
% of Respondents by
Level
Elementary School 44%
Middle School 23%
High School 29%
Combined Schools (K-8, K-12) 4%
Statewide Teacher Survey Results
The general results from the Statewide Teacher Survey are summarized below (see Appendix A for more
detail). Findings from this survey include the amount of time teachers throughout the State reported
spending in activities associated with professional collaboration and formative assessment. Significant
progress has been made in the implementation of all activities, and activities(s) that are reported to have the
highest implementation rates are highlighted in Exhibit 6 below:

www.ode.state.or.us Quality Education Commission Report 2012
28
Exhibit 6: All Teacher Survey Results
These results are remarkable in that they reveal a fairly high level of implementation of activities associated
with formative assessment and professional teacher collaboration even in the face of reduced funding to
schools. This helps explain why the State’s OAKS results continue to improve gradually. Also, they could
provide critical information about activities that provide the most leverage for instructional improvement
and the cost of bringing to scale these-high leverage practices throughout the State’s system of K-12
schools.
Teacher Surveys Round 2
The general results from the Matched Pair survey data are summarized in Exhibit 7 below (see Appendix A
for more detail). The second round of the surveys was administered to teachers in a smaller subset of
Best Practices Survey Questions for All Teachers Statewide
(Listed in the order they appeared on the survey)
% of All Teachers who
reported engaging in
this Activity
3. Collaborate with others on curriculum choices? 65.4%
4.a Analyze student evidence from classroom assessments with colleagues 30 minutes or more per week? 59.6%
4.b Analyze student evidence from common benchmark assessments with colleagues 30 minutes or more per
week? 52.5%
4.c Analyze student evidence from state assessments with colleagues 30 minutes or more per week? 31.4%
4.d Identify and implement changes in instructional practice with colleagues 30 minutes or more per week? 68.3%
4.e Reflect on and refine changes in instructional practice with colleagues 30 minutes or more per week? 64.6%
5.a Have a late start or early release schedule for teacher collaboration? 30%
6. Set goals for improving student achievement when collaborating w/colleagues usually or always? 55.3%
7.a Share learning objectives in student friendly language at least monthly with students? 97.5%
7.b Use formative assessment techniques at least monthly? 95.4%
7.c Provide students at least monthly (or more) feedback about their progress in meeting learning
objective/standards? 94.7%
7.d Use targeted instructional practices at least monthly to address specific learning needs of individuals or
small groups of students? 97.1%
7.e Provide feedback to parents at least monthly on the degree to which their child has mastered a specific
learning objective/standard?
59.1%
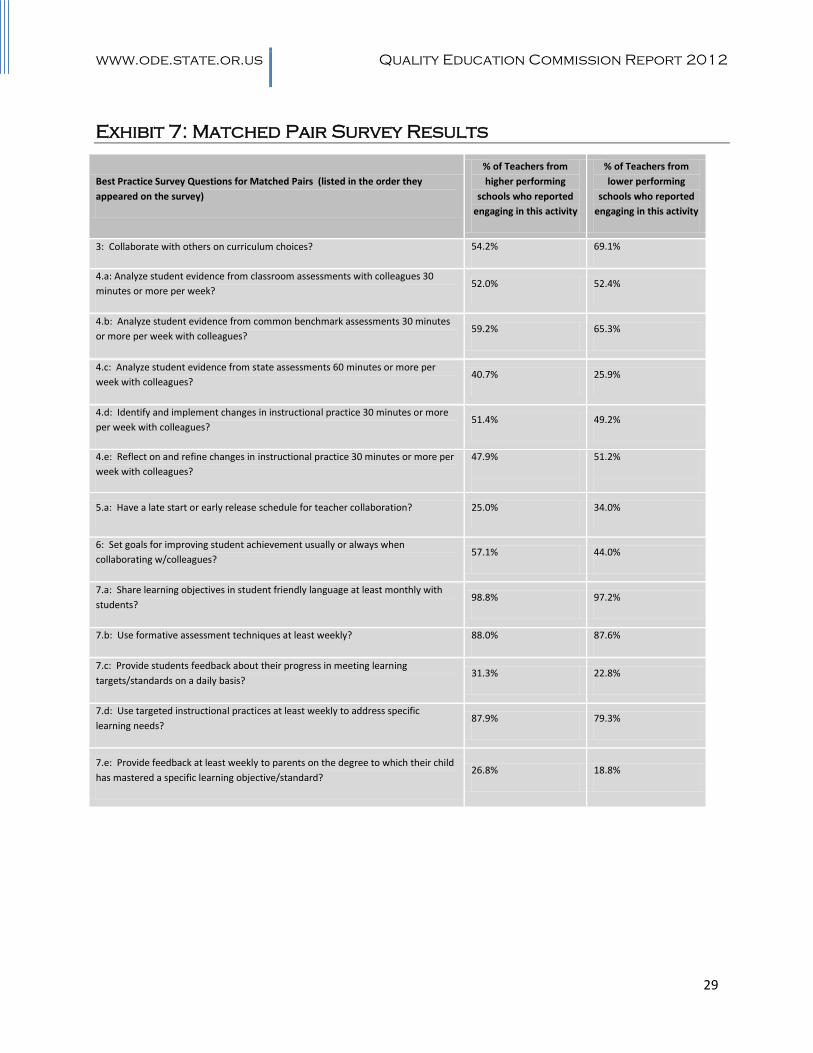
www.ode.state.or.us Quality Education Commission Report 2012
29
Exhibit 7: Matched Pair Survey Results
Best Practice Survey Questions for Matched Pairs (listed in the order they
appeared on the survey)
% of Teachers from
higher performing
schools who reported
engaging in this activity
% of Teachers from
lower performing
schools who reported
engaging in this activity
3: Collaborate with others on curriculum choices? 54.2% 69.1%
4.a: Analyze student evidence from classroom assessments with colleagues 30
minutes or more per week? 52.0% 52.4%
4.b: Analyze student evidence from common benchmark assessments 30 minutes
or more per week with colleagues? 59.2% 65.3%
4.c: Analyze student evidence from state assessments 60 minutes or more per
week with colleagues? 40.7% 25.9%
4.d: Identify and implement changes in instructional practice 30 minutes or more
per week with colleagues? 51.4% 49.2%
4.e: Reflect on and refine changes in instructional practice 30 minutes or more per
week with colleagues?
47.9%
51.2%
5.a: Have a late start or early release schedule for teacher collaboration? 25.0% 34.0%
6: Set goals for improving student achievement usually or always when
collaborating w/colleagues? 57.1% 44.0%
7.a: Share learning objectives in student friendly language at least monthly with
students? 98.8% 97.2%
7.b: Use formative assessment techniques at least weekly? 88.0% 87.6%
7.c: Provide students feedback about their progress in meeting learning
targets/standards on a daily basis? 31.3% 22.8%
7.d: Use targeted instructional practices at least weekly to address specific
learning needs? 87.9% 79.3%
7.e: Provide feedback at least weekly to parents on the degree to which their child
has mastered a specific learning objective/standard? 26.8% 18.8%

www.ode.state.or.us Quality Education Commission Report 2012
30
matched-pair schools. While the differences in responses between the “performing higher than predicted”
and “performing lower than predicted” schools in the matched pair were not large, they do exist and they
are the same activities that the Panel’s best practice and literature review pointed to as effective in
improving student achievement:
Analyze student evidence from state assessments with colleagues for at least 60 minutes per week.
Set goals for improving student achievement when collaborating with colleagues.
Use formative assessment techniques at least weekly.
Use targeted instructional practices at least weekly to address specific learning needs.
Provide feedback to students on their progress on a daily basis.
Provide feedback at least weekly to parents on the degree to which their child has mastered a
specific learning objective/standard.
Site interviews of teachers in higher and lower performing schools revealed that specific collaborative
activities in these schools appear to be different, with the high-performing schools tending to focus more on
the analysis of student OAKS test data and setting student achievement goals than did the low-performing
schools. This result suggests a more in depth study into the form and function of teacher collaborative time
in Oregon is needed to identify the detailed practices that are most effective.
Another finding involves the feedback teachers report giving to students and parents, which suggests the
higher performing schools report more frequently. This result is also consistent with school interview
comments from teachers in higher performing schools who were the most likely to seek better reporting
technology that they could use to report information about student proficiency levels and academic
progress to parents, students, and other teachers.
The Cost Panel Report
N each two-year round of the Commission’s work, the Commission’s Cost Panel updates the Quality
Education Model’s cost calculations with the most recent data available and forecasts how costs will
change over time. The panel also incorporates into the QEM’s cost calculations any changes in resource
requirements that the full Quality Education Commission adopts. In the 2012 round of the Commission’s
work, the Cost Panel also analyzed the academic progress of intact cohorts of students as they progressed
through the grades. It evaluated that progress in relationship to district allocation of resources to individual
schools to see if certain grades get more “bang-for-the-buck” than others. The results of that evaluation are
discussed later in this section.
Data Update
The Cost Panel updates all of the model’s data and forecasts with the most recent information available.
For this round of the Commission, the most recent expenditure data comes from school district and
education service district (ESD) audited financial statements for the 2010-11 school year. Similarly, the
latest data for wages and salaries, from Department of Education data collections, are for 2010-11.
Enrollment data and student demographic data, because they are collected earlier than the financial data,
are available for the 2011-12 school year.
I

www.ode.state.or.us Quality Education Commission Report 2012
31
One specific and important change to the data reported in the 2012 version of the model relates to reporting
of expenditures for the Public Employees Retirement System (PERS). Many Oregon school districts issued
bonds as a way to reduce the burden of rising PERS contribution rates for employers. The proceeds from
the bonds (the so-called “side accounts”), are invested with other PERS assets and the earnings on the
invested bond proceeds are used to help pay the districts’ PERS obligations—in effect, buying a lower
employer contribution rate. For the districts that issued these bonds, the earnings on the side accounts have
generally been higher than the debt service requirements on the bonds, improving the financial position of
the districts.
The QEM uses the full PERS rate in its calculation of the costs of the K-12 system, but in the past did not
include the side account earnings as a revenue source. This past practice is inconsistent—the side account
earnings should be included either as a revenue source or as a reduction in the effective PERS rate. To
correct this inconsistency, starting with the 2012 version of the QEM, we include side account earnings as a
revenue source. For the 2013-15 biennium, side account revenue is forecast to be approximately $445
million.
Resource Allocation and Student Achievement
The decline in state and local revenue from the current economic downturn has left Oregon schools with
per student revenue more than 9% below the pre-recession level in 2007-08 and almost 20% below the
level the Quality Education Commission recommends. With the expectation of relatively slow revenue
growth for the next two or three biennia, there is increased attention on improving the efficiency in the use
of existing school resources. As a first step in better understanding how Oregon school districts currently
use their resources, the Cost Panel evaluated how districts allocate resources across schools and how that
allocation impacts the path of student learning as students progress through the grades. This evaluation is
just one part of a more comprehensive analysis of education resource use that needs to be done in order for
policymakers and educators to make decisions that get the most out of Oregon’s education dollars.
Education is a cumulative process, with certain knowledge and skills that must be mastered before more
advanced and complex concepts can be learned. In addition, there are limits on how much students can
learn over a given period of time, both because of time constraints and because of the timing of cognitive
development as children grow. These two factors mean that, if school districts are to get the most “bang-
for-their-buck,” they must take into account these aspects of learning when making decisions about how to
allocate resources to schools and to grades. Spending too much when students are in the early grades
means those resources are not available for the later grades, when the increment of learning per dollar may
be larger. Conversely, spending too little in the early grades means students are not prepared for the more
complex concepts they will encounter in the later grades.
These trade-offs between spending in the early grades versus spending in the later grades suggest that there
may exist an alternative allocation of spending over the grades that can increase the cumulative learning
that students attain during their time in school. The primary focus for the 2012 Commission’s Cost Panel
was to evaluate the impact that resource allocations across schools has on student achievement as students
advance through the grades. Ideally the analysis would include the entire educational continuum—Pre-
kindergarten through higher education—but Oregon currently does not have sufficient data for the Pre-K
and higher education years to perform such an analysis. The Commission’s analysis, therefore, focuses on
K-12 but recognizes that future analyses must incorporate Pre-K and higher education. Data collection
efforts that are already underway will provide the required data to do those analyses in the near future.
The analysis described here combines student-level academic performance data and demographic
information with school level financial data to evaluate whether the allocation of resources across

www.ode.state.or.us Quality Education Commission Report 2012
32
elementary, middle, and high schools has an impact on the highest level of achievement students are able to
attain in high school for a given level of resources. Specifically, we follow intact cohorts of students
through the grades, tracking the level of spending in elementary, middle, and high schools they attend and
correlating that with their scores on the Oregon Assessment of Knowledge and Skills (OAKS), Oregon’s
standardized academic achievement test. We use multiple regression analysis to determine whether there
are statistically significant relationships between spending and achievement, and we use those relationships
to evaluate whether different spending patterns across schools are associated with higher levels of student
achievement in high school.
The model estimates current year student achievement as a function of the prior year’s achievement and
current year spending for each grade for which Oregon administers the OAKS. The model also includes
variables for school size and student attendance rates. The variables used are described below.
Student achievement: The student’s raw score on the OAKS test (known as the RIT score).
Prior year student achievement: The student’s RIT score in the prior year.
Instructional expenditures per student: The average spending for instructional purposes at the
school the student attends.
School enrollment: The number of students enrolled on October 1 at the school the student attends.
Attendance rate: The percentage of total days that the student was present at school.
The equation to be estimated is shown below, with the expenditure and enrollment variables expressed in
logarithmic form to account for non-linear effects. The enrollment variable also enters in quadratic form
(by entering a second time as a squared term) to account for possible diseconomies of scale in very large
schools.
student achievement = a + b*prior year student achievement + c*ln(instructional expend. per student)
+ d*ln(school enrollment) + e*ln(school enrollment)2 + f*attendance rate
Where a, b, c, d, e, and f are the coefficients to be estimated. These coefficients represent the estimated
impacts of the factors on current year student achievement.
The two factors of primary interest—ones that can be influenced by school district resource allocation
decisions—are prior year student achievement and instructional expenditures per student. Districts could,
for example, choose to increase funding for elementary schools, anticipating that better student
performance there will carry over and indirectly increase performance in middle school and then high
school. Alternatively, districts could increase funding in high schools, foregoing the indirect impacts of
added funding in elementary schools, but gaining direct impacts on student achievement of the increased
high school spending.
The goal is to allocate resources in a way that gets students to the highest level of achievement by the time
they finish high school (given that this analysis is limited to K-12). This requires balancing the indirect
impacts on later achievement that added resources have in the early grades against the more direct impacts
that more resources have in the later grades. But because the impacts of shifting greater resources to the
earlier grades can fade over time (e.g., during the summer months when school is not in session), as a
general rule the impacts in the early grades need to be larger than those in later grades in order to have the
same eventual impact on achievement at the high school level.

www.ode.state.or.us Quality Education Commission Report 2012
33
Evaluated this way, the decision rule for allocation of resources is straightforward: allocate resources
across schools (and across grades within schools) so that eventual impact on high school achievement is
equalized across all possible allocation options. While this may sound quite technical, it boils down to
something quite intuitive: add resources in the schools and grades where you get the most bang-for-your-
buck, where bang-for-your-buck is defined as the eventual impact on your desired outcome—high school
achievement/graduation.
Estimation Results
Using student test scores from the Oregon Assessment of Knowledge and Skills (OAKS) for math and
reading, we followed intact cohorts of students through the grades and estimated the coefficients in the
equation above. OAKS results for the 2006-07 school year are unreliable because the state was forced to
switch from the online testing system to pencil/paper tests in the middle of the year. We could not,
therefore, estimate parameters for 2006-07 or 2007-08 (because the 2007-08 equation uses 2006-07 test
scores as one of its inputs). The estimated math and reading coefficients, averaged across the 10 cohorts
and all years for which we have data, are shown in Exhibit 8.
Exhibit 8: Resource Allocation Model Estimation Results
Average Instructional Spending Coefficients
Average Prior Year Achievement Coefficients
Math Reading Math Reading
4th Grade 1.0975 0.0976 0.7518 0.7069
5th grade -0.0367 -0.2846 0.7406 0.6956
6th Grade 0.3832 0.0949 0.8298 0.7944
7th Grade 0.4493 0.7112 0.7568 0.8105
8th Grade -0.0387 -0.1543 0.8733 0.7077
10th Grade 0.1886 -0.2562 0.6633 0.7168
While the coefficients vary somewhat over different cohorts of students, for the math equations the results
show, on average, that the direct impact of added resources on student achievement is higher in grades 4, 6,
and 7. This suggests that student math achievement can be improved by adding relatively more resources
to the late elementary and middle school level as more resources become available. For reading, the impact
of adding more resources is largest in the 7th grade.
The coefficients on the prior-year achievement variable are considerably lower than 1.0, suggesting that
knowledge and learning is only partially carried over from one grade to the next. This finding is consistent
with the fact that many students have limited opportunities for academic learning over the summer months
when school is not in session.
The estimation results indicate sizeable differences in the relative bang-for-the-buck of adding resources in
different grades. For example, the eventual impact on 10th grade math test scores of increasing spending in
the 6th grade is more than twice as large as the impact of an equivalent increase in spending in the 10
th
grade. In other words, enough of the achievement gain from adding more resources in the 6th carries
through to the 10th grade to make it greater than the gain from adding the same amount of resources directly

www.ode.state.or.us Quality Education Commission Report 2012
34
in the 10th grade. For reading, the impact of adding resources in the 7th grade is considerably larger than in
any other grade.
The estimated magnitude of the achievement gains are, however, relatively small. As an example, the
addition of $500 per student to the 6th grade will increase high school test scores by about 0.05 RIT points.
In contrast, the addition of $500 per student in the 10th grade will increase scores only about .02 RIT points.
This analysis assumes an increase in spending for all students. If the spending were instead targeted to
students with specific needs, the added resources per student served would be larger, resulting in larger
impacts on achievement for those students.
Conclusions
While far from conclusive, this analysis adds to our understanding of how resources can best be used to
promote higher achievement, and it also provides a good beginning in our efforts to better understand the
question of how resources affect the cumulative learning of students as they progress through the grades.
Our results do not find large impacts, but they do provide some guidance about where to spend additional
resources when they become available. Adding resources in the early and middle grades appears to be more
productive in reaching higher levels of achievement than does adding resources in the high school grades.
Because circumstances vary from district to district, however, the primary lesson of this analysis is that
school districts should take a careful look at their methods for allocating resources to individual schools.
Districts may be able to raise student achievement by allocating resources based on measures of student
need and student outcomes as they progress through the grades rather than on simple formulas based
primarily on student to staff ratios.
Finally, it is important to note that this analysis only looks at K-12, and even within K-12 cannot evaluate
the earliest grades (kindergarten to grade 3) because of the lack of achievement data for those grades. A
more comprehensive and useful analysis would look across the entire educational spectrum from pre-
kindergarten through higher education. Previous research, for example, suggests a large payoff to high-
quality pre-kindergarten program, particularly for economically disadvantaged students.
The State of School Funding in Oregon
he Quality Education Commission’s second major charge is to calculate the appropriate level of
funding to ensure that Oregon’s K-12 education system meets its quality goals. In this way, the QEM
illustrates how educational spending is linked to student performance and how resource levels impact
overall achievement. For more than two decades, though, Oregon has been forced to reconcile ambitious
educational goals with resource limitations.
Ballot Measure 1, passed by Oregon voters in November 2000, sought to increase education funding levels
in Oregon. Still, the state continues to struggle with budgetary shortfalls and education funding levels
generally regarded as inadequate. The recession following the housing market crash in 2008 left Oregon
with multi-billion dollar budget shortfalls, and recovery from the recession has been slow. In each of its
constitutionally mandated Measure 1 reports, the Legislature has acknowledged that the level of state
resources devoted to K-12 education has been insufficient to meet the quality education goals established in
Oregon law. Specifically, the legislative reports cite the following factors:
T

www.ode.state.or.us Quality Education Commission Report 2012
35
Declines in local resources available for schools due to cuts in property taxes required by Ballot
Measure 5 (1990) and Ballot Measure 50 (1997)
State revenue declines resulting from the economic recessions
New federal mandates not accompanied by sufficient federal funding
Large increases in required contribution rates to the Public Employees Retirement System (PERS)
Rapid growth in health insurance premiums paid by school districts
Higher transportation costs faced by school districts due to increases in fuel prices
Trends in School Funding
Understanding the state of school funding in Oregon today requires an understanding of the property tax
limitation measures passed in the 1990s. Ballot Measure 5, passed in 1990, cut school property taxes
dramatically by capping the school property tax rate at $5 per $1,000 of market value. Despite the reduced
rates (which were phased-in from 1991-92 to 1995-96), rapidly growing real estate market values in the
early and mid-1990s caused property tax bills to continue to grow, and in response Oregon voters passed
Measure 50 in 1997, further cutting property taxes. As a result, the amount of funding for schools has been
decreasing in inflation-adjusted dollars.
Prior to the passage of Measures 5 and 50, school district and education service district combined property
tax rates in Oregon averaged $16.53 per $1,000 of market value. For the 2011-12 tax year, they averaged
$4.09 per $1,000 of market value, a tax rate cut of 75 percent since 1990-91. As a result of the dramatic
decline in local property tax funding available for schools, more responsibility shifted to the state, with state
general fund dollars becoming the primary source of funding for Oregon schools.
Exhibit 9: Total School district Operating Revenue

www.ode.state.or.us Quality Education Commission Report 2012
36
Exhibit 9 illustrates trends in local, state, and federal funding for Oregon’s schools. Although state income
tax revenue was able to make up for much of the lost property tax revenue throughout a period of economic
growth in the 1990s, state revenue declined substantially in 2003 and again in 2008 with the onset of
economic recessions. With less financial support from the state and a limited ability to raise local property
tax revenues, Oregon school districts still had to balance their budgets; in many cases this has meant cutting
staffing levels and shortening the school year.
K-12 total operating revenue has generally increased over time in nominal dollars (not adjusted for
inflation), but education costs have risen considerably faster than have consumer prices (as measured by the
Consumer Price Index). These rising costs, along with growing enrollments and changing demographics,
mean that inflation-adjusted revenue available to Oregon’s school districts has declined considerably over
the past two decades. Exhibit 10 shows that inflation-adjusted revenue per student fell from $5,019 in
1990-91 to an estimated $4,553 in 2010-11, a decline of 9.3%.
Exhibit 10: Inflation-Adjusted Revenue per Student
The Funding Gap
For the 2013-15 biennium, the Quality Education Model estimates that state funding of $8.75 billion is
necessary to reach the state’s educational goals. Given the Current Service Level estimate (the amount
required to fund the same level of services provided in the prior biennium), a funding gap of $2.44 billion
will remain if the Legislature adopts the Current Service Level for the 2013-15 biennium, as shown in
Exhibit 11.

www.ode.state.or.us Quality Education Commission Report 2012
37
Exhibit 11: State Portion of K-12 Education Funding
State Portion of K-12 Education Funding (Billions of Dollars)2013-15
Biennium
Current Service Level* $6.32
Fully-Funded Quality Education Model $8.76
Funding Gap $2.44
* Funding required to maintain level of services provided in 2011-13.
The Oregon Legislature’s consistent failure to appropriate adequate state funding for the public education
system means this funding gap has been growing over time. As Exhibit 12 shows, the funding gap
narrowed to $1.64 billion in 2007-09, down from $1.79 billion in 2005-07. However, the gap widened
again in 2009-11 and reached $2.21 billion in 2011-13. If the legislature funds schools in 2013-15 at the
Current Service Level, the gap is projected to increase to $2.44 billion. Governor Kitzhaber has indicated
his intent to reverse the trend of a declining share of the state budget being directed to education, but given
weak revenue from Oregon’s income tax, it is unclear how much progress in closing the funding gap can be
made in the 2013-15 biennium.
Exhibit 12: History of Oregon School Funding Gap

www.ode.state.or.us Quality Education Commission Report 2012
38
A strategy to eliminate the funding gap must be based on two components: increased levels of funding
available to schools and increased efficiency in educational service delivery. For more than a decade,
education funding per student provided by the state has not kept up with educational cost increases, which
have risen faster than commonly used measures of inflation like the Consumer Price Index. Further,
Oregon has experienced substantial growth in its population of students with special needs. Although the
share of students meeting state academic standards has continued to increase under these circumstances, the
rate of achievement growth is showing signs of slowing. Unless the state can provide additional resources
and districts can improve the effectiveness with which they use resources, progress in student achievement
is unlikely to continue. Particularly in a period of economic downturn and higher academic standards,
Oregon’s short-term challenge is to get more out of the education dollars it currently has, and its long-term
challenge is to increase the level of resources devoted to education.
Oregon’s education reforms have the potential to increase the efficiency of education delivery in Oregon in
three primary ways: first, by reducing administrative redundancies through the integration of pre-
kindergarten, K-12, and post-secondary programs; second, by improving coordination and alignment of
programs across the education continuum, particularly at key student transition points; and third, by
creating incentives in funding systems that promote more efficient use of resources by schools and more
efficient use of time by students. While all three of these reforms can help Oregon get more from each
education dollar, the magnitude of those gains will not be sufficient to get Oregon to its educational goals.
Without higher funding, Oregon will almost certainly fail to meet those goals.
The State of Student Achievement in Oregon
regon has set very high academic goals for its schools and students. Schools are called on to provide a
world-class education, while students must demonstrate the essential knowledge and skills needed to
fulfill their potential in advanced learning, work, and citizenship. Because the results of state standardized
assessments are a commonly used and relatively consistent measure of student performance, the Quality
Education Commission utilizes them to understand trends in student achievement over time. The
Commission does recognize, however, that standardized assessments are just one measure, and no single
measure can adequately reflect all dimensions of student learning and achievement. With renewed
attention being paid to graduation rates nationally, and with Oregon’s recently-adopted 40-40-20 education
goals requiring dramatic increases in graduation rates, more attention to graduation rate trends and the
factors that influence student decisions to drop out of school clearly are needed.
As in prior reports, this year’s report includes statewide data on student performance on the Oregon
Assessment of Knowledge and Skills (OAKS) tests for reading, math, and science. OAKS tests for reading
and math are administered in grades 3-8 and high school. Scientific inquiry is assessed in grades 5, 8, and
high school.1 Writing tests were given in grades 4, 7, and high school, but the 4
th and 7
th grade tests were
eliminated in 2008-09 due to budget cuts. This report also presents information about the high school
graduation rate, including the recently released cohort graduation rate for the years for which it has been
calculated.
1 Starting in 2010-11, the high school tests were administered to most students in the 11
th grade. In prior years, it was
administered in the 10th
grade. In the graphs presented below, the prior-year scores have been adjusted to be comparable to the 11
th grade scores for 2010-11.
O

www.ode.state.or.us Quality Education Commission Report 2012
39
Exhibit 13: Percent Meeting Math Standard
Exhibit 14: Percent Meeting Reading Standard

www.ode.state.or.us Quality Education Commission Report 2012
40
Exhibit 15: Percent Meeting Math Standard by Subgroup 2010-11
Exhibit 16: Percent Meeting Reading Standard by Subgroup 2010-11

www.ode.state.or.us Quality Education Commission Report 2012
41
Exhibit 17: Percent Meeting Science Standard
Exhibit 18: Percent Meeting Writing Standard
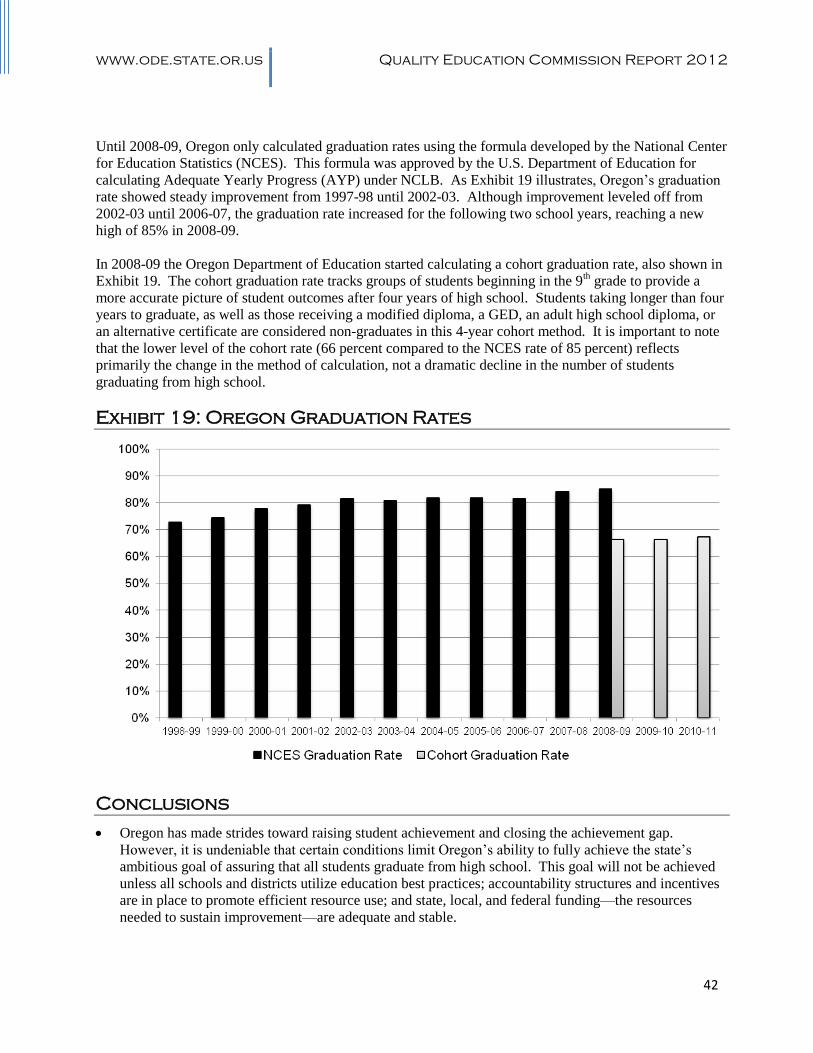
www.ode.state.or.us Quality Education Commission Report 2012
42
Until 2008-09, Oregon only calculated graduation rates using the formula developed by the National Center
for Education Statistics (NCES). This formula was approved by the U.S. Department of Education for
calculating Adequate Yearly Progress (AYP) under NCLB. As Exhibit 19 illustrates, Oregon’s graduation
rate showed steady improvement from 1997-98 until 2002-03. Although improvement leveled off from
2002-03 until 2006-07, the graduation rate increased for the following two school years, reaching a new
high of 85% in 2008-09.
In 2008-09 the Oregon Department of Education started calculating a cohort graduation rate, also shown in
Exhibit 19. The cohort graduation rate tracks groups of students beginning in the 9th grade to provide a
more accurate picture of student outcomes after four years of high school. Students taking longer than four
years to graduate, as well as those receiving a modified diploma, a GED, an adult high school diploma, or
an alternative certificate are considered non-graduates in this 4-year cohort method. It is important to note
that the lower level of the cohort rate (66 percent compared to the NCES rate of 85 percent) reflects
primarily the change in the method of calculation, not a dramatic decline in the number of students
graduating from high school.
Exhibit 19: Oregon Graduation Rates
Conclusions
Oregon has made strides toward raising student achievement and closing the achievement gap.
However, it is undeniable that certain conditions limit Oregon’s ability to fully achieve the state’s
ambitious goal of assuring that all students graduate from high school. This goal will not be achieved
unless all schools and districts utilize education best practices; accountability structures and incentives
are in place to promote efficient resource use; and state, local, and federal funding—the resources
needed to sustain improvement—are adequate and stable.

www.ode.state.or.us Quality Education Commission Report 2012
43
The proportion of Oregon students who meet or exceed benchmark standards in math and reading
continues to increase despite a consistent downward trend in inflation-adjusted resources available to
school districts. Assessment results show that math performance in the 3rd
and 8th grades decreased for
the first time in many years in 2006-07, but rebounded the following year.2 The percentage of both 8
th
and 10th graders meeting the state standard rose in 2008-09. The percent of students meeting the state
reading standard for 5th, 8
th, and 10
th grade increased in 2008-09. Except for a minor decrease in the
most recent round of assessments, 3rd
grade reading performance has been gradually improving since
2003-04. In general, the elementary grades have exhibited greater and more consistent growth in the
proportion of students meeting state benchmarks. Improvement has been less consistent for middle and
high school students.
Predictions about the impact of fully funding the QEM suggest that the goal of getting all students to
graduate from high school is within reach. However, without increased funding levels and continued
improvement in educational practices, there is a great deal of uncertainty about whether or not this goal
will be achieved by the 2025 target date.
Predictions about future levels of student achievement are based on the assumption that additional
funding will be supplied for schools, and that educational practices that are aligned with the Quality
Indicators will be adopted by Oregon schools. Because neither increased funding nor best practices
alone can be expected to significantly boost student achievement, effecting positive change during a
time of economic uncertainty is a daunting task.
Applying best practices and investing resources in all grades, K-12, will promote student achievement
of Oregon’s high standards and new diploma requirements. However, as the analysis of resource
allocation in this report suggests, adding resources proportionally to all grade levels may not be the best
approach. Adding more resources in the grades where schools get the most bang-for-their-buck makes
more sense. As the analysis indicates, relatively more resources in the late elementary and middle
school grades, at least for math, has the potential to improve high school test scores and, by extension,
graduation rates.
Disparities in student achievement continue to exist for certain segments of the student population;
students of minority ethnic and cultural backgrounds, students with disabilities, those who have limited
English proficiency, and economically disadvantaged students continue to exhibit lower performance
on state assessments and lower graduation rates. As these segments of the student population continue
to grow, it is increasingly important to invest in the targeted resources and strategies suggested by the
Quality Education Model in an effort to close the achievement gap.
Quality Education Model Impact Analysis
and Student Performance Expectations
ithout dramatic increases in the productivity of educational inputs (primarily teachers), Oregon’s K-
12 school system will need additional resources if student performance is to continue improving. In
2 In 2006-07 most Oregon students were assessed using a paper and pencil test because the state’s computer-based
testing system was shut down. Because of the different testing method, the scores for 2006-07 are not comparable to
other years.
W

www.ode.state.or.us Quality Education Commission Report 2012
44
this section we estimate both the level of resources required to fully fund the Quality Education Model and
the impact this level of funding is expected to have on student achievement in the coming years.
Quality Education Model Estimates for the 2013-15 Biennium
Prior to the beginning of each legislative session, the Commission updates the Quality Education Model to
include the most recent data available. The Commission also reviews the assumptions in the model to
ensure that they are consistent with current research. Once the updates are complete, the Commission uses
the model to estimate the level of funding required to meet Oregon’s educational goals as established in
law.
As in past Commission reports, the Cost Panel reviewed the technical aspects of the Quality Education
Model this year. In general, the panel’s responsibility is to make recommendations for improving the QEM
as a tool to support policy decisions regarding school funding in Oregon. In order to do this, the panel
updated the model with the most recent data available and refined the cost estimates so they are as accurate
as possible. The data used in this report are from the 2010-11 and 2011-12 school years, including
expenditures by category, wages and salaries of school personnel, retirement system and health care costs,
and class size. The cost Panel also calibrated the model so that it is consistent with current spending in
Oregon schools and with the Current Service Level amount estimated by the School Revenue Forecast
Committee for the 2013-15 biennium. The Current Service Level scenario represents the starting point for
evaluating policy proposals with the model.
The most current data available for use in the model includes the school district and education service
district (ESD) audited financial information available through the Database Initiative Project (DBI),
enrollment and other student data from the Oregon Department of Education, and economic and price data
from the Office of Economic Analysis (Oregon Department of Administrative services).
Exhibit 20 provides estimates of the resources needed to fully fund the Quality Education Model in the
2013-15 biennium. To allow for comparison, it also shows the estimated level of funding required to
provide the same level of education services provided in 2011-13 (the Current Service Level). As the table
shows, the Fully Funded Quality Education Model for 2013-15 would require $2.43 billion above the
Current Service Level funding amount.
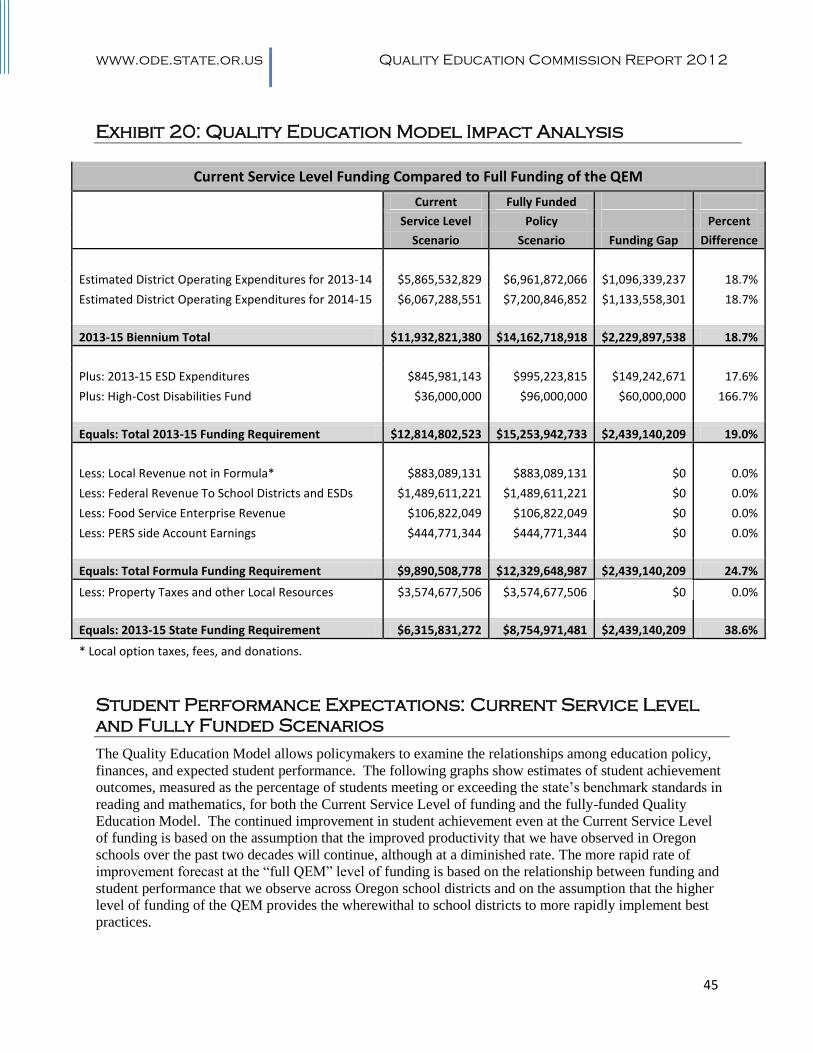
www.ode.state.or.us Quality Education Commission Report 2012
45
Exhibit 20: Quality Education Model Impact Analysis
Current Service Level Funding Compared to Full Funding of the QEM
Current Fully Funded
Service Level Policy Percent
Scenario Scenario Funding Gap Difference
Estimated District Operating Expenditures for 2013-14 $5,865,532,829 $6,961,872,066 $1,096,339,237 18.7%
Estimated District Operating Expenditures for 2014-15 $6,067,288,551 $7,200,846,852 $1,133,558,301 18.7%
2013-15 Biennium Total $11,932,821,380 $14,162,718,918 $2,229,897,538 18.7%
Plus: 2013-15 ESD Expenditures $845,981,143 $995,223,815 $149,242,671 17.6%
Plus: High-Cost Disabilities Fund $36,000,000 $96,000,000 $60,000,000 166.7%
Equals: Total 2013-15 Funding Requirement $12,814,802,523 $15,253,942,733 $2,439,140,209 19.0%
Less: Local Revenue not in Formula* $883,089,131 $883,089,131 $0 0.0%
Less: Federal Revenue To School Districts and ESDs $1,489,611,221 $1,489,611,221 $0 0.0%
Less: Food Service Enterprise Revenue $106,822,049 $106,822,049 $0 0.0%
Less: PERS side Account Earnings $444,771,344 $444,771,344 $0 0.0%
Equals: Total Formula Funding Requirement $9,890,508,778 $12,329,648,987 $2,439,140,209 24.7%
Less: Property Taxes and other Local Resources $3,574,677,506 $3,574,677,506 $0 0.0%
Equals: 2013-15 State Funding Requirement $6,315,831,272 $8,754,971,481 $2,439,140,209 38.6%
* Local option taxes, fees, and donations.
Student Performance Expectations: Current Service Level
and Fully Funded Scenarios
The Quality Education Model allows policymakers to examine the relationships among education policy,
finances, and expected student performance. The following graphs show estimates of student achievement
outcomes, measured as the percentage of students meeting or exceeding the state’s benchmark standards in
reading and mathematics, for both the Current Service Level of funding and the fully-funded Quality
Education Model. The continued improvement in student achievement even at the Current Service Level
of funding is based on the assumption that the improved productivity that we have observed in Oregon
schools over the past two decades will continue, although at a diminished rate. The more rapid rate of
improvement forecast at the “full QEM” level of funding is based on the relationship between funding and
student performance that we observe across Oregon school districts and on the assumption that the higher
level of funding of the QEM provides the wherewithal to school districts to more rapidly implement best
practices.

www.ode.state.or.us Quality Education Commission Report 2012
46
Exhibit 21: 3rd Grade Reading Achievement Forecast
Exhibit 22: 5th Grade Reading Achievement Forecast
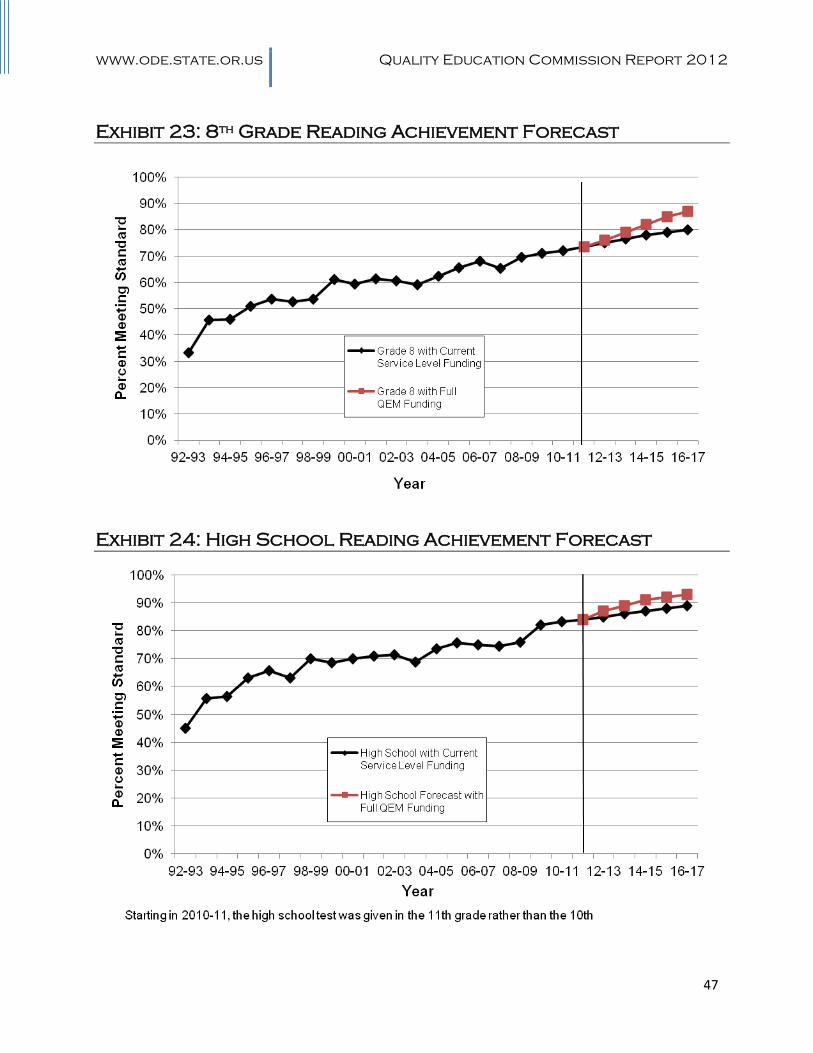
www.ode.state.or.us Quality Education Commission Report 2012
47
Exhibit 23: 8th Grade Reading Achievement Forecast
Exhibit 24: High School Reading Achievement Forecast
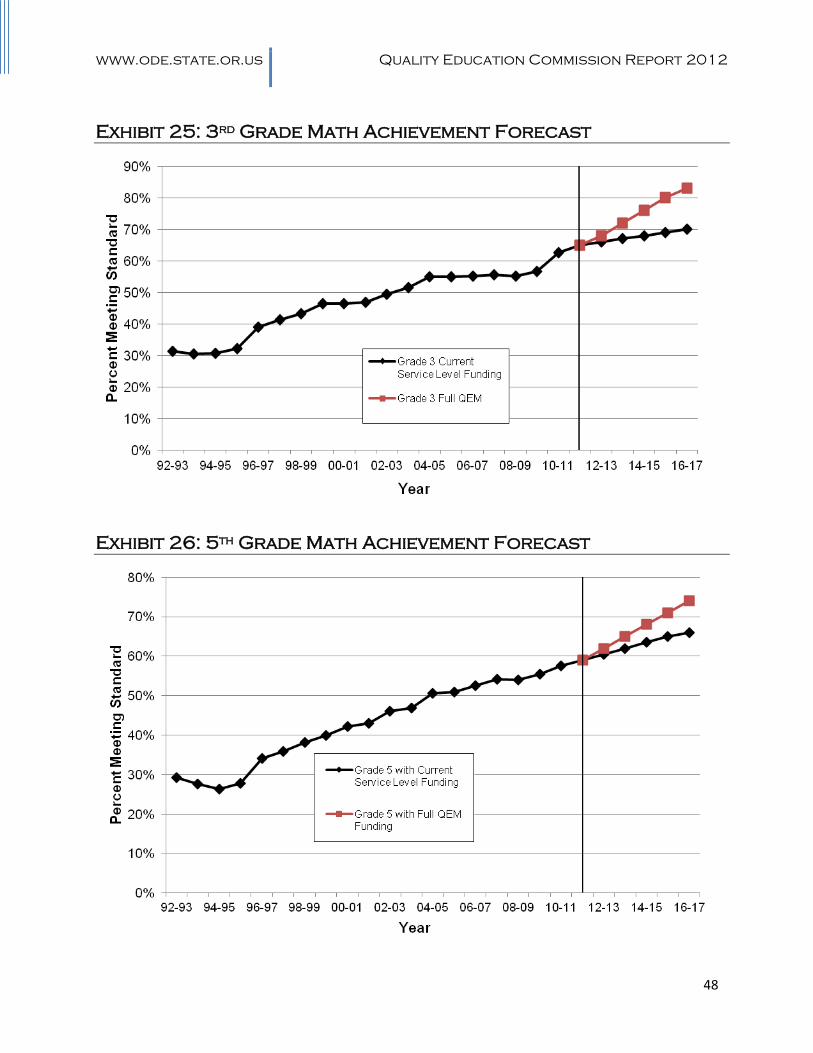
www.ode.state.or.us Quality Education Commission Report 2012
48
Exhibit 25: 3rd Grade Math Achievement Forecast
Exhibit 26: 5th Grade Math Achievement Forecast

www.ode.state.or.us Quality Education Commission Report 2012
49
Exhibit 27: 8th Grade Math Achievement Forecast
Exhibit 28: High school Math Achievement Forecast
www.ode.state.or.us Quality Education Commission Report 2012
50
Alternative Strategies for Implementing
the Quality Education Model
he Quality Education Model is Oregon’s primary tool for determining the resources required to meet
the state’s educational goals. The 2012 Quality Education Model estimates the level of resources that
will be needed to prepare all students to meet the state’s new graduation standards set out in the Oregon
Diploma and to put Oregon on the path to meet the 40-40-20 goal that is part of the governor’s current
education reforms.
Given that current funding falls considerably short of the level the Commission estimates is needed to meet
Oregon’s academic goals, the Commission’s focus has been on how to best use current resources.
Focusing on practices that will have the greatest positive impact on student achievement in the short-term
and developing a long-term strategy for increasing the funding levels for Oregon schools are necessary for
advancing education in Oregon.
Alternative 1: Invest in Strategies With the largest Impact
In any organization or system, improved results depend on using best practices, and using those with the
greatest impact first. One alternative to full implementation of the 2012 Quality Education Model is to
invest limited resources in strategies that have the most potential to help move Oregon students toward the
state’s achievement and graduation standards. This proposal suggests the implementation of practices
which are most likely to assist the greatest number of students in achieving the state’s educational goals and
provides suggestions for how to use school resources most efficiently and effectively. Identifying and
adopting practices that have the greatest impact on student achievement becomes increasingly important in
the type of funding environment that Oregon now finds itself: one where state revenue is expected to grow
relatively slowly for an extended period of time. In such an environment, a more efficient use of resources
is critical.
In 2010, the Commission proposed strategic goals for partial implementation of the Model that addressed
the entire K-12 system. The recommendations included improving school teacher effectiveness through
professional development, developing strong district frameworks for the articulation of academic content
across grades, better alignment of coursework to state assessments, and providing targeted interventions for
Oregon students most at-risk of not meeting academic standards.
Again this year, the Commission recognizes that helping Oregon students meet the state’s rigorous
academic standards and graduation requirements will require investing in strategies that impact students at
all points on the K-12 continuum. The Commission recommends that Oregon’s school districts continue
with their efforts to implement the 2010 recommendations. In addition, based on the work of the Best
Practices and Cost Panels in 2012, the Commission encourages school districts to pursue the following
strategies:
Invest in effective teacher collaboration time. Evaluation of practices of selected Oregon
schools by the Commission’s Best Practices Panel suggest that added teacher collaboration time is
effective in raising student achievement if school staff are supportive and engaged in the activity
and if it is implemented well. Staff-initiated collaboration appears to be the most effective, even if
it is done informally.
T

www.ode.state.or.us Quality Education Commission Report 2012
51
Promote the use of high-quality formative assessments to improve instruction. The Best
Practices Panel also found that the data generated by formative assessments can be useful in
improving instruction if teachers take the time to evaluate it with their colleagues and report what
they find regularly to students and parents.
Evaluate the allocation of resources within districts to get the most impact from district
resources. Analysis by the Commission’s Cost Panel suggests that more resources in the late
elementary and middle grades (4 through 8) can generate improvements in student achievement
that carry over through high school, particularly in mathematics.
Alternative 2: Ten-Year Phase-In of the Quality Education
Model
Another alternative to immediate introduction of all components of the Quality Education Model is to
gradually phase in its provisions and funding requirements over a longer period of time. Spreading these
changes out over ten years (five biennia) is particularly advantageous in the current economic climate in
Oregon, as it allows the Legislature time to develop funding strategies that can provide stable resources for
education. Additionally, a more gradual influx of additional funding and introduction of new requirements
and practices will give school districts the time they might need to make adjustments and to learn how to
most effectively and efficiently utilize new resources. Governor Kitzhaber has proposed that Oregon state
agencies develop 10-year budget plans as a way to promote a longer-term perspective on how to best
provide public services. For the education sector, the Quality Education Commission’s long-standing
recommendation for a 10-year phase-in of full QEM funding is consistent with the governor’s longer-term
budgeting strategy and is one example of how the mechanics of such a strategy might work.
Exhibit 29 illustrates how the funding gap could be closed gradually through a multi-biennium approach.
In this way, full QEM funding—taking into account cost increases over time—could be achieved by the
2021-23 biennium. This type of phase-in approach represents a realistic option for moving forward with
Oregon’s education goals and the ideals of the Quality Education Model without expecting drastic funding
changes to occur immediately. It provides targets for each biennium when revenues grow slowly and a
basis for discipline when revenues grow quickly.
Additionally, the phase-in approach provides opportunities for school districts to learn from successes and
failures as they integrate additional resources, best practices, and the new graduation standards. As such,
this alternative to full implementation of the QEM may actually help to foster efficient resource use at the
school and district levels.

www.ode.state.or.us Quality Education Commission Report 2012
52
Exhibit 29: Recommended 10-Year Phase-In of Full QEM Funding
SSF Required to Fully Phase-in QEM by 2021-23 Billions of Dollars
Current
Required Total State
Service Percent of Funding School Fund
Biennium Level (CSL) Gap to Close Above CSL Required
2013-15 $6.316 10% $0.579 $6.895
2015-17
15% $0.869 $7.764
2017-19
20% $1.159 $8.923
2019-21
25% $1.448 $10.371
2021-23
30% $1.738 $12.110
Recommendations
f current funding trends are allowed to continue, Oregon will not be able to meet its 40-40-20 education
goals. The Quality Education Commission’s primary recommendation is that the state adopt a 10-year
funding strategy that will phase-in the full QEM funding level by the 2021-23 biennium. The schedule of
State School Fund requirements shown in Exhibit 29 above is an example of such a phase-in strategy.
Based on the findings of the Best Practices and Cost Panels, the Commission also makes the following
recommendations:
Schools should invest in effective teacher collaboration time. The most effective collaboration
time is initiated and supported by teachers and involves setting specific goals for improving
student achievement.
Districts should promote the use of high-quality formative assessments to improve instruction.
Such assessments are most effective when teachers share the results with students and parents
frequently.
Districts should take a fresh look at how they allocate resources across schools, and across
grades within schools. To get the most from their resources, districts need to allocate resources
where they have the most positive impact on student achievement.
In addition, the Commission continues to make the following recommendations from prior Commission
reports:
Provide more time for new teacher induction and job-embedded professional development.
Provide adequate resources and staff so that schools can offer Algebra courses for high school
credit in the 7th or 8
th grade. Early introduction to Algebra concepts promotes higher achievement
in high school.
I
www.ode.state.or.us Quality Education Commission Report 2012
53
Include adequate classroom spaces, smaller class sizes, and early identification of struggling
students, and additional instruction time with licensed math teachers.
Allocate time and resources to districts to develop frameworks for the articulation of math
programs for 4th grade through high school.
Develop a strategic focus on practices that build a solid academic foundation in the early grades.
Align the timing of student course-taking with the timing of state assessments.
Invest in strategies and allocate additional resources where they will have the greatest impact on
student performance. Time and leadership are priority investment targets.
www.ode.state.or.us Quality Education Commission Report 2012
54
BIBLIOGRAPHY
Amabile, T., & Kramer, S. (2010). What really motivates workers: Understanding the power of progress.
Harvard Business Review.
Annenberg Institute for School Reform. (2005). Professional Learning Communities: Professional
development strategies that improve instruction. Providence, RI.
http://annenberginstitute.org/pdfProfLearning.pdf
Black, P., & William, D. (1998). Assessment and Classroom Learning: Assessment in Education.
Black, P., & William, D. (1998b). Inside the Black Box: Raising standards through Classroom
Assessment. Phi Delta Kappan. Accessed at www.pdkintl.org/kappan/kbla9810.htm
Brown-Chidsey, R. and Steege, M. Response to Intervention. Principles and Strategies for Effective
Practice. New York/London. The Guilford Press
Bryk, A., & Schneider, B. (2004). Trust in schools: A core resource for improvement. New York: Russell
Sage.
Carroll, T., Fulton, K., & Doerr, H. (2010). Team up for 21st century teaching and learning: What
Research and Practice reveal about professional learning. Washington, DC: National
Commission on Teaching and America’s Future.
City, E.A., Elmore, R.F.,Fiarman, S.E., & Teitel, L. (2009). Instructional rounds in education: A network
approach to improving teaching and learning. Cambridge, MA: Harvard University Press
Common Core State Standards Initiative. (2010): Common core state standards for English language
arts & literacy in history/social studies, science, and technical subjects. Washington, DC:
National Governors Association Center for Best Practices and the Council of Chief State
School Officers.
Conley, D. (2005). College Knowledge: What it really takes for students to succeed and what we can do
to get them ready. San Francisco, CA: Jossey-Bass.
Darling-Hammond, L., Wei, R.C., Richardson, N., Andree, A., & Orphanos, S. (2009). Professional
learning in the learning profession: A status report on the teacher development in the U.S, and
abroad. Washington DC: National Staff Development Council.
Darling-Hammond, L. (2010). The flat world and education; How America’s commitment to equity
will determine our future. New York: Teachers College Press.
Dobbie, W. and Fryer, R. Jr. (2011). Getting Beneath the Veil of Effective Schools: Evidence from New
York City. Cambridge, MA. The Harvard University Press.
Dufour, R. and Marzano, R. (2011). Leaders of Learning. How District, School, and Classroom Leaders
Improve Student Achievement. Bloomington, IN: Solution Tree Press.

www.ode.state.or.us Quality Education Commission Report 2012
55
Elmore, R. (2003). School reform from the inside out: Policy, practice, and performance. Boston:
Harvard Education Press.
Fullan, M. (2008). The six secrets of change: What the best organizations do to help their
organizations survive and thrive. San Francisco: Jossey-Bass.
Fullan, M. (2010). Motion Leadership: The skinny on Becoming Change Savvy. Thousand Oaks CA:
Corwin Press.
Hargreaves, A., and Fullan, M., Professional Capital: Transforming Teaching in Every School.
Columbia University, NY and London: Teachers College Press.
Institute of Education Sciences, & National Center for Education Research. (2007). Organizing
instruction and study to improve student learning. Washington, DC: Author.
Khan Academy Talks Analytics, OER, and iPads. THE Journal: Transforming Education Through
Technology. Accessed at:
http://thejournal.com/Articles/2012/04/05/Khan-Academy-Talks-Analytics-OER-and-iPads.aspx?Page=2
Knight, J., Instructional Coaching: A Partnership Approach to Improving Instruction. (2007).
Thousand Oaks, CA. Corwin Press and the Association for Supervision and Curriculum
Development.
Marzano, R., Norford, Paynter, D., Pickering, D. and Gaddy, B., (2001). A Handbook for Classroom
Instruction that Works. Alexandria, VA: Association for Supervision and Curriculum
Development.
Marzano, R.J. (2006). Classroom assessments and grading that work. Alexandria, VA: Association for
Supervision and Curriculum Development.
Noguera, P. (2008). The trouble with black boys…and other reflections on race, equity, and the future of
public education. San Francisco, CA: Jossey-Bass.
Odden, A. R., & Archibald, S.J. (2009). Doubling student performance…and finding the resources to do
it. Thousand Oaks CA: Corwin Press.
Oregon Quality Education Commission. (2010). Oregon Quality Education Model 2010 Report.
Sahlberg, P. (2011). Finnish Lessons. What can the world learn from educational change in Finland?
New York. Teachers College Press.
Schmoker, M. (2006). Results now: How we can achieve unprecedented improvement in teaching and
learning. Alexandria, VA: Association for Supervision and Curriculum Development.
Schmoker, M. (2011). Focus. Elevating the Essentials To Radically Improve Student Learning.
Alexandria, VA: Association for Supervision and Curriculum Development
www.ode.state.or.us Quality Education Commission Report 2012
56
Smith, L. (2008). Schools that change: Evidence based improvement and change leadership. Thousand
Oaks, CA: Corwin Press.
State Educational Technology Directors Association. (2012). SETDA (ARRA) Case Studies 2012.
Accessed at: http://www.setda.org/web/guest/casestudies2012
Stiggins, R. (1994). Student Centered Classroom Assessment. New York: Merrill.
William, D. (2007). Content then process: Teacher Learning Communities in the service of formative
assessment. In D. Reeves (Ed.), Ahead of the curve: The power of assessment to transform
teaching and learning. Bloomington, IN: Solution Tree.
Yoon, K.S., Duncan, T., Lee, S.W.-Y., Scarloss, B. & Shapley, K. (2007). Reviewing the evidence on how
teacher professional development affects student achievement. (Issues & Answers Report, REL
2007-No. 033). http://ies.ed.gov/ncee/edlabs/regions/southwest/pdf/REL_2007033.pdf
www.ode.state.or.us Quality Education Commission Report 2012
57
Appendix
BEST PRACTICES PANEL
ON-LINE SURVEY ROUND I AND ROUND II REPORT TO THE COMMISSION
RESULTS AND FINDINGS:
Questions one and two of the survey asked teachers to identify their school and teaching responsibility. The
results and findings from questions three through seven follow and include data from all three groups of
teachers administered the surveys: 1) teachers from schools performing higher than predicted; 2) teachers
from schools performing lower than predicted; and 3) ALL active classroom teachers in the State. The
comparisons made among responses from all three groups of teachers enabled the QEC to identify the
specific survey questions about formative assessment and professional collaboration that appear to have the
most impact on high performing school teachers’ capacity to effect positive academic change for their
students.
Caveat: Although the following findings are consistent with the Panel’s current educational best practices
research, it should be noted that limitations of the survey process included a low matched pair response
rate and a reliance on teacher self-reported data. A deeper and more rigorous investigation is
recommended to determine the validity of the results presented in this document.

www.ode.state.or.us Quality Education Commission Report 2012
58
Survey Question #3:
3. Finding: 65.4% of statewide respondents reported they collaborate with others on curriculum
choices. Teachers from schools performing lower than predicted report they collaborate on
curriculum more often than schools performing higher than predicted:

www.ode.state.or.us Quality Education Commission Report 2012
59
Question #4:
4.a Finding: 59.6% of statewide respondents reported they analyze classroom assessments with
colleagues, with 30 minutes per week being the most frequently reported amount of time spent in this
activity. Schools performing lower than predicted reported they collaborate slightly more than schools
performing higher than predicted:
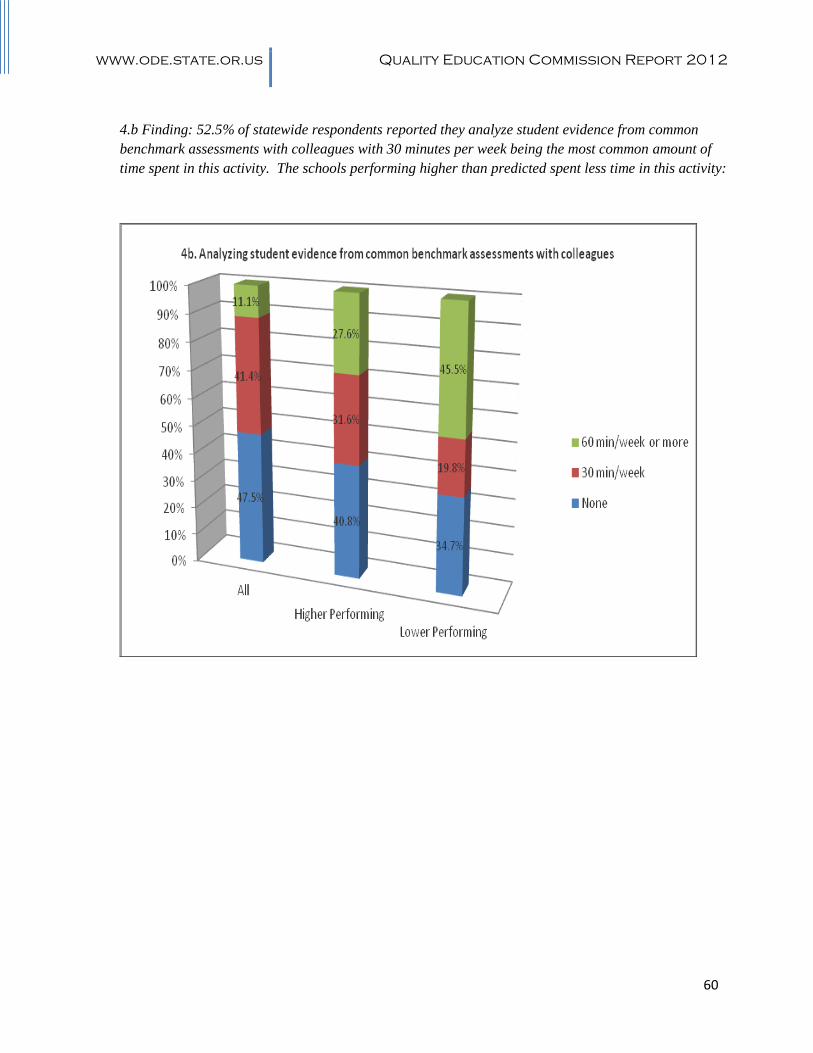
www.ode.state.or.us Quality Education Commission Report 2012
60
4.b Finding: 52.5% of statewide respondents reported they analyze student evidence from common
benchmark assessments with colleagues with 30 minutes per week being the most common amount of
time spent in this activity. The schools performing higher than predicted spent less time in this activity:
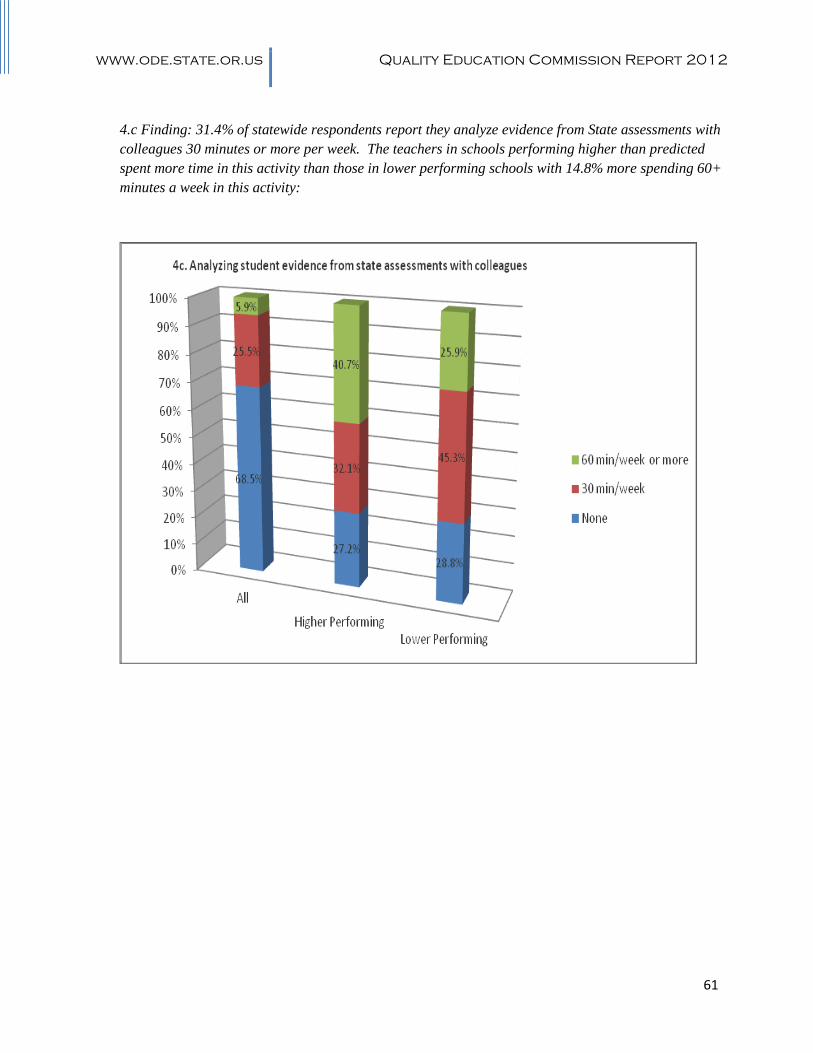
www.ode.state.or.us Quality Education Commission Report 2012
61
4.c Finding: 31.4% of statewide respondents report they analyze evidence from State assessments with
colleagues 30 minutes or more per week. The teachers in schools performing higher than predicted
spent more time in this activity than those in lower performing schools with 14.8% more spending 60+
minutes a week in this activity:

www.ode.state.or.us Quality Education Commission Report 2012
62
4.d Finding: 68.3% of statewide respondents report they identify and implement changes in
instructional practice with colleagues. Teachers in schools performing higher than predicted reported
spending less time in this activity than teachers in lower performing schools:
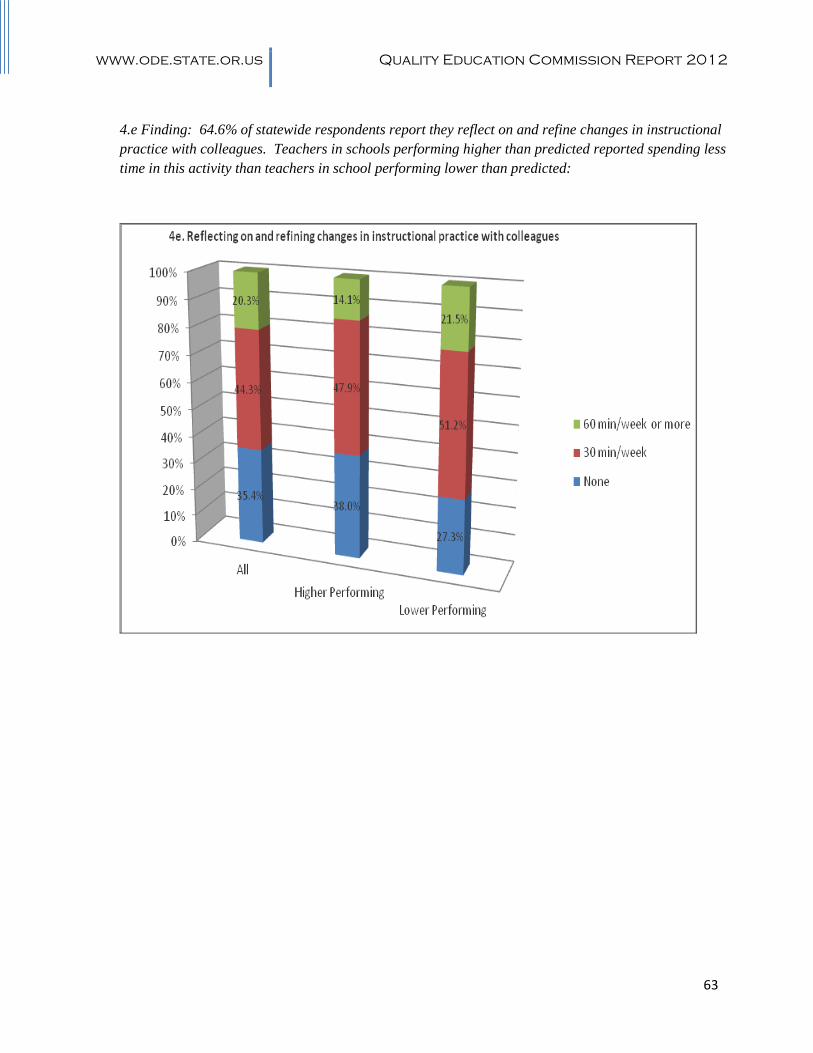
www.ode.state.or.us Quality Education Commission Report 2012
63
4.e Finding: 64.6% of statewide respondents report they reflect on and refine changes in instructional
practice with colleagues. Teachers in schools performing higher than predicted reported spending less
time in this activity than teachers in school performing lower than predicted:

www.ode.state.or.us Quality Education Commission Report 2012
64
Question #5:
5.a Finding: 30% of respondents statewide report they have a late start or early release schedule for
teacher collaboration. The schools performing higher than predicted were less likely to have a late
start or early release for collaboration than lower performing schools (note: Interviews revealed that
one higher performing HS and an ES have a late start but neither reported this in the survey and it is
not reflected in graph 5.a)
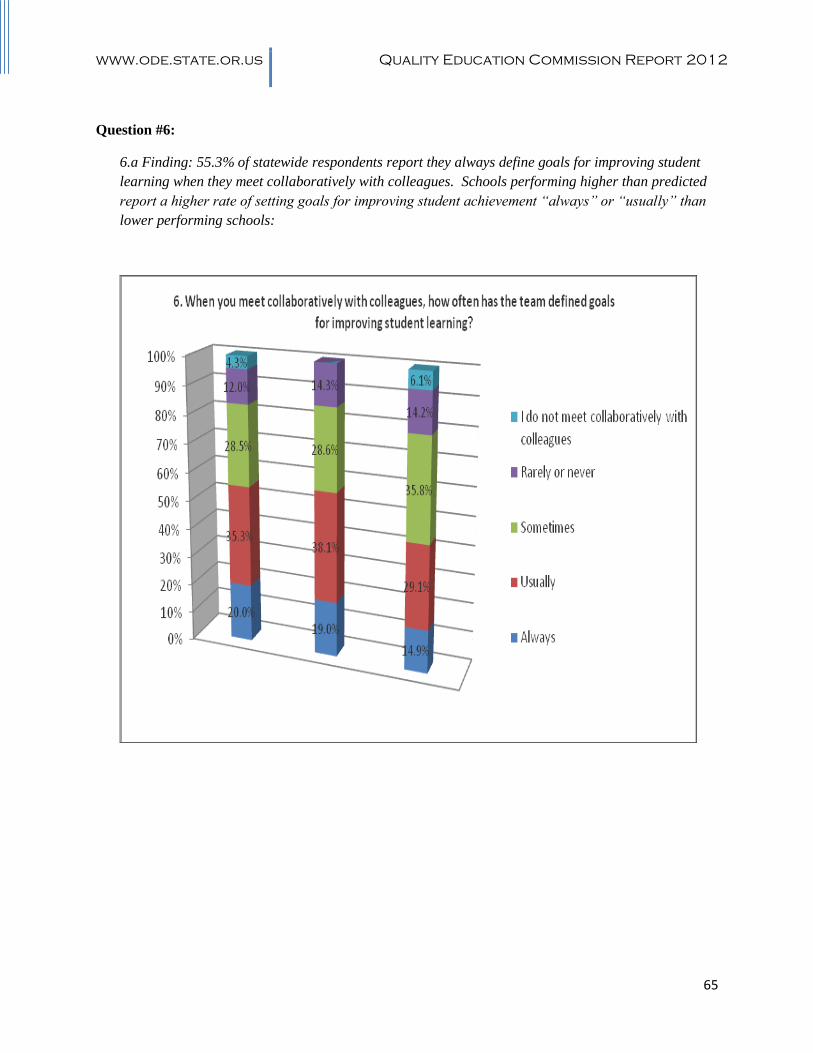
www.ode.state.or.us Quality Education Commission Report 2012
65
Question #6:
6.a Finding: 55.3% of statewide respondents report they always define goals for improving student
learning when they meet collaboratively with colleagues. Schools performing higher than predicted
report a higher rate of setting goals for improving student achievement “always” or “usually” than
lower performing schools:

www.ode.state.or.us Quality Education Commission Report 2012
66
Question #7:
7.a Finding: 97.5% of statewide respondents report they share learning objectives with students in
student-friendly language at least monthly. Schools performing higher than predicted have a higher
percentage of teachers reporting that they engage in this activity at least weekly than teachers from
lower performing schools:

www.ode.state.or.us Quality Education Commission Report 2012
67
7.b Finding: 95.4%% of Statewide respondents report they use formative assessment techniques at
least monthly. Schools performing higher than predicted have a slightly higher percentage of teachers
reporting that they engage in this activity “daily” or “at least weekly” than teachers from lower
performing schools:
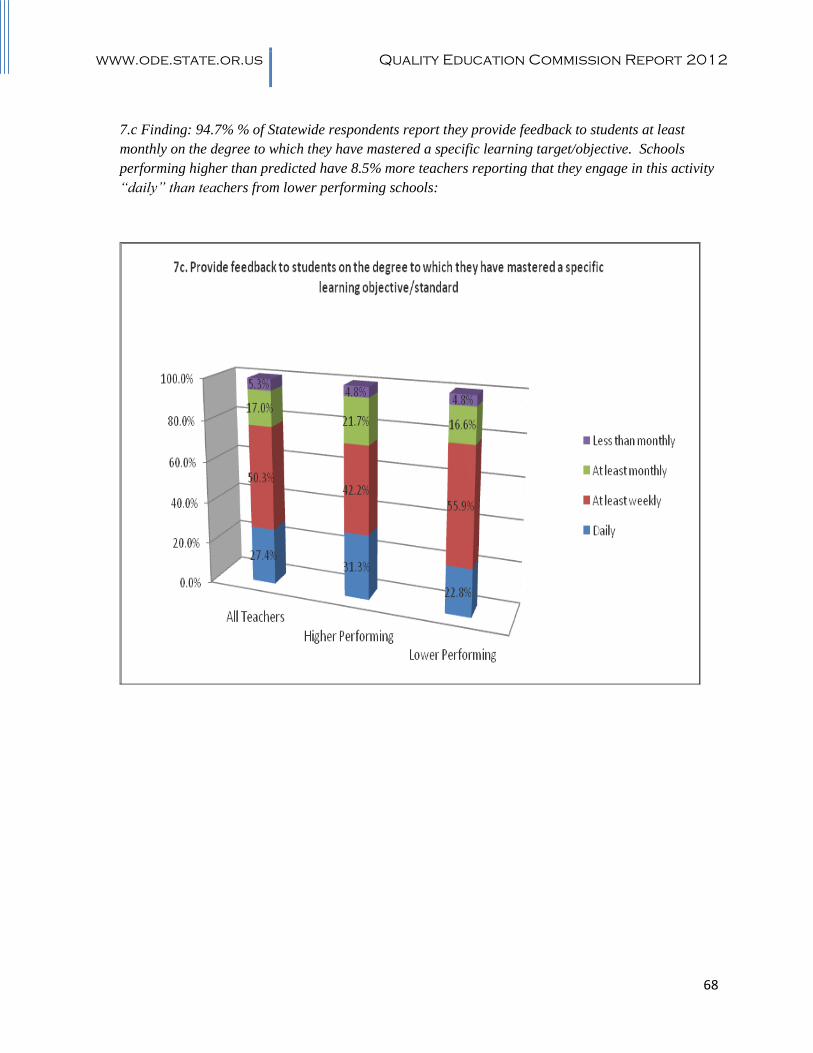
www.ode.state.or.us Quality Education Commission Report 2012
68
7.c Finding: 94.7% % of Statewide respondents report they provide feedback to students at least
monthly on the degree to which they have mastered a specific learning target/objective. Schools
performing higher than predicted have 8.5% more teachers reporting that they engage in this activity
“daily” than teachers from lower performing schools:
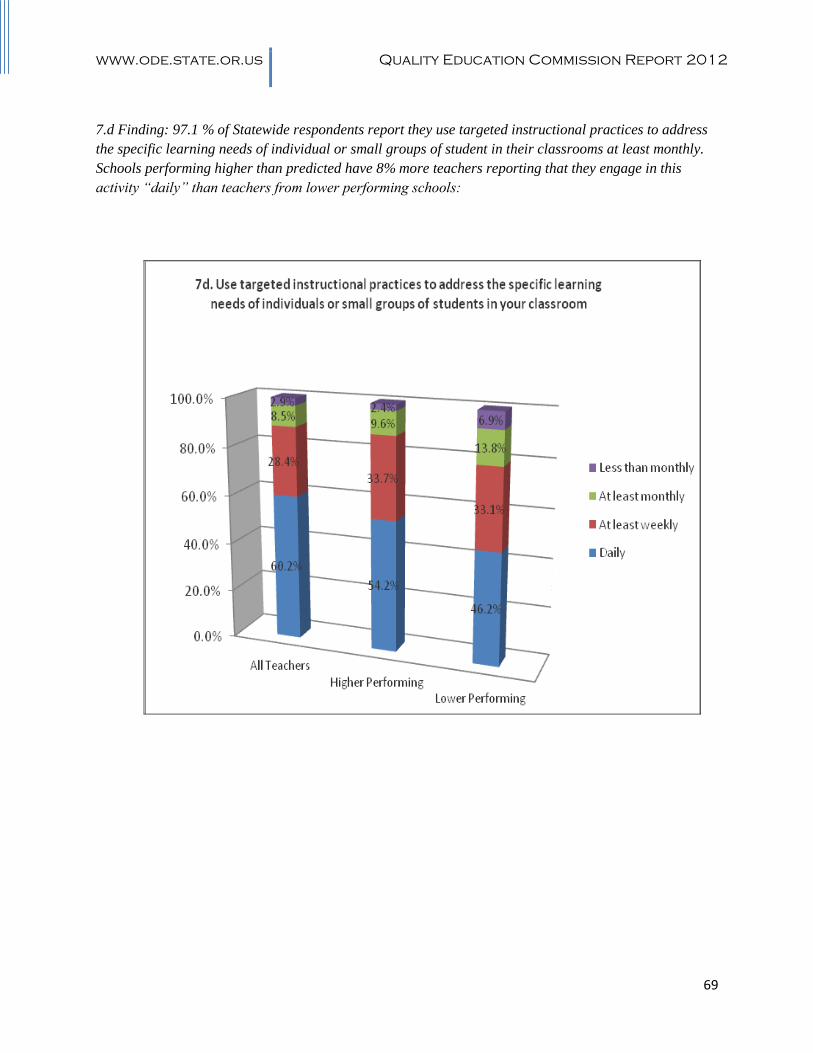
www.ode.state.or.us Quality Education Commission Report 2012
69
7.d Finding: 97.1 % of Statewide respondents report they use targeted instructional practices to address
the specific learning needs of individual or small groups of student in their classrooms at least monthly.
Schools performing higher than predicted have 8% more teachers reporting that they engage in this
activity “daily” than teachers from lower performing schools:
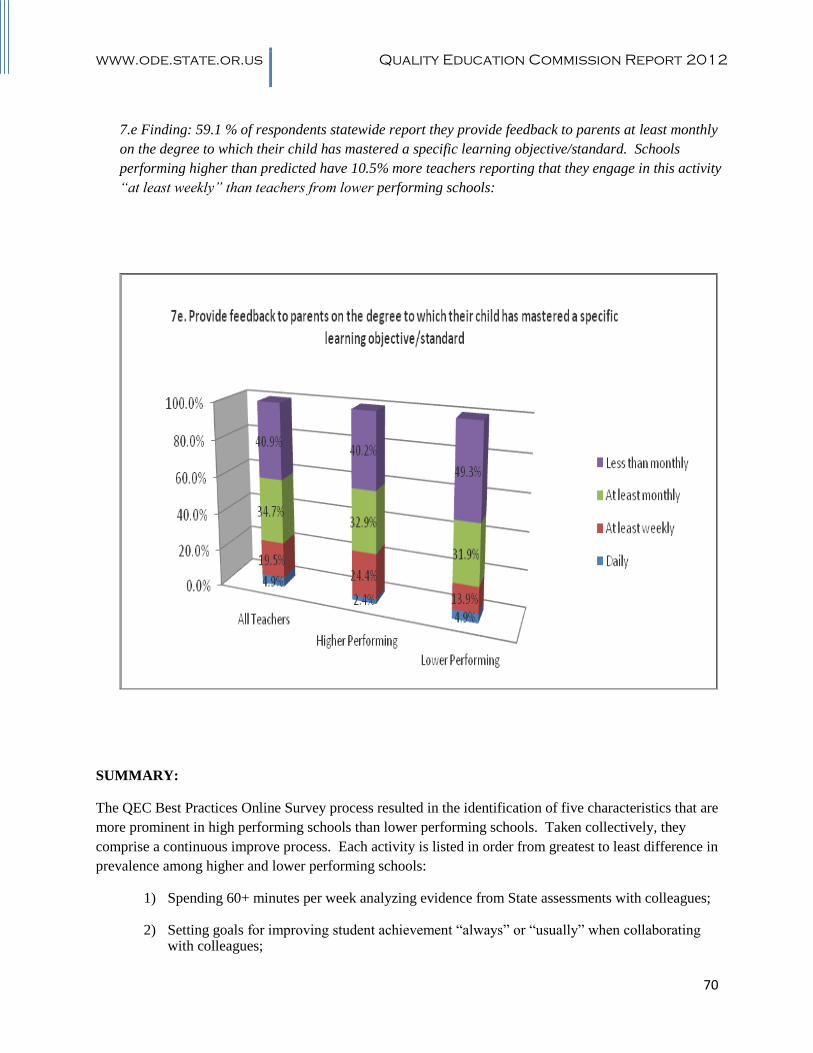
www.ode.state.or.us Quality Education Commission Report 2012
70
7.e Finding: 59.1 % of respondents statewide report they provide feedback to parents at least monthly
on the degree to which their child has mastered a specific learning objective/standard. Schools
performing higher than predicted have 10.5% more teachers reporting that they engage in this activity
“at least weekly” than teachers from lower performing schools:
SUMMARY:
The QEC Best Practices Online Survey process resulted in the identification of five characteristics that are
more prominent in high performing schools than lower performing schools. Taken collectively, they
comprise a continuous improve process. Each activity is listed in order from greatest to least difference in
prevalence among higher and lower performing schools:
1) Spending 60+ minutes per week analyzing evidence from State assessments with colleagues;
2) Setting goals for improving student achievement “always” or “usually” when collaborating with colleagues;

www.ode.state.or.us Quality Education Commission Report 2012
71
3) Providing feedback to parents on the degree to which their child has mastered a specific learning objective/standard “at least weekly;”
4) Providing feedback to students “daily” or “at least weekly” on the degree to which they have mastered a specific learning target/objective; and
5) Using targeted instructional practices to address the specific learning needs of individual or small groups of student in their classrooms “daily” or “at least weekly.”
Survey results also raise questions about the time teachers spend (and don’t spend) throughout the State
engaging in all five of the activities found to be more prevalent in higher performing schools. Further
investigation of teacher practices, including the supports and impediments to implementation of these five
practices (along with associated costs), could provide further insights.