quality of organ tones - brigham young university
TRANSCRIPT
THE JOURNAL OF THE ACOUSTICAL SOCIETY OF AMERICA VOLUME 35, NUMBER 3 MARCH 1963
Quality of Organ Tones
HARVEY FLETCHER, E. DONNELL BLACKHAM, AND DOUGLAS A. CHRISTENSEN
Brigham Young Univ•sity, Provo, Utah (Received 26 November 1962)
The tones were produced by the pipe organ in the Smith Auditorium at Brigham Young University. They were picked up by a microphone placed at various positions in the auditorium and recorded on magnetic tape. The tape was taken into the laboratory where analyses of the tones were made. The structure of full organ tones becomes very complicated. For example, when the three keys for the major chord were de- pressed, there were 229 partials whose frequency and level were measured.
After the analysis of the tone was made, a synthetic tone was constructed by our synthesizer. Judgment tests were made by juries to see if synthetic tones could be distinguished from real tones. These juries were unable to distinguish between them. The paper discusses musical warmth. It shows that it is definitely related to the level variation of the partials. These variations are due to the frequencies of several partials being close together, causing beats.
Methods and apparatus were developed so that a tone could be warmed to any extent without using the large number partials produced in the pipe organ. A method of rating the warmth of organ tones is proposed and will be used in our future work on all musical tones.
HIS paper reports that part of our general research study of the quality of musical tones which is
concerned with organ tones. The general procedure used in this study is the same as used in our study of piano tones, and which was described in the paper • on piano tones. Briefly stated it is as follows. The organ tone is recorded on tape. The tape is then used for analyzing the tone. Next, a synthetic tone is produced from this analysis and then compared to the real tone by judg- ment tests. This is followed by a search for new synthetic tones that are considered interesting and useful by a jury of musicians. The synthesizer, frequency shifter, and other apparatus are the same as used in our studf of piano tones.
The real organ tones were obtained from the organ that was formerly in the Salt Lake Tabernacle and now installed in the Smith Auditorium at Brigham Young University. The auditorium is considered very good for musical performances. The reverberation times (T) are given below for tones of the frequencies shown.
f=50 100 200 500 1000 2000 3000 4000 cps; T--1.6 1.4 1.4 1.4 1.4 1.7 1.3 1.5 sec.
• H. Fletcher, E. D. Blackham, and R. Stratton, J. Acoust. Soc. Am. 34, 749-761 (1962).
Some of the organ tones were sustained for 40 or 50 sec and recorded on our tape recorder. Others had duration times about the same as those used in playing the instrument. The reel of tape was then transferred to the tape recorder controlled by a "frequency- shifter." The use of tones of long duration made it easier to obtain an accurate analysis of the partial structure of the tone.
ANALYSIS OF ORGAN TONES FROM SINGLE PIPES
Analyses were made of the following organ tones produced by single pipes: namely, G'", G", G', G, Gt, and G2, the G"' being the third bass G below middle C, and G2 being the third treble G above middle C. These tones were produced by use of typical stops from the four families of organ tone:
Flutes --Gedeckt 8'
Strings --Gamba 8' Diapasons--First Diapason 8' Reeds --Fagotto 8'.
From this analysis a synthetic tone was created by the synthesizer. The analysis was considered satisfactory only when a comparison between the synthesized and
314
Redistribution subject to ASA license or copyright; see http://acousticalsociety.org/content/terms. Download to IP: 128.187.97.22 On: Fri, 14 Mar 2014
23:18:57

QUALITY OF ORGAN TONES 315
real tones showed that the two sounded alike. The
attack and decay characteristics were duplicated approximately by turning the dials to the corresponding proper position on the attack and decay amplifiers. In order to match the decay characteristics more exactly the synthetic tone was produced in one of the laboratory rooms having about the same reverberation character- istics as the auditorium and the sound then picked up by a microphone and recorded on magnetic tape.
The measurement of the partial structure of the organ tones revealed that the partials were harmonics within the observational error of our measurements, which was about 1 cycle in 1000. To illustrate this, the measure- ments of the frequencies of the first fourteen partials of the diapason tone G" and the reed tone G" are given in Table I.
The data for the 24 analyzed organ tones from single pipes are shown in the charts of Fig. 1.
The points represent the sound-pressure levels (SPL's) of the partials of the four kinds of organ pipes. These levels correspond to that produced in the auditorium at about one-third of the distance from the
organ to the back of the hall. The wide-band wind-noise level at this location, which was produced when the organ was turned on, was found to be approximately 50 dB=t=3 dB. For example, the SPL of the fundamental of the G"' diapason pipe was found to be at 76 dB, which was 26 dB above the wind noise. The wind-noise level
in «-octave bands was measured, and from this the levels in the critical bands were calculated. The results
are given by the solid curves in the charts. As is well known, this curve is also the threshold of hearing for pure tones in the presence of this wind noise. It is seen that the 12th, 13th, and 14th partials of the string tone G" are below the threshold of hearing, and consequently could not be heard. But they could be measured because the bandwidths in our analyzer were much narrower than the critical bandwidth.
In many cases the levels of the organ tones from single pipes are not much above the wind noise. When
only a single pipe was speaking, the noise was very prominent. However, when the full organ was playing, the sound-pressure intensity level was 85 to 90 dB, so the wind noise was not noticeable.
SYNTHESIS AND IDENTIFICATION TESTS OF TONES FROM SINGLE PIPES
The harmonic structures shown in Fig. 1 were used to produce synthetic tones. In the first trial a constant decay rate was used for all the partials. A comparison of such synthetic tones to real organ tones showed that the real tones could be identified without too much
difficulty due principally to the very different decay characteristics.
In the second trial the synthetic tones were produced in a room having similar reverberation characteristics to those in the auditorium. Also wind noise was intro-
duced into this room, which had the same relative level to the tone as that in the auditorium. The tone and
noise were then picked up by a nficrophone and recorded. In both trials wind noise at the proper level was introduced into the recording.
Using the second technique, a program consisting of real and synthetic tones was made for identification tests. The program in Table II illustrates the order in which these tones were presented for judgment tests of reed tones. The (S) indicates synthetic tones and the (R) indicates real tones.
T,•gLE II. Program of tests on single-pit)e organ tones.
Tone 1 G" (S) Tone 13 G'" (S) Tone 25 G' (R) Tone 2 G•(S) Tone 14 G(S) Tone 26 G(S) Tone 3 Go.(S) Tone 15 G"(S) Tone 27 G2(S) Tone 4 G'"(S) Tone 16 G'(S) Tone 28 G(R) Tone 5 Go.(R) Tone 17 G"(R) Tone 29 G"(R) Tone 6 G(S) Tone 18 G.o(S) Tone 30 G2(R) Tone 7 G'(S) Tone 19 G•(R) Tone 31 G• (S) Tone 8 G"' (R) Tone 20 G• (S) Tone 32 G'" (R) Tone 9 G"(R) Tone 21 G(R) Tone 33 G•(R) Tone 10 G(R) Tone 22 G'(R) Tone 34 G'" (S) Tone 11 G'(R) Tone 23 G"'(R) Tone 35 G"(S) Tone 12 G•(R) Tone 24 G2(R) Tone 36 G'(S)
T^gzE I. Frequencies in cps of the partials of a single-pipe reed tone and diapason tone.
No. of partial Frequency (reed) Frequency (diapason)
1 98 99 2 196 198 3 294 297 4 392 •96 5 490 496 6 587 594 7 686 694 8 784 791 9 882 891
10 979 989 11 1079 1089 12 1176 1188 13 1274 --- 14 1372 -.-
A similar program was set up for the string tones. A jury of nine persons having had musical training
from 2 to 15 years listened to these tones and marked on a data sheet which they thought were the real tones. The results of these judgment tests are presented in Table III.
There were 36 tones in the test. When the number
judged to be correct is near 18 or less, the observer is simply guessing. It will be seen that none of the observers could recognize the difference between the real and the synthetic tones. It is therefore concluded that synthetic tones can be made to sound like real tones from single pipes.
The synthetic tones have one great advantage; namely, the wind noise may be eliminated.
Redistribution subject to ASA license or copyright; see http://acousticalsociety.org/content/terms. Download to IP: 128.187.97.22 On: Fri, 14 Mar 2014
23:18:57

316 FLETCHER, BLACKHAM, AND CHRISTENSEN
o o o o o o o L • •) • •:• V3 • •1
0 0 0 0 0 0 0
c] [2
D x
II
-
ø/ "1 I-
oJ
o o o o o o o
•ff - •IZA2•I ZL•!g•qg• (•kTfiOS
Q•
I I I I I "" I
0 0 0 0 0 0 0
_ O
Redistribution subject to ASA license or copyright; see http://acousticalsociety.org/content/terms. Download to IP: 128.187.97.22 On: Fri, 14 Mar 2014
23:18:57

QUALITY OF ORGAN '[ONES 317
EFFECT ON HARMONIC STRUCTURE OF LISTENING AT DIFFERENT POSITIONS IN THE
AUDITORIUM
As is well known, the harmonic structure of a sustained organ tone is different in different parts of the auditorium due to the standing wave pattern. To show the extent of this effect the harmonic structure of
G"' (reed) tone from a single pipe was taken at three different positions in the hall, which were about ten feet apart. The data presented in Fig. 2 give the results. The three points on each partial ordinate give the three values of the sound-pressure level at three positions. It will be seen that the levels of the harmonics vary 10 or 15 dB, depending upon the position in the auditorium. It is obvious then that a recording of the tone at each of these three positions should result in three tones of different quality. Judgment tests with such recordings confirmed that these differences in quality were greater than any difference between the synthetic and real tones discussed above.
TA•nE III. Number correct out of 36 tries in judgment tests on single-pipe organ tones.
Strings Reeds
15 22 17 16 18 12 15 14 27 13 17 17 18 18
19 16
Average 18.6 16.3
CHARACTERISTIC PARTIAL STRUCTURES OF REED, STRING, DIAPASON, AND FLUTE ORGAN TONES
Boner 2 and others have made measurements of the
harmonic structures of such tones. Even when the
blowing is under laboratory control and free from wind noise, the differences between the tones from these four classes of organ tone are not too clearly defined, as will be seen from examining his curves. The analysis shown by the curves in Fig. 1 is subject to the variations found in the auditorium, as shown in Fig. 2. However, one can deduce the following general characteristics.
Reed tones. In the lower three octaves, the first nine partials have approximately the same SPL. From the ninth to the twentieth, the level decreases at about 4 or 5 dB per partial. For G, G•, and G2, the first three or four partials have equal levels, then they decrease in level per harmonic approximately 6 or 8 dB per octave.
String tones. In these tones the levels are about 5 or 10 dB lower than the reed tones. For the lower three
octaves only the first four or five partials have the same
o C. P. Boner, J. Acoust. Soc. Am. 10, 32-40 (1938).
60--
30--
20-
iO-
ORGAN TONE G'' (REED) ß 1 2
ß o
ß
o ß • ........ ß ß WiI]d Noise
o
Threshold
I I I I I I I I I I I i I I i l I I I I 2 3 4 5 6 7 8 9 10 11 12 13 14 15 16 17 13
HARMO• IC Nbq•iBER
Fro. 2. Reed-organ tones at three positions in auditorium.
level and then decrease in level per partial about the same as the reeds.
Diapason tones. These tones produce the highest levels, being from 5 to 10 dB above the reed tones. Only two or three of the first partials have the same level, and then the level of the harmonics decreases at the same rate as the reed tones.
Flute tones. These tones are in a class by themselves. The even partials are extremely low in level. The third and fifth partial tones are near the threshold of hearing in the noise. The flute tones are characterized by being almost pure tones.
COMBINATION AND FULL ORGAN TONES
A pipe organ of modest proportions is sufficient to offer to the performer a large variety of tone color by the addition of stops in different combinations. Each stop has its characteristic tone color, and for the most part consists of a separate pipe for each key encompas- sed in the range of the keyboard. In other words, when the first diapason 8' stop is activated and a G key played, there is a corresponding G pipe which sounds. By adding stops it is possible to have one or many pipes sounding for each key played.
A part of this study is the investigation of the effect upon the partials of a tone by the addition of stops which introduce new pipes into the ensemble. Twelve stops were selected from all the stops found on the organ in the Smith Auditorium. These stops were selected because each produced an audible effect when added consecutively to the rest. The stop list is as follows'
No. 1 First Diapason 8' No. 2 Second Diapason 8' No. 3 Gedeckt 8'
No. 4 Principal 4' No. 5 Octave 4'
No. 6 Twelfth 2õ
No. 7 Horn Diapason 8' No. 8 Fifteenth 2'
No. 9 Fagotto 8 • No. 10 Trompette 8' No. 11 Clarion 4' No. 12 III Mixture.
Redistribution subject to ASA license or copyright; see http://acousticalsociety.org/content/terms. Download to IP: 128.187.97.22 On: Fri, 14 Mar 2014
23:18:57
318 FLETCHER, BLACKHAM, AND CHRISTENSEN
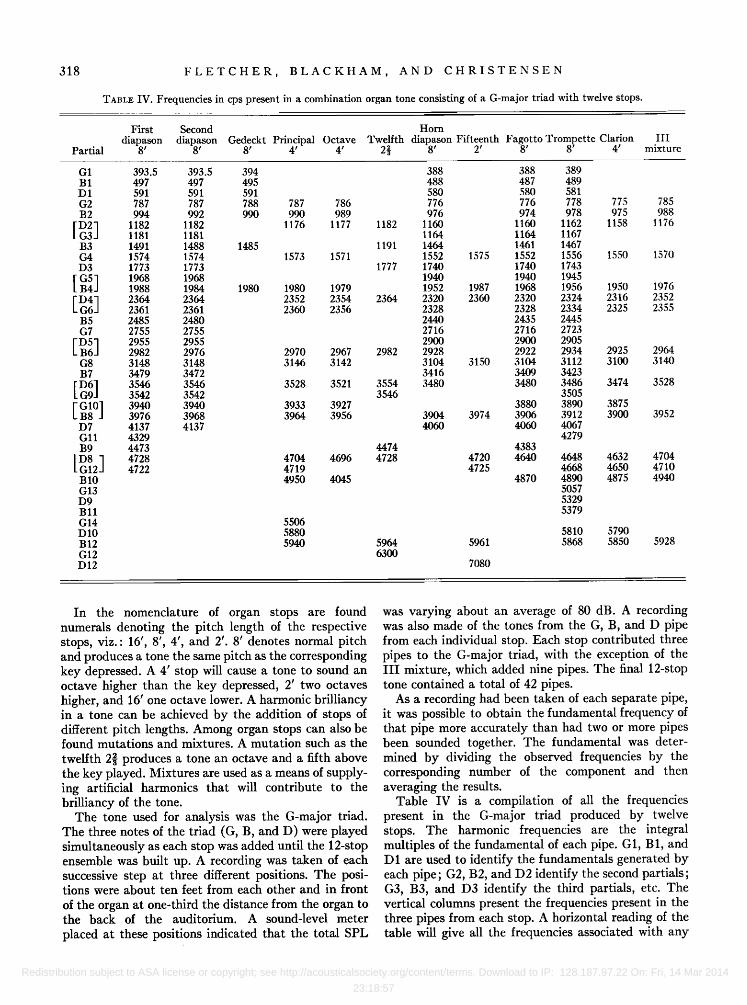
TABLE IV. Frequencies in cps present in a combination organ tone consisting of a G-major triad with twelve stops.
Partial
First
diapason 8'
Second Horn diapason Gedeckt Principal Octave Twelfth diapason Fifteenth Fagotto Trompette Clarion
8' 8' 4' 4' 2• 8' 2' 8' 8' 4' III
mixture
G1 B1 D1 G2 B2
B3 G4 D3
D4
B5 G7 D5
G8 B7 D6 [O•]
[•101 B8 J D7 Gll B9
I u8 -G12• B10 G13 D9 Bll G14 D10 B12 G12 D12
393.5 497 591 787 994
1182 1181 1491 1574 1773 1968 1988 2364 2361 2485 2755 2955 2982 3148 3479 3546 3542 3940 3976 4137 4329 4473 4728 4722
393.5 394 388 388 389 497 495 488 487 489 591 591 580 580 581 787 788 787 786 776 776 778 775 992 990 990 989 976 974 978 975
1182 1176 1177 1182 1160 1160 1162 1158 1181 1164 1164 1167 1488 1485 1191 1464 1461 1467 1574 1573 1571 1552 1575 1552 1556 1550 1773 1777 1740 1740 1743 1968 1940 1940 1945 1984 1980 1980 1979 1952 1987 1968 1956 1950 2364 2352 2354 2364 2320 2360 2320 2324 2316 2361 2360 2356 2328 2328 2334 2325 2480 2440 2435 2445 2755 2716 2716 2723 2955 2900 2900 2905 2976 2970 2967 2982 2928 2922 2934 2925 3148 3146 3142 3104 3150 3104 3112 3100 3472 3416 3409 3423 3546 3528 3521 3554 3480 3480 3486 3474 3542 3546 3505 3940 3933 3927 3880 3890 3875 3968 3964 3956 3904 3974 3906 3912 3900 4137 4060 4060 4067
4279 4474 4383
4704 4696 4728 4720 4640 4648 4632 4719 4725 4668 4650 4950 4045 4870 4890 4875
5057 5329 5379
5506 5880 5810 5790 5940 5964 5961 5868 5850
6300 7O8O
785 988
1176
1570
1976 2352 2355
2964 3140
3528
3952
47O4 4710 4940
5928
In the nomenclature of organ stops are found numerals denoting the pitch length of the respective stops, viz.' 16', 8', 4', and 2'. 8' denotes normal pitch and produces a tone the same pitch as the corresponding key depressed. A 4' stop will cause a tone to sound an octave higher than the key depressed, 2' two octaves higher, and 16' one octave lower. A harmonic brilliancy in a tone can be achieved by the addition of stops of different pitch lengths. Among organ stops can also be found mutations and mixtures. A mutation such as the
twelfth 2-• produces a tone an octave and a fifth above the key played. Mixtures are used as a means of supply- ing artificial harmonics that will contribute to the brilliancy of the tone.
The tone used for analysis was the G-major triad. The three notes of the triad (G, B, and D) were played simultaneously as each stop was added until the 12-stop ensemble was built up. A recording was taken of each successive step at three different positions. The posi- tions were about ten feet from each other and in front
of the organ at one-third the distance from the organ to the back of the auditorium. A sound-level meter
placed at these positions indicated that the total SPL
was varying about an average of 80 dB. A recording was also made of the tones from the G, B, and D pipe from each individual stop. Each stop contributed three pipes to the G-major triad, with the exception of the III mixture, which added nine pipes. The final 12-stop tone contained a total of 42 pipes.
As a recording had been taken of each separate pipe, it was possible to obtain the fundamental frequency of that pipe more accurately than had two or more pipes been sounded together. The fundamental was deter- mined by dividing the observed frequencies by the corresponding number of the component and then averaging the results.
Table IV is a compilation of all the frequencies present in the G-major triad produced by twelve stops. The harmonic frequencies are the integral multiples of the fundamental of each pipe. G1, B1, and D 1 are used to identify the fundamentals generated by each pipe; G2, B2, and D2 identify the second partials; G3, B3, and D3 identify the third partials, etc. The vertical columns present the frequencies present in the three pipes from each stop. A horizontal reading of the table will give all the frequencies associated with any
Redistribution subject to ASA license or copyright; see http://acousticalsociety.org/content/terms. Download to IP: 128.187.97.22 On: Fri, 14 Mar 2014
23:18:57
QUALITY OF ORGAN TONES 319
given partial. Brackets indicate that the frequencies of the enclosed partials were too close together to be effectively resolved by the analyzer, had they been sounded together.
Some interesting observations can be made from this table. The 42 pipes sounding together produce a total of 229 measured frequencies. Of the 229 frequencies there are 182 different frequencies. If all the pipes were exactly in tune, there would be only 38 different frequencies. The beating between many of these fre- quencies that are close together would certainly be a contributing factor to the warmth of the tone, which will be discussed later in this paper.
The tone produced by an 8' pipe contains all integer multiples of the fundamental. A 4' pipe has a funda- mental an octave higher and reinforces all the even partials. A 2' pipe has a fundamental 2 octaves higher and reinforces the 4th, 8th, 12th, 16th, etc. partials.
From Table IV it can be noted that stop Nos. 7, 9, 10, and 11 produce frequencies that are somewhat out of tune with the remainder of the stops. This can be explained by the fact that the pipes from these four stops are enclosed in a swell box of the organ. This box is equipped with shutters across the front, which serve as a means of varying the dynamics of this section of the organ. The swell box had been closed during the evening prior to when the recordings were made, with the result that these pipes had not warmed up to the room temperature and were sounding flat with the rest of the organ.
Due to the fact that the organ was out of tune when the recordings were taken, the range of the frequencies associated with any one partial is rather wide. These ranges are not as wide but, nevertheless, present in the tones that are analyzed and discussed in the following sections of this paper.
The relative levels of the partials were measured in the laboratory. These observed values were difficult to determine accurately due to the fact that the level of the partial was not constant but varied with time as much as 10 dB. It was not only difficult to determine the level, but also difficult to set the analyzer to obtain the proper maximum reading and thus accurately determine the frequency. In some cases the beating pattern enabled an estimate of the relative levels at two frequencies.
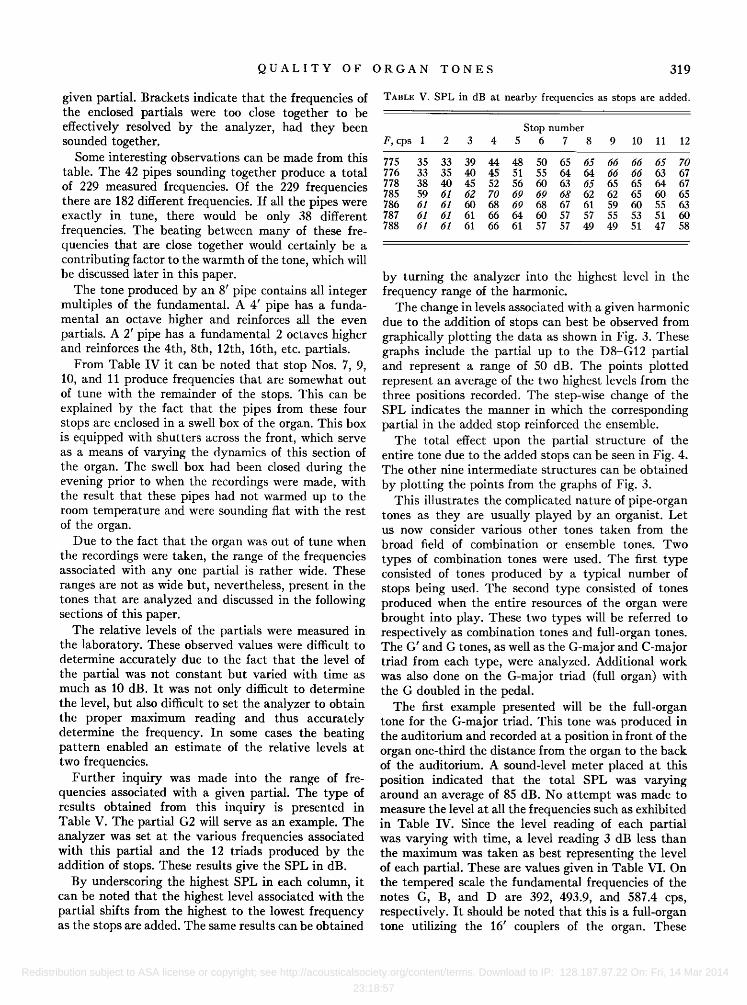
Further inquiry was made into the range of fre- quencies associated with a given partial. The type of results obtained from this inquiry is presented in Table V. The partial G2 will serve as an example. The analyzer was set at the various frequencies associated with this partial and the 12 triads produced by the addition of stops. These results give the SPL in dB.
By underscoring the highest SPL in each column, it can be noted that the highest level associated with the partial shifts from the highest to the lowest frequency as the stops are added. The same results can be obtained
TABLE V. SPL in dB at nearby frequencies as stops are added.
Stop number F, cps 1 2 3 4 5 6 7 8 9 10 11 12
775 35 33 39 44 48 50 65 65 66 66 65 70 776 33 35 40 45 51 55 64 64 66 66 63 67 778 38 40 45 52 56 60 63 65 65 65 64 67 785 59 61 62 70 69 69 68 62 62 65 60 65 786 61 61 60 68 69 68 67 61 59 60 55 63 787 61 61 61 66 64 60 57 57 55 53 51 60 788 61 61 61 66 61 57 57 49 49 51 47 58
by turning the analyzer into the highest level in the frequency range of the harmonic.
The change in levels associated with a given harmonic due to the addition of stops can best be observed from graphically plotting the data as shown in Fig. 3. These graphs include the partial up to the D8-G12 partial and represent a range of 50 dB. The points plotted represent an average of the two highest levels from the three positions recorded. The step-wise change of the SPL indicates the manner in which the corresponding partial in the added stop reinforced the ensemble.
The total effect upon the partial structure of the entire tone due to the added stops can be seen in Fig. 4. The other nine intermediate structures can be obtained
by plotting the points from the graphs of Fig. 3. This illustrates the complicated nature of pipe-organ
tones as they are usually played by an organist. Let us now consider various other tones taken from the
broad field of combination or ensemble tones. Two
types of combination tones were used. The first type consisted of tones produced by a typical number of stops being used. The second type consisted of tones produced when the entire resources of the organ were brought into play. These two types will be referred to respectively as combination tones and full-organ tones. The G' and G tones, as well as the G-major and C-major triad from each type, were analyzed. Additional work was also done on the G-major triad (full organ) with the G doubled in the pedal.
The first example presented will be the full-organ tone for the G-major triad. This tone was produced in the auditorium and recorded at a position in front of the organ one-third the distance from the organ to the back of the auditorium. A sound-level meter placed at this position indicated that the total SPL was varying around an average of 85 dB. No attempt was made to measure the level at all the frequencies such as exhibited in Table IV. Since the level reading of each partial was varying with time, a level reading 3 dB less than the maximum was taken as best representing the level of each partial. These are values given in Table VI. On the tempered scale the fundamental frequencies of the notes G, B, and D are 392, 493.9, and 587.4 cps, respectively. It should be noted that this is a full-organ tone utilizing the 16' couplers of the organ. These
Redistribution subject to ASA license or copyright; see http://acousticalsociety.org/content/terms. Download to IP: 128.187.97.22 On: Fri, 14 Mar 2014
23:18:57

320 FLETCHER, BLACKHAM, AND CHRISTENSEN
go • G1 •0 _r
90 • B1 30 •
90 • D1 • 80 ß
, 70 I • • I I I I I I I I 1
80
60
50
40 ........
60
• D5-B6 r--- , 40 I , • , , I I I I I I I i
• 6o
3 (a) 3 (b)
FIG. 3. Effect of adding stops upon the level of partials present in the G-major triad.
couplers automatically add pipes an octave below the etc. partials. The level values show this effect. Several keys played, and therefore add the fundamental sets of pipes of different quality are used, and they may frequencies 196, 246.9, and 293.7 cps and their harmon- not be exactly in tune. Similarly the tones B and D are ics. In the upper part of the table, the observed SPL's made by many pipes, but the resultant levels are given of the partials are given when this major-triad tone in this table. sounds. The fundamental frequency from the longest In the lower half of this table is shown a comparison pipe used to produce the tone G was 196 cps. All in- between the ideal harmonic frequencies and those teger multiples of this should be present. A second experimentally determined by the technique already pipe with a fundamental frequency of 392 cps reinforces described. Due to the varying level of the component, all the even partials, and a third pipe with a fundamental it was difficult to set the analyzer to give a maximum frequency of 784cps reinforces the 4th, 8th, 12th, 16th, deflection. The frequencies of the partials that are
Redistribution subject to ASA license or copyright; see http://acousticalsociety.org/content/terms. Download to IP: 128.187.97.22 On: Fri, 14 Mar 2014
23:18:57

QUALITY OF ORGAN TONES 321
9O
• •o i
6o
• •o
• $o
• •o
100 _
_
= ..... Stop ,•o. 1
] ..... '• ...... 12-S%op E ....... ble L _..,.__ .,. -- .r-- -•.__.•
L_ _• F - --i
G1B1 DI G2 B2 DS B3 G4 D3 G5 D4 B5 G7 D5 GJ B7 D6 G10 D7 GllB9 D8 G3 ]94 G6 B6 G9 B8 G12
PARTIAL h UU,•ER
FIO. 4. Effect of adding stops upon the harmonic structure of the G-major triad.
bracketed are too close together to be resolved by the analyzer. It is concluded that within the observational error the frequencies of the partials are harmonic. This is borne out by similar data in Tables VI-IX. However, it wn• •oon that tho p•rt;•l• from the different pipes are not exactly in tune. A component of the combined tone that is measured is actually a combination of tones that have their frequencies close together. Therefore, they cause the measured level of this compo- nent to vary due to the beating effect of these several
TAB•.E VII. Partial-tone structure of G(392 cps) with combination tone. Matching warmth = 0-- 11 -- 11 --.
n dB n dB n dB n dB
1 80 4 75 7 47 10 52 2 82 5 56 8 59 11 30 3 67 6 68 9 44 12 45
partials. Our technique was not sufficiently accurate to determine the levels and frequencies of these several components, but a method of warming the synthetic tones was found which would give the equivalent effect.
TABLE VIII. Partial-tone structure of G' (196 cps) with full organ. Matching warmth = 0-- 0--.
n dB n dB n dB n dB
1 80 5 64 9 50 16 66 2 86 6 74 10 72 18 54 3 76 7 50 12 78 20 58 4 86 8 83 14 70 24 49
TABLE VI. Partial-tone structure of G-major triad with full organ with pedal. Matching warmth =0-0-0-0.
G (49 cps) n dB n dB
B (247 cps) D (293.6 cps) n dB n dB
1 95 17 53 2 8O 18 -.- 3 62 19 44 4 84 20 -.- 5 ... 21 42 6 ..- 22 5O 7 66 23 41 8 80 24 -.- 9 59 26 48
10 74 28 63 11 74 32 72 12 74 34 42 13 63 44 50 14 62 56 59 15 64 55 16 '•
cal. obs. cal.
n f f n f
1 75 1 74 2 74 2 74 3 67 3 69 4 75 4 74 6 60 5 60 8 63 6 60
10 55 7 ... 12 56 8 64 16 53 12 48 19 42 16 42
obs. cal. obs.
f n f f
G1 G2 G3 G4 G5 D1
G7 G8 G9
G10-] 490.0 B2 J 494.O 494 Gll 539.0 537 D2 587.3 [G12] 588.0 588 G13 637.0 636
686 G28 1372 1370 B6 1482 1480
742 G32 1568 1566 785 G34 1666 1667 831 D6 1762 1760 883 B8 1976 1977
G44 2156 2160
929 [D8 1 2349 2349 982 G481 2352 B10 2469 2464
49.0 49 G14 686
98.0 98 [G15] 735 147.0 147 B3 J 741 196.0 196 G16 784 245.0 245 G17 833
293.0 294 [D 3] 881 294.0 G18 882 343.0 343 G19 931
392.0 393 [G20] 980 441.0 441 B4 J 988 G21 1029 1025 G56 2744 2741
G22 1078 1080 [DB10 ] 2937 2951 G23 1127 1125 12 2963
IDa ] 1175 1175 G64 3136 3129 G24 1176 D12 3524 3524 G26 1274 1276 B16 3951 3938
B19 4692 4680
The synthesizer was tuned to the observed frequencies and set to the levels of the partials as indicated in Table X. The resulting synthetic G-major triad was fair match for the real tones, but it lacked what musicians call warmth.
As stated above, the warmth is due to the beating effect of several components having frequencies close together. This beating may be caused in several ways. These frequencies in Table X which are bracketed will cause beats, even though all the pipes used are exactly in tune. However, the beating for these particular components was not greater than for other components. This bears out the fact that the different pipes that were used to produce the tone have slightly different fundamental frequencies.
To show this level variability of the component, the real organ tone from the tape recorder was sent through the analyzer, which was set to pass 196, 588, 1175, and 1980 cps. It was then sent from the analyzer to the level recorder. The "levelgrams" thus produced are shown in Fig. 5.
TABLE IX. Partial-tone structure of G'(196 cps) with combination tone. Matching warmth = 0-- 5 --.
n dB n dB n dB n dB
1 78 6 64 11 38 2 82 7 49 12 52 3 72 8 66 13 35 4 74 9 44 14 33 5 61 10 52 15 28
16 48 17 25 18 29
Redistribution subject to ASA license or copyright; see http://acousticalsociety.org/content/terms. Download to IP: 128.187.97.22 On: Fri, 14 Mar 2014
23:18:57

322 FLETCHER, BLACKHAM, AND CHRISTENSEN
TA•zv. X. Partial-tone structure of G-major triad with full organ, the SPL of each partial measured in the auditorium being tabulated against the number of partial n. Matching warmth =0-6--8--9.
G (196 cps) B (247 cps) D (293.6 cps) n dB n dB n dB
1 75 1 77 1 69 2 85 2 81 2 83 3 60 3 65 3 67 4 81 4 78 4 79 5 63 5 45 5 69 6 79 6 60 6 69 7 48 7 43 7 51 8 78 8 73 8 70 9 67 9 .-- 9 40
10 62 10 60 10 40 11 45 11 --- 11 .-. 12 70 12 59 12 57 13 40 13 ... 13 ... 14 63 14 47 14 40 16 63 16 61 16 53
cal. obs. cal. obs. cal. obs.
f f n f f n f f
G1 199 B1 247 D 1 294 G2 392 B2 494
D2 [587• G3 [5881 B3 741 G4 784 D3 881 G5 B4
D4 [11•56• 1175 DO (;6 G12 B10
196 B5 1235 1231 G13 2548 2544 245 B7 1372 1369 D9 2643 2540
293 D5 [-1468• 1470 G14 2744 2733
393 B6 t_1482-1 D10 [2937] 494 G8 1568 1561 G15 2940 -1 2947 584 B7 1728 B12 2963
D6 [1762] 1757 G16 3136 3123 740 G9 / 1764-1 B14 3447
782 G10 [1960-] D12 3524-] 3507 879 B8 1976-1 1971 Gig [3528-1 980] D7 2056 2053 B16 3951 3937
988-1 983 Gll 2156 2156 D14 [4111] 4097 [2349] 2344 G21 4116 t2352 B19 [4692] 4681 2469 2464 D16 k4699
lOO 95 90 85 80 75
lOO
8õ 8O
m, 100
8O
75 •1751 c
1 2 5 4 5 6 7 8 9 10 11 12
TIME - SECONDS
FIG. 5. Levelgrams indicating the variations with time of four partials of an organ tone.
the speed is designated 1002, etc. (2) The tone from the synthesizer made up in accordance with Table X is recorded on track ! with speed 1000. (3) The same tone is recorded on track 2 with speed 1002.5. (4) It is again recorded on track 3 with speed 1005. (5) It is again recorded on track 4 with speed 1007.5.
All four tracks are then played together and the
These levelgrams indicate the level variation with time of these four partials. All of the sixty-two harmon- ics were treated similarly. The ones shown are typical. It is this variation in the level of the partials that gives the tone its warmth.
METHOD OF WARMING ORGAN TONES
A method of warming synthetic organ tones so that they could not be identified from the real organ tones has been found. It will now be described. It uses a
5-track tape-recording machine by placing the following recordings on each channel.
(1) A 1000-cps tone is recorded on track 5. The tone from this track is sent to the electronic counter. If the
speed of reproducing is exactly the same as of recording, then this counter will read 1000. Since this 5-track
machine is driven by a high-power oscillator, its speed can be changed by any desired amount within a range of ! to 3. It is convenient to designate the speed in terms of the count from the 1000-cps tone recorded on track 5. For example, if the recording speed is the same as that when the 1000-cps tone was recorded, it is designated as 1000. If the speed is increased 2/'10 of 1%,
TABLE XI. Partial-tone structure of G' single tone with full organ. Matching warmth =0-0--.
n dB n dB n dB n dB
1 81 13 .-. 25 ... 37 -.- 2 81 14 63 26 41 38 ..- 3 71 15 27 -.- 39 ... 4 85 16 '• 28 63 40 44 5 57 17 ..- 29 --- 41 ..- 6 79 18 65 30 39 42 ... 7 44 19 -.- 31 .-- 43 ... 8 84 20 66 32 55 44 ..- 9 61 21 -.. 33 -.- 45 .--
10 70 22 51 34 -.- 46 .-- 11 44 23 --- 35 ... 47 -,- 12 75 24 65 36 50 48 39
cal. obs. cal. obs. cal. obs. f f n f f n f f
98 98 10 980 979 26 2548 2547 196 196 11 1078 28 2744 2743 294 293 12 1176 •7 30 2940 "' 392 393 14 1372 1373 32 3136 3140 490 490 16 1568 1566 36 3528 3514 588 589 18 1764 1765 40 3920 3922 686 20 1960 1961 48 4704 4799 784 • 22 2156 2156 882 886 24 2352 2351
Redistribution subject to ASA license or copyright; see http://acousticalsociety.org/content/terms. Download to IP: 128.187.97.22 On: Fri, 14 Mar 2014
23:18:57

QUALITY OF ORGAN TONES 323
TABLE XII. Partial-tone structure of G-major triad with combination tone. Matching warmth=O- 11-- 11-11.
TAgrE XIV. Partial-tone structure of C-major triad with combination tone. Matching warmth -- 0-- 11 -- 11 -- 14.
G (392 cps) B (494 cps) D (587 cps) C (261.1 cps) E (330 cps) C (392 cps) n dB n dB n dB
1 76 1 78 2 8O 2 73 3 7O 3 62 4 68 4 62 5 57 5 45 6 58 6 51 7 34 7 31 8 54 8 51 9 28 9 29
10 45 10 37 11 21 12 44
n dB n dB n dB
1 71 1 2 74 2 3 55 3 4 58 4 5 51 5 6 48 6 7 29 7 8 48 8
9 10 11 12 16
levels of each adjusted until the proper warmth is c1
obtained. The warmth then for these organ tones can E1 be designated by giving the levels in dB of the tone G1 from each of these four channels. For example, the C2 E2
warmth of the tone G-major triad full organ was G2 matched by a warmth of 0-6-8-9, meaning that E3 track 2 was reproduced at 6-dB level lower than track 1, C4
G3
gCS•l
TAn•-E XIII. Partial-tone structure of C-major triad with full organ. Matching warmth = 0 - 0-- 0 --.
70 1 83 1 81 86 2 81 2 80 75 3 71 3 69 79 4 77 4 72 60 5 57 5 57 70 6 50 6 60 50 7 ..- 7 42 68 8 6O 8 60 45 9 ..- 9 40 6O 10 52 10 47 ß .- 1! --- 11 27 60 12 58 12 45 48 16 42
cal. ohs. cal. obs. cal. ()})s.
f f n f f n f f
262 262 EE4] 330 330 G4 392 390 Ec6] 523 522 E5 659 662 C7 784 G5 785 785 EE6] 989 992 C8
1047 1046 G6 1176 1177 [C9] 1308
1319 1319 EE8• 2637 2636 1568 1569 G7 2744
1570 EGO ] 3136 1648 1653 C12 3139 3139 1831 1830 El0 3296 3298 1960 1962 G9 3528
1978 [G10] 3920 2093 2090 E12J 3955 3953 2352 2350 C16 4186 4176 2354 Gll 4312
[C103 2616 G12 4704 4713 El6 5274 5279
C (130.8 cps) n dB n dB
E' (164.8 cps) G' (196.0cps) n dB n dB
1 82 13 43 1 73 1 77 2 82 14 63 2 85 2 79 3 82 15 40 3 71 3 71 4 84 16 71 4 81 4 79 5 60 20 67 5 47 5 57 6 82 25 53 6 78 6 77 7 48 28 58 7 48 7 50 8 81 30 50 8 79 8 83 9 48 32 52 9 -.. 9 50
10 77 36 47 10 65 10 68 11 47 12 71 14 67 12 83 14 53 18 47
19 65 20 52
cal. ol)s. cal. obs. cal. obs. f j n f J " I J
C1 131.0 131 C8 1047 1047 E1 165.0 165 E7 1154 1155
G1 196.0 196 [G6] 1176 1176 C2 262.0 263 C9 1177 E2 330.0 330 C10 1308 1308
[G2] 392.0 E8 1319 1320 C3 392.4 394 G7 1372 1372 E3 494.0 497 Cll 1439 1440
C4 523.0 524 [GO ] 1568 1567 G3 588.0 588 C12 1570
E4 659.0 659 C13 1701 1694
[G4] 784.0 784 G9 1764 CO 785.0 C14 1831 1829
E5 824.0 825 IG10-] 1960 C7 916.0 918 C151 1962 lEG65] 980.0 E12J 1978 1978 989.0 990 C16 2093 2093
Gll 2156
EEl4] 2307 2307 G12 2352 C20 2616 2623
EG14] 2744 2741 C21 2747 El9 3131 3136 C25 3270 E20 3296 3285
G18'] 3528 3525 C27J 3532 C28 3663 3655
EG20] 3920 C30J 3924 3924 C32 4186 4195
[G24'] 4704 4697 C36J 4709
that track 3 was reproduced at 8 dB, and track 4 at 9 dB lower than track 1.
A similar analysis and synthesis were made for (;' full organ, G" major-triad full organ with pedal, G combina- tion tone, F' full organ with subcouplers, G combination tone, G-major triad-combination tone, C-major triad- combination tone, and C' major-triad full organ. The results are given in Tables XI, VI, VII, VIII, IX, XII, XIII, and XIV, respectively.
It will be seen that the frequencies of the partials are harmonic within the observational error. Observed
frequencies were not taken for the three G's shown in Tables VII-IX. They were considered to be harmonic.
IDENTIFICATION TESTS FOR FULL ORGAN AND COMBINATION TONES
Synthetic tones were made in accordance with these tables and then warmed with the technique described above. The matching warmth is given with each table. A program of identification tests using the real and synthetic tones was recorded. The make-up of this program is given in Table XV. (S) and (R) signify synthetic and real tones, respectively. The number preceding these symbols identifies the tone used, e.g., tone 6 is the same as that found in Table VI, tone 7 is the same as that found in Table VII, etc.
The results obtained when this test was given to a jury of six musicians and five nonmusicians are presented
Redistribution subject to ASA license or copyright; see http://acousticalsociety.org/content/terms. Download to IP: 128.187.97.22 On: Fri, 14 Mar 2014
23:18:57

324 FLETCHER, BLACKHAM, AND CHRISTENSEN
TABLE XV. Program for identification tests on combination and full organ tones.
Test 1 11 (S) Test 21 10 (S) Test 41 11 (R) Test 2 9 (R) Test 22 9 (S) Test 42 10 (S) Test 3 8 (S) Test 23 7 (R) Test 43 14 (R) Test 4 14 (S) Test 24 6 (R) Test 44 12 (R) Test 5 6 (S) Test 25 13 (R) Test 45 6 (S) Test 6 8 (R) Test 26 12 (S) Test 46 ... Test 7 7 (R) Test 27 ... Test 47 14 (S) Test 8 10 (R) Test 28 9 (R) Test 48 11 (S) Test 9 13 (R) Test 29 8 (R) Test 49 12 (S) Test 10 .-- Test 30 6 (S) Test 50 8 (R) Test 1! -.. Test 31 7 (S) Test 51 13 (S) Test 12 14 (R) Test 32 10 (R) Test 52 7 (R) Test 13 6 (R) Test 33 14 (R) Test 53 7 (S) Test 14 7 (S) Test 34 13 (S) Test 54 8 (S) Test 15 12 (R) Test 35 12 (R) Test 55 9 (S) Test 16 9 (S) Test 36 11 (S) Test 56 9 (R) Test !7 11 (R) Test 37 ... Test 57 6 (R) Test 18 10 (S) Test 38 14 (S) Test 58 13 (R) Test 19 12 (S) Test 39 8 (S) Test 59 10 (R) Test 20 13 (S) Test 40 11 (R) Test 60 ...
tone can be matched by judgment tests and given a number like that above. The warmth specified in the nine previous tables is indicated only by the difference in dB between tracks. The above designations also include the track speed. This warmth must also be closely related to the levelgrams like those shown in Fig. 5.
It seems possible to work out a single figure for the warmth. It will depend upon the following factors: (1) the variation of the level of each partial component, (2) the frequency of this component, and (3) the frequency of the amplitude variation. A figure for each partial must then be combined in some way to find the final figure.
Some preliminary work has been done which indicates the possibilities. This part of the work is continuing. Many more experimental data are necessary before we know how to assess the various factors.
in Table XVI. Each of the nine synthetic tones and each of the nine real tones occur three times in the test.
The jury of musicians has a chance to make 18 errors, and the nonmusicians have a chance to make 15 errors
on each of the nine synthetic and each of the nine real tones used in the test, or a total of 324 for the musicians and 270 for the nonmusicians. It can be verified from Table XVI that 333 errors were committed out of
594 tries. In other words, 44% of the tones were correctly judged. When the scores made by the jury members are in the area of 50%, it must be concluded that the members of the jury are simply guessing. Obviously the observers were unable to recognize the difference between the real and synthetic tones. These results show that synthetic tones can be made to sound like full organ and combination tones produced by many pipes speaking together.
A POSSIBLE SCALE OF WARMTH
It has been shown that a method has been found for
increasing the warmth of a musical tone. It has been observed that using the following ratios of tape speed on the 5-track tape recorder--namely, 1000, 1003, 1005, 1008, and 1011--produces a range of tone warmths that will match nearly any tone. The tape having the speed 1011 begins to sound out of tune with the tone from the track having the speed 1000. The warmth then can be defined by giving these ratios and the levels on the 5 tracks. For example, for the speed ratios mentioned above and for equal levels on all tracks, the warmth can be designated 00--30--50-80--110. If the level in the second and third tracks was decreased 8 dB below
the others, then the warmth would be designated 00--38--58--80--110, and so forth. When the partial- tone content of a synthetic tone is approximately the same as a real musical tone, then the warmth of that
TABLE XVI. Results of judgment tests on combination and full organ tones.
Errors by five Errors by six Tone nonmusicians musicians no. (R) (S) (R) (S)
6 4 6 18 5 7 7 8 16 6 8 5 11 8 15 9 9 6 16 6
10 10 5 17 3 11 9 6 15 6 12 4 10 11 10 13 5 9 12 12 14 5 8 16 14
Total errors 58 59 129 77
44% of the tones judged correctly
With the above notation some judgment tests were made to determine what warmth is considered best by a jury of musicians and nonmusicians. These pre- liminary results indicate that the warmth preferred by both groups is about the same as that obtained in matching the original organ tone. Where there were differences, all nonmusicians indicated that they preferred a warmer tone than this, and none preferred cooler tones. Among the musicians there were those who had a preference for warmer tones and those who had a preference for cooler than the real organ tones.
PREFERENCE TESTS OF ELECTRONIC ORGAN VS PIPE ORGAN
Tones from an electronic organ have been used in tests to determine if they are preferred over the tones of a pipe organ. The quality of electronic organ tones depends to a great extent upon the installation of the speakers. The conclusions of these tests are based upon only one installation.
Redistribution subject to ASA license or copyright; see http://acousticalsociety.org/content/terms. Download to IP: 128.187.97.22 On: Fri, 14 Mar 2014
23:18:57

QUALITY OF ORGAN TONES 325
Results indicate that when a jury judged between a tone produced by a commercial electronic organ and that of a pipe organ, there was a preference for the pipe organ tone in the majority of cases.
Some tests have also been carried out wherein the
electronic organ tone was warmed by the use of the
5-track recorder. After this warming process some of the observers preferred the warmed electronic organ tone, but the majority still had a preference for the pipe organ. The results of these tests are still rather incon- clusive, requiring more work until more valid conclusions can be ascertained.
Redistribution subject to ASA license or copyright; see http://acousticalsociety.org/content/terms. Download to IP: 128.187.97.22 On: Fri, 14 Mar 2014
23:18:57