quality services review - allegheny county analytics
TRANSCRIPT
QUALITY SERVICES REVIEW ALLEGHENY COUNTY CHILDREN AND YOUTH SERVICES/ JUVENILE PROBATION
Prepared for: Allegheny County Children and Youth Services/Juvenile Probation
By
Hornby Zeller Associates, Inc.
On Behalf of the Pennsylvania Office of Children, Youth and Families
Department of Public Welfare
April 2012

TABLE OF CONTENTS
Introduction ................................................................................................. 1
Child/Youth Demographics .......................................................................... 5
Child/Youth & Family Status Domain ........................................................ 11
Safety ................................................................................................... 11
Permanency ......................................................................................... 15
Well-Being ........................................................................................... 21
Parent/Caregiver Functioning ............................................................. 26
Practice Performance Status Domain........................................................ 29
Additional Organizational Considerations ........................................... 46
QSR Results Summary................................................................................ 49
Key Questions for Next Steps Planning ..................................................... 52
Appendix A: Summary of Ratings .............................................................. 54
Quality Service Review Protocol Rating Scale Logic ............................ 54
Appendix B: Summary of QSR Sub-indicator Ratings ................................ 56

Quality Service Review Prepared by Hornby Zeller Associates, Inc. Allegheny County Page 1 April 2012
INTRODUCTION
Background Implementing change at the local level is critical to the achievement of positive child, youth and family outcomes, particularly in a state-supervised and county-administered state. A well-developed Continuous Quality Improvement (CQI) process will be one vehicle to drive change forward in Pennsylvania. Continuous quality improvement is not a time limited project or initiative. Casey Family Programs and the National Resource Center for Organizational Improvement define continuous quality improvement as “the ongoing process by which an agency makes decisions and evaluates its progress.” The CQI process being developed in Pennsylvania will support staff in improving their practice which will ultimately lead to healthy children, youth and families. The Quality Services Review (QSR) is one critical component of the CQI process that will be used to assess and monitor progress.1 Pennsylvania’s QSR Protocol, developed in collaboration with Human Systems and Outcomes (HSO), uses an in-depth case review method and practice appraisal process to find out how children, youth and families are benefiting from services received. The QSR uses a combination of record reviews, interviews, observations, and deductions made from fact patterns gathered and interpreted by trained reviewers regarding children, youth and families receiving services. The QSR Protocol contains qualitative indicators that measure the current status of the focus child/youth2 and the child/youth’s parents and/or caregivers, that status reflecting the outcomes that have been achieved thus far. The QSR serves as a measure of Pennsylvania’s Practice Model and associated standards which have been established to promote a culture of excellence in serving children, youth and families. The Practice Model was developed through consensus among those working at all levels in the system regarding the actions necessary to promote sound outcomes. Pennsylvania’s QSR Protocol is also designed to capture information for the Program Improvement Plan (PIP) that resulted from the most recent Child and Family Services Review (CFSR). The U.S. Department of Health and Human Services (HHS) conducted the second round of CFSRs in Pennsylvania in 2008. Items found not to be in substantial conformity had to be addressed in the statewide PIP, which was approved by the Administration for Children and Families (ACF). The QSRs are being utilized as one way to gauge progress in meeting the safety, permanency and well-being needs of children, youth and families. During the first year
1 For more information on the framework of Pennsylvania’s Continuous Quality Improvement process, please see the QSR Protocol.
2 For each of the in-home and out-of-home cases selected for review, one child was selected as the “focus child” about whom reviewers were asked to rate the child-specific indicators.

Quality Service Review Prepared by Hornby Zeller Associates, Inc. Allegheny County Page 2 April 2012
following the approval of the PIP (July 1, 2010 – June 29, 2011), Pennsylvania established a baseline for nine specific CFSR items needing improvement; during the second year, progress is being measured against the baseline on an item-by-item basis. The phased in approach to this statewide CQI effort allows for ongoing evaluation and monitoring of child welfare practice in the Commonwealth. This ongoing monitoring will continue to provide data that will allow the Pennsylvania Office of Children, Youth and Families to better monitor the quality of practice across the Commonwealth.
Methodology For the purposes of selecting a sample for the QSR, each county has been assigned to one of eight strata based on the number of dependent (including dependent/delinquent) children it served during federal fiscal year 2008. Allegheny County falls into stratum II, meaning that there were 20 cases selected for review -- eight in-home cases3 and 12 placement cases, one of which was a “shared case.”4 The in-home sample is family-based5 and was selected for Allegheny County from a list provided by the county of families with open in-home cases on November 23, 2011. The placement sample is child-based and was selected for Allegheny County from a list provided by the county of those children in out-of-home placement on the same date. The proportion of cases randomly selected, 40 percent in-home and 60 percent out-of-home, roughly reflects the proportions used by ACF during the 2008 onsite CFSR. For each of the in-home cases selected for review, one child was randomly selected as the “focus child” about whom reviewers were asked to rate the child-specific indicators. The QSR process combines the use of focus groups and key stakeholder interviews with the use of in-depth case reviews to create a multi-method qualitative inquiry process. Focus group and key stakeholder interviews provide information about local practices, resources, collaboration, coordination, and working conditions that helps to provide context for and explain the case-specific review findings which provide a set of micro-point, drill-down analyses that reveal how well children, youth and their caregivers are benefiting from practices and services they are receiving in local sites. The micro- and macro-views of practice are
3 Eight in-home cases were selected but at the time of the review one in-home case was eventually dropped when the focus child and the current caregiver could not be interviewed or seen, and the home in which other focus child currently resides could not be seen, bringing the total number of in-home cases down to seven. 4 A “shared case” refers to the sharing of responsibility for the care and services to youth who are under the direct supervision of either County Child and Youth Agencies (CCYA) or Juvenile Probation Offices (JPO), or both concurrently, and to the families of the youth. The youth include adjudicated delinquents in the CCYA administered Title IV-E Foster Care Maintenance Program. 5 A “family-based” sample means that each family in the population represented a single unit that could be randomly sampled. This stands in contrast to a “child-based” sample, in which each child would represent a single sample able unit (meaning that a single family could be represented in the sample by multiple children).

Quality Service Review Prepared by Hornby Zeller Associates, Inc. Allegheny County Page 3 April 2012
combined to develop a big-picture understanding of local review results and factors that have shaped current outcomes. The QSR process measures both:
the current status of the family including both the parents or caregivers and the selected focus child for in-home cases, and
the quality of practice exhibited by the county. Allegheny County conducted its QSR over six days in February 2012. A total of 235 interviews were conducted, an average of 12 interviews per case. The status indicators measure the extent to which certain desired conditions relevant to safety, permanence and well-being are present in the life of the child/youth and the parents/ caregivers. Changes in status over time may be considered the near-term outcomes at a given point in the life of a case. In measuring child/youth and family status, the QSR generally focuses on the most recent 30 day period, as of the review date. Practice indicators, on the other hand, measure the extent to which best practice guidelines are applied successfully by members of the team serving the family and child/youth. Regardless of any change or lack of change in the status of the cases examined, these indicators generally identify the quality of the work being done within the 90 days leading up to the review. The QSR instrument uses a Likert scale of 1 to 6 for each indicator, with a score of 1 representing “adverse” performance and a score of 6 representing “optimal” performance. The percentage of cases rated as “acceptable” and “unacceptable” is calculated for each indicator, with scores between 1 and 3 representing the “unacceptable” range and scores between 4 and 6 representing the “acceptable” range. Feedback from the focus groups and key stakeholder interviews is used in conjunction with results of reviewed cases and incorporated into the Next Steps Meeting so that the county can utilize this information in the development of its County Improvement Plan. Participants included Office of Children, Youth and Families case workers, supervisors, and biological fathers6 who are actively involved and who receive services from CYF. Each group identified key strengths and challenges for Allegheny County and offered a number of recommendations to improve outcomes for children, youth and families. Information gleaned from the focus groups and interviews is included within this report. Themes which are not attributed to specific review indicators are outlined in the Organizational Considerations section.
6 Three biological fathers comprised the fathers’ focus group.

Quality Service Review Prepared by Hornby Zeller Associates, Inc. Allegheny County Page 4 April 2012
How the Report is Organized This report consists of five major sections, all of which explain the findings of the Allegheny County QSR. The demographics section gives the descriptive characteristics of the children/youth and their families. The tables in the demographics section are broken out by in-home, out-of-home and are compared, when possible, to the entire Allegheny County foster care population. A dash “-“ is used in tables where no data are available or applicable. The next two sections summarize the ratings for each indicator in the Child/Youth & Family Domain and the Practice Performance Domain. A pie chart is displayed for each sub-indicator providing the proportions of applicable cases rated acceptable and unacceptable. Below the pie charts a table is provided that gives the frequency of ratings, one through six, for each indicator. A summary of the indicator ratings is provided at the end of each section. Here the identified strengths and areas needing improvement from the QSR are explored. The final section of this report lists key questions that county staff may ask themselves in regard to the findings of the QSR. More detailed information on the QSR methodology, including sampling, definitions of indicators and scoring, may be found in the Pennsylvania Quality Service Review Protocol Version 2.0.7
7 http://www.pacwcbt.pitt.edu/Resources/PA%20QSR%20Protocol%20Version%202%200.pdf

Quality Service Review Prepared by Hornby Zeller Associates, Inc. Allegheny County Page 5 April 2012
CHILD/YOUTH DEMOGRAPHICS
As noted earlier, 20 cases were reviewed in Allegheny County, although one in-home case was ultimately dropped,8 leaving seven in-home cases and 12 out-of-home cases, one of which was a shared case. Demographic breakdowns of the sampled cases and Allegheny County’s foster care population are shown in Figure 1.
Sex
In-home Out-of-home Combined Total Foster Care Population
9
# % # % # % %
Male 3 43% 4 33% 7 37% 49%
Female 4 57% 8 67% 12 63% 51%
Total 7 100% 12 100% 19 100% 100%
Age
In-home Out-of-home Combined Total Foster Care Population
# % # %10
# % %
0 – 6 6 86% 6 50% 12 63% 42%
7 – 14 1 14% 2 17% 3 16% 38%
15 – 18 0 0% 4 33% 4 21% 20%
19 + 0 0% 0 0% 0 0% <1%
Total 7 100% 12 100% 19 100% 100%
Figure 1: Sex and Age of Focus Children/Youth and Countywide Foster Care Population
More female children/youth were sampled for the review than male children/youth though the distribution of males and females roughly reflects the gender distribution of the children/youth in the Allegheny County foster care population. The vast majority of children/youth sampled were under the age of seven. Much the same as the gender distribution, the age distribution of the out-of-home sample is roughly similar to that of the whole out-of-home population.
8 One in-home case was eventually dropped when the focus child and the current caregiver could not be interviewed or seen, and the home in which the other focus child of the case currently resides could not be seen by reviewers. 9 Percentages were determined based on the total number of children in care on November 23, 2011. 10 Percentages throughout the report may not sum to 100 percent due to rounding.

Quality Service Review Prepared by Hornby Zeller Associates, Inc. Allegheny County Page 6 April 2012
Race/Ethnicity11
In-home Out-of-home Combined Total Foster Care Population
# % # % # % %
White/Caucasian 1 14% 6 50% 7 37% 33%
Black/African-American 6 86% 8 67% 14 74% 65%
American Indian or Alaskan Native 0 0% 0 0% 0 0% <1%
Native Hawaiian or Pacific Islander 0 0% 0 0% 0 0% 0%
Asian 0 0% 0 0% 0 0% <1%
Other 0 0% 0 0% 0 0% -
Unknown 0 0% 0 0% 0 0% -
Unable to Determine 0 0% 0 0% 0 0% 2%
Hispanic 1 14% 1 8% 2 11% <1%
Total 7 12 19
Figure 2: Race and Ethnicity of Focus Children/Youth and Countywide Foster Care Population
The distribution of race, as seen in Figure 2, is relatively similar between the out-of-home cases reviewed and Allegheny’s overall foster care population; the majority of cases selected for review involved children/youth who were black/African American or white/Caucasian. There is a slight over-representation in the sample of children/youth reported to be of Hispanic ethnicity.
Current Placement
In-home Out of Home Foster Care
Population12
# % # % %
Birth home (Biological Mother) 4 57% - - - Birth home (Biological Father) 1 14% - - - Birth home (Both Biological Parents) 2 29% - - - Pre-Adoptive Home - - - - <1%
Post-Adoptive Home - - 0 0% -
Traditional foster home - - 2 17%
39% Therapeutic foster home - - 2 17%
Formal kinship foster home - - 5 42%
36%
Informal kinship foster home - - 0 0%
Subsidized/Permanent Legal Custodianship - - 0 0%
Group/congregate home - - 0 0% 12%
Residential treatment facility - - 0 0%
6%
Juvenile Correctional Facility - - 0 0%
Medical/Psychiatric Hospital - - 2 17%
Detention - - 1 8%
Other - - 0 0% 7%
Total 7 100% 12 100% 100%
Figure 3: Current Placement Types of Focus Children/Youth and Countywide Foster Care Population
11 Reviewers were able to report more than one race for each focus child, in addition to recording whether the child is of Hispanic ethnicity. 12 Placement settings reported in AFCARS include: pre-adoptive home, relative foster family home, non-relative foster family home, group home, institution, supervised independent living, runaway and trial home visit.

Quality Service Review Prepared by Hornby Zeller Associates, Inc. Allegheny County Page 7 April 2012
Figure 3 displays the current placement types of the sampled children/youth and Allegheny County’s foster care population. Of the seven sampled in-home cases, more than half involved children/youth living at home with only their birth mothers. The distribution of current placement settings reported for the children/youth in the out-of-home cases is roughly similar to that of the county’s foster care population, although a larger proportion of the sampled children/youth were placed in institutions13 (25%) than was the case for the county’s foster care population (6%).
Identified Stressors for Mothers
In-Home Out-of-Home
Combined Total
# % # % # %
Lack of Transportation 4 57% 6 50% 10 53%
Overwhelming Child Care/Parenting Responsibilities 5 71% 4 33% 9 47%
Drug Abuse 3 43% 5 42% 8 42%
Insufficient Income 4 57% 4 33% 8 42%
Mental Health Problems 2 29% 5 42% 7 37%
Lack of Parenting Skills 2 29% 5 42% 7 37%
Inadequate Housing 2 29% 4 33% 6 32%
Unstable Living Conditions 2 29% 4 33% 6 32%
Family Discord/Marital Problems 3 43% 3 25% 6 32%
Alcohol Abuse 1 14% 4 33% 5 26%
Chronic Illness 3 43% 1 8% 4 21%
Pregnancy/New Child 3 43% 1 8% 4 21%
Difficulty Budgeting 0 0% 4 33% 4 21%
Job Related Stress 1 14% 3 25% 4 21%
Domestic Violence 0 0% 4 33% 4 21%
Unknown 1 14% 3 25% 4 21%
Legal Problems 0 0% 3 25% 3 16%
Physical Disability 1 14% 1 8% 2 11%
Neglect 2 29% 0 0% 2 11%
Recent Relocation 1 14% 1 8% 2 11%
Mental Retardation 1 14% 0 0% 1 5%
Learning Disability 1 14% 0 0% 1 5%
Physical Abuse 0 0% 1 8% 1 5%
Emotional Abuse 0 0% 1 8% 1 5%
Social Isolation 1 14% 0 0% 1 5%
Incarceration 0 0% 1 8% 1 5%
None 0 0% 1 8% 1 5%
Not Applicable 0 1 1
Figure 4: Identified Stressors of Mothers
Overall, “lack of transportation” and “overwhelming child care/parenting responsibilities” were listed as the most-identified stressors among the mothers of the sampled cases, as seen in
13 Institutions refer to residential treatment facilities, medical/psychiatric hospitals, juvenile correctional facilities, and detention centers.

Quality Service Review Prepared by Hornby Zeller Associates, Inc. Allegheny County Page 8 April 2012
Figure 4. “Drug abuse” and “insufficient income” were also identified frequently among mothers as stressors.
Identified Stressors for Fathers
In-Home Out-of-Home
Combined Total
# % # % # %
Legal Problems 3 43% 3 25% 6 32%
Drug Abuse 1 14% 4 33% 5 26%
Incarceration 2 29% 3 25% 5 26%
Alcohol Abuse 1 14% 2 17% 3 16%
Pregnancy/New Child 2 29% 1 8% 3 16%
Insufficient Income 1 14% 2 17% 3 16%
Inadequate Housing 0 0% 3 25% 3 16%
Unstable Living Conditions 0 0% 3 25% 3 16%
Family Discord/Marital Problems 2 29% 1 8% 3 16%
Lack of Parenting Skills 1 14% 2 17% 3 16%
Mental Health Problems 0 0% 2 17% 2 11%
Difficulty Budgeting 0 0% 2 17% 2 11%
Job Related Stress 1 14% 1 8% 2 11%
Overwhelming Child Care/Parenting Responsibilities 1 14% 1 8% 2 11%
Learning Disability 0 0% 1 8% 1 5%
Recent Relocation 0 0% 1 8% 1 5%
Lack of Transportation 0 0% 1 8% 1 5%
Domestic Violence 0 0% 1 8% 1 5%
Other Stressor 1 14% 0 0% 1 5%
None 0 0% 1 8% 1 5%
Not Applicable 0 1 1
Figure 5: Identified Stressors of Fathers
“Legal problems” was the most identified stressor for fathers. Like mothers, “drug abuse” was also often identified as a stressor for fathers. “Incarceration” was a common stressor for more than a quarter (26%) of the fathers from the sample (versus five percent of mothers).
Identified Stressors for Caregivers
In-Home Out-of-Home
# % # %
Overwhelming Child Care/Parenting Responsibilities 0 0% 3 75%
Lack of Transportation 0 0% 1 25%
None 0 0% 7 58%
Not Applicable 0 1
Figure 6: Identified Stressors of Caregivers
Caregivers of the children/youth in out-of-home placement were most often identified as having no stressors. As seen in Figure 6, when caregivers were identified as having known stressors, “overwhelming child care/parenting responsibilities” and “lack of transportation” were the only ones reported.

Quality Service Review Prepared by Hornby Zeller Associates, Inc. Allegheny County Page 9 April 2012
Stressors
In-Home Out-of-Home Combined Total
# % # % # %
Substance Exposed 3 43% 3 25% 6 32%
History of Physical Abuse/Inappropriate Discipline 2 29% 3 25% 5 26%
Mental Health 0 0% 5 42% 5 26%
Emotional Disturbance 0 0% 4 33% 4 21%
History of Sexual Abuse 0 0% 4 33% 4 21%
Witnessed Domestic Violence 0 0% 4 33% 4 21%
Other14
1 14% 3 25% 4 21%
School Related Problems 1 14% 2 17% 3 16%
Delinquent Behaviors 0 0% 3 25% 3 16%
Learning Disability 1 14% 2 17% 3 16%
Mental Retardation 0 0% 2 17% 2 11%
Chronic Illness 1 14% 1 8% 2 11%
History of Emotional Abuse 0 0% 2 17% 2 11%
Developmental Delay 1 14% 1 8% 2 11%
Medically Fragile/Complex 1 14% 1 8% 2 11%
None 1 14% 1 8% 2 11%
Battered Child Syndrome 0 0% 1 8% 1 5%
Premature Birth 1 14% 0 0% 1 5%
Suicide Risk 0 0% 1 8% 1 5%
Total 7 12 113% 19 213%
Figure 7: Focus Child/Youth Stressors
Figure 7 shows the children/youth stressors identified by the reviewers. Overall, “substance exposed” was the most-identified stressor, which is unsurprising considering both mothers and fathers were often reported to have “drug abuse” stressors. Of the nine children/youth in the sample enrolled in school, only three children/youth (16%) were reported to have a stressor of “school related problems.”
Allegations
In-home Out-of-home Combined Total
# % # % # %
Child Protective Services (CPS)15
Bruises 1 14% 1 8% 2 10%
Asphyxiation/Suffocation 0 0% 1 8% 1 5%
Near Fatality 0 0% 1 8% 1 5%
Mental Injury 0 0% 1 8% 1 5%
Pornography 0 0% 1 8% 1 5%
General Protection Services (GPS)16
Substance Abuse: Parent 3 43% 5 42% 8 42%
Inappropriate Parenting 2 29% 3 25% 5 26%
14 The “other” stressor for the in-home case was reported as “inherited physical condition (under treatment)”. The three “other” stressors for the out-of-home cases were reported as: “Non-verbal”, “Witnessed drug use”, and “Possible witness to violent assault to sibling”. 15Child Protective Services (CPS) - CPS cases are those with alleged harm, or with threat or risk of harm to the child. These cases include allegations of physical abuse that result in severe pain or dysfunction, sexual abuse, medical neglect, or lack of supervision resulting in a specific physical condition or impairment, psychological abuse attested to by a physician, or repeated injuries with no explanation. 16General Protective Services (GPS) - GPS cases include most instances of child neglect, including environmental conditions such as inadequate housing, inadequate clothing, and medical neglect not leading to a specific physical condition (e.g., failure to keep appointments or get prescriptions).

Quality Service Review Prepared by Hornby Zeller Associates, Inc. Allegheny County Page 10 April 2012
Allegations
In-home Out-of-home Combined Total
# % # % # %
Parent/Child/Youth Conflict 0 0% 4 33% 4 21%
Other GPS Allegation17
2 29% 2 17% 4 21%
Mental Health Concerns 0 0% 3 25% 3 16%
Abandonment 0 0% 2 17% 2 11%
Substance Exposed Infant: Prescription Drugs 1 14% 1 8% 2 11%
Environmental Neglect 2 29% 0 0% 2 11%
Substance Exposed Infant: Heroin 0 0% 1 8% 1 5%
Substance Exposed Infant: Marijuana 1 14% 0 0% 1 5%
Truancy 0 0% 1 8% 1 5%
Lack of Food, Shelter or Clothing 0 0% 1 8% 1 5%
Lack of Medical/Dental Care 1 14% 0 0% 1 5%
Figure 8: Allegations
Allegations which led to a case opening were reported for both the in-home and out-of-home cases and are listed in Figure 8. The reported allegations align with the most identified stressors for parent/caregivers and children/youth. “Drug abuse/addiction” was one of the most identified stressors of mothers and fathers and is also the most reported allegation (as “substance abuse: parent”) among both in-home and out-of-home cases.
17 The two “other GPS allegations” for the in-home cases were reported as, “Domestic violence” and “Mother allowed father to have unsupervised access to victim child”. The two “other GPS allegations” for the out-of home cases were reported as, “self-injurious behaviors” and “Shared Case”.

Quality Service Review Prepared by Hornby Zeller Associates, Inc. Allegheny County Page 11 April 2012
CHILD/YOUTH & FAMILY STATUS DOMAIN
The Child/Youth and Family Status Domain section examines the safety, permanence and well-being of the child/youth, as well as the capacity of the child/youth’s caregivers (both familial and substitute) to provide support to that child/youth. Nine indicators are utilized, with the indicators generally focusing on the 30 days immediately prior to the on-site review. 18
SAFETY The following two indicators focus on the safety of the focus child/youth.
Indicator 1a: Safety from Exposure to Threats of Harm
Safety is the primary and essential factor that informs and guides all decisions made from intake through case closure. The focus is on identifying safety factors, present and/or impending danger, protective capacities and interventions with caregivers to supplement protective capacities. The first safety indicator assesses the degree to which the child/youth is free of abuse, neglect, and exploitation by others in his/her place of residence, school, and other daily settings; it also addresses whether the child/youth’s parents and/or caregivers provide the attention, actions, and supports and possess the skills and knowledge necessary to protect the child/youth from known and potential threats of harm in the home, school, and other daily settings.
Family Home #1 Family Home #2 Substitute Home School Other Settings
18 For each indicator throughout the report, a pie chart is displayed for each sub-indicator providing the proportions of applicable cases rated acceptable and unacceptable.
85%
15%
100% 92%
8%
100% 100%

Quality Service Review Prepared by Hornby Zeller Associates, Inc. Allegheny County Page 12 April 2012
Sub-indicator N
Unacceptable Acceptable
1 2 3 % 4 5 6 %
Family home #1 13 0 2 0 15% 6 0 5 85%
Family home #2 1 0 0 0 0% 1 0 0 100%
Substitute Home 12 0 0 1 8% 2 2 7 92%
School 12 0 0 0 0% 2 2 8 100%
Other settings 1 0 0 0 0% 0 1 0 100%
Total - 0 2 1 8% 11 5 20 92%
Figure 9: “Exposure to Harm” QSR Results
Figure 9 gives the frequency of ratings for the Exposure to Harm indicator. The majority of ratings (92%) were acceptable for Exposure to Harm across the five applicable settings, meaning the threat of harm to the children/youth was limited. When safety concerns were brought to the attention of the county, the caseworkers responded immediately and worked toward resolving those concerns. For example, the house from an in-home case was found to be unclean and the structural integrity of the building unsafe. The caseworker sought new housing for the family as part of the services provided. While the ratings were overwhelmingly acceptable, reviewers noted some exceptions. One out-of-home case involved a youth who has unsupervised visits with her parents; the child/youth reported he/she does not feel safe during these visits, and the agency had no safety plan in place to address the child/youth's concerns. Reviewers of another out-of-home case noted that the father is approved for unsupervised visits with his child/youth; during the interviews, however, the reviewers discovered that there were frequently other individuals present in the home during the visits and it was unknown whether they were providing care to the children. As such, their backgrounds had not been assessed for caregiving capacity, criminal clearances, and child abuse clearances. The Fathers' Focus Group reported that parents feel there is a lack of appropriate response by the caseworkers when parents express their feelings that the placements in which their children/youth are placed are not safe.

Quality Service Review Prepared by Hornby Zeller Associates, Inc. Allegheny County Page 13 April 2012
Indicator 1b: Safety from Risk to Self/Others Throughout development, a child/youth learns to follow rules, values, norms, and laws established in the home, school, and community, while learning to avoid behaviors and actions that can put themselves or others at risk of harm. The second safety indicator assesses the degree to which the child/youth avoids self-endangerment and if the child/youth refrains from using behaviors that may put others at risk of harm. This indicator applies only to children/youth ages three or older.
Sub-indicator N
Unacceptable Acceptable
1 2 3 % 4 5 6 %
Risk to self 12 0 1 3 33% 0 1 7 67%
Risk to others 12 1 0 1 17% 0 2 8 83%
Total - 1 1 4 25% 0 3 15 75%
Figure 10: "Behavioral Risk" QSR Results
Figure 10 gives the frequency of ratings for the Behavioral Risk indicator. Overall, 75 percent of the ratings were found to be acceptable. Reviewers attributed the acceptable ratings to children/youth being placed in the homes or facilities that best meet their specific needs. Risk to self was found to be in need of improvement in four out-of-home cases. Two of those cases were also in need of improvement in risk to others. One case with concerns in both risk to self and risk to others involved a youth who was voluntarily hospitalized in a psychiatric facility due to self-harming behaviors, and thoughts of physically harming his/her sibling. The second case needing improvement in both risk to self and risk to others involved a child/youth that had recently caused property damage and threatened staff at a group home, resulting in detention placement prior to the QSR. The same youth also experienced severe emotional outbursts so severe they resulted in the child/youth being physically restrained.
Risk to Self Risk to Others
67%
33%
83%
17%

Quality Service Review Prepared by Hornby Zeller Associates, Inc. Allegheny County Page 14 April 2012
Additional Safety Data Timeliness of Investigations Each of the seven in-home cases reviewed had one CPS or GPS report received within the prior 12 months, totaling seven accepted reports of abuse and neglect. Six of the seven reports had the investigation initiated in accordance with state and/or county timeframes19 and within the requirements for a report of that priority. In each of those same seven reports, face-to-face contact had been made with the child/youth within the required timeframe. All but one of the in-home cases was rated as a “strength” for the timeliness of the investigation. The one case that did not meet the timeline requirements involved a newborn who was born drug- exposed and who was safely hospitalized at the time that CYF conducted an assessment. CYF intake had established a 0-2 hour response time for this case. Of the 12 out-of-home cases reviewed, five had one CPS or GPS report received within the prior 12 months, totaling five accepted reports of abuse and neglect. All five reports had the investigation initiated in accordance with state and/or county timeframes and within the requirements for a report of that priority. Face-to-face contact had been made with the child/youth within the required timeframe for each. The five out-of-home cases were rated as a “strength” for the timeliness of the investigation.
19 State timeframes - For CPS allegations the agency has 24 hours to respond to the report. GPS allegations are handled differently in each of Pennsylvania’s 67 counties.
Quality Service Review Prepared by Hornby Zeller Associates, Inc. Allegheny County Page 15 April 2012
PERMANENCY When measuring permanency, the Child and Family Services Review (CFSR) only examines the circumstances for the child/youth placed in out-of-home care. Pennsylvania’s QSR, however, examines the permanency needs of all children and youth, those removed from their homes as well as those who continue to live with their parents/caretakers.
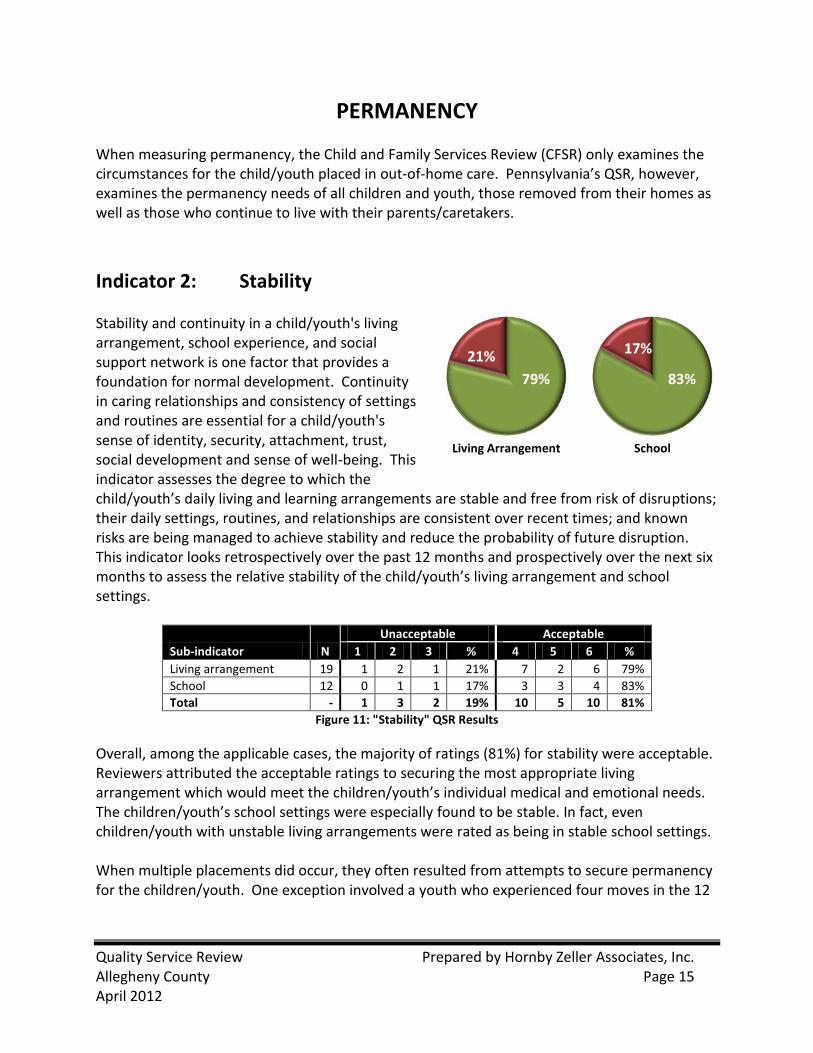
Indicator 2: Stability Stability and continuity in a child/youth's living arrangement, school experience, and social support network is one factor that provides a foundation for normal development. Continuity in caring relationships and consistency of settings and routines are essential for a child/youth's sense of identity, security, attachment, trust, social development and sense of well-being. This indicator assesses the degree to which the child/youth’s daily living and learning arrangements are stable and free from risk of disruptions; their daily settings, routines, and relationships are consistent over recent times; and known risks are being managed to achieve stability and reduce the probability of future disruption. This indicator looks retrospectively over the past 12 months and prospectively over the next six months to assess the relative stability of the child/youth’s living arrangement and school settings.
Sub-indicator N
Unacceptable Acceptable
1 2 3 % 4 5 6 %
Living arrangement 19 1 2 1 21% 7 2 6 79%
School 12 0 1 1 17% 3 3 4 83%
Total - 1 3 2 19% 10 5 10 81%
Figure 11: "Stability" QSR Results
Overall, among the applicable cases, the majority of ratings (81%) for stability were acceptable. Reviewers attributed the acceptable ratings to securing the most appropriate living arrangement which would meet the children/youth’s individual medical and emotional needs. The children/youth’s school settings were especially found to be stable. In fact, even children/youth with unstable living arrangements were rated as being in stable school settings. When multiple placements did occur, they often resulted from attempts to secure permanency for the children/youth. One exception involved a youth who experienced four moves in the 12
Living Arrangement School
79%
21%
83%
17%

Quality Service Review Prepared by Hornby Zeller Associates, Inc. Allegheny County Page 16 April 2012
months prior to the review. The moves were due to the youth’s own violent and out-of-control behavior. Participants in the Supervisors' Focus Group reported that there are in fact too many placement changes, especially for children/youth ages nine and older. Many foster homes or residential programs are not willing to work with difficult children/youth, resulting in placement that has inadequate capacities to address behavioral challenges. Further, some older youth, ages 16 and older) have been found to “shop around” for placements instead of learning to fully cope with difficult situations. This instability often serves to exacerbate existing behavioral issues. As recommended by supervisors, services should be provided to children/youth upon placement in new out-of-home settings to learn how to adjust to new situations and for caregivers to learn how to deal with any behavioral/adjustment issues that may arise. This should help to decrease the rate of placement disruption.
Indicator 3: Living Arrangement The child/youth's home is the one that the individual has lived in for an extended period of time. For a child/youth that is not in out-of-home care, this home can be the home of his or her parents, informal kinship care, adoptive parents, or a guardian. For a child/youth in out-of-home care, the living arrangement can be a resource family setting or a congregate care setting. The child/youth's home community is generally the area in which the child/youth has lived for a considerable amount of time and is usually the area in which the child/youth was living prior to removal. This indicator assesses the degree to which the child/youth, consistent with age and/or ability, is currently living in the most appropriate/least restrictive living arrangement, consistent with the need for family relationships, assistance with any special needs, social connections, education, and positive peer group affiliation. If the child/youth is in out-of-home care, the living arrangement should meet the child/youth's basic needs as well as the inherent expectation to be connected to his/her language and culture, community, faith, extended family, tribe, social activities, and peer group. This indicator evaluates the child/youth’s current living situation.
Family Home #1 Family Home #2 Substitute Home
85%
15%
100% 83%
17%

Quality Service Review Prepared by Hornby Zeller Associates, Inc. Allegheny County Page 17 April 2012
Sub-indicator N
Unacceptable Acceptable
1 2 3 % 4 5 6 %
Family home #1 13 0 0 2 15% 4 2 5 85%
Family home #2 1 0 0 0 0% 1 0 0 100%
Substitute home 12 1 0 1 17% 0 4 6 83%
Total - 1 0 3 15% 5 6 11 85%
Figure 12: "Living Arrangement" QSR Results
As seen in Figure 12, the Living Arrangement indicator was found to be within the acceptable range for 85 percent of the ratings. Reviewers recognized the efforts of substitute caregivers, most notably formal kinship home providers, in providing stable homes for children/youth, as well as the efforts of caseworkers in ensuring children/youth in need of residential treatment were placed in the most appropriate facility to meet their specific needs. Reviewers also recognized the willingness of the county to keep siblings together whenever possible and appropriate to do so. In one out-of-home case, the foster mother was reported to have been the former foster mother to the biological mother of the current case. This situation put the young biological mother at ease knowing her child/youth would be looked after by the same woman who had helped to raise her. In an in-home case, the biological father took custody of the child/youth after the mother was hospitalized. Reviewers noted that the family plans to stay together and formally reunite upon the mother’s completion of outpatient treatment and stabilization of her mental health needs. Unacceptable ratings were attributed to a lack of supervision of the children/youth in their current living arrangements. For example, one child/youth was living at an older sibling’s home where there was limited to no supervision of the child/youth’s actions. The child/youth admitted to using narcotics while unsupervised in the home. Participants in the Supervisors' Focus Group stated the Courts regularly approve placements for children/youth that meet minimal standards and are against the recommendations of the Caseworker/Supervisor. When the placement or living arrangement is found to be inappropriate, the courts may be unwilling to order a change in the placement.

Quality Service Review Prepared by Hornby Zeller Associates, Inc. Allegheny County Page 18 April 2012
Indicator 4: Permanency Every child/youth is entitled to a safe, secure, appropriate, and permanent home. Permanency is achieved when the child/youth is living successfully in a family situation that the child/youth, parents, caregivers, and other team members believe will endure lifelong. This indicator assesses the degree to which there is confidence by the child/youth, parents, caregivers or other team members that the child/youth is living with parents or other caregivers who will sustain in this role until the child/youth reaches adulthood and will continue to provide enduring family connections and supports into adulthood. Where such support is not available, the review assesses the timeliness of the permanency efforts to ensure that the child/youth will be enveloped in enduring relationships that will provide a sense of family, stability, and belonging.
Indicator N
Unacceptable Acceptable
1 2 3 % 4 5 6 %
Permanency 19 1 0 4 26% 3 9 2 74%
Total - 1 0 4 26% 3 9 2 74%
Figure 13: "Permanency" QSR Results
As seen in Figure 13, the ratings for the Permanency indicator was deemed acceptable in 74 percent of the cases reviewed. In one-third of the out-of-home cases, the kinship/foster care provider was considering adoption or legal guardianship. All in-home cases were reported to have the children/youth living with at least one of their biological parents with no reported threats of future removal; in fact, as noted earlier in one in-home case, the biological mother and father reported planning to reunite the family once the mother has stabilized her mental health, further increasing stability and permanency for the child/youth. Unacceptable ratings stemmed from a variety of causes. The permanency of one youth was reliant on whether the youth decided to remain in care beyond his or her 18th birthday. The kinship care provider stated she would like to provide a permanent home for the youth but would be unable to do so if she were no longer receiving assistance via foster care payments. One biological father voiced his desire to be the permanent home for his child/youth upon release from prison; however, due to the agency’s very recent identification of this father, assessment of his caregiving capacity needs to occur prior to a decision for placement.
Permanency
74%
26%

Quality Service Review Prepared by Hornby Zeller Associates, Inc. Allegheny County Page 19 April 2012
Primary Permanency Goal
Concurrent Permanency Goal
Foster Care
20
Population
# % # % %
In-Home Cases
Remain in Home 7 100% - -
Adoption 0 0% 0 0%
Permanent Legal Custodian /Subsidized Legal Custodian 0 0% 0 0%
Placement with a Fit and Willing Relative 0 0% 0 0%
Other Planned Placement Intended to be Permanent/APPLA 0 0% 0 0%
No Goal Established 0 0% 7 100%
Total 7 100% 7 100%
Out-of-Home Cases
Return Home 6 50% 2 17% 71%
Adoption 0 0% 3 25% 9%
Permanent Legal Custodian /Subsidized Legal Custodian 1 8% 0 0% 4%
Placement with a Fit and Willing Relative 3 25% 0 0% 8%
Other Planned Placement Intended to be Permanent/APPLA 2 17% 1 8% 8%
Emancipation 0 0% 0 0% 0%
No Goal Established 0 0% 6 50% 0%
Total 12 100% 12 100% 100%
Figure 14: Permanency Goals of Focus Children/Youth and Countywide Foster Care Population
Figure 14 shows the permanency goals of the sampled children/youth and those of Allegheny County’s entire foster care population. The primary permanency goal for all in-home cases reviewed was “remain in the home.” The distribution of the primary goals for children/youth from the out-of-home sample is roughly similar to that of the Allegheny County foster care population. Half of the out-of-home cases were reported to have a concurrent goal. Two of these cases were reported to have a concurrent goal of “Return Home;” their primary goals were reported as “Permanent Legal Custodian /Subsidized Legal Custodian“ for a two year old and “Placement with a Fit and Willing Relative“ for a five year old. Supervisors indicate concurrent planning does take place on an ongoing basis; the county is working towards improving the documentation to demonstrate the practice.
20 Placement settings reported in AFCARS includes: pre-adoptive home, relative foster home, non-relative foster home, group home, institution, supervised independent living, runaway and trial home visit.

Quality Service Review Prepared by Hornby Zeller Associates, Inc. Allegheny County Page 20 April 2012
Appropriateness of Permanency Goals
In-home Out-of-home Combined Total
# % # % # %
Primary Goal Appropriate 7 100% 11 92% 18 95%
Concurrent Goal Appropriate - - 6 50% 6 32%
Total Cases 7 12 19
Figure 15: Appropriateness of Permanency Goals of Focus Children/Youth
As well as identifying the primary and concurrent permanency goals of the cases reviewed, the appropriateness of the goals was also assessed, as seen in Figure 15. The primary permanency goal was considered appropriate for 18 (95%) of the cases reviewed. Only half of the out-of-home cases had established concurrent goals, and reviewers noted these concurrent goals to be appropriate in all six cases. There were no concurrent goals established for children/youth who reside with their families. Additional Permanency Data Caseworker Turnover The average number of caseworkers assigned to the in-home cases under review was 2.1 caseworkers, with a minimum count of two and a maximum number of three workers. The number of caseworkers assigned to the out-of-home cases under review averaged 2.9 caseworkers, with a minimum number of two and a maximum number of six workers having been assigned. Due to the turnover, families have come to expect difficulty in working with their caseworker due to challenges associated with engaging and forming relationships, with knowing to whom to communicate questions and concerns, and with feelings that their concerns are not addressed in a timely manner, as shared by the Fathers' Focus Group.

Quality Service Review Prepared by Hornby Zeller Associates, Inc. Allegheny County Page 21 April 2012
WELL-BEING The following five indicators examine the well-being needs of the child/youth.
Indicator 5: Physical Health A child/youth should achieve and maintain their best attainable health status, consistent with their general physical condition when taking medical diagnoses, prognoses, and history into account. This indicator assesses the degree to which the child/youth is achieving and maintaining his/her optimum health status. If the child/youth has a serious or chronic physical illness, the child/youth should be achieving his/her best attainable health status given the disease diagnosis and prognosis.
Indicator N
Unacceptable Acceptable
1 2 3 % 4 5 6 %
Physical Health 19 0 2 2 21% 2 1 12 79%
Total - 0 2 2 21% 2 1 12 79%
Figure 16: “Physical Health” QSR Results
Figure 16 gives the frequency of ratings for the Physical Health indicator. The physical health of the children/youth was rated within the acceptable range for 79 percent of the cases reviewed. The review found that while many children/youth had chronic and oftentimes serious medical conditions, the medical concerns were being appropriately addressed and closely monitored by the agency and caregivers in the majority of the cases. Three of the four unacceptable ratings were attributed to medical conditions of children/youth that were known but not being treated or closely monitored, such as a recent diagnosis of obesity, untreated cataracts, and a mother who is not consistently providing her child/youth with necessary epilepsy medication. The other case involved a child/youth with a congenital heart defect, whose medical progress was diligently followed but whose physical health conditions were not improving in response to medical treatment. Reviewers recommended that caseworkers ensure children/youth have a current medical insurance card so that medical attention can be accessed at any given time, especially in an emergency. One youth was found to have cataracts but had not received any care due to the barrier of not having a medical card. Reviewers further recommended that older youth not be put completely in charge of scheduling and managing their own medical appointments as support is still needed. While managing one’s own medical needs is an exercise in independent living, one youth was found to be scheduling her medical appointments on her own and was
Physical Health
79%
21%
Quality Service Review Prepared by Hornby Zeller Associates, Inc. Allegheny County Page 22 April 2012
believed to be behind in her periodic visits as she had not scheduled all appointments at appropriate intervals.
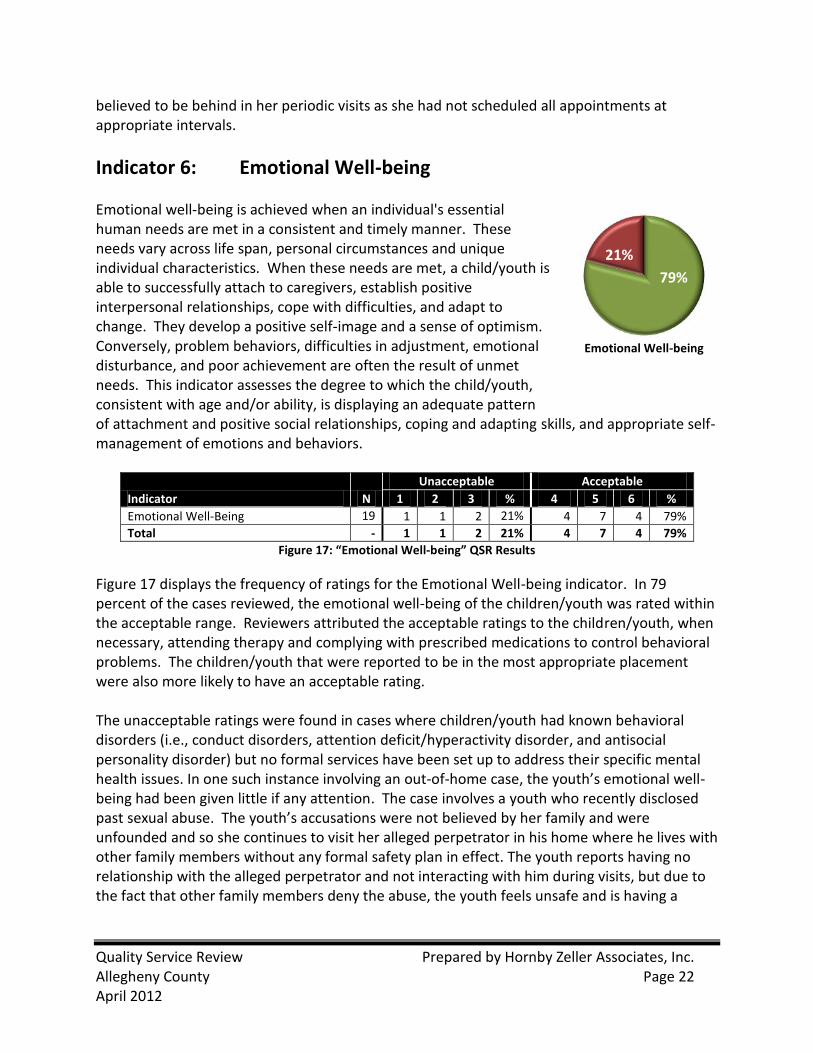
Indicator 6: Emotional Well-being Emotional well-being is achieved when an individual's essential human needs are met in a consistent and timely manner. These needs vary across life span, personal circumstances and unique individual characteristics. When these needs are met, a child/youth is able to successfully attach to caregivers, establish positive interpersonal relationships, cope with difficulties, and adapt to change. They develop a positive self-image and a sense of optimism. Conversely, problem behaviors, difficulties in adjustment, emotional disturbance, and poor achievement are often the result of unmet needs. This indicator assesses the degree to which the child/youth, consistent with age and/or ability, is displaying an adequate pattern of attachment and positive social relationships, coping and adapting skills, and appropriate self-management of emotions and behaviors.
Indicator N
Unacceptable Acceptable
1 2 3 % 4 5 6 %
Emotional Well-Being 19 1 1 2 21% 4 7 4 79%
Total - 1 1 2 21% 4 7 4 79%
Figure 17: “Emotional Well-being” QSR Results
Figure 17 displays the frequency of ratings for the Emotional Well-being indicator. In 79 percent of the cases reviewed, the emotional well-being of the children/youth was rated within the acceptable range. Reviewers attributed the acceptable ratings to the children/youth, when necessary, attending therapy and complying with prescribed medications to control behavioral problems. The children/youth that were reported to be in the most appropriate placement were also more likely to have an acceptable rating. The unacceptable ratings were found in cases where children/youth had known behavioral disorders (i.e., conduct disorders, attention deficit/hyperactivity disorder, and antisocial personality disorder) but no formal services have been set up to address their specific mental health issues. In one such instance involving an out-of-home case, the youth’s emotional well-being had been given little if any attention. The case involves a youth who recently disclosed past sexual abuse. The youth’s accusations were not believed by her family and were unfounded and so she continues to visit her alleged perpetrator in his home where he lives with other family members without any formal safety plan in effect. The youth reports having no relationship with the alleged perpetrator and not interacting with him during visits, but due to the fact that other family members deny the abuse, the youth feels unsafe and is having a
Emotional Well-being
79%
21%

Quality Service Review Prepared by Hornby Zeller Associates, Inc. Allegheny County Page 23 April 2012
difficult time developing a trusting relationship with other family members in the home. Besides the notable safety concerns related to unsupervised visits in the family home where the alleged perpetrator resides, a behavioral decline of the youth has coincided with his/her disclosure of alleged sexual abuse, resulting in multiple voluntary and involuntary psychiatric hospitalizations. While he/she has received ongoing mental health case management services, his/her mental health treatment has been intermittent due to lack of cooperation and his/her decision to decline trauma- informed treatment.
Indicator 7a: Early Learning & Development From birth, a child progresses through a series of stages of learning and development. The growth during the first eight years is greater than any subsequent developmental stage. This offers a great potential for accomplishment, but it also creates vulnerabilities if the child's physical status, relationships, and environments do not support appropriate learning, development, and growth. These developmental years provide the foundation for later abilities and accomplishments. Significant differences in children's abilities are also associated with social and economic circumstances that may affect learning and development. This indicator assesses the degree to which the young child’s developmental status is commensurate with the child’s age and developmental capacities; and whether or not the child’s developmental status in key domains is consistent with age and/or ability-appropriate expectations. This indicator applies only to children under the age of eight years and not attending school.
Indicator N
Unacceptable Acceptable
1 2 3 % 4 5 6 %
Early Learning & Development 10 0 0 2 20% 0 1 7 80%
Total - 0 0 2 20% 0 1 7 80%
Figure 18: “Early Learning & Development” QSR Results
Of the 14 cases with children under the age of eight, ten were applicable21 for review of the Early Learning and Development indicator (see Figure 18), of which, 80 percent were rated as acceptable. Reviewers reported that the children were developing appropriately and were on target with developmental milestones. Three children included in this measure were reported as attending “Head Start/Preschool.” The two cases with unacceptable ratings involved one child who had chronic physical health concerns and one of who has a diagnosed speech delay.
21 The four inapplicable cases involved children who were formally enrolled in kindergarten.
Early Learning &
Development
80%
20%

Quality Service Review Prepared by Hornby Zeller Associates, Inc. Allegheny County Page 24 April 2012
Indicator 7b: Academic Status A child/youth is expected to be actively engaged in developmental, educational, and/or vocational processes that will enable him or her to build skills and functional capabilities at a rate and level consistent with his/her age and abilities. This indicator assesses the degree to which the child/youth is regularly attending school; is placed in a grade level consistent with age or developmental level; is actively engaged in instructional activities; is reading at grade level or Individualized Education Plan (IEP) expectation level; and is meeting requirements for annual promotion and course completion leading to a high school diploma or equivalent. This indicator applies to a child/youth eight years or older or attending school.
Indicator N
Unacceptable Acceptable
1 2 3 % 4 5 6 %
Academic Status 9 0 0 4 44% 1 2 2 56%
Total - 0 0 4 44% 1 2 2 56%
Figure 19: “Academic Status” QSR Results
The frequency of ratings for the Academic Status indicator is displayed in Figure 19. The academic status was considered acceptable for a little over half (56%) of the applicable cases. Of the two children/youth enrolled in primary school settings, one child/youth has attended the same school since kindergarten, and the other child/youth has an IEP, receives specialized services, and benefits from his mother’s participation in every IEP meeting. For children/youth who reside in out-of-home care, one child/youth is placed with kin, and the other two children/youth are placed in therapeutic foster homes where they receive individualized services to support their mental health and intellectual disability. All four unacceptable ratings involved out-of-home cases. Though the rating was unacceptable in one of the four cases due to the child/youth’s poor academics and behaviors, reviewers noted that the school and teachers were working with the child/youth to create an atmosphere that promoted academic success by moving the child/youth to a physically smaller classroom with fewer students. These changes were cited as the cause of improvement in the child/youth’s academic and behavioral performance. In another case, a child/youth was reported as “gifted” by her teachers but had also been suspended from school, while another youth attending community college was also suspended from a nursing program due to frequent absences. Lastly, one child/youth’s rating was “unacceptable” due to needing an Individual Educational Plan (IEP). Figure 20 shows the frequency of children/youth attending different educational settings. Nine of the sample children/youth are enrolled in school; of those, three were reported to have
Academic Success
56%
44%

Quality Service Review Prepared by Hornby Zeller Associates, Inc. Allegheny County Page 25 April 2012
“school related problems” identified as a stressor. These stressors may be at the root of the suspensions reported in two out-of-home cases.
Educational Situation
In-home Out-of-home Combined Total
# % # % # %
Regular K-12 Education22
1 50% 4 57% 5 56%
Alternative Education 0 0% 2 29% 2 22%
Part-Time Special Education 1 50% 0 0% 1 11%
None (No school setting) 0 0% 1 14% 1 11%
Total 2 100% 7 100% 9 100%
Figure 20: Educational Situation of the Focus Child/Youth
Two of the children/youth from in-home cases had school performance issues that may have warranted consideration for IEPs but only one was found to have a current IEP at the time of the review. An additional seven children in out-of-home cases were assessed as warranting consideration for IEPs but only three were found to have a current IEP at the time of the review.
Indicator 8: Pathway to Independence The goal of assisting youth is to build the capacities that will enable them to live safely and function successfully and independently, consistent with their ages and abilities, following the conclusion of youth services. This indicator assesses the degree to which the youth is gaining the skills, education, work experience, connections, relationships, income, housing, and necessary capacities for living safely and functioning successfully independent of the agency’s services, and is developing long-term connections and informal supports that will support him/her into adulthood. This indicator applies to any youth who is age 16 or older and it looks at outcomes beyond formal independent living services.
Indicator N
Unacceptable Acceptable
1 2 3 % 4 5 6 %
Pathway to Independence 4 1 1 1 75% 1 0 0 25%
Total - 1 1 1 75% 1 0 0 25%
Figure 21: “Pathways to Independence” QSR Results
22 The child/youth from an out-of-home case was reported to be enrolled in an “other” educational setting. The reviewers reported it as an “approved private school”. Since the child/youth is attending 12th grade this case is being placed in the “regular K-12 education” setting for this report.
Pathway to
Independence
25%
75%

Quality Service Review Prepared by Hornby Zeller Associates, Inc. Allegheny County Page 26 April 2012
As seen in Figure 21, only one of the four qualifying cases (25%) was rated as acceptable for the Pathway to Independence indicator. Reviewers noted a variety of reasons for the unacceptable ratings for the other three cases. In one instance it was unclear if the youth was planning to remain in care past his/her 18th birthday. In another instance, the youth had incurred heavy restitution fines which will most likely result in a "lien/judgment against him/her for the amount owed in restitution," impairing his/her ability to obtain housing and utilities, even beyond his/her 21st birthday. Lastly, one youth’s emotional well-being has declined to the point that group homes and independent living settings may not be appropriate settings for his/her next placement. Reviewers proposed a lack of engagement or inconsistent assessment and understanding of the youth as they move towards independence may contribute to the uncertainty of the older youth’s readiness to live independently. Participants of the Caseworkers' Focus Group recommend that youth 18 and older remain in care and take advantage of the “contracts” that enable the youth to get a head start in college by offering the youth stability and support.
PARENT/CAREGIVER FUNCTIONING The following indicator evaluates the capacity of the child/youth’s caregivers (both familial and substitute) to provide support to the child/youth.
Indicator 9: Parent/Caregiver Functioning Parents/caregivers should have and use the necessary levels of knowledge, skills, and situational awareness to provide their child/youth with nurturance, guidance, age-appropriate discipline, and supervision necessary for protection, care, and normal development. Understanding the basic developmental stages that a child/youth experiences, relevant milestones, expectations, and appropriate methods for shaping behavior are key to parental capacity to support their child/youth’s healthy growth and learning. This indicator assesses the degree to which the parent(s), other significant adult(s) and/or substitute caregiver(s), is/are willing and able to provide the child/youth with the assistance, protection, supervision, and support necessary for daily living. If added supports are required in the home to meet the needs of the child/youth and assist the parent(s) or caregiver(s), those added supports should also meet the child/youth’s needs.

Quality Service Review Prepared by Hornby Zeller Associates, Inc. Allegheny County Page 27 April 2012
Mother Father Substitute Caregiver Other
Sub-indicator N
Unacceptable Acceptable
1 2 3 % 4 5 6 %
Mother 18 2 4 6 67% 3 3 0 33%
Father 6 1 0 2 50% 2 1 0 50%
Substitute Caregiver 11 0 0 1 9% 2 5 3 91%
Other 2 0 1 0 50% 1 0 0 50%
Total - 3 5 9 46% 8 9 3 54%
Figure 22: “Caregiver Functioning” QSR Results
As seen in Figure 22, overall, the functioning of the parent/caregiver was rated as acceptable for 54 percent of the sub-indicators. The “mother’s caregiver functioning” was less likely to be rated as acceptable (33%) than the “father’s caregiver functioning” (50%). While the rating for the caregiving function of fathers was rated as unacceptable in half of the applicable cases, many fathers in Allegheny County are demonstrating capacity as positive primary caregivers. In one out-of-home case, the father had managed to achieve service goals while incarcerated, with the exception of securing permanent housing. Once housing is secured, the father will be able to offer permanency to his child/youth. In a second case, an incarcerated father consistently writes to his daughter and sincerely wishes to build a relationship with his daughter although at this point the daughter has refused to answer any of his letters. He has also stated his desire for the daughter’s paternal grandmother to be involved once he is released from prison. Fathers from in-home cases have also taken on the challenge of becoming primary caregivers. In fact, in one case the mother’s fiancé (rated as an “other” caregiver) acted as a primary caregiver to the child/youth and his/her siblings. Reviewers reported that he is an excellent and willing caregiver who loves the child/youth as if she were his own. The identification of fathers who have become strong primary caregivers is in contrast to what was learned via the Caseworkers' Focus Group. Caseworkers stated fathers often deny paternity and/or do not take responsibility for caregiving or other family responsibilities. Participants in both the Supervisors' and Caseworkers' Focus Groups agreed that mothers can often be a direct barrier to fathers’ involvement in their children/youth’s lives. It was
33%
67% 50% 50% 91%
9%
50% 50%

Quality Service Review Prepared by Hornby Zeller Associates, Inc. Allegheny County Page 28 April 2012
acknowledged that the system is “too mother-driven;” according to the Fathers' Focus Group, mothers are preferred over fathers for reunification. Among cases with unacceptable ratings, mothers were most often reported to be inconsistent and sporadic in their parenting. Reviewers noted one mother from an out –of-home case was an “excellent caregiver” but due to struggles with substance abuse, she had difficulty being a consistent provider for her children/youth. Due to histories of drug use, many mothers acknowledged they have had little to no role in raising their children/youth. One foster mother attempts to mentor a biological mother to improve her parenting. This gesture is helpful and appreciated by the mother and other team members as foster mother identified mother’s need to build confidence in her parenting skills and has made herself available as a resource/informal support.

Quality Service Review Prepared by Hornby Zeller Associates, Inc. Allegheny County Page 29 April 2012
PRACTICE PERFORMANCE STATUS DOMAIN
The Practice Performance Domain section examines the twelve indicators used to assess the status of core practice functions. These indicators generally focus on the past 90 days from the date of the on-site review, unless otherwise indicated.
Indicator 1a: Engagement Efforts For this indicator the central focus is on the diligence shown by the team in taking actions to find, engage, and build a rapport with the child/youth and families and overcoming barriers to families' participation. This indicator assesses the degree to which those working with the child/youth and his/her family (parents and other caregivers) are:
Finding family members who can provide support and permanency for the child/youth;
Developing and maintaining a culturally competent, mutually beneficial trust-based working relationship with the child/youth and family;
Focusing on the child/youth and family's strengths and needs;
Being receptive, dynamic, and willing to make adjustments in scheduling and meeting locations to accommodate family participation in the service process, including case planning; and
Offering transportation and childcare supports, where necessary, to increase family participation in planning and support efforts.
Child/Youth Mother Father Substitute Caregiver Other
73%
27%
67%
33% 31%
69% 75%
25%
60%
40%

Quality Service Review Prepared by Hornby Zeller Associates, Inc. Allegheny County Page 30 April 2012
Sub-indicator N
Unacceptable Acceptable
1 2 3 % 4 5 6 %
Child/Youth 11 0 2 1 27% 4 2 2 73%
Mother 18 0 2 4 33% 6 4 2 67%
Father23
13 2 2 4 69% 3 1 1 31%
Substitute Caregiver 12 0 1 2 25% 2 5 2 75%
Other 5 0 2 1 40% 1 1 0 60%
Total - 2 9 12 39% 16 13 7 61%
Figure 23: “Engagement Efforts” QSR Results
Figure 23 gives the frequency of ratings for the Engagement Efforts indicator. The majority of cases for this indicator were rated as acceptable across four of the five sub-indicators. Engagement efforts were more likely to be rated as acceptable for the children/youth (73%) and substitute caregivers (75%). Based on the earlier discussion, it is not surprising that mothers were much more likely to be engaged (67%) than fathers (31%). Fathers were not engaged for a variety of reasons; however, in three cases the fathers expressed desire to be active members in the case. These fathers feel they are not considered a part of the case and have to get updated case information from the mothers or other family members. One father stated he had been engaged until just recently, after he turned down a housing option. According to the reviewers, the county was concerned the father refused the housing option because he was concerned about the responsibility and his capacity to parent his son as a single father, as the child/youth’s mother was incarcerated. If the county had engaged the father further they may have been able to encourage the father to meet this goal and provide him with appropriate supports to be able to parent the child/youth with the assistance of formal and informal supports. While children/youth were more likely to be engaged than their fathers, one youth from an out-of-home case reported having been in care for nearly three years and has had only two meetings with the assigned caseworker. The youth did note, however, that he/she had regular visits from her kinship caregiver provider. Mothers who reported a lack of engagement with their caseworkers stated they would obtain updates on the case from other family members, such as grandparents, who were in regular contact with the team members. Participants of the Supervisors' Focus Group suggested that increased bureaucracy and paperwork reduce the availability of the caseworker to engage with families one-on-one. Additionally, caseworkers face a number of challenges when attempting to engage with
23 Although there are 13 fathers rated under this indicator, only four fathers were rated under the caregiver functioning indicator. The discrepancy is due to the indicators being measured over different number of days. Caregiver Functioning is measured over the past 30 days but Engagement Efforts is over the past 90 days.

Quality Service Review Prepared by Hornby Zeller Associates, Inc. Allegheny County Page 31 April 2012
incarcerated parents, e.g., visiting hours and early arrival requirements which are difficult to comply with, as well as frequently changing penitentiary policies.
Indicator 1b: Role & Voice The family change process belongs to the family. The child/youth and family should have a sense of personal ownership in the plan and decision process. Service arrangements should build on the strengths of the child/youth and family and they should reflect their strengths, views and preferences. This indicator assesses the degree to which the child/youth, parents, family members, and caregivers are active, ongoing participants (e.g., having a significant role, voice, choice, and influence) in shaping decisions made about the child/youth and family strengths and needs, goals, supports, and services.
Child/Youth Mother Father Substitute Caregiver Other
Sub-indicator N
Unacceptable Acceptable
1 2 3 % 4 5 6 %
Child/Youth 9 1 2 1 44% 2 2 1 56%
Mother 18 2 1 4 39% 4 5 2 61%
Father 13 4 3 3 77% 2 1 0 23%
Substitute Caregiver 12 1 0 1 17% 2 4 4 83%
Other 5 1 2 0 60% 1 1 0 40%
Total - 9 8 9 46% 11 13 7 54%
Figure 24: “Role & Voice” QSR Results
Figure 24 gives the frequency of ratings for the Role and Voice indicator. Just over half (54%) of the cases for this indicator were rated as acceptable across three of the five sub-indicators. Role and Voice was more likely to be rated as acceptable for the substitute caregivers (83%) and mothers (61%). The proportion of acceptable ratings for three of the sub-indicators, specifically children/youth, mothers and fathers, were lower for the role and voice indicator as compared to the engagement indicator, suggesting that even those who are engaged may not be given the opportunity to fully participate or be heard. This is especially disconcerting considering two of the four cases with unacceptable ratings involved older youth who reported they did not feel
56%
44%
61%
39% 23%
77% 83%
17%
40% 60%

Quality Service Review Prepared by Hornby Zeller Associates, Inc. Allegheny County Page 32 April 2012
they had any say in their case planning and are also two of the cases with an unacceptable rating for the Pathway to Independence indicator. Reviewers noted a mother from an out-of-home case had a role and voice but attributed this to the foster mother advocating for the mother and prompting the mother to speak up and have her opinion heard. Other mothers and fathers were reported as having “a lack of interest” in their children/youth’s case and did not wish to participate. Reviewers and caseworkers, alike, agree that Family Group Decision-Making should be utilized to a greater degree because it gives families more control by allowing them to gain a greater role in the decision making process.
More than once a week Once a week
Less than once a week
Less than twice a month
Less than once a month Never
Combined Total of Applicable
Cases
# % # % # % # % # % # % # %
In-home
Child 2 29% 1 14% 4 57% 0 0% 0 0% 0 0% 7 100%
Mother 2 29% 1 14% 4 57% 0 0% 0 0% 0 0% 7 100%
Father 0 0% 1 17% 1 17% 0 0% 1 17% 3 50% 6 100%
Out-of-home
Child 1 8% 2 17% 1 8% 6 50% 2 17% 0 0% 12 100%
Mother 1 9% 0 0% 1 9% 3 27% 6 55% 0 0% 11 100%
Father 0 0% 0 0% 1 13% 0 0% 3 38% 4 50% 8 100%
Combined
Child 3 16% 3 16% 5 26% 6 32% 2 11% 0 0% 19 100%
Mother 3 17% 1 6% 5 28% 3 17% 6 33% 0 0% 18 100%
Father 0 0% 1 7% 2 14% 0 0% 4 29% 7 50% 14 100%
Figure 25: Caseworker Visits
The frequency of visits between the caseworkers (or other responsible parties) and the focus children/youth was found to be sufficient to address the issues pertaining to the safety, permanency and well-being of the focus children/youth and to promote the achievement of case plan goals in six of the seven in-home cases. In 11 of the 12 out-of-home cases the frequency of visits between the caseworkers (or other responsible parties) and the children/youth was reported as sufficient. The frequency of visits between the caseworkers (or other responsible parties) and the mothers was more likely to be considered sufficient in the in-home cases (six of the seven applicable cases) compared to the applicable out-of-home (seven of the 11 cases). The results for the fathers were not as favorable. In two of the five applicable in-home cases, the frequency of visits between the caseworkers (or other responsible parties) and the fathers was reported as being sufficient to address issues pertaining to the safety, permanency and well-being of the children/youth and to promote the achievement of case goals. In only one of the seven applicable out-of-home cases was the frequency of visits between the caseworkers (or other responsible parties) and the fathers reported as sufficient.

Quality Service Review Prepared by Hornby Zeller Associates, Inc. Allegheny County Page 33 April 2012
There was at least one other child/youth residing in the home in six of the seven in-home cases reviewed. Of the 12 additional children/youth in the home, two were visited by a caseworker more than once a week, one was visited once a week, five were visited less than once a week but more than twice a month, and four were visited less than twice a month but at least once a month. Visits were found to be sufficient to address the issues pertaining to their safety, permanency and well-being and to promote the achievement of permanency goals for eight of the 12 (67%) additional children/youth.
Indicator 2: Teaming This indicator focuses on the formation and functional performance of the family team in conducting ongoing collaborative problem solving, providing effective services, and achieving positive results with the child/youth and family. This indicator assesses the degree to which appropriate team members have been identified and formed into a working team that shares a common “big picture” understanding and long-term view of the child/youth and family. Team members should have sufficient professional knowledge, skills, and cultural awareness to work effectively with the child/youth and family. Members of the team should demonstrate a pattern of working effectively together to share information, plan, provide, and evaluate services for the child/youth and family. This indicator examines and evaluates the formation of the team, and the functioning of the team as two separate components.
Sub-indicator N
Unacceptable Acceptable
1 2 3 % 4 5 6 %
Formation 19 1 2 5 42% 4 6 1 58%
Functioning 19 1 3 8 63% 2 2 3 37%
Total - 2 5 13 53% 6 8 4 47%
Figure 26: “Teaming” QSR Results
In less than half (47%) of the cases reviewed was the overall Teaming indicator rated as acceptable. The “Formation” indicator was rated as acceptable (58%) for a higher proportion of cases than the “Functioning” (37%) indicator, meaning, when teams did form, they were not likely to function successfully. Reviewers rated 43 percent of the in-home cases as unacceptable for both sub-indicators – “Formation” and “Functioning.” A lack of communication among team members and lack of inclusion with all formal supports as team members were identified most often as the reason for the unacceptable team functioning.
Formation Functioning
58%
42%
37% 63%

Quality Service Review Prepared by Hornby Zeller Associates, Inc. Allegheny County Page 34 April 2012
For out-of-home cases, 42 percent of the cases were rated as unacceptable overall for teaming; of which, three cases (25%) were rated as unacceptable under “Functioning” while being rated as acceptable under “Formation,” again indicating teams did not function well. A lack of teaming was a subject of discussion in the Supervisors' Focus Group, with participants’ noting many of the same issues found in the case reviews. Supervisors suggested a lack of teaming has resulted in a couple of issues: individuals with clashing personalities are not able to work well together and staff most familiar with the family are not able to contribute to decision making. Not surprisingly, adoption workers have found the lack of teaming to be difficult because they must work with both the biological and adoptive families. Participants in the Supervisors' Focus Group did state that, “DHS’ integrated focus has helped increase responsiveness from other offices within DHS” and, “certain areas of teaming have improved because of advocates.”
Indicator 3: Cultural Awareness & Responsiveness Making cultural accommodations may involve a set of strategies used by practitioners to individualize the service process to improve the “goodness-of-fit” between family members and providers who work together in the family change process. The term “culture” is broadly defined; focus is placed here on whether the child/youth’s and family's culture has been assessed, understood, and accommodated. This indicator assesses the degree to which any significant cultural issues, family beliefs, and customs of the child/youth and family have been identified and addressed in practice (e.g., culture of poverty, urban and rural dynamics, faith and spirituality and youth culture). It examines if the natural, cultural, or community supports, appropriate for this child/youth and family, are being provided; and, if necessary, supports and services provided are being made culturally appropriate via special accommodations in the engagement, assessment, planning, and service delivery processes in use among the child/youth and family.
Child/Youth Mother Father
89%
11%
83%
17%
38% 62%

Quality Service Review Prepared by Hornby Zeller Associates, Inc. Allegheny County Page 35 April 2012
Sub-indicator N
Unacceptable Acceptable
1 2 3 % 4 5 6 %
Child/Youth 19 0 1 1 11% 7 3 7 89%
Mother 18 0 2 1 17% 6 6 3 83%
Father 13 3 1 4 62% 2 1 2 38%
Total - 3 4 6 26% 15 10 12 74%
Figure 27: “Cultural Awareness & Responsiveness” QSR Results
The Cultural Awareness indicator was rated as acceptable in 74 percent of the cases, as seen in Figure 27. Reviewers reported that when cultural aspects of the case were identified, they were generally addressed. The greatest impact on meeting the cultural needs of the children/youth comes from fit and willing relatives identified by the county as kinship homes, as was seen in a third of the out-of-home cases. Unacceptable ratings for the cultural awareness and responsiveness of fathers were attributed mostly to a lack of engagement with the fathers, as evidenced in each of the eight cases. In two cases (one in-home and one out-of-home), the fathers’ whereabouts were unknown to the county for the majority of the review period. In both cases the father was located and the county was making efforts to engage the fathers. Reviewers reported the fathers in two other out of home cases were “silent” in the case, meaning there is a lack of participation in assessments and services for fathers. The Supervisors' Focus Group noted that families become overwhelmed by policies and complicated paperwork. The former standard that all written documentation must be comprehensible to anyone with a 7th grade reading level is a policy that would help this situation; but, this standard is no longer employed.
Indicator 4: Assessment & Understanding Assessment involves understanding the core story of the child/youth and family and how the family reached its present situation. This story provides a framework for the family's history and is supplemented by the assessment/evaluation of the child/youth and family's current situation, environment, and support networks. This indicator assesses the degree to which the team has gathered and shared essential information so that members have a shared, big picture understanding of the child/youth’s and family's strengths and needs based on the underlying issues, safety threats/factors, risk factors, protective capacities, culture, hopes and dreams. It assesses the development of an understanding of what changes must take place in order for the child/youth and family to live safely together, achieve timely permanence, and improve the child/family's well-being and functioning. The team’s assessment and understanding of the child/youth and family situation should evolve throughout the family change process, and ongoing assessments of the child/youth and family situation should be used to better understand what modifications in planning and intervention strategies are needed to achieve sustainable, safe case closure.

Quality Service Review Prepared by Hornby Zeller Associates, Inc. Allegheny County Page 36 April 2012
Child/Youth Mother Father Substitute Caregiver
Sub-indicator N
Unacceptable Acceptable
1 2 3 % 4 5 6 %
Child/Youth 19 0 2 1 16% 6 7 3 84%
Mother 18 1 4 2 39% 5 5 1 61%
Father 13 4 3 2 77% 2 1 1 23%
Substitute Caregiver 11 0 1 1 18% 4 1 4 82%
Total - 5 10 6 34% 17 14 9 66%
Figure 28: “Assessment & Understanding” QSR Results
As seen in Figure 28, the Assessment and Understanding indicator was rated as acceptable for 66 percent of the cases reviewed. In 92 percent of the out-of-home cases and 63 percent of the in-home cases, the assessment and understanding for the child/youth was rated within the acceptable range. Substitute caregivers in out-of-home cases were significantly more likely than parents to have an acceptable rating. Two thirds of substitute caregivers were rated a four or higher which is greater than the ratings of fathers and mothers combined at 17 and 42 percent, respectively. With in-home cases, three fourths of mothers were rated within the acceptable range which is greater than the number of child/youth. As it relates to fathers, this indicator was rated as unacceptable in 77 percent of the applicable cases while it was rated as unacceptable in only 39 percent of the cases relating to mothers. Reviewers noted that the lack of assessment and understanding was tied to not engaging the family, especially fathers and giving them a role and voice. Reviewers noted a lack of assessment of all concerned parties within a case. In an out-of-home case the father’s girlfriend provided the primary caregiving during the day but she had not been assessed or engaged by the team. One father from an in-home case who stated he was eager to be involved and participate in the case has never been evaluated by the team. Even when assessments are conducted and appropriate services are offered, the recipient may often feel overwhelmed with the sheer number of overlapping visits and appointments they are expected to attend, as was expressed by one mother from an out-of-home case. Part of assessing the family is managing the services by keeping them to a realistic number.
Indicator 5: Long-term View
84%
16%
61%
39% 23%
77% 82%
18%

Quality Service Review Prepared by Hornby Zeller Associates, Inc. Allegheny County Page 37 April 2012
Having a long-term view of a better life enables the child/youth, family, and those helping them to see both the next steps forward and the end-points on the horizon that provide a clear vision of the pathway ahead. This indicator focuses on the specification and use of the capacities and conditions that must be attained by the child/youth and family (birth, adoptive, or guardianship) to achieve stability, adequate functioning, permanency, and other outcomes necessary to achieve their desired improvements and goals. This indicator assesses the degree to which there is a guiding strategic vision shared by the family team, including the parents and child/youth, which describes:
The purpose and path of interventions for achieving safe case closure;
The capacities and conditions necessary for safe case closure; and
The family’s knowledge and supports to sustaining those capacities and conditions following safe case closure with child welfare intervention.
Indicator N
Unacceptable Acceptable
1 2 3 % 4 5 6 %
Long-Term View 19 0 2 6 42% 3 6 2 58%
Total - 0 2 6 42% 3 6 2 58%
Figure 29: “Long-term View” QSR Results
Figure 29 gives the frequency of ratings for the Long-term View indicator. In 58 percent of all cases reviewed this indicator was rated as acceptable. Reviewers attribute the unacceptable ratings to a lack of teaming and communication. A lack of communication among team members and delays in paperwork, such as permanency goal changes, were found to impact the long term view of cases. According to participants in the Caseworkers' Focus Group, the primary and concurrent goals are often contradictory which confuses the family and the focus of the case plan. The group further reported, “Not all caseworkers are looking for permanent placements even when the goal is not reunification.”
Indicator 6: Child/Youth & Family Planning Process Planning is an ongoing team-based process for specifying and organizing intervention strategies and directing resources toward the accomplishment of defined outcomes set forth in the long-term view for the child/youth and family. This indicator assesses:
Long-Term View
58%
42%

Quality Service Review Prepared by Hornby Zeller Associates, Inc. Allegheny County Page 38 April 2012
The degree to which the planning process is individualized and matched to the child/youth’s and family’s present situation, preferences, near-term needs and long-term view for safe case closure; and
Provides a combination and sequence of strategies, interventions, and supports that are organized into a holistic and coherent service process providing a mix of services that fits the child/youth’s and family's evolving situation so as to maximize potential results and minimize conflicts and inconveniences.
Child/Youth Mother Father Substitute Caregiver
Sub-indicator N
Unacceptable Acceptable
1 2 3 % 4 5 6 %
Child/Youth 9 0 2 3 56% 1 1 2 44%
Mother 18 1 4 2 39% 5 5 1 61%
Father 13 2 6 1 77% 2 2 0 23%
Substitute Caregiver 12 0 1 3 33% 4 1 3 67%
Total - 3 13 9 48% 12 9 6 52%
Figure 30: “Child/Youth & Family Planning Process” QSR Results
As seen in Figure 30, reviewers rated the Child/Youth and Family Planning Process indicator as acceptable for 52 percent of the sub-indicators. Unacceptable ratings regarding the Child/Youth and Family Planning Process indicator appeared to be directly impacted by unacceptable progress planning for transitions and life adjustments. This was evidenced in the written case review summaries of the reviewers, which cited that the planning process was made more difficult, or in some cases, non-existent, due to lack of inclusivity of team members. Supervisors noted that the Family Service Plan is supposed to be the “roadmap” of the case but, instead, it focuses on the legal and administrative issues. These types of plans confuse the family and discourage participation.
Indicator 7: Planning for Transitions & Life Adjustments
44% 56% 61%
39% 23%
77% 67%
33%

Quality Service Review Prepared by Hornby Zeller Associates, Inc. Allegheny County Page 39 April 2012
A child/youth and family move through several critical transitions over the course of childhood and adolescence. Well-coordinated efforts in assisting the child/youth through significant transitions are essential for success. This indicator assesses the degree to which the current or next life change transition for the child/youth and family is being planned, staged, and implemented to assure a timely, smooth, and successful adjustment after the change occurs. Plans and arrangements should be made to assure a successful transition and life adjustment in daily settings. Well-planned follow-along supports should be provided during the adjustment period to ensure that successes are achieved in the home or school situation. Alternative timeframes are used for the ratings in this indicator. This indicator looks retrospectively over the past 90 days and prospectively over the next 90 days to assess the planning and transitioning through a significant life change and adjustment process of the child/youth and family.
Indicator N
Unacceptable Acceptable
1 2 3 % 4 5 6 %
Planning for Transitions & Life Adjustments 16 0 2 7 56% 4 1 2 44%
Total - 0 2 7 56% 4 1 2 44%
Figure 31: “Planning for Transitions & Life Adjustments” QSR Results
Figure 31 gives the frequency of ratings for the Planning for Transitions and Life Adjustments indicator. Reviewers rated this indicator as acceptable in 44 percent of the cases. Reviewers suggested that poor teaming, particularly in cases involving older youth, directly contributed to the unacceptable ratings. Reviewers also noted families were not being kept in the loop regarding major case decisions which did not allow them to prepare for major transitions and life adjustments. For example, the mother from an out-of-home case was unaware her parental rights were pending termination.
Indicator 8: Efforts for Timely Permanency
Planning for Transitions
& Life Adjustments
44% 56%

Quality Service Review Prepared by Hornby Zeller Associates, Inc. Allegheny County Page 40 April 2012
Conditions for timely permanence define requirements that have to be met in order for the child/youth to have a forever family with necessary supports to sustain the relationship once protective supervision ends. This indicator examines the pattern of diligent actions and the sense of urgency demonstrated by assigned team members. This indicator assesses the degree to which current efforts by system agents for achieving safe case closure (consistent with the long-term view) show a pattern of diligence and urgency necessary for timely attainment of permanency with sustained adequate functioning of the child/youth and family following cessation of protective supervision. This indicator looks at both efforts and timeliness. The “efforts” for achieving permanence are assessed for both out-of-home and in-home cases; however, the “timeliness” of achieving permanence is rated for out-of-home cases only and includes specific timeframes which reviewers must consider.
Sub-indicator N
Unacceptable Acceptable
1 2 3 % 4 5 6 %
Efforts 19 0 0 4 21% 8 4 3 79%
Timeliness 12 0 1 5 50% 4 2 0 50%
Total - 0 1 9 32% 12 6 3 68%
Figure 32: “Efforts for Timely Permanency” QSR Results
As seen in Figure 32, 68 percent of the ratings overall for the Efforts for Timely Permanency indicator were acceptable. The “Efforts” indicator (79%) was more likely to be rated as acceptable than was the “Timeliness” indicator (50%). Reviewers attributed the unacceptable ratings to the failure to establish concurrent goals in a timely manner and a lack of teaming, leading to team members’ pursuits of separate permanency goals. Caseworkers noted that time granted to parents to achieve reunification goals are often too long, requiring children/youth to wait for long periods of time for permanency while parents "take their time" to reunify with their children/youth. It was also suggested that fathers be taken more seriously in permanency planning.
Months In Care24
# %
0 - 6 3 25%
24 Time in care was calculated as the difference between the last removal date and the date of discharge or if the child was still in care, the difference between the last removal date and the first day of the Allegheny County QSR (February 21, 2012).
Efforts Timeliness
79%
21%
50% 50%

Quality Service Review Prepared by Hornby Zeller Associates, Inc. Allegheny County Page 41 April 2012
Months In Care24
# %
6.1 - 12 4 33%
12.1 - 24 2 17%
24.1 - 48 1 8%
More than 48 2 17%
Total 12 100%
Figure 33: Months In Care
Nearly 60 percent of the children/youth in the out-of-home sample have spent up to a year in care. Of the two children/youth that had been in care for more than four years, one was currently age seven and the other age 18.
Timeliness of Permanency Goals
In-home Out-of-home Combined Total
# % # % # %
Primary Goal Established Timely 7 100% 10 83% 17 89%
Concurrent Goal Established Timely - - 5 42% 5 26%
Total Cases 7 12 19
Figure 34: Timeliness of Permanency Goals of Focus Children/Youth
As well as reporting the primary and concurrent permanency goals of the cases reviewed, the timeliness25 in determining the goals was assessed (see Figure 34). In 17 of the 19 cases, the primary goal had been established in a timely manner. The county also performed well in establishing concurrent goals on time, when they were established at all. A concurrent permanency goal was reported for six of the 12 (50%) out-of-home cases, with five (83%) found to have been established in a timely manner.
Timely & Finalized Termination of Parental Rights
25 Goal established timely - For children who recently entered care, reviewers should expect the first permanency goal to be established no more than 60 days from the date of the child/youth’s entry into foster care consistent with the Federal requirement that a case plan be established within 60 days from the date of the child's entry into foster care. For children whose goal was changed from reunification to adoption, reviewers should consider the guidelines established by the Federal Adoption and Safe Families Act (ASFA) regarding seeking termination of parental rights, which might impact the timeliness of changing a goal from reunification to adoption. Reviewers should answer this question for all permanency goals in effect during the past 12 months. Reviewers should answer this question based on their professional judgment regarding the timeliness of establishing the goal, particularly with regard to changing a goal, and provide the rationale for their decision in their documentation.

Quality Service Review Prepared by Hornby Zeller Associates, Inc. Allegheny County Page 42 April 2012
Out-of-Home Cases
Yes No Compelling Reason
Given26
# % # % # %
TPR Filed Timely
Mother 1 50% 1 50% 1 100%
Father27
0 0% 1 100%
TPR Finalized
Mother 1 50% 1 50%
Father28
0 0% 1 100%
Figure 35: TPR Summary
Five of the 12 out-of-home cases involved a child/youth who had been in care for 15 of the last 22 months or met other Adoption and Safe Families Act (ASFA) criteria 29 for termination of parental rights. A petition for termination of parental rights was filed for only one of these cases, although the petition was not filed in a timely manner.30 Reviewers reported there was a compelling reason31 for not doing so in this case. The compelling reason given was that the “child's age, needs.”
Indicator 9: Intervention Adequacy & Resource Availability
26 Termination of Parental Rights Exceptions include: (1) at the option of the State, the child/youth is being cared for by a relative; (2) the agency has documented in the case plan a compelling reason for determining that TPR would not be in the best interests of the child/youth; or (3) the State has not provided to the family the services that the State deemed necessary for the safe return of the child/youth to the his/her home if reasonable efforts of the type described in Section 471(a)(15)(B)(ii) of the Social Security Act are required to be made with respect to the child/youth. 27 Biological father in one case was reported as deceased. 28 Biological father in one case was reported as deceased. 29 ASFA criteria - ASFA requires an agency to seek TPR under the following circumstances: The child has been in care for at least 15 of the most recent 22 months, or a court of competent jurisdiction has determined that: (1)the child is an abandoned child, or (2) the child's parents have been convicted of one of the felonies designated in Section 475(5)(E) of the Social Security Act, including: (a) committed murder of another child of the parent; (b) committed voluntary manslaughter of another child of the parent; (c) aided or abetted, attempted, conspired, or solicited to commit such a murder or such a voluntary manslaughter; or (d) committed a felony assault that resulted in serious bodily injury to the child or another child of the parent. 30 TPR filed timely - TPR is filed when the child has been in care for at least 15 of the most recent 22 months unless there are compelling reasons not to file. 31 TPR exceptions - Exceptions to the TPR requirement include the following: (1) at the option of the State, the child/youth is being cared for by a relative; (2) the agency has documented in the case plan a compelling reason for determining that TPR would not be in the best interests of the child/youth; or (3) the State has not provided to the family the services that the State deemed necessary for the safe return of the child/youth to the child/youth’s home if reasonable efforts of the type described in Section 471(a)(15)(B)(ii) of the Social Security Act are required to be made with respect to the child/youth.

Quality Service Review Prepared by Hornby Zeller Associates, Inc. Allegheny County Page 43 April 2012
To be adequate, the intensity and consistency of service delivery should be commensurate with that required to produce sustainable and beneficial results for the child/youth and family. An adequate, locally available array of services must exist in order to implement the intervention and support strategies planned for the child/youth and family. This indicator assesses the degree to which planned interventions, services, and supports being provided to the child/youth and family have sufficient power and beneficial effect to meet near-term needs and achieve the conditions necessary for safe case closure defined in the long-term view. Resources required to implement current child/youth and family plans should be available on a timely, sufficient, and convenient local basis.
Sub-indicator N
Unacceptable Acceptable
1 2 3 % 4 5 6 %
Adequacy 19 0 2 2 21% 7 4 4 79%
Availability 19 0 0 3 16% 2 6 8 84%
Total - 0 2 5 18% 9 10 12 82%
Figure 36: “Intervention Adequacy & Resource Availability” QSR Results
Figure 36 gives the frequency of ratings for the Intervention Adequacy and Resource Availability indicator. This indicator was rated as acceptable in 82 percent of ratings. Reviewers attributed the acceptable ratings to the services available county-wide. Domestic violence programs were utilized, though reviewers noted that some team members believed that parents’ completion of domestic violence classes would not impact the court’s decision for return to their care. Family counseling was made available even to families who were not geographically near the service. Caseworkers set up conference calls for the families and counselors to meet. While the ratings were overwhelmingly acceptable for this indicator, it should be noted that while resources are available in Allegheny County, reviewers proposed a lack of assessments and understanding of each family member may be at the root for case participants not receiving the services they need. Participants in the Supervisors' Focus Group reported that services deemed important by caseworkers are denied or not supported by staff that had responsibilities for service reauthorizations. Further, fathers’ programs are noted to be a valuable service, but supervisors suggested the need for more programs for fathers. Further, they shared that those that do exist do not take fathers who are challenged by mental health problems. Caseworkers stated that the information on resources is inadequate and outdated. They also noted an inadequate
Adequacy Availability
79%
21%
84%
16%

Quality Service Review Prepared by Hornby Zeller Associates, Inc. Allegheny County Page 44 April 2012
number of “good” drug and alcohol programs, citing "seven day detox" as the most commonly ordered resource but the least effective one.
Indicator 10: Maintaining Family Connections This indicator measures the quality of relationships between the child/youth and his/her family members and other important people in the child/youth’s life. The quality of these relationships depends on opportunities for positive interactions; emotionally supportive, mutually beneficial connections; and engaging in nurturing exchanges with one another. When this occurs, it promotes the preservation of families and the successful reunification of the child/youth and his/her parents. This indicator assesses the degree to which interventions are building and maintaining positive interactions and providing emotional support between the child/youth and his/her parents, siblings, relatives and other important people in the child/youth's life, when the child/youth and family members are temporarily living away from one another.
Mother Father Siblings Other
Sub-indicator N
Unacceptable Acceptable
1 2 3 % 4 5 6 %
Mother 12 1 2 0 25% 3 4 2 75%
Father 10 4 2 1 80% 1 2 0 20%
Siblings 7 2 2 1 71% 1 1 0 29%
Other 5 1 0 0 20% 2 2 0 80%
Total - 8 6 2 47% 7 9 2 53%
Figure 37: “Maintaining Family Connections” QSR Results
As seen in Figure 37, just over half (53%) of the ratings were acceptable for maintaining family connections. The county performed well at maintaining connections among the children/youth, their mothers and “other” family members, but performed significantly poorer at maintaining family connections with fathers and siblings. Reviewers noted that sometimes the family refused to maintain contact, such as an out-of-home case in which the father was incarcerated and refused all visits in prison. One child/youth in care has requested more visitations with his/her siblings, but the mother has become a barrier to this request. At the time of the review, the caseworker had not determined a resolution to this dilemma.
75%
25% 20%
80%
29%
71% 80%
20%

Quality Service Review Prepared by Hornby Zeller Associates, Inc. Allegheny County Page 45 April 2012
Both supervisors and caseworkers acknowledged that even if the fathers are “not good role models or placement options, many fathers are interested in being involved” in their children/youth’s lives, and visiting fathers often provides a therapeutic experience for the children/youth. Efforts to encourage maintaining connections with fathers, even those incarcerated, should be made. The supervisors' group noted that there is increased casework when a family served has multiple fathers to engage.
Child/Youth Placed with: # %
All Siblings 3 60%
Some Siblings 1 20%
All Siblings in Separate Foster Homes 1 20%
Total 32
5 100%
Figure 38: Sibling Placement
Figure 38 gives the frequency at which children/youth in out-of-home cases were placed in foster homes with their siblings. Among the five children/youth that have siblings who are also in care, three were reported to have been placed in the same home as all of their siblings. In one of the cases where the target child was not placed with his or her siblings, the sibling required a special placement to get appropriate care for serious physical needs. In the fifth case the child/youth was placed in a separate foster home than his/her only other sibling in-care; reviewers reported that the maternal grandmother who was providing a placement for the sibling was unable to provide care for more than one child/youth at time.
Indicator 11: Tracking & Adjusting An ongoing examination process should be used by the team to track service implementation, check progress, identify emergent needs and problems, and modify services in a timely manner. This indicator assesses the degree to which:
The team routinely monitors the child/youth’s and family's status and progress, interventions, and results and makes necessary adjustments;
32 Results are not cumulative. Reviewers were instructed to select the best option.
Tracking Adjustment
74%
26%
63%
37%

Quality Service Review Prepared by Hornby Zeller Associates, Inc. Allegheny County Page 46 April 2012
Strategies and services are evaluated and modified to respond to changing needs of the child/youth and family; and
Constant efforts are made to gather and assess information and apply knowledge gained to update planned strategies to create a self-correcting service process that leads to finding what works for the child/youth and family.
Sub-indicator N
Unacceptable Acceptable
1 2 3 % 4 5 6 %
Tracking 19 0 0 5 26% 7 4 3 74%
Adjustment 19 0 3 4 37% 5 6 1 63%
Total - 0 3 9 32% 12 10 4 68%
Figure 39: “Tracking & Adjusting” QSR Results
As seen in Figure 39, the Tracking and Adjustment indicator was rated as acceptable in 68 percent of ratings. “Tracking” (74%) was more likely than “Adjustment” (63%) to be rated as acceptable. Reviewers directly attributed the acceptable scores to successful team formation (by including key stakeholders), and team functioning (by making all team members aware of the changing specifics of the case).
ADDITIONAL ORGANIZATIONAL CONSIDERATIONS

Quality Service Review Prepared by Hornby Zeller Associates, Inc. Allegheny County Page 47 April 2012
Further input was gathered, beyond that noted earlier, from the participants of three Focus Groups33 who were asked questions regarding the agency, the agency’s practice and how to improve outcomes for the children, youth and families served by Allegheny County CYF. Additional trends that were identified are as follows.
Organizational Structure: o Administrators who are make decisions are removed from the day-to-day issues
that staff encounter; input from caseworkers is often discouraged and discounted. Overall, there is a communication breakdown between staff and administration.
o Caseloads are uneven among regional offices, with some caseworkers described as being overwhelmed and others having more manageable caseloads.
o The caseworker position is extremely stressful and demanding, and recognition of balance between work and life balance is lacking.
o Caseworkers feel underappreciated and devalued.
Policies and Procedures: o Administrative requirements continue to be added which result in more time
consuming casework, but old requirements are never eliminated. The extra paperwork is burdensome and takes away from assisting families in an individualized manner.
o All policies are considered a “priority”, which means nothing is a priority; i.e., everything from voter’s registration, locating fathers and education are priorities, and there is no room to prioritize tasks da- to-day. Further, staff are not permitted to exercise discretion when applying certain policies. It is felt this “one size fits all” mentality is not productive.
Human Resources/Work Force: o Supervisors and caseworkers agree that their positions provide stability in
employment, good pay and benefits, and opportunities to make a difference in the lives of the families they work with each day. While the pay is considered good, there is a disincentive for caseworkers to seek promotions to administrative positions due to the inability to earn overtime.
o Some staff find it difficult to “walk the line between policy and support.” o Caseworkers reported feeling that the training and mentoring of new staff could
benefit from improvement, particularly when it pertains to working with the
33 The three groups were comprised of caseworkers, supervisors, and fathers.

Quality Service Review Prepared by Hornby Zeller Associates, Inc. Allegheny County Page 48 April 2012
courts. Caseworkers stated that, immediately following training, they are expected to “hit the ground running” without any extra support.
Collaboration: o Parents are given multiple chances to correct their behavior while the
children/youth are bounced around whenever a placement or foster parent cannot handle their behavior.
o Staff are looking for enhanced supports in the courtrooms. Some staff feel that judges do not value the caseworkers’ input and that attorneys do not respond to the families.
o Contracted providers are not held to the same level of accountability as caseworkers.
o “Partners” take no responsibility for maintaining contact with the family.

Quality Service Review Prepared by Hornby Zeller Associates, Inc. Allegheny County Page 49 April 2012
QSR RESULTS SUMMARY
The QSR instrument uses a rating scale of 1 to 6 for each indicator. The percentages of cases rated as “acceptable” and “unacceptable” is calculated for each indicator, with scores between one and three representing the “unacceptable” range and scores between four and six representing the “acceptable” range.
Indicator % Unacceptable % Acceptable
Safety: Exposure to threats of harm 8% 92%
Safety: Risk to self and others 25% 75%
Stability 19% 81%
Living arrangement 15% 85%
Permanency 26% 74%
Physical health 21% 79%
Emotional well-being 21% 79%
Early learning and development 20% 80%
Academic status 44% 56%
Pathway to independence 75% 25%
Parent or caregiver functioning 46% 54%
Overall 24% 75%
Figure 40: “Child/Youth & Family Domain Ratings” QSR Results
Indicator % Unacceptable % Acceptable
Engagement efforts 39% 61%
Role & voice 46% 54%
Teaming 53% 47%
Cultural awareness & responsiveness 26% 74%
Assessment & understanding 34% 66%
Long-term view 42% 58%
Child/youth & family planning process 48% 52%
Planning for transitions & life adjustments 56% 44%
Efforts to timely permanence 32% 68%
Intervention adequacy & resource availability 18% 82%
Maintaining family relationships 47% 53%
Tracking and adjustment 32% 68%
Overall 39% 61%
Figure 41: “Practice Performance Domain Ratings” QSR Results
Figures 40 and 41 summarize the overall ratings for each of the indicators within the Child/Youth/Family Status Domain and the Practice Performance Status Domain. Sixty-six percent of the ratings overall were found to be acceptable. An acceptable rating was more likely to occur among indicators from the Child/Youth and Family domain (75%) than the Practice Performance domain (61%).

Quality Service Review Prepared by Hornby Zeller Associates, Inc. Allegheny County Page 50 April 2012
The following sections describe the indicators’ scores which are areas of strengths and those which are areas identified as needing improvement. Each of these sections is further broken out by the major themes identified by the type of rating. Areas of Strengths Safe and Healthy Children/Youth The Safety (both Exposure to Threats of Harm and Risk to Self and Others), Living Arrangement, Physical Health of the children/youth, and Emotional Well-being indicators were found to be appropriately addressed in the majority of the cases reviewed. These four indicators often complement one another in that children/youth living in appropriate living arrangements will likely be safe from harm and emotionally stable. Fathers as Primary Caregivers While reviewers only found in 50 percent of applicable cases that the father's caregiver functioning could be rated acceptably, these fathers are assessed as demonstrating greater capability than mothers (with only 33% of acceptable ratings for mother’s caregiver functioning). Of the applicable cases where fathers were present, they were involved in their children/youth’s lives more so than mothers. They show a willingness to acknowledge that services are needed, and work diligently to improve their family’s lives by complying with county recommendations. Even fathers who were not the primary caregivers were reported as making significant changes in their own behaviors for the sake of their children/youth’s well-being as well as being supportive of their children/youth who were working on improving their own behaviors. However, the lack of engagement and role and voice often were obstacles to the success of these fathers. Stability in Living Arrangements Overall, the county scored well on Stability and the appropriateness of the Living Arrangement. This was especially true for in-home cases where there were no immediate threats of removal. Though the stability indicator looks retrospectively over the past 12 months (as well as prospectively over the upcoming six months), 42 percent of children/youth from the out-of-home cases have been in care well over a year and have experienced placement instability. However, it appears the most recent living arrangement is offering stability for the majority of children/youth. Areas Needing Improvement Older Youth Significant improvement is needed for the Pathway to Independence indicator. Among the four applicable cases, over three-quarters of the sub-indicators were rated as unacceptable. The cases that were scored as unacceptable for the Pathway to Independence indicator were also likely to have the role and voice of the youth rated as unacceptable.

Quality Service Review Prepared by Hornby Zeller Associates, Inc. Allegheny County Page 51 April 2012
Another indicator with unfavorable overall ratings that may affect the Pathway to Independence score includes the Planning for Transition and Life Adjustments indicator. This indicator received an overall acceptable rating of 44 percent. The same cases in which the Pathway to Independence and the youth’s Role and Voice indicators were rated low were also rated low for the Planning for Transition and Adjustments indicator. Fathers Cases where a father was applicable to be rated as a subcategory (in the six Practice Performance indicators) were consistently rated lower than efforts taken on behalf of the mother. By improving the scores for Engagement and Role and Voice of the fathers, the overall score of fathers would improve dramatically, as the fathers’ needs and concerns would be better known to the agency and thus could be addressed more appropriately.
Practice Performance Indicators
Percentage of Acceptable Ratings
for Father Sub-Indicators
Percentage of Acceptable Ratings
for Mother Sub-Indicators
Engagement efforts 31% 67%
Role & voice 23% 61%
Cultural awareness & responsiveness 38% 83%
Assessment & understanding 23% 61%
Child/youth & family planning process 23% 61%
Maintaining family connections 20% 75%
Overall Score 32% 67%
Figure 42: Comparison of Acceptable Ratings for Mother and Father Sub-indicators
Teaming Teaming was rated as acceptable in only 47 percent of the cases reviewed and it was frequently cited in other indicators (four Practice Performance indicators) as a contributing factor for unacceptable ratings. Reviewers reported several other indicators would benefit by strengthening teaming. Reviewers agreed the county was having difficulty forming teams and, even when teams were formed, they were not likely to function. A lack of communication is often cited as the main factor in poor teaming. Considering parents and children/youth (when age appropriate) are meant to be participating members of teams, improving engagement with the families would only benefit the Teaming indicator.

Quality Service Review Prepared by Hornby Zeller Associates, Inc. Allegheny County Page 52 April 2012
KEY QUESTIONS FOR NEXT STEPS PLANNING
Outlined below are questions to consider when reviewing the QSR findings in conjunction with the agency’s next steps, as the purpose of these questions is to help move the agency forward toward the next step of the Continuous Quality Improvement process. The development of a County Improvement Plan (CIP) is aimed to help agencies drive organizational improvements by beginning with an analysis of strengths and needs. The QSR findings are one source of data that should be used in conjunction with other data available to the agency to assess where the county is and in what direction it would like to move to improve the outcomes for the children, youth and families that are served by the agency. Safety Questions 1. How did the agency’s actions impact the unacceptable (ratings 1-3) scores associated
with the safety related indicators?
2. What can the agency do to improve the safety related scores in the future?
3. How did the agency’s actions impact the acceptable (ratings 4-6) scores associated with
the safety related indicators?
4. How can the actions of the agency in the reviewed cases be generalized to other cases
to promote the quality casework seen in the review?
Permanency Questions 5. How did the agency’s actions impact the unacceptable (ratings 1-3) scores associated
with the permanency related indicators?
6. What can the agency do to improve the permanency related scores in the future?
7. How did the agency’s actions impact the acceptable (ratings 4-6) scores associated with
the permanency related indicators?
8. How can the actions of the agency in the reviewed cases be generalized to other cases
to promote the quality casework seen in the review?
Well-being Questions 9. How did the agency’s actions impact the unacceptable (ratings 1-3) scores associated
with the well-being related indicators?
10. What can the agency do to improve these well-being related scores in the future?
11. How did the agency’s actions impact the acceptable (ratings 4-6) scores associated with
the well-being related indicators?

Quality Service Review Prepared by Hornby Zeller Associates, Inc. Allegheny County Page 53 April 2012
12. How can the actions of the agency in the reviewed cases be generalized to other cases
to promote the quality casework seen in the review?
Parent/Caregiver Questions
13. How did the agency’s actions impact the unacceptable (ratings 1-3) scores associated
with the parent/caregiver functioning indicator?
14. What can the agency do to improve these scores in the future?
15. How did the agency’s actions impact the acceptable (ratings 4-6) scores associated with
the parent/caregiver indicator?
16. How can the actions of the agency in the reviewed cases be generalized to other cases
to promote the quality casework seen in the review?
Practice Performance Questions
17. How did the agency’s actions impact the unacceptable (ratings 1-3) scores associated
with the Practice Performance indicators?
18. What can the agency do to improve the practice performance related scores in the
future?
19. How did the agency’s actions impact the acceptable (ratings 4-6) scores associated with
the Practice Performance indicators?
20. How can the actions of the agency in the reviewed cases be generalized to other cases
to promote the quality casework seen in the review?
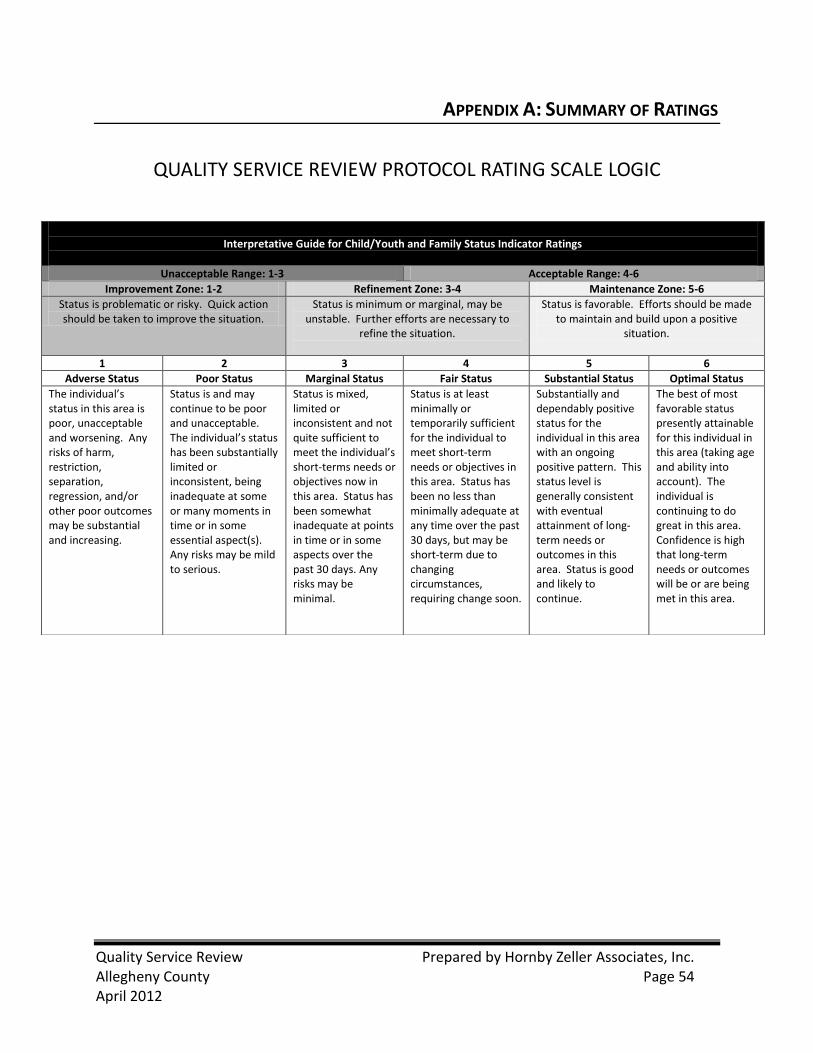
Quality Service Review Prepared by Hornby Zeller Associates, Inc. Allegheny County Page 54 April 2012
APPENDIX A: SUMMARY OF RATINGS
QUALITY SERVICE REVIEW PROTOCOL RATING SCALE LOGIC
Interpretative Guide for Child/Youth and Family Status Indicator Ratings
Unacceptable Range: 1-3 Acceptable Range: 4-6
Improvement Zone: 1-2 Refinement Zone: 3-4 Maintenance Zone: 5-6
Status is problematic or risky. Quick action should be taken to improve the situation.
Status is minimum or marginal, may be unstable. Further efforts are necessary to
refine the situation.
Status is favorable. Efforts should be made to maintain and build upon a positive
situation.
1 2 3 4 5 6
Adverse Status Poor Status Marginal Status Fair Status Substantial Status Optimal Status
The individual’s status in this area is poor, unacceptable and worsening. Any risks of harm, restriction, separation, regression, and/or other poor outcomes may be substantial and increasing.
Status is and may continue to be poor and unacceptable. The individual’s status has been substantially limited or inconsistent, being inadequate at some or many moments in time or in some essential aspect(s). Any risks may be mild to serious.
Status is mixed, limited or inconsistent and not quite sufficient to meet the individual’s short-terms needs or objectives now in this area. Status has been somewhat inadequate at points in time or in some aspects over the past 30 days. Any risks may be minimal.
Status is at least minimally or temporarily sufficient for the individual to meet short-term needs or objectives in this area. Status has been no less than minimally adequate at any time over the past 30 days, but may be short-term due to changing circumstances, requiring change soon.
Substantially and dependably positive status for the individual in this area with an ongoing positive pattern. This status level is generally consistent with eventual attainment of long-term needs or outcomes in this area. Status is good and likely to continue.
The best of most favorable status presently attainable for this individual in this area (taking age and ability into account). The individual is continuing to do great in this area. Confidence is high that long-term needs or outcomes will be or are being met in this area.

Quality Service Review Prepared by Hornby Zeller Associates, Inc. Allegheny County Page 55 April 2012
Interpretative Guide for Practice Performance Indicator Ratings
Unacceptable Range: 1-3 Acceptable Range: 4-6
Improvement Zone: 1-2 Refinement Zone: 3-4 Maintenance Zone: 5-6
Performance is inadequate. Quick action should be taken to improve practice now.
Performance is minimal or marginal and may be changing. Further efforts are necessary to
refine the practice situation.
Performance is effective. Efforts should be made to maintain and build upon a positive practice situation.
1 2 3 4 5 6
Adverse Practice Poor Practice Marginal Practice Fair Practice Substantial Practice Optimal Practice
Practice may be absent or not operative. Performance may be missing (not done). - OR - Practice strategies, if occurring in this area, may be contra-indicated or may be performed inappropriately or harmfully.
Practice at this level is fragmented, inconsistent, lacking necessary intensity, or off-target. Elements of practice may be noted, but it is incomplete/not operative on a consistent basis.
Practice at this level may be under- powered, inconsistent or not well-matched to need. Performance is insufficient for the individual to meet short-term needs or objectives. With refinement, this could become acceptable in the near future.
This level of performance is minimally or temporarily sufficient to meet short-term need or objectives. Performance in this area may be no less than minimally adequate at any time in the past 30 days, but may be short -term due to change circumstances, requiring change soon.
At this level, the system function is working dependably for this individual, under changing conditions and over time. Effectiveness level is consistent with meeting long-term needs and goals for the individual.
Excellent, consistent, effective practice for this individual in this function area. This level of performance is indicative of well-sustained exemplary practice and results for the individual.
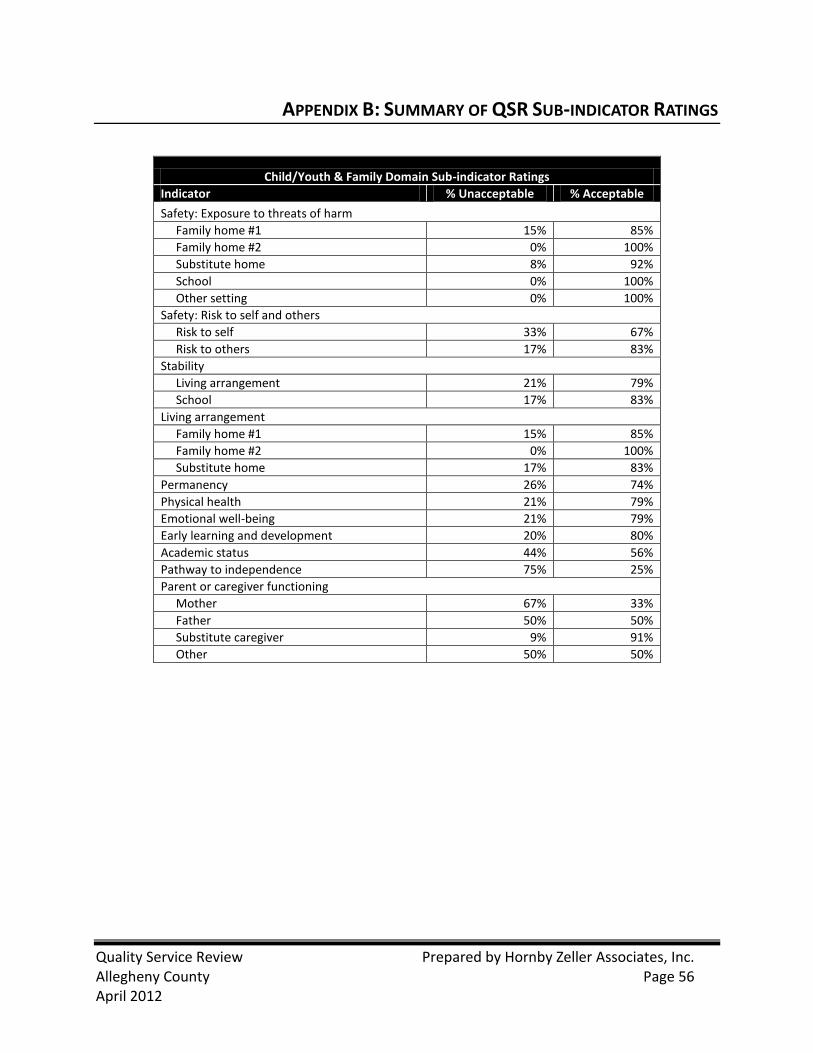
Quality Service Review Prepared by Hornby Zeller Associates, Inc. Allegheny County Page 56 April 2012
APPENDIX B: SUMMARY OF QSR SUB-INDICATOR RATINGS
Child/Youth & Family Domain Sub-indicator Ratings
Indicator % Unacceptable % Acceptable
Safety: Exposure to threats of harm
Family home #1 15% 85%
Family home #2 0% 100%
Substitute home 8% 92%
School 0% 100%
Other setting 0% 100%
Safety: Risk to self and others
Risk to self 33% 67%
Risk to others 17% 83%
Stability
Living arrangement 21% 79%
School 17% 83%
Living arrangement
Family home #1 15% 85%
Family home #2 0% 100%
Substitute home 17% 83%
Permanency 26% 74%
Physical health 21% 79%
Emotional well-being 21% 79%
Early learning and development 20% 80%
Academic status 44% 56%
Pathway to independence 75% 25%
Parent or caregiver functioning
Mother 67% 33%
Father 50% 50%
Substitute caregiver 9% 91%
Other 50% 50%

Quality Service Review Prepared by Hornby Zeller Associates, Inc. Allegheny County Page 57 April 2012
Practice Performance Domain Sub-indicator Ratings
Indicator % Unacceptable % Acceptable
Engagement efforts
Child/youth 27% 73%
Mother 33% 67%
Father 62% 38%
Substitute caregiver 25% 75%
Other 60% 40%
Role & voice
Child/youth 44% 56%
Mother 39% 61%
Father 77% 23%
Substitute caregiver 17% 83%
Other 60% 40%
Teaming
Formation 42% 58%
Functioning 63% 37%
Cultural awareness & responsiveness
Child/youth 11% 89%
Mother 17% 83%
Father 62% 38%
Assessment & understanding
Child/youth 16% 84%
Mother 39% 61%
Father 69% 31%
Substitute caregiver 18% 82%
Long-term view 42% 58%
Child/youth & family planning process
Child/youth 56% 44%
Mother 39% 61%
Father 69% 31%
Substitute caregiver 33% 67%
Planning for transitions & life adjustments 56% 44%
Efforts to timely permanence
Efforts 21% 79%
Timeliness 50% 50%
Intervention adequacy & resource availability
Adequacy 21% 79%
Availability 16% 84%
Maintaining family relationships
Mother 25% 75%
Father 70% 30%
Siblings 71% 29%
Other 33% 67%
Tracking & adjusting
Tracking 26% 74%
Adjusting 37% 63%