quantification of cerebral ventricle volume change of ...cychiu/papers/chenyspie2015.pdf · tapping...
TRANSCRIPT
Quantification of Cerebral Ventricle Volume Change ofPreterm Neonates Using 3D Ultrasound Images
Yimin Chena, Jessica Kishimotob, Wu Qiub, Sandrine de Ribaupierrec and Aaron Fensterb,Bernard Chiua
aDepartment of Electronic Engineering, City University of Hong Kong, Hong KongbRobarts Research Institute, Western University, London, Ontario, Canada
cDepartment of Clinical Neurological Science, Western University, London, Ontario, Canada
ABSTRACT
Intraventricular hemorrhage (IVH) is a major cause of brain injury in preterm neonates. Quantitative measurement of ventricular dilation or shrinkage is important for monitoring patients and in evaluation of treatment options. 3D ultrasound (US) has been used to monitor the ventricle volume as a biomarker for ventricular dilation. However, volumetric quantification does not provide information as to where dilation occurs. The location where dilation occurs may be related to specific neurological problems later in life. For example, posterior horn enlargement, with thinning of the corpus callosum and parietal white matter fibres, could be linked to poor visuo-spatial abilities seen in hydrocephalic children. In this work, we report on the development and application of a method used to analyze local surface change of the ventricles of preterm neonates with IVH from 3D US images. The technique is evaluated using manual segmentations from 3D US images acquired in two imaging sessions. The surfaces from baseline and follow-up were registered and then matched on a point-by-point basis. The distance between each pair of corresponding points served as an estimate of local surface change of the brain ventricle at each vertex. The measurements of local surface change were then superimposed on the ventricle surface to produce the 3D local surface change map that provide information on the spatio-temporal dilation pattern of brain ventricles following IVH. This tool can be used to monitor responses to different treatment options, and may provide important information for elucidating the deficiencies a patient will have later in life.
Keywords: Preterm neonate, cerebral ventricle, volume change, 3D ultrasound (US)
1. INTRODUCTION
Among very low birth weight, preterm neonates, the most common non-congenital cause of cerebral ventricledilation is intraventricular hemorrhage (IVH).1 Post-hemorrhagic ventricle dilation (PHVD), especially PHVDrequiring interventional therapies, such as ventricle tapping to remove excess cerebral spinal fluid (CSF) or asurgically inserted ’shunt’ (as in the case of hydrocephalus), is linked to specific neuropsychological impairments,such as visuo-spatial and motor deficits.2 There are currently no means of accurately predicting the severityof PHVD or determining if and when ventricular dilation requires treatment.3 Decision on interventions istypically based on clinical signs such as increased head circumference, bulging of the anterior fontanelle, alongwith increases in ventricle size measured by ultrasound (US) as well as symptoms of increased intracranialpressure (ICP), the latter of which tend to be non-specific in this patient population. Monitoring PVHD ina quantitative manner may assist clinicians in theirs decisions on whether or not to intervene in patients withdilated ventricles.
3D US has proven to be a reliable tool to measure the ventricle volume size4.5 However, there are differentialenlargement of specific parts of the ventricles over time, which cannot be identified by volume measurement alone.The analysis of local surface changes provides rich information that could explain some specific neurological andneuropsychological deficits seen in hydrocephalic patients such as those associated with visuo-spatial abilitiesand gross motor function6.78 While hypotheses have been proposed about the importance of white matterintegrity in the verbal and non-verbal developments of these hydrocephalic infants, there has been no studies,to our knowledge, on correlating the change of the ventricular shape segmented from 3D US to the deficits inintellectual developments of the hydrocephalic patients.
Medical Imaging 2015: Ultrasonic Imaging and Tomography, edited by Johan G. Bosch, Neb Duric, Proc. of SPIE Vol. 9419, 94190V · © 2015 SPIECCC code: 1605-7422/15/$18 · doi: 10.1117/12.2081470
Proc. of SPIE Vol. 9419 94190V-1
Downloaded From: http://proceedings.spiedigitallibrary.org/ on 01/21/2016 Terms of Use: http://spiedigitallibrary.org/ss/TermsOfUse.aspx

Manual Segmentationof Lateral Ventricle
- 3D SurfaceReconstruction
- Rigid Registrationof Surfaces
1- 3D SymmetricCorrespondence
- Mapping toTemplate Surface
Figure 1. Schematic diagram of the proposed algorithm.
In this work, we developed a method for quantifying the spatio-temporal changes of the cerebral ventriclesurfaces of IVH patients using 3D US. In addition, non-rigid point set registration was applied to map theproposed metric from different subjects together to make inter-subject comparison possible. Fig. 1 shows theschematic diagram of our proposed algorithm.
2. METHODS
2.1 3D US Image Acquisition
3D US images were acquired with a motorized 3D US system developed for cranial scanning of preterm neonatesin Neonatal Intensive Care Unit in University Hospital of The University of Western Ontario, which used anHDI 5000 (Philips, Bothel WA) and C8-5 (Philips, Bothel WA) curved array 5-8 MHz broadband transducer.5
To perform a scan, an US technician located the third ventricle, midline through the anterior fontanelle withthe patient inside an incubator, and then the 3D US system mechanically tilted the 2D transducer to acquire afull 3D image of the ventricular system. The 3D image sizes ranged from 300×300×300 to 450×450×450 voxelswith a voxel size of 0.22×0.22×0.22 mm3.
2.2 Manual Segmentation and 3D Surface Reconstruction
The cerebral lateral ventricles were manually segmented on a slice-by-slice basis using an in-house 3D viewingsoftware (3D Quantify, Robarts Research Institute, The University of Western Ontario, London, Canada). Atrained observer blinded to the image orders segmented each subject in parallel slices with 1mm interval. Theseplanar contours are reconstructed into a 3D surface based on the distance map of each contour.9 Specifically, amap showing the shortest signed distance from each point to the contour was generated in each transverse image.Points inside and outside the contour were respectively equipped with positive and negative values. Distancevalues at points between two adjacent transverse images were obtained by linearly interpolating distance mapson the transverse images. A marching cube algorithm was applied to extract zero level set of the distance mapto generate the 3D surface.10
2.3 3D Surface Change (∆S) Map
To compute the local difference between surfaces obtained at baseline and follow-up from the same subject,the iterative closest point (ICP) algorithm was applied to align two surfaces as shown in Fig. 2. Then, a 3Dsymmetric correspondence algorithm11 was used to match these two registered surfaces on a point-by-point basis.Specifically, the symmetric nearest neighbor correspondences between those two surfaces were established firstand then an interpolation process was applied to find the corresponding points for the points without symmetricnearest points. After that, a smoothing procedure was used to smooth those displacement fields connectingpairs of correspondence points. For each pair of corresponding points connected by the green arrow as shown inblue rectangle box of Fig. 2, we computed signed distance (∆S) between them, with positive values for surfacedilation and negative values for surface shrinkage.
2.4 Mapping to the template shape
Although ∆S can be mapped to the ventricle surface of a subject (3D ∆S map) to facilitate visualization andinterpretation, the shape of the 3D ∆S map is highly subject-specific. Quantitative point-by-point comparisonof ∆S between subjects was therefore not possible. To address this issue, a robust point set registration methodknown as coherent point drift (CPD) algorithm12 was applied to match the 3D ∆S maps of different subjects
Proc. of SPIE Vol. 9419 94190V-2
Downloaded From: http://proceedings.spiedigitallibrary.org/ on 01/21/2016 Terms of Use: http://spiedigitallibrary.org/ss/TermsOfUse.aspx

Figure 2. Rigid registration of the left cerebral ventricle surfaces of a subject with grade III IVH obtained at baselineand follow-up (red solid: surface at baseline and black mesh: surface at follow-up). Green arrows connect pairs ofcorresponding points.
to a template surface (selected from a set of surfaces from 3D US by a physician). Considering the point setX = (x1, . . . , xN ) ∈ IRN×D of template surface and point set Y = (y1, . . . , yM ) ∈ IRM×D of subject surface, weaimed to find a transformation f to make that:
f : X = Y + f(Y ) (1)
And a Gaussian mixture model (GMM) listed as below was established as the likelihood function to obtain theoptimal transformation:
p(X|Y, θ) =
N∏n=1
p(xn|Y, θ) =
N∏n=1
M∑m=1
πm
(2πσ2)D/2
e−||xn−ym−f(ym)||2
2σ2 (2)
where θ = {f, πm, σ2} is a set of unknown model parameters. πm is the prior probability and σ2 represents theisotropic variance of all GMM components. Expectation-Maximization was applied to maximize the likelihoodfunction and move the GMM centroids (subject surface) to point set of template surface as group coherently topreserve the topological structure of the point set.
Based on the registered surfaces from the CPD, we applied the 3D symmetric correspondence algorithmdescribed in Sec. 2.3 to generate an accurate point-by-point correspondence between the template and subjectsurface. As a result, the 3D ∆S map of each subject was mapped onto the template surface, making point-by-point comparison between 3D ∆S maps of different subjects possible.
3. RESULTS
We used cerebral ventricle 3D US images acquired from two subjects at two scanning sessions to verify theperformance of our algorithm and to demonstrate its application. Subject 1 diagnosed with severe IVH (gradeIII bilateral13) was not treated between two scanning sessions that were 3 days apart and ventricle dilation wasexpected. Table 1 shows the volume measurements of left and right lateral ventricle (LLV and RLV) at baselineand follow-up. Both the left and right ventricle of this subject show an increase in volume after three days. Inparticular, the volume of left ventricle increased by approximately 55%. Fig. 3 (a) and (b) show the histogramsof point-wise ∆S for LLV and RLV of Subject 1 respectively. Fig. 4 (a) shows the ventricle surface of this subjectat baseline with local surface change color-coded and superimposed. Point-wise ∆S was mapped to the templatesurface and displayed in Fig. 4 (b). We observed that the largest dilation was located in the posterior horn regionof the ventricle. For Subject 2, the left lateral ventricle had been drained of CSF during a tapping procedureafter the patient had become clinically symptomatic for raised ICP. 3D ultrasound images before and after the
Proc. of SPIE Vol. 9419 94190V-3
Downloaded From: http://proceedings.spiedigitallibrary.org/ on 01/21/2016 Terms of Use: http://spiedigitallibrary.org/ss/TermsOfUse.aspx
O
% o
f V
ertic
esU
iI
6) -
] i
\ l/ `
D O -
m_
4,_
O -
6) N
e."-
D-.
.U
) O
O
% o
f V
ertic
esN
AO
.IOo
.IO
.I
.
i i
m_
4,_
O
...--
^\`
DO N
O
% o
f V
ertic
esN
AO
.IOo
.IO
.I
.
4,_ . 6) Á
=I
= O
% o
f V
ertic
esN
NA
ON
8.T,'
Oo
OI
Oo
II
] = =e.
...\
CT
D..
U)
°- N 4,_ . -
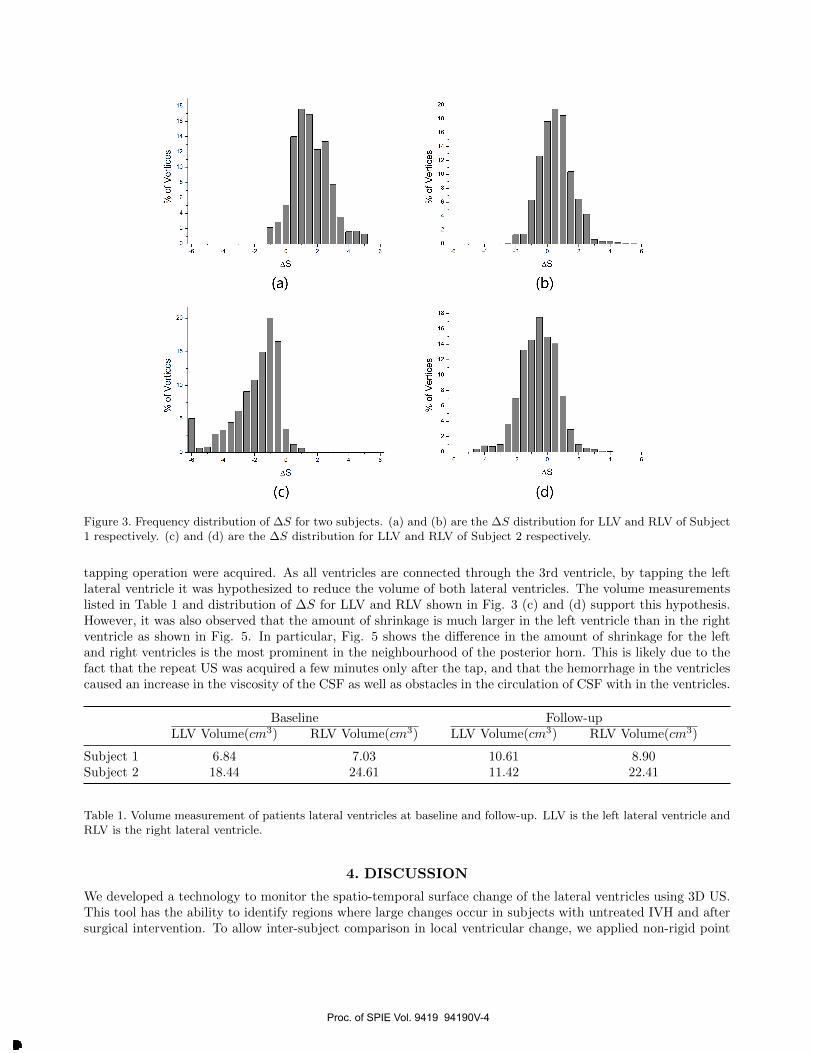
Figure 3. Frequency distribution of ∆S for two subjects. (a) and (b) are the ∆S distribution for LLV and RLV of Subject1 respectively. (c) and (d) are the ∆S distribution for LLV and RLV of Subject 2 respectively.
tapping operation were acquired. As all ventricles are connected through the 3rd ventricle, by tapping the leftlateral ventricle it was hypothesized to reduce the volume of both lateral ventricles. The volume measurementslisted in Table 1 and distribution of ∆S for LLV and RLV shown in Fig. 3 (c) and (d) support this hypothesis.However, it was also observed that the amount of shrinkage is much larger in the left ventricle than in the rightventricle as shown in Fig. 5. In particular, Fig. 5 shows the difference in the amount of shrinkage for the leftand right ventricles is the most prominent in the neighbourhood of the posterior horn. This is likely due to thefact that the repeat US was acquired a few minutes only after the tap, and that the hemorrhage in the ventriclescaused an increase in the viscosity of the CSF as well as obstacles in the circulation of CSF with in the ventricles.
Baseline Follow-upLLV Volume(cm3) RLV Volume(cm3) LLV Volume(cm3) RLV Volume(cm3)
Subject 1 6.84 7.03 10.61 8.90Subject 2 18.44 24.61 11.42 22.41
Table 1. Volume measurement of patients lateral ventricles at baseline and follow-up. LLV is the left lateral ventricle andRLV is the right lateral ventricle.
4. DISCUSSION
We developed a technology to monitor the spatio-temporal surface change of the lateral ventricles using 3D US.This tool has the ability to identify regions where large changes occur in subjects with untreated IVH and aftersurgical intervention. To allow inter-subject comparison in local ventricular change, we applied non-rigid point
Proc. of SPIE Vol. 9419 94190V-4
Downloaded From: http://proceedings.spiedigitallibrary.org/ on 01/21/2016 Terms of Use: http://spiedigitallibrary.org/ss/TermsOfUse.aspx

Occipital
Lateral Lateral
Medial MedialFrontal
Right(a)
Left
Lateral
Medial
Occipital
Frontal
Lateral
Right(b)
Left
Medial
AS (mm)
4
0
-2
-4-
Lateral
Medial
Right
Lateral
Medial
Right
Occipital
Frontal
(a)
Occipital
Frontal
(b)
Lateral
Media
Lateral
Left
Left
Medial
AS (mm)
4
2
Io
-2
-4-
Figure 4. (a) Subject 1 and (b) template surface with local surface change color-coded and superimposed. The patient had bilateral grade III IVH, and was expected to undergo ventricle dilation over the first weeks of life. Images were acquired three days apart and surfaces maps show the expected dilation mostly in the posterior horn, as well as the frontal horns (red).
Figure 5. (a) Subject 2 who had a tapping procedure and (b) template surface with local surface change color-coded and super-imposed. The patient had diagnosed bilateral grade III IVH and required a ventricle tap. The left lateral ventricle was tapped, and showed an expected decrease in ventricle size (blue) as shown on the surface maps; however, the right ventricle didn’t decrease as much, due to partial obstruction of the pathways caused by an intraventricular hemorrhage.
Proc. of SPIE Vol. 9419 94190V-5
Downloaded From: http://proceedings.spiedigitallibrary.org/ on 01/21/2016 Terms of Use: http://spiedigitallibrary.org/ss/TermsOfUse.aspx
set registration (CPD) and 3D symmetric correspondence to map surfaces of different subjects to a templatesurface on point-by-point basis. This approach has the potential to help correlate localized damage (caused byexcessive ventricle enlargement) to neurological problems later in life.
There were several limitations in this study. First, manual segmentation of the 3D ventricular images ofneonates is labor intensive and has been shown to associate with high segmentation variability.14 Although asemi-automatic algorithm has been proposed,14 until the local segmentation accuracy of this algorithm has beenthoroughly validated, manual segmentation is still regarded as the most reliable technique in delineating localstructures of the ventricle. Second, the quantification of local change is based on a single segmentation on eachof the baseline and follow-up images. As manual segmentation is prone to variability, repeated segmentationsmay be required to establish statistically whether the computed surface change is due to real biological changeor appears merely because of the segmentation variability.
5. CONCLUSIONS
In this paper, we described a technology to monitor the spatio-temporal surface change of cerebral ventriclesand its application to model the surface change of preterm neonate’s ventricles with untreated IVH and aftersurgical intervention. The metric of local surface change was defined as the signed distance between the pairof corresponding points. We demonstrated the use of our algorithm to quantify local surface change for twosubjects involved in this study.
6. ACKNOWLEDGMENTS
This study is supported by a grant from the Research Grant Council of the HKSAR, China (Project No. CityU139713) and the National Natural Science Foundation of China (Grant No. 81201149).
REFERENCES
[1] A. R. Synnes, L.-Y. Chien, A. Peliowski, R. Baboolal, and S. K. Lee, “Variations in intraventricular hemor-rhage incidence rates among canadian neonatal intensive care units,” Journal of Pediatrics 138(4), pp. 525–531, 2001.
[2] M. Mataro, C. Junque, M. A. Poca, and J. Sahuquillo, “Neuropsychological findings in congenital andacquired childhood hydrocephalus,” Neuropsychology Review 11(4), pp. 169–178, 2001.
[3] L. S. de Vries, A. J. Brouwer, and F. Groenendaal, “Posthaemorrhagic ventricular dilatation: when shouldwe intervene?,” Archives of Disease in Childhood-Fetal and Neonatal Edition 98(4), pp. F284–F285, 2013.
[4] J. H. Gilmore, G. Gerig, B. Specter, H. C. Charles, J. S. Wilber, B. S. Hertzberg, and M. A. Kliewer, “Infantcerebral ventricle volume: a comparison of 3-D ultrasound and magnetic resonance imaging,” UltrasoundMed. Biol. 27(8), pp. 1143–1146, 2001.
[5] J. Kishimoto, S. de Ribaupierre, D. Lee, R. Mehta, K. St Lawrence, and A. Fenster, “3D ultrasound systemto investigate intraventricular hemorrhage in preterm neonates,” Phys. Med. Biol. 58(21), p. 7513, 2013.
[6] J. Donders, B. P. Rourke, and A. I. Canady, “Neuropsychological functioning of hydrocephalic children,”Journal of Clinical and Experimental Neuropsychology 13(4), pp. 607–613, 1991.
[7] J. M. Fletcher, D. J. Francis, N. M. Thompson, B. L. Brookshire, T. P. Bohan, S. H. Landry, K. C. Davidson,and M. E. Miner, “Verbal and nonverbal skill discrepancies in hydrocephalic children,” Journal of Clinicaland Experimental Neuropsychology 14(4), pp. 593–609, 1992.
[8] J. Hodel, P. Besson, A. Rahmouni, E. Petit, A. Lebret, B. Grandjacques, O. Outteryck, M. A. Benadjaoud,A. Maraval, A. Luciani, et al., “3D mapping of cerebrospinal fluid local volume changes in patients withhydrocephalus treated by surgery: preliminary study,” European radiology 24(1), pp. 136–142, 2014.
[9] A. G. Bors, L. Kechagias, and I. Pitas, “Binary morphological shape-based interpolation applied to 3-Dtooth reconstruction,” Medical Imaging, IEEE Transactions on 21(2), pp. 100–108, 2002.
[10] W. E. Lorensen and H. E. Cline, “Marching cubes: A high resolution 3D surface construction algorithm,”in ACM Siggraph Computer Graphics, 21(4), pp. 163–169, ACM, 1987.
Proc. of SPIE Vol. 9419 94190V-6
Downloaded From: http://proceedings.spiedigitallibrary.org/ on 01/21/2016 Terms of Use: http://spiedigitallibrary.org/ss/TermsOfUse.aspx

[11] X. Papademetris, A. J. Sinusas, D. P. Dione, R. T. Constable, and J. S. Duncan, “Estimation of 3-Dleft ventricular deformation from medical images using biomechanical models,” Medical Imaging, IEEETransactions on 21(7), pp. 786–800, 2002.
[12] A. Myronenko and X. Song, “Point set registration: Coherent point drift,” Pattern Analysis and MachineIntelligence, IEEE Transactions on 32(12), pp. 2262–2275, 2010.
[13] L.-A. Papile, J. Burstein, R. Burstein, and H. Koffler, “Incidence and evolution of subependymal andintraventricular hemorrhage: a study of infants with birth weights less than 1,500 gm,” The Journal ofPediatrics 92(4), pp. 529–534, 1978.
[14] W. Qiu, J. Yuan, J. Kishimoto, J. McLeod, Y. Chen, S. de Ribaupierre, and A. Fenster, “User-guidedsegmentation of preterm neonate ventricular system from 3-D ultrasound images using convex optimization,”Ultrasound Med. Biol. 20, pp. 542–556, 2014.
Proc. of SPIE Vol. 9419 94190V-7
Downloaded From: http://proceedings.spiedigitallibrary.org/ on 01/21/2016 Terms of Use: http://spiedigitallibrary.org/ss/TermsOfUse.aspx