quantifying carbon sources for de novo lipogenesis in wild- … · quantifying carbon sources for...
TRANSCRIPT

Quantifying Carbon Sources For de novo Lipogenesis in Wild-Type and IRS-1 Knockout Brown Adipocytes Running title: Quantifying de novo Lipogenesis in Brown Adipocytes
Authors: Hyuntae Yoo†, Gregory Stephanopoulos¶, and Joanne K. Kelleher¶ †Department of Chemistry,
¶Department of Chemical Engineering
Massachusetts Institute of Technology Cambridge, MA, 02139, USA
Corresponding author: Joanne K. Kelleher, Ph.D.
Department of Chemical Engineering
Massachusetts Institute of Technology 77 Massachusetts Ave, Room 66-401
Cambridge, MA 02139
PHONE: (617) 253-3178
Email: [email protected]
1
Abbreviations: WT, wild-type; IRS-1, insulin receptor substrate-1; G3P, glycerol-3-phosphate; phosphoenolpyruvate carboxykinase, PEPCK; IBMX, isobutylmethylxanthine; Dex, dexamethasone; ISA, isotopomer spectral analysis; SIM, selected ion monitoring; Glc, glucose; Gln, glutamine; AcAc, acetoacetate; AC, acetate; Std, standard.
1
by guest, on January 19, 2019w
ww
.jlr.orgD
ownloaded from

Abstract Studies were conducted to evaluate the flux of various carbon sources to lipogenesis
during brown adipocyte differentiation. 13C-labeling and isotopomer spectral analysis
quantified the contribution of metabolites to de novo lipogenesis in wild-type (WT) and
IRS-1 knockout (KO) brown adipocytes. Both glucose and glutamine provided
substantial fractions of the lipogenic acetyl CoA for both WT and KO cells in standard
media, together contributing 60%. Adding acetoacetate (10 mM) to the medium resulted
in a large flux of acetoacetate to lipid representing 70% of the lipogenic acetyl CoA and
decreasing the contribution of glucose plus glutamine to 30%. For WT cells, the
fractional synthesis of new fatty acids during 4-day differentiation was 80% of the total.
Similarly, 80% of the lipidic glycerol was derived from glucose in the medium;
glutamine was not a precursor for glycerol. When glutamine was removed from the
medium, the contribution of glucose to fatty acid synthesis doubled, replacing most of the
contribution of glutamine and maintaining total lipogenesis. Conversely, removal of
glucose dramatically decreased lipogenesis. These results indicate that glucose’s distinct
role in lipid synthesis during differentiation cannot be replaced by other carbon sources,
consistent with the role for glucose supplying NADPH and/or glycerol for triglyceride
synthesis.
Supplementary key words insulin receptor substrate-1, lipogenesis, 13C, isotopomer, gas chromatography/mass spectrometry, adipogenesis, glucose, glutamine, acetoacetate, acetate
2
by guest, on January 19, 2019w
ww
.jlr.orgD
ownloaded from

Introduction
The differentiation of brown adipocyte cells from a fibroblast-like precursor is
evolutionarily related to pre-hibernation fat accumulation and thus linked to total body
energy metabolism (1). Adipogenesis occurs under conditions of excess nutrients and
accompanying hormones and involves changes in gene expression and cell signaling,
leading to a substantial increase in de novo synthesis and storage of triglyceride. Cell
surface receptors, especially for insulin and insulin-like growth factor-1 (IGF-1) provide
a mechanism for hormonal response to nutrient abundance. Recent investigations of
adipogenesis have focused on gene expression and cell signaling events associated with
this conversion (2-4). The importance of the insulin receptor substrate-1 (IRS-1)
signaling pathway for differentiation has been demonstrated by the finding that an IRS-1
knockout (IRS-1 KO) preadipocyte cell line is unable to differentiate under the standard
condition where wild-type (WT) cells accumulate triglyceride and express adipocyte-
specific genes including UCP-1 and fatty acid synthase (5). A consequence of the IRS-1
KO is that these cells are deficient in insulin-stimulated glucose uptake via glucose
transporter GLUT4. The studies of in vitro adipogenesis are normally conducted under
constant nutrient conditions using cell culture media where glucose (25 mM) and
glutamine (2-4 mM) provide the major carbon sources for cell metabolism. In the work
presented here, we investigate the role of the nutrient and hormonal environment on the
process of lipogenesis accompanying brown adipocyte differentiation.
Animal studies support the concept that glucose is a major carbon source for brown
adipose lipogenesis. Lipid synthesis measured with 3H2O increases on glucose
administration and is insulin-sensitive (6). However, ketone bodies may also supply
carbon for brown adipose lipogenesis. Investigations using rats and slices of rat brown
adipose tissue demonstrated that acetoacetate was utilized by brown adipose tissue both
for oxidation and for de novo lipogenesis. In fasted animals, the incorporation 14C-
labeled β-hydroxybutyrate into lipids in brown adipose tissue was ten-fold greater on a
weight basis than into liver or white adipose tissue (7). In addition, incorporation of β-
hydroxybutyrate into fatty acid was increased in brown adipose tissue of cold-adapted
rats (8). In concert with these fluxes, elevated levels of mitochondrial enzymes required
3
by guest, on January 19, 2019w
ww
.jlr.orgD
ownloaded from

for the conversions of acetoacetate to acetyl CoA, 3-oxoacid CoA-transferase and
acetoacetyl-CoA thiolase, have been found in brown adipose tissue from suckling and
weanling rats (9, 10). In addition to fatty acid synthesis, nutrients are required for the
glycerol backbone of the triglyceride. In most cells, glucose supplies the glycerol-3-
phosphate (G3P) precursor for the triglyceride backbone. Brown adipocytes may also
utilize the glyceroneognesis pathway involving glycerol-3-phosphate synthesis from three
carbon compounds via phosphoenolpyruvate carboxykinase (PEPCK) (11). A third
possible route for G3P formation in brown adipocyte cells is from glycerol via
glycerokinase. A futile cycle involving glycerokinase and triglyceride hydrolysis has
been suggested as an additional heat generating mechanism in brown adipocyte cells (12,
13).
A standard procedure for in vitro differentiation of brown preadipocytes has been
adopted from the procedure used for white adipocyte differentiation (14). The procedure
involves incubating confluent preadipocytes in dexamethasone, indomethacin, and
isobutylmethylxanthine (IBMX). Dexamethasone, in brown preadipocytes, appears to
repress the expression of insulin-insensitive glucose transporter GLUT1 and stimulate the
level of insulin-sensitive glucose transporter GLUT4 in a dose-dependent manner. In the
absence of dexamethasone, brown preadipocytes may differentiate by transporting
glucose primarily through GLUT1 (15, 16). Thus, both the nutrient environment and the
hormonal conditions inducing differentiation may affect the intracellular metabolic
environment that allows the cells to rapidly accumulate triglyceride during
differentiation.
The studies presented here, focus on the role of nutrients in the synthesis of
triglyceride during the brown adipocyte differentiation process using the WT and IRS-1
KO cell lines developed by Kahn and co-workers (5). This model provides the
opportunity to compare the two cell types to assess their ability to accumulate lipid under
a variety of nutrient conditions. In white adipose 3T3-L1 cells, the IRS-1 KO cells retain
partial ability to differentiate (17). Thus, we specifically tested the hypothesis that
alternations in nutrients could affect the lipogenic ability of the IRS-1 KO brown adipose
cells. We employed 13C-labeled metabolites to investigate the carbon sources for
lipogenesis and glycerol backbone. We analyzed labeling data with Isotopomer Spectral
4
by guest, on January 19, 2019w
ww
.jlr.orgD
ownloaded from

Analysis (ISA) to estimate parameters associated with lipogenesis. This method has been
used previously to assess the synthesis of triglyceride fatty acids in differentiating 3T3-
L1 white adipocyte cells (18). Our studies provide insight into the role of nutrients in
brown adipocyte differentiation to complement the extensive work on signaling and
transcriptional changes underway in other laboratories (3, 5, 19).
MATERIALS AND METHODS
Materials
Biochemicals were obtained from Sigma Chemical Co., St. Louis, MO. 13C-labeled
chemicals were obtained from Cambridge Isotope Laboratories, Inc., Andover, MA.
Tissue culture media were obtained from Invitrogen, Co., Carlsbad, CA.
Cell culture, adipocyte differentiation and lipid isolation
Brown preadipocyte cells were cultured essentially as described in Fasshauer et al.
(20) and as outlined in Figure 1A. All studies were conducted in 10-cm2 (surface area) 6-
well plates containing 4 mL media. WT and IRS-1 KO brown preadipocyte cells (kindly
provided by Dr. C. R. Kahn, Joslin Diabetes Center, Boston) were cultured until
confluence (day 0) in “Differentiation media” (Dulbecco’s Modified Eagle Medium
(DMEM) containing 25 mM glucose and 4 mM glutamine, supplemented with 10% fetal
bovine serum, 20 nM insulin, and 1 nM thyroid hormone (T3)). On day 0, media were
changed to “Induction media”, which is Differentiation media supplemented with 0.125
mM indomethacin, 0.25 mM IBMX, and 5 µM dexamethasone (In some studies,
dexamethasone was omitted from the Induction medium: “Dex-”). After 48 hours, media
were changed back to Differentiation media (in some studies, 10 mM sodium
acetoacetate or 2 mM sodium acetate was added to Differentiation media: “AcAc+” or
“AC+”). For all 13C-labeling experiments, glucose, glutamine, added acetoacetate, or
added acetate in the medium was individually replaced with the corresponding [U-13C]
labeled carbon source, and DMEM was replaced with DMEM Base medium (from Sigma
Chemical Co.) with no glucose or glutamine (buffered with 44 mM sodium bicarbonate at
5
by guest, on January 19, 2019w
ww
.jlr.orgD
ownloaded from

pH 7.2). Media were replaced on day 4 with the same differentiation media used on day
2.
On day 6, the experiment was terminated by removing the medium and adding 1.0 mL
of 2% perchloric acid for 10 minutes at room temperature to each well (21). After
removing the acidic solution, cellular lipid was isolated twice by adding 1.3 mL of
hexane-isopropanol (3:2) mixture for 30 min at room temperature, when 20 µg of
triheptadecanoin in 10 µL hexane-isopropanol (3:2) was added to the organic solvent for
quantification of total fatty acids. Combined hexane-isopropanol solution was
evaporated and redissolved in 400 µL of methane-benzene (2:1) mixture, 100 µL of
which was mixed with 100 µL of BF3/MeOH. The mixture was vortexed in glass vial
and incubated at 75 °C for 2 hours to derivatize the entire fatty acid moiety in lipids into
the corresponding methyl esters. The reaction product was then purified by hexane
extraction (3 x 0.3 mL) against 0.2 mL of saturated aqueous NaCl solution. Combined
hexane solution was treated with 100 mg of sodium sulfate to remove water. The hexane
solution was then diluted appropriately before injection into the GC-MS instrument.
For ISA analysis of the glycerol portion of the lipids, glycerol was derivatized with tert-
butyldimethylsilyl (TBDMS) group and the mass isotopomer distribution determined by
GC-MS as described by Flakoll et al. (22) Upon separation of organic phase after
methylation of the fatty acid moiety of lipids, 0.2 mL of the aqueous solution was
evaporated to dryness and dissolved in the mixture of 100 µL pyridine and 100 µL of N-
Methyl-N-[tert-butyldimethylsilyl]trifluoroacetimide (MTBSTFA, from Pierce). The
mixture was incubated at room temperature for 30 minutes prior to GC-MS analysis.
GC-MS for fatty acid quantification and ISA analysis
Samples with fatty acid methyl esters in 1 µL hexane were injected into a Hewlett-
Packard model 6890A GC connected to JMS-GCmate II (JEOL, Peabody, MA) and
equipped with DB-XLB (60 m x 0.25 mm id x 0.25 µm) capillary column (J&W
Scientific, Folsom, CA). Helium flow was maintained at 1.0 mL per minute via
electronic pressure control. The injection port temperature was 230°C. The temperature
of the column was started at 100°C for 1 minute, increased to 250°C at 25°C/min, and
6
by guest, on January 19, 2019w
ww
.jlr.orgD
ownloaded from

held for 5 minutes. The temperature was then increased to 300°C at 25°C/min and held
for 1 min. For general detection of fatty acid methyl ester, m/z = 100 to 330 was scanned
and recorded with scan speed of 0.51 second and interscan delay of 0.2 second.
Myristate (m/z = 242), palmitate (m/z = 270), palmitoleate (m/z = 268), oleate (m/z =
296), and stearate (m/z = 298) methyl esters were detected above detection limit, together
with the internal standard, heptadecanoate methyl ester (m/z = 284). For quantification
of total fatty acids, the intensities of M0 peaks (“Mx” denotes the isotopomer with m/z =
M + x where M is the base mass) of fatty acid methyl esters were normalized by that of
heptadecanoate methyl ester. Various known amounts of tripalmitin were derivatized and
measured together with the samples to construct a standard curve for calculating the
absolute amounts of the fatty acids. Protein amounts of the replicate cell culture samples
were measured using protein assay kit (Sigma Diagnostics, St. Louis, MO) after
extraction of protein from the cell cultures with 1% Triton X-100 (0.7 mL per well) for
20 minutes at 37 °C and centrifugation (18,000 × g for 2 min).
Because palmitate was the major fatty acid under all experimental conditions, the
analysis of methyl palmitate was used for representative ISA analysis on fatty acid
synthesis in brown adipocytes. For detection of mass isotopomers of methyl palmitate in 13C-labeling studies, relative intensities of the molecular ions and their isotopomers (M0,
M1, M2,… M16 (m/z = 270 to 286)) were monitored by selected ion monitoring (SIM).
For detection of mass isotopomers of TBDMS derivative of lipidic glycerol in 13C-
labeling studies, the same instrumental setup as for fatty acid methyl esters was used
except for the following GC temperature profile: temperature held at 100 °C for 0.5
minute, increased to 300°C at 25°C/min, and held for 1.5 minute. Relative intensities of
M−57 ions (M−tert-butyl) and their isotopomers (m/z = 377 to 384) were also monitored
by SIM (22).
Assay on the concentration of glucose, glutamine, and lactate in the culture medium
The concentration of glucose and lactate in media samples was measured by YSI 2300
STAT glucose/L-lactate analyzer (Yellow Springs Instruments, Yellow Springs, OH).
Glutamine concentration was measured by TBDMS derivatization and GC-MS, and
corrected for the spontaneous decomposition of glutamine at 37°C. The mixture of 100
7
by guest, on January 19, 2019w
ww
.jlr.orgD
ownloaded from

µL of each medium sample plus 40 µL of 10 mM [U-13C] glutamine was first acidified
by adding 100 µL of 2% perchloric acid. Then, the mixture was loaded onto a column
with 2 mL of Dowex 50Wx8-400 cation exchange resin. After washing the column with
1 mL of distilled water, glutamine was eluted by 3 mL of 6 M NH4OH aqueous solution.
The eluant was evaporated and dissolved into 50 µL of dimethylformamide by sonication,
before mixing with 70 µL of MTBSTFA. The mixture was then incubated at 70°C for 30
minutes prior to injection into GC-MS instrument. Standard glutamine solutions of
known concentration were used for construction of a standard curve. GC-MS setup was
the same as in glycerol analysis above, except for the following GC temperature profile:
temperature held at 140 °C for 2 minutes, increased to 200 °C at 25 °C/min, and held for
1 minute; temperature increased again to 250 °C at 3 °C/min and held for 7.9 minutes;
temperature raised to 300°C at 5 °C/min and held for 5 minutes. Relative intensities of M
− 57 (M − tert-butyl) ions from of natural glutamine (m/z = 431) and [U-13C] glutamine
(m/z = 436) were used for the calculation of glutamine concentrations of the media
samples.
Isotopomer spectral analysis
The flux of carbon sources to fatty acids was evaluated by ISA, a stable isotope
method for estimating the fractional contribution and the fractional new synthesis of
carbon sources to lipogenesis (18, 23). This method utilizes the mass isotopomer
distribution of a polymer produced in part by de novo synthesis as illustrated in Figure
1B. In this study, we analyzed palmitate synthesized from 13C-enriched precursors. The
ISA model produces estimated values for the two parameters controlling flux of 13C to
the sampled palmitate. D is the fractional contribution of a 13C-labeled precursor to the
lipogenic acetyl CoA, and g(time) is the fractional amount of newly synthesized
palmitate in the sample. The parameter g(time) is equivalent to the fractional synthesis of
the product at the specified time. The model used here assumes that the flux of the
precursors to the lipogenic acetyl CoA pool is constant during the time course of 13C
incubation. ISA uses equations for the probability of appearance of each isotopomer
based on test values for D and g(time). These probabilities are compared to the fractional
abundance determined for each palmitate isotopomer to obtain the best-fit solution. The
8
by guest, on January 19, 2019w
ww
.jlr.orgD
ownloaded from

fit is obtained by weighted nonlinear regression with the weights proportional to the
inverse of the standard deviation of the isotopomer measurement. In practice, the
weighting insures that the parameter estimates will not be strongly affected by the least
reliable measurements.
RESULTS AND DISCUSSION
Quantifying total fatty acid content of WT and IRS-1 KO brown adipocytes
Confluent WT and IRS-1 KO brown adipocytes were cultured under the standard (Std)
condition or one of two modified conditions: AcAc+ or Dex- (see Materials and Methods
for details). Under Std condition, WT cells produced approximately three times as much
total fatty acids per protein mass as IRS-1 KO cells by day 6 (Fig. 2). Under AcAc+ or
Dex- conditions, WT and IRS-1 KO cells produced similar amounts of fatty acids as in
Std condition. Removing any one of the induction chemicals (IBMX, dexamethasone,
and indomethacin) from the induction medium for WT cells did not alter the total fatty
acid amounts noticeably, but absence of two or more induction chemicals reduced fatty
acid production of WT cells to that of IRS-1 KO cells under Std condition (data not
shown). Previous studies comparing the amount of total fatty acids synthesized in WT
and IRS-1 KO cells used Oil Red O staining to demonstrate qualitatively the decreased
triglyceride accumulation in the KO cells (20). The data in Figure 2 quantify the total
fatty acid amounts in both cell lines, allowing calculations of amounts of total fatty acids
per mg of protein. The finding that the Dex- condition did not alter the total fatty acid
accumulation suggests that any shift in the population of GLUT1 and GLUT4 does not
affect total fatty acid synthesis (15, 16).
Lipogenesis under varied conditions for differentiation: adding acetoacetate and
removing dexamethasone
To determine the flux of various carbon sources to lipogenesis, cells were incubated in 13C-labeled substrates for the four-day differentiation period, days 2 – 6 (Fig. 1A).
Among the three conditions studied, the experiment adding acetoacetate during
9
by guest, on January 19, 2019w
ww
.jlr.orgD
ownloaded from

differentiation (AcAc+) was performed to quantify the contribution of this carbon source
to brown adipocyte lipogenesis under well-defined conditions and to test the hypothesis
that alternative carbon sources could substitute for glucose in fatty acid synthesis of the
IRS-1 KO cells. The Dex- experiment was conducted to test the hypothesis that the
contribution of glucose to lipogenesis could be altered by removal of dexamethasone.
For each of the three conditions, the fractional contribution and fractional new synthesis
of glucose, glutamine, and acetoacetate when present, were estimated by the ISA
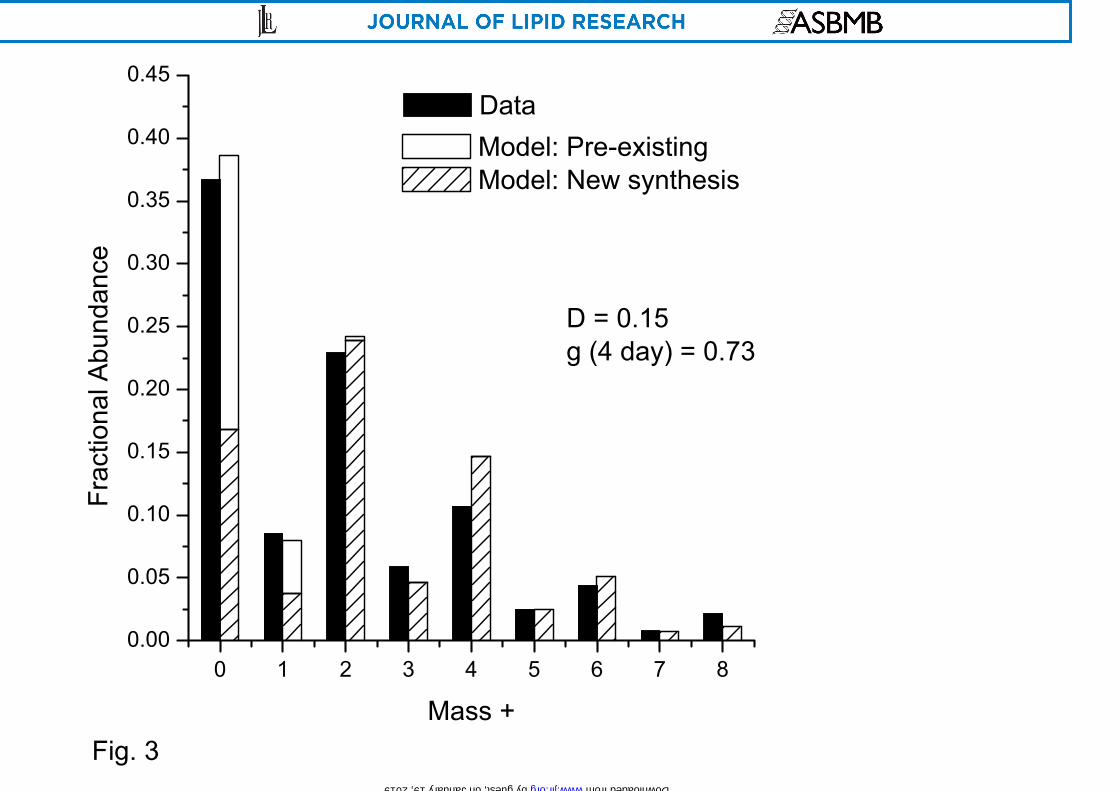
parameters, D and g(4 day) (Fig. 1B). A sample ISA experiment showing the mass
isotopomer distribution and the fit of the model to the data demonstrates the key features
of the analysis (Fig. 3).
The results of the ISA analysis indicate that brown adipocytes can utilize a variety of
carbon sources for de novo lipogenesis (Fig. 4A). Glucose (25 mM) and glutamine (4
mM) are the major lipogenic carbon sources in the differentiation medium. ISA analysis
indicated that both glucose and glutamine make substantial contributions of carbon for
lipogenesis under all conditions examined. Acetoacetate (10 mM) was readily converted
to lipid, indicating that these cell lines have a large capacity for acetoacetate utilization
consistent with the results in animal studies (9, 10). The activity of acetoacetyl-CoA
synthetase has been correlated with the incorporation of acetoacetate carbon into lipid,
which was increased in the presence of glucose and insulin (9). Acetoacetate displaced
glucose and glutamine as lipogenic carbon sources as indicated by the high D(AcAc) values
and the decreases in the D values for these substrates in the presence of acetoacetate.
When dexamethasone was removed from the induction medium (Dex- condition), the
fractional contribution of glucose to lipogenesis increased in the WT cells, consistent
with the finding that this condition increases the expression of GLUT1 (15, 16; see also
Fig. 4C).
D values estimate the fractional contribution of a substrate to the lipogenic acetyl CoA
pool. To examine the total flux of a substrate to fatty acids, it is necessary to consider the
fraction of total fatty acids that was newly synthesized during the isotope incubation
period. The ISA term for this variable, g(4 day) (Fig. 1B), was estimated as shown in
Figure 4B. Except for IRS-1 KO cells in the presence of acetoacetate, 60 to 80% of the
total fatty acids in WT and IRS-1 KO cells was synthesized during the differentiation
10
by guest, on January 19, 2019w
ww
.jlr.orgD
ownloaded from

period (days 2 – 6). The total flux to fatty acids per mg protein was determined by
multiplying g(4 day) with the total content of fatty acids (Fig. 4C). This calculation
assumes that there is little turnover of the newly synthesized fatty acids during the four-
day experiment. However, it should be noted that the well-differentiated WT cells
undergo clonal expansion as part of the differentiation process (Clonal expansion of
adipocytes during differentiation are reviewed in Darlington et al. (24)). Because the
protein mass of WT cells per well is approximately twice that of IRS-1 KO cells by day 6,
the differences in total lipogenic flux between WT and IRS-1 KO cells shown in Figure
4C would be further increased. The isotopic flux of each substrate to fatty acids may be
calculated as: (flux of substrate per mg protein) = D(substrate) × g(4 day) × (total amount of
fatty acids / mg protein). In Figure 4C, the total flux is partitioned among the 13C labeled
substrates and other carbon sources. For each of the three conditions, the D values for all
carbon sources are expected to sum to 1 according to the ISA model (Fig. 1B). Sources
of carbon for lipogenic acetyl CoA other than the compounds investigated as 13C
substrates are grouped together and labeled “Other”. This term includes metabolites in
the medium as well as intracellular metabolites. Although the fractional contribution
from glucose and glutamine for IRS-1 KO cells are comparable to that in WT cells (Fig.
4A), the absolute fluxes of the carbon sources in IRS-1 KO cells are much lower than in
WT cells under all three conditions as shown in Figure 4C. Thus, despite the changes in
substrate use, the IRS-1 KO cells were not able to overcome the defect in total
lipogenesis (20).
To further explore the quantitative use of glucose and glutamine for lipid synthesis,
the changes in concentration in the medium of WT cells under Std condition were
measured during the period of the most active lipogenesis, from day 4 to day 6 (Fig. 4D).
Glutamine consumption of WT cells from the medium amounted to 4.1 µmol per well
over 48 hrs. Also, it was estimated that 2.0 µmol of glutamine was used for fatty acid
synthesis during the last 2 days of differentiation*. These results indicate that an isotopic
flux of 49% of the glutamine consumed from medium was used for synthesis of fatty
acids during the 48-hr period. In parallel with the result from glutamine analysis, 63
µmol of glucose was consumed and 77 µmol of lactate was produced per well over the
11
by guest, on January 19, 2019w
ww
.jlr.orgD
ownloaded from

48-hr period (Fig. 4D), consistent with glucose’s contribution to lipogenesis (Fig. 4C and
Fig. 6).
Under Std and Dex- conditions where glucose and glutamine were the major carbon
sources in the medium, the sum of D(Glc) and D(Gln) was considerably less than 1,
indicating that other carbon sources supplied nearly 40% of the acetyl units used for de
novo fatty acid synthesis. On the other hand, addition of 10 mM acetoacetate made the
sum of D(AcAc), D(Glc), and D(Gln) equal to 1.00 in both WT and IRS-1 KO cells.
Acetoacetate was able to entirely displace the contribution of the “Other” sources and
reduced the contribution of both glucose and glutamine. This finding suggests that both
WT and IRS-1 KO cells have a high capacity to metabolize acetoacetate to acetyl CoA
without affecting total fatty acid synthesis (Fig. 2).
Lipogenesis in the absence of glucose or glutamine
The studies presented in Figure 4 demonstrate substantial isotopic flux of both glucose
and glutamine to the lipogenic acetyl CoA during differentiation of WT brown adipocytes.
To further explore this issue, we removed either glutamine (Gln-) or glucose (Glc-) from
the standard medium from day 2 to day 6 and examined the flux of 13C labeled glucose
and glutamine to lipogenic acetyl CoA. The results of this ISA analysis are summarized
in Figure 5. When glutamine was removed, the fractional contribution of glucose was
almost doubled (D(Glc) = 0.51 ± 0.03) from that in WT cells with 25 mM glucose and 4
mM glutamine (D(Glc) = 0.28 ± 0.02) and amounted to 81% of the sum of the two D
values (D(Glc) + D(Gln) = 0.63 ± 0.03). In parallel with these findings, total fatty acid
production in WT cells under Gln- condition was similar to that in WT cells under Std
condition (Fig. 5B). Thus, glucose’s flux to lipogenic acetyl CoA can largely compensate
for the absence of glutamine in WT cells. In contrast, when glucose was removed from
the medium (Glc-), glutamine provided only 24 ± 1 % of the carbon sources for fatty
acid synthesis. This D value was lower than D(Gln) (0.34 ± 0.02) in WT cells under Std
condition. With glucose removed from the medium, total fatty acid production in WT
cells under Glc- condition was reduced to the level as low as that in IRS-1 KO cells under
Std condition, which was not restored even after addition of acetoacetate (Fig. 5B).
12
by guest, on January 19, 2019w
ww
.jlr.orgD
ownloaded from
These results indicate that glucose is required to support triglyceride synthesis from
glutamine during differentiation of brown adipocytes.
Carbon sources for glycerol backbone of cellular lipid
The studies removing glucose or glutamine from the medium during differentiation
raise the issue of the carbon sources for the glycerol backbone of the newly synthesized
lipids as an explanation for the limited lipogenic ability of WT cells under Glc- condition.
We considered two hypotheses for the failure of the WT cells under Glc- condition to
produce normal amounts of fatty acids. First, glucose may be required for adequate
production of acetyl CoA such that lipogenesis will not proceed unless the acetyl units
provided by glucose are available to supplement those from glutamine and other sources.
Second, glucose may be required for providing the glycerol backbone to the synthesis of
lipids. To evaluate these hypotheses, we examined the labeling of the glycerol moiety of
the lipids under Std condition in the presence of 25 mM [U-13C] glucose for WT cells
(carbon from neither glutamine or acetoacetate under all three conditions contributed to
lipidic glycerol). The isotopomer distribution of TBDMS-glycerol indicated that 13C-
labeled glucose provided 79% of the glycerol backbone for WT cells calculated as M3 /
(M0 + M3) after correction for natural abundance (Fig. 6). The percentage agrees well
with the g(4 day) value of 0.79 for WT cells under Std condition, indicating that 79% of
the lipids was newly synthesized. This result also agrees with the finding that the amount
of total fatty acids increased approximately four-fold over the 4-day differentiation period
(data not shown). Thus, glucose from the medium appears to be the sole carbon source
for glycerol used for de novo lipogenesis of WT cells under the Std condition.
Several routes for the synthesis of glycerol-3-phosphate (G3P), the immediate
precursor for glycerol backbone of lipids, have been proposed in brown adipose tissue.
As the previous data indicate, carbon of G3P can be derived from glucose. A second
route, glyceroneogenesis (glycerol synthesis from non-glucose sources) has been reported
to be active in brown adipose tissue (11), but its quantitative significance has not been
investigated. A third possibility is the recycling of glycerol via glycerokinase (25). We
sought evidence that glyceroneogenesis and/or glycerol cycling could replace the role of
glucose in supplying G3P for lipidic glycerol. WT cells were incubated during days 2 – 6
13
by guest, on January 19, 2019w
ww
.jlr.orgD
ownloaded from

of differentiation in the absence of glucose but in glutamine (4 mM) supplemented with
one of the following; pyruvate (5 mM); lactate (5 mM) plus pyruvate (0.5 mM); glycerol
(10 mM). None of these conditions increased the synthesis of total fatty acids over those
found for Glc- condition. In addition, the possibility that glutamine could form glycerol
via glyceroneogenesis was investigated in the Glc- condition using [U-13C] glutamine.
GC-MS analysis of lipidic glycerol was unable to detect flux of glutamine to glycerol in
the Glc- condition. Thus, we found no evidence that alternative carbon sources could
compensate for the role of glucose to stimulate de novo lipogenesis in the presence of
glutamine.
Lipogenesis in the presence of added acetate
Acetate is a commonly used substrate for lipogenesis and has been used previously
with ISA to quantify the contribution in lipogenesis of 3T3-L1 cells (18). To evaluate the
contribution of acetate to the lipogenic acetyl CoA pool, 2 mM acetate was added to the
differentiation medium from day 2 to day 6 for WT and IRS-1 KO brown adipocytes.
For ISA analysis, acetate, glucose, or glutamine in the medium was replaced in individual
wells with [U-13C] acetate, [U-13C] glucose, or [U-13C] glutamine, respectively. The
isotopomer distribution of methyl palmitate was evaluated by ISA to determine the D and
g(4 day) values (Fig. 7). The data demonstrate that acetate is an effective carbon source
for lipogenic acetyl CoA in both WT and IRS-1 KO brown adipocytes. Comparing the
D values from Figures 6A and 4A indicates that acetate added to the medium displaced
some of the contribution of glutamine to lipogenic acetyl CoA in WT cells. This result
was obtained by noting that the sum of D values of added carbon sources for WT cells in
the presence of acetate, D(AC) + D(Glc) + D(Gln) = 0.67±0.01, was not different from that
of WT cells under Std condition, D(Glc) + D(Gln) = 0.63±0.03. D(Glc) remained similar
between the two condition (Std: D(Glc) = 0.28 ± 0.02, AC+: D(Glc) = 0.26 ± 0.01) while
D(Gln) was reduced (from 0.34 ± 0.02 to 0.20 ± 0.00) mainly due to the contribution from
acetate (D(AC) = 0.20 ± 0.00).
A different result was found for IRS-1 KO cells (Figs. 4A and 7A). The sum of D
values of added carbon sources in IRS-1 KO cells under AC+ condition (0.75 ± 0.02)
14
by guest, on January 19, 2019w
ww
.jlr.orgD
ownloaded from

was increased from those in IRS-1 KO cells under Std condition (0.61 ± 0.01) by the
same amount as D(AC) (0.14 ± 0.00). D(Glc) (Std: D(Glc) = 0.42 ± 0.01, AC+: D(Glc) = 0.45
± 0.01) and D(Gln) (Std: D(Gln) = 0.19 ± 0.00, AC+: D(Gln) = 0.16 ± 0.01) remained
similar. These results indicate that acetate replaced “Other” carbon sources in fatty acid
synthesis of the IRS-1 KO cells. When acetate was added to the medium, the g(4 day)
value for WT cells was 0.79, identical to that found for the Std condition (Figs. 4B and
7B). Likewise, for IRS-1 KO cells, the g(4 day) value was not affected by adding acetate.
These results indicate that addition of 2 mM acetate altered the fluxes of carbon to
lipogenic acetyl CoA but did not affect fractional synthesis of total fatty acids.
Physiology of lipogenesis in brown adipose cells
Taken together, the results of this study demonstrate the utilization of a number of
carbon sources for de novo lipogenesis in brown IRS-1 KO preadipocytes and
differentiating WT adipocytes. The finding that the contribution of glutamine to
lipogenic acetyl CoA was nearly equal to that of glucose was novel, as glutamine has not
been noted as a lipogenic carbon source in adipocytes. Low rates of glutamine flux to
triglyceride have previously been reported for white adipose tissue (26). Two routes are
known for flux of glutamine to acetyl CoA. Glutaminolysis flux described by
Newsholme and colleagues (27) involves TCA cycle metabolism to α-ketoglutarate
followed by flux of malate or oxaloacetate to pyruvate via malic enzyme or PEPCK and
pyruvate kinase. Alternatively, the reductive carboxylation pathway metabolizes α-
ketoglutarate to citrate by reversal of the NADH or NADPH coupled isocitrate
dehydrogenase (28). The studies performed here do not distinguish between these
pathways. However, isotopic methods can be used to determine the relative flux by each
pathway (29) and this technique may be useful to clarify the role of glutamine as a carbon
source for lipogenesis. Although glutamine was an important carbon source for
lipogenesis, we found that neither glutamine, nor glutamine plus acetoacetate, could
compensate for removal of glucose from the medium (Fig. 5B).
In the absence of glucose, the amount of triglyceride fatty acids in WT cells was low,
similar to that of the IRS-1 KO cells. These findings indicate a distinct role for glucose
in lipid synthesis during differentiation. A distinct metabolic action of glucose is as the
15
by guest, on January 19, 2019w
ww
.jlr.orgD
ownloaded from

source for G3P for the glycerol backbone of triglyceride and for NADPH generation in
the pentose phosphate pathway. In this study, we found no evidence for alternatives to
glucose for G3P synthesis despite the ample evidence for glyceroneogenesis and
glycerokinase flux in brown adipose tissue (30). Thus, G3P synthesis remains a
candidate for a pathway not duplicated by other substrates investigated here. A second
candidate for a distinct metabolic role of glucose is the production of lipogenic NADPH
through the pentose phosphate pathway. However, NADPH may be produced both via
glucose-6-phosphate dehydrogenase (G6PDH) in the pentose phosphate pathway and via
malic enzyme. Brown adipocyte differentiation induces increases in both of these
enzymes and thus both may play a role in generating NADPH for lipogenesis (31, 32).
As shown here, isotopic tools, including ISA, may be applied to further explore and
quantify lipogenic fluxes in brown adipose cells.
16
by guest, on January 19, 2019w
ww
.jlr.orgD
ownloaded from

Acknowledgement This work was supported by NIH support DK58533. The WT and IRS-1 KO brown
preadipocyte cell lines were generously provided by Dr. C. R. Kahn.
17
by guest, on January 19, 2019w
ww
.jlr.orgD
ownloaded from

Footnotes (Page 11) * It was assumed that one molecule of glutamine provides a two-carbon unit of
acetyl CoA for fatty acid synthesis and that palmitate is the representative fatty acid.
Also, from Figure 4C, it was calculated that 0.3 µmol of fatty acid was synthesized from
glutamine over 4-day period in a well (2.8 mg of protein per well). Together with the
measurement that 83% of the newly synthesized fatty acids during the 4-day
differentiation period is produced from day 4 to day 6, glutamine usage for fatty acid
synthesis was estimated to be 2.0 µmol.
18
by guest, on January 19, 2019w
ww
.jlr.orgD
ownloaded from

References
1. Lowell, B. B. and J. S. Flier. 1997. Brown adipose tissue, beta 3-adrenergic
receptors, and obesity. Annu.Rev.Med. 48: 307-316.
2. Spiegelman, B. M., P. Puigserver, and Z. Wu. 2000. Regulation of adipogenesis and
energy balance by PPARgamma and PGC-1. Int.J.Obes.Relat Metab Disord. 24
Suppl 4: S8-10.
3. Linhart, H. G., K. Ishimura-Oka, F. DeMayo, T. Kibe, D. Repka, B. Poindexter, R.
J. Bick, and G. J. Darlington. 2001. C/EBPalpha is required for differentiation of
white, but not brown, adipose tissue. Proc.Natl.Acad.Sci.U.S.A 98: 12532-12537.
4. Boeuf, S., M. Klingenspor, N. L. van Hal, T. Schneider, J. Keijer, and S. Klaus.
2001. Differential gene expression in white and brown preadipocytes. Physiol
Genomics 7: 15-25.
5. Klein, J., M. Fasshauer, H. H. Klein, M. Benito, and C. R. Kahn. 2002. Novel
adipocyte lines from brown fat: A model system for the study of differentiation,
energy metabolism, and insulin action. Bioessays 24: 382-388.
6. McCormack, J. G. and R. M. Denton. 1977. Evidence that fatty acid synthesis in the
interscapular brown adipose tissue of cold-adapted rats is increased in vivo by
insulin by mechanisms involving parallel activation of pyruvate dehydrogenase and
acetyl-coenzyme A carboxylase. Biochem.J. 166: 627-630.
7. Agius, L. and D. H. Williamson. 1981. The utilization of ketone bodies by the
interscapular brown adipose tissue of the rat. Biochemica Biophysica Acta 666:
127-132.
8. Wright, J. and L. Agius. 1983. Fatty acid synthesis and ketone body utilization by
brown adipose tissue of the rat. Response to cold or nutritional state? Biochemica
Biophysica Acta 753: 244-248.
19
by guest, on January 19, 2019w
ww
.jlr.orgD
ownloaded from

9. Williamson, D. H. and V. Ilic. 1985. Activities of enzymes of acetoacetate
metabolism in rat brown adipose tissue during development. Biochem.J. 231: 773-
775.
10. Cooney, G., R. Curi, A. Mitchelson, P. Newsholme, M. Simpson, and E. A.
Newsholme. 1986. Activities of some key enzymes of carbohydrate, ketone body,
adenosine and glutamine metabolism in liver, and brown and white adipose tissues
of the rat. Biochem Biophys Res Commun 138: 687-92.
11. Brito, M. N., N. A. Brito, S. R. Brito, M. A. Moura, N. H. Kawashita, I. C.
Kettelhut, and R. H. Migliorini. 1999. Brown adipose tissue triacylglycerol
synthesis in rats adapted to a high-protein, carbohydrate-free diet. Am.J.Physiol
276: R1003-R1009.
12. Kawashita, N. H., W. T. Festuccia, M. N. Brito, M. A. Moura, S. R. Brito, M. A.
Garofalo, I. C. Kettelhut, and R. H. Migliorini. 2002. Glycerokinase activity in
brown adipose tissue: a sympathetic regulation? Am.J.Physiol Regul.Integr.Comp
Physiol 282: R1185-R1190.
13. Tagliaferro, A. R., S. Dobbin, R. Curi, B. Leighton, L. D. Meeker, and E. A.
Newsholme. 1990. Effects of diet and exercise on the in vivo rates of the
triglyceride-fatty acid cycle in adipose tissue and muscle of the rat. Int.J.Obes. 14:
957-971.
14. Bernlohr, D. A., C. W. Angus, M. D. Lane, M. A. Bolanowski, and T. J. Kelly.
1984. Exprssion of specific mRNAs during adipose differentiation: identification of
an mRNA encoding a homologue of mylin P2 protein. Proc.Natl.Acad.Sci.U.S.A.
81: 5468-5472.
15. Shimizu, Y., D. Kielar, H. Masuno, Y. Minokoshi, and T. Shimazu. 1994.
Dexamethasone induces the GLUT4 glucose transporter, and responses of glucose
transport to norepinephrine and insulin in primary cultures of brown adipocytes.
J.Biochem.(Tokyo) 115: 1069-1074.
20
by guest, on January 19, 2019w
ww
.jlr.orgD
ownloaded from

16. Shima, A., Y. Shinohara, K. Doi, and H. Terada. 1994. Normal differentiation of rat
brown adipocytes in primary culture judged by their expressions of uncoupling
protein and the physiological isoform of glucose transporter. Biochemica
Biophysica Acta 1223: 1-8.
17. Miki, H., T. Yamauchi, R. Suzuki, K. Komeda, A. Tsuchida, N. Kubota, Y.
Terauchi, J. Kamon, Y. Kaburagi, J. Matsui, Y. Akanuma, R. Nagai, S. Kimura, K.
Tobe, and T. Kadowaki. 2001. Essential role of insulin receptor substrate 1 (IRS-1)
and IRS-2 in adipocyte differentiation. Mol.Cell Biol. 21: 2521-2532.
18. Kharroubi, A. T., T. M. Masterson, T. A. Aldaghlas, K. A. Kennedy, and J. K.
Kelleher. 1992. Isotopomer spectral analysis of triglyceride fatty acid synthesis in
3T3-L1 cells. Am J Physiol 263: E667-E675.
19. Rosen, E. D. and B. M. Spiegelman. 2000. Molecular regulation of adipogenesis.
Annu.Rev.Cell Dev.Biol. 16: 145-171.
20. Fasshauer, M., J. Klein, K. M. Kriauciunas, K. Ueki, M. Benito, and C. R. Kahn.
2001. Essential role of insulin receptor substrate 1 in differentiation of brown
adipocytes. Mol.Cell Biol. 21: 319-329.
21. Hara, A. and N. S. Radin. 1978. Lipid extraction of tissues with a low-toxicity
solvent. Anal.Biochem. 90: 420-426.
22. Flakoll, P. J., M. Zheng, S. Vaughan, and M. J. Borel. 2000. Determination of
stable isotopic enrichment and concentration of glycerol in plasma via gas
chromatography-mass spectrometry for the estimation of lipolysis in vivo.
J.Chromatogr.B Biomed.Sci.Appl. 744: 47-54.
23. Kelleher, J. K. and T. M. Masterson. 1992. Model equations for condensation
biosynthesis using stable isotopes and radioisotopes. Am J Physiol 262: E118-E125.
24. Darlington, G. J., S. E. Ross, and O. A. MacDougald. 1998. The role of C/EBP
genes in adipocyte differentiation. J.Biol.Chem. 273: 30057-30060.
21
by guest, on January 19, 2019w
ww
.jlr.orgD
ownloaded from

25. Chakrabarty, K., B. Chaudhuri, and H. Jeffay. 1983. Glycerokinase activity in
human brown adipose tissue. J.Lipid Res. 24: 381-390.
26. Kowalchuk, J. M., R. Curi, and E. A. Newsholme. 1988. Glutamine metabolism in
isolated incubated adipocytes of the rat. Biochem.J. 249: 705-708.
27. Newsholme, E. A. and A. L. Carrie. 1994. Quantitative aspects of glucose and
glutamine metabolism by intestinal cells. Gut. 35: S13-S17.
28. D'Adamo, A. F. and D. E. Haft. 1989. An alternative pathway of alpha-
ketoglutarate catabolism in the isolated, perfused rat liver. J.Biol.Chem. 240: 613-
617.
29. Holleran, A. L., D. A. Briscoe, G. Fiskum, and J. K. Kelleher. 1995. Glutamine
metabolism in AS-30D hepatoma cells. Evidence for its conversion into lipids via
reductive carboxylation. Mol Cell Biochem 152: 95-101.
30. Festuccia, W. T., N. H. Kawashita, M. A. Garofalo, M. A. Moura, S. R. Brito, I. C.
Kettelhut, and R. H. Migliorini. 2003. Control of glyceroneogenic activity in rat
brown adipose tissue. Am.J.Physiol Regul.Integr.Comp Physiol 285: R177-R182.
31. Valverde, A. M., M. Benito, and M. Lorenzo. 1992. Hormonal regulation of malic
enzyme and glucose-6-phosphate-dehydrogenase expression in fetal brown-
adipocyte primary cultures under non-proliferative conditions. Eur.J.Biochem. 203:
313-319.
32. Garcia-Jimenez, C., A. Hernandez, M. J. Obregon, and P. Santisteban. 1993. Malic
enzyme gene expression in differentiating brown adipocytes: regulation by insulin
and triiodothyronine. Endocrinology 132: 1537-1543.
22
by guest, on January 19, 2019w
ww
.jlr.orgD
ownloaded from

Figure legends
Figure 1. Protocol for brown adipose cell differentiation and ISA analysis
A: Standard differentiation protocol for WT or IRS-1 KO brown adipocytes. Cells were seeded into a well of 10-cm2 surface area with Differentiation medium and grown to confluence. On day 0, medium was changed to Induction medium containing the following induction chemicals: Dex, IBMX, and indomethacin. On day 2, cells were returned to Differentiation medium containing 13C-labeled substrates. On day 6, lipids were extracted from the cells for analysis. Insulin and T3 were present in the medium throughout the whole cell-culture period. B: Isotopomer spectral analysis (ISA) model for de novo biosynthesis of palmitate. Substrate labeled with 13C is converted to 13C-labeled acetyl CoA, which is mixed with acetyl CoA derived from natural sources in intracellular pool of acetyl CoA at a constant ratio of D to 1-D. One molecule of palmitate is synthesized from eight molecules of acetyl CoA in the homogeneous pool. When total cellular palmitate is sampled at the end of the incubation after the time period “t”, the fraction of palmitate resulting from de novo biosynthesis is g(t).
Figure 2. Quantifying fatty acid synthesis in WT and IRS-1 KO cells
Amounts of total fatty acids under three culture conditions on day 6 measured by GC-MS using triheptadecanoin as the internal standard (conditions as described in Methods and Fig. 1A). Std: Induction medium from day 0 to day 2, Differentiation medium from day 2 to day 6; AcAc+: addition of 10 mM acetoacetate from day 2 to day 6; Dex-: Induction medium without Dex from day 0 to day 2. Data shown are mean ± SEM (n = 3) in WT and IRS-1 KO brown adipocytes. No significant difference was found among the three conditions in either WT or IRS-1 KO cells.
Figure 3. ISA of palmitate synthesis in brown adipose cells
Representative isotopomer distribution of methyl palmitate (sampled on day 6 from WT brown adipocytes under AcAc+ condition with [U-13C] glutamine from day 2 to day 6) compared to its fit by ISA model with D = 0.15 and g(4 day) = 0.73.
Figure 4. Flux of carbon sources to lipids in brown adipose cells
A: Fractional tracer contribution (D values) for palmitate synthesis from Glc, Gln, or AcAc in WT and IRS-1 KO brown adipocytes on day 6 (13C-labeling from day 2 to day 6) under Std, AcAc+, or Dex- conditions. B: Fractional synthesis (g(4 day) values) for the same conditions as above. C: Partitioning of fatty acid synthesis among substrates - the products of g(4 day) × the amount of total fatty acids per protein mass (µg/mg) partitioned for the corresponding D values. Data shown are mean ± SEM (n = 6). Asterisk (*) indicates significant difference between the standard condition and each of the modified conditions with the same 13C-labeled precursors at P ≤ 0.01.
23
by guest, on January 19, 2019w
ww
.jlr.orgD
ownloaded from

24
D: Consumption of glutamine and glucose from the medium and production of lactate into the medium for WT brown adipocytes under Std condition within 48 hrs (days 4-6). Figure 5. Effect of absence of glucose or glutamine on flux of carbon sources to fatty acids. A: D values for palmitate synthesis from either Glc or Gln in WT brown adipocytes under Std, Gln-, and Glc- conditions on day 6 (13C-labeling of Glc or Gln from day 2 to day 6). Data shown are mean ± SEM (n ≥ 4). Asterisk (*) indicates significant difference between the conditions with the same 13C-labeled precursors at P ≤ 0.01. B: Relative amounts of total fatty acids per protein mass in WT cells - effect of the absence of glucose. Conditions were the same as in 5A except for Glc-AcAc+: the addition of 10 mM acetoacetate and the absence of glucose from day 2 to day 6.
Figure 6. Carbon sources for glycerol backbone of lipids
Isotopomer distribution of TBDMS derivative of glycerol from lipids of WT cells following four-day labeling with either [U-13C] glucose or [U-13C] glutamine on day 6 under Std condition. Large M3 value indicates that glucose, and not glutamine, supplies carbon for glycerol. Data shown are the averages of two independent determinations with error bars indicating the ranges.
Figure 7. Effect of acetate on flux of carbon sources to fatty acids
A: Fractional tracer contribution, D values, for palmitate synthesis from Glc, Gln, or AC in WT and IRS-1 KO BF cells under standard + acetate condition (AC+) on day 6 (13C-labeling from day 2 to day 6). Data shown are mean ± SEM (n ≥ 3). Asterisk (*) indicates significant difference between the standard condition (Fig. 4A) and the AC+ condition with the same 13C-labeled precursors at P ≤ 0.01. B: Fractional synthesis, g (4 day) values, for the same conditions as in 7A.
by guest, on January 19, 2019w
ww
.jlr.orgD
ownloaded from

Fig. 1A
DAY 0 2 4 6
Growth Induction Differentiation
13C labeled substrates
Insulin, T3 Insulin, T3 Insulin, T3
Dex. IBMX Indomethacin Isolate lipids for analysis
Fig. 1B
1-g(t)
NewlySynthesized
Palmitate g(t) =?
D = ? 1-D ?
C-C
*C-*C*C-*C
8 Acetyl CoA -> 1 palmitate
C-C
Pre-existingPalmitate
SampledPalmitate
Natural sources of Acetyl CoA
*C-*C C-C13C labeled substrate
0 1 2 Mass +0 1 2 3 4
Mass +
0 1 2 3 4Mass +
by guest, on January 19, 2019w
ww
.jlr.orgD
ownloaded from

0
20
40
60
80
100
120
140
Std AcAc+ Dex-
Culture conditions
Am
ount
of t
otal
fatty
aci
dspe
r pro
tein
mas
s (u
g/m
g)WT IRS-1 KO
Fig. 2
by guest, on January 19, 2019w
ww
.jlr.orgD
ownloaded from
Model: Pre-existing Model: New synthesis
0 1 2 3 4 5 6 7 80.00
0.05
0.10
0.15
0.20
0.25
0.30
0.35
0.40
0.45
Fig. 3
D = 0.15g (4 day) = 0.73
DataFr
actio
nal A
bund
ance
Mass +
by guest, on January 19, 2019 www.jlr.org Downloaded from

0.0
0.1
0.2
0.3
0.4
0.5
0.6
0.7
0.8
Glc Gln AcAc Glc Gln Glc Gln
Culture conditions and 13C-labeled precursors
D v
alue
s
WT
IRS-1 KO
Std AcAc+ Dex-
*
*
*
*
* *
Fig. 4A
0.0
0.1
0.2
0.3
0.4
0.5
0.6
0.7
0.8
0.9
Std AcAc+ Dex-
Culture conditions
g (4
day
)
WT
IRS-1 KO
*
Fig. 4B
by guest, on January 19, 2019w
ww
.jlr.orgD
ownloaded from

0
20
40
60
80
100
120
Std AcAc+ Dex-
Culture Conditions
(Am
ount
of t
otal
fatty
aci
d pe
rpr
otei
n m
ass)
x g
(4 d
ay) (
ug/m
g)
WT
IRS-1 KO
*Glc
Gln
Other
GlcGln
OtherGlc
Gln
AcAc
Glc
Gln
Other
GlcGlnAcAc
GlcGln
Other
Fig. 4C
by guest, on January 19, 2019 www.jlr.org Downloaded from

0
1
2
3
4
0 hr 48 hr
Time (hr)
Glu
tam
ine
(mM
)
0
5
10
15
20
25
Glu
cose
/ La
ctat
e (m
M)
GlutamineGlucose
Lactate
Fig. 4D
by guest, on January 19, 2019w
ww
.jlr.orgD
ownloaded from

0.0
0.1
0.2
0.3
0.4
0.5
0.6
0.7
Std (Glc+Gln) Gln- Glc-
Culture conditions of WT cells
D v
alue
sD(Gln)
D(Glc) *
*
Fig. 5A
by guest, on January 19, 2019w
ww
.jlr.orgD
ownloaded from

0%
20%
40%
60%
80%
100%
120%
Std(Glc+Gln)
Gln- Glc- Glc-AcAc+
Culture conditions of WT cells
Rel
ativ
e am
ount
of t
otal
fatty
aci
ds p
er p
rote
in m
ass
Fig. 5B
by guest, on January 19, 2019w
ww
.jlr.orgD
ownloaded from

0
1
2
3
4
5
0 1 2 3 4 5
Mass+
Rel
ativ
e ab
unda
nce
[U-13C] glucose[U-13C] glutamine
Fig. 6
by guest, on January 19, 2019w
ww
.jlr.orgD
ownloaded from

0.0
0.1
0.2
0.3
0.4
0.5
acetate glucose glutamine
U-13C labeled precursors
D v
alue
s WT
IRS-1 KO
*
Fig. 7A
0.0
0.1
0.2
0.3
0.4
0.5
0.6
0.7
0.8
0.9
WT IRS-1 KO
g (4
day
) val
ues
Fig. 7B
by guest, on January 19, 2019w
ww
.jlr.orgD
ownloaded from