quantifying land use/cover change of oredo, egor, …...oredo, egor, and ikpoba-okha are local...
TRANSCRIPT

International Journal of Scientific & Engineering Research, Volume 6, Issue 11, November-2015 180
ISSN 2229-5518
IJSER © 2015
http://www.ijser.org
Quantifying Land use/cover change of Oredo, Egor, Ikpoba-Okha LGA, Benin City, Edo State,
Nigeria from 1987-2013 Dirisu Dolo Kelvin, Frimpong Emmanuel Osei,
Eguaroje Onoshi Ezekiel, Alaga Abayomi Taofik
Abstract - With the phenomenal increasing population globally and in particular Nigeria, it is very important to be aware of the limited
resources that are available to the huge number of people. The size of land remains unchanged (devoid of a catastrophe) but to put the
land in good use to be sustainable, it is crucial to know the various land cover and land uses of an area to be able to plan how future
developments would be executed. This information notwithstanding is not readily available to authorities to help plan the area. It is for this
reason that this work was carried out to provide this gab in knowledge on the LULC of the Oredo, Egor, Ikpoba-Okha local government
areas (LGA) which are forms the main growing areas of Benin City of Edo State in Nigeria. Changes in the LCLU between the period of
1987 and 2013 in the study area were considered and how the lands uses changed during that period, using geospatial techniques.
Satellites images of the area in 1987 and 2013 from the Landsat achieve were used for this work. The figures showed that while forest and
water body in the study area decreased at an average of 13.69 Km2 (2.12%) and 0.123 Km2 (1.85%) annually respectively the other land
uses increased over the same period – Agricland = 1.409 Km2 at 0.81% annually, Grass = 4.980 Km2 at 2.40% annually, Settlement =
5.421 Km2 at 4.86% annually and wetland = 1.89 Km2 at 2.73% annually. Thus the increasing population of the area has shifted the land
use from the natural use as forest and water body to the artificial use as buildings for bot accommodation and commercial as well as
farmlands to feed the growing numbers.
Index Terms - Land cover Land use, Geospatial technique, Satellite image, Landsat.
—————————— ——————————
1 INTRODUCTION
T is a communal practice that the terms land-cover and land-use (LULC) are often used in place of the other. They are however, different. Land-cover refers to the surface
cover on the ground, whether vegetation, urban infrastructure, water, or bare soil. Identifying, delineating and mapping land-cover is important for global monitoring studies, resource management and planning activities [1]. When land-cover of an area is well-known it forms the baseline from which monitoring activities (change detection) can be performed and provides the ground cover information for baseline thematic maps. On the other hand Land-use refers to the purpose the land serves and this includes purposes such as settlement, recreation, or agriculture etc. Knowing what the land-use in an area requires baseline mapping and subsequent monitoring. This will not only enlighten one on the current use of land but also enable one to know how the land-use is changing with time. It is therefore essential to clearly know
this difference between land cover and land use, and the information that can be obtained from each [1]. Most major metropolitan areas face the growing problems of urban sprawl, loss of natural vegetation and open space, and a general decline in the extent and connectivity of wetlands and wildlife habitat and urban growth rates show no signs of slowing, especially when viewed at the global scale, since these problems can be generally attributed to increasing population. Cities have changed from small, isolated population centers to large, interconnected economic, physical, and environmental features. Urban growth and the concentration of people in urban areas are creating societal problems world-wide. One hundred years ago, approximately 15 percent of the world's population was living in urban areas. Today, the percentage is nearly 50 percent. In the last 200 years, world population has increased six times, stressing ecological and social systems. Over that same time period, the urban population has increased 100 times, concentrating more people on less land even as the total land devoted to urbanization expands. Yet the temporal and spatial dimensions of the land use changes that shape urbanization are little known, even in the world over. The story is no different in the study area. Nigeria is the most populous country in Africa accounting for approximately one sixth of the African population (or one fifth of Sub-Saharan African population). United Nation [2] reported that Nigeria had a population of 37,860 thousand in 1950, which has risen steadily over the years to a staggering number of 182,202 thousand in 2015. This represents 381.3% for the 65 year period averaging 5.8% annually. It is also reported by [3] that approximately 50% of Nigerians are urban dwellers. This means that there is going to be a huge stress on the available
I
————————————————
Dirisu Dolo Kelvin is currently pursuing a master’s degree program in remote sensing
and GIS and doubles as a scientific officer with cooperative information network
(COPINE) of National Space Research and Development Agency (NASRDA). E-mail:
Frimpong Emmanuel Osei works with the Ghana Space Science & Tech Inst as a research
scientist with particular interest in Environmental monitoring using Earth Observation
Systems for the purposes of sustainable development. E-mail: [email protected]
Eguaroje O. E. is pursuing a PhD program in at the Obafemi Awolowo University and is
a deputy director in National Centre for Remote Sensing (NCRS), Jos, Email:
ALAGA, A. T., is the National coordinator/CEO of (COPINE). Email:
————————————————
IJSER
International Journal of Scientific & Engineering Research, Volume 6, Issue 11, November-2015 181
ISSN 2229-5518
IJSER © 2015
http://www.ijser.org
lands in the country to satisfy both the agricultural and accommodation needs of the urban dwellers and so there is the need for proper administration of lands. Nigeria has 36 States and Edo is one of the states located in the South South part of the country [4]. Nigerian National Population Commission [4] reports that, the population of Edo state stood at 3,233,366 with Benin City accounting 35.5 (%) per the 2006 population and housing census. Benin City has
seven (7) Local Government Areas (LGAs) with three being the most populated. These are Oredo (374,515), Egor (340,287) and Ikpoba-Okha (372,080). For this reason of the high population in these LGAs in Benin City, this work will quantify the various land use and land cover in the area for effective planning. There has been attempts by scientist to improve on their knowledge of the world in this direction over the years
employing methods as ground surveys, aerial photogrammetry and satellite remote sensing in the past five decades to extensively map LULC. The cost and time-consuming nature of ground surveys and aerial photogrammetry confines them to small areas and low temporal domains [5]. Satellite remote sensing has the advantages of long-term data, wide spatial and synoptic coverage as well as high temporal resolution, making this technique an important technology for mapping LULC and its
changes for the past three decades after the launch of the Landsat group of satellites [1]. Remote sensing methods of mapping LULC change include multi- data composites, change vector, image algebra image differencing, image ratio), on-screen digitization, GIS overlay and post-classification comparison [6]; [7]; [8]; [9]; [10]. Therefore, this study will adopt remote sensing as a tool for quantifying the LULC change in the study area.
2 MATERIALS AND METHODS
2.1 Study Area
Oredo, Egor, and Ikpoba-Okha are local government areas in Benin City Edo state in Nigeria. This area is densely populated than every other area in Benin with a population of about 544,479 and 359.802 km2 [4]. The geographical co-ordinates of the city limits lie within the Latitudes 6°261 and 6°341 North of Equator and Longitude 5°351 and 5°41 East of Greenwich Meridian. Most of the social amenities, including the University of Benin, are located in these areas. This constitutes the driving force for the tremendous increasing population of the area. Apart from other commercial activities, craft work and agriculture are the main occupations of the people of Benin-City. Being a tropical climate area cultivation of crops like maize, yam, cassava, plantain, palm produce, rubber, and cocoa is very suitable. It is no surprise there are numbers of government farms scattered in and around the city [11]. 2.2 Materials
Cloud Free Landsat images for the years 1987 and 2013 with
path 189 and row 056 containing the study area were
downloaded free from the USGS website. According to [10]
and [12] Landsat images have high spatial resolution suitable
for the USGS Land cover classification system level 1. The
analytical tools used were ERDAS Imagine 2014 and ENVI 5.0
for the image processing including pre-processing, image
classification and accuracy assessment. The output of these
computer programs was then put in ArcGIS 10.2.2 to generate
output (thematic) maps and also used to carry out all the GIS
analysis that was done. The statistics from the thematic maps
were extracted and taken to Microsoft excel for further
analyses.
2.3 Method
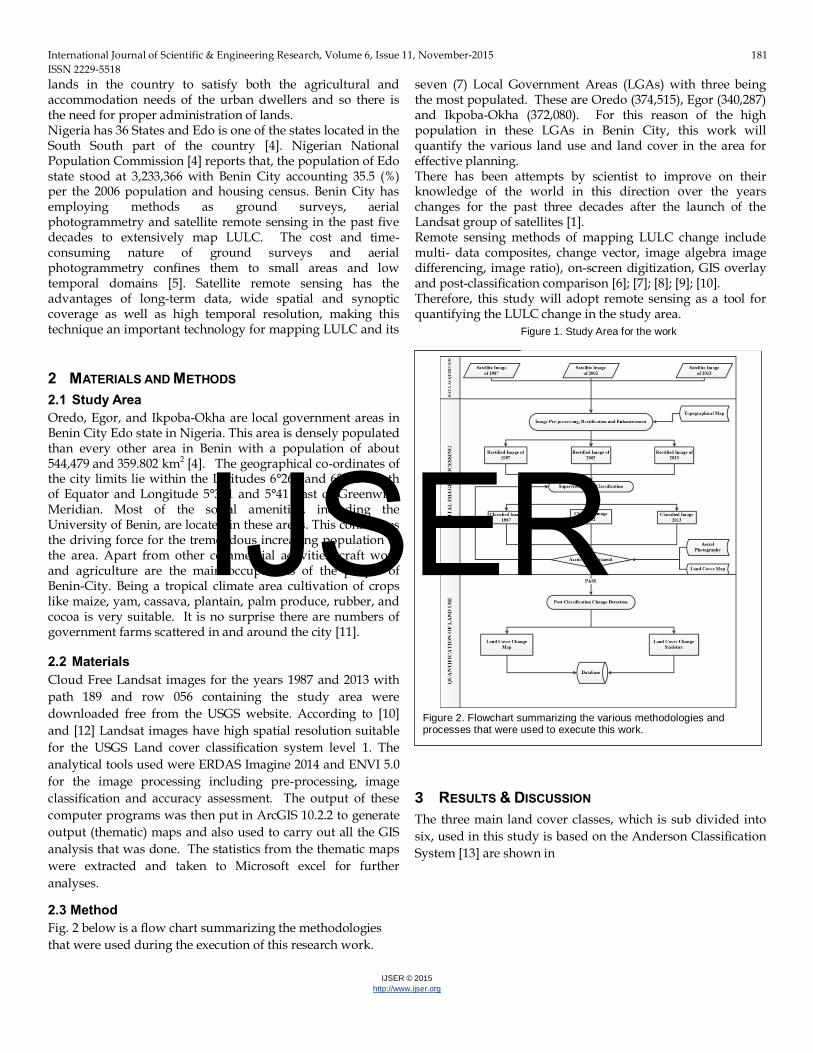
Fig. 2 below is a flow chart summarizing the methodologies
that were used during the execution of this research work.
3 RESULTS & DISCUSSION
The three main land cover classes, which is sub divided into
six, used in this study is based on the Anderson Classification
System [13] are shown in
Figure 2. Flowchart summarizing the various methodologies and processes that were used to execute this work.
Figure 1. Study Area for the work
IJSER

International Journal of Scientific & Engineering Research, Volume 6, Issue 11, November-2015 182
ISSN 2229-5518
IJSER © 2015
http://www.ijser.org
TABLE 1.
TABLE 1
Description of the land cover classification system used in the study
Main
Cover
Class
Sub Cover
Class
Description
URBAN Urban/Built- up This comprises of areas of intensive use
with much of the land covered by
structures. Included in this category are
cities, towns, villages, highways and
transportation, power, and
communications facilities.
WATER Water and
Wetland
This consists of areas persistently
covered with water; provided that if
linear they are at least 200m wide. This
category includes; streams and canals,
lakes, reservoirs, bays and Estuaries
NON-
URBAN
Barren land Barren Land is land of limited ability to
support life and in which less than one-
third of the area has vegetation or other
cover.
Agricultural
land
Agricultural Land may be defined
broadly as land used primarily for
production of food and fiber. This
category includes; Cropland and
Pasture, Ornamental Horticultural
Areas.
Forestland Forest Lands have a tree-crown areal
density (crown closure percentage) of
10% or more, are stocked with trees
capable of producing timber or other
wood products, and exert an influence
on the climate or water regime.
Forestlands include Deciduous,
Evergreen and Mixed Forestlands.
The results of the supervised classification produced the
thematic maps in Figures 3 and 4 with the accompanying
statistics in Table
Very significant among the figures in the table 2 is the forest
cover. While in 1987 there was a total of 646.4363 Km2 of
forest cover representing more than half (53.45%) of the total
land cover of the study area, it has dwindled to as low as
290.5646 Km2 (24.03%). That is a decrease of 355.8717 Km2
representing 55.05% of the forest cover. From both the table
and figure below it is observed that all the other land uses
(except for water which decreased as indicated in the figure)
increased. This makes sense in that the population kept
increasing from 1987 to 2013 and so to sustained life, forest
had to give way to other uses as agriculture and for other
Figure 4. Land Cover Land Use map of the study area in 1987 generated from ENVI 5.0 supervised classification and ArcGIS 10.2.2
Figure 3. . Land Cover Land Use map of the study area in 2013 generated from ENVI 5.0 supervised classification and ArcGIS 10.2.2
IJSER
International Journal of Scientific & Engineering Research, Volume 6, Issue 11, November-2015 183
ISSN 2229-5518
IJSER © 2015
http://www.ijser.org
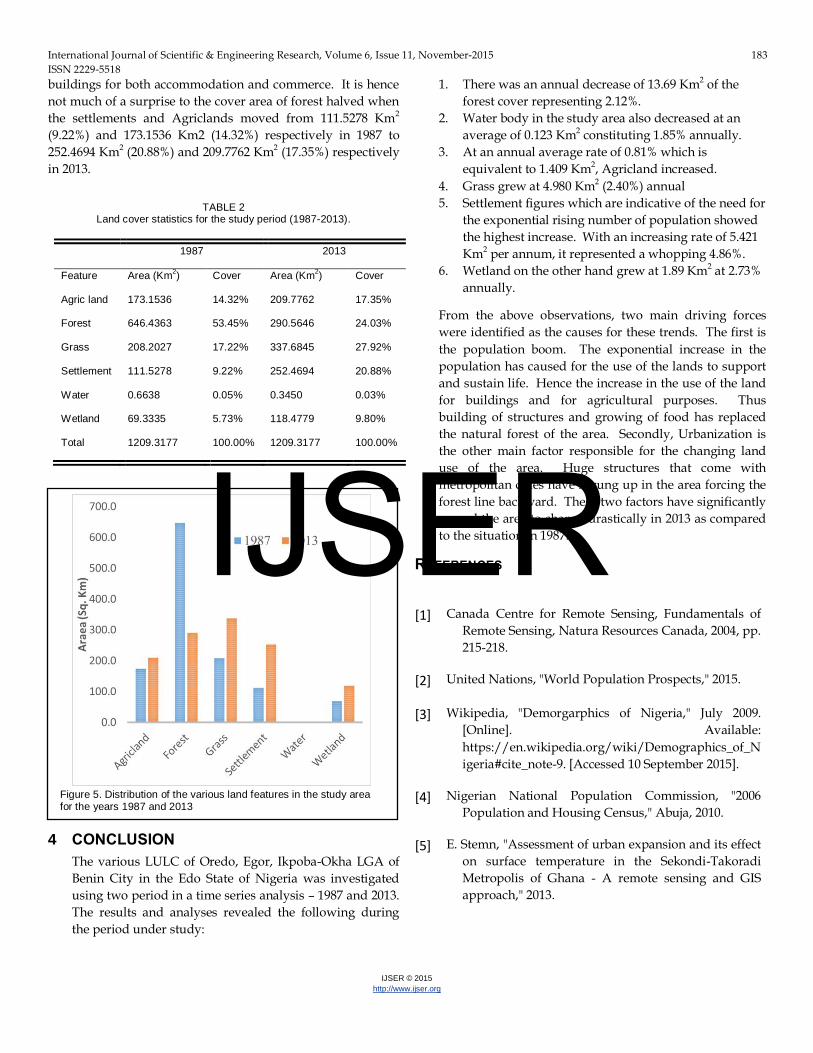
buildings for both accommodation and commerce. It is hence
not much of a surprise to the cover area of forest halved when
the settlements and Agriclands moved from 111.5278 Km2
(9.22%) and 173.1536 Km2 (14.32%) respectively in 1987 to
252.4694 Km2 (20.88%) and 209.7762 Km2 (17.35%) respectively
in 2013.
TABLE 2
Land cover statistics for the study period (1987-2013).
1987 2013
Feature Area (Km2) Cover Area (Km
2) Cover
Agric land 173.1536 14.32% 209.7762 17.35%
Forest 646.4363 53.45% 290.5646 24.03%
Grass 208.2027 17.22% 337.6845 27.92%
Settlement 111.5278 9.22% 252.4694 20.88%
Water 0.6638 0.05% 0.3450 0.03%
Wetland 69.3335 5.73% 118.4779 9.80%
Total 1209.3177 100.00% 1209.3177 100.00%
4 CONCLUSION
The various LULC of Oredo, Egor, Ikpoba-Okha LGA of
Benin City in the Edo State of Nigeria was investigated
using two period in a time series analysis – 1987 and 2013.
The results and analyses revealed the following during
the period under study:
1. There was an annual decrease of 13.69 Km2 of the
forest cover representing 2.12%.
2. Water body in the study area also decreased at an
average of 0.123 Km2 constituting 1.85% annually.
3. At an annual average rate of 0.81% which is
equivalent to 1.409 Km2, Agricland increased.
4. Grass grew at 4.980 Km2 (2.40%) annual
5. Settlement figures which are indicative of the need for
the exponential rising number of population showed
the highest increase. With an increasing rate of 5.421
Km2 per annum, it represented a whopping 4.86%.
6. Wetland on the other hand grew at 1.89 Km2 at 2.73%
annually.
From the above observations, two main driving forces
were identified as the causes for these trends. The first is
the population boom. The exponential increase in the
population has caused for the use of the lands to support
and sustain life. Hence the increase in the use of the land
for buildings and for agricultural purposes. Thus
building of structures and growing of food has replaced
the natural forest of the area. Secondly, Urbanization is
the other main factor responsible for the changing land
use of the area. Huge structures that come with
metropolitan cities have sprung up in the area forcing the
forest line backward. These two factors have significantly
caused the area to change drastically in 2013 as compared
to the situation in 1987.
REFERENCES
[1] Canada Centre for Remote Sensing, Fundamentals of
Remote Sensing, Natura Resources Canada, 2004, pp.
215-218.
[2] United Nations, "World Population Prospects," 2015.
[3] Wikipedia, "Demorgarphics of Nigeria," July 2009.
[Online]. Available:
https://en.wikipedia.org/wiki/Demographics_of_N
igeria#cite_note-9. [Accessed 10 September 2015].
[4] Nigerian National Population Commission, "2006
Population and Housing Census," Abuja, 2010.
[5] E. Stemn, "Assessment of urban expansion and its effect
on surface temperature in the Sekondi-Takoradi
Metropolis of Ghana - A remote sensing and GIS
approach," 2013.
Figure 5. Distribution of the various land features in the study area for the years 1987 and 2013
IJSER
International Journal of Scientific & Engineering Research, Volume 6, Issue 11, November-2015 184
ISSN 2229-5518
IJSER © 2015
http://www.ijser.org
[6] A. O. Zubair, "Change Detection in Land Use and Land
Cover Using Remote Sensing Data and GIS: A case
study of Ilorin and its environs in Kwara," Ibadan,
Nigeria, 2006.
[7] E. Coppin, I. Jonckheere, K. Nackaerts and B. Muys,
"Digital Change Detection Methods in Ecosystem
Monitoring: A review," International Journal of Remote
Sensing, vol. 25, no. 9, pp. 1565-1596, 2004.
[8] D. Lu, P. Mausel, E. Brundizio and E. Moran, "Change
Detection Technique," International Journal of Remote
Sensing, vol. 25, no. 12, pp. 2365-2407, 2004.
[9] R. S. Lunetta and C. D. Elvidge, "Remote Sensing
Change Detection," Environmental Monitoring Methods
and Application, 1999.
[10] J. B. Campell, "Introduction to Remote Sensing," 2002.
[11] Nurhi, 2013.
[12] J. R. Jensen, "Remote Sensing of the Environment: an
Earth Resource Perspective," 2000.
[13] J. R. Anderson, E. H. Ernest, J. T. Roach and R. E.
Wutmar, "Land Use and Land Cover Classification
System for Use with Remote Sensing Data," 1976.
IJSER