quantifying spatially-explicit change in sediment … · quantifying spatially-explicit change in...
TRANSCRIPT

1
Quantifying spatially-explicit change in sediment storage on an emerging floodplain and wetland on Carneros Creek, CA
A Capstone Project Presented to the Faculty of Science and Environmental Policy
in the College of Science, Media Arts, and Technology
at California State University, Monterey Bay
in Partial Fulfillment of the Requirements for the Degree of Bachelor of Science
by Ryan Bassett

2
12 May 2010
Abstract
Although wetlands provide valuable ecosystem services including flood protection, groundwater recharge, and water quality improvement, over 90% of California’s wetlands have been altered, degraded or replaced as urban or agricultural land, prompting a rush to protect, preserve, and restore wetlands whenever possible. The Agriculture and Land Based Training Association (ALBA) is a non-profit organization that owns and operates a small organic farm located on Carneros Creek, the primary freshwater tributary of the Elkhorn Slough National Estuarine Research Reserve. ALBA is interested in restoring aquatic habitat, and improving water quality in Carneros Creek by restoring previously impacted floodplains and wetlands. This study used total-station surveys and the placement of artificial grass mats to quantify the change in volume of sediment over one rainy season of a 13,000 m2 floodplain and wetland on the Triple M Ranch. Volume of floodplain change was quantified by subtracting gridded raster files using ESRI ArcGIS. Analysis of the raster subtraction determined that the northeast floodplain had a net gain of 4.8 x 10² m3 of sediment, with a mean deposition of 0.052 m. When combined with additional data collected from other depositional areas on the property, these findings will provide an independent check to a mass balance sediment budget completed for the whole site, which is being completed in a separate study. This project is the first step in quantifying the mass, volume and spatial accumulation of sediment within a complex unregulated wetland and floodplain system.
Introduction
Carneros Creek is the primary source of fresh water flowing into Elkhorn Slough, a National
Estuarine Research Reserve located on the central coast of California (Figure 1). The majority of the
creek has been channelized in order to maximize the amount of land available for agriculture and cattle
grazing. The channel walls have been reinforced with dredge spoil levees to provide some level of flood
protection for the surrounding property. However, there is evidence that Carneros Creek was once a
meandering stream with connected floodplains, oxbow ponds, and wetlands that would have supported
riparian habitat and amphibian populations. This problem is not unique to the Monterey Bay; wetlands
all over the country face destruction from toxic runoff, invasive species, and direct anthropogenic
threats such as development and agriculture. In California alone, over 90% of the state’s wetlands have
been lost; adding up to approximately 26 million fewer acres of available wetlands (Natural Resource
Agency, State of California, 2009). As defined by the U.S. Army Corps of Engineers and the

3
Environmental Protection Agency (EPA), wetlands are, “areas that are inundated or saturated by surface
or ground water at a frequency and duration sufficient to support, and that under normal circumstances
do support, a prevalence of vegetation typically adapted for life in saturated soil conditions. Wetlands
generally include swamps, marshes, bogs, and similar areas." (Clean Water Act, Sec 404). However, in
April 2008, the California State Board felt that other critical habitats including un-vegetated mudflats
and tidal pools, should also be included as protected wetlands and directed staff to “fill in the gaps” of
federal jurisdiction. Under this proposed plan, an area could be considered a wetland if; (1) it is
saturated by ground or surface water for a length of time sufficient to enable anaerobic conditions in
the soil, (2) has hydric substrate conditions indicative of wetland hydrology, and (3) is either lacking
vegetation or the vegetation present is dominated by hydrophytes. Even though these two definitions
of wetlands sound similar, the State Board’s definition allows for a looser interpretation for classifying
wetlands, potentially providing protection to areas that had been previously unregulated (State Water
Board Proposes Expanded Definition of Wetlands, 2009).
Benefits of Wetlands
The ecological, social, and economic values of wetlands are well published even though it is
often difficult to assign monetary values for their functions (Richardson, 1994, Turner et al, 2000).
Locally, wetlands provide flood protection, recharge groundwater, improve water quality by trapping
excess sediment and nutrients, and provide habitat for many plant and animal populations (Novitzki,
1997). Wetlands also have a have a global significance by playing a key role in the hydrologic, carbon,
sulfur, and methane cycles (Novitzki, 1997). Sedimentary processes often have the greatest influence in
wetland functions and are influential in water quality improvement (Harter & Mitsch, 2003). However,
much of the knowledge of these wetland systems originated from river delta and subsiding coastal
marsh research, and few studies have focused on freshwater wetlands. To date, very little research has
been done on freshwater wetland sedimentary processes, although a thorough understanding of these
systems would prove valuable insight into the functional processes of these systems (Harter & Mitsch,
2003).
Flood plains are generally non-homogenous depositional features with variability in spatial
patterns of erosion and deposition. Additionally, information on floodplain spatial variability is not well
studied, but is required to estimate spatial variations in sedimentation/ storage rate. This knowledge is

4
also vital for understanding the importance of substrate for floodplain ecosystems as well as
management decisions (Wasson, 2002).
Many federally and state listed threatened or endangered species that inhabit wetlands face
extinction in the absence of timely conservation and habitat restoration. The California Red-legged Frog
(Rana aurora draytonii) and the Santa Cruz Long-toed Salamander (Ambystoma macrodactylum
croceum) are two federally listed amphibian species that inhabit central Californian wetlands.
The Santa Cruz Long-toed Salamander is classified as federally threatened and is known to have
only three metapopulations located in Monterey and Santa Cruz Counties in Central California (U.S. Fish
and Wildlife Service. 1999). During breeding season, the salamander inhabits seasonal ponds near
woodland and upland scrub areas where the species is found the rest of the year. Habitat loss is a
primary factor in this species’ decline. The Santa Cruz Long-toed Salamander inhabits relatively few
areas in the California Central Coast, and road construction, urbanization, and agriculture restrict the
available habitat for this species even further. Decreased water quality through pollution and siltation
from nearby agriculture and development also take a toll the salamander populations, as well as the
spread of exotic plant species and predation by bull frogs, tiger salamanders and parasites. As stated in
the recovery plan, the delisting of the species may be considered when: populations are supported for a
minimum of twenty years in the Valencia-Seascape, Larkins Valley, Ellicott-Buena Vista and McClusky
Slough complexes; containing a minimum of three active breeding ponds with adequate upland scrub
and woodland habitat; al least one population existing under the previously stated conditions in
Monterey County (U.S. Fish and Wildlife Service. 1999). The USFWS (1999) also states that due to the
limited range and small population size, all populations of the Santa Cruz Long-toed Salamander warrant
protection and appropriate management.
The California Red-legged Frog is the largest native frog in the western United States with
females reaching a total body length of 138 mm and the slightly smaller males reaching 116 mm. The
frog’s back usually shows black specks or dark splotches, and its posterior abdomen and hind legs may
vary in color, but are often red or salmon pink (Federal Register, 2001). The frog generally breeds
December through March where a female may lay from 750 – 4000 eggs, and are typically found in calm
lagoons or ponds. They can tolerate freshwater to mildly brackish water, up to 4.5 ppt (Casagrande et al.
2006). This species is generally highly aquatic and often requires extensive vegetative cover, and even

5
though individuals may travel great distances especially on a rainy night, they tend to remain in their
home streamside or pond habitat (Morey et al. 2008). Even though the California Red-legged Frogs are
found in a range of conditions, they are most often observed in a Mediterranean climate where large
fluctuation in fluvial and floodplain processes exist and aquatic habitat frequently disappear seasonally.
However, there is a great deal of variation in how the frogs utilize their environment; some individuals
will stay in one habitat type for their entire life cycle, whereas other frogs seek multiple habitat types.
Thus, Red-legged Frog populations are most successful where many breeding areas are interconnected
by tolerable habitat types (U.S. Fish and Wildlife Service 2002). The Red-legged Frog is one of the best
known examples of amphibian decline; the frogs were once abundant and widespread in the southern
San Joaquin valley and Sierra Nevada, but today only six populations (and only one with more than 10
breeding adults) have been found within this range (Schafer et al. 2004). The California red-legged frog
was listed as a threatened species on May 31, 1996. Many researchers attribute the species’ decline to
habitat loss or alteration and the introduction of non-native invasive species including the bullfrog Rana
catesbeiana, which studies have shown compete for resources and prey upon red-legged Frogs, and
predatory fishes (Fed Reg. 2001).
Relevant Policy
The Clean Water Act (1977) is an amendment to the Federal Water Pollution Control Act of
1972. This legislation set up a framework that governs the discharge of pollutants into the nation’s
waterways and wetlands.
The Federal Agriculture Improvement and Reform Act of 1996 (Farm Bill) created a Wildlife
Habitat Incentives Program which provided $50 million to help landowners improve wildlife habitat on
their private land. This law also created A Flood Risk Reduction Program where farmers with land having
high flood potential to receive incentives to move farming operations away from frequently flooded
areas.
The Endangered Species Act of 1973 (ESA) is a program established for the conservation of
threatened and endangered plants and animals as well as the habitats in which they are found. In 1973,
congress declared that “...species of fish, wildlife, and plants in the United States have been rendered
extinct as a consequence of economic growth and development untempered by adequate concern and
conservation; other species of fish, wildlife, and plants have been so depleted in numbers that they are

6
in danger of or threatened with extinction; these species of fish, wildlife, and plants are of esthetic,
ecological, educational, historical, recreational, and scientific value to the Nation and its people..” The
ESA authorizes the listing of threatened and endangered species, prohibits unauthorized possession and
transportation of a listed species, and provided the federal government the authority to acquire land for
the purpose of conserving listed species. The ESA also established cooperative agreements and grants to
States so that they may create and maintain adequate programs for threatened and endangered
species. The act also allows civil and criminal penalties for the violation of regulations, and authorizes
rewards paid to anyone who provides information leading to the arrest and conviction of a violator of
the ESA (USC, 1973).
Study Location
Carneros Creek is the primary tributary feeding the Elkhorn Slough, a National Estuarine
Research Reserve and a globally important bird area located in Monterey Bay, CA. The Agriculture and
Land Based training Association (ALBA) owns and operates Triple M Ranch, which is located on the lower
reach of Carneros Creek (Figure 1). Triple M Ranch is a 195 acre farm, but has preserved 135 acres as
uncultivated land to be used for ecological conservation and restoration. ALBA is a non-profit
organization that has declared its mission to: train farmers in organic and sustainable farming practices;
provide marketing alternatives to small-scale and limited income farmers; and to enhance the biological
diversity and natural resources of their land. ALBA is interested in managing the flow of water and
sediment that passes through Triple M Ranch. They hope to improve water quality flowing into Elkhorn
Slough by trapping excess sediment and nutrients, as well as provide habitat for special status
amphibian species including the California Red-legged Frog and the Santa Cruz Long-toed Salamander.

7
Figure 1. Map showing location of ALBA's Triple M Ranch (orange dashed line), and the northeast floodplain (solid red line). Carneros Creek is shown as the light blue dashed line.
ALBA’s Triple M Ranch Relevant Goals and Objectives ALBA has listed the following goals and objectives for the restoration of Triple M Ranch, as quoted in a previous study (Largay, 2007):
1. Improve the water quality on Triple M Ranch and the Elkhorn Slough watershed a. Replace Sill Rd. crossing b. Reduce impacts of local water quality impairment sources c. Preserve existing features that are beneficial to water quality d. Reduce the likelihood of levee failure
1a. Restore a balanced sediment system on Triple M Ranch
a. Facilitate deposition on the northern floodplain b. Keep the option of increasing sediment transport to Elkhorn Slough
2. Restore diverse native plant communities
a. Remove non-native species and promote native riparian forest establishment
100 m

8
b. Protect existing native communities c. Increase biodiversity in wetlands dominated with Polygonum amphibium d. Replace non-native vegetation in favor of diverse native vegetation
3. Ensure ongoing activity is permitted within the California Endangered Species Act and the Safe
Harbors Agreement a. Maintain communication and collaboration with the USFWS and CADFG b. Consult a professional regulatory compliance agency
4. Provide flood storage
a. Ensure floodwater access to floodplains and wetlands b. Retain floodwaters on property using water control structures at the Sill rd. crossing. c. Minimize risk of levee failure
5. Reconnect Carneros Creek to its floodplain
6. Create additional open water habitat which would provide habitat for waterfowl and mosquito
control a. Where possible, remove agricultural fill to create wetlands with exposed clay soils b. Increase wetland water depth c. Implement mosquito control measures and collaborate with the Monterey County
Mosquito Abatement District
Of these six primary goals for the management and restoration of Triple M Ranch, this study is closely addressing goals 1, 1a, 4 and 5.
Study Objectives
The purpose of this study was to quantify the volume of sediment that was trapped on the
northeast floodplain on Triple M Ranch from Fall 2009 to Spring 2010. The floodplain occupies
approximately 13000 m2, and is located upstream of Johnson bridge, near where Carneros Creek enters
Triple M Ranch. The results will provide feedback to resource managers about the effects of their
conservation and restoration policies and actions. Research was conducted by comparing the change in
elevation as determined from Fall 2009 and Spring 2010 total-station surveys. Additionally, forty-eight
0.1 m2 artificial turf mats were placed on the wetland and floodplain on the northeast floodplain area of
the Triple M Ranch. These mats were staked down to ensure that they do not wash away before the
trapped sediment on the mats is collected and weighed. Due to the restricted timeframe associated
with this project, data from only one winter season (2009-2010) were analyzed. The method of using
artificial turf to collect sediment riparian areas has been proven to be a statistically and scientifically
valid approach (Kronvang et al. 2007, Steiger et al. 2003, Lambert & Walling, 1987). Comparison in
ArcGIS of the two total station surveys will provide results on the volume of change, in cubic meters, for
9
the whole study site. The recorded data from the turf mats will be g/m2, and extrapolated via GIS to the
area as a whole, and spatially illustrated.
The purpose of this study is to investigate the postulate that a floodplain and wetland are areas
of sediment storage, and when inundated with winter flows they will act as a sink for suspended and
bedload sediment. Specifically, this study examines the theory that that there was net aggradation of
sediment (> 0 m3) on the northeast floodplain of Triple M Ranch by estimating the amount of deposition
by comparing floodplain surface elevation before and after the 2009-2010 rainy season.
Methods
In October – November 2009, artificial grass square plots were placed on the ALBA’s Triple M
Ranch to trap sediment on floodplain and wetland of the North East Floodplain on the property. These
turf plots were staked down in order to minimize the chance of loss in times of high flow. The turf
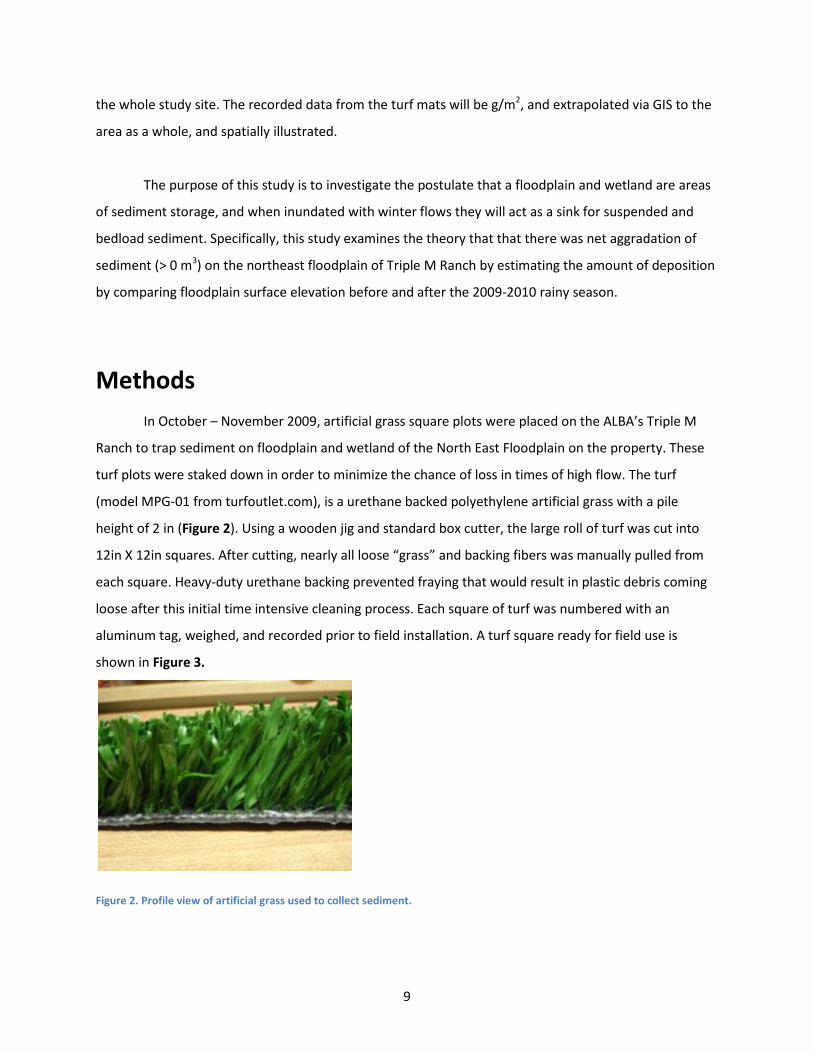
(model MPG-01 from turfoutlet.com), is a urethane backed polyethylene artificial grass with a pile
height of 2 in (Figure 2). Using a wooden jig and standard box cutter, the large roll of turf was cut into
12in X 12in squares. After cutting, nearly all loose “grass” and backing fibers was manually pulled from
each square. Heavy-duty urethane backing prevented fraying that would result in plastic debris coming
loose after this initial time intensive cleaning process. Each square of turf was numbered with an
aluminum tag, weighed, and recorded prior to field installation. A turf square ready for field use is
shown in Figure 3.
Figure 2. Profile view of artificial grass used to collect sediment.

10
Figure 3. Tagged 0.1 m2 artificial grass sediment trap
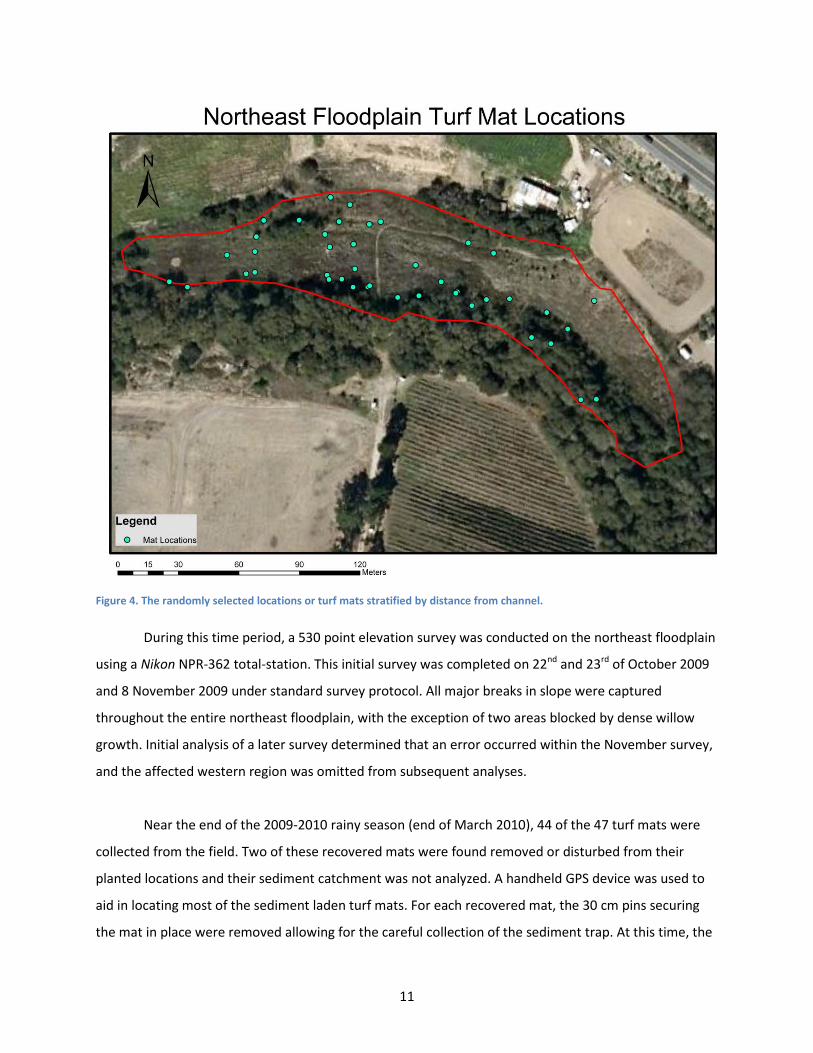
A total of 48 turf plots were placed individually at randomly selected locations stratified by distance
from channel (Figure 4). Because exceedingly dense vegetation is absent on the northeast floodplain,
minimal clearing was required except for some near-channel locations with dense blackberry growth. All
locations were randomly selected using GPS location selected via a random number generator in
Microsoft Excel. In the field, all points were located with handheld GPS units. The location and elevation
of all turf plots was recorded with a total-station in order to obtain a more precise location than would
be possible using the autonomous GPS unit that was used to place them. Each square was inset into the
soil approximately 2 cm to place the artificial turf flush with the natural soil horizon, minimizing the
plot’s alteration of shallow overland flow. The direction of the nap was also orientated to face the
anticipated direction of incoming water during high flow, and all mats were staked down using five 30
cm steel stakes.
11
Figure 4. The randomly selected locations or turf mats stratified by distance from channel.
During this time period, a 530 point elevation survey was conducted on the northeast floodplain
using a Nikon NPR-362 total-station. This initial survey was completed on 22nd and 23rd of October 2009
and 8 November 2009 under standard survey protocol. All major breaks in slope were captured
throughout the entire northeast floodplain, with the exception of two areas blocked by dense willow
growth. Initial analysis of a later survey determined that an error occurred within the November survey,
and the affected western region was omitted from subsequent analyses.
Near the end of the 2009-2010 rainy season (end of March 2010), 44 of the 47 turf mats were
collected from the field. Two of these recovered mats were found removed or disturbed from their
planted locations and their sediment catchment was not analyzed. A handheld GPS device was used to
aid in locating most of the sediment laden turf mats. For each recovered mat, the 30 cm pins securing
the mat in place were removed allowing for the careful collection of the sediment trap. At this time, the

12
majority of sediment clinging to the bottom of the mat was removed, as the mats were intended to
collect only sediment deposited by the flood waters of Carneros Creek. The mat was then placed into a
labeled 2 gallon Ziplock type bag and sealed. This process was repeated for every located turf mat and
great care was given to minimize the loss of trapped sediment throughout the collection process. To
help with drying and in preparation for lab analysis, all mats were laid out on top of their respective
collection bags in a covered barn on site for 4 days.
A second total-station survey was conducted following the turf mat collection. Similarly to the
pre-rainy season survey, all major breaks in slope as well as any erosional and depositional features
were captured.
Field dimensions and area were obtained through use of a Trimble Geo-XM GPS receiver. The
coordinates were post-processed in order to provide maximum accuracy.
Laboratory Methods
After 4 days of drying in the covered barn, each turf mat was placed back into its respective
Ziplock bag for 24 hours in preparation for laboratory processing of collected sediment. The remaining
moisture was removed using the following protocol. Individually, each mat was removed from its bag
and placed into a 50 cm X 40 cm plastic tub where the majority of sediment was manually removed. This
damp sediment was placed into a pre-weighed and numbered canvas bag; each bag is sealable with a
drawstring and was designed to dry bedload sediment samples in a laboratory oven. The drawstrings
were then securely closed and it was placed in a 70° C laboratory oven for a minimum of 48 hours. After
the loose sediment was bagged and placed in the drying oven, the damp and dirty mat was reweighed.
Due to the time constraints of approaching project deadlines, it was not possible to allow sufficient time
for the mats to completely dry on their own. To determine the amount of moisture remaining in the mat
and its trapped sediment, a small (approximately 8 cm X 10 cm) piece was removed from the mat and
placed into a marked and pre-weighed aluminum tin and the initial damp weight was recorded. After 8-
12 hours sitting on top of the warm oven, 48 hours in a well ventilated chemical hood, and 2 hours
inside the 70° C laboratory oven, the tin was reweighed and the dry mass recorded. Several pieces were
replaced back into the drying oven for several hours and reweighed and were found to have the same
mass as previously recorded, indicating the previous drying period had sufficiently removed nearly all
moisture from the samples. This difference in wet weight to dry weight (final dry weight/ initial wet

13
weight) was applied to the weight of the entire damp mat, and when the mass from the separated
sediment placed in a drying bag was added, provided the total dry mass of the collected sediment. This
process was repeated for all recovered mats.
Analyses and Calculations
The goal of survey analysis was to find the volumetric change in floodplain sediment storage by
subtracting the digitally gridded 2009 floodplain elevation surface from the 2010 surface. Both survey
datasets were gridded on a surface in which the areas in between the survey points were filled. A csv file
containing the easting, northing and elevation data for the 2009 survey was gridded using Fledermaus
Avggrid software with a set 1 meter pixel size. The grid file was then imported into Fledermaus Dmagic
where the points were interpolated until a complete surface was created. This surface was exported for
analysis into ESRI ArcGIS. This protocol was repeated for the 2010 survey and the turf mat sediment
data. For the turf mat file, the dry mass of collected sediment was used in place of an elevation value for
all mats. The total change in sediment volume was quantified through a raster subtraction of the
exported gridded data files for the 2009 and 2010 surveys, using a shapefile of the floodplain boundary
as an analysis mask. The range of error was quantified by adding the 2009 survey error and the 2010
survey error. Only changes in elevation greater than these combined errors were used in the change in
volume analysis in order to disregard data that may be considered noise.
Using the Inverse Distance Weighted (IDW) method in ArcGIS, a raster was created to
interpolate the mass of sediment captured on the mats over the whole northeast floodplain. This
method was used because raster subtraction would not be required; therefore a gridded file was not
necessary. From this IDW raster file, the total mass of sediment deposition was calculated for the entire
northeast floodplain by:
𝑇𝑇𝑇𝑇𝑇𝑇𝑇𝑇𝑇𝑇 𝑀𝑀𝑇𝑇𝑀𝑀𝑀𝑀 = (𝑇𝑇𝑇𝑇𝑇𝑇𝑇𝑇𝑇𝑇 𝑁𝑁𝑁𝑁𝑁𝑁𝑁𝑁 𝑇𝑇𝑎𝑎𝑎𝑎𝑇𝑇) ∗ (𝑇𝑇𝑇𝑇𝑇𝑇𝑇𝑇𝑇𝑇 𝑀𝑀𝑇𝑇𝑀𝑀𝑀𝑀 𝑇𝑇𝑜𝑜 𝐼𝐼𝐼𝐼𝐼𝐼 𝐶𝐶𝑇𝑇𝑇𝑇𝐶𝐶𝐶𝐶𝑇𝑇𝑇𝑇𝑇𝑇𝐶𝐶𝑇𝑇𝐶𝐶𝐴𝐴𝑎𝑎𝑎𝑎𝑇𝑇 𝑇𝑇𝑜𝑜 𝐼𝐼𝐼𝐼𝐼𝐼 𝐶𝐶𝑇𝑇𝑇𝑇𝐶𝐶𝐶𝐶𝑇𝑇𝑇𝑇𝑇𝑇𝐶𝐶𝑇𝑇𝐶𝐶
)
The use of this equation was necessary because the raster created from the turf mat location file is a
subarea within the total northeast floodplain area. This value will provide an independent check of the
results of the comparative analysis of the two total station surveys. It is assumed that the sediment
collected on each mat is representative of the area adjacent to the mat. Because of this, eight turf mat
points were excluded from this calculation as well as the change in elevation vs. mass of sediment
collected plot. Seven of these mats were located in the area in which the 2009 survey error occurred
14
and the change in elevation is not known, one mat was not used because even though it had collected
sediment, it was not representative of the adjacent area which has eroded.
Initial analysis of the raster subtraction found that 0.2 – 0.9 meters of sediment was eroded
from the downstream region of the northeast floodplain. Erosion of this magnitude was not noticed by
the 2010 survey crew, and was determined to be erroneous following a visual level reconnaissance in
the field. This region was resurveyed and validated the 2010 survey, indicating that an error had
occurred in the 2009 survey. For this reason, this downstream area of the floodplain was not included in
the quantitative raster subtraction analysis.
Results
Survey Results
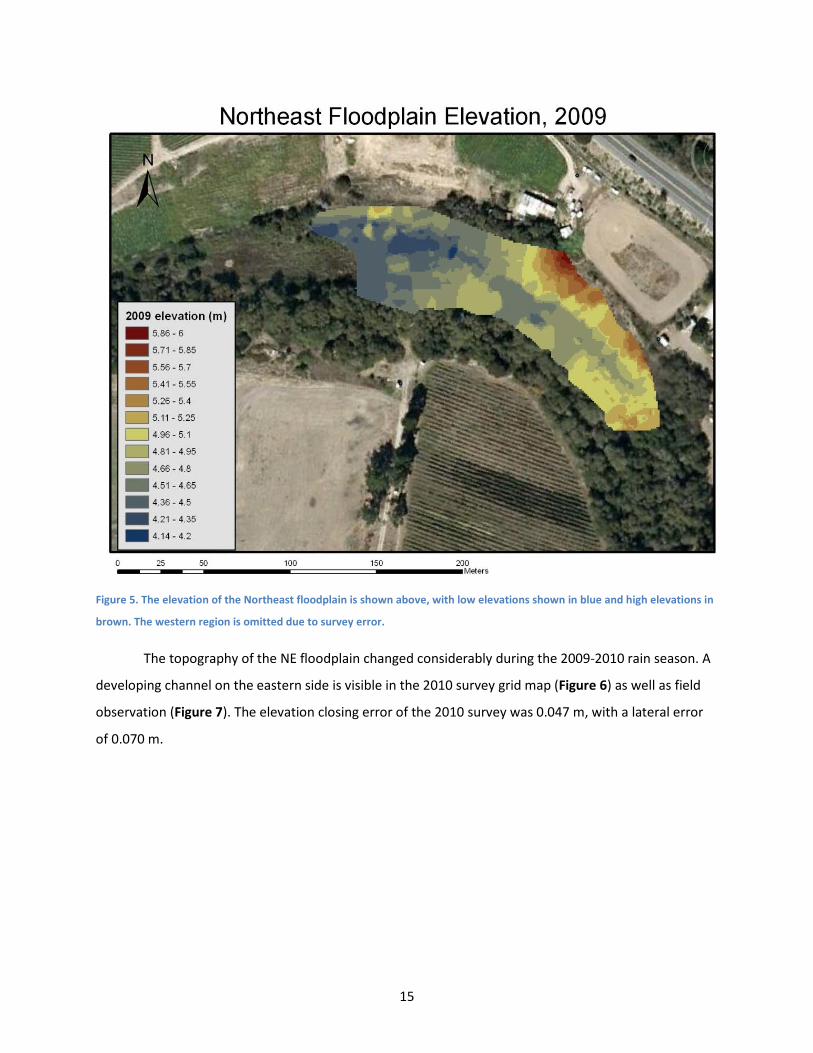
With an exception of the downstream region, the 2009 survey was able capture the initial
conditions for the northeast floodplain with a closing elevation error of ±0.015 m and a lateral error of
±0.004 m. The floodplain ranged in elevation from 4.14 m to 5.95 m above NAVD 88 datum sea level
(Figure 5). Carneros Creek is positioned just south of the image; when in flood, water enters the
floodplain from the southeast corner and exits of the far western side. Note the faint indication of a
channel on the eastern region.
15
Figure 5. The elevation of the Northeast floodplain is shown above, with low elevations shown in blue and high elevations in
brown. The western region is omitted due to survey error.
The topography of the NE floodplain changed considerably during the 2009-2010 rain season. A
developing channel on the eastern side is visible in the 2010 survey grid map (Figure 6) as well as field
observation (Figure 7). The elevation closing error of the 2010 survey was 0.047 m, with a lateral error
of 0.070 m.

16
Figure 6. A map of the NE floodplain is shown following the 2009-2010 rainy season.

17
Figure 7. This photo taken on 7 March 2010, displays the newly developed channel on the NEFP. View upstream (east)
Analysis of the GIS raster subtraction of the 2009 and 2010 survey grid files found a net
aggradation of 4.8 x 10² m3 of sediment. Due to the uncorrectable error discovered in the 2009 survey,
the western downstream region was omitted from quantitative analysis. A visual representation of the
spatial change in elevation of the northeast floodplain is also provided (Figure 8).

18
Figure 8. The change in elevation (m) of the northeast floodplain following the 2009-1010 rainy season. Red colors indicate
areas of erosion, and green indicates areas of deposition. Pixels displaying change of ± 0.067 m were within the combined
survey error and omitted from analysis and the map.
Turf Mat Results
A total of 42 artificial grass mats were collected in the end of March 2010, and two additional
mats were recovered that had been moved by the flowing water. The average dry mass of sediment
collected on the mats was 1.054 kg (1.13 x 101 kg/m2), with a standard deviation of 0.538 kg (5.79
kg/m2). The mat containing the least amount of sediment held 0.0719 kg (0.774 kg/m2), whereas the
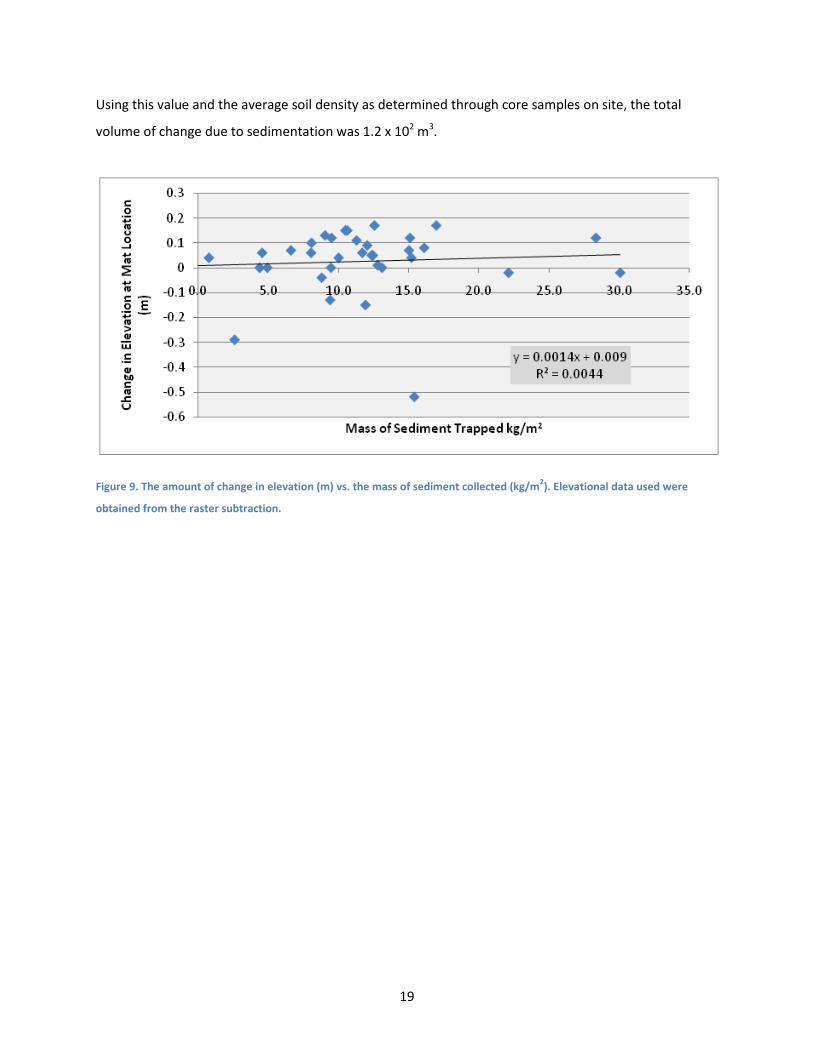
heaviest mat held 2.794 kg (3.01 x 101 g/m2). The trendline of the plotted change in elevation (m) vs. the
mass of sediment trapped in the mats (g/m2) has a slope of 0.0014, and an r2 value of 0.0044 (Figure 9).
Using the IDW method in ArcGIS, a raster was created and displays the mass of sediment captured on
the mats interpolated over the whole northeast floodplain (Figure 10). From this IDW raster file, the
total mass of sediment deposition over the entire northeast floodplain was calculated to be 1.6 x 10⁵ kg.
19
Using this value and the average soil density as determined through core samples on site, the total
volume of change due to sedimentation was 1.2 x 10² m3.
Figure 9. The amount of change in elevation (m) vs. the mass of sediment collected (kg/m2). Elevational data used were
obtained from the raster subtraction.

20
Figure 10. The mass of sediment collected on the mats (g/m) interpolated to the rest of the NEFP using the Inverse Distance
Weighted method.
Soil Density
A total of four soil samples were taken from the northeast floodplain for soil density analysis.
The samples were taken at locations which were representative of the larger site and consisted of fine,
sand, and fine and sand mix substrate types. The average soil density calculated was 1.36 x 10³ kg/m3,
whereas the sandy soil, fine soil, and mixed soil had densities of 1.51 x 10³ kg/m3, 1.25 x 10³ kg/m3, 1.26
x 103 kg/m3 respectively.
Mass of Sediment Deposition
Using this average soil density value obtained from the core samples and multiplied by the
calculated volume of change between the two surveys, a total mass of sediment deposited on the
northeast floodplain in the 2009 – 2010 rainy season was calculated to be 6.5 x10⁵ kg.

21
Discussion
The findings of this study support the postulate that wetlands and floodplains act as a sediment
sink during winter flows. Specifically, this study found that the change in elevation of the northeast
floodplain was greater than the combined survey error, indicating aggradation of sediment had occurred
in the 2009-2010 rainy season. However, it should be noted that these results have not been examined
statistically, and are pending future geostatistical analysis. In all, it is estimated that 480 cubic meters of
sediment were deposited on the northeast floodplain during the 2009 – 2010 rain season. However, it
should be noted that the actual volume of sediment deposition on the entire floodplain is likely to be
higher as the 1055 square meters furthest downstream were omitted from the calculations due to the
error in the 2009 total-station survey.
This change in volume was not uniformly distributed across the surface. The raster subtraction
image demonstrates how the upstream area is especially uneven and shows erosion adjacent to
deposition (Figure 8). The formation of a developing channel is also apparent on the raster subtraction
image (Figure 8), and as well as the floodplain elevation map created from the 2010 elevation survey
(Figure7), and is supported by field observations (Figure 6). It has become apparent that the northeast
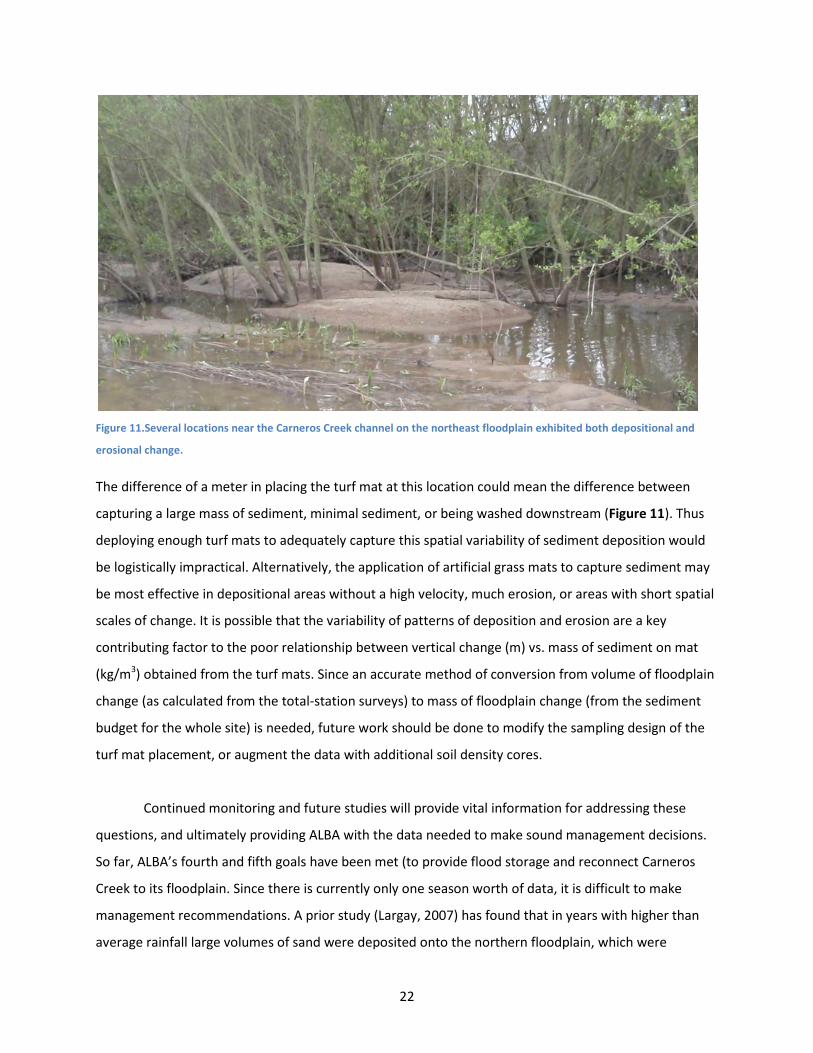
floodplain is a complex system and more dynamic than previously speculated. Large piles of sand were
observed near the channel and in the upstream area of the floodplain, yet they were patchy and locally
adjacent to areas which experienced erosion (Figure 11). This pattern of patchy deposition and erosion
is likely a key factor in the poor relationship between mass of sediment captured by the turf mats and
the change in elevation.
22
Figure 11.Several locations near the Carneros Creek channel on the northeast floodplain exhibited both depositional and
erosional change.
The difference of a meter in placing the turf mat at this location could mean the difference between
capturing a large mass of sediment, minimal sediment, or being washed downstream (Figure 11). Thus
deploying enough turf mats to adequately capture this spatial variability of sediment deposition would
be logistically impractical. Alternatively, the application of artificial grass mats to capture sediment may
be most effective in depositional areas without a high velocity, much erosion, or areas with short spatial
scales of change. It is possible that the variability of patterns of deposition and erosion are a key
contributing factor to the poor relationship between vertical change (m) vs. mass of sediment on mat
(kg/m3) obtained from the turf mats. Since an accurate method of conversion from volume of floodplain
change (as calculated from the total-station surveys) to mass of floodplain change (from the sediment
budget for the whole site) is needed, future work should be done to modify the sampling design of the
turf mat placement, or augment the data with additional soil density cores.
Continued monitoring and future studies will provide vital information for addressing these
questions, and ultimately providing ALBA with the data needed to make sound management decisions.
So far, ALBA’s fourth and fifth goals have been met (to provide flood storage and reconnect Carneros
Creek to its floodplain. Since there is currently only one season worth of data, it is difficult to make
management recommendations. A prior study (Largay, 2007) has found that in years with higher than
average rainfall large volumes of sand were deposited onto the northern floodplain, which were

23
mechanically removed to maintain the future access of the creek to its floodplain. However, it is possible
that the channel that was observed developing on the northeast floodplain over the 2009-2010 rainy
season would allow flood waters to reach the floodplain, and with continued channel development,
manual removal of fluvial deposits may not be necessary.
Strengths and Weaknesses of Approach
Several strengths and weaknesses became apparent during the data analysis. The northeast
floodplain is a dynamic environment where the patterns of deposition and erosion are not uniform. For
this reason, the use of artificial grass mats to capture sediment did not provide a measurement of soil
density as was anticipated. Other studies using turf mats have been successful, and the method has
been demonstrated to be valid (Kronvang et al. 2007, Steiger et al. 2003, Lambert & Walling, 1987); yet
there was no clear relationship between the mass of sediment collected on the mats and the amount of
vertical change in elevation estimated near their location. Additionally, there was a moderately high
closing error in the 2010 total station survey (±0.047 m). Further adding to the confusion regarding the
source of this error, the survey opened and closed on two benchmarks shot in consecutive shots. One
benchmark closed with and error of ±0.024 m, whereas the second benchmark closed with an error of
±0.047 m. It is unknown at this point how one of two consecutive benchmark shots can have a closing
error of twice as much as the other point. Both benchmarks were constructed of rebar, and the
surveyors were confident that no human error was made. Although this range of uncertainty was taken
into account during data analysis and the calculated change in volume of the northeast floodplain was
done with this in mind, the magnitude of change that occurred was far greater than this survey error. In
addition, even though the mean change of floodplain elevation (+0.052 m) was lower than the
combined survey error (± 0.067 m), most of the change in elevation exceeded this margin of error.
The 2009 survey error of the downstream region is the most noticeable data weakness and
introduces a higher degree of uncertainty into the results of the study. This error was discovered during
the initial analysis where there was 0.8 meters of erosion calculated on the western side of the
floodplain, but a subsequent site visit revealed that there was no field evidence of erosion. The following
observations were made and do not support the calculated 0.8 m of erosion: (1) no freshly exposed
surfaces, (2) > 1 cm – 2 cm of deposited sediment on previous organic layer, (3) shallow rooted dead
vegetation still in place. These findings indicate an error in at least one of the total-station surveys as
field observations do not support the findings that 0.8 meters of material eroded from the downstream

24
region of the floodplain. The area was then resurveyed less than one month following the initial 2010
survey, and determined that there was an error in the 2009 survey of the western region of the
floodplain. The source of the error is not known at this time, and therefore the data from the western
region of the floodplain were not used in this study.
Connection to Previous Studies
When quantifying the sediment budget for a wetland or reach of a river, studies often look at
the sediment inflow and outflow of the system, but may neglect to quantify where the sediment is
deposited within the system or if there are any internal sources of erosion. This study is the first step in
identifying depositional and erosional features within the larger Triple M Ranch system, and quantifying
where the sediment that is trapped on the floodplains and wetlands accumulates spatially. Although it is
well accepted that wetlands and floodplains provide ecosystem functions including improving water
quality and acting as a sediment sink, few studies have been able to quantify the magnitude of these
services under unregulated flow regimes. Other studies have been able to measure sediment deposition
in treatment wetlands under controlled flows, but real-world wetland systems with variable and
unpredictable discharges are much more complex and less understood (Jordan et al. 2003). Additionally,
information on floodplain spatial variability is not well studied, but is required to estimate spatial
variations in sedimentation or storage rates. This knowledge is also vital for understanding the
importance of substrate for floodplain ecosystems as well as management decisions (Wasson, 2002).
This study is an initial step to gaining a better understanding of the effectiveness of emerging floodplains
and wetlands in trapping sediment in an agriculturally impacted watershed, and provides insight into the
degree of spatial variability of deposition of one floodplain over one rainy season.
Conclusion
The Carneros Creek system is complex with existing dredge spoil levees, breaches, bottlenecks,
floodplains and wetlands, driving the need for future work to ensure that management
recommendations have sound scientific data on which to base their decisions. Similar studies should be
done in the wetlands of field 3 and Sill road, to quantify how much sediment is accumulating in these
locations and where it is spatially located. Also, a quantitative sediment budget should be created for
the Triple M Ranch property as a whole, and would be a vital component of the dataset used to guide
management decisions. Largay (2007) reported that no sand leaves the property, an observation that is
supported by personal observation. At Sill Road, where Carneros Creek exits the property after flowing

25
through the wetlands, a deep culvert that traps all bedload sediment, which travels past the wetlands
exists. If the alluvium in this culvert is cored in the near future, it may be possible to locate last year’s
organic layer and determine how much sediment made it past the wetlands and deposited over the
2009 – 2010 season. Incorporating HEC-RAS and HEC-HMS (U.S. Army Corps of Engineers, Hydraulic
Engineering Center) hydrodynamic modeling would also be beneficial in understanding the creek,
wetland and floodplain systems. Additionally, an analysis of particle size should be done on samples
collected from the recovered turf mats. This would be a valuable addition to the growing dataset, and
provide information on whether bedload or suspended sediment is being deposited in a given area.
Finally, a more long-term dataset is needed in order to provide the best possible data to guide
management decisions.
Acknowledgements: I would like to thank Dr. Doug Smith for his wisdom, support and guidance throughout this project as well as much of my undergraduate experience, Randy Holloway for the tremendous help and effort on his part both in the field and out, Dr. Fred Watson for his valuable input and review of the manuscript, Caleb Schneider for his field assistance and technical solutions, Megan Kelly for her tolerance, patience, support, and help throughout the process, Kaley Grimland at ALBA, and Katrina Morelli, Ken Adair, and Kaitie Beck for their assistance in the field. Thanks again everyone!
Literature Cited
Casagrande, J. & Smith, D. 2006. Garrapata Creek Lagoon, Central Coast, California: A Preliminary
Assessment, 2005-06. Prepared for the California Department of Fish and Game and the Garrapata Creek Watershed Council. The Watershed Institute, California State University Monterey Bay, Publication No. WI-2006-01, 62pp.
[Fed Reg.] Federal Register 2001. Final Determination of Critical Habitat for the California
Red-legged Frog in California. Fed. Reg. Vol. 66, No. 49, pages 14625-14674, March 13. Harter, S., Mitsch W., 2003. Patterns of short-term sedimentation in a freshwater created marsh.
Wetlands and Aquatic Processes. J. Environ. Qual. 32: 325–334 Jordan, T., Whigham, D., Hofmockel, K., Pittek, M.. 2003. Nutrient and Sediment Removal by a Restored

26
Wetland Receiving Agricultural Runoff. Wetlands and Aquatic Processes. J. Environ. Qual. 32: 1534–1547
Kronvang, B., Andersen, I., Hoffmann, C., Pedersen, M., Ovesen, N., Andersen, H. 2007. Water exchange
and deposition of sediment and phosphorus during inundation of natural and restored lowland floodplains. Water Air Soil Pollut 181:115–121.
Lambert, C.P. & Walling, D.E. 1987. Floodplain sedimentation: a preliminary investigation of
contemporary deposition within the lower reaches of the River Clum, Devon, UK. Geografiska Annaler 69A: 393-404.
Largay, B. 2007. ALBA Triple M wetlands restoration project. Existing conditions and conceptual design
technical advisory committee review draft. Largay Hydrologic Sciences, LCC, 19 November 2007 Morey S. Basey, H. Papenfuss, T. Duke, R. 2008. California Wildlife Habitat Relationships System
California Department of Fish and Game California Interagency Wildlife Task Group. Species Profile for California Red-Legged frog (Rana aurora draytonii)
[NRAC] Natural Resources Agency State of California. 2009. State of the State’s Wetlands, Public Review
Draft. Novitzki, R. P., Smith, R. D., Fretwell, J.D.. 1997. Restoration, Creation, and Recovery of Wetlands.
Wetland Functions, Values, and Assessment. National Water Summary on Wetland Resources United States Geological Survey Water Supply Paper 2425 (web resource, last accessed 1 November 2009: http://water.usgs.gov/nwsum/WSP2425/functions.html)
Richardson, C.J.. 1994. Ecological functions and human values in wetlands: a framework for assessing
forestry impacts. Wetlands 14: 1-9 Shaffer H. B., Fellers G. M., Voss S. R., Oliver J. C., Pauly G. B.. 2004. Species boundaries, phylogeography
and conservation genetics of the red-legged frog (Rana aurora/draytonii) complex. Molecular Ecology (13): 2667–2677
Steiger, J., Gurnell, A.M., Goodson, J.M. 2003. Quantifying and characterizing contemporary riparian
sedimentation. River Research and Applications 19: 335-352. Turner, R., Van Den Bergh, J., Soderqvist, T., Barendregt, A., Straaten, J., Maltby, E., Ierland, E.. 2000.
Ecological-economic analysis of wetlands: scientific integration for management and policy. The values of wetlands: landscape and institutional perspectives. Ecological Economics 35: 7–23
United States Code: Endangered Species Act, 7 U.S.C. 136, Title 16 Chapter 35, § 1531 (1973) Wasson, R. 2002. Sediment budgets, dynamics and variability: new approaches and techniques. The
Structure, Function and Management Implications of Fluvial Sedimentary Systems. 471-478. [ USFWS] U.S. Fish and Wildlife Service. 2002. Recovery Plan for the California Red-legged Frog (Rana
aurora draytonii). U.S. Fish and Wildlife Service, Portland, Oregon. viii + 173 pp.

27
[ USFWS] U.S. Fish and Wildlife Service. 1999. Santa Cruz Long-toed Salamander Abystoma macrodactylum croceum draft revised recovery plan. U.S. Fish and Wildlife Service Portland Oregon. Vi + 82 pp.