quantitative analysis of the facial nerve using contrast … · 2015-10-21 · 162 quantitative...
TRANSCRIPT
www.i-mri.org162
Quantitative Analysis of the Facial Nerve Using Contrast-Enhanced Three Dimensional FLAIR-VISTA Imaging in Pediatric Bell’s Palsy
This is an Open Access article distributed under the terms of the Creative Commons Attribution Non-Commercial License (http://creativecommons.org/licenses/by-nc/3.0/) which permits unrestricted non-commercial use, distribution, and reproduction in any medium, provided the original work is properly cited.
Received: July 20, 2015Revised: September 17, 2015Accepted: September 24, 2015
Correspondence to: Sun Kyoung You, M.D.Department of Radiology, Chungnam National University Hospital, 282 Munhwa-ro, Jung-gu, Daejeon 301-721, Korea.Tel. +82-42-220-8108Fax. +82-42-253-0061Email: [email protected]
Copyright © 2015 Korean Society of Magnetic Resonance in Medicine (KSMRM)
iMRI 2015;19:162-167 http://dx.doi.org/10.13104/imri.2015.19.3.162
Original Article Purpose: To evaluate the usefulness of quantitative analysis of the facial nerve using contrast-enhanced three-dimensional (CE 3D) fluid-attenuated inversion recovery-volume isotopic turbo spin echo acquisition (FLAIR-VISTA) for the diagnosis of Bell’s palsy in pediatric patients. Materials and Methods: Twelve patients (24 nerves) with unilateral acute facial nerve palsy underwent MRI from March 2014 through March 2015. The unaffected sides were included as a control group. First, for quantitative analysis, the signal intensity (SI) and relative SI (RSI) for canalicular, labyrinthine, geniculate ganglion, tympanic, and mastoid segments of the facial nerve on CE 3D FLAIR images were measured using regions of interest (ROI). Second, CE 3D FLAIR and CE T1-SE images were analyzed to compare their diagnostic performance by visual assessment (VA). The sensitivity, specificity, and accuracy of RSI measurement and VA were compared.Results: The absolute SI of canalicular and mastoid segments and the sum of the five mean SI (total SI) were higher in the palsy group than in the control group, but with no significant differences. The RSI of the canalicular segment and the total SI were significantly correlated with the symptomatic side (P = 0.028 and 0.015). In 11/12 (91.6%) patients, the RSI of total SI resulted in accurate detection of the affected side. The sensitivity, specificity, and accuracy for detecting Bell’s palsy were higher with RSI measurement than with VA of CE 3D FLAIR images, while those with VA of CE T1-SE images were higher than those with VA of CE 3D FLAIR images. Conclusion: Quantitative analysis of the facial nerve using CE 3D FLAIR imaging can be useful for increasing the diagnostic performance in children with Bell’s palsy when difficult to diagnose using VA alone. With regard to VA, the diagnostic performance of CE T1-SE imaging is superior to that of CE 3D FLAIR imaging in children. Further studies including larger populations are necessary.
Keywords: Bell’s palsy; Facial nerve; 3.0T; Quantitative analysis; Children; 3D FLAIR-VISTA
pISSN 2384-1095eISSN 2384-1109
Jin Hee Seo1, Sun Kyoung You1, In Ho Lee1, Jeong Eun Lee1, So Mi Lee2, Hyun-Hae Cho3
1Department of Radiology, Chungnam National University Hospital, Daejeon, Korea 2Department of Radiology, Kyungpook National University Medical Center, Daegu, Korea 3Department of Radiology, Ewha Womans University Mokdong Hospital, Seoul, Korea

163www.i-mri.org
http://dx.doi.org/10.13104/imri.2015.19.3.162
INTRODUCTION
Bell’s palsy is defined as acute, unilateral facial nerve paresis or paralysis with onset in less than 72 hour from an unknown cause (1). There are numerous etiologies for facial nerve paralysis in pediatric patients, including infection, inflammation, congenital anomalies, trauma, neoplasm, and Bell’s palsy. The most frequent cause of facial palsy in adults is Bell’s palsy; however, Bell’s palsy is less common in infants and younger children than in teenagers and adults. Therefore, diagnosis in pediatric patients with Bell’s palsy should be based on exclusion of differential diagnoses (2, 3). Accordingly, imaging studies are important for pediatric patients with acute facial nerve palsy.
The cisternal, intracanalicular, and labyrinthine segments of the facial nerve do not enhance normally (4). A recent study using a 3.0-T scanner showed mild enhancement in the canalicular and labyrinthine segments of normal facial nerves on thin-section contrast enhanced three-dimensional spoiled gradient echo sequence (SPGR) (5). Another study using a 3.0-T scanner reported that the normal facial nerve rarely shows enhancement on 3D FLAIR (fluid attenuation inversion recovery) images (6), and the same study group reported an improvement in the diagnostic performance for Bell’s palsy when CE-FLAIR image was combined with the 3D VISTA (volume isotropic turbo spin echo acquisition) technique using a 3.0-T scanner (7). Several studies have attempted to diagnose and predict the prognosis of Bell’s palsy using MRI, including quantitative analysis, in adults (8-10). The results of quantitative analysis of the facial nerve using MRI seem disappointing, however, and further development is required. Furthermore, there are no reports of quantitative analysis of the facial nerve using MRI in children with facial paralysis. Therefore, we conducted this study to assess the diagnostic value of quantitative analysis of the facial nerve using CE 3D FLAIR-VISTA imaging and compare the usefulness of CE 3D FLAIR-VISTA with that of CE T1-TSE for the diagnosis of pediatric Bell’s palsy.
MATERIALS AND METHODS
Patients This study was approved by the institutional review
board of our institution. We retrospectively reviewed the clinical information and imaging findings obtained from the records of 15 patients who underwent temporal MRI from March 2014 through March 2015 at the Department
of Pediatrics in our institution. Physical examination and electrophysiological study (EPS) were considered as diagnostic reference of unilateral facial neuritis. One patient with symptoms that persisted for more than a month and two with poor image quality were excluded. Eventually, the records of 12 patients (boys:girls = 5:7; mean age, 9.08 ± 5.66 years; range, 1-17 years) were analyzed. Among these 12 patients, five and seven had developed right- and left-sided palsy, respectively.
Image Acquisition The mean time interval between symptom onset and
MRI was 4.58 ± 4.27 days (range, 1-14 days). All 12 MRI studies were performed using a 3.0-T scanner (Achieva; Philips Medical Systems, Best, the Netherlands). Routine MR sequences included axial T2-TSE, pre- and contrast-enhanced axial T1-SE, 3D T2-VISTA, and pre- and contrast-enhanced axial 3D FLAIR-VISTA sequences. CE 3D FLAIR-VISTA imaging was performed using the following parameters: repetition time (TR)/echo time (TE), 8000/259 ms; echo-train length, 80; field of view (FOV), 180 × 180 mm; matrix, 224 × 226; NEX, 1; section thickness, 1.6 mm; and imaging time, 7 min and 5 s. CE T1-SE imaging was performed using the following parameters: TR/TE, 8000/259 ms; FOV, 160 × 160 mm; matrix, 204 × 152; section thickness, 3 mm; and imaging time, 2 min and 46 s.
Image AnalysisTemporal MR images were retrospectively analyzed in
consensus by two radiologists. (S.K.Y and J.H.S with 7 year and 1 year of experience) who were blinded to the affected side. The nonsymptomatic side was included as a control group. For quantitative analysis of the facial nerve, the signal intensity (SI) for five segments, namely the canalicular, labyrinthine, geniculate ganglion, tympanic, and mastoid segments, was measured by drawing round regions of interest (ROI) containing each segment on CE 3D FLAIR-VISTA images (Fig. 1). The size of each ROI was kept as small as possible to prevent contamination from other tissues. The reviewer measured SI of each segment three times and derived the mean value for quantitative analysis and that was defined as absolute SI.
The absolute SI for each segment and the sum of the absolute SIs of the five segments (total SI) were obtained for all 24 facial nerves. Then, the relative SI (RSI; the absolute SI of right facial nerve/SI of left facial nerve) for each segment and the total SI were calculated. When the RSI was larger than 1, it was considered to indicate right

www.i-mri.org164
CE 3D FLAIR-VISTA for Pediatric Bell’s Palsy | Jin Hee Seo, et al.
facial neuritis. The reviewers also analyzed CE 3D FLAIR-VISTA and CE T1-SE images visually and classified the MRI as normal, right facial neuritis, or left facial neuritis, according to enhancement of facial nerves. The diagnostic performance of RSI measurement was compared with that of visual assessment (VA) of CE 3D FLAIR-VISTA and CE T1-SE imaging.
Statistical Analysis All data were analyzed using IBM SPSS 18.0 for
Windows (SPSS, Chicago, IL). The reliability of quantitative measurements was assessed by calculat ing the intraclass correlation coefficient (ICC) between the three measurements for each segment. The Mann-Whitney U test was used for statistical comparisons of the mean absolute SI between the control and palsy groups, and Fisher’s exact test was used to evaluate the association between
a b
Fig. 1. Axial contrast-enhanced 3D FLAIR-VISTA images of the right facial nerve in a 4-year-old girl. (a, b) The five segments of the facial nerve. 1 = canalicular, 2 = labyrinthine, 3 = geniculate ganglion, 4 = tympanic, 5 = mastoid. (c) Round region of interest (ROI) in the canalicular segment and the measurements.
c
165www.i-mri.org
http://dx.doi.org/10.13104/imri.2015.19.3.162
RSI and the symptomatic side. Comparison of diagnostic performance between quantitative assessment and visual assessment and the diagnostic performance between CE 3D FLAIR- VISTA and CE T1WI was performed using MedCalc for Windows, version 15.6.1 (MedCalc Software, Mariakerke, Belgium). A P-value of < 0.05 was considered statistically significant.
RESULTS
The ICC for intraobserver reliability was 0.951 (95% confidence interval, 0.934-0.965), showing good
reproducibility of the three measurements. The absolute SI for the canalicular and mastoid segments was higher in the palsy group than in the control group, although the difference was not significant (P = 0.074 for both). A similar result was observed for the total SI (P = 0.225). The RSI of the canalicular segment and the total SI were significantly correlated with the symptomatic side (P = 0.028 and 0.015, respectively; Table 1). The sensitivity, specificity, and accuracy for the detection of Bell’s palsy by the RSI of total SI were 91.6%, 91.6%, and 91.6%, respectively. The RSI measurement for five of six patients who were considered normal by VA of CE 3D FLAIR images resulted in accurate detection of the symptomatic side, as did RSI measurement
Table 1. Result of the RSI Measurement in 12 Patients
Patient numberP value
1 2 3 4 5 6 7 8 9 10 11 12
Symptomatic side (diagnostic reference)
L R L R L L R R L L R L
Result of RSI
Canalicular segment
0.972 (L)
2.069 (R)
1.108 (R)
1.166 (R)
0.703 (L)
0.667 (L)
2.247 (R)
1.547 (R)
1.080 (R)
0.387 (L)
1.332 (R)
0.852 (L)
0.028
Total SI0.811
(L)1.250
(R) 0.888
(L)1.143
(R)0.871
(L)0.907
(R)1.530
(R)1.171
(R)1.094
(R)0.709
(L)1.057
(R) 0.986
(L)0.015
L = left; R = right; RSI = relative signal intensity
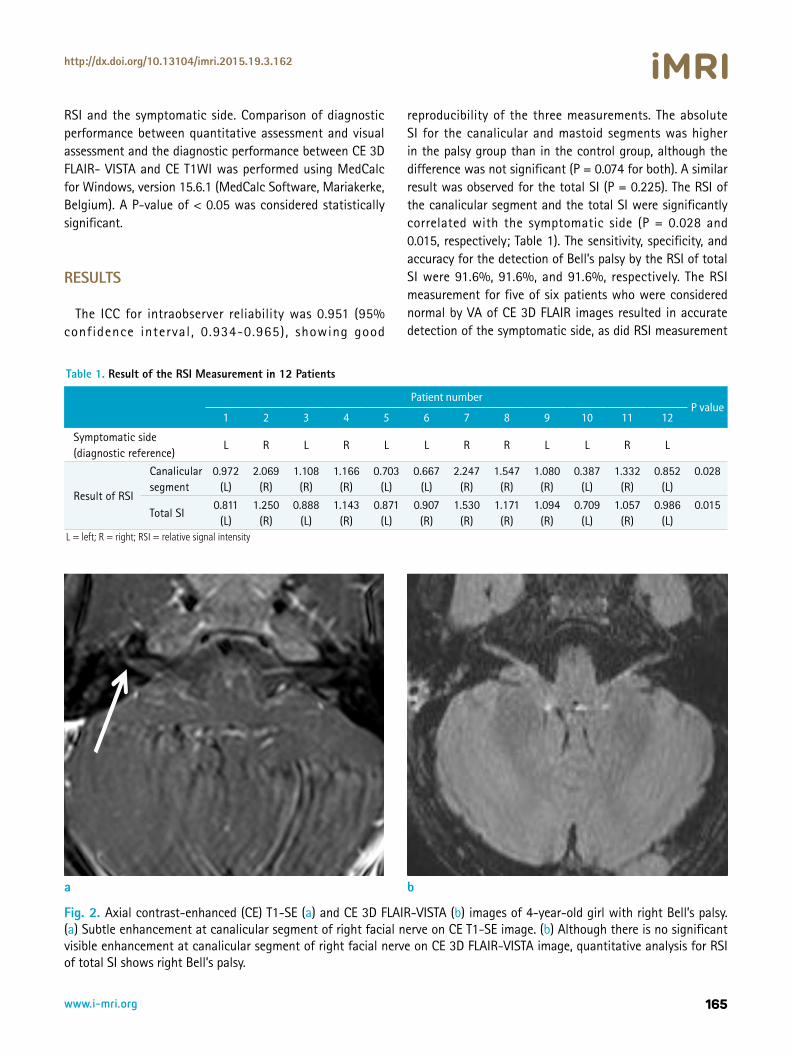
Fig. 2. Axial contrast-enhanced (CE) T1-SE (a) and CE 3D FLAIR-VISTA (b) images of 4-year-old girl with right Bell’s palsy. (a) Subtle enhancement at canalicular segment of right facial nerve on CE T1-SE image. (b) Although there is no significant visible enhancement at canalicular segment of right facial nerve on CE 3D FLAIR-VISTA image, quantitative analysis for RSI of total SI shows right Bell’s palsy.
a b
www.i-mri.org166
CE 3D FLAIR-VISTA for Pediatric Bell’s Palsy | Jin Hee Seo, et al.
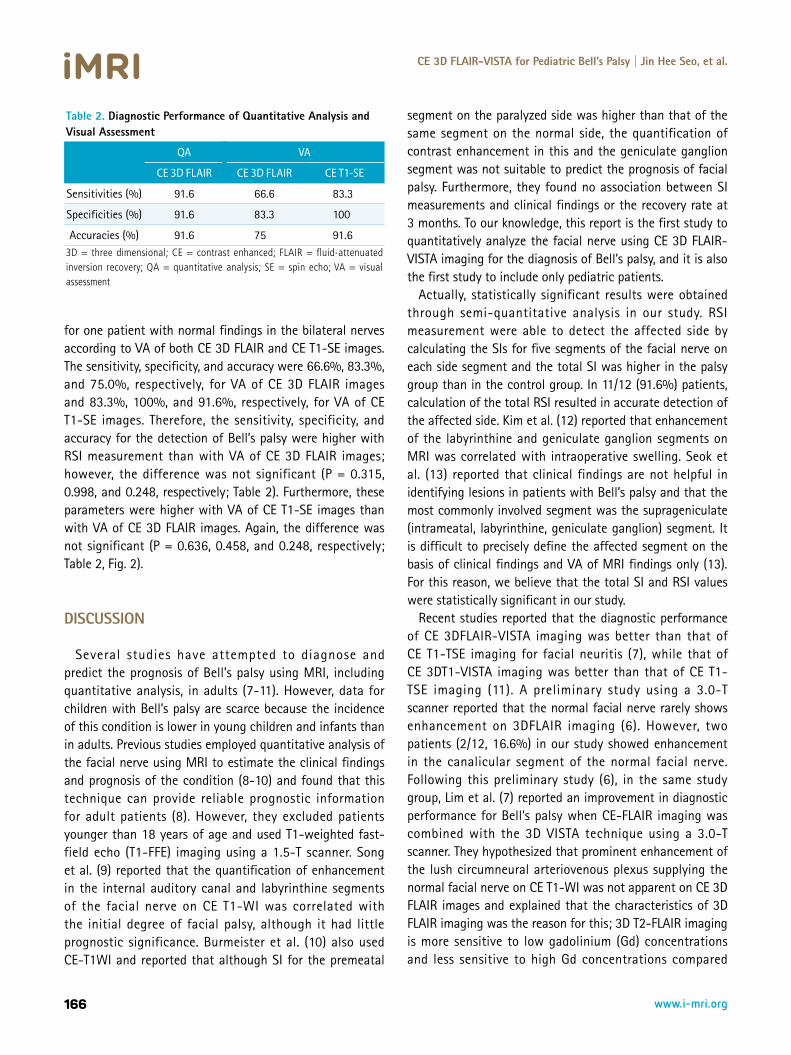
for one patient with normal findings in the bilateral nerves according to VA of both CE 3D FLAIR and CE T1-SE images. The sensitivity, specificity, and accuracy were 66.6%, 83.3%, and 75.0%, respectively, for VA of CE 3D FLAIR images and 83.3%, 100%, and 91.6%, respectively, for VA of CE T1-SE images. Therefore, the sensitivity, specificity, and accuracy for the detection of Bell’s palsy were higher with RSI measurement than with VA of CE 3D FLAIR images; however, the difference was not significant (P = 0.315, 0.998, and 0.248, respectively; Table 2). Furthermore, these parameters were higher with VA of CE T1-SE images than with VA of CE 3D FLAIR images. Again, the difference was not significant (P = 0.636, 0.458, and 0.248, respectively; Table 2, Fig. 2).
DISCUSSION
Several studies have attempted to diagnose and predict the prognosis of Bell’s palsy using MRI, including quantitative analysis, in adults (7-11). However, data for children with Bell’s palsy are scarce because the incidence of this condition is lower in young children and infants than in adults. Previous studies employed quantitative analysis of the facial nerve using MRI to estimate the clinical findings and prognosis of the condition (8-10) and found that this technique can provide reliable prognostic information for adult patients (8). However, they excluded patients younger than 18 years of age and used T1-weighted fast-field echo (T1-FFE) imaging using a 1.5-T scanner. Song et al. (9) reported that the quantification of enhancement in the internal auditory canal and labyrinthine segments of the facial nerve on CE T1-WI was correlated with the initial degree of facial palsy, although it had little prognostic significance. Burmeister et al. (10) also used CE-T1WI and reported that although SI for the premeatal
segment on the paralyzed side was higher than that of the same segment on the normal side, the quantification of contrast enhancement in this and the geniculate ganglion segment was not suitable to predict the prognosis of facial palsy. Furthermore, they found no association between SI measurements and clinical findings or the recovery rate at 3 months. To our knowledge, this report is the first study to quantitatively analyze the facial nerve using CE 3D FLAIR-VISTA imaging for the diagnosis of Bell’s palsy, and it is also the first study to include only pediatric patients.
Actually, statistically significant results were obtained through semi-quantitative analysis in our study. RSI measurement were able to detect the affected side by calculating the SIs for five segments of the facial nerve on each side segment and the total SI was higher in the palsy group than in the control group. In 11/12 (91.6%) patients, calculation of the total RSI resulted in accurate detection of the affected side. Kim et al. (12) reported that enhancement of the labyrinthine and geniculate ganglion segments on MRI was correlated with intraoperative swelling. Seok et al. (13) reported that clinical findings are not helpful in identifying lesions in patients with Bell’s palsy and that the most commonly involved segment was the suprageniculate (intrameatal, labyrinthine, geniculate ganglion) segment. It is difficult to precisely define the affected segment on the basis of clinical findings and VA of MRI findings only (13). For this reason, we believe that the total SI and RSI values were statistically significant in our study.
Recent studies reported that the diagnostic performance of CE 3DFLAIR-VISTA imaging was better than that of CE T1-TSE imaging for facial neuritis (7), while that of CE 3DT1-VISTA imaging was better than that of CE T1-TSE imaging (11). A preliminary study using a 3.0-T scanner reported that the normal facial nerve rarely shows enhancement on 3DFLAIR imaging (6). However, two patients (2/12, 16.6%) in our study showed enhancement in the canalicular segment of the normal facial nerve. Following this preliminary study (6), in the same study group, Lim et al. (7) reported an improvement in diagnostic performance for Bell’s palsy when CE-FLAIR imaging was combined with the 3D VISTA technique using a 3.0-T scanner. They hypothesized that prominent enhancement of the lush circumneural arteriovenous plexus supplying the normal facial nerve on CE T1-WI was not apparent on CE 3D FLAIR images and explained that the characteristics of 3D FLAIR imaging was the reason for this; 3D T2-FLAIR imaging is more sensitive to low gadolinium (Gd) concentrations and less sensitive to high Gd concentrations compared
Table 2. Diagnostic Performance of Quantitative Analysis and Visual Assessment
QA VA
CE 3D FLAIR CE 3D FLAIR CE T1-SE
Sensitivities (%) 91.6 66.6 83.3
Specificities (%) 91.6 83.3 100
Accuracies (%) 91.6 75 91.63D = three dimensional; CE = contrast enhanced; FLAIR = fluid-attenuated inversion recovery; QA = quantitative analysis; SE = spin echo; VA = visual assessment
167www.i-mri.org
http://dx.doi.org/10.13104/imri.2015.19.3.162
with T1-WI or MPRAGE imaging (6, 7, 14). In contrast, the diagnostic performance of CE T1-SE imaging was superior to that of CE 3D FLAIR imaging in our study, although the difference in sensitivity, specificity, and accuracy values was not significant. Also, the mean age of our patients (9 ± 5 years) was much lower than that (50 ± 17 years) of patients in the study by Lim et al. (7). Therefore we assume that the Gd uptake by the lush circumneural arteriovenous plexus is higher in pediatric patients than in adult patients. Therefore, detection of enhancement in each segment of pathologic facial nerves is more difficult with CE 3D FLAIR imaging than with CE-T1 imaging. Further studies including a larger sample size are necessary to clarify these findings.
This study has several limitations. First, this was a retrospective study, which made it difficult to evaluate the prognostic value of MRI in each patient. Second, we did not compare our findings with other symptoms correlated with Bell’s palsy. We also did not evaluate the clinical significance of quantitative analysis. The purpose of our study was to assess the diagnostic value of quantitative analysis of the facial nerve using CE 3D FLAIR-VISTA imaging, not the clinical efficacy of this modality. Third was our small sample size.
In conclusion, our results suggest that quantitative analysis of the facial nerve using CE 3D FLAIR-VISTA imaging is useful for increasing the diagnostic performance in children with Bell’s palsy that is difficult to diagnosis by VA alone. Furthermore, the diagnostic performance of CE T1-SE imaging may be higher than that of CE 3D FLAIR imaging in pediatric patients. Further studies including larger populations are required to estimate the efficacy of quantitative analysis of the facial nerve. Additional investigations into the diagnosis of Bell’s palsy using MRI are also necessary.
REFERENCES 1. Baugh RF, Basura GJ, Ishii LE, et al. Clinical practice
guideline: Bell's palsy. Otolaryngol Head Neck Surg 2013; 149:S1-27
2. Pavlou E, Gkampeta A, Arampatzi M. Facial nerve palsy in childhood. Brain Dev 2011;33:644-650
3. Shargorodsky J, Lin HW, Gopen Q. Facial nerve palsy in the
pediatric population. Clin Pediatr (Phila) 2010;49:411-417 4. Gebarski SS, Telian SA, Niparko JK. Enhancement along the
normal facial nerve in the facial canal: MR imaging and anatomic correlation. Radiology 1992;183:391-394
5. Hong HS, Yi BH, Cha JG, et al. Enhancement pattern of the normal facial nerve at 3.0 T temporal MRI. Br J Radiol 2010;83:118-121
6. Hyun D, Lim HK, Park JW, et al. Enhancement pattern of the normal facial nerve on three - dimensional (3D) - fluid attenuated inversion recovery (FLAIR) sequence at 3.0 T MR units. J Korean Soc Magn Reson Med 2012;16:25-30
7. Lim HK, Lee JH, Hyun D, et al. MR diagnosis of facial neuritis: diagnostic performance of contrast-enhanced 3D-FLAIR technique compared with contrast-enhanced 3D-T1-fast-field echo with fat suppression. AJNR Am J Neuroradiol 2012;33:779-783
8. Kress B, Griesbeck F, Stippich C, Bahren W, Sartor K. Bell palsy: quantitative analysis of MR imaging data as a method of predicting outcome. Radiology 2004;230:504-509
9. Song MH, Kim J, Jeon JH, et al. Clinical significance of quantitative analysis of facial nerve enhancement on MRI in Bell's palsy. Acta Otolaryngol 2008;128:1259-1265
10. Burmeister HP, Baltzer PA, Volk GF, et al. Evaluation of the early phase of Bell's palsy using 3 T MRI. Eur Arch Otorhinolaryngol 2011;268:1493-1500
11. Yun SJ, Ryu CW, Jahng GH, et al. Usefulness of contrast-enhanced 3-dimensional T1-VISTA in the diagnosis of facial neuritis: comparison with contrast-enhanced T1-TSE. J Neuroradiol 2015;42:93-98
12. Kim IS, Shin SH, Kim J, Lee WS, Lee HK. Correlation between MRI and operative findings in Bell's palsy and Ramsay Hunt syndrome. Yonsei Med J 2007;48:963-968
13. Seok JI, Lee DK, Kim KJ. The usefulness of clinical findings in localising lesions in Bell's palsy: comparison with MRI. J Neurol Neurosurg Psychiatry 2008;79:418-420
14. Fukuoka H, Hirai T, Okuda T, et al. Comparison of the added value of contrast-enhanced 3D fluid-attenuated inversion recovery and magnetization-prepared rapid acquisition of gradient echo sequences in relation to conventional postcontrast T1-weighted images for the evaluation of leptomeningeal diseases at 3T. AJNR Am J Neuroradiol 2010;31:868-873